Comparison of Organic Solvents Desorption of Eight Glycol Ethers from Charcoal Tube and Application of Chemometric Approach for the
Optimization of their Recoveries
F. Faidi1,2,3*, S. Hammami3,4, F. Sallem4, E.Ben Khalifa2,4, R. Chakroun2,5, A. Hedhili1
1Laboratory of Research Toxicology-Environment, LR12SP07, CAMUR,Tunis, Tunisia. 2 Health and work environment, Tunisia occupational safety and health institute, Tunis, Tunisia.
3 Center for Scientific Research (QCSR), Umm Al-Qura University, Saudi Arabia. 4 Department of Chemistry, Faculty of Sciences, El Manar University, Tunis, Tunisia.
King , Faculty of Meteorology, Environment and Arid Land AgricultureDepartment of Environmental Sciences, 5
Abdulaziz University, Jedda, Saudi Arabia. .
1.( Introduction The glycol ethers are an important and widely used class of solvents [1]. They are classified into two series: ethylene glycol ether derivatives (EGE), which are the reaction products of ethylene oxides with various alcohols and propylene glycol ether derivatives (PGE) synthesized using propylene oxide [2, 3]. The simultaneous presence of hydrophobic and hydrophilic character has enhanced their industrials uses since the sixties [2, 4-6]. They are commonly used as solvents in the manufacture of several products such as paints, varnishes, inks, detergents, adhesives, cosmetics [1, 5-7]. The most produced GEs in Europe were PGME, EGBE, PGMEA and DEGBE. In 2006, they represent 92 % of overall GE produced [8, 9]. In Tunisia, the import of EGE exceeds 800 tons per year including 200 tons of EGME, EGBE, DEGE and EGEE [8, 9]. In the late 1980s, many epidemiological data have confirmed the toxic effects of some of those compounds. Until 1990, ten glycol ethers were classified toxic for reproduction by the European Union [4]. EGME, EGEE and
Abstract Selective ion monitoring gas chromatography-mass spectrometry (SIM GC-MS) detection method using Chemometric and optimization approach was improved for the determination of eight glycol ethers (GEs): Ethylene glycol methyl ether (EGME), Ethylene glycol ethyl ether (EGEE), Ethylene glycol n-butyl ether (EGBE), 2-Propylene glycol 1-methyl ether (2PG1ME), Ethylene glycol methyl ether acetate (EGMEA), Ethylene glycol ethyl ether acetate (EGEEA), Ethylene glycol n-butyl ether acetate(EGBEA) and 2-Propylene glycol 1-methyl ether acetate (2PG1MEA) in workplace air. A complete separation and faster analysis of these GEs has been achieved in less than 11 min of running time. The DB-624 capillary column used was highly stable with a maximum operating temperature of 360°C, presenting an extremely low bleeding at the working oven temperature program. The application of t-test and analysis of variance (ANOVA) to study GEs extraction from NIOSH charcoal tube with dichloromethane, carbon disulfide and dichloromethane / methanol, indicated that better recoveries were obtained with 5% methanol in dichloromethane. Response surface methodology (RSM) and Doehlert experimental design were used to evaluate the impact of the solvent volume, the desorption time and their interaction on the recovery of GEs. A significant impact of the desorption time was shown for all GEs. As for solvent volume, a significant impact was only mentioned for EGME, EGEE, EGBE and 2PG1ME. The optimal conditions of solvent volume and desorption time were found to be 2mL and 20min. The obtained recoveries of GEs ranged from 97.2% to 99.5%. The precision of the method, as indicated by the relative standard deviations (RSDs), was within the range from 2.5% to 5.1%. The detection limits of ethylene glycol ether derivatives (EGEs) ranged between 0.06 and 1.73mg m-3. The method was applied to study the storage conditions of workplace air samples.
Received 26 Nov 2016, Revised 22 Nov 2017, Accepted 28 Nov 2017
Faidi et al., J. Mater. Environ. Sci., 2018, 9 (5), pp. 1461-1469 1462 !
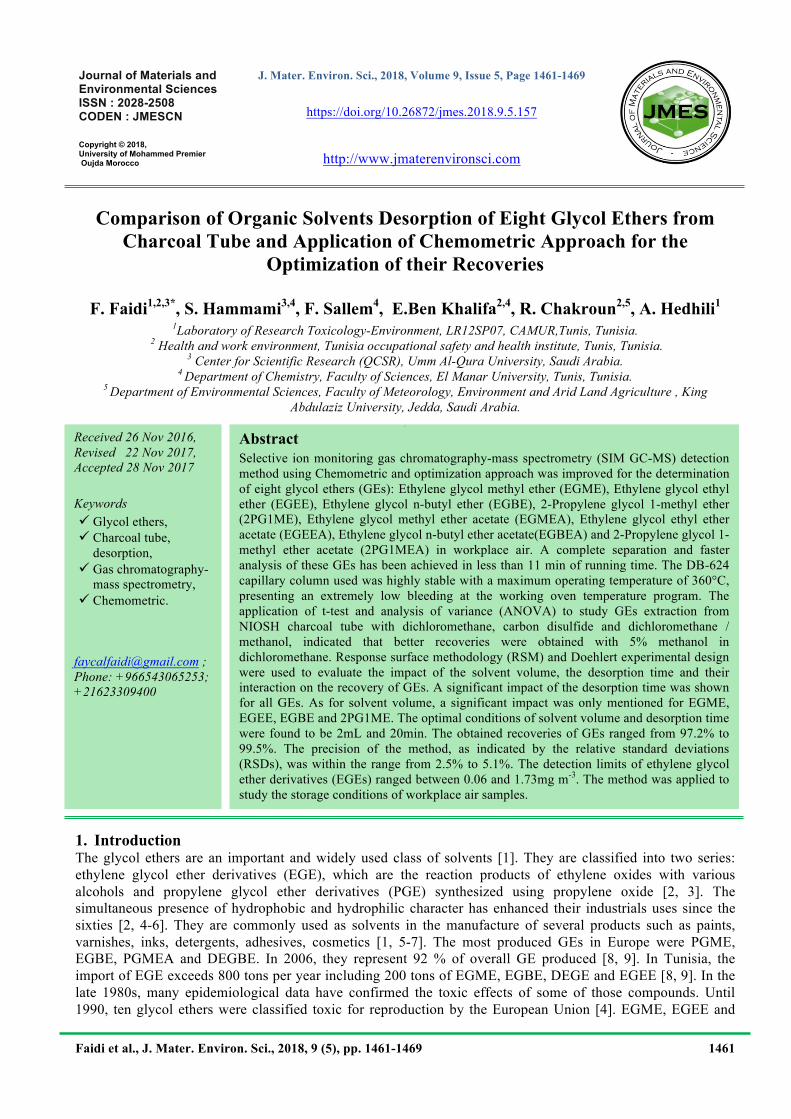
their acetates have been considered the most toxic GEs for reproduction and development health [2, 3, 10-12]. An increase of the embryo-toxic potential of ethylene glycol mono-alkyl with the length of the alkyl chain was shown [13]. Recent studies demonstrated a reprotoxic effect for EGBE and its acetate [10]. Consequently, these compounds were identified as candidates for risk assessment according to the European Community (EC) and were classified as hazardous substances [14]. So that, low threshold limits value-time weighted average (TLV-TWA) have been fixed for these compounds [10, 15]. Given the risk of workers exposition to such dangerous chemicals in chemical industries and the necessity of offering healthy environmental conditions in workplace air, the aim of this study consists to develop and validate a new method to measure the exposure for eight GEs. Four GE are deemed the most reprotoxic: Ethylene glycol methyl ether (EGME) , Ethylene glycol methyl ether acetate (EGMEA), Ethylene glycol ethyl ether (EGEE), Ethylene glycol ethyl ether acetate (EGEEA) and four are chosen due to their intensive use : EGBE Ethylene glycol n-butyl ether (EGBE) , Ethylene glycol n-butyl ether acetate(EGBEA), 2-Propylene glycol 1-methyl ether (2PG1ME ) and 2-Propylene glycol 1-methyl ether acetate (2PG1MEA). Several methods based on active sampling and gas chromatography-mass spectrometry GC/MS , have been developed for their assessment in workplace air. Samples pre-treatment is a crucial step in which the maximum quantities of compounds should be desorbed from charcoal tubes. To ensure this target, several solvents have been used in literature to extract GE from charcoal tubes after active sampling such as : carbon disulfide (CS2) [16, 17], dichloromethane (CH2Cl2) [18,19], dichloromethane and methanol CH2Cl2 / CH3OH (95:5) [16, 17, 20], CH2Cl2 / CS2 / CH3OH (60:35:5) [5], CS2/ dimethylsulfoxide (DMSO) (96:4) [18] and CS2 / dimethylformamide (DMF) [18]. The aim of this study is to compare extraction capabilities of three solvents generally used, by using statistical tests and Doehlert experimental design. These solvents are dichloromethane (S1), carbon disulfide (S2) and dichloromethane / methanol (S3). Then, we validated the whole analytical method through the determination of calibration curves, detection and quantification limits (LOD and LOQ). Repeatability was evaluated in terms of relative standard deviation (RSD). Finally, we have studied the stability conditions of GEs storage. 2.(Material and Methods 2.1.!Chemical and materials All standards and solvents were at a purification grade greater than 96%. EGME, EGMEA, EGEE, EGBE were purchased from Fluka, EGBEA and 2PG1MEA from Acros, EGEEA, 2PG1ME and dichlomethane from Merck, carbon disulfide from Scharleau, methanol from Prolabo and EGPhE from Alfa Aesar. Standard Charcoal tubes (ORBOTM) with two contents (A: 100 mg, B: 50 mg) were purchased from Supelco. 2.2.!GC-MS experiments Samples were analyzed using an Agilent 5973 Mass Selective Detector (MSD) coupled to an Agilent 6890N Gas Chromatograph equipped with an autosampler Agilent 7683. Separation was achieved on a DB-624 (6% cyanopropylphenyl- 94% dimethylpolysiloxane) capillary column (60 m × 0.252 mm I.D., 1.40 µm film thickness) using split injection (split ratio 50:1) and constant carrier gas flow (He 1.2 mL/min). The injector was kept at 260 °C. The GC oven temperature program started at 120°C (to elute the volatile compounds that may interfere with GE), held for 2 min, followed by a 25 °C/min raise up to 250 °C. At this temperature the column was baked for 3.5 min before cooling back to 120 °C. An overall run time was 10.7 min. The GC–MS interface was held at 290 °C, MS quads at 150 °C and ion source at 230 °C. The MSD worked in combined FS-SIM EI mode (70 eV). Full scanning (FS) was used for compounds identification while selected ion monitoring mode (SIM) was used for quantification. Acquisition started after a 4.7 min solvent delay. Compounds retention times and their monitoring ions are given in Table 1 and the elution chromatogram is shown in Figure 1. The ethylene glycol phenyl ether (EGPhE) was used as internal standard (IS). As it’s well known, compound volatility depends mainly on its polarity and molecular weight [21]. Since the medium polarity of the chromatograph column (DB-624), compounds elution depends on compound polarity and volatility: the first eluted compound is the most polar and volatile and inversely. Peaks were also identified using an in-house library and spectral interpretation. It is noted that the most stable fragment ions are those obtained from a simple breaking bond at β position of two oxygen atoms or at α position of one oxygen atom. 2.3.! Solvents desorption experiments 2.3.1.!Optimization of desorption solvents Chemical desorption consists to extract the target compound, initially trapped on a solid sorbent, using a suitable solvent with a high degree of efficiency that should be over 75% as described in NIOSH(National Institute for Occupational Safety and Health) method requirements [22]. To the best of our knowledge, it’s the first time that
Faidi et al., J. Mater. Environ. Sci., 2018, 9 (5), pp. 1461-1469 1463 !
a comparative study has been done with three types of solvents which are dichloromethane, carbon disulfide and dichloromethane / methanol (95: 5), denoted S1, S2 and S3, respectively.
Table 1: Monitored ions and retention times (RT) of Analyzed glycol ethers
Figure 1: Total ion chromatogram of 8 GEs and internal standard under the optimized chromatographic conditions We have eliminated the use of DMSO and DMF due to co-elution with the studied compounds. In order to minimize experiences number, we chose to work with only two GE: EGME and EGBEA. These two elements were characterized with a substantially different physicochemical properties, therefore a different behavior toward the activated carbon and solvent desorption should be observed. We doped in the front section of sampling tube (100 mg) an amount of each GE equal to 8 hours of an active sampling with 0.1 L/min flow sampling under three exposure levels: 0.1, 0.5 and 1 TLV-TWA denoted respectively L1, L2 and L3. The solvent volume used for desorption was 1.5 mL and the extract was injected directly into the chromatographic system. This operation was done for the three exposure levels (L1, L2 and L3) and repeated 6 times for each solvent. In order to calculate the desorption efficiency and the recovery (R), the same experiments were done without activated carbon. 2.3.2.!Optimization of methanol percentage Another series of experiments have been conducted to examine the effect of the methanol/dichloromethane proportion on desorption efficiency. We have varied the methanol content: 0%, 5%, 10%, 25% and 50%. Each experience was repeated 6 times with and free activated carbon for the three studied levels (L1, L2 and L3). 2.3.3.!Optimization of desorption conditions In literature, the desorption duration generally used for GE’s extraction was 30 min [17-20] and desorption solvent volume was 2 mL [5, 19] and 3 mL [17]. Only B. Muir [23] studied the effect of solvent type, solvent volume and sampling tube type using factorial experimental design. In this work, we optimized solvent volume and desorption time using Doehlert experimental design. Doehlert uniform shell design can be used for the determination of critical conditions because it offers uniform distribution of points over the whole experimental domain [24, 25]. This design describes a spherical experimental domain. The total number of experiments is expressed by the formula N = k2 + k + 1, where k is the number of factors [26]. 2.4.! Sample stability experiments Stability test of selected GEs has been studied for two concentration levels (L1 and L2). It has been investigated for GEs adsorbed on charcoal tubes and for these ethers after desorption, in order to choose the most suitable state in storage process. Furthermore, the storage temperature condition has been studied at room temperatures and 4 ᵒC. The concentrations measurements of GEs were repeated three times every 2 days during two weeks of storage.
Faidi et al., J. Mater. Environ. Sci., 2018, 9 (5), pp. 1461-1469 1464 !
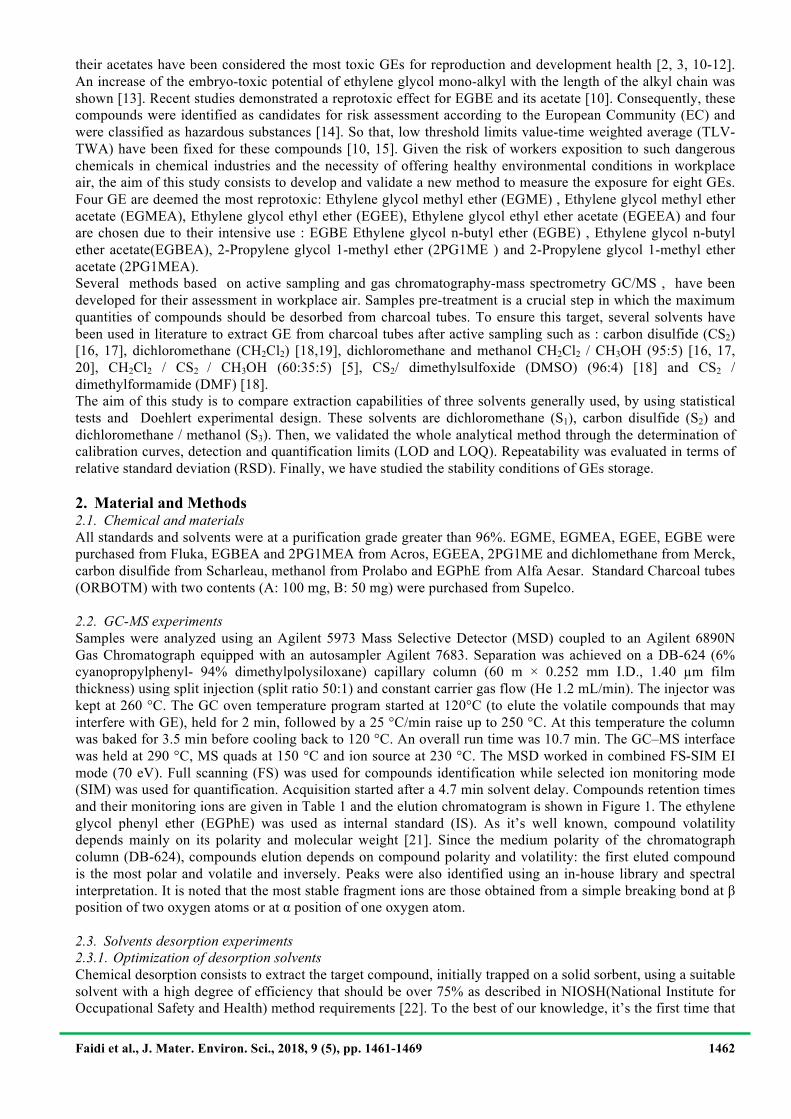
3.(Results and discussion 3.1.! Solvent’s comparative study The recoveries of EGME with S1 and S3 are greater than those of EGBEA. However, the percentage of recovered EGBEA using S2 is greater than the EGME’s one. Figure 2 shows a similar desorption efficiency of S1 and S3 with the two studied compounds. To choose the appropriate solvent, t- test was applied to compare responses between series with and free activated carbon. This test indicates that EGME’s recoveries can reach 100% only with S3 for all studied levels. EGBEA cannot be totally recovered (100%) with these solvents. Consequently, S3 shall be the suitable desorption solvent since EGME has the lowest air exposure limit.
Figure 2: Recoveries of EGME (a) and EGBEA (b) using dichloromethane (S1),
carbon disulfide (S2) and dichloromethane / methanol (95: 5) (S3).
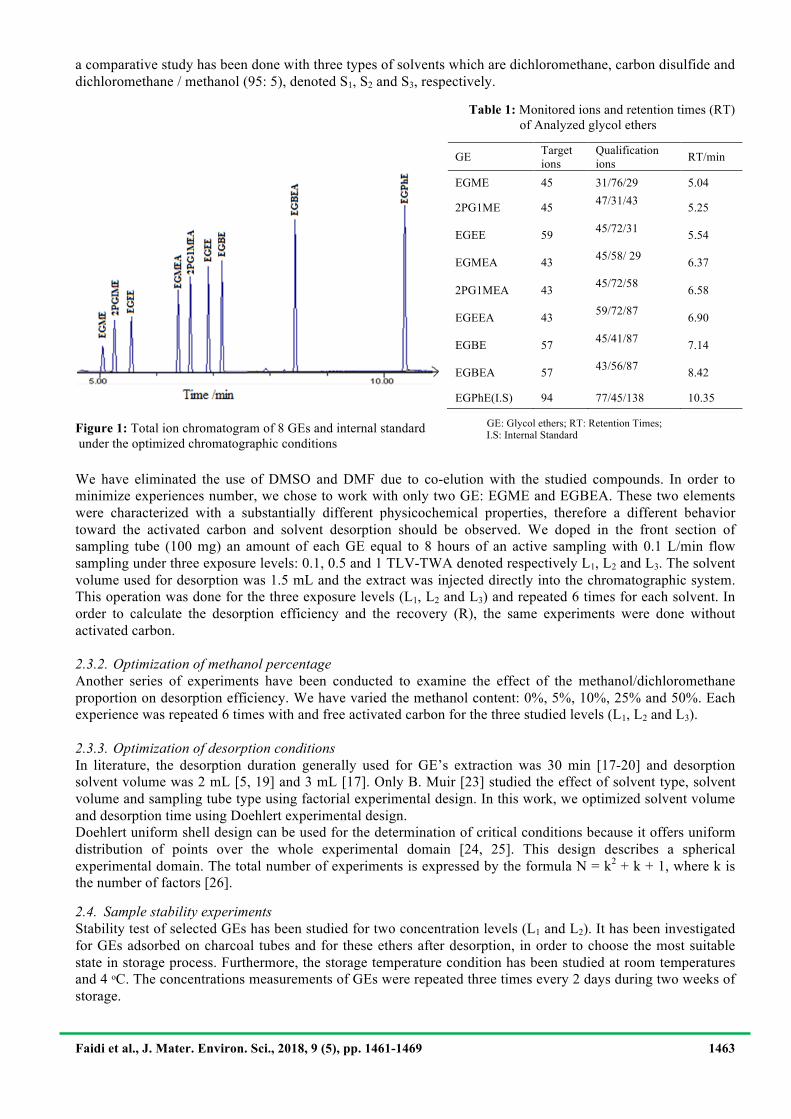
3.2.!Effect of methanol percentage The Figure 3 shows that above 10% of methanol in dichloromethane, compounds recoveries decrease significantly for all three levels. Furthermore, they are very close at the range between 0 and 10%. This may be explained by the fact that methanol in large proportion (more than 10%) may create a layer on charcoal that establish more hydrogen bond with studied compounds decreasing their desorption.
Figure 3: Effect of methanol percentage on EGME (a) and EGBEA (b) desorption efficiencies.
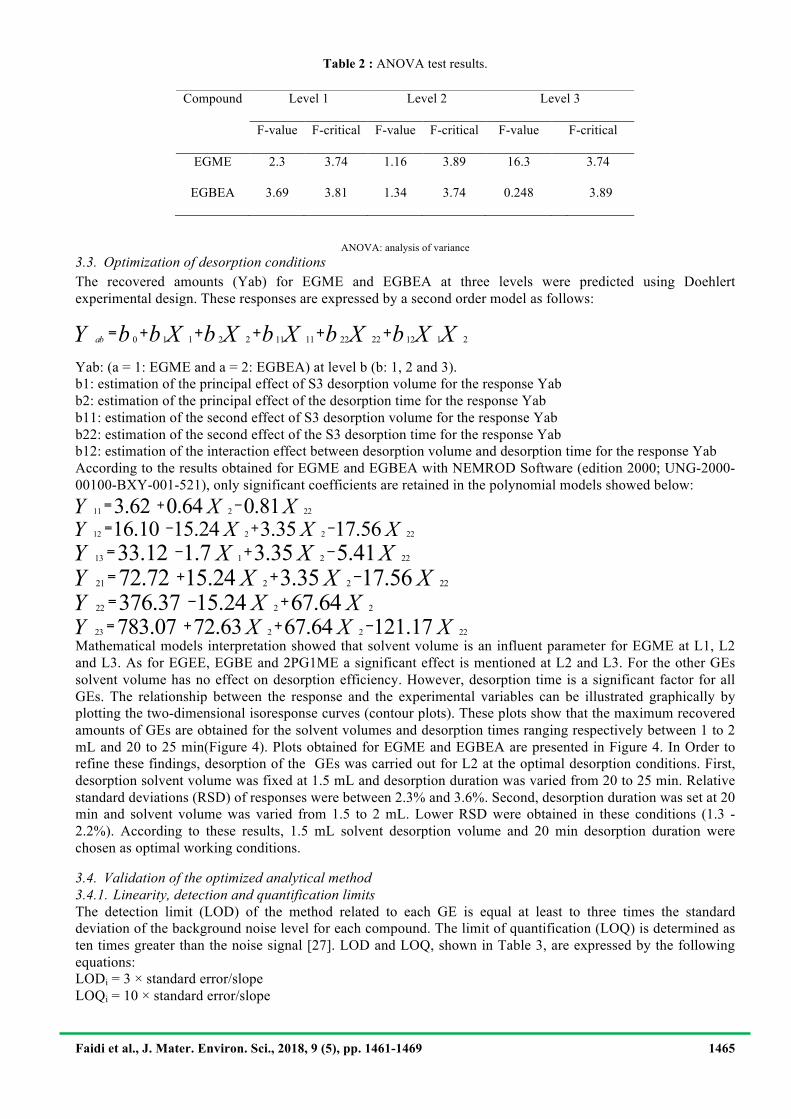
ANOVA test was applied to compare EGME and EGBEA recoveries at 0, 5 and 10% methanol in dichloromethane. As it can be seen from Table 2, F-critical is high than F-value only for EGME at L3. This indicates that % methanol in dichloromethane has no effect on the EGBEA’s responses at all studied levels. For EGME, a negative effect is revealed at level 3 leading to a decrease of its recovery from the charcoal tube. The best responses for EGME are reached at 5% of methanol in dichloromethane. Therefore, 5% of methanol in dichloromethane is convenient for the recovery of GEs from activated carbon.
Faidi et al., J. Mater. Environ. Sci., 2018, 9 (5), pp. 1461-1469 1465 !
Table 2 : ANOVA test results.
ANOVA: analysis of variance 3.3.!Optimization of desorption conditions The recovered amounts (Yab) for EGME and EGBEA at three levels were predicted using Doehlert experimental design. These responses are expressed by a second order model as follows:
1 2 11 22 1 20 1 2 11 22 12ab b b b b b bY X X X X X X= + + + + +
Yab: (a = 1: EGME and a = 2: EGBEA) at level b (b: 1, 2 and 3). b1: estimation of the principal effect of S3 desorption volume for the response Yab b2: estimation of the principal effect of the desorption time for the response Yab b11: estimation of the second effect of S3 desorption volume for the response Yab b22: estimation of the second effect of the S3 desorption time for the response Yab b12: estimation of the interaction effect between desorption volume and desorption time for the response Yab According to the results obtained for EGME and EGBEA with NEMROD Software (edition 2000; UNG-2000-00100-BXY-001-521), only significant coefficients are retained in the polynomial models showed below:
11 2 223.62 0.64 0.81Y X X= + −
12 2 2 2216.10 15.24 3.35 17.56Y X X X= − + −
13 1 2 2233.12 1.7 3.35 5.41Y X X X= − + −
21 2 2 2272.72 15.24 3.35 17.56Y X X X= + + −
22 2 2376.37 15.24 67.64Y X X= − +
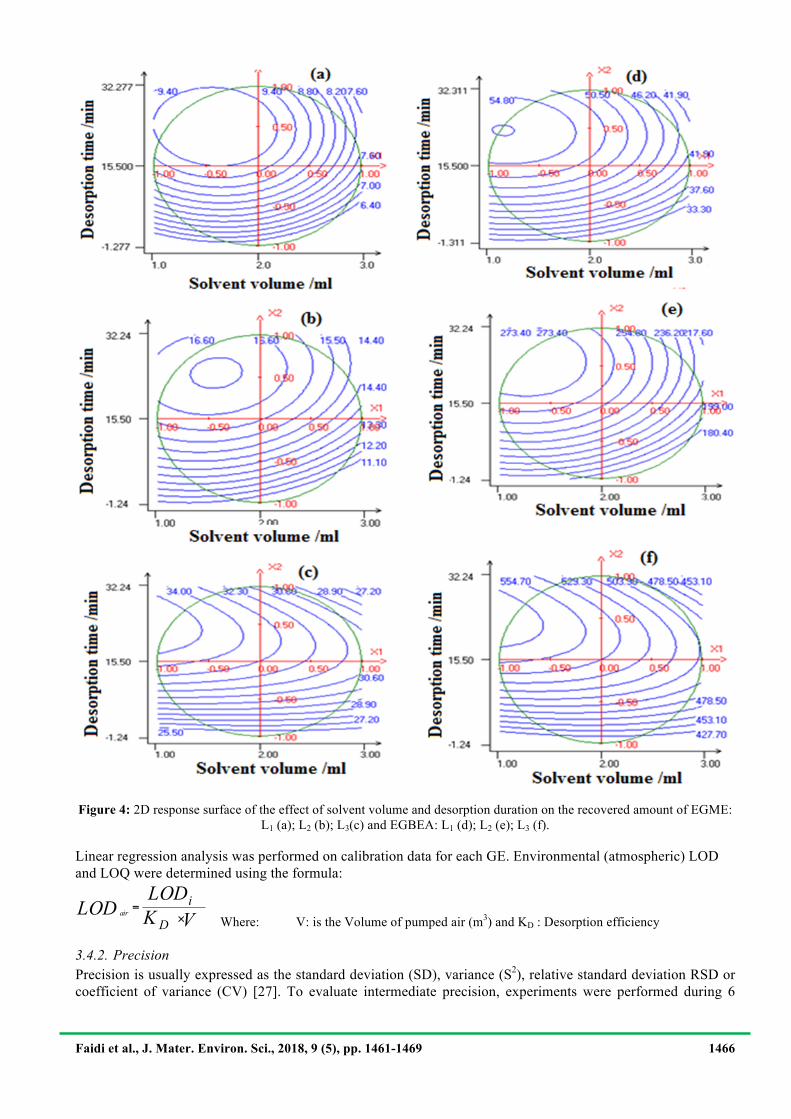
23 2 2 22783.07 72.63 67.64 121.17Y X X X= + + − Mathematical models interpretation showed that solvent volume is an influent parameter for EGME at L1, L2 and L3. As for EGEE, EGBE and 2PG1ME a significant effect is mentioned at L2 and L3. For the other GEs solvent volume has no effect on desorption efficiency. However, desorption time is a significant factor for all GEs. The relationship between the response and the experimental variables can be illustrated graphically by plotting the two-dimensional isoresponse curves (contour plots). These plots show that the maximum recovered amounts of GEs are obtained for the solvent volumes and desorption times ranging respectively between 1 to 2 mL and 20 to 25 min(Figure 4). Plots obtained for EGME and EGBEA are presented in Figure 4. In Order to refine these findings, desorption of the GEs was carried out for L2 at the optimal desorption conditions. First, desorption solvent volume was fixed at 1.5 mL and desorption duration was varied from 20 to 25 min. Relative standard deviations (RSD) of responses were between 2.3% and 3.6%. Second, desorption duration was set at 20 min and solvent volume was varied from 1.5 to 2 mL. Lower RSD were obtained in these conditions (1.3 - 2.2%). According to these results, 1.5 mL solvent desorption volume and 20 min desorption duration were chosen as optimal working conditions.
3.4.!Validation of the optimized analytical method 3.4.1.!Linearity, detection and quantification limits The detection limit (LOD) of the method related to each GE is equal at least to three times the standard deviation of the background noise level for each compound. The limit of quantification (LOQ) is determined as ten times greater than the noise signal [27]. LOD and LOQ, shown in Table 3, are expressed by the following equations: LODi = 3 × standard error/slope LOQi = 10 × standard error/slope
Linear regression analysis was performed on calibration data for each GE. Environmental (atmospheric) LOD and LOQ were determined using the formula:
Where: V: is the Volume of pumped air (m3) and KD : Desorption efficiency
3.4.2.!Precision Precision is usually expressed as the standard deviation (SD), variance (S2), relative standard deviation RSD or coefficient of variance (CV) [27]. To evaluate intermediate precision, experiments were performed during 6
airi
D
LODLOD K V
=×
Faidi et al., J. Mater. Environ. Sci., 2018, 9 (5), pp. 1461-1469 1467 !
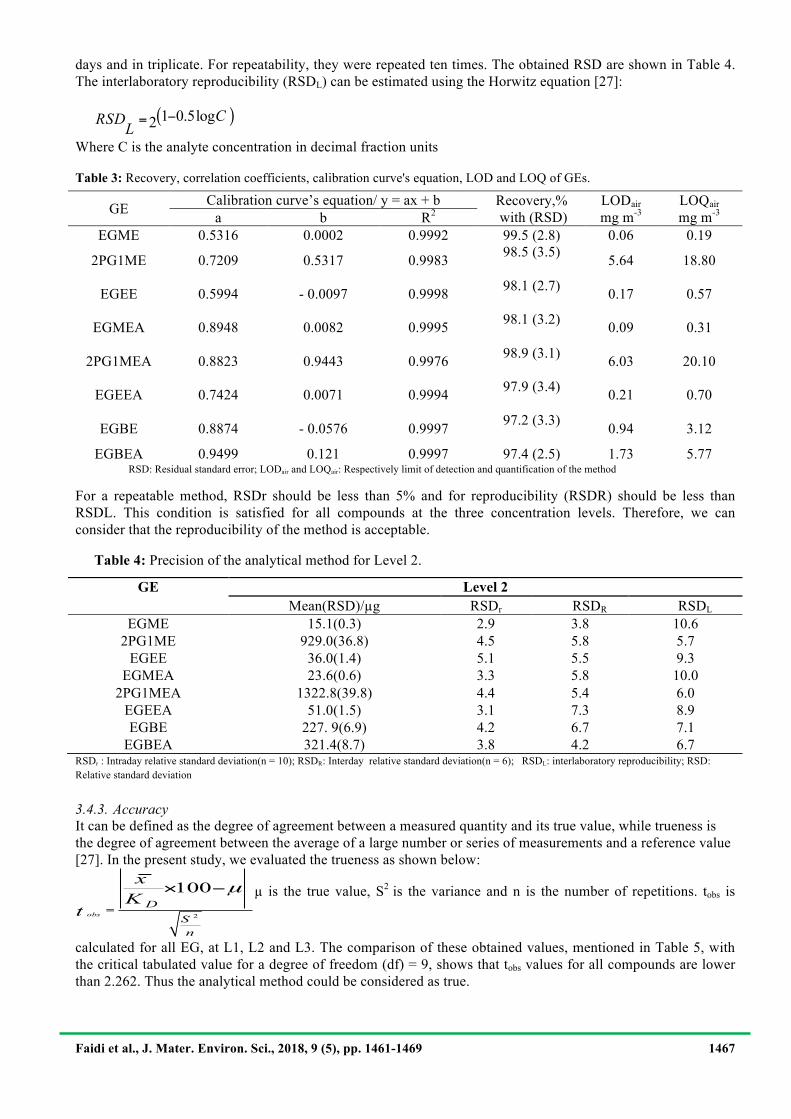
days and in triplicate. For repeatability, they were repeated ten times. The obtained RSD are shown in Table 4. The interlaboratory reproducibility (RSDL) can be estimated using the Horwitz equation [27]:
( )1 0.5log2 CRSDL−=
Where C is the analyte concentration in decimal fraction units
Table 3: Recovery, correlation coefficients, calibration curve's equation, LOD and LOQ of GEs.
RSD: Residual standard error; LODair and LOQair: Respectively limit of detection and quantification of the method For a repeatable method, RSDr should be less than 5% and for reproducibility (RSDR) should be less than RSDL. This condition is satisfied for all compounds at the three concentration levels. Therefore, we can consider that the reproducibility of the method is acceptable.
Table 4: Precision of the analytical method for Level 2.
RSDr : Intraday relative standard deviation(n = 10); RSDR: Interday relative standard deviation(n = 6); RSDL: interlaboratory reproducibility; RSD: Relative standard deviation
3.4.3.!Accuracy It can be defined as the degree of agreement between a measured quantity and its true value, while trueness is the degree of agreement between the average of a large number or series of measurements and a reference value [27]. In the present study, we evaluated the trueness as shown below:
2
100
obs
DSn
xK
t
µ=
× − µ is the true value, S2 is the variance and n is the number of repetitions. tobs is
calculated for all EG, at L1, L2 and L3. The comparison of these obtained values, mentioned in Table 5, with the critical tabulated value for a degree of freedom (df) = 9, shows that tobs values for all compounds are lower than 2.262. Thus the analytical method could be considered as true.
GE Calibration curve’s equation/ y = ax + b Recovery,% with (RSD)
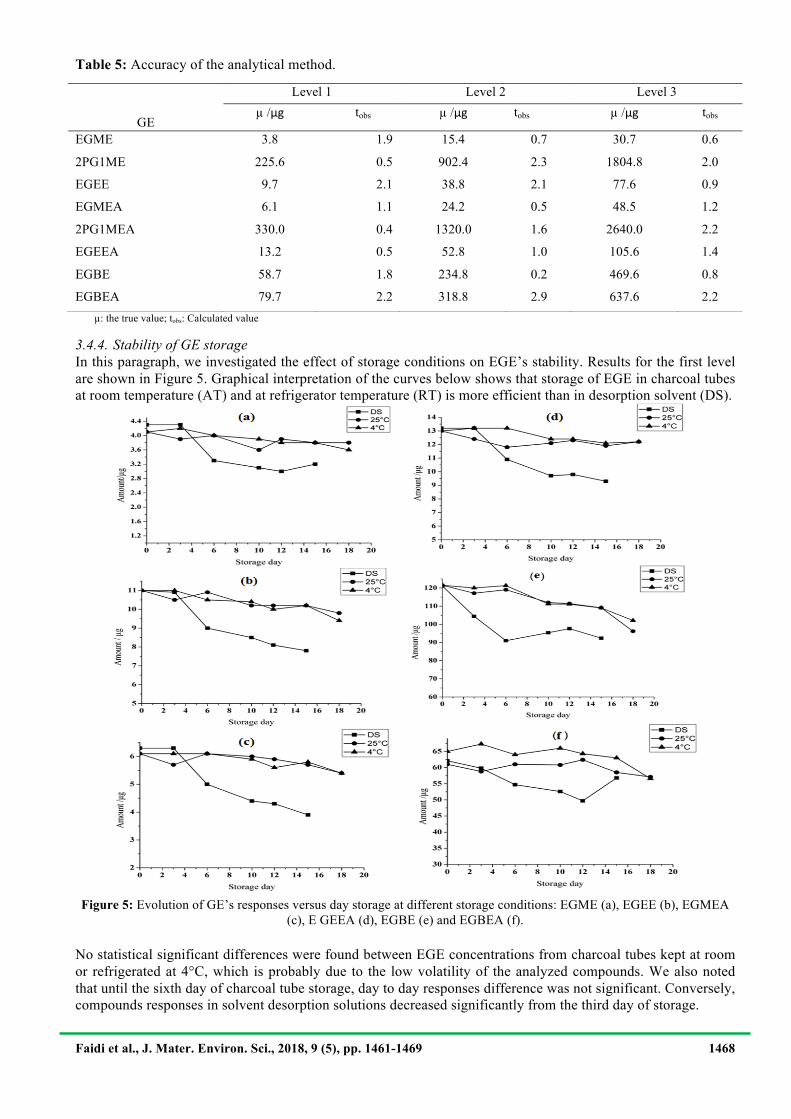
3.4.4.!Stability of GE storage In this paragraph, we investigated the effect of storage conditions on EGE’s stability. Results for the first level are shown in Figure 5. Graphical interpretation of the curves below shows that storage of EGE in charcoal tubes at room temperature (AT) and at refrigerator temperature (RT) is more efficient than in desorption solvent (DS).
Figure 5: Evolution of GE’s responses versus day storage at different storage conditions: EGME (a), EGEE (b), EGMEA
(c), E GEEA (d), EGBE (e) and EGBEA (f).
No statistical significant differences were found between EGE concentrations from charcoal tubes kept at room or refrigerated at 4°C, which is probably due to the low volatility of the analyzed compounds. We also noted that until the sixth day of charcoal tube storage, day to day responses difference was not significant. Conversely, compounds responses in solvent desorption solutions decreased significantly from the third day of storage.
Faidi et al., J. Mater. Environ. Sci., 2018, 9 (5), pp. 1461-1469 1469 !
Conclusion This paper has outlined the determination of the optimum conditions for the desorption of GEs from charcoal using Doehlert experimental design. We obtained optimum chromatographic parameters allowing reasonable analysis duration (10.7 min) and a most efficient mixture of desorption solvent (CH2Cl2/CH3OH (95:5) recovering more than 97% of each GE. The validation of the analytical method and its application to study samples storage conditions makes this method reliable for the assessment of GE in air workplace and could help decision makers. Our investigation into this area is still ongoing by comparing GE solvents desorption with thermal desorption. Despite these encouraging results, these findings might not be transferable to any types of air monitoring device. Further studies on other sampling devices are therefore required. Acknowledgements-This work was carried out and totally sponsored by the Tunisian institute of health and safety at work. We would like to thank the following people for their support, without whose help this work would never have been possible: Almabrouk Ahlem and Nehdi Houda. We are indebted to Pr. Nouwaigui Habib who gave us much valuable advice in the early stages of this work. References
INSERM collective expertise, (1999). 3.! A. Laudet-Hesbert, Toxicol. Lett. 156 (2005) 51. 4.! M.L. Multigner, S. Catala, M. Cordier, P. Delaforge, R. Fenaux, I. Garnier, Toxicol. Lett. 156 (2005) 37. 5.! H. Fromme, L. Nitschke, S. Boehmer, M. Kiranoglu, T. Goen, Chemosphere, 90 (2013) 2714. 6.! M. Abareshi, M. Moosavi, J. Mol. Liq.184 (2013) 17. 7.! J.B. Sullivan, G.R. Krieger, Clinical Environmental Health and Toxic Exposures, ed. L. Williams and
Wilkins, Philadelphia, (1999) 45. 8.! Afsset n°2003/016, Agence française de sécurité sanitaire de l'environnement et du travail, maisons-
Alfort, France, (2008). 9.! Data Base of Foreign Trade of Organic chemical Products, Compilation prepared by National Institute of
Statistics (INS), http://www.apps.ins.tn/comex/fr/index.php . 10.! A. Cicolella, Gynecol. Obstet. Fertil. 34 (2006) 955. 11.! F.W. Frank, Toxicol. Lett. 156 (2005) 13. 12.! P. Ruiz, M. Mumtaz, V. Gombar, Toxicol. Appl. Pharmacol. 254 (2011) 198. 13.! H.C. Bowden, K. Wilby, C.A. Botham, P.J. Adam, F.W. Ross, Toxicol. In Vitro. 9 (1995) 773. 14.! T.G. Vermeire, T.D. Jager, B. Bussian, J. Devillers, K. Haan, B. Hansen, Chemosphere, 8 (1993) 1823. 15.! B. Courtois, S. Cadou, The limit values for occupational exposure to chemical agents, ed. INRS, 3rd ed,
INRS, France, (2012). 16.! J. Park, C. Yoon, H. Byun, Y. Kim, D. Park, K. Ha, J. Occup. Health. 54 (2012) 141. 17.! K. Andersson, J.O Levin, R. Lindahl, C.A. Nilsson, Chemosphere, 11 (1982) 1115. 18.! HSE, "Methods for the Determination of Hazardous Substances", Health and Safety Executive, Norwich,
(2000) 20. 19.! S.M. Pendergrass, in "Manual of Analytical Methods", ed., M. E. Peter, 4th ed., NIOSH, method 5523,
(1996). 20.! Data Base of Methods for the Sampling and the Analysis of Chemical Agents, Validated by National
Institute of Research and Safety (INRS), http://www.inrs.fr/publications/bdd/metropol.html. 21.! J. Hajšlová, T. Cajka, in "Food toxicant analysis", ed., In PicÓ Y., 1st ed., Chap. 12, Elsevier science,
Yolanda. (2006) 419. 22.! M. Harper, J. Chromatogr. A. 885 (2000) 129. 23.! B. Muir, H.B. Duffy, M.C. Moranb, J. Chromatogr. A. 1038 (2004) 183. 24.! P. Araujoa, S. Janagapa, J. Chromatogr. B. 910 (2012) 14. 25.! D. Doehlert, J. R. Stat. Soc. 19 (1970) 231. 26.! J. Goupy, in "Techniques de l’ingénieur", centre de documentation brabois, France, (2013) 29. 27.! G. Indrayanto, in "Profiles of Drug Substances, Excipients and Related Methodology", ed., In Brittain H.,
1st ed., Chap. 12, Academic Press, USA. (2012) 439.