1/22/13 1 COMPARISON OF PHYSICAL ACTIVITY ASSESSMENT TOOLS DANIELBERNSTEIN (DAVIDSON COLLEGE) ELENACOLEMAN (SMITH COLLEGE) ALECIALAMBERT (WESTERN STATE COLLEGE OF COLORADO) DANIEL PEACH (BATES COLLEGE) JOE SHINDLER (DE LA SALLE NORTH) HANNAH CALLENDER MEIKE NIEDERHAUSEN University of Portland REU/RET Summer 2012 IN COLLABORATION WITH: JACQUIE VAN HOOMISSEN (BIOLOGY) ANDREW LAFRENZ (BIOLOGY) DEANA JULKA (SOCIAL AND BEHAVIORAL SCIENCES) ANDREW DOWNS (SOCIAL AND BEHAVIORAL SCIENCES) Compare the physical activity measurements obtained by the Actigraph GT3X+ ™ and the Nike FuelBand ™ Determine whether or not physical activity is increased among college students when wearing the FuelBand ™ vs University of Portland REU/RET 2012 Images courtesy of Nike Corp and Actigraph, Inc. Talk Overview Background info / Motivation Devices: Their Function and Output Our Research Focus Areas Next Steps / Future Plans Research in Quantifying Physical Activity Relationship between physical activity levels and physical health Obesity epidemic, particularly in children Quantifying physical activity Poor accuracy of self-reporting (UP study, 2011) Objective measures of physical activity needed Accelerometers Can be worn during daily living Provides frequency and intensity of activity (pedometer fail!) Accelerometer data can be analyzed to provide predicted energy expenditure.
ALECIALAMBERT (WESTERN STATE COLLEGE OF COLORADO) DANIEL PEACH (BATES COLLEGE)
JOE SHINDLER (DE LA SALLE NORTH) HANNAH CALLENDER MEIKE NIEDERHAUSEN
University of Portland REU/RET Summer 2012
IN COLLABORATION WITH: JACQUIE VAN HOOMISSEN (BIOLOGY)
ANDREW LAFRENZ (BIOLOGY) DEANA JULKA (SOCIAL AND BEHAVIORAL SCIENCES)
ANDREW DOWNS (SOCIAL AND BEHAVIORAL SCIENCES)
Compare the physical activity measurements obtained by the Actigraph GT3X+™ and the Nike FuelBand™
Determine whether or not physical activity is increased among college students when wearing the FuelBand™
vs
University of Portland REU/RET 2012
Images courtesy of Nike Corp and Actigraph, Inc.
Talk Overview
Background info / Motivation Devices: Their Function and Output
Our Research Focus Areas Next Steps / Future Plans
Research in Quantifying Physical Activity
Relationship between physical activity levels and physical health Obesity epidemic, particularly in children
Quantifying physical activity Poor accuracy of self-reporting (UP study, 2011) Objective measures of physical activity needed
Accelerometers Can be worn during daily living Provides frequency and intensity of activity (pedometer fail!) Accelerometer data can be analyzed to provide predicted
energy expenditure.
1/22/13
2
3-axis orientation
+ Axis 2
+ Axis 1
- Axis 3
+ Axis 3
- Axis 1
- Axis 2
ActiGraph GT3X+™ Accelerometer Output from the GT3X+™
Cantilever beam deviations Voltage change Voltage Acceleration (a/g) (g = acceleration due to gravity)
30 Hz data collection per axis (30 data points per second)
Acceleration Activity Count Conversion routine applies a band pass filter and converts
30 Hz acceleration values to 1 Hz activity counts, independently for each axis.
Activity Counts Energy Expenditure Energy expenditure: METS, Calories
METS = Multiples of energy expenditure when at rest Compare METS, Calories to CDC guidelines
CDC = Centers for Disease Control and Prevention
Nike FuelBand™ Accelerometer
“Nike+ FuelBand tracks your activity through a sport-tested accelerometer, then translates every move into NikeFuel.” – Nike Advertisement*
Output: Nike FuelPoints™, Calories, Steps, Time. Syncs with iPhone, iPad (Bluetooth) Uploads to Nike web site (USB)
*Quote and Image from http://nikeplus.nike.com/plus/
Nike FuelBand™: Why study it?
Consumer device Important to test validity against research standard
Potential research instrument with advantages over commonly used accelerometers Better participant compliance due to ease of use and
comfort. Less expensive.
Use may provide motivation to increase physical activity
1/22/13
3
Accelerometer Comparison
Actigraph GT3X+™ Nike FuelBand™
Location worn on body Waist Wrist
Data Frequency Per 1 second Per 15 minutes (900 s)
Output parameters Counts
Steps
FuelPoints™ Calories Steps
Waist vs wrist Can energy expenditure be accurately calculated from wrist
motion? Adjusting activity analysis for sparse FB data Correlation between output parameters
Counts FuelPoints™& Calories
Talk Outline
GT3X+™ data analysis Converting from acceleration to activity counts (Dan) Analyzing 1 sec counts to determine energy
expenditure and compare to guidelines (Daniel)
GT3X+™ versus FuelBand™ Controlled physics experiments for comparing output
parameters (Alecia) Preliminary results of pilot study on humans (Elena)
Correlation of GT3X+™ and FuelBand™ output Correlation of FuelBand™ use and activity level
What does the GT3X+ report?
Raw Data Counts
Sample Rate 30 Hz 1 Hz
Units Acceleration/g (g = 9.804 m/s2)
Proprietary
“Raw” Data Counts
1/22/13
4
Why do we care?
Most studies on physical activity use counts––not raw data.
The Actilife software generates counts from the raw data. What if counts don’t accurately reflect physical activity?
Data from Spring Experiment
5 10 15 20 25 30 35 4080
90
100
110
120
130
140
150
160
170
180
Seconds
Co
un
ts
Actilife Epochs
Fractions of g at 30 Hz (raw data)
Counts at 1 Hz
30 Hz Raw Data to Epochs
Raw Data
x 2048
Raw Data x 2048
Raw Data x 2048
|Δ|
|Δ(Raw Data x 2048)|
|Δ(Raw Data x 2048)|
Mean Value Per Second.
Mean(|Δ(Raw Data x 2048)|) (These are counts!)
5 10 15 20 25 30 35 4080
90
100
110
120
130
140
150
160
170
180
Seconds
Coun
ts
Approximated EpochsActilife Epochs
What do we get?
1/22/13
5
Greater inaccuracies with other activity types 30 Hz Raw Data to Epochs
Raw Data
X2048
Raw Data x 2048
Raw Data x 2048 |Δ|
|Δ(Raw Data x 2048)|
|Δ(Raw Data x 2048)|
Mean Value per Second
Mean(|Δ(Raw Data x 2048)|) (These are counts!)
Filter the Data!
Raw data input signal
y(t) is the filtered signal.
High-Q Bandpass filter
Through correspondence with Actilife, we learned that they use a “High-Q bandpass filter”.
What does this mean? It means they use that spring equation from your
differential equations class.
How do we solve for y(t)?
The filter is characterized by its impulse response––how it responds to an infinitesimal kick. (This is straightforward.)
Any input signal can be rewritten as a series of time-shifted and scaled infinitesimal kicks. (This is also straightforward.)
The y(t) is the sum of scaled and shifted impulse responses. This is equivalent to the convolution of the impulse response
and the input signal.
1/22/13
6
! ! "# $ $"# % %"# & &"# ’ ’ "# #! ! "$
! ! "! #
!
! "! #
! "$
! "$#
! "%
! "%#
(
)*(+
The impulse response characterizes the filter––this characterization is independent of the input signal.
Impulse Response Frequency Response
o Filters frequencies above and below the center frequency. o Functional form of frequency response depends on filter parameters.
Filtered Data vs. Raw Data
The filter cuts high frequency noise from the signal.
Improved counts after filtration
1/22/13
7
(Old Count Approximations) Why do we care?
Depending upon the data set we used, our approximations differed from the Actilife counts by 2%-5%.
Actilife’s algorithm for translating 30 Hz raw data to counts is non-trivial. Do counts accurately reflect physical activity?
Talk Outline
GT3X+™ data analysis Converting from acceleration to activity counts (Dan) Analyzing 1 sec counts to determine energy
expenditure and compare to guidelines (Daniel)
GT3X+™ versus FuelBand™ Controlled physics experiments for comparing output
parameters (Alecia) Preliminary results of pilot study on humans (Elena)
Correlation of GT3X+™ and FuelBand™ output Correlation of FuelBand™ use and activity level
Fundamental Questions
Do people get enough exercise? How much is enough? How do we determine how much exercise someone
is getting? How do we improve our methods?
1/22/13
8
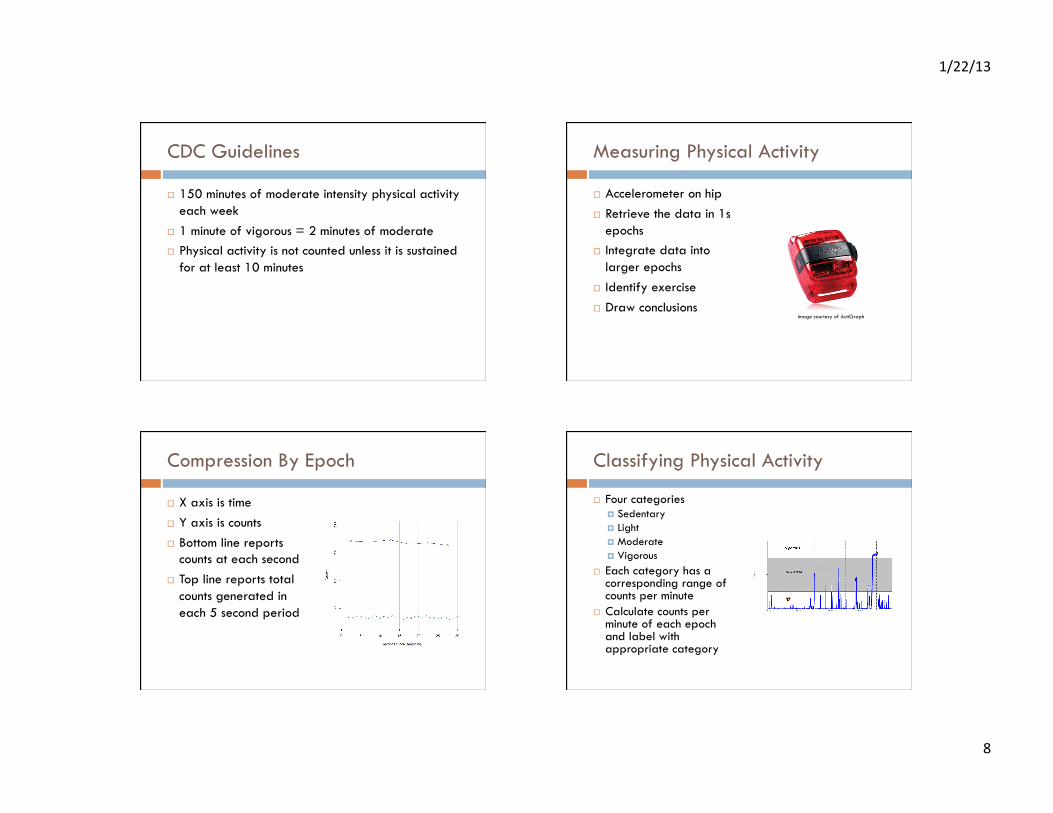
CDC Guidelines
150 minutes of moderate intensity physical activity each week
1 minute of vigorous = 2 minutes of moderate Physical activity is not counted unless it is sustained
for at least 10 minutes
Measuring Physical Activity
Accelerometer on hip Retrieve the data in 1s
epochs Integrate data into
larger epochs Identify exercise Draw conclusions
Image courtesy of ActiGraph
Compression By Epoch
X axis is time Y axis is counts Bottom line reports
counts at each second Top line reports total
counts generated in each 5 second period
Classifying Physical Activity
Four categories Sedentary Light Moderate Vigorous
Each category has a corresponding range of counts per minute
Calculate counts per minute of each epoch and label with appropriate category
1/22/13
9
CDC Guidelines (recap)
150 minutes of moderate intensity physical activity each week
1 minute of vigorous = 2 minutes of moderate Physical activity is not counted unless it is sustained
for at least 10 minutes
Identifying Sustained Exercise
A bout is 10 or more minutes of uninterrupted exercise (moderate or vigorous)
Two definitions Strict Forgive two degenerate minutes
CDC Guidelines (recap)
150 minutes of moderate each week 1 minute of vigorous = 2 minutes of moderate Physical activity is not counted unless it is sustained
for at least 10 minutes
Does our choice of epoch length effect whether or not a person is categorized to meet these
guidelines? (Ideally, no)
Method
Get accelerometer data from old experiments 83 people wore accelerometers for 2 weeks
Compress each person’s data 9 different ways using 9 different epoch lengths 5s, 10s, 15s, 30s, 45s, 60s, 75s, 90s, 120s
If a person meets guidelines under one epoch, they should meet guidelines under any epoch
1/22/13
10
Results: Epoch Length Matters Further Projects
Cut points should be validated for specific epoch lengths
Make my R code available for public use
Talk Outline
GT3X+™ data analysis Converting from acceleration to activity counts (Dan) Analyzing 1 sec counts to determine energy
expenditure and compare to guidelines (Daniel)
GT3X+™ versus FuelBand™ Controlled physics experiments for comparing output
parameters (Alecia) Preliminary results of pilot study on humans (Elena)
Correlation of GT3X+™ and FuelBand™ output Correlation of FuelBand™ use and activity level
Inconsistent results from first run of every group Extra Group: Testing 1st Run Hypothesis
Run 1 Run 2 Run 3
Standard Group Results
Standard Group
Weights Group
Heights Group
Results from Run 3 of each Group Weights Group
Run 2
1/22/13
12
Heights Group
Run 3
Extra Group: First Run Hypothesis
Run 1: Varying Weights Supports Hypothesis (unlike previous runs)
Run 2: Varying Heights Does NOT support hypothesis (similar to previous runs)
Run 3: Varying Heights Supports Hypothesis (similar to previous runs)
Extra Group Run 1 Weights Group Run 2 Weights Group Run 3 EX:
Compiled Data
Correlation Height Weight
FuelPoints™ Yes R2=.906
y=3.9164x
No R2=.0104
Calories Yes R2=.9177
y=1.2192x
Yes R2=.9955 y=.572x
Steps No R2=.0057
No R2=.0057
Normalized Values
1/22/13
13
Talk Outline
GT3X+™ data analysis Converting from acceleration to activity counts (Dan) Analyzing 1 sec counts to determine energy
expenditure and compare to guidelines (Daniel)
GT3X+™ versus FuelBand™ Controlled physics experiments for comparing output
parameters (Alecia) Preliminary results of pilot study on humans (Elena)
Correlation of GT3X+™ and FuelBand™ output Correlation of FuelBand™ use and activity level
Participant Study
First Week: Participants wear GT3X+™
Second Week: Participants wear both the FuelBand™ and GT3X+™
Want to see if activity increased from the first to second week
How closely related are FuelPoints™and counts and FuelBand™ steps and GT3X+™steps?
Percent Change of Total Counts from Wk1 to Wk2
Stars indicate Varsity Team Athletes
Weekly Total Counts
Comparing Shape from Week 1 to Week 2
1/22/13
14
T-Tests for Percent Change (1-sided)
T-Test Run of Percent Change Sample Size (n) P-Value Average % Change
All Participants 12 .52 ‐.444
Motivated by FuelBand™ 6 .27 7.19
Would continue using FuelBand™
3 .20 14.3
Enjoyed usingFuelBand™ 9 .67 ‐3.46
Monitored progress on PC 4 .46 .560
Non-Athletes 7 .13 9.20
Athletes 5 .85 ‐14.0
GT3X+™Steps vs FuelBand™ Steps
1:1 Ratio with standard deviation of .02
ParticipantStudy
Physics Experiments
GT3X+™ Counts vsFuelPoints™
Physics Experiments: 1008 FuelPoints™: 1Count
ParticipantStudy
Physics Experiments
15 Min FB Data vs Counts
Red = FuelPoints Black= Counts
1/22/13
15
Review: Current Focus Areas
GT3X+ data analysis Converting from acceleration to activity counts Analyzing 1 sec counts to determine energy
expenditure and compare to guidelines GT3X+ versus FuelBand
Controlled physics experiments for comparing output parameters
Preliminary results of pilot study on humans Correlation of GT3X+ and FuelBand output Correlation of FuelBand use and activity level
Next Steps: GT3X+ vsFuelBand
Controlled physics experiments for comparing output parameters
Next Steps: Improve functional form of
FB_FuelPoints= ƒ(Counts(x,y,z),Steps,Height)
FB_Calories= ƒ(Counts(x,y,z),Steps,Height,Weight)
Correlation of mechanical motion to human motion Spring/Wheel/Pendulum Walking/Running/etc
Deconvolute causes of GT3X+™ to FuelBand™ difference Waist motion versus wrist motion Device functionality (e.g., axes used)
Next Steps: Human Studies
Correlation of GT3X+™ and FuelBand™ output Correlation of FuelBand™ use and activity level
Next Steps: Human Study II (Accel& FB) Larger and more diverse college cohort Dependence of activity levels on multiple factors:
Athlete vs non-athlete Age, gender, academic major Correlation of FuelBand™use and activity level
Next Steps: Human Studies
Next Steps: Human Study III (FB only) Physical activity in the workplace (Hospital staff?) Dependence of activity levels on job description Correlation of job activity levels with physical health
1/22/13
16
Acknowledgements We would like to thank the following for their generous support and help: NSF and WiVaM The University of Portland (UP) Public Health and Behavior (PHAB) Lab:
Dr. Jacquie Van Hoomissen (Biology) Andrew Lafrenz (Biology) Dr. Deana Julka (Social and Behavioral Science) Dr. Andrew Downs (Social and Behavioral Sciences)
UP Department of Biology for providing the GT3X+TM accelerometers and Nike FuelBandsTM
Professors for recruiting student participants from their summer classes: Dr. Andrew Downs (Social and Behavioral Sciences) Dr. Andrew Guest (Social and Behavioral Sciences) Andrew Lafrenz (Biology)
UP Department of Physics and School of Engineering for providing experimental equipment and assistance: Allison Lawrence (Physics) Dr. Tim Doughty (UP School of Engineering)