ERAD 2012 - THE SEVENTH EUROPEAN CONFERENCE ON RADAR IN METEOROLOGY AND HYDROLOGY 1 Comparison of rainfall microphysics estimates from a dual-polarization X-band radar with a 2D video disdrometer, a Parsivel disdrometer and a K-band Micro Rain Radar Anagnostou, Marios N. 1,4 , John Kalogiros 1 , Joël Van Baelen 2 , Emmanouil N. Anagnostou 3 , Frank S. Marzano 4,5 , Mario Montopoli 5,6 , and Anastasios Papadopoulos 7 1 Institute of Environmental Research and Sustainable Development, National Observatory of Athens, Athens, Greece, [email protected]2 Laboratoire de Météorologie Physique, Observatoire de Physique du Globe de Clermont- Ferrand, France, [email protected]3 Department of Civil and Environmental Engineering, University of Connecticut, Storrs, CT, USA, [email protected]4 Department of Information Engineering, Sapienza University of Rome, Rome, Italy, [email protected]5 CETEMPS, Centre of Excellence, University of L’Aquila, L’Aquila, Italy, [email protected]6 Dept. Of Geography, downing place Cambridge, UK, [email protected]7 Department of Inland Waters, Hellenic Center for Marine Research (HCMR), Greece, [email protected](Dated: 03 June 2012) Marios N. Anagnostou 1. Introduction The inherent spatial and temporal variability of precipitation makes rainfall one of the most difficult geophysical variables to measure anywhere, and yet it is one of the most important in advancing hydrologic and weather forecast applications. In particular, improving local flood and flash flood forecasting requires accurate quantitative rainfall measurements at small temporal (minutes) and spatial (hundred of meters to few kilometers) scales. Arguably, weather radar's capability to monitor precipitation at high spatial and temporal scales has stimulated great interest and support within the hydro-meteorological community. Over the last decade, the increase of frequency and intensity of flash flood events has become a significant worldwide hazard responsible for extensive damages to private and public properties and even loss of life. Flash flood warning systems require accurate precipitation estimates with high space and time resolution observations over a large coverage area. On this aspect, dual-polarization X-band radar observations coupled with a hydrological model have proven an excellent tool for efficient flood forecasting. Many parameterizations based on X-band polarimetric algorithms have been presented in the literature in order to estimate the parameters of rain drop side distribution (DSD) and rainfall rate. In this study, coincident data from an X-band dual-polarization radar (XPOL) and a 2D video disdrometer, a Parsivel disdrometer and near-vertical pointing micro rain radar (MRR) at a distance of 35 km from the XPOL were acquired in Athens area during the December of 2010 to March 2011. The estimates of rain DSD parameters and rainfall rate derived from XPOL PPI measurements using classical polarimetric algorithms as well as a new approach with minimum parameterization error were compared with the corresponding estimates from the disdrometers on the ground and with the MRR estimates within the two radars common volume. The MRR could provide also profiles of rainfall parameters up to 3 km altitude including the structure of the melting (bright band) layer and, thus, provide insights on the DSD vertical profile connecting ground results to the radar observations. Hence, XPOL results from RHI scans were also compared with MRR profiles even though the XPOL vertical resolution is reduced at 35 km range. The results show that the performance of the new algorithm offers a considerable improvement over the past algorithms with smaller bias and random error. The vertical variability of rain parameters was found to be small for measurements well below the melting layer. 2. HYDREX Field Experiment HYDREX is an experimental set up in the coastal area southeast of Athens targeting measurements of coastal rainfall and urban processes from multiple sensors and at various spatial-temporal scales. The experimental data will facilitate studies for developing improved techniques for retrieving rainfall rate and drop size distribution parameters from X-band dual- polarization observations and investigating the connection of rainfall scaling, microphysical variability and vertical structure as a mean for better understanding of satellite retrievals in hydrology. The experimental set up in the Athens urban area (Fig. 1) includes the National Observatory of Athens X-band dual-polarization Doppler mobile weather radar (XPOL), in situ station consisting of rain gauges and disdrometers, and a vertically pointing radar (named MRR). Figure 1 shows the radar ranges with the GV1 includes three rain gauges, a Micro Rain Radar (K-band profiler) and a 2D video disdrometer. 2.1 Description of the instruments 1) The XPOL system (Fig. 1), owned by the National Observatory of Athens (NOA), is an X-band (3.2 cm) dual- polarization radar unit mounted on a truck. The basic radar parameters measured by XPOL are the horizontal (Z H ) and vertical (Z V ) polarization reflectivity, differential reflectivity (Z DR ) defined as the ratio of H to V polarization, differential propagation phase shift (Φ DP ), Doppler velocities, and spectral width. An advantageous characteristic is its simultaneous Horizontal and Vertical polarization transmission, which allows antenna scanning under polarization diversity set at higher rates (e.g., 7-12 deg/sec), thus providing frequent updates of the rain and wind regime without compromising the quality of polarimetric measurements. The system’s receiver gain is systematically evaluated using internal calibration tests through a microwave signal generator. External calibration tests are usually performed comparing against DSD
Transcript
ERAD 2012 - THE SEVENTH EUROPEAN CONFERENCE ON RADAR IN METEOROLOGY AND HYDROLOGY
1
Comparison of rainfall microphysics estimates from a dual-polarization X-band radar with a 2D video disdrometer, a Parsivel disdrometer and a K-band Micro Rain Radar
Anagnostou, Marios N.1,4, John Kalogiros1, Joël Van Baelen2, Emmanouil N. Anagnostou3, Frank S. Marzano4,5, Mario Montopoli5,6, and Anastasios Papadopoulos7
1 Institute of Environmental Research and Sustainable Development, National Observatory of Athens, Athens, Greece, [email protected]
2 Laboratoire de Météorologie Physique, Observatoire de Physique du Globe de Clermont-Ferrand, France, [email protected]
3 Department of Civil and Environmental Engineering, University of Connecticut, Storrs, CT, USA, [email protected]
4 Department of Information Engineering, Sapienza University of Rome, Rome, Italy, [email protected]
5 CETEMPS, Centre of Excellence, University of L’Aquila, L’Aquila, Italy, [email protected]
6 Dept. Of Geography, downing place Cambridge, UK, [email protected] 7 Department of Inland Waters, Hellenic Center for Marine Research (HCMR), Greece,
1. Introduction The inherent spatial and temporal variability of precipitation makes rainfall one of the most difficult geophysical variables
to measure anywhere, and yet it is one of the most important in advancing hydrologic and weather forecast applications. In particular, improving local flood and flash flood forecasting requires accurate quantitative rainfall measurements at small temporal (minutes) and spatial (hundred of meters to few kilometers) scales. Arguably, weather radar's capability to monitor precipitation at high spatial and temporal scales has stimulated great interest and support within the hydro-meteorological community. Over the last decade, the increase of frequency and intensity of flash flood events has become a significant worldwide hazard responsible for extensive damages to private and public properties and even loss of life. Flash flood warning systems require accurate precipitation estimates with high space and time resolution observations over a large coverage area. On this aspect, dual-polarization X-band radar observations coupled with a hydrological model have proven an excellent tool for efficient flood forecasting. Many parameterizations based on X-band polarimetric algorithms have been presented in the literature in order to estimate the parameters of rain drop side distribution (DSD) and rainfall rate. In this study, coincident data from an X-band dual-polarization radar (XPOL) and a 2D video disdrometer, a Parsivel disdrometer and near-vertical pointing micro rain radar (MRR) at a distance of 35 km from the XPOL were acquired in Athens area during the December of 2010 to March 2011. The estimates of rain DSD parameters and rainfall rate derived from XPOL PPI measurements using classical polarimetric algorithms as well as a new approach with minimum parameterization error were compared with the corresponding estimates from the disdrometers on the ground and with the MRR estimates within the two radars common volume. The MRR could provide also profiles of rainfall parameters up to 3 km altitude including the structure of the melting (bright band) layer and, thus, provide insights on the DSD vertical profile connecting ground results to the radar observations. Hence, XPOL results from RHI scans were also compared with MRR profiles even though the XPOL vertical resolution is reduced at 35 km range. The results show that the performance of the new algorithm offers a considerable improvement over the past algorithms with smaller bias and random error. The vertical variability of rain parameters was found to be small for measurements well below the melting layer. 2. HYDREX Field Experiment
HYDREX is an experimental set up in the coastal area southeast of Athens targeting measurements of coastal rainfall and urban processes from multiple sensors and at various spatial-temporal scales. The experimental data will facilitate studies for developing improved techniques for retrieving rainfall rate and drop size distribution parameters from X-band dual-polarization observations and investigating the connection of rainfall scaling, microphysical variability and vertical structure as a mean for better understanding of satellite retrievals in hydrology. The experimental set up in the Athens urban area (Fig. 1) includes the National Observatory of Athens X-band dual-polarization Doppler mobile weather radar (XPOL), in situ station consisting of rain gauges and disdrometers, and a vertically pointing radar (named MRR). Figure 1 shows the radar ranges with the GV1 includes three rain gauges, a Micro Rain Radar (K-band profiler) and a 2D video disdrometer. 2.1 Description of the instruments
1) The XPOL system (Fig. 1), owned by the National Observatory of Athens (NOA), is an X-band (3.2 cm) dual-polarization radar unit mounted on a truck. The basic radar parameters measured by XPOL are the horizontal (ZH) and vertical (ZV) polarization reflectivity, differential reflectivity (ZDR) defined as the ratio of H to V polarization, differential propagation phase shift (ΦDP), Doppler velocities, and spectral width. An advantageous characteristic is its simultaneous Horizontal and Vertical polarization transmission, which allows antenna scanning under polarization diversity set at higher rates (e.g., 7-12 deg/sec), thus providing frequent updates of the rain and wind regime without compromising the quality of polarimetric measurements. The system’s receiver gain is systematically evaluated using internal calibration tests through a microwave signal generator. External calibration tests are usually performed comparing against DSD
ERAD 2012 - THE SEVENTH EUROPEAN CONFERENCE ON RADAR IN METEOROLOGY AND HYDROLOGY
2
measurements from the in situ disdrometers deployed at short ranges (2-5 km), and whenever possible against other well-calibrated radar systems.
Fig. 1 Experimental area map showing the NOA’s XPOL radar site (upper right picture) and the in-situ ground validation site (GV1) of the 2D-video disdrometer with the three tipping buckets (lower right picture), the laser disdrometer and the MRR (middle right picture) in the HCMR premises. The two circles indicate the XPOL ranges
2) Micro Rain Radar (MRR) (Fig. 1) is a vertical pointing frequency modulated-continuous wave (FM-CW) Doppler microwave (K-band/"=1.25 cm) radar rain profiler (Van Baelen et al. 2008) proposed to be deployed side-to-side with the 2D-video disdrometer (cluster A) and the laser disdrometer (cluster B). The MRR is a system manufactured by METEK GmbH, Elmshorn, Germany. The radar uses the FM-CW for volume filling target technique described by Strauch (1976) to measure height-resolved drop size distributions (DSD). Normally, FM-CW radars need to use two separate antennas; however, the MRR transmits a small amount of power (50 mW) that allows one antenna to be used. 3) The Parsivel (otherwise called ASDO) is a modern laser-based optical system (Fig. 1) for the complete and reliable measurement of all kinds of precipitation. This piece of equipment detects and identifies 8 different precipitation types as drizzle, mixed drizzle/rain, rain, mixed rain/snow, snow, snow grains, freezing rain and hail. The output data - consisting of raw data, classification related to size and velocity of particles, rain accumulation and intensity, present weather reports and housekeeping data - make the instrument suitable to any kind of meteorological and hydrological application. 4) 2D-video disdrometer (otherwise called 2DVD) (Fig. 1) manufactured by the Johanneum Research Institute for Applied Systems Technology, Inffeldgrasse, Austria. Two light sources generate orthogonal light sheets that are projected through narrow slits onto two line-scan cameras. The optics are designed so that, seen through the camera lens, the slits appear evenly and brightly lit. Particles falling through the beams of light appear as dark silhouettes against this background. The light sources and cameras form the sensor unit that is exposed to the precipitation. After copying the raw image information from the outdoor unit, the software running on the indoor PC reconstructs the shapes of the hydrometeors. The software also estimates the falling velocity, horizontal velocity, oblateness, and equivalent water content for each individual hydrometeor. In addition, the software computes and aggregates information such as DSD, rain rate versus time, vertical velocity versus time, oblateness versus diameter, etc., and displays it in real-time.
2.2 Timing and scanning strategies
The in-situ instrument (gauges, disdrometers and MRR) is collecting data continuously and at high temporal (1 min) resolution. XPOL is operated whenever there is rain in the area. The scanning strategies of the radar consist of three low level elevation (0.5, 1 & 2 degrees) Polar Planar Indication (PPI), followed by one Range Height Indication (RHI) scan at ray azimuth passing over the ground validation site. The combination of PPI sector and RHI scans is estimated to take less than 3 minutes to complete.
ERAD 2012 - THE SEVENTH EUROPEAN CONFERENCE ON RADAR IN METEOROLOGY AND HYDROLOGY
3
3. Data processing 1) XPOL Radar data
At X-band frequencies attenuation of radar signal by rain can be quite significant and it can be larger than 10 dB in heavy rain. There are a number of rain attenuation correction algorithms like the ZPHI algorithm (Testud et al. 2000), which is based on ΦDP measurements, and its extension with the additions of a ΦDP - ZDR constraint (Bringi et al. 2001). In this study a new attenuation correction algorithm (Kalogiros et al. 2012b) was used which is based on the new rain microphysics parameterizations described in Kalogiros et al. (2012a) with minimum parameterization error (up to 5%). Calibration of the reflectivity measurements from the mini-radars was carried out through comparison with the radar observables estimated from the disdrometer data (not shown here). XPOL was already calibrated from a large dataset collected during the past five years in Athens, Greece. For Hydrex campaign data a low elevation angle was used for rainfall estimation in order to avoid melting layer effects and to minimize effects due to ground clutter. Rainfall estimates based on classical weather radar observations have quantitative limitations mainly due to the lack of uniqueness in the relationship of the single radar measurable (reflectivity) to the associated rainfall intensity. The polarization diversity capability of modern weather radars is expected to moderate this effect using polarimetric relations for estimation of the rainfall rate, which combine ZH, ZDR and KDP (Matrosov et al. 2002, Anagnostou et al. 2004, Park et al. 2005). In this study a new polarimetric rainfall estimation algorithm evaluates, which minimizes the approximation error using the theoretical Rayleigh scattering limit with the addition of a rational polynomial function of reflectivity-weighted droplet diameter to approximate the Mie character of scattering (Kalogiros et al. 2012a, Anagnostou et al. 2012):
RP = 0.8106FR(µ)ΝwD04.67fR(D0) (1) D0 and µ are the median volume diameter and the shape parameter of the DSD, respectively, FR is a function of µ, which is included in the Gamma approximation of the DSD, and fR is a third degree rational polynomial of D0 with constants evaluated by the simulations. 2) MRR data
The radar use an intergrated mixing diode so the backscattered radiation and the transmitted signal produce two different frequencies with a shift that depends on the distance of the target from the radar (time delay) and the fall velocities (Doppler shift) of the particles (Loffler-Mang et al. 1999). Power spectra are calculated with the help of a fast Fourier Transform (FFT), and height-resolved distributions of the particle fall velocities are derived (Klugmann et al. 1996). From these measurements rain rates, liquid water contents and drop size spectra can be derived. The Doppler spectra obtained vertically reflect the fall velocity distribution of hydrometeors and can be converted into DSD under the assumption of zero vertical wind. Because there is no need for a parameterization of DSDs it is preferred to use the DSDs directly as retrieved line by line from the Doppler spectra to derive the rain parameters and parameter-free Z-R relations as function of measuring height.
3) Disdrometer data The rain-drop size distribution (DSD) from disdrometric observations for a time period of some minutes has been found to satisfactorily follow the Gamma distribution (Ulbrich 1983):
(2)
where D is the equivalent (due to the non-spherical shape) volume diameter of raindrops with units mm and Ν0, µ and Λ are parameters of the volume density n(D) with units m-3mm-1. An equivalent to Eq. (2) is the normalized Gamma distribution proposed by Willis (1984), Illingworth and Blackman (2002) and Testud et al. (2000):
n(D) = Nw f (µ)
DD0
!
"##
$
%&&
µ
exp -(µ +3.67) DD0
'
()
*
+, , (3)
where
f (µ) = 63.674
(3.67+µ)µ+4
Γ (µ +4) (4)
and the intercept parameter (Nw) now has units which do not depend on the shape parameter µ in contrast to Ν0. The median volume diameter (D0) is defined by:
D3n(D)dD0
D0∫ =12E[D3] , (5)
where E stands for the expectation value, which in practice is estimated as the DSD-weighted integral over the whole range of diameter values. Assuming a Gaussian model with zero mean the standard deviation of canting angle, the distribution of the latter is typically in the range 5°–20° (Bringi and Chandrasekar, 2001). More precisely and especially for wide distributions with large standard deviations, the orientation angles follow a Fisher distribution of 7.5 deg. because they correspond to the orientation of the symmetry axis which is represented by a three dimensional vector. Figure 2 shows a normalized frequency plot of the above mentioned coincident in time calculated DSD parameters observed from the 2D-video and Parsivel disdrometer. We notice that the Parsivel observations measure small number of larger drops (e.g. drops > 1.3 mm). Using the above parameterizations of DSD, axis ratio and canting angle distribution, it is possible to simulate radar
n(D) = N0Dµ exp −ΛD( ),
ERAD 2012 - THE SEVENTH EUROPEAN CONFERENCE ON RADAR IN METEOROLOGY AND HYDROLOGY
4
observables (ZH, ZDR and KDP) in a radar volume using the T-matrix method for numerical simulations of the scattering of electromagnetic waves by spheroidal water raindrops. 4. Results Dual-polarization radar observations used for this study were collected by the NOA’s XPOL radar, one profile radar (MRR) and two disdrometers (2DVD and Parsivel) taken part during the autumn-winter of 2011 and 2012, two (16/01 and 28/01) of which are presented in this paper. Most of the rain events collected are winter storms with one or two rain events show obvious bright-band. Two selected rain events (Fig. 3) of time-height profiles of MRR horizontal reflectivity ZK (dBZ) and rainfall rate RK (mm h-1). The right-hand side panels (a2 and b2) are the 28/01, rain event with core reflectivities at 2-2.5 km height about 40 (dBZ). The reflectivity and rain accumulation time-height profile plots are shown in the left-hand side panel (a1 and b1) is taken during the 16/01, rain event.
Fig. 2 Normalized frequency plots of DSD parameters (D0, log10Nw and µ) of the 2DVD and ASDO
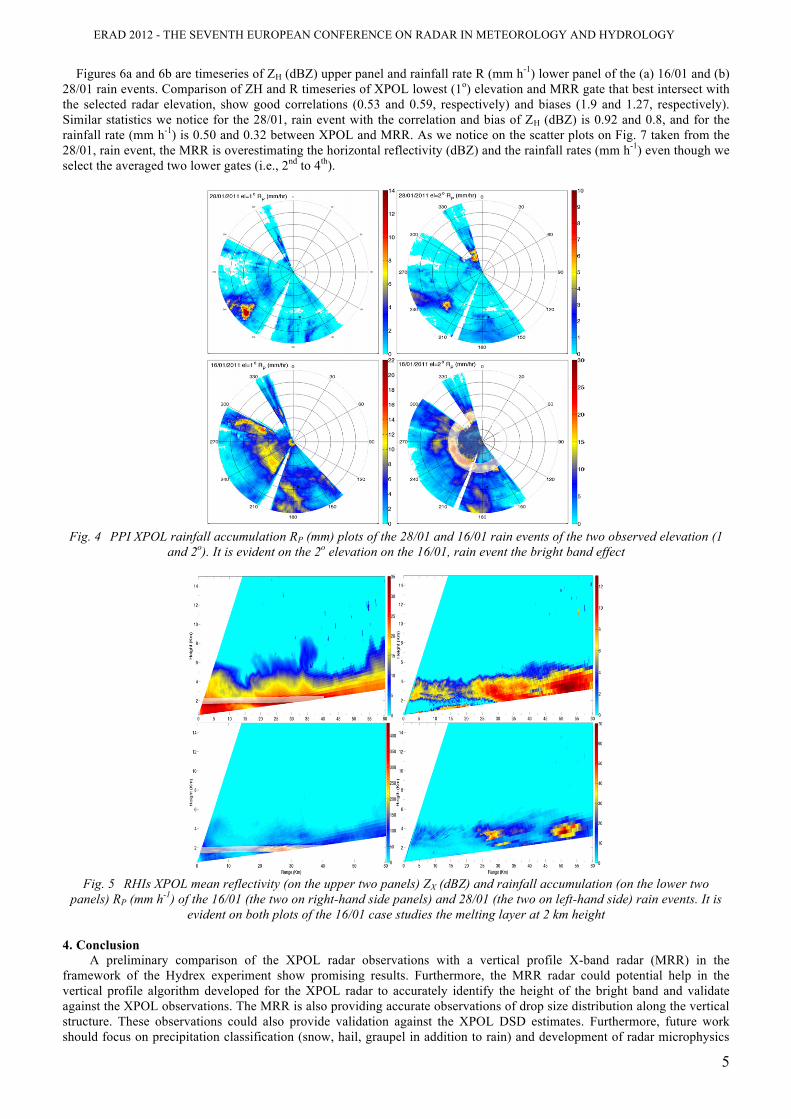
In general, the use of high elevation angles of the radar antennas are needed in cases to avoid beam blockage by terrain
features melting layer effects (bright band) were observed at these elevation angles during widespread (stratiform) rain. Figure 4 presents rainfall accumulation PPI maps of two elevation angles (1 and 2o) of the two selected cases (28/10 upper two panels and 16/01 lower two panels) from XPOL. The 28/01 is a more scatter convective rain event with the core of the storm indicated clearly in the northwest with respect to the radar. On the other hand, the 16/01 is a winter front with a suspicious of bright band at 1o elevation. The bright band is seen more clearly in the 2o elevation as a circular zone of high rainfall accumulation values in the range from 20 to 25 km corresponding to altitudes of about 2000 m, respectively. The white line shown is the base of the melting layer, which was detected using #hv as the rain-to-mixed phase classification criterion (Kalogiros et al. 2012c). The RHI (Fig. 5) plots of mean horizontal reflectivities ZX (dBZ) on the two upper panels and XPOL polarimetric rainfall accumulation RP (mm) plots on the two lower panels, evidence the presence of the bright band shown on both left-hand side panels and indicated with the white line.
Fig. 3 Two selected (the 28/01 on the left hand side panel and the 16/01 on the right hand side panel) MRR time-height
profile plots of the (a1, a2) horizontal reflectivity ZX (dBZ) and the (b1, b2) rainfall rate RX (mm h-1)
!"
!#
$"
$#
ERAD 2012 - THE SEVENTH EUROPEAN CONFERENCE ON RADAR IN METEOROLOGY AND HYDROLOGY
5
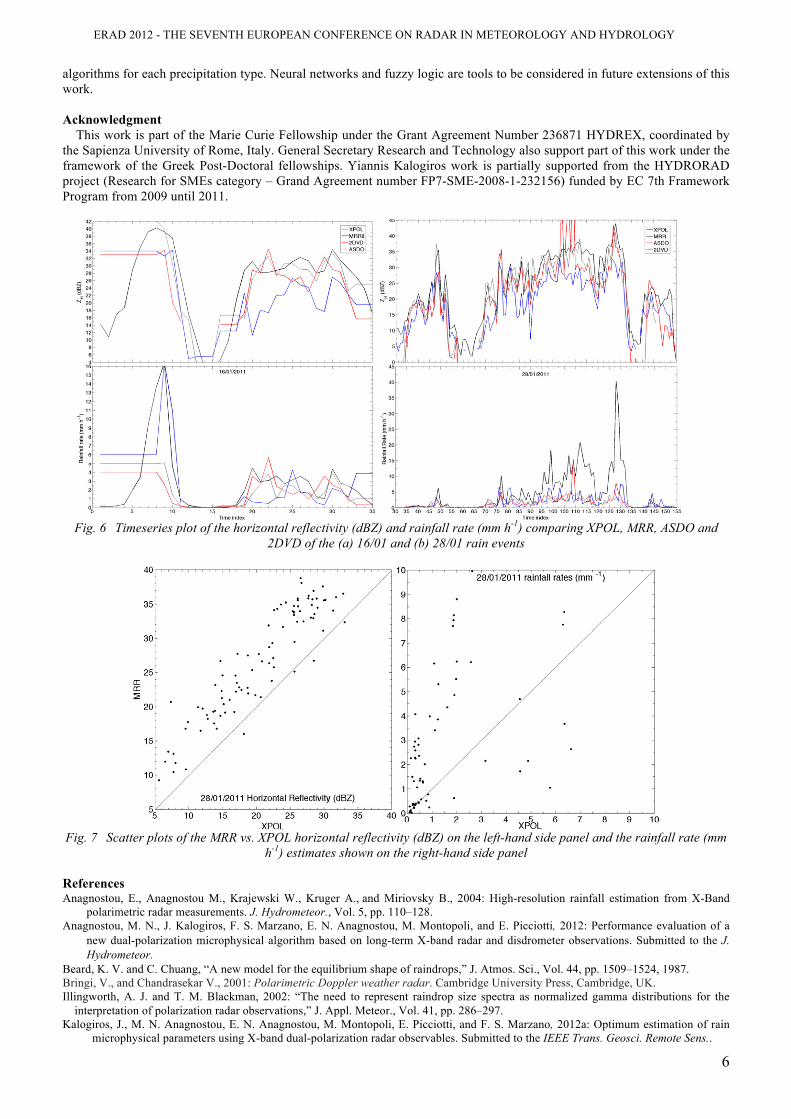
Figures 6a and 6b are timeseries of ZH (dBZ) upper panel and rainfall rate R (mm h-1) lower panel of the (a) 16/01 and (b) 28/01 rain events. Comparison of ZH and R timeseries of XPOL lowest (1o) elevation and MRR gate that best intersect with the selected radar elevation, show good correlations (0.53 and 0.59, respectively) and biases (1.9 and 1.27, respectively). Similar statistics we notice for the 28/01, rain event with the correlation and bias of ZH (dBZ) is 0.92 and 0.8, and for the rainfall rate (mm h-1) is 0.50 and 0.32 between XPOL and MRR. As we notice on the scatter plots on Fig. 7 taken from the 28/01, rain event, the MRR is overestimating the horizontal reflectivity (dBZ) and the rainfall rates (mm h-1) even though we select the averaged two lower gates (i.e., 2nd to 4th).
Fig. 4 PPI XPOL rainfall accumulation RP (mm) plots of the 28/01 and 16/01 rain events of the two observed elevation (1
and 2o). It is evident on the 2o elevation on the 16/01, rain event the bright band effect
Fig. 5 RHIs XPOL mean reflectivity (on the upper two panels) ZX (dBZ) and rainfall accumulation (on the lower two
panels) RP (mm h-1) of the 16/01 (the two on right-hand side panels) and 28/01 (the two on left-hand side) rain events. It is evident on both plots of the 16/01 case studies the melting layer at 2 km height
4. Conclusion
A preliminary comparison of the XPOL radar observations with a vertical profile X-band radar (MRR) in the framework of the Hydrex experiment show promising results. Furthermore, the MRR radar could potential help in the vertical profile algorithm developed for the XPOL radar to accurately identify the height of the bright band and validate against the XPOL observations. The MRR is also providing accurate observations of drop size distribution along the vertical structure. These observations could also provide validation against the XPOL DSD estimates. Furthermore, future work should focus on precipitation classification (snow, hail, graupel in addition to rain) and development of radar microphysics
ERAD 2012 - THE SEVENTH EUROPEAN CONFERENCE ON RADAR IN METEOROLOGY AND HYDROLOGY
6
algorithms for each precipitation type. Neural networks and fuzzy logic are tools to be considered in future extensions of this work. Acknowledgment
This work is part of the Marie Curie Fellowship under the Grant Agreement Number 236871 HYDREX, coordinated by the Sapienza University of Rome, Italy. General Secretary Research and Technology also support part of this work under the framework of the Greek Post-Doctoral fellowships. Yiannis Kalogiros work is partially supported from the HYDRORAD project (Research for SMEs category – Grand Agreement number FP7-SME-2008-1-232156) funded by EC 7th Framework Program from 2009 until 2011.
Fig. 6 Timeseries plot of the horizontal reflectivity (dBZ) and rainfall rate (mm h-1) comparing XPOL, MRR, ASDO and
2DVD of the (a) 16/01 and (b) 28/01 rain events
Fig. 7 Scatter plots of the MRR vs. XPOL horizontal reflectivity (dBZ) on the left-hand side panel and the rainfall rate (mm
h-1) estimates shown on the right-hand side panel References Anagnostou, E., Anagnostou M., Krajewski W., Kruger A., and Miriovsky B., 2004: High-resolution rainfall estimation from X-Band
polarimetric radar measurements. J. Hydrometeor., Vol. 5, pp. 110–128. Anagnostou, M. N., J. Kalogiros, F. S. Marzano, E. N. Anagnostou, M. Montopoli, and E. Picciotti, 2012: Performance evaluation of a
new dual-polarization microphysical algorithm based on long-term X-band radar and disdrometer observations. Submitted to the J. Hydrometeor.
Beard, K. V. and C. Chuang, “A new model for the equilibrium shape of raindrops,” J. Atmos. Sci., Vol. 44, pp. 1509–1524, 1987. Bringi, V., and Chandrasekar V., 2001: Polarimetric Doppler weather radar. Cambridge University Press, Cambridge, UK. Illingworth, A. J. and T. M. Blackman, 2002: “The need to represent raindrop size spectra as normalized gamma distributions for the
interpretation of polarization radar observations,” J. Appl. Meteor., Vol. 41, pp. 286–297. Kalogiros, J., M. N. Anagnostou, E. N. Anagnostou, M. Montopoli, E. Picciotti, and F. S. Marzano, 2012a: Optimum estimation of rain
microphysical parameters using X-band dual-polarization radar observables. Submitted to the IEEE Trans. Geosci. Remote Sens..
ERAD 2012 - THE SEVENTH EUROPEAN CONFERENCE ON RADAR IN METEOROLOGY AND HYDROLOGY
7
Kalogiros, J., M. N. Anagnostou, E. N. Anagnostou, M. Montopoli, E. Picciotti, and F. S. Marzano, 2012b: Evaluation of a new polarimetric algorithm for rain path attenuation correction of X-band radar observations against disdrometer data. Submitted to the IEEE Geosci. Remote Sens. Lett..
Kalogiros, J., M. N. Anagnostou, E. N. Anagnostou, M. Montopoli, E. Picciotti, and F. S. Marzano, 2012c: Correction of polarimetric radar reflectivity measurements and rainfall estimates for apparent vertical profile in stratiform rain. Submitted to the J. Appl. Meteorol. Clim..
Klugmann, D., K. Heinsohn and H.-J. Kirtzel, 1996: “A Low Cost 24 GHz FM-CW-Doppler Radar Rain Profiler.” Contributions to Atmos. Physics, Vol. 69, pp. 247-253.
Löffler-Mang, M. and M. Kunz, 1999: “On the Performance of a Low-Cost K-Band Doppler Radar for Quantitative Rain Measurements.” J. Atmos. Ocean. Techn., Vol. 16, pp. 379-387.
Matrosov, S., Clark K., Martner B., Tokay A., 2002: X-band polarimetric radar measurements of rainfall. J. Appl. Meteor., Vol. 41, pp. 941-952.
Park, S., Maki M., Iwanami K., Bringi V., and Chandrasekar V., 2005: Correction of radar reflectivity and differential reflectivity for rain attenuation at X-band, Part II: Evaluation and application. J. Atmos. Ocean. Technol., Vol. 22, pp. 1633-1655.
Testud, J., Le Bouar E., Obligis E., and Ali-Mehenni M., 2000: The rain profiling algorithm applied to polarimetric weather radar. J. Atmos. Ocean. Technol., Vol. 17, pp.332-356.
Thurai, M., M. Szakall, V. N. Bringi, K. V. Beard, S. K. Mitra and S. Borrmann, 2009: “Drop shapes and axis ratio distributions: comparison between 2-D video disdrometer and wind-tunnel measurements,” J. Atmos. Ocean. Tech., Vol. 26, pp. 1427-1432.
Ulbrich, C. W., 1983: “Natural variations in the analytical form of the drop size distribution,” J. Climate Appl. Meteor., Vol. 22, pp. 1764–1775.
Van Baelen, J. Frédéric Tridon, Yves Pointin, 2009: “Simultaneous X-band and K-band study of precipitation to derive specific Z–R relationships.” Atmospheric Research, Vol. 94, pp. 596–605.
Willis, P. T., 1984: “Functional fits to some observed drop size distribution and parameterization of rain,” J. Atmos. Sci., Vol. 41, pp. 1648– 1661.


![RAINFALL PROBABILITY ESTIMATES FOR - [email protected]](https://static.documents.pub/doc/80x56/62063e728c2f7b173005cb49/rainfall-probability-estimates-for-emailprotected.jpg)


