Page 1
Comparison of Real-Time Performance Between
ĆUK and SEPIC Converters for an MPPT Based on
the P&O Method Using Xilinx System Generator Rezki Tadrist
#1, Mountassar Maamoun
*2, Adnane Hassani
#3
#Laboratoire LSIC ENS de Kouba. B.P N°92 16308 Vieux-Kouba – Alger
[email protected] [email protected]
*Département d'Electronique, Université de Blida, Algérie
[email protected]
Abstract - Today, the electrical energy extracted at the output of
photovoltaic panels is still low despite the significant efforts
made in the development and improvement of the converters in
the photovoltaic field. In addition the maximum energy
extraction is also achieved using a Maximum Power Point
Tracking (MPPT) method that could increase the electrical
power efficiency and also significantly reduce the overall cost of
a photovoltaic system. However, this paper compares the
performances of two main and popular converters, the ĆUK
and the SEPIC which monitor the MPP of the photovoltaic (PV)
system. As a result, the advantages and disadvantages between
the two converters have been described and discussed. The
results of the simulation showed that the ĆUK and SEPIC
converters followed the MPP with a very small gap difference.
The experimental simulation system was developed using
Matlab/Xilinx System Generator (XSG) for the operation of the
proposed algorithm and the architecture structure was
developed in the XSG environmental tool for its implementation
on an FPGA device with a minimal resource. Thus, the current
research work was completed using a minimal resource and led
to a simple and inexpensive system.
Keywords: Maximum Power Point Tracking (MPPT),
Photovoltaic (PV), Perturb and Observe, ĆUK and SEPIC
converters, Xilinx System Generator.
I. INTRODUCTION
The sun is an inexhaustible source of energy, it is
naturally regenerated in a short time, for this reason, it is
called "renewable energy" or "sustainable energy". Due to the
gravity of the global energy crisis and environmental
pollution, the photovoltaic (PV) system has become a kind of
important source of renewable energy. Solar energy has
important advantages, a maximum reserve, inexhaustible,
without geographical limits, it is thus the photovoltaic
technology of our day becomes a vast subject of popular
research. On the other hand the oil reserves would have been
exhausted in 2040, the natural gas in 2060, and the coal in
2300 [1]. In Algeria, the authorities have become aware of
this challenge, renewable energy objectives will be doubled
(12-25) GW by 2030 [2], the country has about 350 MW of
photovoltaic projects under development.
A tariff system offers surrender rates of approximately
US $ 0.20 for (1-5 MW) projects and a slightly different rate
for projects over (5 MW). Currently research work has
focused on how to extract more efficient power from
photovoltaic cells. The efficiency of PV systems is still low
due to the influence of changes in insolation and temperature.
To improve the efficiency of a PV system, monitoring of the
maximum power point is essential in order to obtain
maximum energy from the PV system. Since 1968, the date
of the first publication of the control law on the MPPT
algorithm, research work has continued to appear [3].
Different types of powerful algorithms on PPM research are
cited in the literature [4] [5].
There are many MPPT algorithms such as Perturb and
Observe (P&O), Incremental Conductance (IC), fraction of
short-circuit current, fraction of open-circuit voltage, neural
networks and fuzzy logic, ext ....
In [6] the concept of power monitoring for photovoltaic
systems is highlighted and an overview of 40 old and recent
maximum power point tracking (MPPT) methods, available
in the literature, is presented and classified. The Perturb and
Observe method presents a problem in determining the
optimum operating point in rapid changes in sunlight, but is
easier and more reliable under normal conditions [7] [8] [9]
[10]. DC-DC converters act as interfaces between the load
and the photovoltaic module. They are generally used as a
means of MPPT research as needed. For example the Boost
converter is used in the case of raising the output voltage. But
in other cases the desired output voltage must be lower than
the input voltage [11]. In [12], the comparative analysis
between the SEPIC topology and the ĆUK topology is
presented. The ĆUK and SEPIC converters operate on the
principle of energy transfer using capacitors and inductors to
reduce current ripple in the circuit. In this article, the
comparison of real-time performances between two
converters, ĆUK and SEPIC for a MPPT based on the P&O
method is studied and implemented using Xilinx System
Generator.
For integration on a single chip, FPGAs offer lower
implementation costs than microcontrollers and DSPs.
FPGAs can provide equivalent or better performance than
ASICs. FPGAs also offer the advantage of being
User1
Typewritten Text
Copyright IPCO-2019 ISSN 1737-9296
User1
Typewritten Text
International Journal of Scientific Research & Engineering Technology (IJSET) Vol.7 pp. 14-20
Page 2
reprogrammed at any time while the system is running thus
providing a high degree of robustness. In addition to
robustness and reprogramming, FPGAs can also provide a
high level of flexibility [13]. Therefore, to meet the required
performance, FPGAs are desirable since their performance
can easily outperform the performance of microcontrollers
and DSPs.
II. MODELING A PANEL (PHOTOVOLTAIC
CELL)
A photovoltaic cell can be compared to the equivalent
circuit shown in Fig. 1 [14].
RpIpv
RS
Practical PV device
Ideal PV cell
Id
I
V
Fig. 1 Circuit equivalent to a single diode of a PV cell
To model the cell, the electrical quantities represented in
the circuit above are expressed in the form of an equation, the
current in the diode is expressed by:
𝐼𝐷 = 𝐼0 𝑒𝑥𝑝 𝑉𝐷
𝑉𝑇 − 1 = 𝐼0[𝑒𝑥𝑝
𝑉𝑝𝑣+𝐼𝑝𝑣∗𝑅𝑠
𝑉𝑇 − 1] (1)
𝐼𝑜 is the saturation current of the reverse polarization of the
diode.
Avec: 𝑉𝐷 = 𝑉𝑝𝑣 + 𝐼𝑝𝑣 ∗ 𝑅𝑠 (2)
And 𝑉𝑇 is the thermal tension defined by:
𝑉𝑇 =𝑘𝑇
𝑞 (3)
With 𝑘 the Boltzman constant equal to 1.3806503x10⁻²³
J/K,
𝑇 is the operating temperature of the cell in Kelvin degree,
and 𝑞 the charge of the electron. The voltage 𝑉𝑝𝑣 is given
by:
𝑉𝑝𝑣 = 𝑉𝐷 − 𝐼𝑝𝑣 ∗ 𝑅𝑠 (4)
And:
𝐼𝑝 =𝑉𝐷
𝑅𝑝=
𝑉𝑝𝑣
𝑅𝑝+
𝑅𝑠
𝑅𝑝𝐼𝑝𝑣 (5)
Finally, we obtain the expression of the current 𝐼𝑝𝑣 of the
cell:
𝐼𝑝𝑣 = 𝐼𝑠𝑐 − 𝐼𝐷 − 𝐼𝑝 = 𝐼𝑠𝑐 − 𝐼0[𝑒𝑥𝑝 𝑉𝑝𝑣+𝐼𝑝𝑣∗𝑅𝑠
𝑉𝑇 −
1] −𝑉𝑝𝑣
𝑅𝑝−
𝑅𝑠
𝑅𝑝𝐼𝑝𝑣 (6)
Photovoltaic cell can not provide enough power to power a
load or power grid. It is therefore necessary to assemble
several cells in series and in parallel in order to obtain more
power. A serial connection increases the output voltage of the
solar panel, while a parallel combination increases the current
supplied to the load. Then, it is necessary to introduce two
new parameters 𝑁𝑝 and 𝑁𝑠 respectively represent the number
of cells in parallel and in series. The expression of the current
𝐼𝑝𝑣 becomes:
𝐼𝑝𝑣 = 𝑁𝑝𝐼𝑠𝑐 −𝑁𝑝 𝐼0[𝑒𝑥𝑝 𝑉𝑝𝑣
𝑁𝑠𝑉𝑇+
𝐼𝑝𝑣∗𝑅𝑠
𝑁𝑝𝑉𝑇 − 1] −
𝑉𝑝𝑣
𝑅𝑝−
𝑅𝑠
𝑅𝑝𝐼𝑝𝑣 (7)
With:
𝐼𝑠𝑐: Short circuit current of the cell;
𝑅𝑝: The resistance characterizing the carrier
recombination losses due to defects in the material;
𝑅𝑠: Characterizes the Joule losses in the
semiconductor and the losses through the gate and
the bad ohmic contact of the cell.
The amount of solar radiation directly affects the
production of charge carriers in the solar panel, therefore
affects the current produced by the latter, its expression is
given by:
𝐼𝑜𝑠 = 𝐼𝑟𝑠 [𝑇/𝑇𝑟]3 exp 𝑞 ∗𝐸𝐺𝑂
𝛽∗𝐾
1
𝑇𝑟−
1
𝑇 (8)
And:
𝐼𝑠𝑐𝑡 = [𝐼𝑠𝑐 + 𝐾𝐼(𝑇 − 298.15)]𝐺
1000 (9)
𝑇𝑟 : is the reference temperature (𝐾 = 298.18), ( 𝐸𝐺0 = 1.12
eV) is the width of the silicon band, (𝛽 = 1.740) the ideality
factor, 𝐼𝑟𝑠 is the reverse saturation current of the cell, 𝐼𝑜𝑠 is
the saturation current of the cell.
In this comparison, we deliberately chose the monocrystalline
photovoltaic solar panel Atersa A-250M. This is one of the
modules used in the Ghardaia station in southern Algeria. It
has a high efficiency, its value is highly competitive. In
addition, these modules are covered by a 10-year guarantee
[15].
User1
Typewritten Text
Copyright IPCO-2019 ISSN 1737-9296
User1
Typewritten Text
International Journal of Scientific Research & Engineering Technology (IJSET) Vol.7 pp. 14-20
Page 3
Fig. 2 Characteristics of PV panel
Table. I below summarizes the manufacturer's data. Based
on the parameters of the table. I, the PV module is modeled
in the Matlab/Simulink environment for standard test
conditions (STC) of 25 ° C and 1000 W/m2. Fig. 2 above
shows the characteristics of the Atersa-250M panel under
standard conditions (G = 1000w / m2, T = 25 ° C).
TABLE. I ELECTRICAL AND THERMAL CHARACTERISTICS OF THE
PANEL A-250M (STC: 1Kw/m2, 25 ° C ± 2 ° C)
Nominal power 250 W
Module efficiency 15.35%
Open circuit voltage 37.62 V
Voltage at the point of maximum power
(Vmp)
30.35 V
Short circuit current 8.79 A
Current at the point of maximum power
(Imp)
8.24 A
Coefficient of temperature voltage Voc (β) -0.34%/°C
Current temperature coefficient Isc (α) -0.03%/°C
Power temperature coefficient P (λ) -0.43%/°C
III. TRACKING MAXIMUM POWER POINT (MPPT)
A. MPPT charge regulator
The technique (MPPT) is used to couple the inverters to
power grids, solar battery chargers and similar devices in
order to obtain the maximum possible power from one or
more photovoltaic devices. The photovoltaic cell has a non-
linear current/voltage characteristic as a function of the
insolation and the temperature of the cell. The role of the
MPPT is to ensure a coherent adaptation between the solar
panel and the converter by generating an appropriate
command to deliver the maximum power to the load
whatever the climatic variations of the insolation and the
temperature. MPPT devices are generally integrated into
power conversion systems. In addition they ensure the
regulation of the voltage and the current provided whatever
the variation of the load or the network to feed [16] [17].
B. MPPT techniques
Maximum Power Point (MPP) tracking is the automatic
control algorithm to adjust the power interfaces and achieve
the greatest possible power extraction, regardless of the
changes in insolation and temperature or the effects the
shading. This is therefore to ensure the operation of the
system at the PPM point under varying atmospheric
conditions. The MPPT then became an essential element for
evaluating the performance of PV power system design [18].
There are different techniques used to track the maximum
power point. Among the most widely used techniques are:
disturbances and observations, incremental conductance, the
fraction of the circuit current, the fraction of the open circuit
voltage, the neural networks and the fuzzy logic. The choice
of the algorithm depends on the complexity and execution
time of the algorithm for monitoring the PPM, the cost of the
algorithm and its implementation [19]. In this article the P &
O technique (perturbe and observer) is used and implemented
on FPGA target.
C. Description of the adopted algorithm
The algorithm called "P & O" is an MPPT command whose
operation is based on the disturbance of the voltage 𝑉𝑝𝑣 , by
increasing or decreasing it by a small amplitude around its
initial value [20][21]. This disturbance has the effect of
acting directly on the duty cycle of the signal controlling the
DC-DC converter. The disturbance is followed by the
observation of its impact on the power output of the PV
panel, with a view to a possible correction of this duty cycle.
The figure. 3 shows the flowchart describing the algorithm
providing this command called "P & O". The "P & O"
method is widely used today because of its simplicity of
implementation. However, this technique has some problems
related to oscillations around the PPM it generates in steady
state, because the search procedure of the PPM must be
repeated periodically, forcing the system to oscillate
permanently around the PPM. These oscillations can be
minimized by reducing the value of the disturbance variable.
However, a low increment value slowed down the search for
the PPM, so you have to find a compromise between
accuracy and speed. Which makes this order difficult to
optimize.
Début
Mesure de Vo(k),Io(k)
Po(k)=Vo(k)xIo(k)Δpo(k)=Po(k)-Po(k-1)
ΔPo>0
D(k)-D(k-1)>0 D(k)-D(k-1)>0
Non Oui
Diminuer le rapport cyclique
Augmenter le rapport cyclique
Diminuer le rapport cyclique
AugemnterA le rapport cyclique
Oui Non Non Oui
Po(k-1)=Po(k)D(k-1)=D(k)
Fig. 3 Flowchart of P&O Algorithm for MPPT control
0 5 10 15 20 25 30 35 400
50
100
150
200
250
Output voltage PV panel (V)
Outp
ut
pow
er
PV
panel (W
)
0 5 10 15 20 25 30 35 400
2
4
6
8
10
Ipv (A)
Characteristics of PV panel Atersa A-250M
User1
Typewritten Text
Copyright IPCO-2019 ISSN 1737-9296
User1
Typewritten Text
International Journal of Scientific Research & Engineering Technology (IJSET) Vol.7 pp. 14-20
Page 4
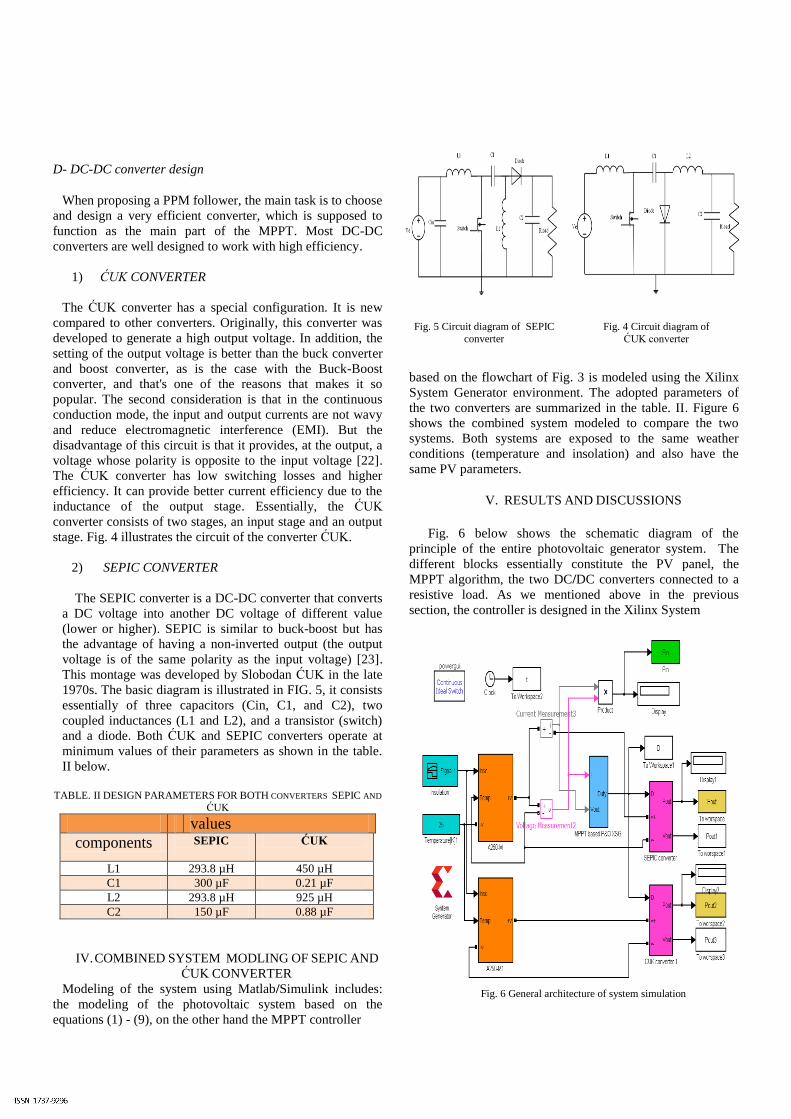
D- DC-DC converter design
When proposing a PPM follower, the main task is to choose
and design a very efficient converter, which is supposed to
function as the main part of the MPPT. Most DC-DC
converters are well designed to work with high efficiency.
1) ĆUK CONVERTER
The ĆUK converter has a special configuration. It is new
compared to other converters. Originally, this converter was
developed to generate a high output voltage. In addition, the
setting of the output voltage is better than the buck converter
and boost converter, as is the case with the Buck-Boost
converter, and that's one of the reasons that makes it so
popular. The second consideration is that in the continuous
conduction mode, the input and output currents are not wavy
and reduce electromagnetic interference (EMI). But the
disadvantage of this circuit is that it provides, at the output, a
voltage whose polarity is opposite to the input voltage [22].
The ĆUK converter has low switching losses and higher
efficiency. It can provide better current efficiency due to the
inductance of the output stage. Essentially, the ĆUK
converter consists of two stages, an input stage and an output
stage. Fig. 4 illustrates the circuit of the converter ĆUK.
2) SEPIC CONVERTER
The SEPIC converter is a DC-DC converter that converts
a DC voltage into another DC voltage of different value
(lower or higher). SEPIC is similar to buck-boost but has
the advantage of having a non-inverted output (the output
voltage is of the same polarity as the input voltage) [23].
This montage was developed by Slobodan ĆUK in the late
1970s. The basic diagram is illustrated in FIG. 5, it consists
essentially of three capacitors (Cin, C1, and C2), two
coupled inductances (L1 and L2), and a transistor (switch)
and a diode. Both ĆUK and SEPIC converters operate at
minimum values of their parameters as shown in the table.
II below.
TABLE. II DESIGN PARAMETERS FOR BOTH CONVERTERS SEPIC AND
ĆUK
values
components SEPIC
ĆUK
L1 293.8 µH 450 µH
C1 300 µF 0.21 µF
L2 293.8 µH 925 µH
C2 150 µF 0.88 µF
IV. COMBINED SYSTEM MODLING OF SEPIC AND
ĆUK CONVERTER
Modeling of the system using Matlab/Simulink includes:
the modeling of the photovoltaic system based on the
equations (1) - (9), on the other hand the MPPT controller
Fig. 5 Circuit diagram of SEPIC
converter
Fig. 4 Circuit diagram of
ĆUK converter
based on the flowchart of Fig. 3 is modeled using the Xilinx
System Generator environment. The adopted parameters of
the two converters are summarized in the table. II. Figure 6
shows the combined system modeled to compare the two
systems. Both systems are exposed to the same weather
conditions (temperature and insolation) and also have the
same PV parameters.
V. RESULTS AND DISCUSSIONS
Fig. 6 below shows the schematic diagram of the
principle of the entire photovoltaic generator system. The
different blocks essentially constitute the PV panel, the
MPPT algorithm, the two DC/DC converters connected to a
resistive load. As we mentioned above in the previous
section, the controller is designed in the Xilinx System
Fig. 6 General architecture of system simulation
User1
Typewritten Text
Copyright IPCO-2019 ISSN 1737-9296
User1
Typewritten Text
International Journal of Scientific Research & Engineering Technology (IJSET) Vol.7 pp. 14-20
Page 5
0.019 0.0195 0.02 0.0205 0.021 0.0215
60
80
100
120
140
160
180
200
220
240
260
Temps (s)
Pu
issan
ce (
w)
Puissace à la sortie du panneau
Puissance de sortie avec convertisseur SPIC
Puissance de sortie avec convertisseur CUK
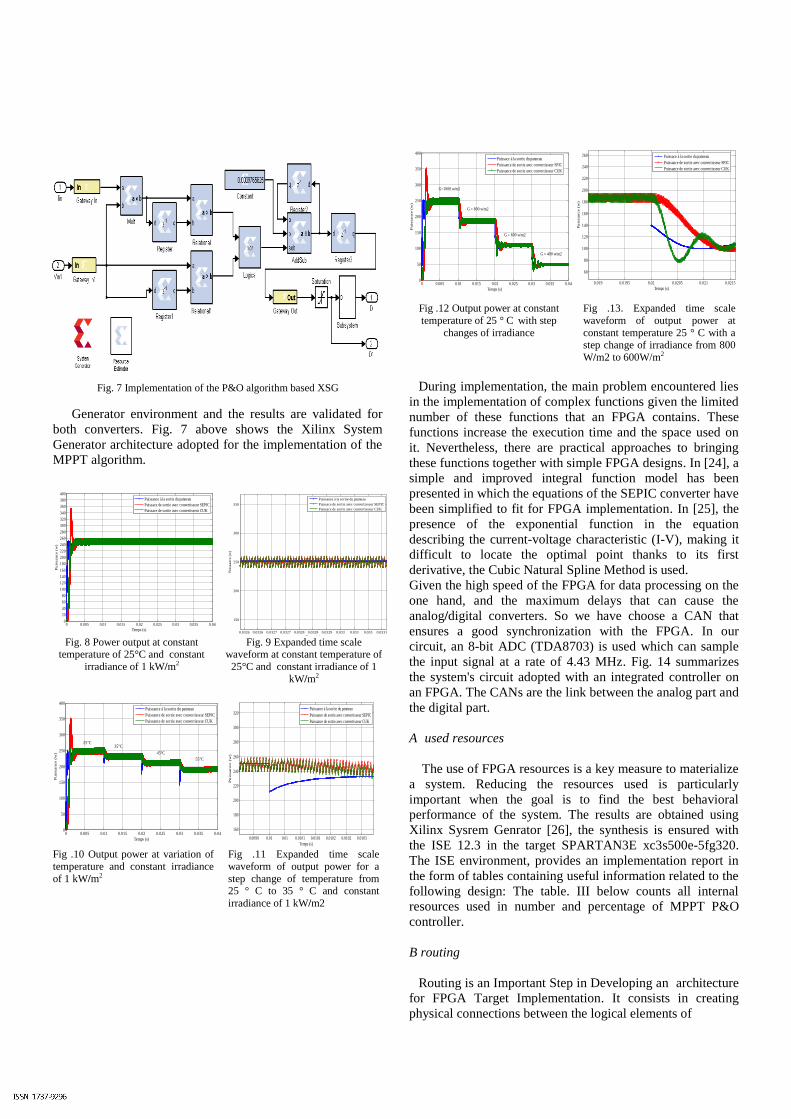
Fig. 7 Implementation of the P&O algorithm based XSG
Generator environment and the results are validated for
both converters. Fig. 7 above shows the Xilinx System
Generator architecture adopted for the implementation of the
MPPT algorithm.
Fig. 8 Power output at constant
temperature of 25°C and constant
irradiance of 1 kW/m2
Fig. 9 Expanded time scale waveform at constant temperature of
25°C and constant irradiance of 1
kW/m2
Fig .10 Output power at variation of
temperature and constant irradiance
of 1 kW/m2
Fig .11 Expanded time scale
waveform of output power for a
step change of temperature from 25 ° C to 35 ° C and constant
irradiance of 1 kW/m2
Fig .12 Output power at constant
temperature of 25 ° C with step
changes of irradiance
Fig .13. Expanded time scale
waveform of output power at
constant temperature 25 ° C with a
step change of irradiance from 800
W/m2 to 600W/m2
During implementation, the main problem encountered lies
in the implementation of complex functions given the limited
number of these functions that an FPGA contains. These
functions increase the execution time and the space used on
it. Nevertheless, there are practical approaches to bringing
these functions together with simple FPGA designs. In [24], a
simple and improved integral function model has been
presented in which the equations of the SEPIC converter have
been simplified to fit for FPGA implementation. In [25], the
presence of the exponential function in the equation
describing the current-voltage characteristic (I-V), making it
difficult to locate the optimal point thanks to its first
derivative, the Cubic Natural Spline Method is used.
Given the high speed of the FPGA for data processing on the
one hand, and the maximum delays that can cause the
analog/digital converters. So we have choose a CAN that
ensures a good synchronization with the FPGA. In our
circuit, an 8-bit ADC (TDA8703) is used which can sample
the input signal at a rate of 4.43 MHz. Fig. 14 summarizes
the system's circuit adopted with an integrated controller on
an FPGA. The CANs are the link between the analog part and
the digital part.
A used resources
The use of FPGA resources is a key measure to materialize
a system. Reducing the resources used is particularly
important when the goal is to find the best behavioral
performance of the system. The results are obtained using
Xilinx Sysrem Genrator [26], the synthesis is ensured with
the ISE 12.3 in the target SPARTAN3E xc3s500e-5fg320.
The ISE environment, provides an implementation report in
the form of tables containing useful information related to the
following design: The table. III below counts all internal
resources used in number and percentage of MPPT P&O
controller.
B routing
Routing is an Important Step in Developing an architecture
for FPGA Target Implementation. It consists in creating
physical connections between the logical elements of
0 0.005 0.01 0.015 0.02 0.025 0.03 0.035 0.040
20
40
60
80
100
120
140
160
180
200
220
240
260
280
300
320
340
360
380
400
Temps (s)
Pu
issan
ce (
w)
Puissance à la sortie du panneau
Puissace de sortie avec convertisseur SEPIC
Puissace de sortie avec convertisseur CUK
0.0326 0.0326 0.0327 0.0327 0.0328 0.0328 0.0329 0.033 0.033 0.033 0.0331
150
200
250
300
350
Temps (s)
Pu
issa
nce (
w)
Puissance à la sortie du panneau
Puissace de sortie avec convertisseur SEPIC
Puissace de sortie avec convertisseur CUK
0 0.005 0.01 0.015 0.02 0.025 0.03 0.035 0.040
50
100
150
200
250
300
350
400
Temps (s)
Pu
issan
ce (
w)
Puissance à la sortie du panneau
Puissance de sortie avec convertisseur SEPIC
Puissance de sortie avec convertisseur CUK
35°C
45°C
55°C
25°C
0.0099 0.01 0.01 0.0101 0.0101 0.0102 0.0102 0.0103
160
180
200
220
240
260
280
300
320
Temps (s)
Pu
issan
ce (
w)
Puissance à la sortie du panneau
Puissance de sortie avec convertisseur SEPIC
Puissance de sortie avec convertisseur CUK
0 0.005 0.01 0.015 0.02 0.025 0.03 0.035 0.040
50
100
150
200
250
300
350
400
Temps (s)
Pu
issan
ce (
w)
Puissace à la sortie du panneau
Puissance de sortie avec convertisseur SPIC
Puissance de sortie avec convertisseur CUK
G=1000 w/m2
G = 400 w/m2
G = 600 w/m2
G = 800 w/m2
User1
Typewritten Text
Copyright IPCO-2019 ISSN 1737-9296
User1
Typewritten Text
International Journal of Scientific Research & Engineering Technology (IJSET) Vol.7 pp. 14-20
Page 6
Fig.14 Diagram of the principle of the adopted PV system with integrated controller on FPGA
the FPGA by respecting the parameters of the architecture
[27]. Each signal must therefore be connected to the FPGA
routing resources. After these simulation results, the design
was synthesized, a system-wide bitflow device was
generated. It has been verified successfully by downloading it
on the FPGA target mentioned above. The overall and
internal diagram of the architecture of the proposed P&O
algorithm is shown in FIG. 15 below. Fig. 16 shows the
routing of the FPGA circuit for the "MPPT P&O" controller
program.
Table. III Resources used for the P&O algorithm
Logic Utilization Used Available Utilization
Number of Slice Flip
Flops 52 9,312 1%
Number of 4 input LUTs 53 9,312 1%
Number of occupied
Slices 44 4,656 1%
Number of Slices
containing only related
logic
44 44 100%
Number of Slices
containing unrelated
logic
0 44 0%
Total Number of 4 input
LUTs 53 9,312 1%
Number of bonded IOBs 41 232 17%
IOB Flip Flops 16
Number of BUFGMUXs 1 24 4%
Number of
MULT18X18SIOs 1 20 5%
Average Fan out of Non-
Clock Nets 1.45
Fig. 15 Global RTL scheme of the P & O algorithm
Fig. 16 FPGA circuit routing for the MPPT P&O controller program
We analyze the simulation results described in Figures 8 to
13, we can conclude that:
The MPPT algorithm (Perturb and Observe) reaches the
maximum power point (PPM) very fast for both
converters ĆUK and SEPIC.
Both systems respond to changes in temperature and
irradiation.
The output power of the system for the SEPIC converter
has a 40% overshoot, but no overrun is recorded for the
converter ĆUK.
The rise time for both converters is almost the same, its
value is 0.55ms.
The output power of the system is more stable with the
SEPIC converter at the point of maximum power
compared to the system with the converter ĆUK.
VI. CONCLUSION
This study compares the performance of two converters
ĆUK and SEPIC used for the design of a MPPT using the
P&O (Perturb and Observe) technique. The MATLAB/
Simulink software was used to simulate the system including
the two converters and the photovoltaic module. On the other
hand, the MPPT algorithm is executed in the XSG
environment. The research work is carried out with minimal
resources, making the system easy to implement on target
FPGA and is therefore inexpensive. The results show that the
output power of the ĆUK convertor is greater than the one of
the SEPIC convertor within a short period of time. They also
show that both systems easily detect the maximum power
point in a period of time less than 0.005s. The ĆUK converter
User1
Typewritten Text
Copyright IPCO-2019 ISSN 1737-9296
User1
Typewritten Text
International Journal of Scientific Research & Engineering Technology (IJSET) Vol.7 pp. 14-20
Page 7
is much more stable with less power drive at the PPM
position than the SEPIC converter.
REFERENCES
[1] Nabil Karamia, Nazih Moubayedb, Rachid Outbib, “General review
and classification of different MPPT Techniques’’, Renewable and
Sustainable Energy Reviews 68 (2017) 1–18. www.elsevier.com/locate/rser.
[2] MENA 2013, “The International Renewable Energy Agency
(IRENA)’’, www.irena.org. [3] T. Esram ;P. L. Chapman, “Comparison of Photovoltaic Array
Maximum Power Point Tracking Techniques’’, IEEE
TRANSACTIONS ON ENERGY CONVERSION, VOL. 22, NO. 2, JUNE 2007.
[4] Priety, Vijay Kumar Garg 1M. Tech Student(EE) “A Review Paper
On Various Types Of Mppt Techniques For Pv System” e-ISSN 2277-2685, p-ISSN 2320-976 IJESR/May 2014/ Vol-4/Issue-5/320-330.
[5] Ali RezaReisi a,n, Mohammad HassanMoradi b, ShahriarJamasb,
“Classification and comparison of maximum power point tracking techniques for photovoltaic system: A review’’, Renewable and
Sustainable Energy Reviews 19 (2013) 433–443.
[6] K. H. Hussein, I. Muta, T. Hoshino, and M. Osakada, “Maximum photovoltaic power tracking: An algorithm for rapidly changing
atmospheric conditions”, Proc. Inst. Elect. Eng., Generation,
Transmission and Distribution, Vol. 142, No. 1, January 1995, pp. 59–64.
[7] S. Surawdhaniwar, R. Diwan “An Improved Approach of Perturb and
Observe Method Over Other Maximum Power Point Tracking Methods ”, International Journal of Recent Technology and
Engineering (IJRTE) ISSN: 2277-3878, Volume-1, Issue-3, August
2012. [8] D. P. Hohm and M. E. Ropp, “Comparative Study of Maximum
Power Point Tracking Algorithms’’, Published online 22 November
2002 Received 12 February 2002 Copyright # 2002 John Wiley & Sons, Ltd. Revised 2 June 2002.
[9] N. Femia, Member, IEEE, G. Petrone, G. Spagnuolo, Member,
“Optimization of Perturb and Observe Maximum Power Point Tracking Method’’, IEEE, and Massimo Vitelli IEEE
TRANSACTIONS ON POWER ELECTRONICS, VOL. 20, NO. 4,
JULY 2005. [10] L. R. Shanmugasundaram , K. Sarbham . “Load Controlled Adaptive
P&O MPPT Controller PV Energy Systems’’, International Journal of
Innovative Research in Science, Engineering and Technology; Vol. 4, Issue 5, May 2015.
[11] N. Mohan, T. M. Undeland, and W. P. Robbins, “Power Electronics:
Converters, Applications and Design’’, Third Edition, John Wiley, New York, 2003.
[12] Gayathri Deivanayaki.VP, Dhivyabharathi.R, Surabhi.R, Naveena.P,
“comparative Analysis of Bridgeless CUK and SEPIC Converter’’, International Journal of Innovative Computer Science & Engineering,
Volume 3 Issue 1; January-February-2016; Page No. 15-19.
[13] A. Messai , A. Mellit, A. Guessoum, and S.A. Kalogirou, “Maximum
power point tracking using a GA optimized fuzzy logic controller and
its FPGA implementation”, Solar energy, vol.85, pp.265–277, 2011. [14] M. G. Villalva, J.R. Gazoli & E. Rupert. “Modeling and circuit based
simulation of photovoltaic arrays’’, Brazilian Journal of Power
Electronics, Vol/Issue: 14(1). Pp. 35- 45, 2009. [15] www.atersa.com.
[16] K. Kassmi, M. Hamdaoui and F. Olivié, “Caractérisation des
Panneaux Photovoltaïques. Conception et Optimisation d’un Système Photovoltaïque pour une Meilleure Exploitation de l’Energie
Solaire’’, Energies Renouvelables, Organisation des Nations Unies
pour l’Education, la Science et la Culture, Bureau de l’UNESCO à Rabat, Bureau Multi Pays pour le Maghreb, Les Energies
Renouvelables au Maroc, Le débat est lancé. ISBN9954_8068_2_2,
Rabat, Maroc, pp. 87 - 110, 2007. [17] M. El Ouariachi, T. Mrabti, B. Tidahf, Ka. Kassmi and K. Kassmi,
“Regulation of the Electric Power Provided by the Panels of the
Photovoltaic System’’, International Journal of Physical Sciences, Vol. 4, N°5, pp. 294 – 309, May 2009.
[18] H. Othmani, H. chaouali, D. Mezghani, A. Mami. “Optimisation de la
Technique de Perturbation et Observation par la logique floue’’, 3ème conférence Internationale des énergies renouvelables CIER-2015
International Journal of Scientific Research & Engineering
Technology (IJSET). [19] A. R. Saxena, S. M. Gupta, “Performance Analysis of P&O and
Incremental Conductance MPPT Algorithms Under Rapidly Changing
Weather Conditions’’, J.Electrical systems, 10-3(2014):292-304. [20] P .Bhatnagar, RK. Nema, “Maximum power point tracking control
techniques: State-of the art in photovoltaic applications”, Renewable
and Sustainable Energy Reviews Sci Verse Science Direct, 2013; 224–241.
[21] N. Femia, G. Petrone, G. Spagnuolo and M. Vitelli, “Optimization of
Perturb and Observe Maximum Power Point Tracking Method”, IEEE Transactions On Power Electronics, Vol.20, No. 4, pp. 16-19, Mar.
2004
[22] P. de Souza , P. de Oliveira, R. Gules, E. F. R. Romaneli, A. A. Badin, “A high static gain CUK DC-DC converter ) ’’, 2015 IEEE 13th
Brazilian Power Electronics Conference and 1st Southern Power
Electronics Conference (COBEP/SPEC. [23] M. Kaouane, A. Boukhelifa, A. Cheriti, “Design of a synchronous
sepic DC-DC converter for a stand-alone photovoltaic system,
Electrical and Computer Engineering (CCECE) ’’, 2015 IEEE 28th Canadian Conference on.
[24] R. Tadrist, A. Hassani, M. Maamoune, A. Nesba, “Nouvelle Approche
d' Implémentation Sur FPGA d'un Modèle du Convertisseur Sepic Basé Sur Xilinx System Generator”, 2ème conférence Internationale
des énergies renouvelables CIER-2014 International Journal of Scientific Research & Engineering Technology (IJSET) Vol.3-pp.94-
101, Copyright - IPCO 2015.
[25] R. Tadrist, A. Hassani, M. Maamoune, A. Nesba, I. Kebli, “Nouvelle Approche Temps-Réel de Modélisation des Panneaux Photovoltaïques
basée sur FPGA”, Revue des Energies Renouvelables Vol. 17 N°4
(2014) 611 – 622.
[26] Xilinx System Generator User's Guide, www.Xilin x.com.
[27] V. Betz and J. Rose, “How Much Logic Should Go in an FPGA Logic
Block?”, IEEE Design and Test Magazine, Spring 1998, pp. 10 - 15
User1
Typewritten Text
Copyright IPCO-2019 ISSN 1737-9296
User1
Typewritten Text
International Journal of Scientific Research & Engineering Technology (IJSET) Vol.7 pp. 14-20