Page 1
Comparison of Simulation Tools to Fit and Predict Performance Data
of CO2 Absorption into Monoethanol Amine at CO2 Technology Centre
Mongstad (TCM)
Lars Erik Øi1,* Kai Arne Sætre1 Espen Steinseth Hamborg2
1Department of and Process, Energy and Environmental Technology, University College of Southeast Norway 2CO2 Technology Centre Mongstad DA
[email protected]
Abstract
In this work, several sets of experimental data from the
amine based CO2 capture process at CO2 Technology
Centre Mongstad (TCM) have been compared with
simulations of different equilibrium based models and a
rate-based model. The equilibrium models (in Aspen
Plus and Aspen HYSYS) were fitted by adjusting the
Murphree efficiency for each stage and the rate-based
model (in Aspen Plus) was fitted by adjusting the
interfacial area factor. Aspen Plus (using the
Electrolyte-NRTL model) and Aspen HYSYS (using
Kent-Eisenberg and Li-Mather models) gave almost
identical results for the capture rate and small deviations
for the temperature profiles. There are however
deviations both between the measured temperatures at a
specified column height and between measured
temperatures and the simulated temperatures.
Equilibrium based models are less fundamental than
rate-based models, but for the conditions in this study,
the rate-based models still lack accurate input
parameters like the interfacial area. The results from
this study show that equilibrium and rate-based models
perform equally well in both fitting performance data
and in predicting performance at changed conditions.
Keywords: CO2, amine, absorption, simulation
1 Introduction
Developing robust and predictable process simulation
tools for CO2 capture is an important step in improving
carbon capture technology to reduce man-made carbon
emissions. Examples of available process simulation
tools for CO2 absorption into amine solutions are the
equilibrium based models in Aspen Plus and Aspen
HYSYS and the rate-based model in Aspen Plus.
Equilibrium based absorption models are based on the
assumption of equilibrium at each stage. The model can
be extended by introducing a Murphree efficiency (the
ratio of the change in mole fraction from a stage to the
next divided by the change assuming equilibrium).
Rate-based models are based on rate expressions for
chemical reactions, mass transfer and heat transfer.
At CO2 Technology Centre Mongstad (TCM) there
is an absorption column with a rectangular cross section
of 3.55 times 2 meter which is equivalent to a packing
diameter of 3 meter, and a packing height up to 24
meter. At TCM, performance tests of CO2 absorption
from flue gas into 30 wt-% monoethanol amine (MEA)
have been run in 2013 (Thimsen et al., 2014; Hamborg
et al., 2014) and in 2015 (Gjernes et al., 2017). Figure
1 shows a simplified process diagram of the amine based
CO2 absorption and desorption facility at TCM.
Figure 1. Simplified process diagram of the amine based CO2 capture plant at TCM (Thimsen et al., 2014)
https://doi.org/10.3384/ecp18153230 230 Proceedings of The 59th Conference on Simulation and Modelling (SIMS 59), 26-28 September 2018,
Oslo Metropolitan University, Norway
Page 2
A performance test at TCM is normally run at
constant conditions for a long period of time to obtain
steady state conditions. In this work, the emphasis is on
the absorber part of the process. Especially the total
CO2 capture rate (in % of incoming CO2) in the
absorption section and the temperature profile from top
to bottom of the absorption section are the evaluated
parameters.
The aim of this work is to compare results from
simulations with performance data for CO2 absorption
into 30 wt-% MEA at TCM using different simulation
tools. In this work, 4 sets of experimental data
(scenarios) from the amine based CO2 capture process
at TCM have been compared with simulations of
different equilibrium based models and a rate-based
model. The work is based on the Master Thesis of Kai
Arne Sætre (2016). Some of the results from the Master
Thesis were presented as a non-published Poster at the
TCCS-9 conference in Trondheim in June 2017. In the
original work (Sætre, 2016) the equilibrium models (in
Aspen Plus and Aspen HYSYS) were fitted to one
specific scenario by adjusting the Murphree efficiency
for each stage, and the rate-based model (in Aspen Plus)
was fitted to another scenario by adjusting the interfacial
area factor. In this work, the Murphree efficiency for
each stage was adjusted in the other scenarios to achieve
a good fit to the temperature profile. The interfacial area
was constant in all the calculations for the rate-based
model, and this gave a good fit to the CO2 capture rate
and reasonably good fit to the temperature profile.
2 Available Equilibrium and Kinetic
Models
There are several equilibrium models available for the
MEA/water/CO2 system describing the relations
between the vapour and liquid phase at equilibrium.
Aspen HYSYS has an amine package with the Kent-
Eisenberg (1976) and the Li-Mather (1994) equilibrium
models. Aspen Plus has an Electrolyte-NRTL
equilibrium model which is based on Austgen et al.
(1989). The column models in both Aspen HYSYS and
Aspen Plus can be specified with Murphree efficiencies.
In the Master Thesis work of Zhu (2015) and Sætre
(2016), a Murphree efficiency for each stage (meter of
packing) was estimated for a set of TCM data (Hamborg
et al., 2014). Zhu (2015) found that a Murphree
efficiency fitted to 0.09 for all stages obtained good
agreement between measured and simulated CO2
capture rate. Using different Murphree efficiencies for
each stage, it was possible to achieve also good
agreement between the measured and simulated
temperature profile.
In Aspen Plus, there are several models for heat
transfer, mass transfer and kinetics which can be
included in a rate-based calculation. A rate-based
example file for CO2 removal using MEA is available
with the Aspen Plus program. The parameters in this file
are mostly based on the work of Zhang et al. (2009) who
fitted Aspen Plus simulations to experimental runs at a
CO2 absorption pilot plant at the University of Texas.
The rate-based models used at TCM have been
developed during several years, and different models
have been used in the Master Thesis works of Larsen
(2014), Desvignes (2015) and Sætre (2016).
There have been published very few comparisons
between different simulation tools for CO2 absorption.
One reference comparing different simulation programs
for CO2 removal from atmospheric gas is Luo et al.
(2009). They tested Aspen RadFrac, ProTreat, ProMax,
Aspen RateSep, CHEMASIM from BASF and CO2SIM
from SINTEF/NTNU and compared with pilot plant
data. They claimed that all models were capable of
fitting the capture rate, but the temperature and
concentration profiles were less well predicted. Øi
(2012) has performed comparisons between the
programs Aspen HYSYS and Aspen Plus. He claimed
that there were small differences between the tested
equilibrium models, and that a rate-based and
equilibrium based model with estimated Murphree
efficiencies gave similar results.
In literature, different models and tools are
mentioned. In this work a simulation tool is meant as a
complete collection of models for equilibrium, rate
expressions and efficiencies including defined
parameter values for all the models. It should be noted
that most of the models used are very dependent on the
parameter values.
3 Material, Methods and
Specifications
3.1 Performance Data from TCM
Performance data for this work have been taken from 4
sets of conditions (scenarios) at TCM. They are from
campaigns in 2013 and 2015 for approximately 30 wt-
% MEA in water. 24 meter of packing height (the
maximum available) was used in these scenarios. These
scenarios were all run with anti-foam to avoid operating
problems due to foaming. Only the performance of the
absorber part of the process was evaluated in this work.
The conditions in each scenario are mainly defined by
the conditions of the inlet gas stream and the inlet amine
stream to the absorption section of the absorption
column. The performance test data cover measurements
from all the process units in Figure 1. Each of the
scenarios were run for several days to obtain
measurements for steady state conditions.
The data for the 4 scenarios are listed in Table 1,
Table 2, Table 3 and Table 4 (from Sætre, 2016). The
data are from scenarios documented in Hamborg (2014) and Gjernes (2017), but some of the data are converted
to different units to make them suitable for input to
simulation programs.
https://doi.org/10.3384/ecp18153230 231 Proceedings of The 59th Conference on Simulation and Modelling (SIMS 59), 26-28 September 2018,
Oslo Metropolitan University, Norway
Page 3
The 4 scenarios which have been selected in this work
are named H14 and 6w from 2013 (Hamborg, 2014) and
2B5 and Goal1 from 2015 (Gjernes, 2017). The names
have been used internally at TCM, except the H14
scenario which is based on a temperature profile with
mean values from the 4 locations for each packing
height of one meter. The 4 scenarios were run with
amine concentrations close to 30 wt-% MEA in water.
The measured MEA concentrations were 30.0 (H14),
30.4 (6w), 31.6 (2B5) and 32.4 wt-% (Goal1).
Table 1 Scenario H14 experimental input data for process
simulations.
Table 2 Scenario 6w experimental input data for process
simulations.
Table 3 Scenario 2B5 experimental input data for process
simulations.
Table 4 Scenario Goal1 experimental input data for
process simulations.
The results from the performance data scenarios to be
compared with simulations, are the total CO2 capture
rate and the temperature profile measured for every
meter of the packing. The temperature was measured at
different locations for each meter of packing, and the
different locations were named A, B, C and D. For the
H14 scenario, a mean value for each meter of packing
was specified in the temperature profile (Hamborg,
2014).
3.2 Specifications for the Equilibrium
Based Simulation Tools
When using Aspen HYSYS version 8.0, the Amine
package with the Kent-Eisenberg model was used with
non-ideal vapor phase. In the work of Sætre (2016) also
the Li-Mather model was used, but the results with the
Li-Mather model are not included in this work.
When using Aspen Plus version 8.0, the Electrolyte-
NRTL (Non-Random-Two-Liquid) was used. The
sample file available from Aspen Plus, was used as the
basis for the Aspen Plus simulations.
In the Master Thesis work of Zhu (2015) and in Sætre
(2016), a Murphree efficiency for each of the 24 stages
(meter of packing) was estimated for the TCM data set
(Hamborg 2014). Zhu (2015) found that a Murphree
efficiency of 0.09 for all stages gave a good fit to the
capture rate. This approach was used by Sætre (2016)
in his work, but these results are not presented in this
work. Zhu (2015) also found that a linear Murphree
efficiency profile gave a better fit to the temperature
profile. A Murphree efficiency of 0.23 at the top stage
and then reduced linearly to 0.09 for stage 14 and
constant equal to 0.01 (close to 0) for the bottom stages
fitted the temperature profile very well for the H14
scenario (Zhu, 2015). This Murphree efficiency was
used in all the scenarios in the work of Sætre (2016). In
this work, this was found to be satisfactory only for the
scenarios H14 and Goal1. The capture rate and
temperature profile in the scenarios 6w and 2B5
scenarios were found to be well predicted by a linear
efficiency profile with EM = 0.192 at the top stage and
0.008 at the bottom. This was specified in this work for
6w and 2B5 in both the Aspen HYSYS and Aspen Plus
simulation tool.
3.3 Specifications for the Rate-Based Tool
The specifications in the rate-based Aspen Plus
simulation tool at TCM have been developed during
several years and different versions have been used
(Larsen, 2014; Desvignes, 2015; Sætre 2016).
Especially the parameters in the Electrolyte-NRTL model are not the same in all versions. In this work, the
parameters in the sample file from Aspen Plus version
Input data to the simulations
Amine inlet Flue gas inlet
Flow rate [kg/h] 54900 Flow [kmol/h] 2022
Temperature [oC] 36.5 Temperature [oC] 25.0
MEA [mol%] 10.94 CO2 [mol%] 3.7
H2O [mol%] 86.54 H2O [mol%] 2.95
CO2 [mol%] 2.52 O2 [mol%] 13.6
Pressure [bara] 1.0313 N2 [mol%] 79.75
Pressure [bara] 1.063
Input data to the simulations:
Amine inlet Flue gas inlet
Flow rate [kg/h] 54915 Flow [kmol/h] 2005
Temperature [oC] 36.9 Temperature [oC] 25
MEA [mol%] 11.13 CO2 [vol%] 3.57
H2O [mol%] 86.37 H2O [vol%] 3.0
CO2 [mol%] 2.5 O2 [vol%] 13.6
Pressure [bara] 1.0313 N2 [vol%] 79.83
Pressure [bara] 1.063
Input data to the simulations
Amine inlet Flue gas inlet
Flow rate [kg/h] 49485 Flow [kmol/h] 2022
Temperature [oC] 36.8 Temperature [oC] 28.2
MEA [mol%] 11.67 CO2 [mol%] 3.57
H2O [mol%] 85.65 H2O [mol%] 3.7
CO2 [mol%] 2.68 O2 [mol%] 14.6
Pressure [bara] 1.0313 N2 [mol%] 78.08
Pressure [bara] 1.063
Input data to the simulations
Amine inlet Flue gas inlet
Flow rate [kg/h] 44391 Flow [kmol/h] 2017
Temperature [oC] 28.6 Temperature [oC] 25
MEA [mol%] 12.04 CO2 [mol%] 3.62
H2O [mol%] 85.19 H2O [mol%] 3.1
CO2 [mol%] 2.77 O2 [mol%] 14.3
Pressure [bara] 1.0313 N2 [mol%] 79
Pressure [bara] 1.063
https://doi.org/10.3384/ecp18153230 232 Proceedings of The 59th Conference on Simulation and Modelling (SIMS 59), 26-28 September 2018,
Oslo Metropolitan University, Norway
Page 4
8.0 (Rate_Based_MEA_Model) were used. Most of
these specifications are based on the work by Zhang et
al. (2009) where Aspen Plus rate-based simulations
were fitted to pilot scale experiments of CO2 absorption
at the University of Texas. The specifications for the
rate-based model (in the APRB_TCM2016 file) is
shown in Table 5.
Table 5. Specifications for the rate-based model in the
APRB_TCM2016 file
SPECIFICATION
Calculation type Rate-based
Number of stages 50
Efficiency type Vaporization efficiencies
Reaction ID MEA-NEW
Holdup 0.0001 stage 1 to 50
Reaction condition factor 0.9
Packing type Koch metal 2x
Section diameter [m] 3
Section packed height [m] 24
Flow model Countercurrent
Interfacial area factor 0.55 (0.5 to 1)
Film Liquid phase Discrxn
Film Vapor phase Film
Mass transf coeff method Bravo et al. 1985
Heat transf coeff method Chilton and Colburn
Interfacial area method Bravo et al. 1985
Holdup method Bravo et al. 1992
Add. Discretize points liquid 5
Detailed documentation of the rate-based model can
be found in the Aspen Plus program documentation.
References to the mass transfer, interfacial area and
hold-up models are Rocha et al. (1985) and Rocha et al.
(1993), and for the heat transfer coefficient method
Chilton and Colburn (1935).
4 Results
4.1 General Results
The results from the simulations are mainly the capture
rate and the temperature profile. There are 3 simulation
tools used, and no parameters are changed in the
simulation tools from scenario to scenario except for the
Murphree efficiencies. Simulation results and
performance data are compared for each scenario. In
general, the simulated capture rate was reasonably close
to the measured capture rate for all scenarios except for
the Goal1 scenario. Because of that, emphasis is in this work on comparison of temperature profiles.
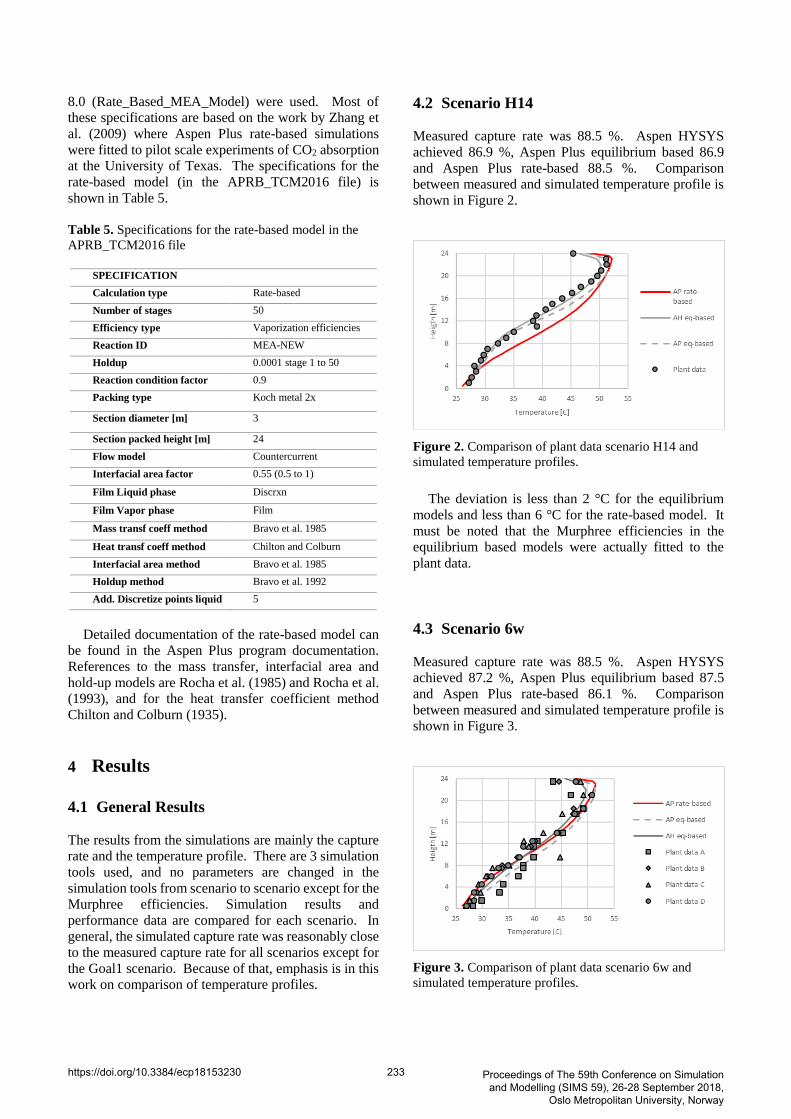
4.2 Scenario H14
Measured capture rate was 88.5 %. Aspen HYSYS
achieved 86.9 %, Aspen Plus equilibrium based 86.9
and Aspen Plus rate-based 88.5 %. Comparison
between measured and simulated temperature profile is
shown in Figure 2.
Figure 2. Comparison of plant data scenario H14 and
simulated temperature profiles.
The deviation is less than 2 °C for the equilibrium
models and less than 6 °C for the rate-based model. It
must be noted that the Murphree efficiencies in the
equilibrium based models were actually fitted to the
plant data.
4.3 Scenario 6w
Measured capture rate was 88.5 %. Aspen HYSYS
achieved 87.2 %, Aspen Plus equilibrium based 87.5
and Aspen Plus rate-based 86.1 %. Comparison
between measured and simulated temperature profile is
shown in Figure 3.
Figure 3. Comparison of plant data scenario 6w and
simulated temperature profiles.
https://doi.org/10.3384/ecp18153230 233 Proceedings of The 59th Conference on Simulation and Modelling (SIMS 59), 26-28 September 2018,
Oslo Metropolitan University, Norway
Page 5
With the exception of the plant data A and one outlier
temperature from plant data C, the deviations between
measured and simulated temperatures were less than 3
°C. In this case the Murphree efficiencies were fitted as
a linear profile from top to bottom. It must be noted that
the interfacial area factor was fitted (to 0.55) for the
Aspen Plus rate-based model to fit the capture rate and
the temperature profile for this scenario.
4.4 Scenario 2B5
Measured capture rate was 87.2 %. Aspen HYSYS
achieved 87.3 %, Aspen Plus equilibrium based 87.5
and Aspen Plus rate-based 86.0 %. Comparison
between measured and simulated temperature profile is
shown in Figure 4.
Figure 4. Comparison of plant data scenario 2B5 and
simulated temperature profiles.
With the same exception of the plant data A and one
temperature from plant data C, the deviations between
measured and simulated temperatures were less than 2
°C. Also in this case the linear Murphree efficiency
profile gave a good fit to the temperature profile. The
equilibrium based temperatures were slightly less than
the measured temperatures, while the rate-based
temperatures were close to the measured.
4.5 Scenario Goal1 Measured capture rate was 90.1 %. Aspen HYSYS
achieved 86.2 %, Aspen Plus equilibrium based 82.7
and Aspen Plus rate-based 78.9 %. This is the only case
where there is a significant deviation between
performance data and capture rate. The deviation is 4
%-points for the Aspen HYSYS equilibrium based
model, 7 %-points for Aspen Plus equilibrium based and
11 %-points for the Aspen Plus rate-based model.
Comparison between measured and simulated
temperature profile is shown in Figure 5.
The deviations between measured and simulated
temperatures were less than 3 °C. The Murphree
efficiency profile from Zhu (2015) gave a reasonably good fit for the equilibrium based models with less than
2 °C difference between the models.
Figure 5. Comparison of plant data scenario Goal1 and
simulated temperature profiles.
5 Discussion
There is very little difference in the results from
different equilibrium models like Kent-Eisenberg and
Electrolyte-NRTL. Sætre (2016) also simulated the 4
scenarios in this work with the Li-Mather model. The
Li-Mather and Kent-Eisenberg models gave very
similar results, and this has also been experienced earlier
(Øi, 2012). There is a difference of approximately 2 °C
in the maximum temperature in the upper part of the
column between Kent-Eisenberg and Electrolyte-
NRTL, but this does not seem to give differences in the
removal rate. When simulating the Goal1 scenario, the
maximum temperature in the simulation tools were very
close to each other.
All the tools are close to similar when it comes to
prediction of the total absorption rate. Fitting the
models to achieve the measured absorption rate can be
performed for one scenario by adjusting the Murphree
efficiency for the equilibrium based models or the
interfacial area factor for the rate based models. For the
equilibrium based models, two sets of Murphree
efficiencies were used to achieve reasonable results for
all 4 scenarios. The ability to predict performance at
other conditions was about the same for the different
simulation tools. Luo et al. (2009) have tested Aspen
RadFrac, ProTreat, ProMax, Aspen RateSep,
CHEMASIM and CO2SIM. As in this work, they
concluded that basically all the codes were capable of
giving reasonable predictions on overall CO2 absorption
rate.
The figures show that measured temperature profiles
and simulated temperature profiles are reasonably close.
There are however deviations both between the
measured temperatures at different locations at a
specified column height and between measured
temperatures and the simulated temperatures. It is not
obvious that any of the simulation tools predicts the
measured temperatures better than the other models.
https://doi.org/10.3384/ecp18153230 234 Proceedings of The 59th Conference on Simulation and Modelling (SIMS 59), 26-28 September 2018,
Oslo Metropolitan University, Norway
Page 6
Some references (Zhang et al., 2009; Larsen, 2014;
Desvignes, 2015) have compared also the concentration
profiles when comparing performance data and
simulation tools. This is not done in this work. In the
work of Larsen (2014) the concentration data values
were too uncertain to make the comparisons significant
because the uncertainty in the measured liquid
concentrations were higher than the simulation
uncertainties.
It has been claimed (Zhang et al., 2009) that rate-
based models are superior to equilibrium based models
because the rate-based models are capable of describing
more detailed mechanisms. It is however factors and
parameters in the rate-based models which are not
known, especially specifications for fluid flow, heat
transfer and mass transfer conditions in structured
packings. A rate-based model has several parameters
which can be used to fit the model to performance data.
The most reasonable parameter to vary to fit capture
efficiency is the interfacial area factor. It could also be
possible to divide the column in sections with different
interfacial area factors. The ability to predict
performance at other conditions is however a difficult
challenge. One assumption for the rate-based model is
that there is ideal flow in axial direction and perfect
mixing in radial direction. The large deviations in
temperature measurements at different locations for
each meter of packing (location A, B, C and D) indicate
that this assumption is optimistic.
It is an important question whether the simulation
tools with fitted parameters are able to give a predictable
simulation at different conditions. Sætre (2016) tried to
predict the capture rate and the temperature profiles for
scenarios with 40 wt-% MEA (Desvignes, 2015) with
the 3 simulation tools used in this work (which is fitted
for 30 wt-% scenarios). The predictions were rather
poor.
In this work, only performance data with 24 meter of
packing was used. With such a high packing height, the
capture rate becomes very high, and will approach
equilibrium. This is indicated by the Murphree
efficiencies which give the best temperature fit for
scenario H14 and Goal1 were almost zero for the lowest
stages. There are also available performance data for
lower packing heights, e.g. 18 meter (Hamborg, 2014;
Gjernes, 2017). When comparing performance data
with simulation tools, comparisons using lower packing
height would probably give interesting results.
6 Conclusions
It is possible to fit a rate-based model by adjusting the
interfacial area factor, and to fit an equilibrium model
by adjusting the Murphree efficiency for each stage.
Equilibrium based models are less fundamental than
rate-based models, but for the conditions in this study,
the rate-based models still lack accurate input
parameters like the interfacial area. The results from
this study show that equilibrium and rate-based models
perform equally well in both fitting performance data
and in predicting performance at changed conditions.
The models with fitted parameters will give a
predictable simulation only when there are small
changes in the process parameters.
References
D. M. Austgen, G. T. Rochelle, X. Peng and C. Chen. Model of Vapor-
Liquid Equilibria for Aqueous Acid Gas-Alkanolamine Systems
Using the Electrolyte-NRTL Equation. Industrial & Engineering
Chemistry Research, 28:1060-73, 1989.
T. H. Chilton and A. P. Colburn. Distillation and absorption in packed
columns - A convenient design and correlation method. Industrial
and Engineering Chemistry, 27:255-260, 1935.
C. Desvignes. Simulation of post-combustion CO2 capture process with
amines at CO2 Technology Centre Mongstad. Master Thesis, CPE
Lyon, France, 2015.
E. Gjernes, S. Pedersen, T. Cents, G. Watson, B. F. Fostås, M. I. Shah, G.
Lombardo, C. Desvignes, N. E. Flø, A. K. Morken, T. de Cazenove,
L. Faramarzi and E. S. Hamborg. Results from 30 wt% MEA
performance testing at the CO2 Technology Centre Mongstad.
Energy Procedia, 114:1146-1157, 2017.
E. S. Hamborg, V. Smith, T. Cents, N. Brigman, O. Falk-Pedersen, T. de
Cazanove, M. Chagnlal, J. K. Feste, Ø. Ullestad, H. Ulvatn, O.
Gorset, I. Askestad, L. K. Gram, B. F. Fostås, M. I. Shah, A. Maxson
and D. Thimsen. Results from MEA testing at the CO2 Technology
Centre Mongstad. Part II: Verification of baseline results. Energy
Procedia, 63:5994-6011, 2014.
R. L. Kent, B. Eisenberg. Better data for Amine Treating. Hydrocarbon
Processing, 55(2):87-90, 1976.
I. M. S. Larsen. Simulation and validation of CO2 mass transfer processes
in aqueous MEA solutions with Aspen plus at TCM. Master Thesis,
Telemark University College, Norway, 2014.
Y. Li, A. E. Mather. Correlation and Predicition of the Solubility of
Carbon Dioxide in a Mixed Alkanol Solution. Industrial &
Engineering Chemistry Research, 33:2006-2015, 1994.
X. Luo, J. N. Knudsen, D. de Montigny, T. Sanpasertparnich, R. Idem, D.
Gelowitz et al. Comparison and validation of simulation codes
against sixteen sets of data from four different pilot plants. Energy
Procedia, 1:1249-56, 2009.
J. A. Rocha, J. L. Bravo, J. R. Fair. Mass Transfer in Gauze Packings,
Hydrocarbon Processing, 64(1):91, 1985.
J. A. Rocha, J. L. Bravo, J. R. Fair. Distillation Columns Containing
Structured Packings: A Comprehensive Model for Their
Performance. 1. Hydraulic Models. Industrial and Engineering
Chemistry Research, 32:641-651, 1993.
K. A. Sætre. Evaluation of process simulation tools at TCM. Master
Thesis. University College of Southeast Norway, 2016.
D. Thimsen, A. Maxson, V. Smith, T. Cents, O. Falk-Pedersen, O. Gorset
and E. S. Hamborg. Results from MEA testing at the CO2
Technology Centre Mongstad. Part I: Post-Combustion CO2 capture
testing methodology. Energy Procedia, 63:5938-5958, 2014.
Y. Zhang, H. Chen, C. Chen, J. Plaza, R. Dugas, G. T. Rochelle. Rate-
based Process Modelling Study of CO2 Capture with Aqueous
Monoethanolamine Solution. Industrial & Engineering Chemistry
Research, 48:9233-46, 2009.
Y. Zhu. Simulation of CO2 capture at Mongstad using Aspen HYSYS.
Master Thesis. Telemark University College, Norway, 2015.
L. E. Øi. Comparison of Aspen HYSYS and Aspen Plus simulation of
CO2 absorption into MEA from atmospheric gas. Energy Procedia,
23: 360-369, 2012.
https://doi.org/10.3384/ecp18153230 235 Proceedings of The 59th Conference on Simulation and Modelling (SIMS 59), 26-28 September 2018,
Oslo Metropolitan University, Norway