Page 1
1
Comparison of static 18F-FDG-PET/CT (SUV, SUR) and dynamic 18F-FDG-PET/CT (Ki) for quantification of pulmonary inflammation in acute lung injury
Anja Braune1,2, Frank Hofheinz3, Thomas Bluth1, Thomas Kiss1, Jakob Wittenstein1, Martin Scharffenberg1, Jörg Kotzerke2, Marcelo Gama de Abreu1
1Pulmonary Engineering Group, Department of Anesthesiology and Intensive Care Medicine, University Hospital Carl Gustav Carus at the Technische Universität Dresden, Dresden, Germany
2Department of Nuclear Medicine, University Hospital Carl Gustav Carus at the Technische Universität Dresden, Dresden, Germany
3Helmholtz-Zentrum Dresden-Rossendorf, PET Center, Institute of Radiopharmaceutical Cancer Research, Dresden, Germany
Corresponding Author / Reprint request: Anja Braune Department of Nuclear Medicine University Hospital Carl Gustav Carus Fetscherstr. 74 D-01307 Dresden Phone: +49 (0)351-458 12128 Fax: +49 (0)351-458 5310 E-mail: [email protected]
Short running title: 18F-FDG-PET/CT imaging in acute lung injury
Words: 4993, 345 (abstract)
Journal of Nuclear Medicine, published on May 3, 2019 as doi:10.2967/jnumed.119.226597by on January 25, 2020. For personal use only. jnm.snmjournals.org Downloaded from
Page 2
2
ABSTRACT
Positron Emission Tomography (PET) imaging with 18F-FDG followed by mathematical modelling
of the pulmonary uptake rate (Ki) is the gold standard for assessment of pulmonary inflammation
in experimental studies of acute respiratory distress syndrome (ARDS). However, dynamic PET
requires long imaging and only allows the assessment of one cranio-caudal field of view
(~15 cm). We investigated whether static 18F-FDG-PET/CT and analysis of standard uptake
values (SUV) or standard uptake ratios (SURstat, uptake time corrected ratio of 18F-FDG-
concentration in lung tissue and blood plasma) might be an alternative to dynamic 18F-FDG-
PET/CT and Patlak analysis for quantification of pulmonary inflammation in experimental ARDS.
METHODS: ARDS was induced by saline lung lavage followed by injurious mechanical
ventilation in fourteen anesthetized pigs (29.5-40.0 kg). PET/CT imaging sequences were
acquired before and after 24 h of mechanical ventilation. Ki and the apparent volume of
distribution (Vdist) were calculated from dynamic 18F-FDG-PET/CT scans using the Patlak
analysis. Static 18F-FDG-PET/CT scans were obtained immediately after dynamic PET/CT and
used for calculations of SUV and SURstat. Mean Ki values of the whole imaged field of view and
of five ventro-dorsal lung regions were compared with corresponding SUV and SURstat values,
respectively, by means of linear regression and concordance analysis. The variability of the 18F-
FDG concentration in blood plasma (arterial input function) was analyzed.
RESULTS: Both for the whole imaged field of view and ventro-dorsal subregions, Ki were
linearly correlated with SURstat (r2 ≥ 0.84), while Ki-SUV correlations were worse (r2 ≤ 0.75). The
arterial input function exhibited an essentially invariant shape across all animals and time points
and can be described by an inverse power law. Compared to Ki, SURstat and SUV tracked the
same direction of change in regional lung inflammation in 98.6 % and 84.3 % of measurements,
respectively.
CONCLUSION: The Ki-SURstat correlation was considerably stronger than the Ki-SUV
correlation. The good Ki-SURstat correlation suggests that static 18F-FDG-PET/CT and SURstat
by on January 25, 2020. For personal use only. jnm.snmjournals.org Downloaded from
Page 3
3
analysis provides an alternative to dynamic 18F-FDG-PET/CT and Patlak analysis, allowing the
assessment of inflammation of whole lungs, repeated measurements within the period of 18F-
FDG decay, and faster data acquisition.
KEY WORDS: pulmonary inflammation, positron emission tomography, 18F-FDG, tumor-to-blood
standard uptake ratio, standard uptake value
by on January 25, 2020. For personal use only. jnm.snmjournals.org Downloaded from
Page 4
4
INTRODUCTION
The acute respiratory distress syndrome (ARDS) is an inflammatory condition of the lung
and associated with high morbidity and mortality (1). The non-invasive and in vivo measurement
of the degree and distribution of pulmonary inflammation can improve the understanding of this
syndrome and the impact of mechanical ventilation. Positron emission tomography / computed
tomography (PET/CT) imaging of the uptake rate of 18F-FDG is a valuable method to determine
the pulmonary inflammatory response in ARDS. 18F-FDG-PET/CT measurements are based on
the fact that pulmonary inflammation is associated with regionally increased accumulation of
inflammatory cells, especially neutrophils, which have higher glucose metabolism compared to
other pulmonary cells (2,3). The more pronounced regional uptake of 18F-FDG and the
associated higher radioactivity originating from a local inflamed region can therefore be used to
assess the degree and the distribution of lung inflammation in ARDS.
Dynamic 18F-FDG-PET/CT acquires time-activity data over a long period after 18F-FDG
injection (typically over 60 to 75 min). Upon mathematical modeling, they allow the calculation of
dynamic indices describing the uptake rate of 18F-FDG (Ki). Such models take the transportation
rates between blood and tissue compartments into account. However, dynamic PET requires
long image acquisition and only allows the assessment of one cranio-caudal field of view (FoV),
which usually captures approximately 15 cm and thus not the whole lung. The captured lung
region has to be defined beforehand when degree and distribution of pulmonary inflammation is
not yet known.
Static PET scanning of the decay rate of 18F-FDG allows fast image acquisition and can
cover an unlimited FoV, enabling the acquisition of the whole lung. The standard uptake value
(SUV) is a simple and widely used parameter for quantification of static PET scans, which
represents the mean activity concentration within a region of interest normalized to the injected
dose and body weight. However, SUV values strongly depend on the 18F-FDG uptake of other
organs and tissue, affecting the amount of 18F-FDG in blood plasma available for the uptake by
by on January 25, 2020. For personal use only. jnm.snmjournals.org Downloaded from
Page 5
5
lung tissue. This is of particular importance in the lung due to its much lower 18F-FDG uptake
compared to other organs such as kidney, heart or brain (4) and has potentially caused weak
correlation between Ki and SUV in dogs suffering from lung injury (2), patients with liver
metastases (5) and patients with non-small cell lung cancer (6). Van den Hof et al. introduced
the standard uptake ratio, which is defined as tissue SUV normalized to the 18F-FDG
concentration in blood plasma available for influx into the tissue (7). Therefore, the SUR value
takes the 18F-FDG uptake of other bodily tissue and organs into account. In comparison to the
dynamic index Ki reflecting the variation of the 18F-FDG uptake rate over time, static indices such
as SUR reveal the amount of 18F-FDG within a region of interest at the time point of a static
PET/CT scan.
In this study we investigated whether SUR or SUR values derived from static PET
scanning can be used as alternative to dynamic PET for the quantification of regional lung
inflammation in experimental ARDS.
by on January 25, 2020. For personal use only. jnm.snmjournals.org Downloaded from
Page 6
6
MATERIALS AND METHODS
Experimental Protocol
The Institutional Animal Care and Welfare Committee and the Government of the State of
Saxony, Germany, approved all animal procedures in accordance to federal law (AZ 24-
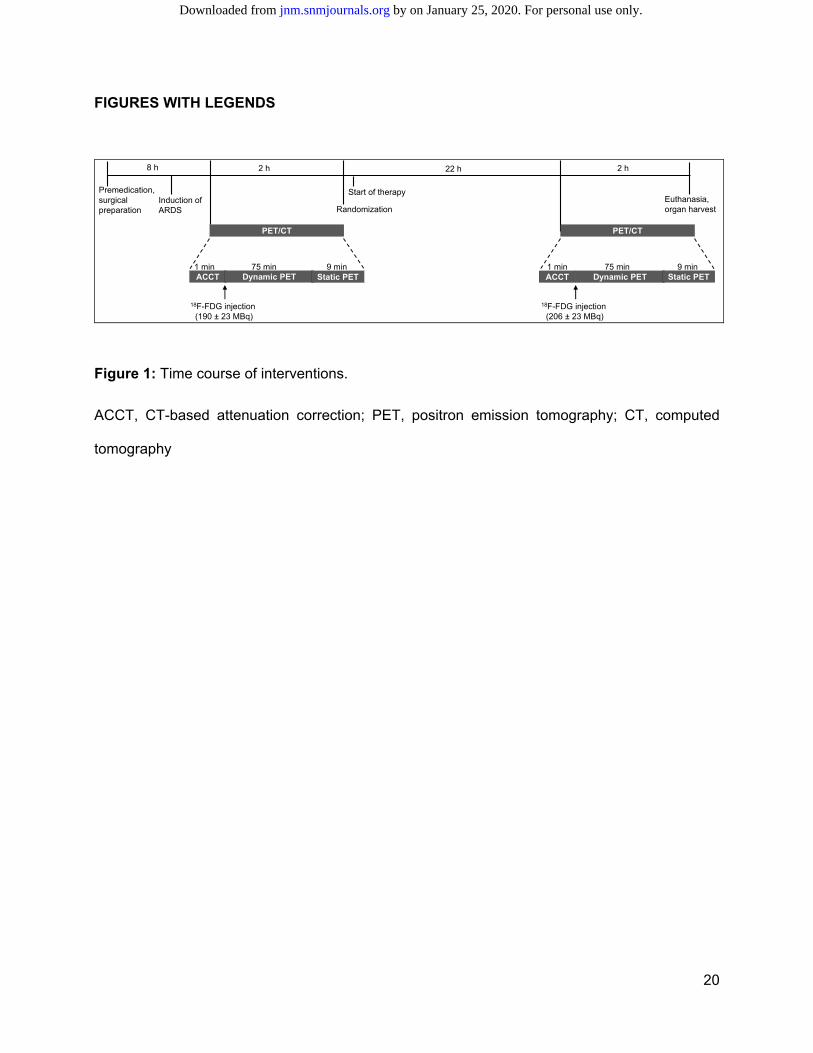
9168.11-1/2013-53). The time course of interventions is shown in Figure 1. Briefly, after
premedication (1 mg/kg midazolam, 10 mg/kg ketamine, 0.05 mg/kg atropine), 14 juvenile pigs
(29.5 - 40.0 kg) were intravenously anesthetized (5 - 15 mg/kg ketamine, 0.3 – 1 mg/kg
midazolam, both as bolus), paralyzed (3 mg/kg atracurium), oro-tracheally intubated and
mechanically ventilated (Evita XL, Dräger Medical AG, Lübeck, Germany) in supine position.
Lungs were ventilated in volume controlled mode using the following settings: fraction of inspired
oxygen: 1.0; tidal volume (VT): 6 mL/kg; positive end-expiratory pressure: 10 cmH20; inspiratory
to expiratory ratio: 1:1; constant airway flow: 35 L/min, and respiratory rate adjusted to achieve
an arterial partial pressure of carbon dioxide between 35 and 45 mmHg. During preparation, a
crystalloid solution (E153, Serumwerk Bernburg AG, Bernburg, Germany) was infused
intravenously at a rate of 10 mL/kg/h via a peripheral vein. An 8.5 French sheath was inserted in
the right internal carotid artery and a 7.5 French pulmonary artery catheter was advanced
through another sheath placed in the right external jugular vein. The lungs were recruited with
continuous positive airway pressure of 30 cmH2O for 30 s followed by 15 min of stabilization.
Experimental ARDS was induced using a double hit model consisting of surfactant depletion
(eight repetitive isotonic saline lung lavages alternating in prone and supine position) followed by
injurious mechanical ventilation with high VT (20 mL/kg) until Horovitz index < 100 mmHg for at
least 30 min. After acquisition of baseline PET/CT imaging data, animals were randomly
assigned to mechanical ventilation with either variable volume controlled ventilation with a mean
VT of 6 mL/kg and coefficient of variation in VT of 30 % (n = 7) or volume controlled ventilation
with non-variable VT (n = 7). Further mechanical ventilation settings were: fraction of inspired
oxygen titrated according to the low positive end-expiratory pressure table of the ARDS network,
by on January 25, 2020. For personal use only. jnm.snmjournals.org Downloaded from
Page 7
7
inspiration-expiration-ratio: 1:1; respiratory rate adjusted to arterial pH > 7.30, maximal plateau
pressure: 30 cmH2O and 45 cmH2O for variable and non-variable ventilation, respectively, mean
plateau pressure: 30 cmH2O in the variable ventilation mode.
After randomization, the crystalloid solution infusion rate was changed to 4 mL/kg/h to
maintain intravascular volume. Colloid solution (6 % hydroxyenthyl starch, Fresenius Kabi
Deutschland GmbH, Bad Homburg, Germany) was administered as necessary to keep the
hemoglobin concentration in the blood approximately constant. After 24 h of mechanical
ventilation in variable or non-variable ventilation mode, PET/CT imaging was repeated.
Respiratory mechanics, gas exchange and hemodynamics were assessed before and after
induction of ARDS (BL 1, injury), before start of mechanical ventilation (BL 2) and in 6 h intervals
thereafter (Time 1 to 4). At the end of the experiments, animals were killed by intravenous
injections of thiopental (2 g), followed by potassium chloride (1 M, 50 mL).
Lung Imaging Protocol and Image Processing
After induction of lung injury and before start of 24 h of mechanical ventilation, as well as
after 24 h of mechanical ventilation, imaging data were acquired according to the imaging
protocol illustrated in Figure 1. Briefly, low dose helical CT scans of the thorax were obtained
during mechanical ventilation and used for attenuation correction of the following PET images
(attenuation correction CT scans - ACCT) (Biograph16 Hirez PET/CT, Siemens, Knoxville, TN,
USA). 18F-FDG (198.6 ± 42.3 MBq) was injected intravenously over 60 s. Starting at the
beginning of 18F-FDG infusion, sequential PET frames (6 × 30″, 7 × 60″, 15 × 120″, 1 × 300″, 3 ×
600″) were acquired over 75 min. The 15 cm cranio-caudal FoV of the dynamic PET scans was
set above the diaphragmatic dome to reduce artifacts due to motion of the diaphragm.
Pulmonary arterial blood was sampled during the time course of the dynamic PET scans (12 ×
15″, 4 × 30″, 5 × 60″, 11 × 300″, and 75′). The concentration of 18F-FDG in 1 mL blood plasma
was measured in a gamma counter cross-calibrated with the PET scanner. Immediately after
by on January 25, 2020. For personal use only. jnm.snmjournals.org Downloaded from
Page 8
8
dynamic PET and 77-81 min after 18F-FDG injection, static 18F-FDG-PET/CT scans were
obtained in three bed positions assessing the whole lung.
ACCT scans were reconstructed with 2.0 mm slice thickness, yielding matrices with 512
× 512 pixels (1.37 × 1.37 mm2). Static and dynamic PET scans were reconstructed with 2.0 mm
slice thickness, yielding matrices with 168 × 168 pixel (2.03 × 2.03 mm2). The reconstruction
was carried out iteratively (ordered subset expectation maximization, six iterations, four subsets,
post-filtering Gauss 5 mm) with correction for scatter and attenuation.
Analysis of Blood Plasma Samples
For each animal and imaging sequence, the activity measurements of 18F-FDG in blood
plasma were interpolated to the mean frame time points of the dynamic PET scans, giving a
subject-specific arterial input function (Cp(t)). For each animal and time point, an inverse power
law (Eq. 1) was fitted to the input function using the data at t ≥ 10 min after 18F-FDG injection:
C t A ∗ t (Eq. 1)
The resulting input function was extrapolated to the time p.i. of the respective static PET
scan. The extrapolated Cp values were used to compute SUR of the static PET scans (see
below), for which no blood samples were available.
To validate wether equation 1 can be used to adequately describe the input function, the
time course of Cp was normalized to its mean value over the period of the dynamic PET scan to
account for differing amount of injected 18F-FDG and for differing body weight (blood volume).
The time-averaged Cp was compared between imaging sequences and animals by graphical
illustration and by fitting equation 1 to the time-averaged Cp data at t > 3 min and t ≥ 10 min.
by on January 25, 2020. For personal use only. jnm.snmjournals.org Downloaded from
Page 9
9
Image Analysis
ACCT scans and static PET scans were coregistered to the dynamic PET scans.
Segmentation was performed on coregistered ACCT scans to define regions of interest (ROI),
from which major airways and vessels were excluded. The acquired 15 cm cranio-caudal lung
fields of view of the dynamic PET scans were divided in 5 iso-gravimetric subregions reaching
from ventral to dorsal. The ROIs were applied to dynamic and static PET scans and were used
to compute the corresponding concentration of 18F-FDG in lung tissue (CPET).
18F-FDG uptake rates (Ki) and the apparent distribution volume of 18F-FDG in blood
plasma as a fraction of tissue volume (Vdist) were derived from the Patlak graphical analysis of
the dynamic PET frames acquired 10 - 75 min after 18F-FDG injection using the following
equation:
K ∗ θ t V . with θ t∗
(Eq. 2)
where Θ(t) is the so-called Patlak time and is the integration variable. Ki and Vdist were
averaged for each ROI as well as for the whole FoV.
SUV was calculated from static PET scans as:
SUV T /
(Eq. 3)
SUR was computed for the data of the dynamic PET scans acquired 40 min to 75 min p.i.
(SURdyn) and static PET scans (SURstat) as the uptake time corrected ratio of tissue
concentration and blood concentration as described in (8):
SUR T ∗ (Eq. 4)
where T is the actual scan time p.i. and T0 is the chosen standard scan time to which SUR
values are normalized. By definition the uptake time of SURdyn is the same for all measurements
and, therefore, T0 = T was chosen (i.e. no scan time correction). The mean frame time point of
the static PET scans ranged from 80.0 min to 83.4 min. The mean value of the scan times was
chosen as reference time T0 = 81.0 min p.i.. Mean SUV and SUR values were calculated for the
by on January 25, 2020. For personal use only. jnm.snmjournals.org Downloaded from
Page 10
10
same ROIs as used for the Patlak analysis, thus covering only the 15 cm cranio-caudal FoV, and
for the whole FoV.
For PET measurements before and after 24 h of mechanical ventilation, respectively,
correlations of Ki vs. SUV, Ki vs. SURstat and Ki vs. SURdyn were investigated by means of linear
regression and comparison of the coefficients of determination (r2) for regional values and the
whole FoV.
The ability of static PET scanning and SUV and SURstat analysis, respectively, to track
the direction of change in regional lung inflammation induced by 24 h of mechanical ventilation
and determined by dynamic PET scanning and Patlak Ki analysis was assessed by concordance
analysis and calculation of Cohen’s Kappa.
Statistics
A sample size calculation was not performed. Data are presented as mean and standard
deviation (SD) if not stated otherwise. Wilcoxon tests were used for comparisons between
measurement time points. For the analysis of hemodynamics, gas exchange and lung
mechanics, differences between and within groups (Group Effect, Time*Group Effect) were
tested with general linear model statistics. Differences between groups at time point Injury and
Time 4, respectively, were tested with Mann-Whitney-U tests. Significance was accepted at
p<0.05. Statistical analysis was performed with SPSS (version 23, SPSS, Chicago, IL).
by on January 25, 2020. For personal use only. jnm.snmjournals.org Downloaded from
Page 11
11
RESULTS
Hemodynamics, gas exchange and lung mechanics data are shown in Supplemental
Table 1 of the Appendix. There was no group effect or time-Group-effect for any of the variables.
Variables regarding hemodynamics and gas exchange were comparable between groups at the
imaging time points Injury and Time4, respectively (Supplemental Table 1).
Maps of pulmonary inflammation of one representative animal obtained by static and
dynamic 18F-FDG-PET/CT scanning before and after 24 hare shown in Figure 2. The 15 cm
cranio-caudal FoV assessed by dynamic PET scanning covered 76.43 ± 9.61 % of the volume of
the whole lung and 65.58 ± 5.96 % of the cranio-caudal lung expansion (see Fig. 2 for
illustration). In comparison, static PET scans covered the whole lung. Static PET scans were
acquired 81.0 ± 0.81 min after injection of 18F-FDG, and 11.0 ± 0.81 min after the mean time
point of the last dynamic PET frame. Dynamic PET scans were acquired over 75 min, while
acquisition of static PET scans lasted 9 min.
The period of 24 h of mechanical ventilation was associated with a 127.2 ± 79.4 %, 63.2
± 68.0 %, and 99.2 ± 76.5 % increase in regional Ki, SUV and SURstat, respectively (Figs. 3 and
4).
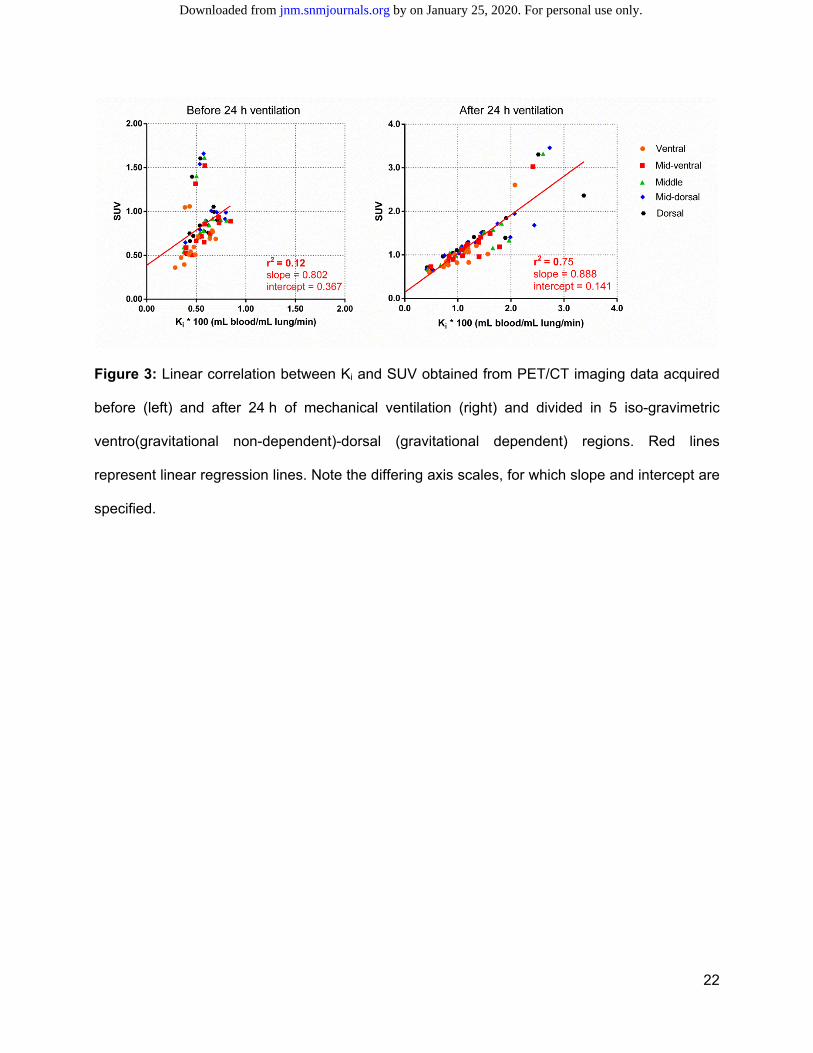
Before the 24 h ventilation period, the linear correlation between Ki and SUV was weak,
both for the whole FoV (r2 = 0.08) and 5 ventro-dorsal ROIs (Fig. 3, r2 = 0.12). Ki-SUV correlation
was stronger after 24 h of mechanical ventilation (whole FoV: r2 = 0.73; 5 ventro-dorsal ROIs: r2
= 0.75, Fig. 3). Linear correlation between Ki and SUV was worse than Ki-SURstat correlation
(compare Fig. 3 and 4). Before and after 24 h of mechanical ventilation, Ki and SURstat were
correlated, both for the whole FoV (Supplemental Fig. 2, r2 = 0.94 and 0.97, respectively) and for
5 ventro-dorsal ROIs (Fig. 4, r2 = 0.84 and 0.97, respectively). The correlation between Ki and
SURstat was higher after 24 h of mechanical ventilation, when inflammation increased
substantially (Fig. 4).
by on January 25, 2020. For personal use only. jnm.snmjournals.org Downloaded from
Page 12
12
Static PET scanning and SURstat and SUV analysis, respectively, was able to predict the
direction of change in regional lung inflammation, as determined by dynamic PET and Ki
analysis, in 98.6 % and 84.3 % of measurements (Fig. 5). The smallest change in Ki that was
still detected as increase in SURstat was 0.0006 mL/mL/min (Fig. 5). The agreement between
changes in Ki and SURstat induced by 24 h of mechanical ventilation was good (Cohen’s Kappa:
0.66), while there was no agreement between changes in Ki and SUV (Cohen’s Kappa: -0.027).
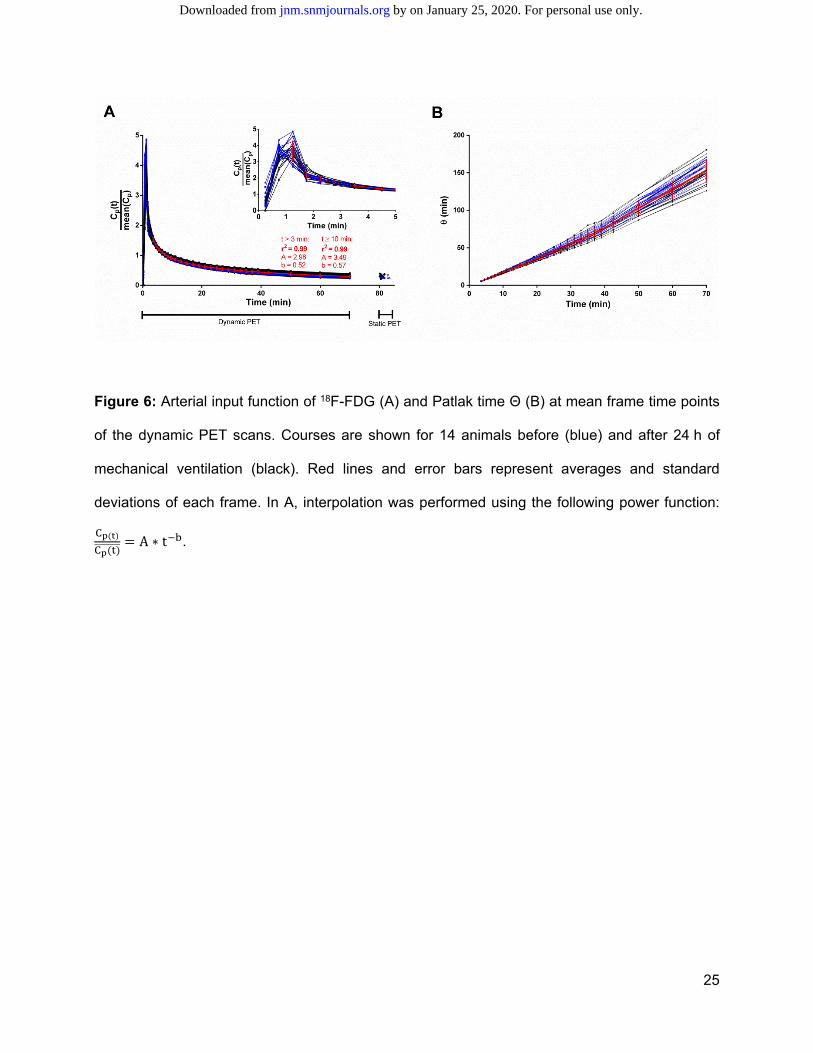
Figure 6 A shows the time course of the time-averaged Cp of all animals and both
imaging sequences. The very small standard deviation of CP at mean frame time points beyond
t > 3 min after 18F-FDG injection and the excellent agreement of the interpolation function with
time-averaged Cp values (r2 = 0.99) illustrates the very small inter- and intra-subject variability of
the mean normalized activity of 18F-FDG in blood plasma, despite much higher inflammatory
values after a 24 h period of mechanical ventilation. The low variability is especially true at late
time points, which are the relevant ones for the correlation Ki vs. SURstat. As a consequence, Θ
featured a relatively small inter-study variability and was linearly correlated with time for each
animal and measurement time point (Fig. 6 B). The low relative standard deviations of Θ at later
time points (e.g. at t = 70 min: 8.7 %) indicates the small inter- and intra-subject variability of the
Patlak timeVdist was lowest in ventral regions and increased along the gravitational gradient at
both imaging time points (Fig. 7). The 24 h period of mechanical ventilation was associated with
a 23.2 ± 25.0 % increase in mean regional Vdist.
Ki and SURdyn were strongly correlated (before and after 24 h of mechanical ventilation:
r2 = 0.78 and r2 = 0.97, Supplemental Fig. 3). While for higher inflammatory values obtained after
24 h of mechanical ventilation the Ki-SURdyn correlation was similar to the Ki-SURstat correlation,
the Ki-SURdyn correlation was worse than the Ki-SURstat correlation before 24 h of mechanical
ventilation (lower r2).
by on January 25, 2020. For personal use only. jnm.snmjournals.org Downloaded from
Page 13
13
DISCUSSION
The main results of this study were that, in an experimental model of ARDS: 1) the
agreement between Ki and SURstat was stronger than the agreement between Ki and SUV at
different Ki levels; 2) Ki and SURstat were strongly correlated at different levels of lung
inflammation; 3) the arterial input function exhibited an essentially invariant shape across all
animals and time points; 4) compared to Ki, SURstat and SUV tracked the same direction of
change in regional lung inflammation in 98.6 % and 84.3 % of measurements, respectively.
The SUV is a widely used parameter for quantification of the uptake of 18F-FDG.
However, the SUV is dependent on factors such as body mass, injected dose of 18F-FDG and
other confounding factors (9,10). We found a weak correlation between Ki and SUV, despite
similar weight of the pigs (35.3 ± 3.6 kg), small variation of the injected dose of 18F-FDG (198.6 ±
42.3 MBq) and acquisition of the static PET/CT scans at a similar time after 18F-FDG injection
(78.4 ± 0.9 min). The Ki-SUV-correlation was especially weak at low levels of lung inflammation
where variations in body mass and injected 18F-FDG dose have a comparatively high impact on
SUV.
The linear correlation between Ki and SUR was much stronger than the Ki-SUV
correlation at different levels of lung inflammation. Similarly, Chan et al. showed in an
experimental ARDS study in dogs that Ki, determined from compartment modeling of dynamic
18F-FDG-data, strongly correlated with tissue-to-plasma activity ratios (calculated from the last
frame of a dynamic 18F-FDG scan), while Ki-SUV correlation was weak (2).
A prerequisite for the good correlation between Ki and SUR is the shape invariance of
the arterial input function of 18F-FDG. This shape invariance across different subjects and time
points has been shown in patients with liver metastasis (7) and colon cancer metastatic to the
liver (11). Van den Hoff et al. showed that, in case the arterial input function can additionally be
described by an inverse power law, the shape invariance translates into: same exponent b but
different scale factor A in Eq. 1 (8). As a direct consequence, the Patlak time Θ(t) does not
by on January 25, 2020. For personal use only. jnm.snmjournals.org Downloaded from
Page 14
14
depend on the individual arterial input function but is rather proportional to real time t. Therefore,
the Patlak time is comparable between subjects at any time point after an initial period of about
3 min (8). Van den Hoff showed that these theoretical consideration are approximately fulfilled in
measurements obtained from patients with liver metastases (8). The investigation of the arterial
input function performed in this study demonstrates that both the shape invariance of the 18F-
FDG input function across different animals and imaging time points and the description of the
arterial 18F-FDG-time-activity curve by an inverse power law is also valid in pigs with ARDS.
However, the exponent of the power law seems to be notably larger in pigs than in humans (0.52
compared to 0.31). In general, a shape invariant arterial input function (as indicated by the
constant exponent) is very likely a result of a constant systemic glucose metabolism (12).
Therefore, the differing shape of the arterial input function between pigs and humans reflect
different systemic metabolism. However, further investigations are necessary to confirm this
hypothesis.
The slightly worse correlation of Patlak Ki and SUR directly after induction of lung injury
compared to imaging data obtained after 24 h mechanical ventilation might be caused by the
lower inflammatory values and the resulting higher contribution of the variability of Vdist. The
rather high intra-subject variability of Vdist might be explained by a substantial increase in lung
perfusion from ventral to dorsal regions in supine positioned animals (13-15), potentially
increasing the fractional blood volume.
The 24 h period of mechanical ventilation and the associated ventilator induced lung
injury was associated with a 127.2 ± 79.4 % increase in regional Ki, while regional Vdist did
increase by 23.2 ± 25.0 %. Therefore, the contribution of the variability of regional Vdist was much
lower after the 24 h period of mechanical ventilation. This might, at least partly, explain the better
correlation between Ki and SUR at higher levels of pulmonary inflammation obtained after the
24 h period of mechanical ventilation.
by on January 25, 2020. For personal use only. jnm.snmjournals.org Downloaded from
Page 15
15
The comparison of Patlak Ki and SUR was performed using two different static PET
images for SUR computation: the static PET scan measured after dynamic data acquisition
(covering the whole lung, giving SURstat) and one image generated from the last frames of the
dynamic PET scan (giving SURdyn). The latter was analyzed, since the analysis of a static PET
scan has two artificial sources of errors. First, there were no blood samples taken at the time
point of the static PET scan. Instead, the measured arterial input function was extrapolated to
this time point. Second, due to the different FoV, the image data had to be coregistrated to the
corresponding dynamic PET scan. Both aspects introduce an additional small error, which would
not be present in a study designed accordingly. Therefore, the accuracy, which can be expected
when Ki is replaced by SUR, is given by the results for the generated static image (SURdyn) not
by the measured static image (SURstat).
A limitation of the current study is the above mentioned lack of blood samples at the time
point of the static whole lung PET scan. A second limitation is the low number of investigated
subject. Further investigations with larger sample size have to be performed before these results
can be transferred to patient investigations.
CONCLUSION
In this model of experimental ARDS, the SUR analysis provided an alternative to
dynamic PET scanning and Patlak modeling of the uptake rate of 18F-FDG, allowing assessment
of inflammation of whole lungs, repeated measurements within the period of the 18F-FDG decay,
and faster data acquisition.
by on January 25, 2020. For personal use only. jnm.snmjournals.org Downloaded from
Page 16
16
DISCLOSURE
No potential conflicts of interest relevant to this article exist.
ACKNOWLEDGMENTS
We thank Susanne Henninger Abreu, Gabriele Kotzerke, Kathrin Rosenow, and Michael
Andreeff for their valuable support during the experiments.
by on January 25, 2020. For personal use only. jnm.snmjournals.org Downloaded from
Page 17
17
KEY POINTS
QUESTION: Can static 18F-FDG-PET/CT and analysis of standard uptake values (SUV) or
standard uptake ratios (SURstat) be used as alternative to Patlak- Ki values derived from dynamic
18F-FDG-PET/CT for quantification of regional lung inflammation in experimental acute
respiratory distress syndrome in pigs?
PERTINENT FINDINGS: An experimental study in fourteen anesthetized pigs suffering from
acute respiratory distress syndrome revealed a weak and a strong linear correlation between
SURstat and Ki at two separate imaging time points. The good SURstat-Ki–correlation can be
explained by the shape invariance of the arterial input function of 18F-FDG across all animals
and time points.
IMPLICATIONS FOR PATIENT CARE: The findings suggest that SURstat derived from static 18F-
FDG-PET/CT provides an alternative to dynamic 18F-FDG-PET/CT and Patlak-Ki analysis,
allowing the assessment of inflammation of whole lungs, repeated measurements within the
period of 18F-FDG decay, and faster data acquisition.
by on January 25, 2020. For personal use only. jnm.snmjournals.org Downloaded from
Page 18
18
REFERENCES
1. Bellani G, Laffey JG, Pham T, et al. Epidemiology, Patterns of Care, and Mortality for Patients With Acute Respiratory Distress Syndrome in Intensive Care Units in 50 Countries. JAMA. 2016;315:788-800.
2. Chen DL, Mintun MA, Schuster DP. Comparison of methods to quantitate 18F-FDG uptake with PET during experimental acute lung injury. J Nucl Med. 2004;45:1583-1590.
3. Musch G, Venegas JG, Bellani G, et al. Regional gas exchange and cellular metabolic activity in ventilator-induced lung injury. Anesthesiology. 2007;106:723-735.
4. Paquet N, Albert A, Foidart J, Hustinx R. Within-patient variability of (18)F-FDG: standardized uptake values in normal tissues. J Nucl Med. 2004;45:784-788.
5. van den Hoff J, Oehme L, Schramm G, et al. The PET-derived tumor-to-blood standard uptake ratio (SUR) is superior to tumor SUV as a surrogate parameter of the metabolic rate of FDG. EJNMMI Res. 2013;3:77.
6. Hofheinz F, Hoff J, Steffen IG, et al. Comparative evaluation of SUV, tumor-to-blood standard uptake ratio (SUR), and dual time point measurements for assessment of the metabolic uptake rate in FDG PET. EJNMMI Res. 2016;6:53.
7. van den Hoff J, Oehme L, Schramm G, et al. The PET-derived tumor-to-blood standard uptake ratio (SUR) is superior to tumor SUV as a surrogate parameter of the metabolic rate of FDG. EJNMMI research. 2013;3:77.
8. van den Hoff J, Lougovski A, Schramm G, et al. Correction of scan time dependence of standard uptake values in oncological PET. EJNMMI research. 2014;4:18.
9. Carlier T, Bailly C. State-Of-The-Art and Recent Advances in Quantification for Therapeutic Follow-Up in Oncology Using PET. Front Med (Lausanne). 2015;2:18.
10. Chen DL, Cheriyan J, Chilvers ER, et al. Quantification of Lung PET Images: Challenges and Opportunities. J Nucl Med. 2017;58:201-207.
11. Graham MM, Peterson LM, Hayward RM. Comparison of simplified quantitative analyses of FDG uptake. Nuclear Medicine and Biology. 2000;27:647-655.
12. Paquet N, Albert A, Foidart J, Hustinx R. Within-patient variability of (18)F-FDG: standardized uptake values in normal tissues. Journal of Nuclear Medicine: Official Publication, Society of Nuclear Medicine. 2004;45:784-788.
by on January 25, 2020. For personal use only. jnm.snmjournals.org Downloaded from
Page 19
19
13. Braune A, Scharffenberg M, Naumann A, Bluth T, de Abreu MG, Kotzerke J. Comparison of 68Ga- and fluorescence-labeled microspheres for measurement of relative pulmonary perfusion in anesthetized pigs. Nuklearmedizin Nuclear Medicine. 2018;57:100-107.
14. Glenny RW, Lamm WJ, Albert RK, Robertson HT. Gravity is a minor determinant of pulmonary blood flow distribution. Journal of Applied Physiology (Bethesda, Md: 1985). 1991;71:620-629.
15. Walther SM, Domino KB, Glenny RW, Hlastala MP. Pulmonary blood flow distribution in sheep: effects of anesthesia, mechanical ventilation, and change in posture. Anesthesiology. 1997;87:335-342.
by on January 25, 2020. For personal use only. jnm.snmjournals.org Downloaded from
Page 20
20
FIGURES WITH LEGENDS
Premedication, surgical preparation
Euthanasia, organ harvest
Induction of ARDS
8 h
Randomization
Start of therapy
2 h 22 h 2 h
PET/CT
ACCT Dynamic PET Static PET1 min 75 min 9 min
18F-FDG injection (190 ± 23 MBq)
PET/CT
ACCT Dynamic PET Static PET1 min 75 min 9 min
18F-FDG injection (206 ± 23 MBq)
Figure 1: Time course of interventions.
ACCT, CT-based attenuation correction; PET, positron emission tomography; CT, computed
tomography
by on January 25, 2020. For personal use only. jnm.snmjournals.org Downloaded from
Page 21
21
FoV of dynamic PET scan
Missing part in dynamic PET scan
0 2.7 0 2.3 0 2.3
Dynamic PET: Ki (102 mL/min/mL) Static PET: SUV Static PET: SUR3D
lu
ng
co
nto
ur
Bef
ore
24 h
ven
tila
tio
nA
fter
24
h v
enti
alti
on
Figure 2: 3D lung contour (upper line) and 2D transversal slices of one representative animal
obtained before (middle) and after 24 h of mechanical ventilation (lower line). 18F-FDG uptake
rate (Ki, left column) was derived by dynamic PET/CT, while SUV (central column) and SURstat
(right column) were derived from static PET/CT. The location of the 2D transversal slices is
shown in the 3D contours. Caudal lung regions that are not assessed by the dynamic PET scan
due to its limited field of view are highlighted in the 3D contours.
by on January 25, 2020. For personal use only. jnm.snmjournals.org Downloaded from
Page 22
22
Figure 3: Linear correlation between Ki and SUV obtained from PET/CT imaging data acquired
before (left) and after 24 h of mechanical ventilation (right) and divided in 5 iso-gravimetric
ventro(gravitational non-dependent)-dorsal (gravitational dependent) regions. Red lines
represent linear regression lines. Note the differing axis scales, for which slope and intercept are
specified.
by on January 25, 2020. For personal use only. jnm.snmjournals.org Downloaded from
Page 23
23
Figure 4: Linear correlation between Ki and SURstat obtained from PET/CT imaging data
acquired before (left) and after 24 h of mechanical ventilation (right) and divided in 5 iso-
gravimetric ventro(gravitational non-dependent)-dorsal (gravitational dependent) regions. Red
lines represent linear regression lines, for which slope and intercept are specified. Note the
differing axis scales.
by on January 25, 2020. For personal use only. jnm.snmjournals.org Downloaded from
Page 24
24
Figure 5: Linear correlation between changes in regional pulmonary uptake rates of 18F-FDG
(∆Ki) and SURstat (∆SURstat, left), and linear correlation between changes in regional Ki (∆Ki) and
SUV (∆SUV, right), induced by 24 h of mechanical ventilation in 14 animals and divided in 5 iso-
gravimetric ventro(gravitational non-dependent)-dorsal (gravitational dependent) regions. Red
lines represent linear regression lines, for which slope and intercept are specified.
by on January 25, 2020. For personal use only. jnm.snmjournals.org Downloaded from
Page 25
25
Figure 6: Arterial input function of 18F-FDG (A) and Patlak time Θ (B) at mean frame time points
of the dynamic PET scans. Courses are shown for 14 animals before (blue) and after 24 h of
mechanical ventilation (black). Red lines and error bars represent averages and standard
deviations of each frame. In A, interpolation was performed using the following power function:
A ∗ t .
by on January 25, 2020. For personal use only. jnm.snmjournals.org Downloaded from
Page 26
26
Figure 7: Regional volume of distribution (Vdist) of 14 animals before (left) and after (right) the
24 h period of mechanical ventilation.
by on January 25, 2020. For personal use only. jnm.snmjournals.org Downloaded from
Page 27
Supplemental Digital Content
Comparison of static 18F-FDG-PET/CT (SUV, SUR) and dynamic 18F-FDG-PET/CT (Ki) for quantification of pulmonary inflammation in acute lung injury
Anja Braune1,2, Frank Hofheinz3, Thomas Bluth1, Thomas Kiss1, Jakob Wittenstein1, Martin Scharffenberg1, Jörg Kotzerke2, Marcelo Gama de Abreu1
1Pulmonary Engineering Group, Department of Anesthesiology and Intensive Care Medicine, University Hospital Carl Gustav Carus at the Technische Universität Dresden, Dresden, Germany
2Department of Nuclear Medicine, University Hospital Carl Gustav Carus at the Technische Universität Dresden, Dresden, Germany
3Helmholtz-Zentrum Dresden-Rossendorf, PET Center, Institute of Radiopharmaceutical Cancer Research, Dresden, Germany
Corresponding Author / Reprint request: Anja Braune Department of Nuclear Medicine University Hospital Carl Gustav Carus at the Technische Universität Dresden Fetscherstr. 74 D-01307 Dresden Phone: +49 (0)351-458 12128 Fax: +49 (0)351-458 5310 E-mail: [email protected]
Short running title: 18F-FDG-PET/CT imaging in acute lung injury
by on January 25, 2020. For personal use only. jnm.snmjournals.org Downloaded from
Page 28
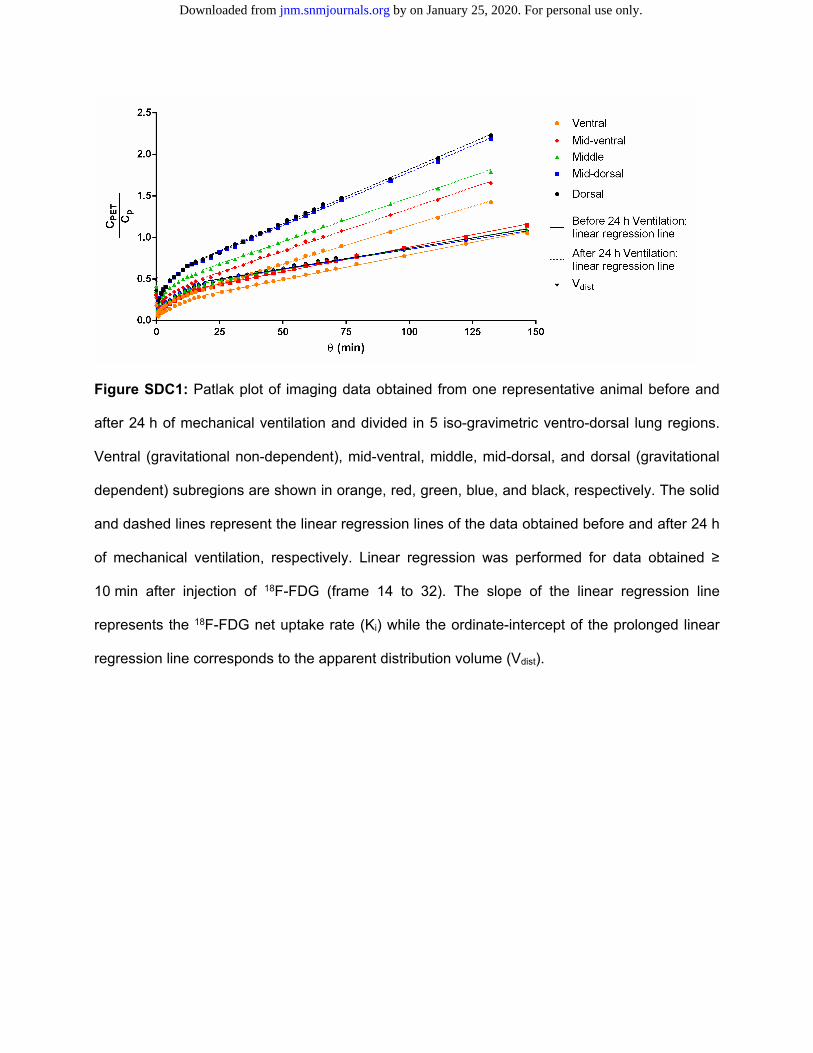
Figure SDC1: Patlak plot of imaging data obtained from one representative animal before and
after 24 h of mechanical ventilation and divided in 5 iso-gravimetric ventro-dorsal lung regions.
Ventral (gravitational non-dependent), mid-ventral, middle, mid-dorsal, and dorsal (gravitational
dependent) subregions are shown in orange, red, green, blue, and black, respectively. The solid
and dashed lines represent the linear regression lines of the data obtained before and after 24 h
of mechanical ventilation, respectively. Linear regression was performed for data obtained ≥
10 min after injection of 18F-FDG (frame 14 to 32). The slope of the linear regression line
represents the 18F-FDG net uptake rate (Ki) while the ordinate-intercept of the prolonged linear
regression line corresponds to the apparent distribution volume (Vdist).
by on January 25, 2020. For personal use only. jnm.snmjournals.org Downloaded from
Page 29
Figure SDC2: Linear correlation between Ki and SURstat obtained from PET/CT imaging data of 14 animals acquired before (black markers) and after 24 h mechanical ventilation (gray markers) and averaged over the whole field of view (15 cm craniao-caudal field of view). SURstat were obtained from the static PET/CT scans and analysis of the same 15 cm cranio-caudal field of view as used for the Patlak analysis. The red solid and dashed lines represent the linear regression lines of the data obtained before and after 24 h of mechanical ventilation, respectively.
by on January 25, 2020. For personal use only. jnm.snmjournals.org Downloaded from
Page 30
Figure SDC3: Linear correlation between Ki and SURdyn obtained from PET/CT imaging data of 14 animals acquired before (left) and after 24 h mechanical ventilation (right) and divided in 5 iso-gravimetric ventro-dorsal regions. Pulmonary uptake rates of 18F-FDG (Ki) were derived by dynamic PET scanning followed by Patlak analysis. SURdyn data were obtained from the dynamic PET scan and analysis of frame 29 – 32 acquired 40 min to 75 min post injection of 18F-FDG and analysis of the same 15 cm cranio-caudal field of view as used for the Patlak analysis. Ventral (gravitational non-dependent), mid-ventral, middle, mid-dorsal, and dorsal (gravitational dependent) subregions are shown in orange, red, green, blue, and black, respectively. The red lines represent the linear regression lines. Note the differing axis scales.
by on January 25, 2020. For personal use only. jnm.snmjournals.org Downloaded from
Page 31
Table 1: Hemodynamics, gas exchange and lung mechanics data.
Group BL 1 Injury BL 2 Time 1 Time 2 Time 3 Time 4
Group Effect Time*Group Effect
Hemodynamics
CO (l/min) nVCV 3.9 ± 0.8 6.7 ± 1.9 4.4 ± 0.3 6.3 ± 2.3 6.8 ± 2.0 6.9 ± 1.9 6.74 ± 1.70
n.s. n.s.
VCV 3.4 ± 0.6 5.6 ± 2.3 4.7 ± 1.5 5.5 ± 2.1 5.3 ± 0.5 6.4 ± 1.6 5.90 ± 0.76
n.s. n.s.
HF (min-1)
nVCV 105 ± 18 113 ± 27 100 ± 13 107 ± 20 109 ± 12 113 ± 8 107 ± 12 n.s. n.s. VCV 97 ± 13 107 ± 34 107 ± 22 106 ± 14 100 ± 14 111 ± 9 108 ± 12
n.s. n.s.
MAP (mmHg)
nVCV 64.7 ± 6.4 81.0 ± 8.7 77.6 ± 9.7 70.3 ± 10.3 70.4 ± 7.4 71.6 ± 9.5 71.1 ± 6.9 n.s. n.s. VCV 73.9 ± 14.5 80.1 ± 9.5 77.9 ± 13.3 72.3 ± 16.4 67.4 ± 9.4 68.9 ± 8.2 71.4 ± 8.6
n.s. n.s.
MPAP (mmHg)
nVCV 18.1 ± 3.6 31.7 ± 4.2 27.1 ± 3.6 26.6 ± 2.1 26.4 ± 4.9 26.4 ± 3.5 24.7 ± 4.2 n.s. n.s. VCV 18.9 ± 2.7 31.4 ± 4.5 31.7 ± 7.0 28.3 ± 5.2 28.7 ± 4.4 28.0 ± 2.0 27.3 ± 3.2
n.s. n.s.
Hct nVCV 0.27 ± 0.02 0.29 ± 0.05 0.29 ± 0.02 0.26 ± 0.03 0.25 ± 0.03 0.25 ± 0.04 0.25 ± 0.04 n.s. n.s. VCV 0.26 ± 0.03 0.27 ± 0.04 0.28 ± 0.04 0.26 ± 0.04 0.24 ± 0.03 0.24 ± 0.02 0.24 ± 0.03
n.s. n.s. Gas Exchange
PaO2 nVCV 600.6 ± 61.6 69.14 ± 16.22 86.86 ± 13.06 83.57 ± 17.82 82.29 ± 16.12 83.29 ± 14.04 87.86 ± 18.28 n.s. n.s. VCV 599.7 ± 60.2 64.43 ± 14.79 80.86 ± 6.26 75.71 ± 11.09 74.00 ± 9.83 77.57 ± 10.75 74.57 ± 8.98
n.s. n.s.
PaCO2 nVCV 47.7 ± 6.4 89.17 ± 10.42 87.71 ± 18.03 83.91 ± 11.24 81.63 ± 7.64 91.54 ± 10.41 95.74 ± 15.55 n.s. n.s. VCV 50.9 ± 5.8 88.49 ± 27.48 88.99 ± 19.89 80.41 ± 15.14 80.41 ± 15.62 86.73 ± 19.34 84.20 ± 10.36
n.s. n.s.
PaO2/ FiO2
nVCV 600.6 ± 61.6 69.1 ± 16.2 202.6 ± 81.7 214.2 ± 79.4 220.0 ± 222.6 ± 74.4 228.3 ± 85.6
n.s. n.s. VCV 599.7 ± 60.2 64.4 ± 14.8 158.2 ± 42.0 167.6 ± 32.5 189.4 ± 198.4 ± 47.7 190.4 ± 41.8
n.s. n.s.
pH nVCV 7.4 ± 0.0 7.23 ± 0.06 7.26 ± 0.08 7.30 ± 0.06 7.33 ± 0.06 7.32 ± 0.06 7.30 ± 0.07 n.s. n.s. VCV 7.4 ± 0.0 7.25 ± 0.11 7.22 ± 0.08 7.30 ± 0.05 7.32 ± 0.04 7.34 ± 0.05 7.35 ± 0.05
n.s. n.s.
Tempe-rature
nVCV 37.8 ± 0.9 37.99 ± 0.68 38.63 ± 1.19 38.89 ± 0.62 38.23 ± 0.56 38.66 ± 0.34 38.81 ± 0.40 n.s. n.s. VCV 37.6 ± 0.6 37.71 ± 0.83 38.13 ± 1.02 38.39 ± 0.82 37.93 ± 0.45 38.43 ± 0.37 38.41 ± 0.34
n.s. n.s.
by on January 25, 2020. For personal use only. jnm.snmjournals.org Downloaded from
Page 32
Group BL 1 Injury BL 2 Time 1 Time 2 Time 3 Time 4
Group effect Time* Group effect
Lung Mechanics VT (mL/kg) nVCV 6.4 ± 0.1 6.4 ± 0.1 6.5 ± 0.0 6.2 ± 0.5 6.2 ± 0.5 6.1 ± 0.6 6.0 ± 0.5 n.s. n.s.
VCV 6.5 ± 0.2 6.6 ± 0.2 6.8 ± 0.9 6.4 ± 0.4 6.4 ± 0.5 6.5 ± 0.4 6.6 ± 0.2 n.s. p=0.009 RR (min-1)
nVCV 33.6 ± 2.5 33.6 ± 2.5 35.1 0.1 28.3 ± 7.2 27.5 ± 8.1 25.3 ± 8.6 26.0 ± 9.3 n.s. n.s. VCV 33.6 ± 2.5 33.6 ± 2.5 35.1 0.0 32.9 ± 2.7 29.3 ± 6.1 27.9 ± 5.7 26.4 ± 5.6
n.s. n.s. MV (l/min)
nVCV 7.9 ± 0.6 7.9 ± 0.6 8.3 0.7 6.2 ± 1.4 6.0 ± 1.6 5.4 ± 1.5 5.5 ± 1.5 n.s. n.s. VCV 7.6 ± 0.7 7.6 ± 0.6 8.2 0.9 7.3 ± 0.6 6.4 ± 0.8 6.1 ± 1.4 5.8 ± 1.5
n.s. n.s. RRS (cmH2O l-1/s)
nVCV 7.3 ± 0.6 10.7 ± 2.0 7.4 0.3 8.2 ± 0.6 9.1 ± 1.1 9.8 ± 2.1 10.7 ± 4.2 n.s. n.s. VCV 7.6 ± 1.1 10.0 ± 1.6 8.5 ± 1.9 7.9 ± 0.6 8.4 ± 2.1 9.4 ± 2.2 9.6 ± 2.4
n.s. n.s. ERS (cmH2O l-1)
nVCV 24.1 ± 2.7 81.2 ± 7.0 69.2 12.4 74.6 ± 21.6 74.1 ± 23.7 71.3 ± 22.6 70.1 ± 23.2 n.s. n.s. VCV 23.6 ± 4.3 67.7 9.8 69.1 ± 8.8 79.3 ± 13.5 78.0 ± 14.4 74.6 ± 11.1 71.0 ± 10.2
p=0.018 p=0.805 Pmax (cmH2O)
nVCV 21.0 ± 0.7 34.4 ± 2.4 27.6 ± 4.2 27.1 ± 5.2 27.6 ± 6 26.8 ± 5 27.2 ± 4.7 n.s. n.s. VCV 20.9 ± 0.7 31.1 ± 2.6 30.5 ± 3.6 29.1 ± 3.9 28.1 ± 2.3 28 ± 2.5 26.6 ± 2.4
p=0.048 n.s. Pmean (cmH2O)
nVCV 14.0 ± 0.2 19.2 ± 0.8 15.5 ± 3.2 14.2 ± 2.7 14.4 ± 3.5 13.8 ± 3.1 14.0 ± 3.2 n.s. n.s. VCV 14.0 ± 0.3 17.9 ± 0.9 17.6 ± 3.1 15.9 ± 2.8 15.3 ± 2.2 15.2 ± 2.1 13.9 ± 1.7
p=0.026 n.s. Pplat (cmH2O)
nVCV 17,4 0.7 30.8 2.3 25.6 4.3 24.6 5.2 24.7 7.0 23.5 6.1 23.4 6.2 n.s. n.s. VCV 17,3 0.6 27.0 2.3 27.8 4.8 27.1 4.2 25.7 3.4 25.2 3.1 23.6 3.0
p=0.018 n.s. PEEP (cmH2O)
nVCV 10.0 ± 0.0 9.8 ± 0.2 7.7 ± 2.9 6.2 ± 1.5 6.3 ± 62 5.8 ± 1.9 6.2 ± 2.0 n.s. n.s. VCV 10.0 ± 0.0 9.8 ± 0.2 9.7 ± 2.8 7.6 ± 2.0 6.9 ± 1.9 6.7 ± 1.9 5.6 1.5
n.s. n.s. Values are given as mean and standard deviation. Differences between and within groups were tested with general linear model statistics with BL 2 as covariate. Differences between groups at time point Injury and Time 4, respectively, were tested with Mann-Whitney-U tests and are specified in the respective columns. Statistical significance was accepted at p<0.05. BL1/2, Baseline 1/2; nVCV, volume controlled ventilation with variable tidal volumes; VCV, volume controlled ventilation with non-variable tidal volume; CO, cardiac output; HR, heart rate; MAP, mean arterial blood pressure; MPAP, mean pulmonary arterial blood pressure; Hct, hematocrit; PaO2, arterial partial pressure of oxygen; FiO2, fraction of inspired oxygen; PaCO2, arterial partial pressure of carbon dioxide; VT, tidal volume; RR, respiratory rate; MV, minute ventilation; RRS, resistance of the respiratoy system; Pmax, maximal airway pressure; Pmean, mean airway pressure; PEEP, positive end-expiratory pressure; n.s., no significance.
by on January 25, 2020. For personal use only. jnm.snmjournals.org Downloaded from
Page 33
Doi: 10.2967/jnumed.119.226597Published online: May 3, 2019.J Nucl Med. Marcelo Gama de AbreuAnja Braune, Frank Hofheinz, Thomas Bluth, Thomas Kiss, Jakob Wittenstein, Martin Scharffenberg, Joerg Kotzerke and for quantification of pulmonary inflammation in acute lung injury
F-FDG-PET/CT (Ki)18F-FDG-PET/CT (SUV, SUR) and dynamic 18Comparison of static
http://jnm.snmjournals.org/content/early/2019/05/03/jnumed.119.226597This article and updated information are available at:
http://jnm.snmjournals.org/site/subscriptions/online.xhtml
Information about subscriptions to JNM can be found at:
http://jnm.snmjournals.org/site/misc/permission.xhtmlInformation about reproducing figures, tables, or other portions of this article can be found online at:
and the final, published version.proofreading, and author review. This process may lead to differences between the accepted version of the manuscript
ahead of print area, they will be prepared for print and online publication, which includes copyediting, typesetting,JNMcopyedited, nor have they appeared in a print or online issue of the journal. Once the accepted manuscripts appear in the
. They have not beenJNM ahead of print articles have been peer reviewed and accepted for publication in JNM
(Print ISSN: 0161-5505, Online ISSN: 2159-662X)1850 Samuel Morse Drive, Reston, VA 20190.SNMMI | Society of Nuclear Medicine and Molecular Imaging
is published monthly.The Journal of Nuclear Medicine
© Copyright 2019 SNMMI; all rights reserved.
by on January 25, 2020. For personal use only. jnm.snmjournals.org Downloaded from