COMPARISON OF THE CHEMICAL COMPOSITION OF AQUEOUS HUMOR, CEREBROSPINAL FLUID, LYMPH, AND BLOOD FROM FROGS, HIGHER ANIMALS, AND MAN REDUCING SUBSTANCES, INORGANIC PHOSPHATE, URIC ACID, UREA* BY ARTHUR M. WALKER WITH THE ASSISTANCE OF E. H. ELLINWOOD (From the Laboratory of Pharmacology, University of Pennsylvania, Philadelphia) (Received for publication, February 28, 1933) In the course of the quantitative studies of glomerular urine which have long been in progress in this laboratory, analytical methods requiring exceedingly minute amounts of fluid have been developed for a number of constituents of blood and urine. It seemed important to extend the application of these methods to certain other body fluids for the sake not only of the information which might be gained, but also of the influence which the results might have upon the credibility of the analyses of fluid from single renal units. The fluids chosen for study are lymph, cerebrospinal fluid, and aqueous humor. The analyses to which they have been sub- jected include determination of reducing substances, inorganic phosphate, uric acid, and urea. The results of analyses of lymph and cerebrospinal fluid of frogs were quite in accord with those of the majority of investigators who have analyzed these fluids in mammals. In the case of the aqueous humor of frogs, however, our results were so at variance with accepted ideas of the com- * The expenses of this investigation were defrayed in large part from a grant by the Commonwealth Fund. A preliminary report of these experi- ments was made before the American Society of Biological Chemists at Philadelphia, April 29, 1932 (J. Biol. Chem., 9’7, lxxii (1932)). 269 by guest on May 7, 2018 http://www.jbc.org/ Downloaded from
Transcript
COMPARISON OF THE CHEMICAL COMPOSITION OF AQUEOUS HUMOR, CEREBROSPINAL FLUID, LYMPH,
(From the Laboratory of Pharmacology, University of Pennsylvania, Philadelphia)
(Received for publication, February 28, 1933)
In the course of the quantitative studies of glomerular urine which have long been in progress in this laboratory, analytical methods requiring exceedingly minute amounts of fluid have been developed for a number of constituents of blood and urine. It seemed important to extend the application of these methods to certain other body fluids for the sake not only of the information which might be gained, but also of the influence which the results might have upon the credibility of the analyses of fluid from single renal units.
The fluids chosen for study are lymph, cerebrospinal fluid, and aqueous humor. The analyses to which they have been sub- jected include determination of reducing substances, inorganic phosphate, uric acid, and urea. The results of analyses of lymph and cerebrospinal fluid of frogs were quite in accord with those of the majority of investigators who have analyzed these fluids in mammals. In the case of the aqueous humor of frogs, however, our results were so at variance with accepted ideas of the com-
* The expenses of this investigation were defrayed in large part from a grant by the Commonwealth Fund. A preliminary report of these experi- ments was made before the American Society of Biological Chemists at Philadelphia, April 29, 1932 (J. Biol. Chem., 9’7, lxxii (1932)).
position of this fluid that the observations were extended to the aqueous humor of higher animals and man with results which con- firmed the findings upon frogs. Despite the fact that the study has been restricted to the four substances mentioned above, the results make it appear extremely unlikely that either cerebrospinal fluid or aqueous humor is formed by purely physical processes of filtration or dialysis.
Analytical Methods
The ultramicrocolorimetric technique described by Richards, Bordley, and Walker (1) was employed in the determinations of reducing substances (2), inorganic phosphate (3)) and uric acid (4). Approximately 0.2 c.mm. of fluid was used in each determination and all determinations were made in duplicate. The low protein content of cerebrospinal fluid and aqueous humor of frogs, higher animals, and man made routine deproteinization for the phosphate analysis unnecessary. Frog lymph was analyzed in the same way as frog plasma. In the phosphate analyses of mammalian blood plasma, the quantity of trichloroacetic acid used in deproteiniza- tion was double that used in frog plasma; in the sugar determina- tions mammalian plasma was subjected to preliminary dilution with 1 volume of 0.9 per cent sodium chloride. The accuracy of these micromethods, as described in the original papers, approaches closely that of the macromethods in common use. In seven of the experiments upon the reducing substances in mammalian aqueous humor, in addition to the micromethod (a), analyses by the Hagedorn-Jensen method (5) were made by Dr. B. B. Westfall of this laboratory. All but two of the urea determinations were made by the aeration-titration method of Van Slyke and Cullen (6), with 1.0 cc. of aqueous humor and plasma in the experiments upon dogs, 0.5 cc. in those on rabbits; in five experiments the analyses were made by Dr. K. A. Elsom of this laboratory; in the two instances specified in Tables IV and V the amount of dixan- thydrolurea precipitated by centrifugalization of 0.6 c.mm. of fluid and 0.7 c.mm. of glacial acetic acid and xanthydrol in a small glass capillary tube was taken as a measure of the amount of urea present; to these two analyses less weight need be given than to the other urea analyses.
Lymph-O.01 to 0.02 cc. of lymph was collected from the web of a frog’s foot by inserting the finely drawn tip of a glass capil- lary pipette into the lymph vessel at the margin of one of the toes. The fluid was clear, colorless, and devoid of red blood corpuscles. It was obtained within 1 to 4 minutes after blood had been collected by cardiac puncture, and contained about half as much protein as the plasma..
Cerebrospinal Fluid-The experiments were performed between November, 1931, and April, 1932, upon healthy Rana pipiens. Cerebrospinal fluid was collected from the cisterna magna by pushing the finely drawn tip of a Pyrex glass capillary pipette (0.6 mm. internal diameter) through the atlanto-occipital liga- ments. An oval section of skin and the vertebral muscles imme- diately above the site of puncture were removed by cautery before the collection was mndc. When the pipette point entered the cistern about 0.02 cc. of clear, colorless fluid rose in the pipette. This amount would have been sufficient for more than a dozen analyses with the technique employed. The collection was finished within from 30 seconds to 2 minutes after the frog was removed from the cage; within 1 or at most 2 minutes thereafter the skull was crushed by hemostatic forceps, the chest wall opened, and a specimen of blood obtained by cardiac puncture.l It is believed that these time relations, and those observed in the collec- tion of aqueous humor, were such as to obtain normal plasma sugar values and to avoid the fictitious differences between these fluids and plasma which might have been caused by delaying the blood collection.
Aqueous Humor-The brain was crushed and blood collected by cardiac puncture within 35 to 90 seconds after the animal was removed from the cage.2 When venous blood was used it was
1 In Experiments 15, 20, 23, and 24 of Table I, the interval between col- lection of cerebrospinal fluid and plasma slightly exceeded 2 minutes. A 45 minute interval in Experiments 12, 17, 18, and 20 of Table II was considered relatively unimportant because of the stability of phosphate concentration in the blood of pithed frogs (3).
2 In experiments where cerebrospinal fluid also was collected, the cardiac puncture was delayed about 1 minute.
obtained from the posterior vena cava. Within 30 seconds there- after the aqueous humor was collected in a pipette similar to that employed for lymph and cerebrospinal fluid. Its tip was thrust through the cornea into the anterior chamber of the eye, the angle and depth of the thrust being so directed as to avoid the lens. As soon as the point penetrated the cornea about 0.01 cc. of clear, colorless fluid entered the pipette, which was then with- drawn; about 0.02 cc. was left in the anterior chamber.
Healthy Higher Animals
Aqueous Humor-With exception of the rabbits of Experiments 7, 9, and 10 (Table IV), the animals had not been fed for at least 12 hours before the experiment. In six instances they were anesthetized with barbital before collections of blood and aqueous humor were made; in twenty-five instances venipuncture was per- formed without anesthesia, as speedily and with as little disturb- ance of the animal as possible. Oxalated plasma or serum was used for the analyses. Aqueous humor was collected immediately following venipuncture and after cocainization of the cornea in the unanesthetized animals. When macroanalyses were to be made, the cornea was punctured by the sharp point of a glass pipette and the anterior chamber rapidly evacuated; about 0.6 cc. could be obtained from each eye of a dog, about 0.25 cc. from each eye of a rabbit. When only microanalyses were to be made, 0.02 cc. was collected in the manner described for frogs.
Man
Aqueous Humor-The practicability of these experiments was suggested by Dr. James Bordley, 3rd. Four specimens of aqueous humor were obtained for us by Dr. Francis H. Adler in the course of preliminary iridectomies for cataract at the Wills Eye Hospital. The patients had not been fed for at least 6 hours previous to the operation and no general anesthetic was used. The pathological condition of the lens was believed to be the only abnormality. The volume of each specimen was approximately 0.02 cc. In addition to the analyses for reducing substances and phosphates which were made upon all, two of the specimens were analyzed for uric acid by Dr. Bordley, and one of these for urea by the xanthydrol method. The comparisons were made against serum
obtained by venipuncture within 5 minutes of the time of aqueous humor collection, and against protein-free ultrafiltrates subse- quently prepared from these sera by means of cellophane mem- branes. Analyses were begun within 1 hour after the collections were finished.
Depancreatized Dogs
Cerebrospinal Fluid and Aqueous Humor-Dr. I. S. Ravdin of the Department of Surgical Research removed the pancreas from each of three dogs under amytal anesthesia. No insulin was given and the animals died within 90 hours. 48 and 72 hours after operation, specimens of venous blood, cerebrospinal fluid, and aqueous humor were collected for ultramicroanalysis. The first specimen of aqueous humor was collected from the left, the second from the right eye. Blood and aqueous humor were taken before the brief period of ether anesthesia which was usually required for the collection of cerebrospinal fluid.
RESULTS
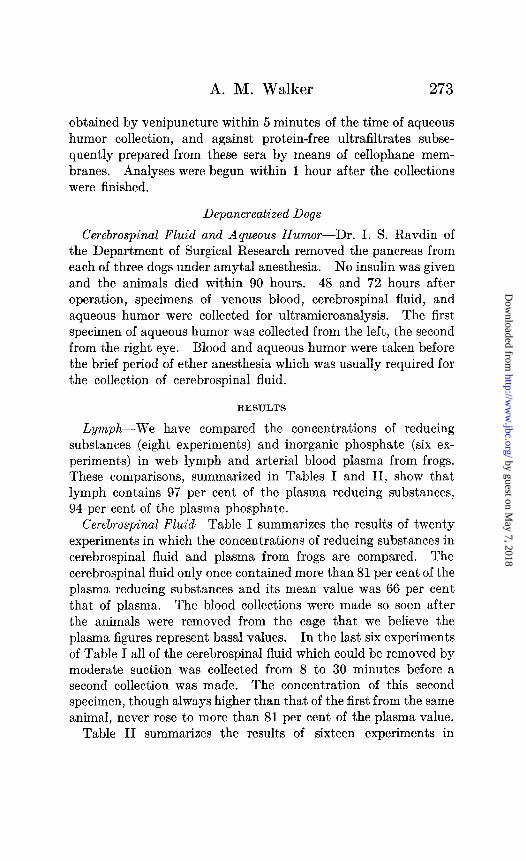
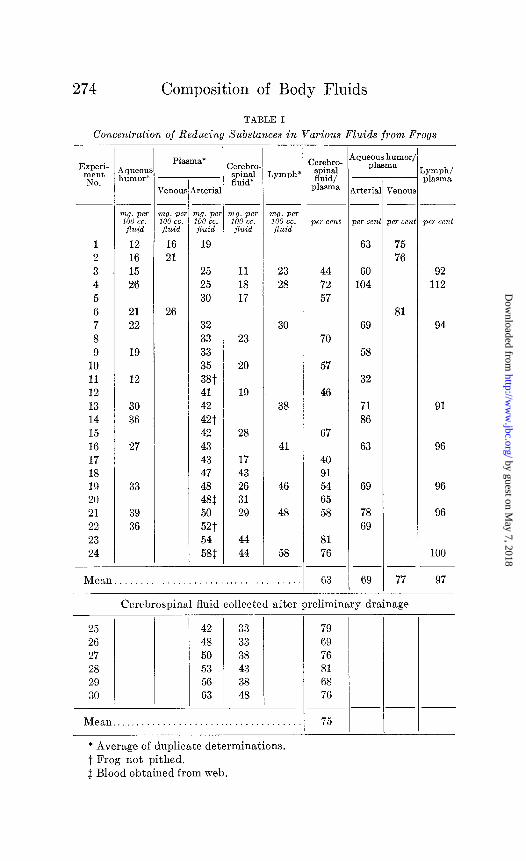
Lymph-We have compared the concentrations of reducing substances (eight experiments) and inorganic phosphate (six ex- periments) in web lymph and arterial blood plasma from frogs. These comparisons, summarized in Tables I and II, show that lymph contains 97 per cent of the plasma reducing substances, 94 per cent of the plasma phosphate.
Cerebrospinal Fluid-Table I summarizes the results of twenty experiments in which the concentrations of reducing substances in cerebrospinal fluid and plasma from frogs are compared. The cerebrospinal fluid only once contained more than 81 per cent of the plasma reducing substances and its mean value was 66 per cent that of plasma. The blood collections were made so soon after the animals were removed from the cage that we believe the plasma figures represent basal values. In the last six experiments of Table I all of the cerebrospinal fluid which could be removed by moderate suction was collected from 8 to 30 minutes before a second collection was made. The concentration of this second specimen, though always higher than that of the first from the same animal, never rose to more than 81 per cent of the plasma value.
Table II summarizes the results of sixteen experiments in
which the inorganic phosphate content of cerebrospinal fluid and plasma from frogs are compared. In the first twelve experiments, where the plasma concentration ranged from 1.5 to 5.1 mg. per 100 cc., the cerebrospinal fluid phosphate never exceeded 1.6 mg. per 100 cc. and averaged 37 per cent of the plasma value. In the last four experiments, where the plasma concentration had been raised by the subcutaneous injection of a phosphate solution 1 to 2 hours before the experiment, the value of the cerebrospinal fluid remained below 1.4 mg. per 100 cc.
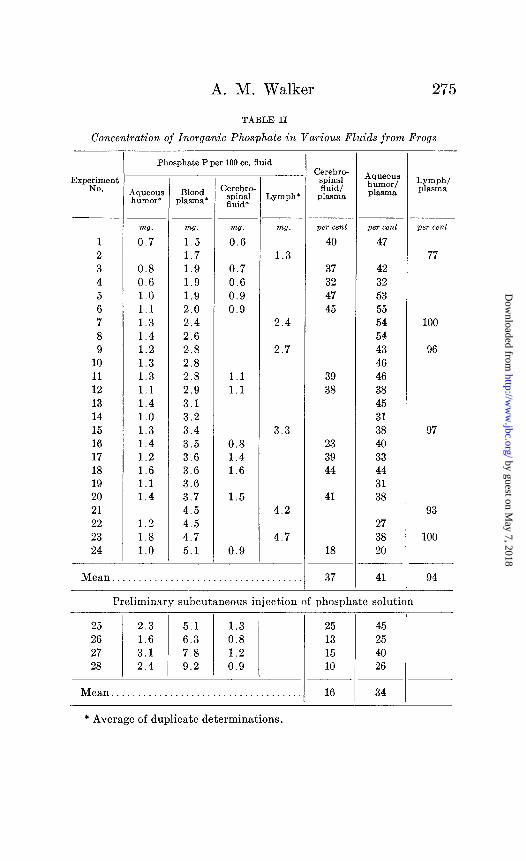
Table III summarizes the results of five experiments upon three depancreatized dogs in which the serum concentration of reducing
TABLE III
Concentration of Reducing Substances and Inorganic Phosphate in Various Fluids from Depancreatized Dogs
substances lay between 351 and 520 mg. per 100 cc. In cere- brospinal fluid the reducing substances, though far above normal, never amounted to more than 64 per cent of the serum concen- tration. The inorganic phosphate of cerebrospinal fluid never amounted to more than 40 per cent of that of the serum, the con- centration in both fluids remaining at a normal level.
Aqueous Humor. (a) Frog-The reducing substances of aqueous humor were compared with those of blood in fifteen experiments (Table I). In twelve instances, in which the comparison was with arterial blood, the mean aqueous humor value was 69 per cent of that of plasma. In three instances, in which the com- parison was with venous blood, the mean aqueous humor value
was 77 per cent of that of plasma. Here, as in the experiments upon cerebrospinal fluid, we believe the plasma sugar was at basal level.
The inorganic phosphate concentration of aqueous humor was similarly compared with arterial blood plasma in twenty-six experiments (Table II). The average concentration of the aque- ous humor was 40 per cent of that of blood. With respect then to both inorganic phosphate and reducing substances, the com- position of frog aqueous humor is nearly identical with that of cerebrospinal fluid. In the four instances of Table II (Experi- ments 25 to 28), in which ‘the blood level was raised by preliminary subcutaneous injection of phosphate solution, the aqueous humor concentration, unlike that of cerebrospinal fluid, increased to maintain its usual relationship to plasma.
In eight frogs we have evacuated one eye as completely as possible from two to five times within 60 minutes, and made phosphate analyses upon the series of aqueous humors thus ob- tained. The protein content of the successive specimens in- creased from approximately 2 to 50 per cent of the plasma speci- men taken at the end of the experiment and they occasionally contained a few red blood corpuscles. The phosphate concen- tration of the specimens always rose, but, despite the pathological increase in capillary permeability” indicated by the protein changes, that of the final specimen averaged only 69 per cent of the plasma.
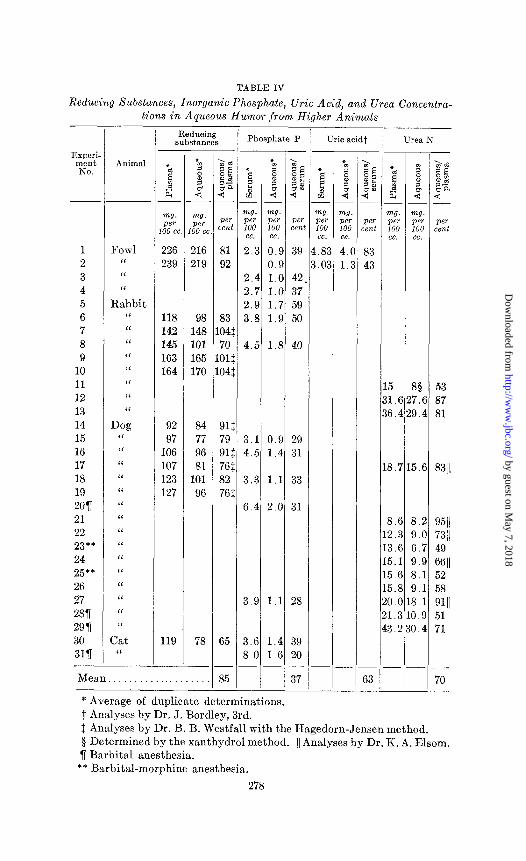
(b) Fowls, Rabbits, Dogs, and Cats-The composition of aqueous humor and that of blood from thirty-one animals have been compared in the experiments summarized in Table IV.
The mean concentration of reducing substances in the aqueous humor in fourteen experiments was 85 per cent of that in blood plasma. This difference between the two fluids is less marked than that which was found in frogs, and has less significance
because the plasma concentrations were not certainly at basal
3 In a few experiments we attempted to avoid a decrease in intraocular pressure by the injection of mineral oil simultaneously with the withdrawal of aqueous humor. The experiments were technically unsatisfactory and the specimens of aqueous humor continued to show abnormally large amounts of protein.
Reducing Substances, Inorganic Phosphate, Uric Acid, and Urea Concentra-
tions in Aqueous Humor from Higher Animals
4 2 2
m!J. Per 00 cc
226 239
118 142 145 163 164
1
1 Fowl 2 I‘
3 “
4 ‘I
5 Rabbit 6 “
7 I‘
8 “
9 “
10 “
11 “
12 “
13 “
14 Dog 15 “
16 “
17 “
18 “
19 “
ZOog I‘
21 “
22 “
23** “
24 I‘
25** I‘
26 “
27 “
28lT ‘I
298 “
30 Cat
3llT “
-
Mean. .
92 97
106 107 123 127
119
Reducing substances
*m s d 2
w?. Per
‘00 cc
216 219
:.
98 83 148 04: 101 70 165 01; 170 04:
84 91: 77 79 96 914 81 761
101 82 96 763
78 I
I -
i Phosphate P i Uric scidt
i :
cl - m
E CL
2
2 2 2 3
4
3 8 -
“m g d
z
m7. Per 100 cc.
0.S 0.C 1.c 1.C 1.: 1.5
1.8
0.E 1.4
1.1
2.c
1.1
1.4 l.E
Per ceni
39
42 37 59 50
40
29 31
33
31
28
39 20
37
* Average of duplicate determinations.
/
.
1. r 0 <
.O
.3
P@ :ent
83 43
63 -
Urea N
8s 7.t 9.1
53 87 81
3.i ‘1 5.t 8311
3.t i a.: , 3.e i
5.1 5.E i 5.E i 3.C 11
1.3 ; 11
3.: ! 3’
8.: 9.c 6.: 9.! 8.1 9.1 8.: O.! 0.i
WI 7311
El, 52 58
9111 51 71
t Analyses by Dr. J. Bordley, 3rd. 3 Analyses by Dr. B. B. Westfall with the Hagedorn-Jensen method. § Determined by the xanthydrol method. I[ Analyses by Dr. K. A. Elsom. 7 Barbital anesthesia.
level.4 Some species difference apparently existed among the various animals; for, while three of the five rabbits showed an equilibrium between the two fluids, two rabbits, two fowls, six dogs, and one cat showed less reducing substances in aqueous humor than in plasma. In the seven experiments where both the Hagedorn-Jensen method and ultramicrotechnique were em- ployed, the results of the two agreed.
The inorganic phosphate concentration of aqueous humor, determined in fourteen experiments, avera,ged only 37 per cent of that of serum. This difference between the two fluids was marked in all four species and was of the same order as that discovered in frogs.
Uric acid analyses were made upon the aqueous humor and serum of two fowls by Dr. James Bordley, 3rd. In both cases the aqueous humor value was well below that of the serum, though there were considerable differences in the degree of this deficiency.
The mean urea concentration of aqueous humor in ten dogs and three rabbits was only 70 per cent of that in plasma. With the exception of a single animal (Experiment 21) in which the plasma value was abnormally low, the difference between the two fluids from dogs was always considerable and beyond the limit of ex- perimental error; it was somewhat more marked in the four animals which were anesthetized. In only two inst,ances was the plasma value above 20 mg. per 100 cc. of urea nitrogen. We place less reliance upon the rabbit experiments because the two macroanalyses were made with 0.5 cc. of fluid, the plasma values were both above 30 mg. per 100 cc., and the third analysis was made by the xanthydrol method.
(c) Depancreatized Dogs-The results of six experiments are summarized in Table III. The mean value of the reducing sub- stances in aqueous humor was 88 per cent of that in blood serum. They were far above normal and far above those of the cerebro- spinal fluid specimens simultaneously obtained. In view of the rising level of the reducing substances in blood and the presumably slow formation of aqueous humor, the significance of this rather
4 The rabbits of Experiments 7, 9, and 10 had access to food a short time before the fluids were collected. The high concentration of reducing sub- stances in fowl blood is apparently normal for these animals (7).
small difference between the two fluids may be doubted. In terms of absolute amounts, however, it is still considerable and, like the difference between aqueous humor and plasma of normal dogs, would be nearly doubled were the relative water content of the two fluids taken into consideration.
The phosphate concentration of the aqueous humor in these experiments was only 44 per cent of that of serum, a relationship similar to that existing between the two fluids in normal dogs.
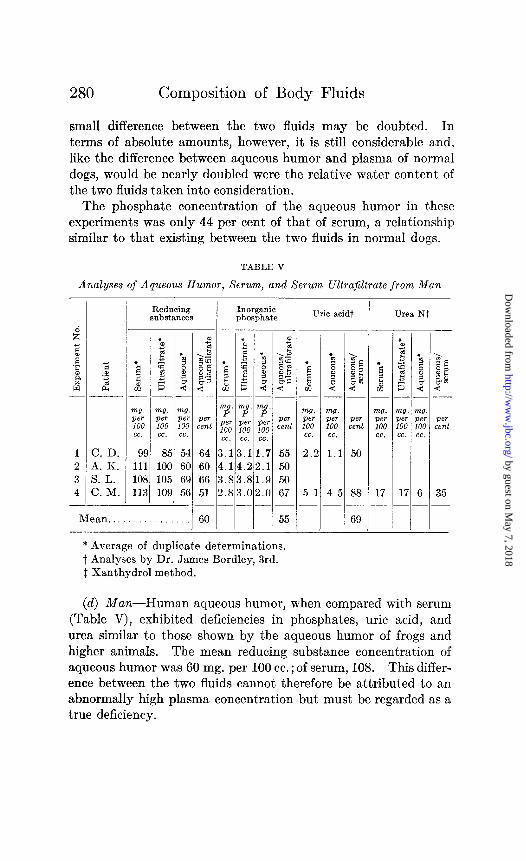
TABLE V
Analyses of Aqueous Humor, Serum, and Serum Ultrajiltrate from Man
* Average of duplicate determinations. t Analyses by Dr. James Bordley, 3rd. 1 Xanthydrol method.
(d) Man-Human aqueous humor, when compared with serum (Table V), exhibited deficiencies in phosphates, uric acid, and urea similar to those shown by the aqueous humor of frogs and higher animals. The mean reducing substance concentration of aqueous humor was 60 mg. per 100 cc.; of serum, 108. This differ- ence between the two fluids cannot therefore be attributed to an abnormally high plasma concentration but must be regarded as a true deficiency.
Lymph-The work of Starling (8) and of Landis (9) gives us every reason to believe that lymph derives from blood plasma by filtration through the capillary wall. The concentration of re- ducing substances and inorganic phosphates of the two fluids should therefore be identical if these substances exist in filtrable form. Arnold and Mendel (10) have already demonstrated the existence of such an equilibrium between lymph from the thoracic duct and blood serum in dogs. Our demonstration of a similar equilibrium in frogs is thus of only minor and confirmatory in- terest; it may have some slight theoretical advantage in that the lymph was collected from peripheral channels rather than from the thoracic duct. In view of work performed in this laboratory upon glomerular function, the demonstration of this equilibrium between frog lymph and plasma has the effect of confirming the reliability of the analytical methods for body fluids, and of pro- viding a parallel for the similar equilibrium which has been demon- strated between glomerular fluid and plasma (2, 3).
Cerebrospinal Fluid-The early belief that cerebrospinal fluid was elaborated by secretory activity of the choroid plexus was based on histological demonstration of changes in the epithelial cells of this plexus (ll), and on changes in cerebrospinal fluid pressure following the administration of drugs (12). Neither type of evidence is sufficiently unequivocal to determine whether the process in the choroid plexus is one of secretion or of filtration (13, 14). Direct chemical comparison between cerebrospinal fluid and blood should yield more decisive evidence and a large number of such comparisons for higher animals and man may be found in the literature. The most complete of these has been published by Fremont-Smith et al. (15). The numerous investi- gators agree that, though the total molecular concentration of the two fluids is similar,5 there is marked disparity in the concentration of individual constituents. This has not led to the conclusion that
6 The similarity in freezing point determinations is taken by Fremont- Smith and coworkers (16) as positive evidence that cerebrospinal fluid is a filtrate of plasma. If this were the case, both gastric fluid (17) and hepatic bile (18) would have to be accepted as filtrates.
oerebrospinal fluid is a product of secretion. There has been an inclination to explain the discrepancies on the basis of such phys- ical determinants as Donnan’s equilibrium and to coSnclude that the fluid is formed by simple filtration (19). These explanations are not altogether satisfactory, for they do not explain the dis- paraties in urea, uric acid, and non-protein nitrogen which have been described by Cockrill (20) and others (15, 21, 22). They appear unable to explain the results of our determinations of reducing substances and phosphates.
This discrepancy in reducing substances between the cerebro- spinal fluid and blood plasma of frogs (Table I) has been repeatedly demonstrated in higher animals and man. But, in the case of mammals it has been explained on these bases: (1) a portion of the plasma sugar (the non-fermentable reducing substances) was not in filtrable form, or (2) a portion of the plasma sugar was utilized by the brain tissue before the cerebrospinal fluid was col- lected. In our experiments these explanations do not apply. Frog plasma contains only about 5 mg. per 100 cc. of non-fer- mentable reducing substances and all of the plasma sugar must be in filtrable form since it all appears in an in vitro ultrafiltrate, in the web lymph, and in the glomerular urine (2) of intact frogs; it should, therefore, all appear in the cerebrospinal fluid if un- modified filtration through similar membranes occurs. The failure of cerebrospinal fluid sugar to approximate the plasma level after preliminary cisternal drainage (Table I, Experiment,s 25 to 30) argues against the sugar utilization hypothesis which is finally rendered untenable by the demonstration that this deficiency is maintained in depancreatized dogs (Table III) whose sugar utili- zation must be great,ly diminished or abolished (23, 24).
The demonstration that frog cerebrospinal fluid contains but 40 per cent of the inorganic phosphate of blood plasma (Table II) again merely reflects what has been repeatedy found in mammals (15, 25-27). This discrepancy is the opposite of what would be expected if the Donnan equilibrium determined phosphate dis- tribution. It cannot, in the case of the frog, be due to incomplet,e filtrability for all of the plasma phosphate appears in in vitro ultrafiltrates of frog plasma, and in the web lymph and glomerular urine of intact frogs (3). In view of the deficiency in depan- creatized dogs (Table III), it cannot be explained as an incident
of carbohydrate metabolism. The cerebrospinal fluid phosphate remains low when the plasma concentration is raised by the sub- cutaneous injection of a phosphate solution (Table II, Experiments 25 to 28).
In view of these observations upon frogs and depancreatized dogs, we must conclude that the choroid plexus is partially im- permeable to reducing substances and inorganic phosphate.
Aqueous Humor-The difficulty of collecting sufficient aqueous humor for analysis by the ordinary macrochemical methods prob- ably explains the paucity of information concerning its composition. There have been no analyses of human aqueous humor excepting the sugar determinations of Ask (28). The most inclusive piece of work on the subject, regarded as expressing the “modern view” in this country and England, is that reported by Duke-Elder in 1927 (29). He collected a large pooled specimen of aqueous humor from a group of freshly killed horses and compared it with a speci- men of ‘%ypical” horse serum obtained from the farm of the Medi- cal Research Council. When allowance was made for minor dis- crepancies, he felt justified in concluding that aqueous humor was formed from plasma by simple dialysis. Specifically, and in so far as the four substances under present discussion are concerned, his analyses gave the following results.
There is no further record in the literature of the urea or uric acid content of aqueous humor. Duke-Elder confirmed his view of the equilibrium in reducing substances by three experiments upon rab- bits in which specimens of aqueous humor and venous and arterial blood were taken from each animal and their concentration deter- mined by the Hagedorn-Jensen method. The average concen- tration of aqueous humor was 151 mg. per 100 cc., a figure slightly above that of venous blood, slightly below that of arterial blood. These results confirmed the experiments of Takahashi (30) upon
dogs. They were opposed by the experiments of de Haan and van Creveld (31) upon rabbits and of Adler (32) upon cats; these authors found less reducing substances in aqueous humor than in blood but believed that the discrepancy was due either to a portion of the sugar being “bound to protein” or to its utilization by the tissues of the eye. The phosphate equilibrium described by Duke-Elder was denied by Tron (33) in the course of a very careful study of the electrolytes of the aqueous humor and serum of oxen; he found only 60 per cent of the serum phosphate in the aqueous humor but his belief that a portion of the serum phos- phate was “bound” brought the theoretical conclusion of his ex- periments into accord with that of Duke-Elder. There is then little existing information concerning the relation of aqueous humor to plasma with respect to the concentration of urea or uric acid. Determinations of reducing substances and phosphate have given discordant results, but those who have found de- ficiencies in these in aqueous humor have agreed that they are explicable on physical grounds.
80 experiments have been performed upon frogs, fowls, rabbits, dogs, cats, and men in which the composition of aqueous humor has been compared with that of blood from the same animal. The results of these experiments oppose the conclusion drawn by Duke-Elder in that they show (1) that the inorganic phosphate concentration of aqueous humor averages, in each species, less than 50 per cent of that in plasma, (2) that in rabbits, dogs, and man, the urea concentration averages only 68 per cent, and (3) that the uric acid concentration in fowls and man (four experi- ments) is only 66 per cent of that in plasma. In so far as reducing substances are concerned, three of our five experiments upon rab- bits support Duke-Elder’s belief that these substances are dis- tributed equally between aqueous humor and blood; the results of twenty-seven other analyses principally upon frogs, dogs, and man, however, force us to conclude that in this respect too the aqueous humor shows a moderate deficiency when compared with blood. It appears fair to say that because of the micromethods which have been available, our experiments have certain advan- tages over those of previous investigators in the technique of fluid collections, in the variety of animals used, and in the number of experiments performed.
It seems impossible to reconcile these gross discrepancies in composition between aqueous humor and blood with known physical laws as they are at present understood and exemplified in the formation of filtrates such as lymph and glomerular fluid. The deficiency in reducing substances and phosphates cannot be attributed to their incomplete filtrability; from frog blood they have proved entirely filtrable both in vivo and in vitro (2, 3) and, so far as the evidence yielded by artificial membranes may be trusted, the same statement appears to hold in mammalian bloods (34, 35). In the human experiments our comparisons were made against the protein-free ultrafiltrates of serum. Nor can the deficiencies in either substance be explained as a direct or indirect consequence of carbohydrate utilization since both continued to occur in depancreatized dogs (Table III) whose sugar metabolism must have been either absent or greatly diminished (23, 24). The observation that the phosphate concentration of freshly formed aqueous humor remains below that of plasma also indicates that this deficiency is not concerned with the carbohydrate utilization of the eye, and its distribution between the two fluids is not explicable on the basis of a Donnan equilibrium. Since uric acid has been shown to be completely filtrable through parlodion membranes and through the glomeruli of frogs and snakes (4), the only living membranes in which its filtrability has been directly investigated, it is difficult to explain its partial absence from aqueous humor on purely physical grounds. We know of no physical explanation which would account for the deficiency in urea which aqueous humor displays in comparison with plasma; it is an eminently filtrable substance and is present in the glomerular urine of frogs in concentration identical with that of plasma (36).
SUMMARY
1. Reducing substances and inorganic phosphates are present in lymph from the frog’s web in approximately the same concen- tration as in blood plasma. The agreement of this finding with established belief in the filtration theory of lymph formation is regarded as additional evidence of the validity of the ultramicro- analytical methods used in the greater part of this work.
2. The concentration of reducing substances in cerebrospinal fluid from frogs is about 30 per cent less than that in plasma; of
inorganic phosphate, 60 per cent less. Similar differences exist between these fluids taken from completely depancreatized dogs.
3. The aqueous humor of frogs, in comparison with plasma, shows the same deficiency in reducing substances and inorganic phosphates as the cerebrospinal fluid. In higher animals and man, the deficiency of phosphates was uniformly present; that of reducing substances, though less marked and less constant, was usually recognizable. The urea concentration in aqueous humor from rabbits, dogs, and man is on the average 30 per cent less than in plasma. The concentration of uric acid in aqueous humor from fowls and man is about 34 per cent less than that in plasma.
4. Reasons are given for the belief that neither incomplete filtrability nor utilization of carbohydrates by tissues of the brain or eye can explain these discrepancies. The conclusion is drawn that the choroidal and the ciliary epithelium exhibit selective qualities not possessed by capillary endothelium or by the glomeru- lar membrane, and that neither cerebrospinal fluid nor aqueous humor is formed by simple processes of filtration or dialysis.
The author finds pleasure in acknowledging his debt to Professor A. N. Richards for the encouragement and suggestive criticism which persisted throughout this work.
BIBLIOGRAPHY
1. Richards, A. N., Bordley, J., 3rd, and Walker, A. M., J. Biol. Chem., 101,179 (1933).
2. Walker, A. M., and Reisinger, J. A., J. Biol. Chem., 101, 223 (1933). 3. Walker, A. M., J. Biol. Chem., 101, 239 (1933). 4. Bordley, J., 3rd, and Richards, A. N., J. Biol. Chem., 101, 193 (1933). 5, Hagedorn, H. C., and Jensen, B. N., Biochem. Z., 136,46 (1923). 6. Van Slyke, D. D., and Cullen, G. E., J. Biol. Chem., 19,211 (1914). 7. Schwarz, I<., and Heinrich, I<., Biochem. Z., 194, 346 (1928). 8. Starling, E. H., J. Physiol., 16, 224 (1894). 9. Landis, E. M., Am. J. Physiol., 82, 217 (1927).
10. Arnold, R. M., and Mendel, L. B., J. Biol. Chem., 72, 189 (1927). 11. Pettit, A., and Girard, J., Arch. anat. micr., 5, 214 (1902). 12. Dixon, W. E., andHalliburton, W. D., J. Physiol., 60,198 (1916). 13. Weed, L. H., Am. J. Anat., 32, 253 (1923). 14. Becht, F. C., Am. J. Physiol., 61, 1 (1920). 15. Fremont-Smith, F., Dailey, M. E., Merritt, H. H., Carroll, M. P., and
Thomas, G. W., Arch. Neural. and Psych&., 25, 1271 (1931).
16. Fremont-Smith, F., Thomas, G. W., Dailey, M. E., and Carroll, M. P., Bruin, 64, 303 (1931).
17. Gilman, A., and Cowgill, G. R., Am. J. Physiol., 103, 143 (1933). 18. Ravdin, I. S., Johnston, C. G., Austin, J. H., and Riegel, C., Am. J.
Physiol., 99, 638 (1932). 19. Fremont-Smith, F., Arch. Neurol. and Psychiat., 17,317 (1927). 20. Cockrill, J. R., Arch. Neural. and Psych&., 26,1297 (1931). 21. Leopold, J. S., and Bernhard, A., Am. J. Dis. Child., 13, 34 (1917). 22. Egerer-Seham, G., and Nixon, C. E., Arch. Int. Med., 28, 561 (1921). 23. Richardson, I-1. B., Shorr, E., and Loebel, R. O., J. Biol. Chem., 86, 551
(1930). 24. Canzanelli, A., and Kozodoy, M., Am. J. Physiol., 103, 298 (1933). 25. Pincus, J. B., and Kramer, B., J. Biol. Chem., 67,463 (1923). 26. Merritt, H. H., and Bauer, W., J. Biol. Chem., 90, 215 (1931). 27. Hamilton, B., J. Biol. Chem., 65, 101 (1925). 28. Ask, F., Acta ophth., 6,23 (1927). 29. Duke-Elder, W. S., Biochem. J., 21,66 (1927). 30. Takahashi, T., Arch. Ophth., Berlin, 11’7,479 (1926). 31. de Haan, J., and van Creveld, S., Biochem. Z., 123,190 (1921). 32. Adler, F. H., TV-. Am. Ophth. Sot., 28,307 (1930). 33. Tron, E., Arch. Ophth., Berlin, 119, 659 (1928). 34. von Hess, C. L., and McGuigan, H., J. Pharmacol. and Ezp. Therap.,
6, 45 (1914). 35. Grollman, A., J. Biol. Chem., 72, 565 (1927). 36. Walker, A. M., and Elsom, K. A., J. Biol. Chem., 91, 593 (1931).