Page 1
A FISH TALE: COMPARISON OF THE GUT MICROBIOME OF 15 FISH SPECIES
AND THE INFLUENCE OF DIET AND TEMPERATURE ON ITS COMPOSITION
by
Carrie Elizabeth Givens
(Under the Direction of James T. Hollibaugh)
ABSTRACT
This dissertation addresses four aspects of the biology of the fish gut. 1) What bacteria
constitute the fish gut microbiome, how variable is the composition within a species; how
different are the gut microflora of different fish species; and how do fish gut microbiomes
different from those of other organisms that have been studied? 2) How do food quality
and diet-associated bacteria affect the composition of the gut microbiome? 3) Ocean
temperatures are expected to rise in the future in response to increased atmospheric CO2
concentrations, we know that the incidence of marine pathogenic Vibrios is higher during
warm summer months and we know that Vibrios are common, and often dominant, taxa
in the gut microbiome. Does increased habitat temperature influence the composition of
the gut microbiome and specifically does the abundance of potentially pathogenic Vibrios
increase when fish are held at higher water temperatures? 4) Conversely, can fish serve
Page 2
as refuges for these Vibrios when growth conditions are less favorable and as vectors for
their distribution?
We used 454-pyrosequencing to survey the 16S rRNA ribotypes in the gut
microbiomes of 12 finfish and 3 shark species. Fish were selected to encompass
herbivorous and carnivorous lifestyles, to have varied digestive physiologies, to represent
pelagic and demersal species, and as representatives of a range of habitats from estuarine
to marine. Proteobacteria ribotypes were present in all fish and often dominated the gut
microflora community of many fish species. Firmicutes were also prevalent within the
fish gut community, but at a lower relative abundance. Each species had a core gut
microflora; however, no individual ribotype was present among all species suggesting
that the gut microflora community is adapted to the autecological properties and
physiological conditions of each fish species.
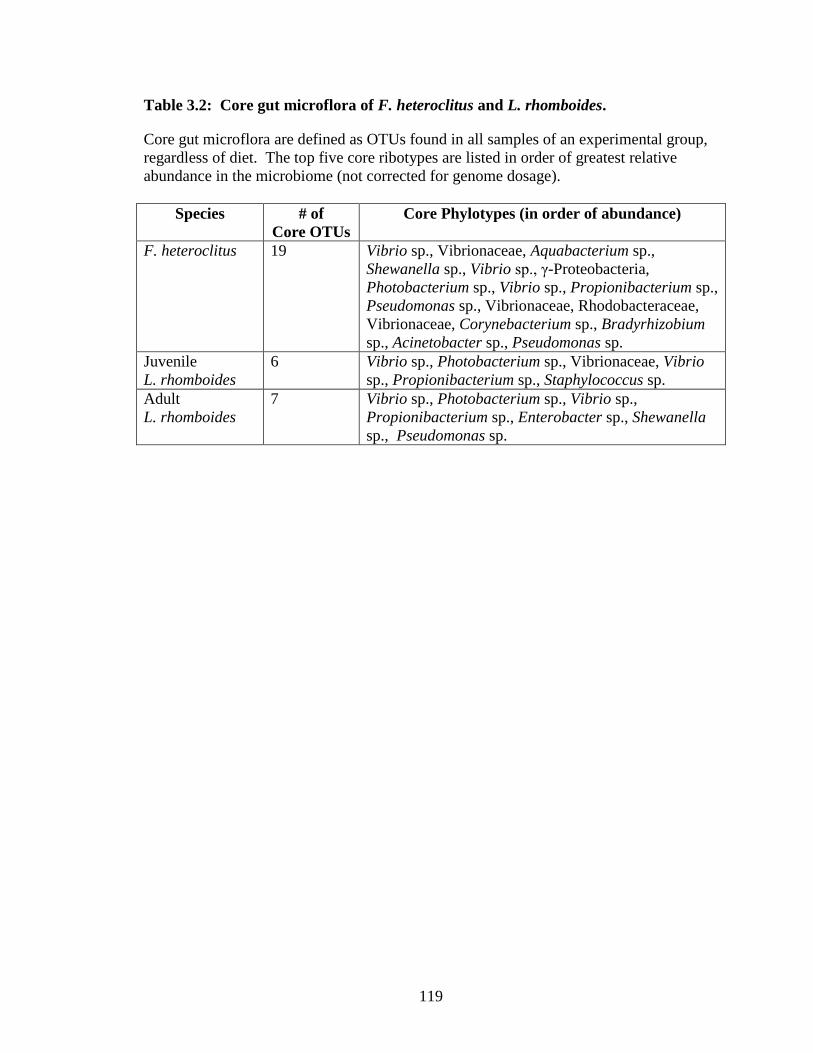
We determined the effects of both diet quality and food-associated bacteria on gut
microflora using mummichogs (F. heteroclitus) and pinfish (L. rhomboides) as model
organisms. We identified a core gut microflora for these species and determined that
food-associated microbiota strongly influenced the composition of the gut microflora in
mummichogs, but not pinfish. We also tested the effect of temperature on the
composition of gut microflora and on the occurrence of Vibrio spp. 16S rRNA and V.
vulnificus vvh genes in the two model fish (mummichogs and pinfish) using clone
libraries and quantitative PCR (qPCR). In a related set of experiments, we asked whether
fish guts might serve as a refuge for Vibrio parahaemolyticus and Vibrio vulnificus
during periods of sub-optimal environmental conditions. We found that both of these
Vibrio species were present in the gut microbiome and that they could be transferred to
Page 3
other environmental reservoirs, implicating fish in the persistence and dispersal of these
potential pathogens. Lastly, we examined the microbiome of the Atlantic blue crab
(Callinectes sapidus) to address how the crab-associated bacterial community may affect
crab, fish, and human health.
INDEX WORDS: Fish gut, Gut microbiome, 16S rRNA, Gut microflora, 454-
pyrosequencing, Shark gut, Blue crab microbiome, core gut microbiome, Proteobacteria,
Firmicutes, Tenericutes, Vibrio sp., Vibrio parahaemolyticus, Vibrio vulnificus, Trinectes
maculatus, Bairdiella chrysoura, Lagodon rhomboides, Paralichthys lethostigma,
Fundulus heteroclitus, Centropristis striata, Sciaeops ocellatus, Caranx hippos,
Scomberomorus maculatus, Scomberomorus cavalla, Coryphaena hippurus, Sphyraena
barracuda, Carcharhinus brevipinna, Rhizoprionodon terraenovae, Carcharhinus
plumbeus, Quantitative PCR (qPCR), 16S rRNA clone library, fish health, crab health,
human health
Page 4
A FISH TALE: COMPARISON OF THE GUT MICROBIOME OF 15 FISH SPECIES
AND THE INFLUENCE OF DIET AND TEMPERATURE ON ITS COMPOSITION
by
Carrie Elizabeth Givens
B.S., University of South Carolina, 2007
A Dissertation Submitted to the Graduate Faculty of the University of Georgia in Partial
Fulfillment of the Requirements for the Degree
DOCTOR OF PHILOSOPHY
ATHENS, GEORGIA
2012
Page 5
© 2012
Carrie Elizabeth Givens
All Rights Reserved
Page 6
A FISH TALE: COMPARISON OF THE GUT MICROBIOME OF 15 FISH SPECIES
AND THE INFLUENCE OF DIET AND TEMPERATURE ON ITS COMPOSITION
by
Carrie Elizabeth Givens
Major Advisor: James T. Hollibaugh
Committee: Erin Lipp
Karen Burnett
Merryl Alber
Mary Ann Moran
Electronic Version Approved:
Maureen Grasso
Dean of the Graduate School
The University of Georgia
December 2012
Page 7
iv
DEDICATION
To my parents Mike and Vickie Givens who have always believed in me.
In memory of my grandfather Harold A. Rutland, Sr. who introduced me to fishing. He
tied the first knot and helped me unhook my first “flopping” fish.
Page 8
v
ACKNOWLEDGMENTS
I thank my advisor Dr. Tim Hollibaugh who accepted me into his lab and
introduced me to marine microbial ecology. He has challenged me to ask scientifically-
driven questions, draw connections between my research and the “bigger scientific
picture”, and explore new concepts and methodology. I would also like to thank Dr. Erin
Lipp who was not only on my committee, but also lead Principal Investigator for my
funding source, the Georgia Oceans and Health traineeship. Her assistance, support, and
advice has not only improved my research, but also has made me a stronger, well-
rounded scientist. I am truly thankful to Erin for both her mentorship and friendship. A
special thanks to Dr. Karen Burnett for not only serving on my committee, but also for
hosting me in her lab for the blue crab research project. I would like to also thank both
Dr. Merryl Alber and Dr. Mary Ann Moran for serving on my committee and providing
suggestions and feedback.
Thanks to Dr. Richard Winn, Michelle Norris, and all personnel at the Aquatic
Biotechnology and Environmental Lab for providing cultured mummichogs, allowing me
to use the facility for the mummichog feeding study, and answering questions regarding
aquaria set-up and fish husbandry. The blue crab research was completed in part at the
Hollings Marine Laboratory in Charleston, SC. I would like to thank Drs. Karen and Lou
Burnett for welcoming me into their lab, and also Nat Johnson, Dr. Natasha Sharp, and
Kristin Stover for help with sampling and processing. Additional thanks to my
collaborators at the FDA Gulf Coast Seafood Laboratory (Dauphin Island, AL) with a
Page 9
vi
special thanks to Dr. Jessica Jones, Dr. Angelo DePaola, Dr. John Bowers, Catharina
Luedeke, Dr. Ron Benner, Jr., Tony Previto, George Doup, Jeff Krantz, Kelvin Calci,
Chris Lott, and Dr. Kristin Butler. Thanks to Dr. Scott Noakes at the UGA Center for
Applied Isotopes Studies who assisted with food sterilization for the feeding and
temperature studies.
Much of my fish collection was done at either the University of Georgia Marine
Institute or the Florida State Coastal & Marine Laboratory. I would like to thank all
personnel at both sites and also additionally acknowledge Mary Price, Ike Sellers, and
Gracie Townsend (UGAMI) for their assistance with permitting and sample collection.
When I came to graduate school I did not have a background in microbiology, Dr.
Nasreen Bano kindly shared her knowledge and expertise on molecular techniques.
Thanks to Bradley Tolar, Leanne Powers, Laura Sargent, and Dr. Vanessa Varaljay for
assisting with field collection, sampling, and feeding. Fishing is always more fun with
friends. Additional thanks to Sylvia Schaefer who helped with feeding for both feeding
studies and temperature manipulation studies. Thanks to Drew Duckett for assistance
with sample processing.
In addition, I thank all of the Hollibaugh lab members (former and present),
colleagues, staff, and friends at the University of Georgia who have supported me during my
graduate career, with special regards to: Bryn Durham, Christian Edwardson, Christine
Hladik, Jessica Joyner, Emily Roberts McReynolds, Leanne Powers, Laura Sargent, Bradley
Tolar, and Dr. Vanessa Varaljay. Many thanks to Sharon Barnhart, who was critical to all
things technical, and also to the Marine Science Office staff for their help and assistance.
Page 10
vii
Lastly, I would like to thank my amazing family: my mom, Vickie, my dad, Mike,
and my sister, Rebecca. I owe much of my success to their unwavering faith, love, and
support.
Page 11
viii
TABLE OF CONTENTS
Page
ACKNOWLEDGMENTS………………………………………………………………...v
CHAPTER
1 INTRODUCTION AND LITERATURE REVIEW…………………….10
2 COMPARSION OF THE GUT MICROFLORA FROM 12 FINFISH
AND 3 SHARK SPECIES……………………………………………….30
3 ALTERING THE BALANCE: THE EFFECTS OF MODIFIED DIET
ON THE GUT MICROFLORA OF FUNDULUS HETEROCLITUS AND
LAGODON RHOMBOIDES……………………………………………..90
4 PUSHING THE LIMIT? EXAMINING THE EFFECTS OF
INCREASED WATER TEMPERATURE ON THE GUT MICROFLORA
OF FUNDULUS HETEROCLITUS AND LADOGON RHOMBOIDES.138
5 INVESTIGATION OF FISH INTESTINES AND SEDIMENT AS
POTENTIAL RESERVOIRS OF VIBRIO VULNIFICUS AND VIBRIO
PARAHAEMOLYTICUS………………………………………………..162
6 MICROBIAL COMMUNITIES OF THE CARAPACE AND GUT AS
POTENTIAL SOURCES OF HEMOLYMPH INFECTIONS IN
CALLINECTES SAPIDUS……………………………………………...190
7 CONCLUSIONS……………………………………………………….218
APPENDICES
A CHAPTER 2 SUPPLEMENTARY MATERIAL………...……………222
Page 12
ix
B CHAPTER 6 SUPPLEMENTARY MATERIAL……………………...227
Page 13
10
CHAPTER 1
INTRODUCTION AND LITERATURE REVIEW
The Gut Microflora Community: Knowns and Unknowns
Bacteria are abundant in the guts of fishes and are expected to influence fish
physiology and health (MacFarlane et al. 1986; Cahill 1990). Elevated abundances in
the intestine of certain bacteria when compared to the composition of the microbial
assemblage in the surrounding water suggest that the intestine provides a unique niche
for a selected, but diverse, group of bacteria (Austin and Austin 1987; Cahill 1990;
Ringø et al. 1995). Some of the species found in the gut appear transiently while others
seem to be resident flora (Kim et al. 2007). The permanent or resident microbes are
often attached to the intestinal wall (Ringø et al. 2001). Fish guts receive inocula of
bacteria from a variety of sources in nature. Bacteria are ingested with water at the larval
stage, and this microflora may colonize the gut tract to become the resident microflora in
juvenile fish (Hansen and Olafsen 1999). Microbes associated with the chorion of fish
eggs and present in their early diet may also influence the development of the gut
microflora (Hansen and Olafsen 1999; Ringø and Birkbeck 1999; Romero and Navarrete
2006). For these bacteria to proliferate and persist as “resident” microflora, they must be
retained within the gut, which requires that they are adapted to gut environmental
conditions including nutrient availability, pH and digestive enzymes (Hansen and
Olafsen 1999). Previous studies have shown that gut microflora respond to a variety of
Page 14
11
factors affecting the host, including changing environmental conditions (Yoshimizu and
Kimura 1976; MacFarlane et al. 1986), developmental stage (Verner-Jeffreys et al. 2003;
Romero and Navarrete 2006), digestive physiology (Cahill 1990), and feeding strategy
(Uchii et al. 2006).
Once established, the gut microbial communities interact with the host in a
number of ways. This community aids in digestion and can affect nutrition, growth,
reproduction, overall population dynamics, and vulnerability of the host to disease
(MacFarlane et al. 1986). Ringø et al. (1995) suggested that Bacteroides spp. and
Clostridium spp. enhance nutrition by providing essential fatty acids and vitamins. Lactic
acid bacteria (often Lactobacillus sp.) have been found to be a minor component of the
gut microflora (Izvekova et al. 2007), but they may be crucial in promoting fish health
and blocking the establishment and growth of potential pathogens (Strøm 1988).
The composition of gut microflora appears to vary among fish species; however
direct comparisons between species are hampered by inconsistencies in the methods
used. Studies conducted prior to ~2005 have relied on culture-based techniques to
enumerate and identify bacteria (Newman et al. 1972; MacFarlane et al. 1986;
Spanggaard et al. 2000; Aschfalk and Müller 2002; Verner-Jeffreys et al. 2003; Al-Harbi
and Naim Uddin 2004; Martin-Antonio et al. 2007; Skrodenytė-Arbaĉiauskienė 2007).
These studies have provided valuable insights into the composition of microbial
communities and have yielded isolates for detailed physiological investigation; however,
they are known to provide biased assessments of the microbial community composition
as typically <1% of the cells known to be present by direct microscopic enumeration
produce colonies on solid media (Ferguson et al. 1984a; Head et al. 1998b). With that
Page 15
12
caveat, Table 1.1 lists the dominant gut microflora reported in published studies of a
variety of fresh- and saltwater fish species from wild and cultured populations. Most of
these studies only examined a single fish species and a variety of culture-dependent and
culture-independent methodologies were used to assess microflora community
composition.
Based on this review of the literature (Table 1.1), the gut microbiome of most fish
seem to be dominated by γ-Proteobacteria such as Aeromonas sp., Escherichia coli,
Photobacterium sp., Pseudomonas sp., and Vibrio sp. (Newman et al. 1972; MacFarlane
et al. 1986; Ringø 1993a; Ringø 1993b; Ringø and Strøm 1994; Spanggaard et al. 2000;
Verner-Jeffreys et al. 2003; Al-Harbi and Naim Uddin 2004; Bates et al. 2006; Romero
and Navarrete 2006; Skrodenyte-Arbaciauskiene et al. 2006; Martin-Antonio et al. 2007;
Skrodenytė-Arbaĉiauskienė 2007; Ransom 2008; Ward et al. 2009a). However, some
fish such as Atlantic salmon (Salmo salar) (Holben et al. 2002b) and long-jawed
mudsucker (Gillichythys mirabilis) (Bano et al. 2007) have intestinal microflora
dominated by Tenericutes (Mycoplasma sp.). Unlike finfish, there has been little
research on the gut microbiome of sharks. One study found that Photobacterium
damselae was a normal member of the gut microflora of sharks (Grimes et al. 1985).
The microbial communities of mammals (humans and other terrestrial mammals)
are much different from that of either finfish or shark species (Turnbaugh et al. 2006;
Ley et al. 2008a). In general, the fish gut microbiome has been thought to be less diverse
than that of mammals (Trust et al. 1979; Sakata 1990; Holben et al. 2002b) and gut
microflora appear to contribute less to the volume of material in fish guts, with an
estimated 106 to 10
8 CFU/gram within the fish intestine (Kim et al. 2007) compared to
Page 16
13
~1011
CFU/gram reported for intestines of terrestrial mammals, including humans (Mead
1997). A recent 16S rRNA gene sequence analysis of gut (fecal) microflora from
humans and 59 other mammals found that gut physiology was a strong indicator of the
fecal microflora community composition (Ley et al. 2008a). Mammal gut microbiomes
grouped by digestive physiologies, with hindgut fermenters, foregut fermenters, and
those with simple guts with minimal differentiation hosting different gut microbial
communities (Muegge et al. 2011). Bacteria from the 60 mammals surveyed by Ley et
al. (2008) binned into 17 phyla and were dominated by Firmicutes (65.7%) and
Bacteriodetes (16.3%). This is slightly different from previous studies (Ley et al. 2005;
Turnbaugh et al. 2006) that categorized human and mouse gut communities as being
dominated by Bacteroidetes followed by Firmicutes. Finally a study characterizing the
gut microflora of Burmese pythons, Python molurus, found that it too was dominated by
Firmicutes (61.8%) and Bacteroidetes (20.6%) (Costello et al. 2010).
Gut Microflora and The Environment: Altered States and Changing Communities
The composition of the transient (versus core) microflora of fish guts is reported
to be affected by diet, by bacteria in the water column, and by environmental factors
(Hansen and Olafsen 1999). Nayak (2010) suggested that microbes from water,
sediment, and food items colonize the fish gastrointestinal tract. Thus, microbes from the
surrounding environment influence the resident gut microflora community. This may
affect fish health if pathogens are present in the environment that are able to colonize the
gut. In fact, the majority of bacteria that cause fish diseases are opportunistic pathogens
frequently found in the water column (Hansen and Olafsen 1999). Environmental
Page 17
14
stressors such as temperature, oxygen concentration, and pollutants can weaken the host’s
immune system and allow these pathogens to colonize the intestinal tract (Hansen and
Olafsen 1999).
Variations in water temperature and salinity can affect gut microflora
communities. DePaola et al. (1994; 1997) documented the prevalence of the potentially
pathogenic Vibrio vulnificus in sheepshead (Archosargus probatocephalus) sampled from
the Gulf of Mexico. Presence and abundance of this bacterium is closely linked to
increased water temperatures, with highest densities of these cells occurring when the
water temperatures range between 20 and 30 °C (Kelly 1982; DePaola et al. 2003;
Tantillo et al. 2004). V. vulnificus densities in sheepshead intestines were 2-3 orders of
magnitude lower in March and December when water temperatures were 21.9 °C and 17.5
°C compared to those recorded in May and September when water temperatures were 24.7
°C and 30.6 °C (DePaola et al. 1997). This suggests that although this bacterium is
naturally present within the sheepshead gut, increased abundance correlates with warmer
water temperatures.
DePaola et al. (1994) also found both a higher prevalence and density of V.
vulnificus in the guts of inshore bottom fish when compared to offshore fish suggesting
that the presence and abundance of V. vulnificus within the fish gut is correlated to this
bacterium’s optimal salinity range (5-15 psu) (Kelly 1982; Wright et al. 1996; Motes et
al. 1998; Lipp et al. 2001; Randa et al. 2004). Several other studies have documented
shifts in the composition of fish gut microflora coinciding with salinity variations
encountered in estuarine environments. (Yoshimizu and Kimura 1976; MacFarlane et al.
1986). For example, many freshwater fish have Aeromonas sp. within their guts;
Page 18
15
whereas, Vibrio sp. is more frequently documented in estuarine and marine species
(Cahill 1990; Ringø et al. 1995; Ringø and Birkbeck 1999). Changes in environmental
conditions like global warming or changes in rainfall pattern may thus affect fish
indirectly by driving potentially detrimental changes in the composition of their gut
A Fish Tale: Gut Microflora and its Effect on Oceans & Human Health:
Vibrio species are often found to be the dominant bacteria in and on marine fish
and are common members of the gut microflora in both farmed and wild fish
(MacFarlane et al. 1986; Cahill 1990; Sakata 1990; Blanch et al. 1997; Martin-Antonio et
al. 2007; Ward et al. 2009a). Baross and Liston (1970) observed that 32% of fish gut
samples collected from Puget Sound contained hemolytic vibrios based on activity
detected on Kanagawa blood agar. Additionally, Liston (1990) isolated V.
parahaemolyticus from various commercial finfish including cod, sardines, mackerel, and
flounder. DePaola et al. (1994; 1997) reported high densities of V. vulnificus in several
finfish species collected from the Gulf of Mexico.
Although several members of the Vibrio genus are pathogenic to humans and
marine animals, V. parahaemolyticus and V. vulnificus in particular are leading causes of
seafood-associated bacterial illness and mortality (Iwamoto et al. 2010). Infections
involving these two bacteria can cause gastroenteritis and septicemia through
consumption of raw or undercooked seafood, and wound infections can result in V.
vulnificus septicemia (Constantin de Magny et al. 2009). Although V. vulnificus
infections are rare, they are the leading cause of seafood-related deaths domestically and
have one of the highest hospitalization (91.3%) and mortality (34.8%) rates of all
Page 19
16
foodborne pathogens (Iwamoto et al. 2010; Scallan et al. 2011). In the United States, V.
parahaemolyticus is the leading cause of bacterial illness from seafood consumption
(Iwamoto et al. 2010), but has a lower hospitalization (22.5%) and mortality (0.9%) rate
than V. vulnificus (Scallan et al. 2011).
V. parahaemolyticus and V. vulnificus are not the only microbes of concern from a
public health standpoint. There are virulent strains of Photobacterium damselae that can
adversely impact fish and humans, causing septicemia in fish (Fouz et al. 2000b), and
septicemia or wound infections in humans (Shin et al. 1996). Although P. damselae
subsp. piscida is not a human pathogen (Fouz et al. 2000b), it is a serious fish pathogen
(Thyssen et al. 1998a), frequently resulting in disease and mortality. Human diseases
associated with handling fish have also been attributed to Streptococcus inae (Zlotkin et
al. 1998; Colorni et al. 2002), Aeromonas hydrophilia, Edwardsiella tarda, E.
rhusopathiae, Mycobacterium marinum, and additional Vibrio spp. (Lehane and Rawlin
2000).
If gut microflora can persist in seawater, there is a risk of increased transmission
of pathogens via infections and open wounds. The population of Aeromonas spp. in a
seawater aquarium increased when fish were held for an extended period (181 days)
(Cahill 1990). Since Aeromonas spp. is not typically isolated from seawater, (Cahill
1990) suggested that this population may have accumulated from fish feces . Gut
microflora capable of persisting in seawater may affect water quality, especially in areas
with dense populations of fish (aquaculture), in shallow water, and in areas of decreased
tidal flushing and increased residence time. Additionally, Janssen and Meyers (1968)
suggested that fish inhabiting water polluted by sewage may become infected with
Page 20
17
human pathogens and thus represent further public health threats as either “carriers” or
“vectors” of human disease.
There is also a potential for fish to participate in the transfer of pathogenic
bacteria to new hosts within the same environment (i.e. humans, other marine animals).
The public health risk from pathogenic bacteria originating from fish may be rare;
however, this risk depends on the interaction between the organism, the physiology of
the infected person, and environmental factors (that can influence virulence) (Strom and
Paranjpye 2000; Oliver 2006). Consumption of raw and undercooked shellfish and fish
is increasingly popular(DePaola et al. 1994) with the attendant risk of infection by
pathogenic bacteria. Gram-negative bacteria such as V. vulnificus can move directly
from the intestine into edible portions of the fish (DePaola et al. 1994). Buras et al.
(1985) found E. coli and Salmonella spp. in fish blood and muscle two hours after
injecting these bacteria into the stomach. Edible portions of the fish may also be
contaminated if the intestine is cut during filleting. There is also a possibility of
infection by pathogenic bacteria during direct contact and handling of some species (i.e.
contact with fecal matter, puncture wounds from spines). Increased occurrences of
certain bacteria (i.e. Vibrio spp., Photobacterium sp., Mycoplasma sp.) within the
intestine may thus affect public health both through food transmissions and wound
infections.
The pathogenesis of some Vibrio-spp. infections in mammals is initiated as a gut
infection (Ringø et al. 2003). Although unproven, this may also be true for fish species.
Some pathogens require nutrient rich environments such as the gut for growth and
survival (Thompson-Chagoyán et al. 2005). They may be expelled with fecal matter, and
Page 21
18
thus in theory may represent “seed populations” that can colonize the surrounding
environment (Ruby and Nealson 1978). As a consequence, fish may be a key link in
pathogen, or Vibrio, cycling between fish, the water column, sediments, and other marine
organisms. Thus although most of the documented Vibrio spp. illnesses and deaths stem
from oyster or shellfish consumption, fish may be integral to the epidemiology because
they harbor potential pathogenic bacteria within their intestines and affect fish, oceans,
and human health.
OBJECTIVES
In Chapter Two, we use massively parallel sequencing (pyrosequencing) to
survey the 16S rRNA ribotypes of 12 finfish and 3 shark species from a wide range of
lifestyles to assess the extent to which gut microflora varies among species. Target fish
species reside in estuarine to marine environments with varied habitats (demersal and
pelagic), have varied feeding strategies (herbivore and carnivore), and differing digestive
physiologies (i.e. pyloric caeca, varied intestinal length and morphologies, stomachless).
Finfish gut microflora assemblages are also compared to the microflora of three shark
species to determine whether microflora differs with physiology (Class Actinopterygii
vs. Chondrichthyes) and spiraled valve digestive system. In addition to the 15 species
used in the cross-species analysis, we further compare the gut microflora of wild and
cultured Fundulus heteroclitus and juvenile and adult Lagodon rhomboides.
In Chapter Three, we analyze 16S rRNA ribotypes in pyrosequenced libraries to
determine the effects of both diet and diet-associated bacteria on the gut microflora and
to investigate the effects of forced dietary change on the species’ intestinal microflora.
Page 22
19
In the first feeding study, cultured F. heteroclitus were fed different diets including
sterilized and unsterilized food with differing protein contents. This study aimed to
determine if there was a baseline or core gut microbiome for the fish and then to follow
changes in the core microbiome among fish fed four different diets over a 2-month time-
series. The second feeding experiment had similar goals but used juvenile and adult
pinfish (L. rhomboides). Pinfish were chosen for this study because they undergo an
ontogenetic diet shift with the transition from juvenile (primarily carnivorous) to adult
(primarily herbivorous) life stages.
Chapter Four describes studies designed to determine the relative abundance of
Vibrio spp. within the gut microflora community and to assess the response of the Vibrio
assemblage to elevated temperature in the fish’s habitat and the occurrence of Vibrio spp.
within the fish gut. Other studies indicated that the gut microflora of the mummichog (F.
heteroclitus) and pinfish (L. rhomboides) are dominated by gamma-Proteobacteria
ribotypes (57% and 41% respectively), mainly members of the family Vibrionaceae (34%
and 41%), including some that are closely related to potential pathogens. Thus, we used
the distribution of 16S rRNA genes in clone libraries and quantitative PCR (qPCR) with
primer sets for Bacteria 16S rRNA, Vibrio spp. 16S rRNA, and V. vulnificus vvh genes to
assess the response of these potentially pathogenic bacteria species to elevated
temperature.
In Chapter Five, we determine whether fish guts and sediments served as
reservoirs of V. vulnificus or Vibrio parahaemolyticus during periods of sub-optimal
environmental conditions. We quantified the abundance of both of these bacteria in fish,
sediment, oysters, and water from coastal sites in Alabama using both culture-
Page 23
20
independent (DNA extractions and qPCR) and culture-dependent (plating and
hybridization) techniques. These samples were collected from the field during the spring
(mid-March to May) when a predictable increase in water temperature was expected to
trigger an increase in V. parahaemolyticus and V. vulnificus abundance.
Chapter Six analyzes Bacteria 16S rRNA genes in clone libraries and uses
quantitative PCR (qPCR) to characterize and quantify the microflora community of the
blue crab Callinectes sapidus. We sampled bacteria associated with crab carapaces
(swabs and clips), guts, and hemolymphs. This analysis describes the bacteria commonly
associated with different parts of components of the C. sapidus anatomy and allowed us to
compare microbial assemblages of the carapace, gut, and hemolymph; and to assess the
potential for other parts of the crab to serve as potential sources of bacteria for
hemolymph infections.
Page 24
21
REFERENCES
Al-Harbi, A. H., and M. Naim Uddin. 2004. Seasonal variation in the intestinal bacterial
flora of hybrid tilapia (Oreochromis niloticus×Oreochromis aureus) cultured in
earthen ponds in Saudi Arabia. Aquaculture 229: 37-44.
Aschfalk, A., and W. Müller. 2002. Clostridium perfringens toxin types from wild-caught
Atlantic cod (Gadus morhua L.), determined by PCR and ELISA. Canadian
Journal of Microbiology 48: 365-368.
Austin, B., and D. A. Austin. 1987. Bacterial fish pathogens : disease in farmed and wild
fish. E. Horwood; Halsted Press.
Bano, N., A. Derae Smith, W. Bennett, L. Vasquez, and J. T. Hollibaugh. 2007.
Dominance of Mycoplasma in the guts of the Long-Jawed Mudsucker, Gillichthys
mirabilis, from five California salt marshes. Environmental Microbiology 9:
2636-2641.
Baross, J., and J. Liston. 1970. Occurrence of Vibrio parahaemolyticus and Related
Hemolytic Vibrios in Marine Environments of Washington State. Applied
Microbiology 20: 179-186.
Bates, J. M., E. Mittge, J. Kuhlman, K. N. Baden, S. E. Cheesman, and K. Guillemin.
2006. Distinct signals from the microbiota promote different aspects of zebrafish
gut differentiation. Developmental Biology 297: 374-386.
Blanch, A. R., M. Alsina, M. Simón, and J. Jofre. 1997. Determination of bacteria
associated with reared turbot (Scophthalmus maximus) larvae. Journal of Applied
Microbiology 82: 729-734.
Buras, N., L. Duek, and S. Niv. 1985. Reactions of fish to microorganisms in wastewater.
Applied and Environmental Microbiology 50: 989-995.
Cahill, M. M. 1990. Bacterial flora of fishes: a review. Microbial Ecology 19: 21-41.
Colorni, A., A. Diamant, A. Eldar, H. Kvitt, and A. Zlotkin. 2002. Streptococcus iniae
infections in Red Sea cage-cultured and wild fishes. Diseases of Aquatic
Organisms 49: 165-170.
Constantin De Magny, G. and others 2009. Predicting the distribution of Vibrio spp. in
the Chesapeake Bay: a Vibrio cholerae case study. EcoHealth 6: 378-389.
Costello, E. K., J. I. Gordon, S. M. Secor, and R. Knight. 2010. Postprandial remodeling
of the gut microbiota in Burmese pythons. ISME J 4: 1375-1385.
Page 25
22
DePaola, A., G. M. Capers, and D. Alexander. 1994. Densities of Vibrio vulnificus in the
intestines of fish from the U.S. Gulf Coast. Applied and Environmental
Microbiology 60: 984-988.
DePaola, A., S. Mcleroy, and G. McManus. 1997. Distribution of Vibrio vulnificus phage
in oyster tissues and other estuarine habitats. Applied and Environmental
Microbiology 63: 2464-2467.
DePaola, A., J. L. Nordstrom, J. C. Bowers, J. G. Wells, and D. W. Cook. 2003. Seasonal
abundance of total and pathogenic Vibrio parahaemolyticus in Alabama oysters.
Applied and Environmental Microbiology 69: 1521-1526.
Ferguson, R. L., E. Buckley, and A. Palumbo. 1984. Response of marine
bacterioplankton to differential filtration and confinement. Applied and
Environmental Microbiology 47: 49-55.
Fouz, B., A. E. Toranzo, M. Milán, and C. Amaro. 2000. Evidence that water transmits
the disease caused by the fish pathogen Photobacterium damselae subsp.
damselae. Journal of Applied Microbiology 88: 531-535.
Grimes, D. J., P. Brayton, R. R. Colwell, and S. H. Gruber. 1985. Vibrios as
autochthonous flora of neritic sharks. Systematic and Applied Microbiology 6:
221-226.
Hansen, G. H., and J. A. Olafsen. 1999. Bacterial interactions in early life stages of
marine cold water fish. Microbial Ecology 38: 1-26.
Head, I. M., J. R. Saunders, and R. W. Pickup. 1998. Microbial evolution, diversity, and
ecology: a decade of ribosomal RNA analysis of uncultivated microorganisms.
Microbial Ecology 35: 1-21.
Holben, W. E., P. Williams, M. Saarinen, L. K. Särkilahti, and J. H. A. Apajalahti. 2002.
Phylogenetic analysis of intestinal microflora indicates a novel Mycoplasma
phylotype in farmed and wild salmon. Microbial Ecology 44: 175-185.
Iwamoto, M., T. Ayers, B. E. Mahon, and D. L. Swerdlow. 2010. Epidemiology of
seafood-associated infections in the United States. Clinical Microbiology Reviews
23: 399-411.
Izvekova, G., E. Izvekov, and A. Plotnikov. 2007. Symbiotic microflora in fishes of
different ecological groups. Biology Bulletin 34: 610-618.
Janssen, W. A., and C. D. Meyers. 1968. Fish: serologic evidence of infection with
human pathogens. Science 159: 547-548.
Page 26
23
Kelly, M. T. 1982. Effect of temperature and salinity on Vibrio (Beneckea) vulnificus
occurrence in a Gulf Coast environment. Applied and Environmental
Microbiology 44: 820-824.
Kim, D. H., J. Brunt, and B. Austin. 2007. Microbial diversity of intestinal contents and
mucus in rainbow trout (Oncorhynchus mykiss). Journal of Applied Microbiology
102: 1654-1664.
Lehane, L., and G. T. Rawlin. 2000. Topically acquired bacterial zoonoses from fish: a
review. Medical Journal of Australia 173: 256-259.
Ley, R. E., F. Bäckhed, P. Turnbaugh, C. A. Lozupone, R. D. Knight, and J. I. Gordon.
2005. Obesity alters gut microbial ecology. Proceedings of the National Academy
of Sciences of the United States of America 102: 11070-11075.
Ley, R. E. and others 2008. Evolution of mammals and their gut microbes. Science 320:
1647-1651.
Lipp, E. K., C. Rodriguez-Palacios, and J. B. Rose. 2001. Occurrence and distribution of
the human pathogen Vibrio vulnificus in a subtropical Gulf of Mexico estuary.
Hydrobiologia 460: 165-173.
Lynch, J. M., and J. E. Hobbie. 1988. The animal environment., p. 163–192. In
Microorganisms in Action: Concepts and Applications in Microbial Ecology
Blackwell Scientific Publications.
MacFarlane, R., J. McLaughlin, and G. Bullock. 1986. Quantitative and qualitative
studies of gut flora in striped bass from estuarine and coastal marine
environments. Journal of Wildlife Diseases 22: 344-348.
Martin-Antonio, B. and others 2007. Intestinal microbiota variation in Senegalese sole
(Solea senegalensis) under different feeding regimes. Aquaculture research 38:
1213-1222.
Mead, G. C. 1997. Bacteria in the gastrointestinal tract of birds. Gastrointestinal
Microbiology 2: 216-240.
Motes, M. L. and others 1998. Influence of water temperature and salinity on Vibrio
vulnificus in Northern Gulf and Atlantic Coast oysters (Crassostrea virginica).
Applied and Environmental Microbiology 64: 1459-1465.
Muegge, B. D. and others 2011. Diet drives convergence in gut microbiome functions
across mammalian phylogeny and within humans. Science 332: 970-974.
Nayak, S. K. 2010. Role of gastrointestinal microbiota in fish. Aquaculture research 41:
1553-1573.
Page 27
24
Newman, J. T., B. J. Cosenza, and J. D. Buck. 1972. Aerobic microflora of the Bluefish
(Pomatomus saltatrix) intestine. Journal of the Fisheries Research Board of
Canada 29: 333-336.
Oliver, J. D. 2006. The viable but non-culturable state in the human pathogen Vibrio
vulnificus. FEMS Microbiology Letters 133: 203-208.
Oxley, A. P. A., W. Shipton, L. Owens, and D. McKay. 2002. Bacterial flora from the gut
of the wild and cultured banana prawn, Penaeus merguiensis. Journal of Applied
Microbiology 93: 214-223.
Randa, M. A., M. F. Polz, and E. Lim. 2004. Effects of temperature and salinity on Vibrio
vulnificus population dynamics as assessed by quantitative PCR. Applied and
Environmental Microbiology 70: 5469-5476.
Ransom, B. L. 2008. Intestinal microflora community composition of six Actinopterygii
fish species in the southeastern United States M. Sci. University of Georgia.
Ringø, E. 1993a. Does chromic oxide (Cr2O3) affect faecal lipid and intestinal bacterial
flora in Arctic charr. Salvelinus alpinus (L.)? Aquaculture Research 24: 767-776.
---. 1993b. Does dietary linoleic acid affect intestinal microflora in Arctic charr,
Salvelinus alpinus (L.)? Aquaculture Research 24: 133-135.
Ringø, E., and T. H. Birkbeck. 1999. Intestinal microflora of fish larvae and fry.
Aquaculture Research 30: 73-93.
Ringø, E., J. B. Lødemel, R. Myklebust, T. Kaino, T. M. Mayhew, and R. E. Olsen. 2001.
Epithelium-associated bacteria in the gastrointestinal tract of Arctic charr
(Salvelinus alpinus L.). An electron microscopical study. Journal of Applied
Microbiology 90: 294-300.
Ringø, E., R. E. Olsen, T. M. Mayhew, and R. Myklebust. 2003. Electron microscopy of
the intestinal microflora of fish. Aquaculture 227: 395-415.
Ringø, E., and E. Strøm. 1994. Microflora of Arctic charr, Salvelinus alpinus (L.):
gastrointestinal microflora of free-living fish and effect of diet and salinity on
intestinal microflora. Aquaculture Research 25: 623-629.
Ringø, E., E. Strøm, and J. A. Tabachek. 1995. Intestinal microflora of salmonids: a
review. Aquaculture Research 26: 773-789.
Romero, J., and P. Navarrete. 2006. 16S rDNA-based analysis of dominant bacterial
populations associated with early life stages of coho salmon (Oncorhynchus
kisutch). Microbial Ecology 51: 422-430.
Page 28
25
Ruby, E., and K. Nealson. 1978. Seasonal changes in the species composition of
luminous bacteria in nearshore seawater. Limnology and Oceanography: 530-533.
Sakata, T. 1990. Microflora in the digestive tract of fish and shellfish, p. 171-176. In
Microbiology in Poecilotherms. Elsevier.
Scallan, E. and others 2011. Foodborne illness acquired in the United States—major
pathogens. Emerging Infectious Diseases 17.
Shin, J. D., M. G. Shin, S. P. Suh, D. W. Ryang, R. J.S, and F. S. Nolte. 1996. Primary
Vibrio damsela septicemia. Clinical Infectious Diseases 22: 856–857.
Skrodenytė-Arbaĉiauskienė, V. 2007. Enzymatic activity of intestinal bacteria in roach
Rutilus rutilus L. Fisheries Science 73: 964-966.
Skrodenyte-Arbaciauskiene, V., A. Sruoga, and D. Butkauskas. 2006. Assessment of
microbial diversity in the river trout Salmo trutta fario L. intestinal tract identified
by partial 16S rRNA gene sequence analysis. Fisheries Science 72: 597-602.
Spanggaard, B., I. Huber, J. Nielsen, T. Nielsen, K. F. Appel, and L. Gram. 2000. The
microflora of rainbow trout intestine: a comparison of traditional and molecular
identification. Aquaculture 182: 1-15.
Strøm, E. 1988. Melkesyrebakt’erier I fb ketarm. Isolasjon, Karaktesisies og egnekaper.
M. Sci. Norwegian College of Fishery Science.
Strom, M. S., and R. N. Paranjpye. 2000. Epidemiology and pathogenesis of Vibrio
vulnificus. Microbes and Infection 2: 177-188.
Tantillo, G. M., M. Fontanarosa, A. Di Pinto, and M. Musti. 2004. Updated perspectives
on emerging vibrios associated with human infections. Letters in Applied
Microbiology 39: 117-126.
Thompson-Chagoyán, O. C., J. Maldonado, and A. Gil. 2005. Aetiology of inflammatory
bowel disease (IBD): role of intestinal microbiota and gut-associated lymphoid
tissue immune response. Clinical Nutrition 24: 339-352.
Thyssen, A., L. Grisez, R. Van Houdt, and F. Ollevier. 1998. Phenotypic characterization
of the marine pathogen Photobacterium damselae subsp. piscicida. International
Journal of Systematic Bacteriology 48: 1145-1151.
Trust, T. J., L. M. Bull, B. R. Currie, and J. T. Buckley. 1979. Obligate anaerobic bacteria
in the gastrointestinal microflora of the grass carp (Ctenopharyngodon idella),
goldfish (Carassius auratus), and rainbow trout (Salmo gairdneri). Journal of the
Fisheries Research Board of Canada 36: 1174-1179.
Page 29
26
Turnbaugh, P. J., R. E. Ley, M. A. Mahowald, V. Magrini, E. R. Mardis, and J. I.
Gordon. 2006. An obesity-associated gut microbiome with increased capacity for
energy harvest. Nature 444: 1027-1131.
Uchii, K. and others 2006. Genetic and physiological characterization of the intestinal
bacterial microbiota of Bluegill (Lepomis macrochirus) with three different
feeding habits. Microbial Ecology 51: 277-284.
Verner-Jeffreys, D. W., R. J. Shields, I. R. Bricknell, and T. H. Birkbeck. 2003. Changes
in the gut-associated microflora during the development of Atlantic halibut
(Hippoglossus hippoglossus L.) larvae in three British hatcheries. Aquaculture
219: 21-42.
Ward, N., B. Steven, K. Penn, B. Methé, and W. Detrich. 2009. Characterization of the
intestinal microbiota of two Antarctic notothenioid fish species. Extremophiles
13: 679-685.
Wright, A. C., R. T. Hill, J. A. Johnson, M. C. Roghman, R. R. Colwell, and J. G. Morris.
1996. Distribution of Vibrio vulnificus in the Chesapeake Bay. Applied and
Environmental Microbiology 62: 717-724.
Yoshimizu, M., and T. Kimura. 1976. Study on the intestinal microflora of salmonids.
魚病研究= Fish Pathology 10: 243-259.
Zlotkin, A., H. Hershko, and A. Eldar. 1998. Possible transmission of Streptococcus iniae
from wild fish to cultured marine fish. Applied and Environmental Microbiology
64: 4065-4067.
Page 30
27
Table 1.1: Dominant Gut Microflora of Freshwater and Saltwater Fish Species
Species Dominant Gut Microflora Methodology1 Reference
BluefishW, SW
(Pomatomus saltatrix)
Vibrio sp., Pseudomonas sp.,
Enterobacteraceae
CD Newman et al., 1972
Striped BassW, SW
(Morone saxatilis)
Aeromonas sp., Pseudomonas sp.,
Vibrio sp.
CD
Plating
MacFarlane et al., 1986
Arctic CharrC/W,FW
(Salvelinus alpinus)
Aeromonas sp., Pseudomonas sp. CD Ringø 1993a; Ringø
1993b; Ringø & Strøm,
1994
Rainbow TroutC, FW
(Oncorhynchus mykiss)
γ-Proteobacteria; Citrobacter sp.,
Aeromonas sp., Pseudomonas sp.,
Carnobacterium sp.
CD
Plating, Isolates 16S rRNA
Spanggarrd et al., 2000
Atlantic CodW, SW
(Gadus morhua)
Clostridium perfringens CD
Fecal samples isolates
Aschfalk & Miller, 2002
Atlantic SalmonC/W, FW/SW
(Salmo salar)
Acinetobacter junii, Mycoplasma
sp.
CI
16S rRNA
Holben et al., 2002
Atlantic HalibutC, SW
(Hippoglossus
hippoglossus)
Vibrionaceae (larvae, juveniles)
Photobacterium phosphoreum
(adults)
CD
Biochemical/Biolog plates
16S rRNA isolates/RFLP
Verner-Jeffreys et al., 2003
Hybrid TilipiaC, FW
(Oreochromis niloticus X
O. aureus)
Aeromonas hydrophila, Shewanella
putrefaciens, Corynebacterium
urealyticum, Escherichia coli,
Vibrio cholerae
CD
Plating/ API, Biolog
Al-Harbi & Uddin, 2004
ZebrafishC, FW
(Danio rerio)
Aeromonas sp., Pseudomonas sp.,
Vibrio sp., Lactococcus sp.
CI
16S rRNA library
Rawls et al., 2004
Silver DrummerW, SW
(Kyphosus sydneyanus)
Clostridium sp. CI
16S rRNA clone library
Moran et al., 2005
River troutW, FW
(Salmo trutta)
Citrobacter sp., Aeromonas sp.,
Pseudomonas sp.
CD
16S rRNA isolates
Skrodenyte-
Arbačiauskiene, 2006
Page 31
28
Coho SalmonC, FW
(Oncorhynchus kisutch)
Aeromonas sp., Pseudomonas sp.
(juveniles)
CD/CI
16S rRNA isolates/DGGE
Romero & Navarrete, 2006
Rainbow TroutC, FW
(Oncorhynchus mykiss)
Aeromonas sp., Carnobacterium
piscicola, Clostridium gasigenes
CD/CI
Isolates – BIOLOG, 16S rRNA
16S rRNA clones, RFLP
Pond et al., 2006
ZebraperchW, SW
(Hermosilla azurea)
Enterovibrio sp. CI
16S rRNA clone library
Fidiopiastis et al., 2006
ZebrafishC, FW
(Danio rerio)
Aeromonas sp., Pseudomonas sp.
(embryos & larvae)
CI
16S rRNA clone library
Bates et al., 2006
RoachW, FW
(Rutilus rutilus)
Aeromonas sp. CD
Plating/Isolates
Skrodenyte-
Arbačiauskiene, 2007
Senegalese SoleC
(Solea senegalensis)
Vibrio sp. (Vibrio ichthyoenteri) CD
16S rRNA isolates
Martin-Antonio et al., 2007
Rainbow TroutC
(Oncorhynchus mykiss)
Enterobacteriaceae,
Aeromonadaceae,
Pseudomonadaceae (CD);
Proteobacteria (CI)
CD/CI
16S rRNA isolates/clone library
Kim et al., 2007
Long-Jawed-
MudsuckerW, SW
(Gillichthys mirabilis)
Mycoplasma sp. CI
16S rRNA PCR/DGGE
Bano et al., 2007
Silver PerchW, SW
(Bairdiella chrysoura)
Escherichia coli CI
16S rRNA clone library
Ransom, 2008
Red DrumW, SW
(Sciaenops ocellatus)
Mycoplasmataceae CI
16S rRNA clone library
Ransom, 2008
Speckled TroutW, SW
(Cynoscion nebulosus)
Escherichia coli CI
16S rRNA clone library
Ransom, 2008
Southern FlounderW, SW
(Paralichthys
lethostigma)
Clostridium sp. CI
16S rRNA clone library
Ransom, 2008
Page 32
29
PinfishW, SW
(Lagodon rhomboides)
Mycoplasmataceae CI
16S rRNA clone library
Ransom, 2008
PipefishW, SW
(Syngnathus scovelli)
γ-Proteobacteria CI
16S rRNA clone library
Ransom, 2008
Black RockcodW, SW
Notothenia coriiceps
Photobacterium sp., Vibrio sp. CI
16S rRNA clone library
Ward et al., 2009
Blackfin Icefish W, SW
(Chaenocephalus
aceratus)
Photobacterium sp. CI
16S rRNA clone library
Ward et al., 2009
ZebrafishC/W, FW
(Danio rerio)
γ-Proteobacteria and Fusobacteria CI
Pyrosequencing
Roeselers et al., 2011
CarpC, FW
(Cyprinus carpio)
Fusobacteria (mostly
Cetobacterium sp.)
CI
Pyrosequencing
Kessel et al., 2011
1CD=culture-dependent, CI-culture-independent; C=cultured, W=wild; FW=freshwater, SW=saltwater (estuarine and marine)
This table includes studies where authors indicated a dominant gut microflora. Studies that just made assessments of
presence/absence were not included.
Page 33
30
CHAPTER 2
COMPARSION OF THE GUT MICROFLORA FROM 12 FINFISH AND
3 SHARK SPECIES1
1 Givens, C.E. and J.T. Hollibaugh. To be submitted to The International Society for
Microbial Ecology Journal.
Page 34
31
ABSTRACT
We used massively parallel sequencing (pyrosequencing) to survey the 16S
rRNA ribotypes in 12 finfish and three shark species from a wide range of lifestyles.
Targeted species encompass herbivores and carnivores with varied digestive
physiologies, are classified as pelagic and demersal, and reside in estuarine to marine
environments. We also compared the gut microbial assemblage of finfish vs. shark
species, wild vs. cultured Fundulus heteroclitus and juvenile vs. adult Lagodon
rhomboides. We sampled 4 F. heteroclitus each from the wild and cultured populations,
4 L. rhomboides at each developmental stage, and 2-3 fish for all other species. A total
of 1,214,355 sequences were filtered, denoised, trimmed, and then sorted into OTUs
based on 97% sequence similarity using the Qiime software pipeline. Bacteria
representing 17 phyla were found among the sampled fish with most fish hosting
between 7 and 15 phyla. Proteobacteria ribotypes were present in all fish and often
dominated the libraries (3.0-98%; average 61%). Firmicutes were also prevalent, but at a
lower relative abundance, ranging between 1.3-45% (average 17%). In most cases, the
gut microflora of individual fish of a given species contained many of the same OTUs;
however, some species (i.e. great barracuda) shared few OTUs among the individuals
sampled.
INTRODUCTION
Skin, gills, eggs, and intestinal tracts of fish all harbor abundant populations of
bacteria (MacFarlane et al. 1986; Cahill 1990) that impact their overall health and
Page 35
32
physiology. Fish intestines in particular harbor large and diverse populations of bacteria
(Austin and Austin 1987; Cahill 1990; Ringø et al. 1995). Most studies have shown that
this gut microflora varies among fish species, and that dominant bacteria are typically
either aerobes or facultative anaerobes (Ringø et al. 1995). However, some studies have
documented obligate anaerobes as part of the gut microbial assemblage (Trust et al.
1979; Ringø et al. 1995). Izvekova et al. (2007) reviewed studies of fish gut microflora
published between 1929 and 2006 and found that of the 73 bacteria taxa documented,
53% were Gram-negative aerobes, 34% were Gram-positive aerobes, 8.2% were Gram-
negative anaerobes , and 4.1% were Gram-positive anaerobes.
Many fish species have gut microflora dominated by γ-Proteobacteria (Ohwada et
al. 1980; MacFarlane et al. 1986; Spanggaard et al. 2000; Rawls et al. 2004; Romero and
Navarrete 2006; Kim et al. 2007; Ward et al. 2009a). Populations of anaerobes found in
some fish were dominated by Firmicutes and Tenericutes such as Mycoplasma sp.
(Holben et al. 2002b; Bano et al. 2007) and Clostridium sp. (Trust et al. 1979; Sugita et
al. 1988; Moran et al. 2005). The gut microflora of freshwater fish species is generally
comprised of Aeromonas sp., Pseudomonas sp., Flavobacterium/Cytophaga species,
Enterobacter sp., and/or Acinetobacter sp. (Trust et al. 1979; Cahill 1990; Ringø et al.
1995; Ringø and Birkbeck 1999). Marine species harbor a different assemblage
featuring Vibrio spp., Pseudomonas sp., Acinetobacter sp., Achromobacter sp.,
Enterobacteraceae, Flavobacterum, and/or Micrococcus sp. (Liston 1957; Colwell 1962;
Newman et al. 1972; Sera and Ishida 1972a; Sugita et al. 1988; Cahill 1990; Onarheim et
al. 1994; Ringø et al. 1995; Ringø and Birkbeck 1999; Izvekova et al. 2007). Lactic acid
Page 36
33
bacteria (mainly Lactobacillus sp.) have also been found to be minor components of the
gut microflora of both freshwater and marine fish (Izvekova et al. 2007).
The gut microbial community can respond to a variety of factors affecting the
host, including changing environmental conditions such as temperature and salinity
(Yoshimizu and Kimura 1976; MacFarlane et al. 1986), developmental stage (Verner-
Jeffreys et al. 2003; Romero and Navarrete 2006), digestive physiology (Cahill 1990),
and feeding strategy (Uchii et al. 2006). Some of the gut microflora appear to be
transient while other bacteria seem to be resident flora (Kim et al. 2007). Resident gut
microflora are those bacteria from the diet or environment that are able to colonize,
persist, and proliferate within the gut (Sugita et al. 1988; Cahill 1990). Within a species’
natural habitat, stable environmental conditions may lead to a stable gut microflora
community that is representative of the “natural flora” (Lynch and Hobbie 1988; Oxley
et al. 2002). However in culture systems, conditions of diet, water quality, and
population density may be very different from those of the natural habitat. This may
result in differences between the gut microflora of wild and cultured populations of the
same species and indeed, MacFarlane et al. (1986) observed that farm-raised fish had a
simpler gut flora than their wild counterparts.
Several studies have shown that many herbivorous fish such as pinfish (Lagodon
rhomboides) undergo an ontogenetic diet shift, transitioning from carnivorous juveniles
to either omnivorous or herbivorous adults (Benavides et al. 1994; Muñoz and Ojeda
2000; Gallagher et al. 2001). Luczkovich and Stellwag (1993) indicated that this
ontogenetic shift in diet resulted in both qualitative and quantitative variability within the
Page 37
34
L. rhomboides gut microbiome. Considering the importance of gut microflora with
regard to digestive capability and nutrient acquisition, it is likely that fish adapted to a
piscivorous lifestyle have gut microbial assemblages that are different than those that
feed on invertebrates or plant material.
We used massively parallel sequencing (pyrosequencing) to survey the 16S
rRNA ribotypes in the gut microbiomes of 12 finfish and 3 shark species, selected to
encompass a wide range of lifestyles. The fish species sampled include both herbivores
and carnivores, represent varied digestive physiologies, are classified as pelagic and
demersal species, and reside in estuarine to marine environments. We also included
three species of sharks as there is little additional information about the composition of
shark gut microbiomes beyond one study suggesting that Photobacterium damselae is a
normal member (Grimes et al. 1985). Unlike finfish, sharks have a short intestine that
incorporates a spiraled valve (Budker and Whitehead 1971), which increases the
intestinal surface area and allows for increased absorption (Castro and Huber 2003). We
hypothesized that the difference in gut physiology between sharks and finfish may lead
to differences between the natural microflora of sharks as compared to that of finfish.
METHODS
Fish Collection
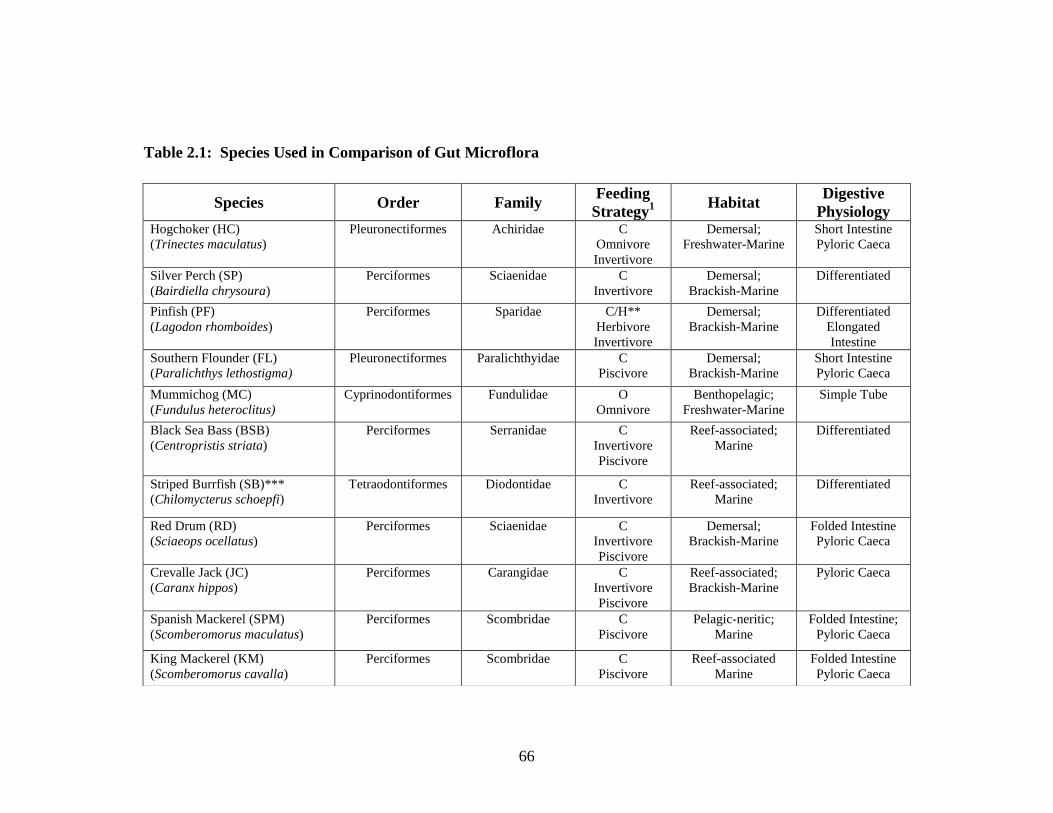
Table 2.1 lists species used in this study, along with their phylogenetic
classification, feeding strategies, common habitats, and digestive physiologies. In
Page 38
35
addition to the 15 species used to compare across species, we also compare wild and
cultured mummichogs, F. heteroclitus and juvenile and adult pinfish, L. rhomboides.
Finfish and sharks were caught by trap, trawl, or hook and line. All were kept in
recirculating tanks or on ice until dissections were completed.
Wild mummichog specimens were collected from Sapelo Island, GA, and
cultured fish were acquired from a population that has been reared in captivity for 11
generations at the Aquatic Biotechnology and Environmental Lab, University of Georgia
(courtesy of Dr. R. Winn). Cultured fish were reared in recirculating seawater culture
tanks and were fed a diet of brine shrimp (San Francisco Bay Brand), freeze-dried
plankton (San Francisco Bay Brand), and Otohime EP1 (Aquatic Ecosystems).
Pinfish were collected by trawl from the Gulf of Mexico (29° 52’ N 84° 29’ W)
with logistic support from the Florida State University Coastal & Marine Laboratory (St.
Teresa, FL). Juveniles and adults were differentiated by size: Juveniles were defined as
fish <100 mm body length and adults were defined as fish >101 mm in length. All fish
were kept in recirculating tanks for no longer than four hours prior to dissection.
Dissections and DNA extractions
Pinfish and mummichogs were euthanized with tricaine methanesulfonate (MS-
222; Sigma). The exterior of each fish was cleaned with 95% ethanol prior to dissection.
Microbes attached to the intestinal wall were considered to be part of the natural gut
microflora (Ringø et al. 2001), and thus, the whole intestine and not just gut contents
were used for all extractions. Lengths of pinfish were measured to assess developmental
Page 39
36
stage. The mid- to hind-gut region of the intestine was removed, sliced open, and placed
into a PowerBead tube (MoBio; Solana Beach, CA). The intestines of several species
including southern flounder, black sea bass, red drum, crevalle jack, Spanish mackerel,
king mackerel, mahi-mahi, great barracuda, spinner shark, Atlantic sharpnose shark, and
sandbar shark were too large to fit directly into PowerBead tubes. These intestines were
placed in 50 or 250-mL tubes with phosphate buffered saline buffer (PBS) and sonicated
for 30 minutes. The supernatant was then centrifuged at 10,000 rpm for five minutes.
The bacterial pellet was transferred directly into a PowerBead tube using a sterile spatula.
DNA extractions were then completed using the MoBio Power Soil DNA Extraction Kit
according to manufacturer’s instructions.
16S rRNA pyrosequencing and analysis
We analyzed the distribution of 16S rRNA ribotypes with massively parallel
sequencing (pyrosequencing) using a Roche 454/FLX instrument running Titanium
chemistry. Bacterial DNA was amplified using universal 16S rRNA primers 27F and
338R-I and II (Roeselers et al. 2011), which were modified with Titanium (Lib-L)
adaptors and sample-specific barcodes. PCR assays were performed in triplicate using
Phusion Hot Start II High Fidelity Polymerase (Thermo Scientific) and 1 μM forward and
reverse (pooled 338R I & II) primers with the following conditions: initial denaturation
at 95 °C for 10 minutes; 25 cycles of denaturation at 94 °C for 30 seconds, annealing at
50 °C for 30 seconds, and extension at 72 °C for 1 minute; followed by a final extension
at 72 °C for 10 minutes.
Page 40
37
PCR products were pooled following amplification and purified using Agencourt
Ampure XP (Beckman Coulter) with a modified 1:1 volume of PCR product to Ampure
XP beads. Purified amplicons were quantified (Quant-iT PicoGreen; Invitrogen), pooled
in equal concentration and submitted to the Georgia Genomics Facility (University of
Georgia) for sequencing. A total of 1,214,355 sequences were obtained. These were
filtered, denoised, checked for chimeras, and then sorted into OTUs based on 97%
sequence similarity using the Greengenes classifier through the Qiime software pipeline
(Caporaso et al. 2010; Caporaso et al. 2011). All chloroplasts and unassigned species
(defined as those not binned to the kingdom level) were removed from the data set before
further analysis. Rarefaction curves were determined using the alpha_rarefaction.py
script in Qiime for the Chao1, Shannon, Phylogenetic Diversity (PD) Whole Tree, and
Observed Species metrics. The Chao1 metric was incorporated to assess species
richness, the Shannon index estimated alpha-diversity, Phylogenetic Diversity is a
phylogenetic measure that incorporated branch lengths of taxa from a phylogenetic tree
(Faith and Baker 2006), and Observed Species counted the number of unique OTUs
found within a sample (Caporaso et al. 2010; Caporaso et al. 2011).
We used the jackknifed_beta_diversity.py workflow script in Qiime (Caporaso et
al. 2010; Caporaso et al. 2011) to compare the gut microbiomes of individual fish. This
analysis assesses the robustness of our sequencing effort (Caporaso et al. 2010; Caporaso
et al. 2011) and determines how often individual microbiomes are clustered randomly
(Lozupone et al. 2011). The analysis used weighted UniFrac (based on normalized
abundance data) distances from our complete OTU table at an even sampling depth for all
Page 41
38
samples. A consensus tree was constructed from 999 jackknifed iterations using UPGMA
(Unweighted Pair Group Method with Arithmetic mean) clustering. We also used the
software package PRIMER (v.6; (Clarke and Gorley 2006a)) for non-metric
multidimensional scaling visualization of core gut OTUs from each species. Core gut
OTUs were transformed as Presence/Absence data of individual OTUs. The
Multiresponse permutation procedure (MRPP) performed in R (R Core Team 2009) with
the vegan statistical package (Oksanen et al. 2009) was used to test whether there were
significant differences between clustered groups of samples. MRPP was run with the
Bray-Curtis distance matrix with 999 permutations. Additional statistical analyses
including t-test, Kruskal-Wallis one way analysis of variance, and pairwise Wilcoxon rank
sum tests were performed in R (R Core Team 2009) using the vegan statistical package
(Oksanen et al. 2009).
16s rRNA Sanger Sequencing and Analysis of Sequences from Clone Libraries
DNA from mummichogs (n=5), pinfish (n=11), silver perch (n=3), black sea bass
(n=4), striped burrfish (n=4), spinner shark (n=2), and sharpnose shark (n=2) was also
amplified using Illustra puReTaq Ready-To-Go PCR Beads (GE Healthcare) with the
Bacteria-specific 16S rRNA primers 27F and 1492R (Lane 1991a) with the following
PCR conditions: initial denaturation at 95 °C for 5 minutes; 35 cycles of: denaturation at
95 °C for 45 seconds, annealing at 62 °C for 30 seconds, and extension at 72 °C for 1
minute; finishing with a final extension at 72 °C for 45 minutes. Amplified DNA was
electrophoresed on a 1% agarose gel, bands of the expected product size were excised,
Page 42
39
and then the DNA was extracted and purified using QIAGEN QIAquick gel extraction
kits. DNA extracted from the gel was cloned with TOPO TA cloning kits (Invitrogen)
using the pCR 4.0-TOPO TA vector and competent E. coli cells. Clones were selected
randomly and sequenced using the 27F primer by Genewiz (South Plainfield, NJ). All
sequences were checked for chimeras using the Bellerophon server (Huber et al. 2004).
Sequences were identified by both RDP SeqMatch (Cole et al. 2007a; Cole et al. 2009a)
and by BLAST (Johnson et al. 2008) against the non-redundant nucleotide database
(NCBI GenBank) and aligned using ClustalW (Larkin et al. 2007). Phylogenetic trees
were constructed using MEGA 5.05 (Tamura et al. 2011).
RESULTS
Cross Species Comparison
We obtained a total of 1,038,277 sequences from the 15 target species. Most
samples contained 0-10% (average 2.3%) chloroplast sequences; however, some libraries
(cultured mummichogs 2-4) contained more (59%, 96%, and 67% respectively). A total
of 719,216 sequences remained after removing chloroplasts and unassigned OTUs
(Supplementary Table 2.1), and these were assigned to 2, 226 OTUs binned to 17 phyla
(Acidobacteria, Actinobacteria, Bacteroidetes, Caldithrix, Chlorobi, Chloroflexi,
Firmicutes, Fusobacteria, Gemmatimonadetes, Nitrospirae, Planctomycetes,
Proteobacteria, Spirochaetes, Tenericutes, Thermi, and Verrucomicrobia). OTUs sorted
into the candidate phyla of OP11, SBR1093, TM6, TM7, WPS-2, WS3, and WS6 were
Page 43
40
combined into an “unclassified phylum” category which comprised between 0-3.7%
(average 0.16%) of individual sample libraries.
As evident in Figure 2.1 not only were there differences in the phyla present in the
guts of different finfish and sharks, but there was also variability among individuals of
the same species. The within-species variability was more marked in some fish, and was
particularly extreme for king mackerel and great barracuda. Despite this variability,
representatives of the same phyla were found in the guts of all samples of individual fish
species, though relative abundance varied. Excluding the category “unclassified
phylum,” richness (at the phylum level) of the gut microbiomes of different fish species
ranged from 7 to 15 phyla (average=11; Supplementary Figure 2.1). Red drum
microbiomes contained the greatest richness, whereas mahi-mahi and sandbar shark had
the lowest richness. The phyla Actinobacteria, Bacteroidetes, Firmicutes, Fusobacteria,
and Proteobacteria were found in all 15 fish gut microbiomes. The phyla Spirochaetes
and Tenericutes were recovered from 73% and 87% of the fish species.
Proteobacteria ribotypes dominated the gut microbiomes of most species,
accounting for 3-98% (mean=61% ± 34%) of the OTUs present. Firmicutes were found
in all species, but at lower relative abundance (1.3-45%, mean=17%, ± 22%). Within the
Firmicutes, Lactobacillales ribotypes were found in all fish species except mahi-mahi.
For most fish species, Lactobacillales ribotypes contributed <1% of the gut microflora
OTUs. However, Lactobacillales were more abundant among some species than others:
cultured mummichogs (2.2%), crevalle jack (2.1%), and Spanish mackerel (13%).
Page 44
41
Spirochaetes contributed <1.1% of the OTUs recovered from all species except
for mahi-mahi and barracuda, where Spirochaetes accounted for 64-98% (83% ± 17%)
and 0.05-99% (34% ± 57%), respectively, of the OTUs present. Tenericutes accounted
for 1.6, 7.9, 2.6 and 1.34% of the OTUs from wild mummichogs, juvenile and adult
pinfish, and crevalle jack, respectively, averaged across all samples of a given fish
species. Two king mackerel samples contained 18 and 82% Tenericutes OTUs.
Within each fish species, we found that the individual finfish and sharks sampled
shared 7 to 60 OTUs, defined at 97% sequence similarity (Table 2.2). For the sake of
simplicity we defined the OTUs shared by all of the fish sampled for a given species as
the core OTU group for that species, recognizing that this simplification has greater
validity for species that had several samples (i.e. mummichogs and pinfish) versus those
for which only two fish were sampled (Spanish mackerel) or for which the microbiomes
from guts of individual fish were highly divergent (e.g. great barracuda). Many of the
OTUs present in one species’ core group were also present as members of the core
groups of other species; however, no OTU was shared among all species. The three
shark species shared a core microbiome containing OTUs assigned to Cetobacterium sp.,
Photobacterium sp., and Vibrio sp. Most of the core microbiomes contained ribotypes
from the phyla Actinobacteria, Fusobacteria, Firmicutes, and Proteobacteria (mainly γ-
Proteobacteria).
OTUs binned to the Family Vibrionaceae were present in the core group of all
fish guts except Spanish mackerel. With the exception of mummichogs and Spanish
mackerel, all species shared ribotypes similar to Photobacterium spp. in their core group.
Page 45
42
The OTUs assigned to Propionibacterium sp., Vibrio sp., Pseudomonas sp. were present
in the core groups of 87%, 67%, and 67% of all target species. OTUs binned as
Escherichia sp., Staphylococcus sp., Streptococcus sp., Clostridiaceae, Clostridium sp.,
Acinetobacter sp., Corynebacterium sp., Cetobacterium sp., Shewanella sp were also
recovered from many of the species (40-53%; Table 2.3). The Lactobacillales ribotypes
assigned to Lactobacillus sp. and Streptococcus sp. were part of the core group of
mummichogs, pinfish, hogchoker, southern flounder, Spanish mackerel, king mackerel,
and crevalle jack. Similar results to our pyrosequencing analysis were also observed in
cloning and sequencing amplicons for mummichogs, pinfish, silver perch, black sea bass,
spinner shark, and Atlantic sharpnose shark. striped burrfish.
Comparison of Cultured vs. Wild Mummichogs
OTUs retrieved from cultured and wild mummichogs were distributed among 11
and 12 phyla, respectively (Figure 2.2). Proteobacteria ribotypes dominated the samples
(48% ± 11% and 72% ±21%, mean +/- S.D. for cultured versus wild fish, respectively).
Ribotypes from the phyla Actinobacteria, Fusobacteria, Firmicutes, and Bacteroidetes
were also present. Planctomycetes ribotypes were found in a greater relative abundance
in cultured fish (2.5%), and Tenericutes (1.0%) were more abundant in wild
mummichogs.
Within the phylum Proteobacteria, 67% (± 27%) of OTUs from cultured fish and
74% (± 23%) of the OTUs from wild fish were assigned to the γ-Proteobacteria. OTUs
classified as δ-Proteobacteria were only retrieved from wild fish (Figure 2.4). Within the
Page 46
43
γ-Proteobacteria, Vibrionales ribotypes were found in both cultured and wild fish at 47%
(± 38%) and 68% (± 14%) relative abundance, respectively. Pseudomonadales ribotypes
were also common, but at lower relative abundances (35% ± 38%, cultured and 18% ±
16%, wild; Figure 2.5). Vibrionaceae ribotypes accounted for 19% (± 24%) of the total
gut microflora of cultured mummichogs and 39% (± 25%) of the gut microflora of wild
mummichogs. Of the Vibrionaceae OTUs, 99% (± 24%) and 84% (± 24%) of the gut
microflora of wild and cultured fish, respectively, were binned to genus Vibrio.
The cultured and wild mummichog core gut microbiomes shared 12 OTUs sorted
among the phyla Actinobacteria, Firmicutes, and Proteobacteria (Table 2.4). The core
gut microbiome of cultured mummichogs consisted of 27 OTUS and included 15 OTUs
not shared with the core of the wild mummichogs. The core group from wild
mummichogs consisted of 41 OTUs, of which 29 were not found in the core group of
cultured mummichogs.
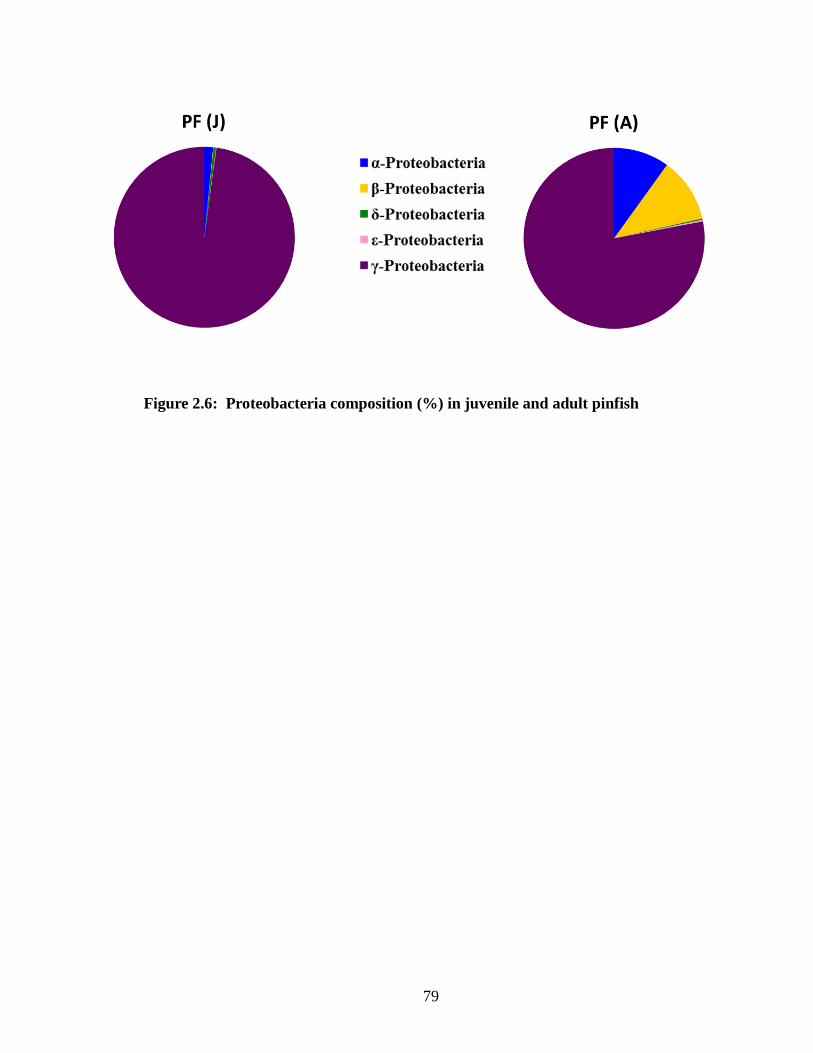
Comparison of Juvenile and Adult L. rhomboides
OTUs retrieved from juvenile and adult L. rhomboides were binned into 11 and
10 phyla respectively (Figure 2.6). Proteobacteria ribotypes dominated both groups,
accounting for 87% ± 15% (juvenile) and 79% ± 32% (adult) of the OTUs retrieved.
Ribotypes representing Actinobacteria, Firmicutes, and Tenericutes were present in both
groups but at lower relative abundances (Figure 2.7). Spirochaete ribotypes contributed
1% of the OTUs found in adult fish, but were not present in juvenile fish.
Page 47
44
The Proteobacteria ribotypes retrieved from juvenile L. rhomboides gut
microbiomes were predominantly γ-Proteobacteria; whereas, adults had additional
contributions from β-Proteobacteria (Figure 2.8). Eighty-three percent (± 14%) of the
Proteobacteria OTUs retrieved from juvenile pinfish were assigned to the family
Vibrionaceae, with those OTUs divided amongst the genera Enterovibrio (35% ± 20%)
and Vibrio (23% ± 35%). Vibrionaceae ribotypes only accounted for 17% (± 24%) of the
sequences retrieved from adult pinfish (Figure 2.9) and these could be further sorted into
Enterovibrio (4.0% ± 6.9%) and Vibrio (8.4% ±13%).
Juvenile and adult pinfish shared a core gut microflora consisting of 9 ribotypes.
The juvenile pinfish core group contained an additional 34 ribotypes, but the adult core
group only contained 5 more ribotypes (Table 2.5). The main difference between the
juvenile and adult pinfish core groups is the presence of Enterovibrio sp., Vibrio sp., and
Rhodobacterales ribotypes in the juvenile core group. The adult pinfish core group also
includes OTUs assigned to Halomonas sp. and Sphingomonas sp., neither of which was
found in the juvenile core group.
Statistical Analysis
Rarefaction curves for the Chao1, Observed Species, Phylogenetic Diversity (PD)
Whole Tree, and Shannon alpha diversity metrics are shown in Figure 2.10. Table 2.3
lists the results of the four alpha diversity metrics for all samples. Table 2.4 averages the
alpha diversity metrics across species. Wild mummichogs had the greatest richness
(Chao 1=227 ± 60.5) and the most diverse gut microflora assemblage (Observed
Page 48
45
Species=166 ± 43.0). Mahi-mahi and sandbar shark had the least diverse assemblage
(Observed Species=13.6 ± 3.35, 13.5 ± 10.2 respectively). The gut microbiomes of all
three shark species had less richness (Chao1) and diversity (Observed Species) than most
finfish species (i.e. mummichog, pinfish, black sea bass, Spanish mackerel, and crevalle
jack). The gut microbiome of the sandbar shark had the least diversity (Observed
Species=13.5 ± 10.2) and spinner shark had the most diversity (63.7 ± 57.0) of the three
shark species.
We compared the gut microflora communities from the fish we sampled using
jackknifed analysis weighted UniFrac calculations (Figure 2.11). The analysis indicated
that all finfish and shark samples, except barracuda 2 (BR2), cluster together with >75%
jackknifed support. Microbiomes from different fish of the same species did not always
cluster with each other, reflecting fish-to-fish variability in the composition of their gut
microbiomes. There is >75% support that all mahi-mahi specimens cluster together on
the same node. This is also true for both sandbar shark specimens.
The core groups of each fish species were also compared using NMDS to
visualize groupings (Figure 2.12). MRPP indicates that clusters defined at 20%, 30%,
40%, and 50% similarity are significantly different (p=0.001). The barracuda core group
was markedly different from those of the other fish. The remaining fish samples formed
two clusters at >20% similarity. One cluster included mahi-mahi, red drum, silver perch,
and the shark species. The second cluster included both mackerel; however, there is little
similarity between the core groups of the two mackerel species and they do not group
together at 30% similarity. Likewise, the flatfish species southern flounder and
Page 49
46
hogchoker core microbiomes do not group at >20% similarity. Core groups among the
herbivorous and omnivorous species of adult pinfish, mummichog, and hogchoker are >
40% similar.
We also compared the gut microbiomes of cultured and wild mummichogs and
juvenile and adult pinfish using a jackknifed analysis based on weighted UniFrac
calculations. There is >75% jackknifed support for the cluster that contains wild
mummichog 1, 2, and 4 (Figure 2.13) and cultured mummichogs 3 and 4 cluster together
with >75% jackknifed support. Adult pinfish 1, 2, and 3 and juvenile pinfish 1, 2, and 3
cluster together with >75% jackknifed support (Figure 2.14). However, the core
microbiomes of other juvenile pinfish form an additional cluster (with >75% support)
that excludes the adult pinfish samples.
DISCUSSION
Our analysis suggests that both finfish and shark gut microbiomes harbor more
diversity than previously suggested by culture-dependent methods and analysis of 16S
rRNA clone libraries (Sogin et al. 2006). We recovered ribotypes distributed among 7 to
15 different phyla. OTUs from the phyla of Acidobacteria, Caldithrix, Chlorobi,
Chloroflexi, Gemmatimonadetes, Nitrospirae, Thermi, and Verrucomicrobia were found
to be minor, rare components (<1%) of the gut microbiomes of several fish. For all fish
species, richness ranged among two to six dominant (>1%) phyla. The dominant phyla
of Actinobacteria, Bacteroidetes, Firmicutes, Fusobacteria, Planctomycetes,
Proteobacteria, and Tenericutes were consistent with those reported in the Sullam et al.
Page 50
47
(2012) meta-analysis of pooled results from previously published fish gut bacteria clone
libraries. OTUs from all of these phyla except Tenericutes were also recovered from
zebrafish, Danio rerio, in a study using 454-pyrosequencing to analyze gut microflora
(Roeselers et al. 2011). Similar phyla (i.e. Firmicutes, Bacteroidetes, Proteobacteria)
were found in human and other mammalian gut communities (Ley et al. 2008a; Ley et al.
2008b). Firmicutes and Bacteroidetes ribotypes dominate the mammalian gut
microbiomes (Ley et al. 2008a), but these ribotypes were less common and did not
dominate the gut microbiomes of the fish we analyzed.
Proteobacteria ribotypes dominated (>50%) the gut microbiomes of 67% of the
fish species we sampled. However, Firmicutes, Fusobacteria, Spirochaetes, and
Tenericutes, not Proteobacteria, were the dominant ribotypes found in the guts of
barracuda, mahi-mahi, king mackerel, Spanish mackerel, and southern flounder. Our
results also suggest that fish-to-fish variability in gut microbiome composition is
significant in some species (i.e. barracuda). This variability has been documented in
other studies of gut microflora (Ley et al. 2008b) and suggests that the composition of the
gut microflora community responds to external factors such as habitat and diet.
Proteobacteria ribotypes dominated the gut microflora of 32 of the 50 individual
fish we sampled, suggesting that they are a core component of most fish species’ gut
microflora. Within a given species, individual fish contained the same phyla
(Proteobacteria, Firmicutes, and Actinobacteria), but at varying contributions to the total
gut microflora community. As suggested in previous studies of gut microflora (Eckburg
et al. 2005; Tap et al. 2009; Roeselers et al. 2011), these phyla likely represent a “core”
Page 51
48
bacteria community. If the core gut microflora is defined as the ribotypes found in all
samples of a given species, we did not find a core microbial assemblage that
encompassed all of the fish species we sampled. This is consistent with an analysis of
fecal microflora reported by Ley et al. (2008), which found that no OTUs were shared by
all mammalian species sampled (humans and 59 terrestrial mammals). Our results
suggest that the gut microflora of each species assembles in response to the fish’s specific
physiological demands and dietary needs.
Many of the OTUs present in one species’ core group were also found in the core
groups of other species. OTUs binned to the Family Vibrionaceae were in the core
groups of all fish guts except Spanish mackerel. With the exception of mummichogs and
Spanish mackerel, all species also have OTUs similar to Photobacterium spp. in their
core group. Additionally, the ribotypes Propionibacterium sp., Vibrio sp., Pseudomonas
sp., Escherichia sp., Staphylococcus sp., Streptococcus sp., Clostridiaceae, Clostridium
sp., Acinetobacter sp., Corynebacterium sp., Cetobacterium sp., Shewanella sp. were
consistently found in the guts of several species. The prevalence of these bacteria within
gut microbial assemblages of different fish species suggests that they are important
contributors to gut function.
OTUs from genera within the Order Lactobacillales were found in 93% of fish
species. This Order includes the lactic acid bacteria species that have been previously
documented within the fish gut microflora community (Rawls et al. 2004; Izvekova et al.
2007). The same lactic acid ribotypes were found in both wild and cultured
mummichogs, but were twice as abundant in the gut microbiomes of cultured fish.
Page 52
49
However, the increased abundance of lactic acid bacteria in guts of cultured mummichog
was not statistically significant by t-test. Although the cultured mummichogs were from
a fish rearing facility, the fish were not treated with antibiotics. Further the greater
relative abundance of Lactobacillales in cultured fish may be an artifact of commercial
feed with lactic acid bacteria. Although none of the diets fed to the cultured fish report
additions of lactic acid bacteria, we recovered Streptococcus sp. OTUs from a freeze-
dried plankton diet used in this laboratory (see Chapter 3, Feeding Study). The
Lactobacillales ribotypes of Lactobacillus sp. and Streptococcus sp. were members of the
core gut microflora of 47% of fish species sampled suggesting that lactic acid bacteria
may be an important member of these gut microflora assemblages.
The mahi-mahi gut microflora community was dominated by Spirochaetes
ribotypes (83%), most of which were assigned to Brachyspira (91%). Spirochaetes were
the dominant (99%) ribotype recovered from the gut microbiome of barracuda 2, but they
were less abundant in the other two barracuda samples. The mahi-mahi samples were not
collected from the same site or at the same time; thus, the dominance of Spirochaetes
ribotypes in all three samples indicates that Spirochaetes and Brachyspira OTUs are core
members of the mahi-mahi gut microflora. The genus Brachyspira is known as an
“intestinal Spirochaete” and has been classified as a gut pathogen in pigs (Hampson and
Ahmed 2009). These bacteria have also been reported in the intestinal tract of various
mammals (including humans) and birds, and the genus includes species that are
commensals and pathogens (Bellgard et al. 2009). Our sequence data does not allow us
Page 53
50
to determine which Brachyspira species were present; however, the mahi-mahi we
sampled did not display any signs of impaired health.
The previous applications of culture-independent techniques for examining gut
microflora have revealed that Mycoplasma sp. are abundant in the gut microflora of a
variety of hosts (Giebel et al. 1990a; Holben et al. 2002b; Gulmann 2004a; Tanaka et al.
2004a; Hongoh et al. 2006; Bano et al. 2007; Ward et al. 2009a; Meziti et al. 2010a).
Tenericutes sequences were recovered from several fish in this study (mummichogs,
pinfish, king mackerel, mahi-mahi, and spinner shark); however, they were only
members of the core group of king mackerel and mahi-mahi. The Tenericutes ribotypes
from mahi-mahi, mummichogs, and pinfish were classified as Mycoplasma sp., but
ribotypes recovered from king mackerel microflora were binned as Ureaplasma sp.
Additionally, the contribution of Mycoplasma sp. ribotypes to the pinfish gut microbiome
was variable, ranging from 0 to 30%, suggesting that their presence within the gut is
influenced by environmental factors (i.e. diet, Chapter 3).
The core gut microflora of the shark species we tested (sharpnose, spinner, and
sandbar) contained Cetobacterium sp., Photobacterium sp. and Vibrio sp., with
Photobacterium ribotypes dominating the core group of all three shark species. This is
consistent with the findings of Grimes et al. (1985), who used culture-dependent methods
and reported that P. damselae is a normal member of the gut microflora of sharks.
However, our work expands on the Grimes et al. (1985) study with deeper coverage and
the application of a culture-independent technique to the survey. Our data indicate that
Actinobacteria, Firmicutes (Clostridium sp), Fusobacteria (Cetobacterium sp.), and other
Page 54
51
Proteobacteria (Campylobacter sp. and Vibrio sp.) are also important members of the
shark gut microbiome. Our findings also indicate that shark gut microbiomes have less
richness and diversity than most finfish guts we sampled.
Ley et al. (2008) concluded that gut microflora of herbivorous animals have the
greatest diversity, and that this diversity would decrease among omnivores and decrease
further among carnivores. We found lower values of all four of the diversity metrics
(Table 2.7) in gut microbiomes of the fish defined as top piscivores (mahi-mahi,
barracuda, and all shark species) (Froese and Pauly 2002; Froese and Pauly 2010).
Southern flounder, king mackerel, and Spanish mackerel are also reported to be
piscivores (Froese and Pauly 2002; Froese and Pauly 2010) ; however, the gut
microbiomes of these fish were more diverse (Observed Species=108 ± 42.7, 121 ± 30.4,
94.2 ± 73.8 respectively) and richer (Chao1=83.5 ± 46.5, 76.7 ± 23.1, 86.2 ± 63.9
respectively) than the other piscivores we sampled. The Kruskal-Wallis one way analysis
of variance indicated that there was not a statistically significant difference between the
richness and diversity of fish defined as piscivores. However, there was a statistically
significant difference in the calculated richness between invertivores/piscivores and
piscivores (p=0.05) and omnivores and piscivores (p=0.02) suggesting that richness may
be linked to a more varied diet.
The gut microbiomes of wild mummichogs, the omnivorous fish we sampled had
some of the highest diversity indices in accordance with Ley et al. (2008)’s conclusions
from studies of mammal feces that suggested that omnivore gut microflora will be more
diverse than carnivore gut communities. There was a statistically significant difference
Page 55
52
between the diversity of omnivores and piscivores (p=0.006) further suggesting a link
between increased gut microflora diversity and a more varied diet. The diversity indices
for the herbivorous fish we sampled (adult pinfish) were greater in richness and diversity
than those of the piscivores. However, adult pinfish do not appear to have the richest
community. The alpha diversity indices of gut microbiomes from the invertivore-
piscivores we sampled (red drum) were greater than piscivores and were among the
richest (Chao 1=243 ±261). There was no statistically significant difference between the
richness or diversity of omnivores, herbivores, and invertivores/piscivores, and these red
drum results may be skewed by the sample “red drum 1” whose gut microbiome had
much higher diversity indices than the other two red drum fish. The diversity metrics
also suggest that silver perch has less diversity (Observed Species=40.7 ± 25.8) much
like the piscivore species. This correlates with the results of our silver perch 16S rRNA
clone library which was composed of only Clostridium spp. and Photobacterium spp.
ribotypes. Thus, conclusions based on the analysis of both our clone and pyrosequencing
suggest a paucity of bacterial diversity within the silver perch gut microflora community.
In conclusion, the relationship between gut microbiome diversity and feeding strategy
proposed by Ley et al. (2008) is supported by our results.
Our cultured and wild mummichogs shared 12 OTUs (7-58% of total sequences)
among the phyla Actinobacteria, Firmicutes, and Proteobacteria. However, the core gut
microbiome of cultured mummichogs and wild mummichogs include additional OTUs
not shared with the other group. These results are consistent with the findings of
Roeselers et al. (2011), who found that although there were differences in the
Page 56
53
composition of gut microflora communities between cultured and wild Danio rerio, they
still shared a core group of microflora.
Juvenile and adult pinfish also shared a core group of gut microflora, consisting of
9 ribotypes (1.1-14% of total sequences). The core group of OTUs from juvenile pinfish
contained an additional 34 ribotypes (65-91% of total sequences), and the core group
from adult pinfish only contained five additional ribotypes (14-93% of total sequences).
These findings are consistent with Luczkovich and Stellwag (1993) who found
qualitative shifts in the gut microflora community correlating with the transition from
juvenile to adulthood.
The use of 454-pyrosequencing allowed us to delve deeper into this community in
an attempt to truly gauge the microbial diversity. The same genera found within the
clone library ribotypes of mummichogs, pinfish, silver perch, black sea bass, sharpnose
shark, and spinner shark were also present amongst the respective species’
pyrosequencing libraries. The longer sequences generated by Sanger sequencing cloned
amplicons allowed us to identify ribotypes at the species level. However,
pyrosequencing provides a deeper analysis of the composition of the fish gut microflora
community. This pyrosequencing study provides an assessment of the resident “core”
gut microbiota and of the variable, or transient members of the gut microflora for the fish
we sampled. The presence of many different, non-core ribotypes within the same fish
species suggests that these bacteria may be opportunistic and the result of varying
environmental factors (such as diet, Chapter 3). The fish gut microbiome contributes to
digestion and can affect nutrition, growth, reproduction, overall population dynamics, and
Page 57
54
vulnerability of the host fish to disease (MacFarlane et al. 1986). Understanding which
bacteria groups are core and variable components of the fish gut microflora is an
important precursor to further research into the functional role of gut microflora in
regards to fish physiology and health.
ACKNOWLEDGMENTS
This research was supported by NOAA Oceans and Human Health Initiative
Traineeship S0867882. We thank Richard Winn, Michelle Norris, Scott Noakes, Bradley
Tolar, Vanessa Varaljay, Jessica Jones, Andy DePaola, Drew Duckett, and Mary Price
for their assistance and advice.
Page 58
55
REFERENCES
Al-Harbi, A. H., and M. Naim Uddin. 2004. Seasonal variation in the intestinal bacterial
flora of hybrid tilapia (Oreochromis niloticus×Oreochromis aureus) cultured in
earthen ponds in Saudi Arabia. Aquaculture 229: 37-44.
Aschfalk, A., and W. Müller. 2002. Clostridium perfringens toxin types from wild-caught
Atlantic cod (Gadus morhua L.), determined by PCR and ELISA. Canadian
Journal of Microbiology 48: 365-368.
Austin, B., and D. A. Austin. 1987. Bacterial fish pathogens : disease in farmed and wild
fish. E. Horwood;Halsted Press.
Bano, N., A. Derae Smith, W. Bennett, L. Vasquez, and J. T. Hollibaugh. 2007.
Dominance of Mycoplasma in the guts of the Long-Jawed Mudsucker, Gillichthys
mirabilis, from five California salt marshes. Environmental Microbiology 9:
2636-2641.
Baross, J., and J. Liston. 1970. Occurrence of Vibrio parahaemolyticus and Related
Hemolytic Vibrios in Marine Environments of Washington State. Applied
Microbiology 20: 179-186.
Bates, J. M., E. Mittge, J. Kuhlman, K. N. Baden, S. E. Cheesman, and K. Guillemin.
2006. Distinct signals from the microbiota promote different aspects of zebrafish
gut differentiation. Developmental Biology 297: 374-386.
Bellgard, M. I. and others 2009. Genome sequence of the pathogenic intestinal spirochete
Brachyspira hyodysenteriae reveals adaptations to its lifestyle in the porcine large
intestine. PLoS ONE 4: e4641.
Benavides, A. G., J. M. Cancino, and F. P. Ojeda. 1994. Ontogenetic change in the diet of
Aplodactylus punctatus (Pisces: Aplodactylidae): an ecophysiological
explanation. Marine Biology 118: 1-5.
Blanch, A. R., M. Alsina, M. Simón, and J. Jofre. 1997. Determination of bacteria
associated with reared turbot (Scophthalmus maximus) larvae. Journal of Applied
Microbiology 82: 729-734.
Budker, P., and P. J. P. Whitehead. 1971. The life of sharks. Weidenfeld and Nicolson.
Buras, N., L. Duek, and S. Niv. 1985. Reactions of fish to microorganisms in wastewater.
Applied and Environmental Microbiology 50: 989-995.
Page 59
56
Burnett, K. G. and others 2007. Fundulus as the premier teleost model in environmental
biology: opportunities for new insights using genomics. Comparative
Biochemistry and Physiology Part D: Genomics and Proteomics 2: 257-286.
Cahill, M. M. 1990. Bacterial flora of fishes: a review. Microbial Ecology 19: 21-41.
Caporaso, J. G. and others 2010. QIIME allows analysis of high-throughput community
sequencing data. Nature Methods 7: 335-336.
Caporaso, J. G. and others 2011. Global patterns of 16S rRNA diversity at a depth of
millions of sequences per sample. Proceedings of the National Academy of
Sciences 108: 4516-4522.
Castro, P., and M. Huber. 2003. Marine biology New York, NY: McGraw-Hill.
Clarke, K., and R. Gorley. 2006. PRIMER v6. User manual/tutorial. Plymouth routine in
mulitvariate ecological research. Plymouth Marine Laboratory.
Cole, J. and others 2007. The ribosomal database project (RDP-II): introducing myRDP
space and quality controlled public data. Nucleic Acids Research 35: D169-D172.
Cole, J. and others 2009. The Ribosomal Database Project: improved alignments and new
tools for rRNA analysis. Nucleic Acids Research 37: D141-D145.
Colorni, A., A. Diamant, A. Eldar, H. Kvitt, and A. Zlotkin. 2002. Streptococcus iniae
infections in Red Sea cage-cultured and wild fishes. Diseases of Aquatic
Organisms 49: 165-170.
Colwell, R. R. 1962. The bacterial flora of Puget Sound fish. Journal of Applied
Microbiology 25: 147-158.
Constantin De Magny, G. and others 2009. Predicting the distribution of Vibrio spp. in
the Chesapeake Bay: a Vibrio cholerae case study. EcoHealth 6: 378-389.
Costello, E. K., J. I. Gordon, S. M. Secor, and R. Knight. 2010. Postprandial remodeling
of the gut microbiota in Burmese pythons. ISME J 4: 1375-1385.
DePaola, A., G. M. Capers, and D. Alexander. 1994. Densities of Vibrio vulnificus in the
intestines of fish from the U.S. Gulf Coast. Applied and Environmental
Microbiology 60: 984-988.
DePaola, A., S. McLeroy, and G. Mcmanus. 1997. Distribution of Vibrio vulnificus phage
in oyster tissues and other estuarine habitats. Applied and Environmental
Microbiology 63: 2464-2467.
Page 60
57
DePaola, A., J. L. Nordstrom, J. C. Bowers, J. G. Wells, and D. W. Cook. 2003. Seasonal
abundance of total and pathogenic Vibrio parahaemolyticus in Alabama oysters.
Applied and Environmental Microbiology 69: 1521-1526.
Eckburg, P. B. and others 2005. Diversity of the human intestinal microbial flora. Science
308: 1635-1638.
Faith, D. P., and A. M. Baker. 2006. Phylogenetic diversity (PD) and biodiversity
conservation: some bioinformatics challenges. Evolutionary bioinformatics online
2: 121.
Ferguson, R. L., E. Buckley, and A. Palumbo. 1984. Response of marine
bacterioplankton to differential filtration and confinement. Applied and
Environmental Microbiology 47: 49-55.
Fouz, B., A. E. Toranzo, M. Milán, and C. Amaro. 2000. Evidence that water transmits
the disease caused by the fish pathogen Photobacterium damselae subsp.
damselae. Journal of Applied Microbiology 88: 531-535.
Froese, R., and D. Pauly. 2002. FishBase. World Wide Web electronic publication: www.
fishbase. org.: 000-000.
---. 2010. FishBase. ICLARM.
Gallagher, M. L., J. J. Luczkovich, and E. J. Stellwag. 2001. Characterization of the
ultrastructure of the gastrointestinal tract mucosa, stomach contents and liver
enzyme activity of the pinfish during development. Journal of Fish Biology 58:
1704-1713.
Giebel, J., A. Binder, and H. Kirchhoff. 1990. Isolation of Mycoplasma moatsii from the
intestine of wild Norway rats (Rattus norvegicus). Veterinary Microbiology 22:
23-29.
Grimes, D. J., P. Brayton, R. R. Colwell, and S. H. Gruber. 1985. Vibrios as
autochthonous flora of neritic sharks. Systematic and Applied Microbiology 6:
221-226.
Gulmann, L. K. 2004. Gut-associated microbial symbionts of the marsh fiddler crab, Uca
pugnax. Massachusetts Institute of Technology.
Hampson, D. J., and N. Ahmed. 2009. Spirochaetes as intestinal pathogens: lessons from
a Brachyspira genome. Gut Pathogens 1: 1-3.
Page 61
58
Hansen, G., E. Strøm, and J. Olafsen. 1992. Effect of different holding regimens on the
intestinal microflora of herring (Clupea harengus) larvae. Applied and
Environmental Microbiology 58: 461-470.
Hansen, G. H., and J. A. Olafsen. 1999. Bacterial interactions in early life stages of
marine cold water fish. Microbial Ecology 38: 1-26.
Head, I. M., J. R. Saunders, and R. W. Pickup. 1998. Microbial evolution, diversity, and
ecology: a decade of ribosomal RNA analysis of uncultivated microorganisms.
Microbial Ecology 35: 1-21.
Holben, W. E., P. Williams, M. Saarinen, L. K. Särkilahti, and J. H. A. Apajalahti. 2002.
Phylogenetic analysis of intestinal microflora indicates a novel Mycoplasma
phylotype in farmed and wild salmon. Microbial Ecology 44: 175-185.
Hongoh, Y., M. Ohkuma, and T. Kudo. 2006. Molecular analysis of bacterial microbiota
in the gut of the termite Reticulitermes speratus (Isoptera; Rhinotermitidae).
FEMS Microbiology Ecology 44: 231-242.
Horn, M. H. 1989. Biology of marine herbivorous fishes. Oceanography and Marine
Biology Annual Review 27: 167-272.
Huber, T., G. Faulkner, and P. Hugenholtz. 2004. Bellerophon: a program to detect
chimeric sequences in multiple sequence alignments. Bioinformatics 20: 2317-
2319.
Iwamoto, M., T. Ayers, B. E. Mahon, and D. L. Swerdlow. 2010. Epidemiology of
seafood-associated infections in the United States. Clinical Microbiology Reviews
23: 399-411.
Izvekova, G., E. Izvekov, and A. Plotnikov. 2007. Symbiotic microflora in fishes of
different ecological groups. Biology Bulletin 34: 610-618.
Janssen, W. A., and C. D. Meyers. 1968. Fish: serologic evidence of infection with
human pathogens. Science 159: 547-548.
Johnson, M., I. Zaretskaya, Y. Raytselis, Y. Merezhuk, S. Mcginnis, and T. L. Madden.
2008. NCBI BLAST: a better web interface. Nucleic Acids Research 36: W5-W9.
Kelly, M. T. 1982. Effect of temperature and salinity on Vibrio (Beneckea) vulnificus
occurrence in a Gulf Coast environment. Applied and Environmental
Microbiology 44: 820-824.
Page 62
59
Kim, D. H., J. Brunt, and B. Austin. 2007. Microbial diversity of intestinal contents and
mucus in rainbow trout (Oncorhynchus mykiss). Journal of Applied Microbiology
102: 1654-1664.
Lane, D. 1991. 16S/23S rRNA sequencing. Nucleic acid techniques in bacterial
systematics.
Larkin, M. and others 2007. Clustal W and Clustal X version 2.0. Bioinformatics 23:
2947-2948.
Lehane, L., and G. T. Rawlin. 2000. Topically acquired bacterial zoonoses from fish: a
review. Medical Journal of Australia 173: 256-259.
Ley, R. E., F. Bäckhed, P. Turnbaugh, C. A. Lozupone, R. D. Knight, and J. I. Gordon.
2005. Obesity alters gut microbial ecology. Proceedings of the National Academy
of Sciences 102: 11070-11075.
Ley, R. E. and others 2008a. Evolution of mammals and their gut microbes. Science 320:
1647-1651.
Ley, R. E., C. A. Lozupone, M. Hamady, R. Knight, and J. I. Gordon. 2008b. Worlds
within worlds: evolution of the vertebrate gut microbiota. Nature Reviews
Microbiology 6: 776-788.
Lipp, E. K., C. Rodriguez-Palacios, and J. B. Rose. 2001. Occurrence and distribution of
the human pathogen Vibrio vulnificus in a subtropical Gulf of Mexico estuary.
Hydrobiologia 460: 165-173.
Liston, J. 1957. The occurrence and distribution of bacterial types on flatfish. Journal of
General Microbiology 16: 205-216.
Lozupone, C., M. E. Lladser, D. Knights, J. Stombaugh, and R. Knight. 2011. UniFrac:
an effective distance metric for microbial community comparison. ISME J 5: 169-
172.
Luczkovich, J. J., and E. J. Stellwag. 1993. Isolation of cellulolytic microbes from the
intestinal tract of the pinfish, Lagodon rhomboides: size-related changes in diet
and microbial abundance. Marine Biology 116: 381-388.
Lynch, J. M., and J. E. Hobbie. 1988. The animal environment., p. 163–192. In Action:
Concepts and Applications in Microbial Ecology Blackwell Scientific
Publications.
Page 63
60
MacFarlane, R., J. McLaughlin, and G. Bullock. 1986. Quantitative and qualitative
studies of gut flora in striped bass from estuarine and coastal marine
environments. Journal of Wildlife Diseases 22: 344-348.
Martin-Antonio, B. and others 2007. Intestinal microbiota variation in Senegalese sole
(Solea senegalensis) under different feeding regimes. Aquaculture research 38:
1213-1222.
Mead, G. C. 1997. Bacteria in the gastrointestinal tract of birds. Gastrointestinal
Microbiology 2: 216-240.
Meziti, A., A. Ramette, E. Mente, and K. A. Kormas. 2010. Temporal shifts of the
Norway lobster (Nephrops norvegicus) gut bacterial communities. FEMS
Microbiology Ecology 74: 472-484.
Montgomery, W. L., and P. E. Pollak. 1988. Gut anatomy and pH in a red sea
surgeonfish, Acanthurus nigrofuscus. Marine Ecology Progress Series. Oldendorf
44: 7-13.
Moran, D., S. J. Turner, and K. D. Clements. 2005. Ontogenetic development of the
gastrointestinal microbiota in the marine herbivorous fish Kyphosus sydneyanus.
Microbial Ecology 49: 590-597.
Motes, M. L. and others 1998. Influence of water temperature and salinity on Vibrio
vulnificus in Northern Gulf and Atlantic Coast oysters (Crassostrea virginica).
Applied and Environmental Microbiology 64: 1459-1465.
Mountfort, D. O., J. Campbell, and K. D. Clements. 2002. Hindgut fermentation in three
species of marine herbivorous fish. Applied and Environmental Microbiology 68:
1374-1380.
Muegge, B. D. and others 2011. Diet drives convergence in gut microbiome functions
across mammalian phylogeny and within humans. Science 332: 970-974.
Muñoz, A. A., and F. P. Ojeda. 2000. Ontogenetic changes in the diet of the herbivorous
Scartichthys viridis in a rocky intertidal zone in central Chile. Journal of Fish
Biology 56: 986-998.
Nayak, S. K. 2010. Role of gastrointestinal microbiota in fish. Aquaculture research 41:
1553-1573.
Newman, J. T., B. J. Cosenza, and J. D. Buck. 1972. Aerobic microflora of the Bluefish
(Pomatomus saltatrix) intestine. Journal of the Fisheries Research Board of
Canada 29: 333-336.
Page 64
61
Ohwada, K., P. S. Tabor, and R. R. Colwell. 1980. Species composition and
barotolerance of gut microflora of deep-sea benthic macrofauna collected at
various depths in the Atlantic Ocean. Applied and Environmental Microbiology
40: 746-755.
Oksanen, J. and others 2009. vegan: Community Ecology Package. R package version
1.15-2. 2009.
Oliver, J. D. 2006. The viable but non-culturable state in the human pathogen Vibrio
vulnificus. FEMS Microbiology Letters 133: 203-208.
Onarheim, A. M., R. Wiik, J. Burghardt, and E. Stackebrandt. 1994. Characterization and
identification of two Vibrio species indigenous to the intestine of fish in cold sea
water; description of Vibrio iliopiscarius sp. nov. Systematic and Applied
Microbiology 17: 370-379.
Oxley, A. P. A., W. Shipton, L. Owens, and D. Mckay. 2002. Bacterial flora from the gut
of the wild and cultured banana prawn, Penaeus merguiensis. Journal of Applied
Microbiology 93: 214-223.
Penry, D. L., and P. A. Jumars. 1987. Modeling animal guts as chemical reactors.
American Naturalist: 69-96.
Pough, F. H. 1973. Lizard energetics and diet. Ecology: 837-844.
R Core Team. 2009. R: A Language and Environment for Statistical Computing. R
Foundation for Statistical Computing.
Randa, M. A., M. F. Polz, and E. Lim. 2004. Effects of temperature and salinity on Vibrio
vulnificus population dynamics as assessed by quantitative PCR. Applied and
Environmental Microbiology 70: 5469-5476.
Ransom, B. L. 2008. Intestinal microflora community composition of six Actinopterygii
fish species in the southeastern United States University of Georgia.
Rawls, J. F., B. S. Samuel, and J. I. Gordon. 2004. Gnotobiotic zebrafish reveal
evolutionarily conserved responses to the gut microbiota. Proceedings of the
National Academy of Sciences 101: 4596-4601.
Rimmer, D. 1986. Changes in diet and the development of microbial digestion in juvenile
buffalo bream, Kyphosus cornelii. Marine Biology 92: 443-448.
Ringø, E. 1993a. Does chromic oxide (Cr2O3) affect faecal lipid and intestinal bacterial
flora in Arctic charr. Salvelinus alpinus (L.)? Aquaculture Research 24: 767-776.
Page 65
62
---. 1993b. Does dietary linoleic acid affect intestinal microflora in Arctic charr,
Salvelinus alpinus (L.)? Aquaculture Research 24: 133-135.
Ringø, E., and T. H. Birkbeck. 1999. Intestinal microflora of fish larvae and fry.
Aquaculture Research 30: 73-93.
Ringø, E., J. B. Lødemel, R. Myklebust, T. Kaino, T. M. Mayhew, and R. E. Olsen. 2001.
Epithelium-associated bacteria in the gastrointestinal tract of Arctic charr
(Salvelinus alpinus L.). An electron microscopical study. Journal of Applied
Microbiology 90: 294-300.
Ringø, E., R. E. Olsen, T. M. Mayhew, and R. Myklebust. 2003. Electron microscopy of
the intestinal microflora of fish. Aquaculture 227: 395-415.
Ringø, E., and E. Strøm. 1994. Microflora of Arctic charr, Salvelinus alpinus (L.):
gastrointestinal microflora of free-living fish and effect of diet and salinity on
intestinal microflora. Aquaculture Research 25: 623-629.
Ringø, E., E. Strøm, and J. A. Tabachek. 1995. Intestinal microflora of salmonids: a
review. Aquaculture Research 26: 773-789.
Roeselers, G. and others 2011. Evidence for a core gut microbiota in the zebrafish. ISME
J 5: 1595-1608.
Romero, J., and P. Navarrete. 2006. 16S rDNA-based analysis of dominant bacterial
populations associated with early life stages of coho salmon (Oncorhynchus
kisutch). Microbial Ecology 51: 422-430.
Ruby, E., and K. Nealson. 1978. Seasonal changes in the species composition of
luminous bacteria in nearshore seawater. Limnology and Oceanography: 530-533.
Sakata, T. 1990. Microflora in the digestive tract of fish and shellfish, p. 171-176. In
Microbiology in Poecilotherms. Elsevier.
Scallan, E. and others 2011. Foodborne illness acquired in the United States—major
pathogens. Emerging Infectious Diseases 17.
Sera, H., and Y. Ishida. 1972a. Bacterial flora in the digestive tract of marine fish. III.
Classification of isolated bacteria. Bulletin of the Japanese Society for the Science
of Fish 38: 853-858.
---. 1972b. Bacterial flora in the digestive tracts of marine fish-II. Changes of bacterial
flora with time lapse after ingestion of diet. Bulletin of the Japanese Society for
the Science of Fish 38: 633-637.
Page 66
63
Shin, J. D., M. G. Shin, S. P. Suh, D. W. Ryang, R. J.S, and F. S. Nolte. 1996. Primary
Vibrio damsela septicemia. Clinical Infectious Diseases 22: 856–857.
Sibly, R. M., and P. Calow. 1986. Physiological ecology of animals: an evolutionary
approach. Blackwell Scientific Publications.
Skjermo, J., and O. Vadstein. 1999. Techniques for microbial control in the intensive
rearing of marine larvae. Aquaculture 177: 333-343.
Skrodenytė-Arbaĉiauskienė, V. 2007. Enzymatic activity of intestinal bacteria in roach
Rutilus rutilus L. Fisheries Science 73: 964-966.
Skrodenyte-Arbaciauskiene, V., A. Sruoga, and D. Butkauskas. 2006. Assessment of
microbial diversity in the river trout Salmo trutta fario L. intestinal tract identified
by partial 16S rRNA gene sequence analysis. Fisheries Science 72: 597-602.
Sogin, M. L. and others 2006. Microbial diversity in the deep sea and the underexplored
“rare biosphere”. Proceedings of the National Academy of Sciences 103: 12115-
12120.
Spanggaard, B., I. Huber, J. Nielsen, T. Nielsen, K. F. Appel, and L. Gram. 2000. The
microflora of rainbow trout intestine: a comparison of traditional and molecular
identification. Aquaculture 182: 1-15.
Stoner, A. W., and R. J. Livingston. 1984. Ontogenetic patterns in diet and feeding
morphology in sympatric sparid fishes from seagrass meadows. Copeia: 174-187.
Strøm, E. 1988. Melkesyrebakt’erier I fb ketarm. Isolasjon, Karaktesisies og egnekaper.
M. Sci. Norwegian College of Fishery Science.
Strom, M. S., and R. N. Paranjpye. 2000. Epidemiology and pathogenesis of Vibrio
vulnificus. Microbes and Infection 2: 177-188.
Sugita, H., M. Tsunohara, T. Ohkoshi, and Y. Deguchi. 1988. The establishment of an
intestinal microflora in developing goldfish (Carassius auratus) of culture ponds.
Microbial Ecology 15: 333-344.
Sullam, K. E. and others 2012. Environmental and ecological factors that shape the gut
bacterial communities of fish: a meta-analysis. Molecular Ecology.
Tamura, K., D. Peterson, N. Peterson, G. Stecher, M. Nei, and S. Kumar. 2011. MEGA5:
molecular evolutionary genetics analysis using maximum likelihood, evolutionary
distance, and maximum parsimony methods. Molecular biology and evolution 28:
2731-2739.
Page 67
64
Tanaka, R., M. Ootsubo, T. Sawabe, Y. Ezura, and K. Tajima. 2004. Biodiversity and in
situ abundance of gut microflora of abalone (Haliotis discus hannai) determined
by culture-independent techniques. Aquaculture 241: 453-463.
Tantillo, G. M., M. Fontanarosa, A. Di Pinto, and M. Musti. 2004. Updated perspectives
on emerging vibrios associated with human infections. Letters in Applied
Microbiology 39: 117-126.
Tap, J. and others 2009. Towards the human intestinal microbiota phylogenetic core.
Environmental Microbiology 11: 2574-2584.
Thompson-Chagoyán, O. C., J. Maldonado, and A. Gil. 2005. Aetiology of inflammatory
bowel disease (IBD): role of intestinal microbiota and gut-associated lymphoid
tissue immune response. Clinical Nutrition 24: 339-352.
Thyssen, A., L. Grisez, R. Van Houdt, and F. Ollevier. 1998. Phenotypic characterization
of the marine pathogen Photobacterium damselae subsp. piscicida. International
Journal of Systematic Bacteriology 48: 1145-1151.
Trust, T. J., L. M. Bull, B. R. Currie, and J. T. Buckley. 1979. Obligate anaerobic bacteria
in the gastrointestinal microflora of the grass carp (Ctenopharyngodon idella),
goldfish (Carassius auratus), and rainbow trout (Salmo gairdneri). Journal of the
Fisheries Research Board of Canada 36: 1174-1179.
Turnbaugh, P. J., R. E. Ley, M. A. Mahowald, V. Magrini, E. R. Mardis, and J. I.
Gordon. 2006. An obesity-associated gut microbiome with increased capacity for
energy harvest. Nature 444: 1027-1131.
Uchii, K. and others 2006. Genetic and physiological characterization of the intestinal
bacterial microbiota of Bluegill (Lepomis macrochirus) with three different
feeding habits. Microbial Ecology 51: 277-284.
Verner-Jeffreys, D. W., R. J. Shields, I. R. Bricknell, and T. H. Birkbeck. 2003. Changes
in the gut-associated microflora during the development of Atlantic halibut
(Hippoglossus hippoglossus L.) larvae in three British hatcheries. Aquaculture
219: 21-42.
Ward, N., B. Steven, K. Penn, B. Methé, and W. Detrich. 2009. Characterization of the
intestinal microbiota of two Antarctic notothenioid fish species. Extremophiles
13: 679-685.
White, T. 1985. When is a herbivore not a herbivore? Oecologia 67: 596-597.
Page 68
65
Wright, A. C., R. T. Hill, J. A. Johnson, M. C. Roghman, R. R. Colwell, and J. G. Morris.
1996. Distribution of Vibrio vulnificus in the Chesapeake Bay. Applied and
Environmental Microbiology 62: 717-724.
Yoshimizu, M., and T. Kimura. 1976. Study on the intestinal microflora of salmonids.
魚病研究= Fish Pathology 10: 243-259.
Zimmerman, L. C., and C. R. Tracy. 1989. Interactions between the environment and
ectothermy and herbivory in reptiles. Physiological Zoology: 374-409.
Zlotkin, A., H. Hershko, and A. Eldar. 1998. Possible transmission of Streptococcus iniae
from wild fish to cultured marine fish. Applied and Environmental Microbiology
64: 4065-4067.
Page 69
66
Table 2.1: Species Used in Comparison of Gut Microflora
Species Order Family Feeding
Strategy1 Habitat
Digestive
Physiology Hogchoker (HC)
(Trinectes maculatus)
Pleuronectiformes Achiridae C
Omnivore
Invertivore
Demersal;
Freshwater-Marine
Short Intestine
Pyloric Caeca
Silver Perch (SP)
(Bairdiella chrysoura)
Perciformes Sciaenidae C
Invertivore
Demersal;
Brackish-Marine
Differentiated
Pinfish (PF)
(Lagodon rhomboides)
Perciformes Sparidae C/H**
Herbivore
Invertivore
Demersal;
Brackish-Marine
Differentiated
Elongated
Intestine
Southern Flounder (FL)
(Paralichthys lethostigma)
Pleuronectiformes Paralichthyidae C
Piscivore
Demersal;
Brackish-Marine
Short Intestine
Pyloric Caeca
Mummichog (MC)
(Fundulus heteroclitus)
Cyprinodontiformes Fundulidae O
Omnivore
Benthopelagic;
Freshwater-Marine
Simple Tube
Black Sea Bass (BSB)
(Centropristis striata)
Perciformes Serranidae C
Invertivore
Piscivore
Reef-associated;
Marine
Differentiated
Striped Burrfish (SB)***
(Chilomycterus schoepfi)
Tetraodontiformes Diodontidae C
Invertivore
Reef-associated;
Marine
Differentiated
Red Drum (RD)
(Sciaeops ocellatus)
Perciformes Sciaenidae C
Invertivore
Piscivore
Demersal;
Brackish-Marine
Folded Intestine
Pyloric Caeca
Crevalle Jack (JC)
(Caranx hippos)
Perciformes Carangidae C
Invertivore
Piscivore
Reef-associated;
Brackish-Marine
Pyloric Caeca
Spanish Mackerel (SPM)
(Scomberomorus maculatus)
Perciformes Scombridae C
Piscivore
Pelagic-neritic;
Marine
Folded Intestine;
Pyloric Caeca
King Mackerel (KM)
(Scomberomorus cavalla)
Perciformes Scombridae C
Piscivore
Reef-associated
Marine
Folded Intestine
Pyloric Caeca
Page 70
67
C-carnivore, H-herbivore, O-omnivore; 1(Froese et al. 1992; Froese & Pauly 2010); **L. rhomboides undergo ontogenetic diet shift
from carnivorous to herbivorous; *** only 16S rRNA clone library available.
Mahi-mahi (MH)
(Coryphaena hippurus)
Perciformes Coryphaenidae C
Piscivore
Pelagic-neritic;
Brackish-Marine
Short Intestine
Pyloric Caeca
Great Barracuda (BR)
(Sphyraena barracuda)
Perciformes Sphyraenidae C
Piscivore
Reef-associated
Brackish-Marine
Short Intestine
Spinner Shark (SPN)
(Carcharhinus brevipinna)
Carcharhiniformes Carcharhinidae C
Piscivore
Reef-associated;
Marine
Short Intestine
Spiraled Valve
Atlantic Sharpnose Shark (SHP)
(Rhizoprionodon terraenovae )
Carcharhiniformes Carcharhinidae C
Piscivore
Demersal;
Brackish-Marine
Short Intestine
Spiraled Valve
Sandbar Shark (SDB)
(Carcharhinus plumbeus)
Carcharhiniformes Carcharhinidae C
Piscivore
Benthopelagic;
Brackish-Marine
Short Intestine
Spiraled Valve
Page 71
68
Figure 2.1: Distribution of bacterial phyla (as % of ribotypes retrieved) in
individual samples of 12 finfish and 3 shark species determined with 454-
pyrosequencing.
C (cultured population), W (wild population), J (juvenile population), and A (adult
population).
Page 72
69
Table 2.2: Core gut microflora of target species. Core gut microflora included OTUs
found among all samples of a species. The top five core phylotypes are listed in order of
greatest abundance. Numbers in parentheses indicate that there were multiple OTUs of
this ribotype.
Species # of Shared OTUS
(Core)
% of total
sequences
Top 5 Core Ribotypes (in abundance)
Cultured
Mummichogs
27
(50-68%)
Cetobacterium sp., Propionibacterium sp., Vibrio
sp., Acidovorax sp., Pseudomonas sp.
Wild
Mummichogs
41
(28-76%)
Vibrio sp., Photobacterium sp., Pseudomonas,
Halomonas sp., Propionibacterium sp.
Mummichogs
(All)
12
(7-58%)
Vibrio sp., Propionibacterium sp., Pseudomonas
sp., Moraxellaceae, Acidovorax sp.
Juvenile
Pinfish
43
(65-91%)
Vibrio sp., Enterovibrio sp., Vibrionaceae,
Staphylococcus sp., Propionibacterium sp.
Adult Pinfish 14
(14-93%)
Shewanella sp., Halomonas sp., Photobacterium
sp., Propionibacterium sp., Corynebacterium sp.
Pinfish (All) 10
(1.1-14%)
Photobacterium sp., Propionibacterium sp.,
Staphylococcus sp., Pseudomonas sp.,
Corynebacterium sp.
Silver Perch 20
(69-99%)
Photobacterium sp. (2), Clostridiaceae,
Vibrionaceae (2)
Black Sea
Bass
12
(9-81%)
Photobacterium sp., Propionibacterium sp.,
Ruegeria sp., Corynebacterium sp., Escherichia
sp.
Hogchoker 36
(61-92%)
Shewanella sp., Halomonas sp.,
Propionibacterium sp., Pseudomonas sp. (2)
Southern
Flounder
21
(12-41%)
Photobacterium sp., Clostridiaceae, Clostridium
sp., Clostridiaceae (2)
Spanish
Mackerel
26
(57-62%)
Alicyclobacillus sp., Propionibacterium sp.,
Pseudomonas sp. (2), Corynebacterium sp.
King Mackerel 60
(94-96%)
Photobacterium sp., Ureaplasma sp.,
Acinetobacter sp., Cetobacterium sp.,
Alicyclobacillus sp.
Red Drum 15
(16-74%)
Photobacterium sp., Cetobacterium sp.,
Clostridiaceae (2), Vibrio sp.
Crevalle Jack 20
(20-91%)
Photobacterium sp., Alicyclobacillus sp.,
Pseudomonas sp., Staphylococcus sp.,
Propionibacterium sp.
Mahi-mahi 13
(98-99%)
Brachyspira sp., Spirochaetes,
Ruminococcaceae, Cetobacterium sp.,
Photobacterium sp.
Page 73
70
Barracuda 7
(0.10-74%)
Photobacterium sp., Acinetobacter sp. (2),
Escherichia sp., Enterobacteriaceae
Sharpnose
Shark
19
(69-74%)
Photobacterium sp. (2), Vibrio sp.,
Campylobacter sp., Propionibacterium sp.
Spinner Shark 14
(82-90%)
Photobacterium sp., Propiongenium sp.,
Clostridiaceae, Clostridium sp., Vibrio sp.
Sandbar Shark 8
(97-98%)
Photobacterium sp. (2), Vibrio sp.,
Cetobacterium sp., Vibrio sp.
Page 74
71
Table 2.3: Comparison of the core group of gut microflora between sampled fish species.
Species # of Core
OTUs
Cory
neb
act
eriu
m
Pro
pio
nib
act
eriu
m
Ali
cycl
ob
aci
llu
s
Clo
stri
dia
ceae
Clo
stri
diu
m
Sta
ph
ylo
cocc
us
Str
epto
cocc
us
Cet
ob
act
eriu
m
Aci
net
ob
act
er
Esc
her
ich
ia
Ph
oto
bact
eriu
m
Pse
ud
om
on
as
Sh
ewan
ella
Vib
rio
Mummichog (C) 27 X X X X X X X X X
Mummichog (W) 41 X X X X X X X X X
Pinfish (J) 43 X X X X X X X X X X
Pinfish (A) 14 X X X X X X X X
Silver Perch 20 X X X X X X X
Black Sea Bass 12 X X X X X
Hogchoker 36 X X X X X X X X X
S. Flounder 21 X X X X X X X X X X
Sp. Mackerel 26 X X X X X X X X
King Mackerel 60 X X X X X X X X X X X X X X
Red Drum 15 X X X X X X X
Crevalle Jack 20 X X X X X X X X X X
Mahi-mahi 13 X X X X X
Page 75
72
Barracuda 7 X X X
Sharpnose Shark 19 X X X X X X X
Spinner Shark 14 X X X X X
Sandbar Shark 8 X X X
Occurrence 9 12 8 7 7 9 6 7 8 10 15 12 7 12
Page 76
73
Figure 2.2: Composition of the gut microbiome (phylum level, % of ribotypes
retrieved) for cultured (MC (C)) and wild (MC (W)) mummichog.
Page 77
74
Figure 2.3: Proteobacteria composition (%) in cultured and wild mummichogs
Page 78
75
Figure 2.4: γ-Proteobacteria composition (%) in cultured and wild mummichogs
Page 79
76
Table 2.4: Core OTUs within the mummichog gut microbiome.
Core gut microflora included OTUs found among all samples of a species. Numbers in
parentheses indicate that there were multiple OTUs of this ribotype.
Species # of Shared
OTUS (Core)
Core OTUs
Cultured
Mummichogs
27 Corynebacterium sp. (5), Propionibacterium sp.,
Alicyclobacillus sp., Staphylococcus sp.,
Lactococcus sp., Streptococcus sp. (2),
Anaerococcus sp., Cetobacterium sp., Pirellulales,
Rhodopirellula sp., Planctomyces sp. (2),
Aquabacterium sp., Comamonadaceae,
Acidovorax sp., Shewanella sp., Moraxellaceae,
Pseudomonas sp. (3), Vibrio sp.,
Stenotrophomonas sp.
Wild
Mummichogs
41 Brevibacterium sp., Corynebacterium sp. (7),
Micrococcus sp., Mycobacterium sp.,
Propionibacterium sp., Flavobacteriaceae
Staphylococcus sp., Lactobacillus sp.,
Streptococcus sp., Finegoldia sp.,
Caulobacteraceae, Methylobacterium sp.,
Sphingomonadaceae
Sphingopyxis sp., Burkholderiales, Acidovorax sp.,
Comamonas sp., Delftia sp., Rhodocyclales,
Pseudoalteromonas sp. (2), Escherichia sp.,
Halomonas sp., Moraxellaceae, Acinetobacter sp. (2), Pseudomonas sp. (4), Enterovibrio sp.,
Photobacterium sp., Vibrio sp. (3)
Mummichogs
(All)
12 Corynebacterium sp. (4), Propionibacterium sp.
(1), Staphylococcus sp., Streptococcus sp.,
Acidovorax sp., Moraxellaceae, Pseudomonas sp.
(2), Vibrio sp.
Page 80
77
Table 2.5: Core gut microflora within pinfish
Core gut microflora included OTUs found among all samples of a species. Numbers in
parentheses indicate that there were multiple OTUs of this ribotype.
Species # of Shared
OTUS (Core)
Top 5 Core Phylotypes (in abundance)
Juvenile
Pinfish
43 Vibrio sp., Enterovibrio sp., Vibrionaceae,
Staphylococcus sp., Propionibacterium sp.
Adult Pinfish 14 Shewanella sp., Halomonas sp., Photobacterium
sp., Propionibacterium sp., Corynebacterium sp.
Pinfish (All) 10 Photobacterium sp., Propionibacterium sp.,
Staphylococcus sp., Pseudomonas sp.,
Corynebacterium sp.
Page 81
78
Figure 2.5: Composition of the gut microbiome (phylum level, % of ribotypes
retrieved) for juvenile (PF-J) and adult pinfish (PF-A)
Page 82
79
Figure 2.6: Proteobacteria composition (%) in juvenile and adult pinfish
Page 83
80
Figure 2.7: Composition of Vibrionaceae ribotypes retrieved from juvenile and adult
pinfish gut microbiomes (genus level, % of all ribotypes retrieved)
Page 84
81
a) b)
c) d)
MC1 (C) MC1 (W) SP1 BSB1 HC1 FL1 MH1
MC2 (C) MC2 (W) SP2 BSB2 HC2 FL2 MH2
MC3 (C) MC3 (W) SP3 BSB3 HC3 FL3 MH3
MC4 (C) MC4 (W) RD1 JC1 BR1 SPM1
PF1 (J) PF1 (A) RD2 JC2 BR2 SPM2
PF2 (J) PF2 (A) RD3 JC3 BR3 KM1
PF3 (J) PF3 (A) SDB1 SPN1 SHP1 KM2
PF4 (J) PF4 (A) SDB2 SPN2 SHP2
Figure 2.8: Rarefaction curves for alpha-diversity metrics of a) Chao1, b) Observed
Species, c) PD_Whole Tree, and d) Shannon index
Page 85
82
Table 2.6: Alpha Diversity Metrics of Chao1, Observed Species, PD_Whole Tree,
and Shannon index. Diversity values were determined for individual samples at 2000
sequences/sample. For those samples with < 2000 sequences, values were recorded at the
maximum sequence length.
Sample Sequences/
Sample Chao1
Observed
Species
PD_Whole
Tree Shannon
MC1-C 2000 113 90.7 11.2 3.54
MC2-C 2000 125 97.7 10.1 3.46
MC3-C 1710 108 102 11.3 5.32
MC4-C 2000 136 123 11.5 4.96
MC5-W 2000 286 201 19.0 5.53
MC6-W 2000 142 110 10.2 4.07
MC7-W 2000 243 197 18.5 5.33
MC8-W 2000 236 155 15.4 3.24
PF1-J 2000 142 66.7 8.56 1.63
PF2-J 2000 143 117 11.7 3.26
PF3-J 2000 193 115 11.3 3.06
PF4-J 2000 137 80.1 8.90 2.72
PF1-A 2000 109 65.5 6.84 3.03
PF2-A 2000 45.6 33.3 5.70 1.58
PF3-A 2000 54.1 44.7 5.89 1.76
PF4-A 2000 230 184 14.9 5.02
SP1 2000 44.4 30.4 2.80 2.51
SP2 2000 37.7 21.6 2.62 1.76
SP3 2000 95.1 70.1 8.53 2.57
BSB1 2000 179 148 14.4 5.04
BSB2 1030 168 127 13.2 4.80
BSB3 2000 79.9 30.5 4.59 3.06
HC1 2000 126 105 11.1 3.71
HC2 2000 193 131 14.3 3.36
HC3 2000 120 85.4 11.4 2.41
FL1 2000 75.0 44.8 4.56 3.33
FL2 2000 156 135 14.0 4.85
FL3 2000 93.4 70.5 7.46 2.17
SPM1 810 42.0 41.0 6.42 4.23
SPM2 2000 146 131 11.8 5.57
KM1 2000 100 60.3 6.40 1.74
KM2 2000 143 93.0 10.5 1.68
RD1 2000 541 278 23.3 5.68
RD2 2000 134 82.9 10.2 2.29
RD3 2000 52.9 41.4 3.24 3.12
JC1 2000 145 135 12.4 5.73
JC2 2000 204 176 13.8 5.61
JC3 2000 97.1 60.2 5.81 1.20
MH1 2000 28.7 16.1 2.99 2.07
MH2 2000 14.3 9.80 2.42 0.37
MH3 2000 27.5 14.9 2.64 1.07
BR1 840 72.7 59.0 6.22 2.98
BR2 2000 13.1 7.60 1.77 0.05
BR3 2000 25.6 18.6 2.93 1.30
SHP1 2000 136 98.6 10.9 2.67
SHP2 2000 30.2 17.6 3.43 0.91
SPN1 2000 27.3 23.4 3.11 2.32
Page 86
83
SPN2 2000 149 104 11.5 2.22
SDB1 2000 7.80 6.30 1.42 0.13
SDB2 2000 42.5 20.7 3.03 0.28
Page 87
84
Table 2.7: Alpha Diversity Metrics for each species.
Listed values are averages among samples with standard deviations in parentheses.
Species Chao1 Observed
Species
PD_Whole
Tree Shannon
MC-C 120 (12.4) 103 (13.8) 11.0 (0.62) 4.32 (0.96)
MC-W 227 (60.5) 166 (43.0) 15.7 (4.07) 4.54 (1.08)
PF-J 154 (26.3) 94.6 (25.0) 10.1 (1.61) 2.67 (0.72)
PF-A 110 (84.9) 81.9 (69.5) 8.33 (4.40) 2.85 (1.59)
SP 59.1 (31.4) 40.7 (25.8) 4.65 (3.37) 2.28 (0.45)
BSB 142 (54.4) 102 (62.7) 10.7 (5.36) 4.30 (1.08)
HC 146 (40.3) 107 (22.8) 12.3 (1.81) 3.16 (0.67)
FL 108 (42.7) 83.5 (46.5) 8.67 (4.82) 3.45 (1.34)
SPM 94.2 (73.8) 86.2 (63.9) 9.13 (3.83) 4.90 (0.95)
KM 121 (30.4) 76.7 (23.1) 8.44 (2.89) 1.71 (0.04)
RD 243 (261) 134 (126) 12.3 (10.2) 3.70 (1.77)
JC 149 (53.6) 124 (58.9) 10.7 (4.29) 4.18 (2.58)
MH 23.5 (8.02) 13.6 (3.35) 2.68 (0.28) 1.17 (0.86)
BR 37.2 (31.4) 28.4 (27.1) 3.64 (2.31) 1.44 (1.47)
SHP 83.2 (75.0) 58.1 (57.3) 7.20 (5.30) 1.79 (1.25)
SPN 88.4 (86.4) 63.7 (57.0) 7.32 (5.95) 2.27(0.07)
SDB 25.2 (24.5) 13.5 (10.2) 2.22 (1.14) 0.21 (0.11)
Page 88
85
Figure 2.9: Differences in the composition of the microbial assemblages between
diets. Cluster analysis with jackknife support based on weighted UniFrac distances
and UPGMA clustering. Red-colored nodes had 75-100% support, yellow-colored nodes had 50-75% support, and
green-colored nodes had 25-50% support. Weighted UniFrac distances were calculated
from OTUs based on 97% similarity level. MC (C) (cultured mummichog), MC (W)
(wild mummichog), PF (J) (juvenile pinfish), PF (A )(adult pinfish), SP (silver perch),
BSB (black sea bass), HC (hogchoker), FL (southern flounder), SPM (Spanish mackerel),
75-100%
50-75%
25-50%
Page 89
86
KM (king mackerel), RD (red drum), JC (crevalle jack), MH (mahi-mahi), BR
(barracuda), SHP (Atlantic sharpnose shark), SPN (spinner shark), and SDB (sandbar
shark).
Page 90
87
Figure 2.10: Non-Metric Multidimensional Scaling comparison of Core groups of
the Gut Microbiomes from 12 finfish and 3 shark species. Data was transformed as
Presence/Absence with Bray Curtis similarity resemblance.
Page 91
88
Figure 2.11: Differences in the composition of the microbial assemblages between
diets. Cluster analysis with jackknife support based on weighted UniFrac distances
and UPGMA clustering.
Red-colored nodes had 75-100% support. Weighted UniFrac distances were calculated
from OTUs based on 97% similarity level. (C) refers to cultured fish and (W) refers to
wild fish.
75-100%
Page 92
89
Figure 2.12: Differences in the composition of the microbial assemblages between
diets. Cluster analysis with jackknife support based on weighted UniFrac distances
and UPGMA clustering. Red-colored nodes had 75-100% support. Weighted UniFrac distances were calculated
from OTUs based on 97% similarity level. (J) refers to juvenile fish and (A) refers to
adult fish.
75-100%
Page 93
90
CHAPTER 3
ALTERING THE BALANCE: THE EFFECTS OF MODIFIED DIET ON THE GUT
MICROFLORA OF FUNDULUS HETEROCLITUS AND LAGODON RHOMBOIDES1
1 Givens, C.E. and J.T. Hollibaugh. To be submitted to The International Society of
Microbial Ecology Journal.
Page 94
91
ABSTRACT
Food resources may be a major factor influencing the composition of fish gut
microflora. Food sources might influence the composition of the gut microflora in two
ways: first by altering the nutritional characteristics of the material in the gut lumen; and
second by inoculating the gut with diet-associated microbes, which may or may not
become established in the gut leading to an ecological succession. We completed two
feeding experiments with Fundulus heteroclitus and Lagodon rhomboides to gauge the
contribution of diet-associated microbes to the gut microflora community. We used
massively parallel sequencing (pyrosequencing) to survey the bacterial 16S rRNA
ribotypes present in five different diets, and then followed the changes in the composition
of gut microflora among fish fed different diets. The results from feeding studies with
both species indicate that diet and diet-associated bacteria impact the composition of the
microflora community. However, both fish retained a core Proteobacteria gut
community, regardless of diet. These results provide insight into how the gut microflora
community responds to dietary change and are important to understanding the underlying
mechanisms of species succession in gut microflora. They also emphasize the point that
the apparent composition of the gut microbiome as assessed by ribotyping can be
strongly influenced by microorganisms associated with recently consumed food, even if
these cells are not alive.
INTRODUCTION
The composition of fish gut microflora is influenced by a variety of factors
including diet (Ringø and Strøm 1994; Uchii et al. 2006), environmental conditions
Page 95
92
(Yoshimizu and Kimura 1976; MacFarlane et al. 1986), and developmental stage
(Verner-Jeffreys et al. 2003; Romero and Navarrete 2006). In fact, the gut microflora
community present at larval and juvenile stages is strongly influenced by bacteria
associated with diet and the surrounding water (Hansen et al. 1992; Hansen and Olafsen
1999; Ringø and Birkbeck 1999; Skjermo and Vadstein 1999).
Sera and Ishida (1972b) suggested that fish with undeveloped intestines have gut
flora resembling that associated with food, but fish with more structured digestive tracts
maintain a gut microflora distinct from food-associated bacteria. A recent study of
Burmese python gut microflora found that pythons and their diet (rats) had different
microbial community composition; however the researchers could not discount a small
exchange of microbes to the python gut from ingested rats (Costello et al. 2010). Yet in
a different study that compared 16S rRNA gene sequences retrieved from terrestrial
mammalian gut (fecal) samples, diet was an important factor in grouping patterns (Ley et
al. 2008b). Ribotypes from non-human omnivorous primates grouped together and were
distinct from those from herbivorous primates (Ley et al. 2008). This same study found
that bacterial diversity was lowest in carnivores, greater in omnivores, and greatest in
herbivores.
Although feeding may alter gut microflora by the introduction of food-associated
bacteria, starvation or fasting may also impact gut physiology and hence its microbial
community. Starvation of the Red Sea surgeonfish Acanthurus nigrofscus resulted in a
reduced gut tract length, which reverted back to normal once these fish resumed feeding
(Montgomery and Pollak 1988). A one-day (24-hour) fast in mice resulted in shifts in the
composition of their gut microflora (Crawford et al. 2000). Likewise, the gut microbial
Page 96
93
community of fasting Burmese pythons has decreased diversity with an increased
abundance of Bacteroides, Rikenella, Synergistes, and Akkermansia (Costello et al.
2010).
Some fish have increased gut length to increase nutrient absorption and
assimilation from an energy-poor, often herbivorous, diet (Rimmer 1986; Sibly and
Calow 1986; Penry and Jumars 1987; Horn 1989). Many herbivorous fish begin their
life as carnivores (Horn 1989). Juveniles consume a primarily animal-based diet that
allows them to meet the high energy demands associated with this early life stage (Pough
1973; White 1985; Zimmerman and Tracy 1989; Benavides et al. 1994). This
ontogenetic diet shift is linked to an increase in intestinal length when compared to
overall body length (Stoner and Livingston 1984; Benavides et al. 1994; Muñoz and
Ojeda 2000; Gallagher et al. 2001; Moran et al. 2005).
The ontogenetic shift is mirrored by an increase in microbial abundance within
the hindgut of herbivorous adults (Rimmer 1986), which is suggested as the main site of
microbial fermentation (Mountfort et al. 2002). The ontogenetic shift in the diet of
pinfish, Lagodon rhomboides, correlates with a qualitative and quantitative transition in
the composition of the gut microflora and results in increased occurrence of bacteria
capable of hydrolyzing carboxymethylcellulose within the gut of herbivorous adults
(Luczkovich and Stellwag 1993). In the herbivorous fish Kyphosus sydneyanus, Moran
et al. (2005) observed that the total OTU diversity increased along the gut tract of the
largest (deemed the oldest) size class. Additionally, the smallest K. sydneyanus had the
lowest gut microbial diversity, suggesting that increased diversity of the gut microbiome
Page 97
94
may be linked to increasing size class or age (Moran et al. 2005). For many herbivorous
fish, increased size results in an ontogenetic diet shift (Luczkovich and Stellwag 1993)
Based on these results, it is likely that fish species with different feeding strategies
(i.e. herbivores, omnivores, carnivores) will also host different gut microflora. This was
established (Chapter 2 of this dissertation) by comparing the composition of the gut
microflora of 15 finfish and 3 shark species, captured from the wild. Although we
documented differences in the composition of the gut microbiome among these species,
we also noted variability, and sometimes dramatic differences, in the composition of the
gut microflora from different individuals of the same species. This led us to hypothesize
that the composition of the gut microflora as we assessed it (ribotyping) might be
influenced by ribotypes associated with recently consumed food items that varied from
fish to fish. We completed two feeding experiments to test this hypothesis. Both studies
aimed to investigate the effect of diet-associated bacteria on the assessed composition of
the gut microflora community. The first study used cultured mummichogs Fundulus
heteroclitus, which are stomachless and have a simple tube intestine (Burnett et al. 2007).
The second study used wild juvenile and adult pinfish, Lagodon rhomboides, which were
chosen because they undergo an ontogenetic diet shift from carnivore to herbivore with
the transition from juvenile to adult life stages (Luczkovich and Stellwag 1993; Gallagher
et al. 2001). We used massively parallel sequencing (pyrosequencing) to survey bacterial
16S rRNA ribotypes present in the guts of test fish that were all conditioned to the same
diet then followed changes in the relative abundance of the gut microflora community
among subsets fed different diets. We found that food-associated ribotypes persisted in
fish guts, even when fish were fed sterilized diets, suggesting that microbial DNA
Page 98
95
associated with food is not rapidly digested. The influence of food-associated ribotypes
was greatest for mummichogs and least for adult pinfish; however, all three treatment
groups maintained a “core microflora,” regardless of diet.
METHODS
These studies were completed in compliance with Animal Use Protocol (AUP)
#2008-10017 approved by the University of Georgia Institutional Animal Care and Use
Committee (IACUC).
Sample Collection and Feeding Study 1 – Fundulus heteroclitus
F. heteroclitus (n=125) were taken from a population at the Aquatic
Biotechnology and Environmental Lab, University of Georgia, that has been reared in
captivity for 11 generations. Fish were held in recirculating seawater culture tanks and
were conditioned to a diet of brine shrimp (San Francisco Bay Brand), freeze-dried
plankton (San Francisco Bay Brand), and Otohime EP1 (Aquatic Ecosystems) for one
month before introducing experimental diets. Five fish were selected randomly and
sacrificed to establish the initial composition of the gut microflora. The remaining fish
were divided randomly into 12 tanks (10 fish/tank). Fish were fed twice daily and all
uneaten food was removed after 15 minutes. Fish were fed three sterilized diets of
either: 1) San Francisco Bay Brand Freeze-Dried Plankton (SPK; 64% protein); 2)
Ocean Nutrition Formula One Flakes (SFL; 49% protein); or 3) Julian Sprung’s
SeaVeggies Mixed Seaweed Flakes (SSV; 25% protein); or an unsterilized diet of San
Francisco Bay Brand Freeze-Dried Plankton (PK). Diets were sterilized by gamma
Page 99
96
irradiation at 10 kilogray (kGy) with a Cobalt-60 source at the University of Georgia
Center for Applied Isotope Studies (Athens, GA), and upon post-irradiation testing
exhibited no growth in LB medium incubated at 50 rpm at 25°C for 72 hours.
Unsterilized diets exhibited vigorous bacterial growth under these conditions. Three
tanks were assigned for each test diet. Tanks were equipped with Power Filters with two
filter cartridges and recirculated water at a rate of 125 gallons per hour. Tank salinity
and water temperature were kept constant at 16-17 psu and 26-27 °C, and levels of
nitrite, nitrate, ammonia, and pH levels were monitored regularly to ensure optimal
conditions for fish.
The study lasted a total of 42 days and was sampled on days 0, 14, 28, and 42.
Nine fish from each diet (three fish per tank) were sacrificed at each time point. All
specimens were euthanized with tricaine methanesulfonate (MS-222; Sigma). Each fish
was cleaned with 95% ethanol prior to dissection. The mid-to-hind-gut region of the
intestine was removed, sliced open with a flame-sterilized scalpel, and placed into a
PowerBead tube (MoBio Laboratories; Solana Beach, CA). DNA extraction from the
dissected gut was completed using the MoBio PowerSoil DNA Extraction Kit.
Sample Collection and Feeding Study 2 – Lagodon rhomboides
L. rhomboides (n=172) were collected by trawl from the Gulf of Mexico (29° 52’
N 84° 29’ W) by personnel from the Florida State University Coastal Marine Laboratory
(St. Teresa, FL), transported back to the University of Georgia campus, and placed in
quarantine for 30 days. Fish were classified as juveniles if they were under 100 mm total
body length, with adults measuring over 101 mm length. Juvenile and adult fish were
placed in separate quarantine tanks to avoid crossover of microflora between the two
Page 100
97
groups. Fish were fed twice daily and all uneaten food was removed after 15 minutes.
During quarantine all fish were fed a mixed diet of unsterilized Julian Sprung’s
SeaVeggies Green Seaweed and San Francisco Bay Brand Freeze Dried Krill. Juvenile
and adult fish were quarantined in a 100-gallon tank and 800-gallon tank, respectively.
Following quarantine, five juvenile and five adult fish were selected randomly and
sacrificed (t=0 days) to establish the initial composition of the gut microflora. The
remaining juvenile and adult fish were randomly divided into six 10-gallon juvenile and
six 100-gallon adult tanks (n=14 juveniles or 13 adults per tank). All tanks were
equipped with double filter Power Filters rated for tank size. Diets were not sterilized
and were a) freeze-dried krill (K, 62% protein), b) green seaweed (GSW, 33% protein),
and c) equal parts freeze-dried krill and green seaweed (GSWK). Two juvenile and two
adult tanks were fed the same diet for the duration of the experiment. Tank salinity and
water temperature were kept constant at 25 psu, 25 °C, and nitrite, nitrate, ammonia, and
pH levels were monitored.
The study lasted a total of 20 days with fish sampled at 0, 2, 5, 9, 14, and 20 days.
Four juveniles and four adults from each diet (two fish per tank) were sacrificed at each
time point. All fish were euthanized and dissected as described above. Body length and
gut length were measured for each fish. All DNA extractions were completed using the
MoBio PowerSoil DNA Extraction Kit.
Diet DNA Extractions
The five unsterilized diets (mixed seaweed flakes, green seaweed, Formula 1,
plankton, and krill) used in both feeding studies were placed into individual PowerBead
Page 101
98
tubes. These DNA extractions were completed using the MoBio PowerSoil DNA
Extraction Kit.
16S rRNA Sequencing and Analysis
We determined the distribution of 16S rRNA ribotypes by massively parallel
sequencing (pyrosequencing) using a Roche 454/FLX instrument running Titanium
chemistry. All samples were amplified, purified, and quantified separately. DNA was
amplified using universal 16S rRNA primers 27F and 338R-I and II (Roeselers et al.
2011) that were modified with Titanium adaptors (Lib-L) and sample-specific barcodes.
Samples corresponding to the same treatment (experimental diet and sampling day) were
amplified using the same barcode. PCR amplifications for each sample were performed
in triplicate using Phusion High Fidelity Polymerase (Thermo Scientific) and 1 μM
forward (27F) and reverse (pooled 338R I & II) primers with the following conditions:
denaturation at 95 °C for 10 minutes; 25 cycles of denaturation at 94 °C for 30 seconds,
annealing at 50 °C for 30 seconds, and extension at 72 °C for 1 minute; followed by a
final extension at 72 °C for 10 minutes.
Following amplification PCR products from each fish were pooled and purified
using Agencourt Ampure XP (Beckman Coulter) with a modified 1:1 volume of PCR
product to Ampure XP beads. Purified amplicons were quantified (Quant-iT PicoGreen;
Invitrogen) and amplicons representing a given diet type and sampling period (4 fish)
were pooled in equal amounts before submission to the Georgia Genomics Facility
(University of Georgia; Athens, GA) for sequencing. A total of 1,282,893 sequences
were obtained. These were filtered, denoised, checked for chimeras, and then assigned to
Page 102
99
operational taxonomic units (OTUs) based on ≥97% sequence similarity using the
Greengenes classifier through the Qiime software pipeline (Caporaso et al. 2010;
Caporaso et al. 2011). All sequences not assigned to OTUs to at least the kingdom level
were removed from the dataset before further analyses.
Rarefaction curves were prepared for all samples using the alpha_rarefaction.py
script in Qiime and the Chao1, Shannon, Phylogenetic Diversity (PD) Whole Tree, and
Observed Species richness and diversity metrics. We used the
jackknifed_beta_diversity.py workflow script in Qiime (Caporaso et al. 2010; Caporaso
et al. 2011) to compare the gut microbiomes of fish fed different diets. This analysis
assesses the robustness of our sequencing effort (Caporaso et al. 2010; Caporaso et al.
2011) and determines how likely it is that treatments are clustered randomly (Lozupone
et al. 2011).The analysis used weighted UniFrac (based on normalized abundance data)
distances from our complete OTU table, at an even sampling depth for all samples. A
consensus tree was constructed from 999 jackknifed iterations using UPGMA
(Unweighted Pair Group Method with Arithmetic mean) clustering. T-tests were
performed in R (R Core Team 2009) using the vegan statistical package (Oksanen et al.
2009).
RESULTS
Phylogenetic composition of diet-associated bacteria
We obtained a total of 136, 567 sequences that sorted into 651 OTUs (Figure 3.1)
from the five different diets. Similar ribotypes were associated with mixed seaweed
flakes and green seaweed diets, which were dominated by sequences from the Order
Page 103
100
Rhodophyta (85% and 63% respectively), representing chloroplast sequences. OTUs
binned to the Phylum Cyanobacteria were likely chloroplasts and will be noted as such
for the rest of these results. Additionally, both the mixed seaweed flake and green
seaweed libraries had small contributions (3.9 and 2.7% of OTUs) from Flavobacteria
within the genus Olleya. The sequences retrieved from the plankton and krill diets were
also similar to each other and were dominated by Proteobacteria ribotypes, mostly
belonging to the genera of Halomonas (39%, 32%) and Shewanella (37%, 33%). The
sequences retrieved from the Formula 1 diet were assigned to Firmicutes and chloroplast
ribotypes (57%, 32%). The majority (57%) of Firmicutes ribotypes were assigned to
Lactobacillus sp., Lactococcus sp., and Weissella sp. OTUs. Chloroplast ribotypes were
predominately from the Phylum Streptophyta.
Alpha diversity calculations suggest the Formula 1 library contained the greatest
bacterial diversity (Table 3.1). Rarefaction curves for diet samples plateaued around
2000 sequences are shown in Figure 3.2. Jackknife analysis indicated that bacterial
ribotypes associated with the diets form three clusters (with >75% jackknifed support) of
1) Mixed Seaweed Flakes and Green Seaweed; 2) Formula 1, and 3) Plankton and Krill
(Figure 3.3).
Feeding Study 1: F. heteroclitus
We retrieved a total of 201,658 sequences from the F. heteroclitus study that
were binned into 806 OTUs. The initial sample collected from fish immediately prior to
changing their diet contained 71% of Proteobacteria and 28% of Fusobacteria ribotypes.
Page 104
101
Ninety-nine percent of the Fusobacteria ribotypes belonged to a Propionigenium sp.
OTU. The majority (83%) of Proteobacteria ribotypes were Vibrio spp. OTUs.
Core OTUs were defined as those found in all mummichogs (initial and diet
manipulation samples) and are listed in Table 3.2. In contrast to the prevalence of
Propionigenium sp. OTUs in the initial sample, this OTU only contributed <0.5% to the
other feeding study samples. Several OTUs were retrieved from all feeding study
samples, but were not retrieved from the initial sample. These OTUs include
Staphyloccus sp., Pseudoalteromonas sp., Stentrophomonas sp., and several from the
Order Lactobacillales (Lactobacillus, Streptococcus, Lactococcus, and Weisella).
Fusobacteria ribotypes decreased in abundance and Actinobacteria, Cyanobacteria
(chloroplasts), Firmicutes, and Proteobacteria ribotypes increased in all feeding study
samples relative to the initial sample (Figure 3.4).
The gut microflora of mummichogs in the feeding study were dominated by
Proteobacteria ribotypes (71-96%, average 87%) except for the fish from Days 14 and 28
fed on a diet of mixed seaweed flakes. Of those Proteobacteria ribotypes, Vibrio spp.
OTUs contributed 10-70% (average 40%) of the total reads per sample. Samples from
the Day 14 and 28 mixed seaweed flake-fed and Day 42 sterilized plankton-fed
treatments contained OTUs similar to chloroplasts 22-54%, average 42%). Day 14 and
28 seaweed-fed fish had chloroplasts ribotypes which were predominantly within the
Orders Rhodophyta (44 and 54% of sample library) and Phylum Streptophyta (4.9 and
0.23% of sample library). The Day 42 sterilized plankton-fed fish had chloroplast
ribotypes that were derived primarily from the genera Arthospira sp. (20% of total).
Page 105
102
Alpha diversity metrics of Chao1, Observed Species, Phylogenetic Diversity
Whole Tree, and Shannon (Figure 3.5) suggest that the initial sample had the lowest
diversity (Table 3.2). Diversity of the gut microflora increased as the feeding study
progressed in all fish except those fed on seaweed flakes. Jackknife analysis indicates
that the gut samples from the Day 14 and Day 28 seaweed-fed fish cluster together and
separate (at >75% support) from the remaining initial rest of the treatments and from the
sample (Figure 3.6). Within the main cluster (includes 11 samples), the initial sample
segregates separately from the feeding study samples.
The two main chloroplast ribotypes of Rhodophyta and Streptophya that were
associated with the mixed seaweed flake diet contributed 44% and 4.9% and 54 % and
0.23% of the Day 14 and Day 28 seaweed flake-fed samples, respectively. By Day 42,
the seaweed flake-fed fish were almost devoid of Rhodophyta and Streptophyta ribotypes
with respective contributions of 0.02 and 0.01% of these OTUs. Jackknife analysis
indicated that Days 14 and 28 seaweed flake-fed fish cluster with the mixed seaweed
flake diet at >75% support (Figure 3.7) and separately from the initial and Day 42
seaweed-fed fish.
Ribotypes associated with the Formula 1 diet (Lactobacillus sp., Lactococcus sp.,
and Streptophyta), are only minimally present (<0.53%) in samples from Formula 1-fed
fish. Jackknife analysis showed that the all Formula 1-fed fish cluster with the initial
sample at >75% support and separate from the Formula 1 diet (Figure 3.8).
Shewanella sp. and Halomonas sp. OTUs increase by 25 and 17%, respectively,
in the Day 42 plankton-fed fish. Neither Shewanella sp. nor Halomonas sp. OTUs were
found in the initial F. heteroclitus fish, but both were retrieved from the plankton diet.
Page 106
103
The initial and other feeding study samples (except Day 42 sterilized plankton-fed fish)
clustered with 75% support (Figure 3.9). The plankton diet and the Day 42 plankton-fed
fish form an additional cluster at >75% support. The Day 28 sterilized and unsterilized
plankton-fed fish further cluster together with >75% support.
Feeding Study 2: Juvenile L. rhomboides
We retrieved a total of 446,876 sequences from juvenile L. rhomboides that were
sorted into 801 OTUs. At the beginning of the diet manipulation, the gut microbiome of
juvenile L. rhomboides was dominated by Proteobacteria (95%) (Figure 3.10). These
fish also contained minimal contributions from additional phyla including Firmicutes
(1.5%) and Bacteroidetes (1.0%) ribotypes. The core gut microbiome of juvenile pinfish
(Table 3.2), which included OTUs shared between the initial fish and these fish
following the diet shift, consisted predominately of Vibrio sp. and Photobacterium sp.
ribotypes.
Fish fed the green seaweed diet had increased relative abundance of
Actinobacteria (average 8.3%) and Firmicutes (1.9%) within their gut microbiome. Gut
microbiomes of Day 2 green seaweed-fed fish also contained more chloroplast ribotypes
(8.0%). Seaweed-fed fish from later sampling points did not have an increased relative
abundance of chloroplast ribotypes when compared to the initial sample. Some green
seaweed/krill-fed fish had increased relative abundances of Actinobacteria,
Cyanobacteria, and Firmicutes ribotypes; however, this pattern was not consistent across
all seaweed/krill-fed fish. Additionally, Bacillus sp., Facklamia sp., Tenacibaculum sp.
Pseudoalteromonas spp., Oceanospirillales, and Sphingobacteriales ribotypes were
Page 107
104
absent in initial samples, but were present as minor components of the gut microflora in
fish from all feeding trials.
The chloroplast OTUs associated with the green seaweed diet were retrieved
from all green seaweed-fed fish except the Day 2 fish. Although retrieved from the other
feeding study samples, these OTUs were present at low relative abundances (0.01-
0.44%, average 0.18%). The gut microflora of green seaweed-fed fish cluster together
with >75% jackknife support and separate from the initial sample and the seaweed diet
(Figure 3.11a).
Several of the OTUs (Aquabacterium sp. Pseudomonas sp., and Vibrio spp.)
associated with the krill diet were retrieved from the initial sample and in the guts of
krill-fed fish. One of the Vibrio sp. OTUs associated with the krill diet was part of the
core gut microbiome of juvenile L. rhomboides. This OTU increased in relative
abundance from 1.8% in the initial sample to 1.4-92% (average 55%) among krill-fed
samples. There was a statistically significant difference (p=0.05) between the relative
abundance of this Vibrio spp. OTU in the initial and later krill-fed samples. The
Halomonas sp. ribotype associated with the krill diet was not retrieved from any of the
krill-fed fish. The Shewanella sp. OTU associated with the krill diet was found in
several other samples of krill-fed fish at minimal contribution (<0.12%). Cluster
analysis indicated that the krill fed-fish samples were more similar to each other (with
>70% jackknifed support) than to either the initial sample or to the krill diet (Figure
3.11b).
Like the gut microbiomes of the green seaweed-fed fish, gut microbiomes from
fish fed the seaweed/krill diet shared few (<1.4%) OTUs with the seaweed diet. Cluster
Page 108
105
analysis suggested that the gut microbiomes of seaweed/krill-fed fish were more similar
to the krill diet (with >75% jackknifed support) than to the initial sample or the seaweed
diet (Figure 3.11c). The gut microbiome of seaweed/krill-fed fish form an additional
cluster (with >75% support) separate from the krill diet.
Feeding Study 2: Adult L. rhomboides
We retrieved 263,861 sequences from adult L. rhomboides gut microbiomes that
were binned into 719 OTUs. The initial sample of the gut microflora of adult L.
rhomboides was dominated by Proteobacteria (61%). In contrast to juveniles, the adult
L. rhomboides microbiome had larger contributions of Firmicutes (27%), chloroplast
(7.6%), and Actinobacteria (3.4%) ribotypes. The core group of the adult L. rhomboides
gut microbiome (Table 3.2) defined as above, contained predominantly Vibrio sp. and
Photobacterium sp. ribotypes. These were the same Vibrio sp. and Photobacterium sp.
OTUs that were dominant in the juvenile core group. The adult core group includes
Enterobacter sp., Shewanella sp., and Pseudomonas sp. ribotypes, which were not
present in the core group of the juvenile gut microbiome.
As in the juvenile fish gut microbiomes, Proteobacteria ribotypes were present in
and dominated most gut microbiomes of fish fed different diets (26-99%, average 81%)
(Figure 3.12). Photobacterium spp. OTUs contributed 3.1% of the OTUs in initial adult
samples. Photobacterium spp. relative abundance increased in gut microflora of fish fed
the seaweed/krill diet, up to 97% in adult fish. The relative abundance of these OTUs
also increased by 6.2% in fish fed the krill diet. In seaweed-fed fish, the relative
abundance of these OTUs decreased by 1.1% relative to the initial fish. The decrease of
Page 109
106
Photobacterium spp. in the seaweed-fed fish and the increase in the seaweed/krill-fed
fish was statistically significant (p=0.05). As in juvenile samples, Bacillus sp.,
Facklamia sp., Tenacibaculum sp. Pseudoalteromonas spp., Oceanospirillales, and
Sphingobacteriales ribotypes were absent in the initial fish, but were present as minor
components of the gut microbiomes of fish fed all three diets.
The main OTUs associated with the seaweed diet were present in all seaweed-fed
samples except the Day 2 fish. Although present among the other feeding study samples,
these OTUs were at low relative abundances (<0.04%). Jackknifed analysis indicates
that all seaweed-fed fish were more similar on an OTU level (with >75% support) to the
initial fish than to the seaweed diet (Figure 3.13a). All seaweed-fed fish were more
similar to each other (with >75% support) than to the initial sample.
Several of the OTUs (Pseudomonas sp. and Vibrio sp.) associated with the krill
diet were also found in the adult core microbiome. The Vibrio sp. OTU associated with
the krill-diet increased in the Day 14 and Day 20 krill-fed fish at 22 and 8.7% relative to
the initial fish. However, this same diet-associated OTU decreased in relative abundance
in the guts of Day 2, 5, and 9 fish. This is in contrast to what we observed with this OTU
in the juvenile gut microbiome. There was a 35% increase in the relative abundance of
the Halomonas sp. ribotype associated with the krill diet in the Day 20 fish. This
Halomonas sp. ribotypes was not present among any of the other krill-fed fish. The
Shewanella sp. OTU associated with the krill diet was also found in several of the krill-
fed samples at minimal percent compositions (<1.3%). Day 2, 5, 14, and 20 krill-fed fish
were more similar to the krill diet than to the initial fish (with >75% support). However,
none of the krill-fed fish clustered directly with the krill diet (Figure 3.13b). As in the
Page 110
107
juvenile seaweed/krill-fed samples, the gut microbiomes of adult seaweed/krill-fed fish
had minimal, if any seaweed-diet associated OTUs. Day 2, 9, and 20 seaweed/krill-fed
fish cluster with the krill diet at >75% support (Figure 3.13c). With the exception of Day
14 seaweed/krill-fed fish, all seaweed/krill-fed fish and the initial fish were more similar
to the krill diet than to the seaweed diet.
Rarefaction curves for the alpha diversity metrics are shown in Figure 3.14.
Table 3.4 lists alpha diversity metrics for L. rhomboides samples. Results indicate that
the gut microbiomes of juvenile and adult initial fish have greater richness than the
microbiomes of subsequent feeding study fish. The Observed Species metric (Figure
3.15) indicated that fish fed the seaweed diet had the greatest richness. With the
exception of Day 9 krill-fed adult fish, the microflora assemblages from other krill-fed
fish had lower richness. For most fish, adults had greater richness and diversity than the
juvenile cohort.
DISCUSSION
The results from these studies indicate that diet and diet-associated bacteria affect
the composition of fish gut microflora. However, in both experiments, fish appeared to
retain a core Proteobacteria gut community. This suggests that gut variations resulting
from diet-associated ribotypes have a greater influence on the transient (or non-core)
microflora community. We were able to identify Shewanella sp. and Halomonas sp.
OTUs from the plankton and krill diets that were retrieved from the gut microbiomes of
plankton- and krill-fed fish. These OTUs were absent in initial samples and were only
found within fish fed either of these particular diets. Additionally, fish fed the mixed
Page 111
108
seaweed flake and green seaweed diets had higher relative abundances of chloroplast
OTUs within their gut microflora. These same chloroplast OTUs were identified in diet
samples and increased in relative abundance in the fish gut microbiomes after the fish
were fed either the mixed seaweed flake or green seaweed diets. Fish fed sterilized diets
(of Formula 1, mixed seaweed flake, and plankton) also had diet-associated OTUs within
their gut microflora. Our post gamma-irradiation analyses indicated that there was no
bacterial growth associated with the sterilized diets, suggesting that these OTUs did not
persist by growing in fish guts. However, gamma-irradiation does not destroy DNA, and
our ability to retrieve these OTUs from gut microbiomes suggests that the DNA in diet-
associated microbes (or chloroplasts) is not degraded rapidly in fish guts, thus persisting
to influence the apparent composition of the gut microbiome.
Our results also indicate that changing diets impact the relative abundance of
some ribotypes within the fish gut microbiome. The abundance of Actinobacteria
(Propionibacterium sp. and Corynebacterium sp), Firmicutes (Clostridium sp. and
Lactobacillales), and Proteobacteria (Aquabacterium sp, γ-Proteobacteria and Vibrio
spp.) increased in F. heteroclitus fed Formula 1 and plankton diets. The
Corynebacterium sp, Clostridium sp., some of the Lactobacillales, and most of the Vibrio
spp. ribotypes were not found within the Formula 1 or plankton diets, and thus, changes
in relative abundance of these ribotypes in the gut microflora may be a response to
changes in the gut, for example in the suite of potential growth substrates available to
bacteria, as a result of the fish being fed different diets. Additionally, we observed diet-
dependent shifts in the relative abundance of Bacteroidetes and Photobacterium spp.
ribotypes in samples from L. rhomboides guts following feeding trials. The relative
Page 112
109
abundance of Lactobacillales ribotypes that were not found in diet-associated bacteria
increased in all samples from the F. heteroclitus and L. rhomboides feeding study. These
shifts in the gut microflora community may be a consequence of competition among the
microbial assemblage.
We intentionally used two fish that differed in digestive physiology for these
experiments. F. heteroclitus has a simple tube gut and no stomach. L. rhomboides has a
more developed, differentiated gut tract that presumably results in greater processing of
the food, longer retention time and a more differentiated gut microflora. If we apply
Sera et al. (1972)’s conceptual model to the comparison, the composition of the F.
heteroclitus gut microflora should have been affected more by diet-associated bacteria
than the gut microflora of L. rhomboides. We found that the gut microflora from L.
rhomboides fed on the green seaweed diet only had minimal contributions (average
0.37%) from diet-associated ribotypes. In contrast, one chloroplast ribotype from the
mixed seaweed flake diet accounted for 44 and 54% of the ribotypes retrieved from F.
heteroclitus guts fed this diet. Bacteria associated with the mixed seaweed flake diet
were more abundant in the seaweed flake-fed F. heteroclitus than those bacteria
associated with the green seaweed diet in the seaweed-fed L. rhomboides. Similarly, the
contribution of ribotypes from the plankton diet to F. heteroclitus gut microflora was
much greater than the contribution of ribotypes from the krill diet to L. rhomboides gut
microflora. We conclude that the bacterial community within the simple gut of F.
heteroclitus was more directly influenced by diet-associated bacteria than the community
of the more differentiated gut of L. rhomboides. Further, because this difference was
observed with diets that had been sterilized by gamma-irradiation as well as with
Page 113
110
unsterilized diets, it must be due to more complete digestion of microbial biomass by L.
rhomboides than F. heteroclitus, rather than as a result of differences in the ability of
diet-associated bacteria to reproduce in the guts of these two fish.
Diversity of the gut microflora community was lowest among L. rhomboides fed
an invertebrate diet (krill), greater among L. rhomboides fed an omnivorous diet
(seaweed and krill), and greatest among those fed a vegetarian (seaweed) diet. This
agrees with the conclusions of Ley et al. (2008), who found that diversity was lowest in
the fecal microflora of carnivores in a study of the fecal microflora of humans and
terrestrial mammals. This generality was not as clearly delineated within the F.
heteroclitus gut microflora, possibly as a result of the greater contribution of diet-derived
ribotypes to the gut microflora assemblage, which may have masked differences in the
core microbiome. Alpha diversity metrics indicated that microflora diversity was
greatest in fish fed the Formula 1 diet. However, the diversity of the ribotypes associated
with the Formula 1 diet was also greater than for the other diets we tested. Since the gut
microflora communities of F. heteroclitus were more directly impacted by diet-
associated bacteria than those of L. rhomboides, the increased diversity of gut microflora
in Formula 1-fed samples may simply be attributed to the greater diversity of bacteria in
the Formula 1 diet.
On average, richness and alpha diversity metrics were greater for gut microflora
communities of the adult L. rhomboides than in that of the juvenile population. A study
of the herbivorous K. sydneyanus showed that increased gut microflora diversity was
linked to increased fish size and to an ontogenetic shift in diet (Moran et al. 2005). Thus,
Page 114
111
it seems to be a general rule that as fish undergo an ontogenetic shift in diet from
carnivorous juveniles to herbivorous adults, their gut microflora increases in diversity.
In summary, we found that diet influences the microbial assemblage present in
fish guts directly via the contribution of diet-associated ribotypes to the community and
also through proliferation of bacterial ribotypes that become more prevalent as a result of
digestive and nutrient requirements. We were able to identify a core microbiome that
consistently contributed to the bulk of the respective fish’s gut microbiome. Diet-
associated ribotypes were recovered from the gut, but they were not always present and
did not increase in relative abundance in samples from later time-points, suggesting that
they were not able to persist within this community. Even when diets contained
potentially viable bacteria, these bacteria were unable to proliferate within the gut. Our
findings provide insight into the environmental factors regulating the composition of the
gut microflora community and contribute to understanding the underlying mechanisms
that influence digestion and nutrient adsorption in fish.
ACKNOWLEDGMENTS
This research was supported by NOAA Oceans and Human Health Initiative
Traineeship grant S0867882. We thank Richard Winn and Michelle Norris at ABEL,
Scott Noakes at CAIS, and the FSU Coastal & Marine Laboratory personnel for their
advice and assistance. A special thanks to Leanne Powers, Bradley Tolar, and Vanessa
Varaljay for helping with fish collection and feeding. Additional thank to Sylvia
Schaefer who also assisted with feeding the fish.
Page 115
112
REFERENCES
Benavides, A. G., J. M. Cancino, and F. P. Ojeda. 1994. Ontogenetic change in the diet of
Aplodactylus punctatus (Pisces: Aplodactylidae): an ecophysiological
explanation. Marine Biology 118: 1-5.
Burnett, K. G. and others 2007. Fundulus as the premier teleost model in environmental
biology: opportunities for new insights using genomics. Comparative
Biochemistry and Physiology Part D: Genomics and Proteomics 2: 257-286.
Caporaso, J. G. and others 2010. QIIME allows analysis of high-throughput community
sequencing data. Nature Methods 7: 335-336.
Caporaso, J. G. and others 2011. Global patterns of 16S rRNA diversity at a depth of
millions of sequences per sample. Proceedings of the National Academy of
Sciences 108: 4516-4522.
Costello, E. K., J. I. Gordon, S. M. Secor, and R. Knight. 2010. Postprandial remodeling
of the gut microbiota in Burmese pythons. ISME J 4: 1375-1385.
Gallagher, M. L., J. J. Luczkovich, and E. J. Stellwag. 2001. Characterization of the
ultrastructure of the gastrointestinal tract mucosa, stomach contents and liver
enzyme activity of the pinfish during development. Journal of Fish Biology 58:
1704-1713.
Hansen, G., E. Strøm, and J. Olafsen. 1992. Effect of different holding regimens on the
intestinal microflora of herring (Clupea harengus) larvae. Applied and
Environmental Microbiology 58: 461-470.
Hansen, G. H., and J. A. Olafsen. 1999. Bacterial interactions in early life stages of
marine cold water fish. Microbial Ecology 38: 1-26.
Horn, M. H. 1989. Biology of marine herbivorous fishes. Oceanography and Marine
Biology Annual Review 27: 167-272.
Ley, R. E., C. A. Lozupone, M. Hamady, R. Knight, and J. I. Gordon. 2008. Worlds
within worlds: evolution of the vertebrate gut microbiota. Nature Reviews
Microbiology 6: 776-788.
Lozupone, C., M. E. Lladser, D. Knights, J. Stombaugh, and R. Knight. 2011. UniFrac:
an effective distance metric for microbial community comparison. ISME J 5: 169-
172.
Luczkovich, J. J., and E. J. Stellwag. 1993. Isolation of cellulolytic microbes from the
intestinal tract of the pinfish, Lagodon rhomboides: size-related changes in diet
and microbial abundance. Marine Biology 116: 381-388.
Page 116
113
MacFarlane, R., J. McLaughlin, and G. Bullock. 1986. Quantitative and qualitative
studies of gut flora in striped bass from estuarine and coastal marine
environments. Journal of Wildlife Diseases 22: 344-348.
Montgomery, W. L., and P. E. Pollak. 1988. Gut anatomy and pH in a red sea
surgeonfish, Acanthurus nigrofuscus. Marine Ecology Progress Series. Oldendorf
44: 7-13.
Moran, D., S. J. Turner, and K. D. Clements. 2005. Ontogenetic development of the
gastrointestinal microbiota in the marine herbivorous fish Kyphosus sydneyanus.
Microbial Ecology 49: 590-597.
Mountfort, D. O., J. Campbell, and K. D. Clements. 2002. Hindgut fermentation in three
species of marine herbivorous fish. Applied and Environmental Microbiology 68:
1374-1380.
Muñoz, A. A., and F. P. Ojeda. 2000. Ontogenetic changes in the diet of the herbivorous
Scartichthys viridis in a rocky intertidal zone in central Chile. Journal of Fish
Biology 56: 986-998.
Oksanen, J. and others 2009. vegan: Community Ecology Package. R package version
1.15-2. 2009.
Penry, D. L., and P. A. Jumars. 1987. Modeling animal guts as chemical reactors.
American Naturalist: 69-96.
Pough, F. H. 1973. Lizard energetics and diet. Ecology: 837-844.
R Core Team. 2009. R: A Language and Environment for Statistical Computing. R
Foundation for Statistical Computing.
Rimmer, D. 1986. Changes in diet and the development of microbial digestion in juvenile
buffalo bream, Kyphosus cornelii. Marine Biology 92: 443-448.
Ringø, E., and T. H. Birkbeck. 1999. Intestinal microflora of fish larvae and fry.
Aquaculture Research 30: 73-93.
Ringø, E., and E. Strøm. 1994. Microflora of Arctic charr, Salvelinus alpinus (L.):
gastrointestinal microflora of free-living fish and effect of diet and salinity on
intestinal microflora. Aquaculture Research 25: 623-629.
Roeselers, G. and others 2011. Evidence for a core gut microbiota in the zebrafish. ISME
J 5: 1595-1608.
Romero, J., and P. Navarrete. 2006. 16S rDNA-based analysis of dominant bacterial
populations associated with early life stages of coho salmon (Oncorhynchus
kisutch). Microbial Ecology 51: 422-430.
Page 117
114
Sera, H., and Y. Ishida. 1972. Bacterial flora in the digestive tracts of marine fish-II.
Changes of bacterial flora with time lapse after ingestion of diet. Bulletin of the
Japanese Society for the Science of Fish 38: 633-637.
Sibly, R. M., and P. Calow. 1986. Physiological ecology of animals: an evolutionary
approach. Blackwell Scientific Publications.
Skjermo, J., and O. Vadstein. 1999. Techniques for microbial control in the intensive
rearing of marine larvae. Aquaculture 177: 333-343.
Stoner, A. W., and R. J. Livingston. 1984. Ontogenetic patterns in diet and feeding
morphology in sympatric sparid fishes from seagrass meadows. Copeia: 174-187.
Uchii, K. and others 2006. Genetic and physiological characterization of the intestinal
bacterial microbiota of Bluegill (Lepomis macrochirus) with three different
feeding habits. Microbial Ecology 51: 277-284.
Verner-Jeffreys, D. W., R. J. Shields, I. R. Bricknell, and T. H. Birkbeck. 2003. Changes
in the gut-associated microflora during the development of Atlantic halibut
(Hippoglossus hippoglossus L.) larvae in three British hatcheries. Aquaculture
219: 21-42.
White, T. 1985. When is a herbivore not a herbivore? Oecologia 67: 596-597.
Yoshimizu, M., and T. Kimura. 1976. Study on the intestinal microflora of salmonids.
魚病研究= Fish Pathology 10: 243-259.
Zimmerman, L. C., and C. R. Tracy. 1989. Interactions between the environment and
ectothermy and herbivory in reptiles. Physiological Zoology: 374-409.
Page 118
115
Figure 3.1: Composition of the Bacterial assemblage (at the phylum level, % of
ribotypes) retrieved from samples of the diets used in this study. Diets are: Julian
Sprung’s SeaVeggies Mixed Seaweed Flakes (SV); Julian Sprung’s SeaVeggies Green
Seaweed (GSW); Ocean Nutrition Formula One Flakes (FL); San Francisco Bay Brand
Freeze-Dried Plankton (PK); and San Francisco Bay Brand Freeze-Dried Krill (K).
*Ribotypes binned as Cyanobacteria were likely chloroplasts.
0%
20%
40%
60%
80%
100%
SV GSW FL PK K
Actinobacteria Bacteroidetes Cyanobacteria*
Firmicutes Fusobacteria Planctomycetes
Proteobacteria Tenericutes Thermi
Page 119
116
Table 3.1: Richness and Alpha Diversity Metrics for Diet samples used in both
Feeding Studies.
Alpha diversity measures were calculated for 6000 sequences/sample.
Sample Sequences/
Sample Chao1
Observed
Species
PD
Whole Tree Shannon
Formula 1 6000 318 260 17.6 4.72
Krill 6000 117 107 10.5 3.17
Mixed Seaweed
Flakes 6000 205 136 13.0 1.31
Plankton 6000 108 88.3 9.26 2.60
Green Seaweed 6000 168 93.9 9.38 1.68
Page 120
117
a) b)
c) d)
c) d)
Mixed Seaweed Flakes Green Seaweed Formula1
Plankton Krill
Figure 3.2: Rarefaction curves of richness and alpha-diversity metrics for diets used
in this study. a) Chao1, b) Observed Species, c) PD Whole Tree, and d) Shannon
index.
Page 121
118
Figure 3.3: Differences in the composition of the microbial assemblages between
diets. Cluster analysis with jackknife support based on weighted UniFrac distances
and UPGMA clustering. Red-colored nodes had 75-100% support. Weighted UniFrac
distances were calculated from the distribution OTUs defined at a 97% similarity level.
75-100%
Page 122
119
Table 3.2: Core gut microflora of F. heteroclitus and L. rhomboides.
Core gut microflora are defined as OTUs found in all samples of an experimental group,
regardless of diet. The top five core ribotypes are listed in order of greatest relative
abundance in the microbiome (not corrected for genome dosage).
Species # of
Core OTUs
Core Phylotypes (in order of abundance)
F. heteroclitus 19 Vibrio sp., Vibrionaceae, Aquabacterium sp.,
Shewanella sp., Vibrio sp., γ-Proteobacteria,
Photobacterium sp., Vibrio sp., Propionibacterium sp.,
Pseudomonas sp., Vibrionaceae, Rhodobacteraceae,
Vibrionaceae, Corynebacterium sp., Bradyrhizobium
sp., Acinetobacter sp., Pseudomonas sp.
Juvenile
L. rhomboides
6 Vibrio sp., Photobacterium sp., Vibrionaceae, Vibrio
sp., Propionibacterium sp., Staphylococcus sp.
Adult
L. rhomboides
7 Vibrio sp., Photobacterium sp., Vibrio sp.,
Propionibacterium sp., Enterobacter sp., Shewanella
sp., Pseudomonas sp.
Page 123
120
Figure 3.4: Composition of the Bacterial assemblage (at the phylum level, % of
ribotypes) retrieved from samples of the F. heteroclitus Feeding Study samples
Percent composition of phyla within the guts of F. heteroclitus from Day 0, 14, 28, and
42. SSV samples were fed sterilized seaweed flake. SFL fish were fed a diet of sterilized
Formula One (F1) flakes. SPK fish were fed sterilized plankton and PK fish were fed
unsterilized plankton. *Ribotypes binned as Cyanobacteria were likely chloroplasts.
Page 124
121
a) b)
c) d)
Initial 14SSV 28SSV 42SSV 14SFL 28SFL
42SFL
14SPK 28SPK 42SPK 14PK 28PK 42PK
Figure 3.5: Rarefaction curves of richness and alpha-diversity metrics for diets used
in this study. a) Chao1, b) Observed Species, c) PD Whole Tree, and d) Shannon
index.
Page 125
122
Table 3.3: Richness and Alpha Diversity Metrics for the F. heteroclitus Feeding
Study.
Indices were calculated for each sample using 6000 sequences/sample. SSV samples
were fed sterilized seaweed flake. F1 fish were fed a diet of sterilized Formula 1 (SFL)
flakes. SPK fish were fed sterilized plankton and PK fish were fed unsterilized plankton.
Sample Sequences/
Sample chao1
Observed
Species
PD
Whole Tree Shannon
Initial 6000 72.4 49.4 5.96 2.23
14 SSV 6000 204 167 14.4 3.42
28 SSV 6000 146 109 9.65 2.97
42 SSV 6000 104 73.2 9.45 2.89
14 SFL 6000 218 195 16.7 4.69
28 SFL 6000 186 162 15.6 3.32
42 SFL 6000 264 199 17.6 3.97
14 SPK 6000 169 113 11.9 2.12
28 SPK 6000 174 147 13.7 4.10
42 SPK 6000 175 133 13.9 3.87
14 PK 6000 168 140 13.3 3.24
28 PK 6000 185 146 14.0 3.58
42 PK 6000 148 128 11.0 4.30
Page 126
123
Figure 3.6: Differences in the composition of the microbial assemblages between F.
heteroclitus Feeding Study samples. Cluster analysis with jackknife support based
on weighted UniFrac distances and UPGMA clustering. Red-colored nodes had 75-
100% support. Yellow-colored nodes had 50-75% support. Weighted UniFrac distances
were calculated from the distribution OTUs defined at a 97% similarity level. 14, 28, and
42 indicate sampling day. SPK fish were fed sterilized plankton, PK fish were fed
unsterilized plankton, SFL fish were fed sterilized Formula 1, and SSV fish were fed
sterilized mixed seaweed flake.
75-100% 50-75%
Page 127
124
Figure 3.7: Bootstrapped tree of jackknifing analysis based on weighted UniFrac
and UPGMA clustering for all F. heteroclitus initial, mixed seaweed flake-fed fish,
and mixed seaweed flake diet. Red-colored nodes had 75-100% support. Weighted
UniFrac distances were calculated from the distribution OTUs defined at a 97% similarity
level. 14, 28, and 42 indicate sampling day. SSV fish were fed sterilized mixed seaweed
flake.
75-100%
Page 128
125
Figure 3.8: Bootstrapped tree of jackknifing analysis based on weighted UniFrac
and UPGMA clustering for all F. heteroclitus initial, Formula 1-fed fish, and
Formula 1 diet. Red-colored nodes had 75-100% support. Weighted UniFrac distances were calculated
from the distribution OTUs defined at a 97% similarity level. 14, 28, and 42 indicate
sampling day. SFL fish were fed sterilized Formula 1.
75-100%
Page 129
126
Figure 3.9: Bootstrapped tree of jackknifing analysis based on weighted UniFrac
and UPGMA clustering for all F. heteroclitus initial, sterilized and unsterilized
plankton-fed fish, and plankton diet. Red-colored nodes had 75-100% support. Yellow-colored nodes had 50-75% support.
Weighted UniFrac distances were calculated from the distribution OTUs defined at a 97%
similarity level. 14, 28, and 42 indicate sampling day. SPK fish were fed sterilized
plankton and PK fish were fed unsterilized plankton.
75-100% 50-75%
Page 130
127
Figure 3.10: Composition of the Bacterial assemblage (at the phylum level, % of
ribotypes) retrieved from samples of the juvenile L. rhomboides Feeding Study
samples
Percent composition of phyla within the guts of juvenile L. rhomboides from Day 0, 2, 5,
9, 14, and 20. GSW samples were fed green seaweed. K fish were fed krill. GSWK fish
were fed equal parts green seaweed and krill. *Ribotypes binned as Cyanobacteria were
likely chloroplasts.
0%
10%
20%
30%
40%
50%
60%
70%
80%
90%
100%
Initia
l (J)
2 G
SW
(J)
5 G
SW
(J)
9 G
SW
(J)
14
GS
W (J
)
20
GS
W (J
)
2 K
(J)
5 K
(J)
9 K
(J)
14
K (J
)
20
K (J
)
2 G
SW
K (J
)
5 G
SW
K (J
)
9 G
SW
K (J
)
14
GS
WK
(J)
20
GS
WK
(J)
Acidobacteria Actinobacteria Bacteroidetes Chlamydiae Chloroflexi
Cyanobacteria* Firmicutes Fusobacteria Planctomycetes Proteobacteria
Spirochaetes Tenericutes Verrucomicrobia Unclassified
Page 131
128
a)
b)
75-100%
Page 133
130
Figure 3.11: Bootstrapped tree of jackknifing analysis based on weighted UniFrac
and UPGMA clustering for a) juvenile L. rhomboides initial fish, GSW-fed fish, and
green seaweed diet, b) juvenile L. rhomboides initial fish, K-fed fish, and krill diet,
and c) juvenile L. rhomboides initial fish, GSWK-fed fish, and green seaweed and
krill diet. Red-colored nodes had 75-100% support. Yellow-colored nodes had 50-75% support.
Weighted UniFrac distances were calculated from the distribution OTUs defined at a 97%
similarity level. K fish were fed krill, GSW fish were fed green seaweed diet, and
GSWK fish were fed green seaweed and krill diet.
75-100% 50-75%
Page 134
131
Figure 3.12: Composition of the Bacterial assemblage (at the phylum level, % of
ribotypes) retrieved from samples of the adult L. rhomboides Feeding Study samples
Percent composition of phyla within the guts of adult L. rhomboides from Day 0, 2, 5, 9,
14, and 20. GSW samples were fed green seaweed. K fish were fed krill. GSWK fish
were fed equal parts green seaweed and krill. *Ribotypes binned as Cyanobacteria were
likely chloroplasts.
0%
10%
20%
30%
40%
50%
60%
70%
80%
90%
100%
Initia
l (A)
2 G
SW
(A)
5 G
SW
(A)
9 G
SW
(A)
14
GS
W (A
)
20
GS
W (A
)
2 K
(A)
5 K
(A)
9 K
(A)
14
K (A
)
20
K (A
)
2 G
SW
K (A
)
5 G
SW
K (A
)
9 G
SW
K (A
)
14
GS
WK
(A)
20
GS
WK
(A)
Acidobacteria Actinobacteria Bacteroidetes Chlamydiae Chloroflexi
Cyanobacteria* Firmicutes Fusobacteria Planctomycetes Proteobacteria
Spirochaetes Tenericutes Verrucomicrobia Unclassified
Page 135
132
a)
b)
75-100%
Page 137
134
Figure 3.13: Bootstrapped tree of jackknifing analysis based on weighted UniFrac
and UPGMA clustering for a) adult L. rhomboides initial fish, GSW-fed fish, and
green seaweed diet, b) adult L. rhomboides initial fish, K-fed fish, and krill diet, and
c) adult L. rhomboides initial fish, GSWK-fed fish, and green seaweed and krill diet. Red-colored nodes had 75-100% support. Weighted UniFrac distances were calculated
from the distribution OTUs defined at a 97% similarity level. K fish were fed krill, GSW
fish were fed green seaweed diet, and GSWK fish were fed green seaweed and krill diet.
75-100%
Page 138
135
a) b)
c) d)
c) d)
Initial (J) Initial (A) 2K (J) 2K (A)
2GSW(J) 2GSW (A) 2GSWK (J) 2GSWK (A)
5K (J) 5K (A) 5GSW (J) 5GSW (A)
5GSWK (J) 5GSWK (A) 9K (J) 9K (A)
9GSW (A) 9GSWK (J) 9GSWK (A) 14K (J)
14K (A) 14GSW (J) 14GSW (A) 14GSWK (J)
14GSWK (A) 20K (J) 20K (A) 20GSW(J)
20GSW (A) 20GSWK (J) 20GSWK (A)
Figure 3.14: Rarefaction curves of alpha-diversity metrics of a) chao1, b) Observed
Species, c) PD Whole Tree, and d) Shannon index for L. rhomboides Feeding Study
samples.
Page 139
136
Table 3.4: Alpha Diversity Metrics of Chao1, Observed Species, Phylogenetic
Diversity (PD) Whole Tree, Shannon index for the L. rhomboides Feeding Study.
Indices were calculated for each sample using 2700 sequences/sample GSW samples
were fed seaweed flake. K samples were fed krill. GSWK samples had a diet of equal
parts krill and seaweed.
Sample Sequences/
Sample Chao1
Observed
Species
PD Whole
Tree Shannon
Initial (J) 2700 193 120 13.0 3.65 Initial (A) 2700 183 124 11.7 3.97 2 GSW (J) 2700 102 93.4 9.63 4.36 5 GSW (J) 2700 103 60.6 7.84 2.07 9 GSW (J) 2700 128 67.6 8.32 1.64 14 GSW (J) 2700 116 98.5 10.9 3.78 20 GSW (J) 2700 196 125 13.0 2.84 2 GSW (A) 2700 57.7 33.6 5.10 0.58 5 GSW (A) 2700 158 124 11.7 3.70 9 GSW (A) 2700 93.0 67.6 7.84 2.04
14 GSW (A) 2700 177 102 11.2 3.21 20 GSW (A) 2700 95.1 77.5 9.30 3.29
2 K (J) 2700 76.6 46.6 5.88 2.09 5 K (J) 2700 40.2 23.7 3.49 1.16 9 K (J) 2700 83.0 41.6 6.15 2.12 14 K (J) 2700 36.0 26.8 4.02 0.58 20 K (J) 2700 57.8 39.0 5.55 1.15 2K (A) 2700 51.9 40.3 5.53 0.86 5 K (A) 2700 87.4 52.6 6.31 3.19 9 K (A) 2700 137 110 11.3 3.45 14K (A) 2700 151 131 12.7 3.87 20 K (A) 2700 67.7 42.7 6.01 2.46
2 GSWK (J) 2700 108 67.9 8.72 2.14 5 GSWK (J) 2700 59.5 38.1 5.18 1.86 9 GSWK (J) 2700 92.8 61.0 7.97 2.08
14 GSWK (J) 2700 78.3 51.1 7.34 2.09 20 GSWK (J) 2700 62.6 36.6 4.85 2.61 2 GSWK (A) 2700 148 91.8 10.5 2.58 5 GSWK (A) 2700 133 109 10.8 3.65 9 GSWK (A) 2700 73.3 69.8 7.55 4.21
14 GSWK (A) 2700 33.6 16.4 3.06 1.18 20 GSWK (A) 2700 74.1 69.5 8.93 3.95
Page 140
137
Figure 3.15: Observed Species metric for L. rhomboides Feeding Study fish.
Page 141
138
CHAPTER4
PUSHING THE LIMIT?
EXAMINING THE EFFECTS OF INCREASED WATER TEMPERATURE ON THE
GUT MICROFLORA OF FUNDULUS HETEROCLITUS AND LAGODON
RHOMBOIDES1
1 Givens, C.E. and J.T. Hollibaugh. To be submitted to FEMS Microbiology Ecology.
Page 142
139
ABSTRACT
Vibrio species are often the dominant bacteria associated with marine fish and are
commonly found in the gut microflora of both farmed and wild fish. Our previous work
indicated that the gut microflora of the mummichog (Fundulus heteroclitus) and pinfish
(Lagodon rhomboides) are dominated by γ-Proteobacteria ribotypes (57% and 41%
respectively), mainly members of the family Vibrionaceae (34% and 41% of all
bacteria), including some that are closely related to potential pathogens. We used the
distribution of ribotypes in clone libraries and quantitative PCR (qPCR) assessments of
the relative abundance of Vibrio spp. and V. vulnificus within the gut microflora
community to assess whether environmental temperature affected the occurrence of
Vibrio species within fish guts. Clone libraries from the L. rhomboides temperature
study were dominated by Vibrionaceae ribotypes; including several that are documented
fish pathogens. The presence of potential pathogens in fish at the start of the study, in
addition to the observation that several fish became ill and/or died during the study,
suggests that these fish were stressed and more susceptible to gut pathogens. Sequences
retrieved from F. heteroclitus indicate that the Vibrio spp. within the gut microflora are
dominated by bacteria closely related (98.1-100%) to V. vulnificus (212 clones, 47%)
with additional contributions from V. ponticus (105 clones, 23%). Changes in relative
abundance of these two ribotypes indicate that there may be shifts within the Vibrio spp.
community with time and temperature. V. ponticus ribotypes peaked non-synchronously
to V. vulnificus ribotypes, suggesting an interaction between dominant Vibrio species.
qPCR analysis of F. heteroclitus gut microbiomes suggest an overall trend of increased
Vibrio spp. and V. vulnificus abundance with temperature.
Page 143
140
INTRODUCTION
Global climate change will impact all ecosystems and may have serious
repercussions for animal, human and environmental health. At the time the Climate
Change 2007 report was published, 11 of the last 12 years (1995-2006) were ranked
among the top 12 warmest years since estimates of annual mean of global surface
temperature were available (IPCC 2007; Parry et al. 2007). Climatologists predict a 1.8
to 4.0 ° C increase in mean temperatures over the next 100 years (Solomon et al. 2007),
with trends of increased temperature varying regionally. This temperature trend extends
to the global ocean. Although land regions seem to be warming more quickly than the
ocean, the upper 3000 meters of the ocean has warmed by approximately 0.4 °C since
1950 (Barnett et al. 2001; Levitus et al. 2001).
Small increases in water temperature can have serious impacts on aquatic
organisms. Elevated water temperatures may cause shifts in the distribution and
abundance of various organisms, in addition to causing changes in ice cover, salinity,
stratification, oxygen and nutrient levels and circulation (IPCC 2007; Parry et al. 2007).
The abundance of Vibrio spp. in coastal waters increases seasonally in response to
warmer water temperatures, and is greatest when the water temperatures are between 20
and 30 °C (Tantillo et al. 2004). As a result of this temperature preference, most
outbreaks of pathogenic Vibrio spp. occur during summer in temperate or subtropical
regions such as the Gulf Coast of the United States (DePaola et al. 2000). However,
recent reports of pathogenic Vibrio spp. outbreaks in new locales seem to indicate that
their ranges are expanding and incidences of virulence are increasing as a consequence of
warming oceans. These reports include V. vulnificus outbreaks in Israel (Paz et al. 2007)
Page 144
141
and Denmark (Dalsgaard et al. 1996). V. parahaemolyticus outbreaks in Spain
(Martinez-Urtaza et al. 2008), Chile (González-Escalona et al. 2005), and Alaska
(McLaughlin et al. 2005) have occurred at locales previously unaffected by this pathogen.
Vibrio spp. infections are increasing and appear to follow regional temperature trends
with outbreaks correlating with periods of unusually warm weather (Baker-Austin et al.
2010).
Vibrio species in general are often the dominant bacteria associated with marine
fish and are common members of the gut microflora in both farmed and wild fish
(MacFarlane et al. 1986; Cahill 1990; Sakata 1990; Blanch et al. 1997; Martin-Antonio et
al. 2007; Ward et al. 2009a). De Paola et al. (1994) isolated V. vulnificus from the
intestines of 18 different fish species from the Gulf of Mexico, suggesting that V.
vulnificus is a common member of the fish gut microbiome. This same study also found
that V. vulnificus densities in sheepshead (Archosargus probatocephalus) intestines were
2-4 orders of magnitude more abundant than in oysters and sediment collected at the same
time. The concentration of V. vulnificus in fish guts was five orders of magnitude greater
than in the surrounding seawater (DePaola et al. 1994).
Our previous work indicated that the gut microflora of the mummichog (Fundulus
heteroclitus) and pinfish (Lagodon rhomboides) are dominated by γ-Proteobacteria
ribotypes (57% and 41% respectively), mainly members of the family Vibrionaceae (34%
and 41% of all Bacteria), including some that are closely related to potential pathogens.
Thus, these two species were ideal for use in experiments to assess how changing
environmental conditions, specifically temperature, might affect the occurrence of
potentially pathogenic bacteria in fish intestines. Since environmental monitoring has
Page 145
142
indicated a correlation between the occurrence of pathogenic Vibrios and warmer
temperatures, we hypothesized an increase in the relative abundance of potential
pathogens within the gut in response to elevated water temperature. We used the
distribution of ribotypes in clone libraries and quantitative PCR (qPCR) to assess the
relative abundance of Vibrio spp. and V. vulnificus within the gut microflora community
to test this hypothesis.
METHODS
These studies were completed in compliance of Animal Use Protocol (AUP)
#2008-10017 approved by the University of Georgia Institutional Animal Care and Use
Committee (IACUC).
Lagodon rhomboides Collection
L. rhomboides (n=40) were collected by trawl from the Gulf of Mexico (29° 52’
N 84° 29’ W) near the Florida State University Coastal Marine Laboratory (St. Teresa,
FL), transported to the University of Georgia campus, and held in quarantine in a pre-
cleaned 800-gallon tank at 15-18 °C for 30 days. Fish body length ranged between 80
and 130 mm and according to our previous size classifications (see Chapter 2 and 3)
were considered to be old juveniles and young adults. Following quarantine, four fish
were selected randomly and sacrificed to establish the initial composition of the gut
microflora. The remaining 36 fish were divided among 6 100-gallon tanks kept at 18 °,
25 ° or 32 °C (2 tanks per temperature). Tanks were equipped with Power Filters with
two filter cartridges and recirculated water at a rate of 125 gallons per hour. The study
Page 146
143
lasted a total of 12 days with fish sampled every four days. All fish were fed a diet of
San Francisco Bay Brand Freeze-Dried Krill that was sterilized at 10 kGy with a Cobalt-
60 source gamma irradiator at the University of Georgia Center for Applied Isotope
Studies (Athens, GA). Food not consumed within 15 minutes of feeding was removed
from the tank. Tank salinity was kept constant and nitrite, nitrate, ammonia, and pH
levels were monitored.
Two fish were taken from each tank at each time point. All specimens were
euthanized with tricaine methanesulfonate (MS-222; Sigma). The mid- to hind-gut
region of the intestine was removed, sliced open, and placed in a PowerBead tube
(MoBio; Solana Beach, CA). DNA extraction was completed using the MoBio
PowerSoil DNA Extraction Kit.
All fish were outwardly healthy before beginning the experiment. Within the
first three days of the study, four fish from the 32 °C tanks developed skin lesions,
suffered skin degradation around their lower jaws, developed red fins, and died. Another
6 fish (two from each temperature treatment) developed red streaking through pectoral
and tail fins. One of those six fish (from the 32 °C treatment) also developed skin
lesions, which were sampled by swabbing.
Fundulus heteroclitus Sample Collection
F. heteroclitus (n=175) were collected from Sapelo Island, Georgia, and placed
into quarantine in a pre-cleaned 800-gallon tank at 15-18 °C for 30 days. Following
quarantine, five fish were selected randomly and sacrificed to establish the initial
composition of the gut microflora. The remaining 170 fish were divided randomly
Page 147
144
among 12 ten-gallon tanks maintained at four different temperatures of 20 °, 24 °, 28 °,
32 °C (3 tanks per temperature). Tanks were equipped with Power Filters and
recirculated as mentioned above. The study lasted a total of 28 days with fish sampled
every 4 days. Fish husbandry, tank maintenance, and fish dissections and DNA
extractions were completed as described in the previous study.
16S rRNA Sequencing and Analysis
Extracted DNA from L. rhomboides gut samples was amplified using Illustra
puReTaq Ready-To-Go PCR Beads (GE Healthcare) with the Bacteria-specific 16S
rRNA primers 27F/1492R (Lane 1991a) with the following PCR conditions: initial
denaturation at 95 °C for 5 minutes; 35 cycles of: denaturation at 95 °C for 45 seconds,
annealing at 62 °C for 30 s, and extension at 72 °C for 1 minute; finishing with a final
extension at 72 °C for 45 minutes. Extracted DNA from F. heteroclitus gut samples was
amplified using Bacteria-specific 16S rRNA primer 27F and Vibrio spp. 16S rRNA
primer 680R (Lane 1991a; Thompson et al. 2004b) and cycling parameters previously
described (Thompson et al. 2004b). Amplified DNA was electrophoresed on a 1%
agarose gel, bands of the expected product size were excised, and the DNA was extracted
and purified using QIAGEN QIAquick gel extraction kits. Gel-purified DNA was cloned
with the TOPO TA cloning kits (Invitrogen) using the pCR 4.0-TOPO TA vector and
competent E. coli cells. Clones were selected randomly and sequenced using the 27F
primer by Genewiz (South Plainfield, NJ). Clone libraries for L. rhomboides aimed to
analyze the total bacteria community (Bacteria 16S rRNA); however, F. heteroclitus
libraries only considered the Vibrio spp. 16S rRNA community. The previous clone
Page 148
145
libraries for L. rhomboides included Vibronaceae ribotypes that were further identified
(at >97% similarity) to both Photobacterium spp. and Vibrio spp. ribotypes. The Vibrio
spp. 16S rRNA primers do not target Photobacterium spp. and we aimed to gauge the
effects of increased water temperature on all Vibrionaceae ribotypes. This was not an
issue for F. heteroclitus clone libraries since all Vibrionaceae ribotypes in the previous
libraries were binned as Vibrio spp. ribotypes. All sequences were checked for chimeras
using the Bellerophon server (Huber et al. 2004). Sequences were then assigned to
ribotypes by BLAST (Johnson et al. 2008) against the non-redundant nucleotide database
(NCBI GenBank), aligned with ClustalW (Larkin et al. 2007), and phylogenetic trees
were constructed using Geneious Pro 4.8.5 (Biomatters Ltd; Auckland, New Zealand)
and MEGA 5.05(Tamura et al. 2011).
Quantitative PCR
Quantitative PCR (qPCR) was completed using a BioRad iCycler (Hercules, CA).
Reactions were run in 25 μL volume with 1 X iQ SYBR Green Supermix (BioRad
Laboratories; Hercules, CA), forward and reverse primers, nuclease free water, and 2 μL
of template DNA. The primers Bact1369F and Prok1492R (Suzuki et al. 2000b) were
used for qPCR of 16S rRNA genes, with cycling parameters previously as described
(Buchan et al. 2009a). Primers 567F and 680R were used for Vibrio-specific qPCR of
16S rRNA genes, with published cycling parameters (Thompson et al. 2004b). Primers
F-vvh and R-vvh (Panicker et al. 2004) were used for qPCR of V. vulnificus vvh genes.,
(Panicker et al. 2004). All reactions were run in triplicate with standards ranging from
101 to 10
7 copies per L. Since many bacteria have more than one copy of the 16S
Page 149
146
rRNA gene per genome, the data were adjusted by dividing the number of gene copies
per reaction (copies/μL) by an average number of 16S rRNA genes per genome (3.94 for
bacteria and 9.75 for Vibrios) (Klappenbach et al. 2001a; Lee et al. 2009b). The average
16S rRNA gene copy number was determined by evaluating the operon copy number of
ribotypes identified in both 16S rRNA and Vibrio 16S rRNA clone libraries.
Statistical Analysis
Kruskal-Wallis one way analysis of variance, and pairwise Wilcoxon rank sum tests were
performed in R (R Core Team 2009) using the vegan statistical package (Oksanen et al.
2009) to test whether differences in relative abundances measured by quantitative PCR
were significant among temperature treatments.
RESULTS
Temperature Study I –L. rhomboides
A total of 270 clones were sequenced, of which 29 were discarded because they
were of poor quality or chimeric. Of the remaining 241 sequences, 52% were γ-
Proteobacteria (Figure 4.1). These γ-Proteobacteria were primarily either
Photobacterium spp. or Vibrio spp., which contributed 27% and 23%, respectively, to the
total bacteria sequences retrieved. Photobacterium spp. ribotypes were >97% similar to
P. mandapamensis and P. damselae subsp. piscida. Vibrio spp. ribotypes were >97%
similar to V. ichthyoenteri, V. ponticus, and V. harveyi.
Most (58%) of the Photobacterium spp. and Vibrio spp. ribotypes were retrieved
from fish in the 18 °C treatments. The gut microbiome of fish from the 32 °C treatment
Page 150
147
contained primarily P. mandapamenis ribotypes (47%). Ribotypes (>97% similarity
cutoff) retrieved from the guts of fish in the 25 °C treatments were assigned to
Methylobacterium jeotgali (29%), uncultured Burkholderiales (29%), and
Saccharococcus sp. (24%). Ribotypes from the lesions on fish from the 32 °C treatment
were classified as V. harveyi (64%), Oxalobacteraceae (18%), Methylobacterium jeotgali
(14%) and uncultured Clostridia (4%).
Vibrio spp. ribotypes accounted for approximately 50% of the Bacteria ribotypes
in the samples taken at the beginning of the experiment (Figure 4.2). Although the
relative abundance of Vibrio ribotypes varied over the time-course of the experiment, the
differences between time points and treatments were not statistically significant.
Temperature Study II – Vibrios in F. heteroclitus
A total of 550 sequences were retrieved from F. heteroclitus gut microbiomes.
Twelve percent of those sequences were discarded because they were of poor quality.
Six percent of the remaining sequences were identified as Enterovibrio spp. and were
also discarded since they did not classify within the genus Vibrio. Of the remaining 455
sequences, 47% were >98% similar to V. vulnificus and 23% were >98% similar to V.
ponticus (Figure 4.3). The remaining clones (30%) were classified as a variety of Vibrio
spp. including V. natriegens, V. shilonii, V. sinaloensis, V. hepatarius, and V.
alginolyticus.
V. vulnificus ribotypes were found in fish from all four temperature treatments.
Twenty-five percent of these ribotypes were from the 20 °C, 27% from the 24 °C, 17%
from the 28 °C, and 36% from the 32 °C treatment. The V. ponticus ribotypes were
Page 151
148
predominately from either the 24 °C (47%) or 28 °C treatments (38%). V. vulnificus
ribotypes were found in the baseline fish (data not shown) and persisted through the
entire time course of the study. However, V. ponticus ribotypes were not found in the
initial samples and were only minimally abundant in the clone library prior to Day 12.
The relative abundance of both Vibrio 16S and vvh genes increased during the
experiment in all treatments (Figure 4.5). There was a statistically significant difference
in the relative abundances of Vibrio 16S rRNA with temperature (p=0.018). There was
also a statistically significant difference in the relative abundance of V. vulnificus vvh
genes with temperature (p=0.008). This difference was statistically significant between
the 20 °C and 32 °C treatments for both the relative abundance of Vibrio 16S rRNA and
V. vulnificus vvh (p=0.037 and 0.012 respectively).
DISCUSSION
These studies were conducted to determine if and how elevated temperature
regimes might affect the relative abundance of Vibrio spp. in fish gut microbiomes.
Libraries from the L. rhomboides temperature study were dominated by Vibrionaceae
ribotypes; including several (P. damselae subsp. piscida, V. harveyi, and V.
ichythoenteri) that are documented fish pathogens (Austin and Austin 1999; Buller
2004). Several of the ribotypes associated with lesions were also similar to the
potentially pathogenic V. harveyi. The presence of potential pathogens in fish at the start
of the study, in addition to the observation that several fish became ill and/or died during
the study, suggests that these fish were stressed and more susceptible to gut pathogens.
Page 152
149
This increased susceptibility may have masked any effects of increased water
temperature on the gut microbiome.
We did not see a correlation between the relative abundance of Vibrio spp. 16S
rRNA genes and increased temperature in the L. rhomboides study. The relative
abundance of Vibrio 16S rRNA increased with temperature during the first 8 days of the
experiment. The subsequent decrease after Day 8 may indicate that other bacteria were
becoming more abundant with time and/or increased temperature.
Sequences retrieved from F. heteroclitus indicate that the Vibrio spp. within the
gut microflora were dominated by bacteria closely related (98.1-100%) to V. vulnificus
(212 clones, 47%) with additional contributions from V. ponticus (105 clones, 23%).
There was significant variation in the relative abundance of Vibrio 16S rRNA between
different time points. These changes may reflect shifts within the composition of the
Vibrio spp. community with time. This is supported by changes we observed in the
contribution of V. ponticus ribotypes to the Vibrio community in our samples. This
ribotype was not found in the initial sample but increased in relative abundance in clone
libraries with time. The relative abundance of V. ponticus ribotype in clone libraries
peaked in opposition to V. vulnificus ribotypes, suggesting a shift in dominating Vibrio
species. The relative abundance of other Vibrio spp. ribotypes present in the clone
libraries (V. alginolyticus, V. natriegens, V. shilonii) did not vary temporally. The
relative abundance of V. vulnificus vvh genes varied significantly between the 20 °C and
32 °C treatments. Kelly (1982) found that this bacterium had an optimal growth rate in
vitro of 37 °C. They also reported that V. vulnificus grew well at 30-35°C, but grew
Page 153
150
more slowly at 25 °C. This may explain the increased abundance of V. vulnificus vvh in
the 32 °C treatment when compared to the 20 °C treatments (especially post-day 20).
Increased abundance of potentially pathogenic bacteria in intestinal microflora
may have implications for both fish health and human health. Although most of the
V.vulnificus-related illnesses and deaths in humans stem from oyster or shellfish
consumption, many fish species harbor this potential pathogen in their guts (DePaola et al.
1994; Chapter 4). Previous studies have suggested that it is possible for Gram-negative
bacteria such as the Vibrio spp. to move from the fish intestine to blood and muscle (Buras
et al. 1985; DePaola et al. 1994) and pathogenesis of some Vibrio-spp. infections in
mammals originates as a gut infection (Ringø et al. 2003). Thus, there may be a danger of
increased V.vulnificus infections in areas where consumption of lightly-cooked and raw
fish are popular (i.e. Eastern Europe, Japan, and IndoPacific regions) (DePaola et al.
1994). Fish feces contain gut microflora, which are then released into the environment
(data not shown), thus fish harboring pathogens within their guts may also serve as vectors
capable of transferring pathogenic gut bacteria to new hosts within the same environment.
ACKNOWLEDGMENTS
This research was supported by NOAA Oceans and Human Health Initiative
Traineeship S0867882. We thank Scott Noakes, Sylvia Schaefer, Christine Hladik,
Bradley Tolar, Vanessa Varaljay, and Mary Price for their assistance and advice.
Page 154
151
REFERENCES
Austin, B., and D. A. Austin. 1999. Bacterial fish pathogens : disease of farmed and wild
fish, 3rd rev. ed. Springer;Praxis Pub.
Baker-Austin, C., L. Stockley, R. Rangdale, and J. Martinez-Urtaza. 2010. Environmental
occurrence and clinical impact of Vibrio vulnificus and Vibrio parahaemolyticus:
a European perspective. Environmental Microbiology Reports 2: 7-18.
Barnett, T. P., D. W. Pierce, and R. Schnur. 2001. Detection of anthropogenic climate
change in the world's oceans. Science 292: 270-274.
Blanch, A. R., M. Alsina, M. Simón, and J. Jofre. 1997. Determination of bacteria
associated with reared turbot (Scophthalmus maximus) larvae. Journal of Applied
Microbiology 82: 729-734.
Buchan, A., M. Hadden, and M. T. Suzuki. 2009. Development and application of
quantitative-PCR tools for subgroups of the Roseobacter clade. Applied and
Environmental Microbiology 75: 7542-7547.
Buller, N. B. 2004. Bacteria from fish and other aquatic animals: a practical identification
manual. CABI.
Buras, N., L. Duek, and S. Niv. 1985. Reactions of fish to microorganisms in wastewater.
Applied and Environmental Microbiology 50: 989-995.
Cahill, M. M. 1990. Bacterial flora of fishes: a review. Microbial Ecology 19: 21-41.
Dalsgaard, A., N. Frimodt-Møller, B. Bruun, L. Høi, and J. Larsen. 1996. Clinical
manifestations and molecular epidemiology of Vibrio vulnificus infections in
Denmark. European Journal of Clinical Microbiology & Infectious Diseases 15:
227-232.
DePaola, A., G. M. Capers, and D. Alexander. 1994. Densities of Vibrio vulnificus in the
intestines of fish from the U.S. Gulf Coast. Applied and Environmental
Microbiology 60: 984-988.
DePaola, A., C. A. Kaysner, J. Bowers, and D. W. Cook. 2000. Environmental
investigations of Vibrio parahaemolyticus in oysters after outbreaks in
Washington, Texas, and New York (1997 and 1998). Applied and Environmental
Microbiology 66: 4649-4654.
González-Escalona, N. and others 2005. Vibrio parahaemolyticus diarrhea, Chile, 1998
and 2004. Emerging Infectious Diseases 11: 129.
Page 155
152
Huber, T., G. Faulkner, and P. Hugenholtz. 2004. Bellerophon: a program to detect
chimeric sequences in multiple sequence alignments. Bioinformatics 20: 2317-
2319.
IPCC. 2007. Climate change 2007: synthesis report. Cambridge University Press
Cambridge,, UK.
Johnson, M., I. Zaretskaya, Y. Raytselis, Y. Merezhuk, S. Mcginnis, and T. L. Madden.
2008. NCBI BLAST: a better web interface. Nucleic Acids Research 36: W5-W9.
Klappenbach, J. A., P. R. Saxman, J. R. Cole, and T. M. Schmidt. 2001. rrndb: the
ribosomal RNA operon copy number database. Nucleic Acids Research 29: 181-
184.
Lane, D. 1991. 16S/23S rRNA sequencing. Nucleic acid techniques in bacterial
systematics.
Larkin, M. and others 2007. Clustal W and Clustal X version 2.0. Bioinformatics 23:
2947-2948.
Lee, Z. M. P., C. Bussema Iii, and T. M. Schmidt. 2009. rrnDB: documenting the number
of rRNA and tRNA genes in bacteria and archaea. Nucleic Acids Research 37:
D489-D493.
Levitus, S., J. I. Antonov, J. Wang, T. L. Delworth, K. W. Dixon, and A. J. Broccoli.
2001. Anthropogenic warming of Earth's climate system. Science 292: 267-270.
MacFarlane, R., J. Mclaughlin, and G. Bullock. 1986. Quantitative and qualitative studies
of gut flora in striped bass from estuarine and coastal marine environments.
Journal of Wildlife Diseases 22: 344-348.
Martin-Antonio, B. and others 2007. Intestinal microbiota variation in Senegalese sole
(Solea senegalensis) under different feeding regimes. Aquaculture research 38:
1213-1222.
Martinez-Urtaza, J., A. Lozano-Leon, J. Varela-Pet, J. Trinanes, Y. Pazos, and O. Garcia-
Martin. 2008. Environmental determinants of the occurrence and distribution of
Vibrio parahaemolyticus in the rias of Galicia, Spain. Applied and Environmental
Microbiology 74: 265-274.
McLaughlin, J. B. and others 2005. Outbreak of Vibrio parahaemolyticus gastroenteritis
associated with Alaskan oysters. New England Journal of Medicine 353: 1463-
1470.
Oksanen, J. and others 2009. vegan: Community Ecology Package. R package version
1.15-2. 2009.
Page 156
153
Panicker, G., M. L. Myers, and A. K. Bej. 2004. Rapid detection of Vibrio vulnificus in
shellfish and Gulf of Mexico water by real-time PCR. Applied and Environmental
Microbiology 70: 498-507.
Parry, M. L., O. F. Canziani, J. P. Palutikof, P. J. Van Der Linden, and C. E. Hanson.
2007. IPCC, 2007: climate change 2007: impacts, adaptation and vulnerability.
Contribution of working group II to the fourth assessment report of the
intergovernmental panel on climate change. Cambridge University Press,
Cambridge.
Paz, S., N. Bisharat, E. Paz, O. Kidar, and D. Cohen. 2007. Climate change and the
emergence of Vibrio vulnificus disease in Israel. Environmental Research 103:
390-396.
R Core Team. 2009. R: A Language and Environment for Statistical Computing. R
Foundation for Statistical Computing.
Ringø, E., R. E. Olsen, T. M. Mayhew, and R. Myklebust. 2003. Electron microscopy of
the intestinal microflora of fish. Aquaculture 227: 395-415.
Sakata, T. 1990. Microflora in the digestive tract of fish and shellfish, p. 171-176. In
Microbiology in Poecilotherms. Elsevier.
Solomon, S. and others 2007. The physical science basis. Contribution of working group
I to the fourth assessment report of the intergovernmental panel on climate
change: 235-337.
Suzuki, M. T., L. T. Taylor, and E. F. Delong. 2000. Quantitative analysis of small-
subunit rRNA genes in mixed microbial populations via 5′-nuclease assays.
Applied and Environmental Microbiology 66: 4605-4614.
Tamura, K., D. Peterson, N. Peterson, G. Stecher, M. Nei, and S. Kumar. 2011. MEGA5:
molecular evolutionary genetics analysis using maximum likelihood, evolutionary
distance, and maximum parsimony methods. Molecular biology and evolution 28:
2731-2739.
Tantillo, G. M., M. Fontanarosa, A. Di Pinto, and M. Musti. 2004. Updated perspectives
on emerging vibrios associated with human infections. Letters in Applied
Microbiology 39: 117-126.
Thompson, J. R., M. A. Randa, L. A. Marcelino, A. Tomita-Mitchell, E. Lim, and M. F.
Polz. 2004. Diversity and dynamics of a North Atlantic coastal Vibrio
community. Applied and Environmental Microbiology 70: 4103-4110.
Page 157
154
Ward, N., B. Steven, K. Penn, B. Methé, and W. Detrich. 2009. Characterization of the
intestinal microbiota of two Antarctic notothenioid fish species. Extremophiles
13: 679-685.
Page 158
155
Figure 4.1: Phylogenetic analysis of Bacteria 16S rRNA gene sequences retrieved
from the guts of L. rhomboides held at different temperatures. This is a Neighbor-
Page 159
156
joining tree. The scale bar at bottom indicates Jukes-Cantor distances. Bootstrap values
>50% (100 iterations) are shown. Numbers below the reference sequence identifiers give
the number of sequences assigned to that clade while bars to right indicate the
contribution of OTUs from different treatments to that clade.
Page 160
157
Figure 4.2: Changes in the relative abundance of Vibrio spp. ribotypes in guts of L.
rhomboides fish held at different temperatures as a percent of all Bacteria ribotypes
retrieved from each fish (n=3 for each temperature, bars indicate standard
deviation).
Initial
Page 162
159
Figure 4.3: Phylogenetic analysis of Vibrio 16S rRNA gene sequences retrieved
from the guts of F. heteroclitus held at different temperatures. This is a Neighbor-
joining tree. The scale bar at the bottom indicates Jukes-Cantor distances. Bootstrap
values >50% (100 iterations) are shown. Numbers below the reference sequence
identifiers give the number of sequences assigned to that clade while bars to right indicate
the contribution of OTUs from different treatments to that clade.
Page 163
160
a)
]
Initial
Page 164
161
b)
Figure 4.5: qPCR analysis of changes in the ratio of: a) Vibrio 16S rRNA:Bacteria
16S rRNA genes; and b) V. vulnificus vvh:Bacteria 16S rRNA genes in samples from
intestines of F. heteroclitus held at different temperatures. Intestinal samples in
assays targeting qPCR data have been corrected for average rRNA copy numbers for
Bacteria (3.94) and Vibrio spp. (9.75). The ratio and standard error (error bars) have
been plotted for n=6 fish at all temperatures and time points.
Initial
Page 165
162
CHAPTER 5
INVESTIGATION OF FISH INTESTINES AND SEDIMENT AS POTENTIAL
RESERVOIRS OF VIBRIO VULNIFICUS AND VIBRIO PARAHAEMOLYTICUS1
1Givens, C.E., J.C. Bowers, A. DePaola, J.T. Hollibaugh, and J.L. Jones. To be
submitted to Applied and Environmental Microiology.
Page 166
163
ABSTRACT
Vibrio vulnificus and Vibrio parahaemolyticus are Gram-negative bacteria native
to estuaries in the Gulf of Mexico. These bacteria are also human pathogens, associated
with the consumption of raw oysters in warm months. We examined fish intestines and
sediment as potential reservoirs for V. vulnificus and V. parahaemolyticus during times of
the year they are not detectable in oysters. We quantified these pathogens in fish
intestine, sediment, oyster, and water samples from Mobile Bay, Alabama, USA. Vibrio
densities were determined by quantitative PCR (qPCR) and direct plating-colony
hybridization. The greatest densities of these bacteria were detected when water
temperatures were 24.5°C and salinity was 8.6 psu. V. vulnificus and V.
parahaemolyticus were detected by qPCR in 69 and 40% of fish intestine, 82 and 42% of
water, 27% and 27% of sediment, 13 and 20% of oyster samples, respectively. Higher
detection rates of both bacteria were obtained by colony hybridization due to the lower
limit of detection (10 CFU/g vs. ~500 copies/g). Overall, V. vulnificus was detected at
greater densities than V. parahaemolyticus. The data indicate that fish intestines and
sediment may be reservoirs for V. vulnificus and V. parahaemolyticus during periods
when temperatures and/or salinity are sub-optimal for these bacteria and few oyster-
associated illnesses are reported.
INTRODUCTION
Vibrio parahaemolyticus and Vibrio vulnificus are Gram-negative marine bacteria
that are naturally found in estuarine and marine waters (Kaneko and Colwell 1975). The
abundance of Vibrio spp. increases seasonally with V. parahaemolyticus and V. vulnificus
Page 167
164
densities increasing during warmer months when the water temperature is above 15 °C
(Kaneko and Colwell 1974, 1975b; McLaughlin et al. 2005) and 20 °C, respectively
(Kelly 1982; Tamplin et al. 1982; Kaysner et al. 1987). The highest densities of these
cells occur when the water temperature ranges between 20 and 30 °C (Kelly, 1982,
DePaola et al. 2003; Tantillo et al. 2004). During this period of increased temperatures,
pathogenic Vibrio spp. can pose an increased risk of infections for humans (Lipp et al.
2002; McLaughlin et al. 2005). Approximately 75% of V. vulnificus infections occur
between May and October when the water temperature is over 20 °C (Rippey 1994; CDC
2009). Additionally, higher densities of V. parahaemolyticus and V. vulnificus have been
observed when salinities are between 15-25 psu (Anonymous 2010; Cook et al. 2002;
DePaola et al. 2003; FAO/WHO 2011) and 5-15 psu, respectively (Kelly 1982; Wright et
al. 1996; Motes et al. 1998, Lipp et al. 2001; Randa et al. 2004). Optimal environmental
conditions for V. vulnificus and V. parahaemolyticus have been defined as >20°C (Kelly,
1982; Wright et al., 1996; Randa et al., 2004;) and 5-15 psu (Kelly, 1982; Wright et al.,
1996; Motes et al., 1998; Lipp et al., 2001), and >15°C (Kaneko & Colwell, 1974; Kaneko
& Colwell, 1975b; DePaola et al, 2003; McLaughlin et al., 2005) and 15-25 psu
(Anonymous 2010; Cook et al., 2002; DePaola et al., 2003; FAO/WHO 2011),
respectively.
Several members of the Vibrio genus are pathogenic to humans and marine
animals, and V. parahaemolyticus and V. vulnificus are leading causes of seafood-
associated bacterial illness and mortality (Iwamoto et al. 2010). Infection with these two
species can cause gastroenteritis and septicemia through consumption of raw or
undercooked seafood or wound infections (Constantin et al. 2009). A recent CDC report
Page 168
165
on foodborne illnesses within the United States documented an annual incidence of V.
vulnificus illnesses at 111 cases and that of V. parahaemolyticus at 287 cases (Scallan et
al. 2011). However, these numbers do not account for under-reporting and misdiagnosis,
with perhaps more accurate annual incidence estimates of 207 cases for V. vulnificus and
44,950 cases for V. parahaemolyticus (Scallan et al. 2011). Although V. vulnificus
infections are rare, they are the leading cause of seafood-related deaths domestically and
have one of the highest hospitalization (91.3%) and mortality (34.8%) rates of all
foodborne pathogens (Scallan et al. 2011; Iwamoto et al. 2010). V. parahaemolyticus
infections are common worldwide. In the United States, this bacterium is the leading
cause of bacterial illness from seafood consumption (Iwamoto et al. 2010), but has a
lower hospitalization (22.5%) and mortality (0.9%) rate than V. vulnificus (Scallan et al.
2011).
Not all V. parahaemolyticus or V. vulnificus strains are pathogenic and cause
illness and infections. The genes tdh (thermostable direct hemolysin, TDH) and trh
(TDH-related hemolysin, TRH) are generally associated with V. parahaemolyticus
virulence (Honda and Iida 1993). The tdh and/or trh gene(s) are frequently present in
clinical strains; they are less frequently recovered from environmental strains (Shirai et
al. 1990, Nishibuchi and Kaper 1995). Although less frequent, tdh and trh genes have
been found in environmental strains of V. parahaemolyticus (Wong et al. 2000; Cook et
al. 2002, DePaola et al. 2000; Zimmerman et al. 2007; Johnson et al. 2010; Kirs et al.
2011; Jones et al. 2012). Aznar et al. (1994) found two main variations in 16S rRNA
gene sequences for V. vulnificus, strains which were designated as Type A and B. The
majority (76-94%) of V. vulnificus isolates originating from clinical fatalities linked with
Page 169
166
oyster consumption were noted to be Type B, suggesting that this ribotype has increased
virulence (Nilsson et al. 2003, Aznar et al. 1994).
Both of these bacteria are found not only in the water column, but also in shellfish,
fish, plankton, and the sediment (Aznar et al. 1994, Zimmerman et al. 2007; Maugeri
2006; Martinez-Urtaza et al. 2012). Vibrio spp. are often considered to be the dominant
cultivable bacteria found in and on marine fish and are common members of the gut
microflora in both farmed and wild fish (MacFarlane et al. 1986; Sakata 1990; Martin-
Antonio et al. 2007; Ward et al. 2009). DePaola et al. (1994; 1997) reported high
densities of V. vulnificus in several finfish species collected from the Gulf of Mexico. De
Paola et al. (1994) documented that V. vulnificus densities in sheepshead (Archosargus
probatocephalus) intestines registered as 2-4 logs (log10; mean V. vulnificus MPN/100 g
or mL) greater than in corresponding oyster and sediment samples and 5 logs (log10)
greater than in seawater samples. Similarly, in a subsequent study, V. vulnificus densities
in the fish gut were 2-3 logs (log10) lower in March and December when water
temperatures were 21.9 °C and 17.5 °C as compared to those recorded in May and
September when water temperatures were 24.7 °C and 30.6 °C (DePaola et al. 1997).
The aim of this study was to determine if fish intestines and/or sediments are
reservoirs of V. vulnificus or V. parahaemolyticus during periods of sub-optimal
environmental conditions. Our objective was to quantify the abundance of both these
bacteria in fish, oysters, sediment, and water using both culture-independent (qPCR) and
culture-dependent (colony hybridization) techniques. All sample collections occurred
during the spring (mid-March to May) when there was an expected increase in water
temperature and thus, an expected increase in V. parahaemolyticus and V. vulnificus
Page 170
167
abundance. Increased occurrence and abundance of these potentially pathogenic bacteria
within the intestine may not only affect fish health, but also the surrounding environment
(oysters, sediment, and water) once they are expelled from the gut with fecal matter. If
pathogenic, these bacteria can impact public health through food transmissions and
wound infections.
METHODS
Sample Collection
Fish, oyster, sediment, and water samples were collected from Mississippi Sound
(30°15’N, 088°60’W) off Dauphin Island, Alabama from March 17 to May 2, 2011.
Water temperature, salinity, and dissolved oxygen measurements were taken during each
sampling using an YSI 85 meter (YSI; Yellow Springs, OH). Six oysters were collected
at each sampling from a suspended oyster cage. Water was collected in sterile 500 mL
wide-mouth polyethylene bottles. Sediment was also collected in sterile specimen cups.
Fish samples were caught with hook and line or cast net and placed immediately on ice.
A total of 10 fish species were used throughout the study including sheepshead
(Archosargus. probatocephalus), sea catfish (Aruis felis), Atlantic croaker
(Micropogonias undulatus), ground mullet (Menticirrhus americanus), spot (Leiostomus
xanthus), black drum (Pogonias cromis), silver perch (Bairdiella chrysoura), pinfish
(Lagodon rhomboides), southern flounder (Paralichthys lethostigma), and striped mullet
(Mugil cephalus). These species were chosen because they could repeatedly be caught
from the same pier from which oyster cages were suspended and water and sediment
were sampled. Fish were weighed and then the external surfaces were sterilized with
Page 171
168
ethanol (70%) to prevent potential contamination of the gut microflora during dissection.
Fish were aseptically dissected, the mid to hind-gut regions removed, and digesta was
squeezed into a sterile container and weighed. Multiple fish specimens of the same
species were pooled when collected on the same sampling day.
DNA Extraction Control
Prior to extraction of each sample, an aliquot of an overnight alkaline peptone
water (APW) culture of ctx+ V. cholerae was added. After addition of the ctx extraction
control, the samples were vortexed briefly and incubated at room temperature for five
minutes. Extractions were performed as described below. The amount of ctx recovered
from the extraction and amount of ctx added were quantified by qPCR (Blackstone et al.
2007). These values were used to determine recovery of the extraction [amount
recovered ÷ amount added = recovery]. The percent recovery was used to adjust qPCR
data for Bacteria 16S rRNA, Vibrio spp. 16S rRNA, V. vulnificus and V.
parahaemolyticus.
DNA Extractions
Approximately 1.0 gram of fish gut was transferred to an empty MoBio
PowerMax Bead Beating tube (MoBio; Carlsbad, CA) and extraction control added.
DNA extraction was completed using the MoBio PowerMax Soil DNA Extraction Kit
following the manufacturer’s instructions except that only 2 mL of Solution C6 was used
for the final elution step, to increase DNA recovery.
Page 172
169
Oysters were washed, shucked, and blended together for 90 seconds. Then 0.5 g
was placed into a microfuge tube and extraction control added. DNA extraction for
oyster samples was completed using the Qiagen Blood & Tissue Kit (Qiagen; Valencia,
CA). As a modification to the manufacturer’s kit instructions to enhance recovery,
reagent volumes for Buffer ATL, Buffer AL, and ethanol were doubled and the final
elution with Buffer AE was reduced to 100 µL.
The extraction control was added to the water samples (100 mL), filtered through
a 0.22 μM nitrocellulose filter (Millipore; Billerica, MA), and extracted using the MoBio
Power Water DNA Extraction Kit following the manufacturer’s instructions.
A 1.0 g sample of sediment was mixed with the extraction control, and then DNA was
extracted using the MoBio Power Soil DNA Extraction Kit following the manufacturer’s
kit instructions.
Culture-Dependent Methods
Colony Hybridization.
Serial 10-fold dilutions of each homogenized sample were made in phosphate
buffered saline (PBS; 7.65 g of NaCl, 0.724 g of Na2HPO4 anhydrous, 0.21 g of KH2PO4
per liter, pH 7.4) and 100 μL was spread plated on T1N3 (1% tryptone, 3% NaCl, 2%
agar, pH 7.6) and VVA (Kaysner and DePaola 2004) agars. Additionally, 0.1 g of oyster
and sediment samples was spread plated onto T1N3 and VVA plates. For water samples,
100 mL and 10 mL aliquots were filtered through a 0.22 μM nitrocellulose filter
(Millipore) and the filters plated on T1N3 and VVA. Additional water samples of 1 mL
Page 173
170
and 100 μL volumes were spread directly onto T1N3 and VVA. All plates were incubated
overnight at 35°C.
After overnight incubation, VVA and T1N3 plates with growth were used for
colony lifts and hybridization using DNA probes (DNA Technology; Aarhus, Denmark)
targeting the V. vulnificus vvhA gene and the V. parahaemolyticus tlh gene as previously
described (Wright et al. 1993; McCarthy et al. 1999). Purple (probe-positive) spots were
counted and V. parahaemolyticus and V. vulnificus levels reported as CFU/g or ml.
Colony Isolation.
For isolation of colonies, thiosulfate-citrate-bile salts sucrose (TCBS) and CPC+
(Warner and Oliver 2007) agars were spread plated as described above and incubated
overnight at 35°C. A maximum of 30 colonies indicative of V. parahaemolyticus (from
TCBS) or V. vulnificus (from CPC+) were picked for colony isolation and streaked onto
TSA + 1% NaCl plates and incubated overnight at 35°C. Following overnight incubation
all TSA + 1% NaCl plates were checked for colony growth. If the growth appeared to be
mixed colony growth, colonies were once again isolated and each type was streaked onto
separate TSA + 1% NaCl plates and incubated overnight at 35°C. If growth appeared to
be pure culture growth, an isolated colony was transferred into a well of a 96-well
microtiter plate containing 100 μL alkaline peptone water (APW; 1% peptone, 1% NaCl,
pH 8.5 ± 0.2) per well. Microtiter plates were incubated overnight at 35°C. Following
incubation, 100 μL TSB + 1% NaCl + 30% glycerol was added to all wells and then the
plate was frozen for future isolate characterization. Isolated colonies were replicated to
VVA and triplicate T1N3 plates, incubated overnight at 35°C, and then used for colony
Page 174
171
lifts and hybridization as described below. Boiled preparations (10 min at 100°C) of the
isolates were used as template in PCR to confirm whether they were positive for either V.
vulnificus and 16S Type A or B genes (Kirs et al 2011; Vickery et al. 2007) or V.
parahaemolyticus and tdh/trh genes (Nordstrom et al. 2007).
Culture Independent Enumeration
Quantitative PCR (qPCR) was completed using the Smart Cycler II (Cepheid;
Sunnyvale, CA) and iCycler (BioRad Laboratories; Hercules, CA) systems and the
primer and probe sequences listed in Table 5.1. All primers and probes were purchased
from IDT (Coralville, IA) or Applied Biosystems (Foster City, CA). 16S and Vibrio 16S
qPCR reactions were run in 25 μL volume with 1 X iQ SYBR Green Supermix (BioRad),
forward and reverse primers, nuclease free water, and 3 μL of template DNA. For the 16S
qPCR, the primers Bact1369F and Prok1492R (Suzuki et al. 2000) were used with
cycling parameters previously described (Buchan et al. 2009). For Vibrio-specific 16S
rRNA qPCR, primers 567F and 680R were used with published cycling parameters
(Thompson et al. 2004). All reactions were run in triplicate with standards ranging from
101 to 10
7 copies per uL. Since many bacteria have more than one copy of the 16S rRNA
gene, the number of gene copies per reaction (copies/reaction) was normalized to
adjusted 16S rRNA genes/reaction by dividing by an average of 3.94 16S rRNA genes
and 9.75 Vibrio 16S rRNA genes (Klappenbach et al. 2001; Lee et al. 2009).
The V. parahaemolyticus qPCR used the tlh primers and protocol as described
previously (Nordstrom et al. 2007). The V. vulnificus PCR used the primers and
protocols as previously published (Campbell and Wright 2003) with modifications for the
Page 175
172
Smart Cycler II platform as previously described (Jones et al. 2012). Standard curves for
each target were run in triplicate and all samples tested in duplicate for quantification.
Statistical Analysis
Correlation and Regression Tree (CART) analysis was performed on qPCR
abundance data for total bacteria count (TBC, Bacteria 16S rRNA) and Vibrio 16S rRNA
and also on colony hybridization data for V. vulnificus and V. parahaemolyticus. CART
was not performed on qPCR data for V. vulnificus and V.parahaemolyticus because there
were too many samples below the level of detection. We used CART to analyze
abundance versus temperature and salinity in order to determine optimal and sub-optimal
temperatures and salinity for our fish, oyster, sediment, and water samples. Additionally
correlations between the abundance of bacteria ((TBC, Bacteria 16S rRNA), Vibrio 16S
rRNA, V. vulnificus, and V. parahaemolyticus) among samples and also by method
(culture dependent vs. culture-independent) were calculated using the non-parametric
correlation, Kendall’s tau.
RESULTS
Environmental Correlations
During the study, water temperature at the sampling site varied from 20.1-24.6 °C
(average=22 °C), salinity ranged from 3.7-18.8 psu (average=10.5 psu), and dissolved
oxygen ranged from 4.5-8.7 mg/L (average=6.9 mg/L). CART analysis defined optimal
and sub-optimal environmental conditions for V. vulnificus and V. parahaemolyticus for
our fish, oyster, sediment, samples (Table 5.1 and Table 5.2). For most samples,
Page 176
173
temperature was the primary influence on abundance. Salinity was the primary indicator
of optimal environmental conditions for V. vulnificus abundance in water samples and
Bacteria 16S rRNA, Vibrio 16S rRNA, and V. vulnificus abundance in oysters. Optimal
temperature for V. vulnificus abundance was >24.0 °C for the fish gut and >22.0 °C for
sediment. The optimal temperature for V. parahaemolyticus was >23.5 °C for the fish
gut, oysters, and water. Optimal salinity for V. parahaemolyticus was >8.3 psu in oyster
and water samples and >11 psu in the fish gut. For V. vulnificus, optimal salinity was
>3.8 psu in the fish gut, >12 psu in oyster samples, and <12 psu in the sediment, <10 psu
in the water samples.
Bacteriological Levels
Figure 5.1 shows the abundance of all Bacteria (Bacteria 16S rRNA), all Vibrio
(Vibrio 16S rRNA), V. vulnificus, and V. parahaemolyticus among each of the four
sample types over the sampling period. By qPCR, V. vulnificus and V. parahaemolyticus
were detected in 69 and 40% of fish intestine, 82 and 42% of water, 27 and 27% of
sediment, and 13 and 20% of oyster samples, respectively. However, no direct
correlation between levels in different sample types was observed.
Fish samples had the highest V. vulnificus densities and were, on average, 2 log10
greater than oyster samples, 3.4 log10 greater than sediment samples, and 4.5 log10 greater
than water samples. Differences among sample type were less pronounced for V.
parahaemolyticus densities with fish samples approximately 1.4 log10 greater than oyster
samples, 1.7 log10 greater than sediment samples, and 3.4 log10 greater than water
samples.
Page 177
174
Isolate Virulence
Of the 123 V. vulnificus isolates tested for 16S rRNA type, 60% were Type A,
7.3% were Type B, 32% were Type AB, and 0.8% were untypable (Table 5.3). The 16S
rRNA Type B (the more virulent genotype) isolates comprised 7.1%, 12.5%, 8.6%, and
3.4% of the total V. vulnificus isolates from fish, oysters, sediment, and water,
respectively. The nine strains with the more virulent genotype were isolated on seven
sampling occasions: four with optimal conditions (as defined in the published literature)
and three with sub-optimal conditions for V. vulnificus.
A total of 24 V. parahaemolyticus isolates were tested for the presence of the trh
and tdh genes (Table 5.4). Only one sediment sample (4%) yielded a virulent (trh+) V.
parahaemolyticus isolate; no virulent strains were isolated from any other sample type.
Culture-Dependent versus Culture Independent Methods
Overall, there was a significant correlation (p<0.05) between levels observed by
each method for V. vulnificus and V. parahaemolyticus (Table 5.5). There was also
significant correlations between levels observed for Bacteria 16S rRNA (TBC) and
Vibrio 16S rRNA (Table 5.6). qPCR abundances were consistently greater than those
reported using colony hybridization targeting the same gene. However, there was more
colony hybridization data for oyster, sediment, and water samples which had qPCR levels
below the detection limitations. The largest discrepancy between colony hybridization
and qPCR abundances was observed in the fish gut samples, with fish gut samples
accounting for 18 of 31 (58%) and 13 of 22 (59%) of V. vulnificus and V.
parahaemolyticus discrepancies (data not shown). Furthermore, these samples accounted
C) D)
Page 178
175
for 17 of 28 (61%) of V. vulnificus and 10 of 14 (71%) of V. parahaemolyticus
discrepancies of greater than one order of magnitude. It is possible the discrepancies are
more apparent within these samples since there are more independent samples of fish
(n=34) versus oyster (n=13), sediment (n=12), or water (n=12). Fish accounted for 48%
of total samples, but 58 and 59% of the discrepancies.
DISCUSSION
V. vulnificus and V. parahaemolyticus were consistently detected in the fish gut
suggesting that the gut may be a reservoir for these pathogens during periods of sub-
optimal temperatures and/or salinity when oyster-associated illnesses are infrequently
reported. Both these bacteria were detected via qPCR and colony hybridization (Table
5.1; Figure 5.1) in fish intestine and sediment samples during the periods when salinity
was sub-optimal (as defined in published literature) for either V. vulnificus and/or V.
parahaemolyticus. In contrast, both of these bacteria were infrequently detected in
oysters at low levels during these sub-optimal periods. However, the highest densities of
V. vulnificus and V. parahaemolyticus were detected when water temperature was at 24.5
°C and salinity of 8.6 psu. These conditions would be considered optimal for V.
vulnificus, but according to published studies this salinity would be considered less than
optimal for V. parahaemolyticus. Densities of these bacteria did not significantly
decrease during periods of sub-optimal salinity, suggesting that abundances are less
dependent on salinity, within an optimal temperature range. This is in contrast to a
previous study that noted that within a limited temperature range, salinity was the most
correlated parameter to V. parahaemolyticus densities (Zimmerman et al., 2007).
Page 179
176
Although V. vulnificus was consistently detected in both fish and water samples
throughout the time course of the study, V. parahaemolyticus was less frequently detected
in these samples. Additionally, V. vulnificus was detected at greater densities than V.
parahaemolyticus. Overall the highest levels among all assays were consistently detected
in fish, followed by oyster, sediment, and water samples. The differences among samples
is similar to that reported by DePaola et al. 1994 who found highest V. vulnificus
densities in the fish gut with a 2-4 log10 decrease in oyster and sediment samples and 5
log decrease in water samples. However, the V. vulnificus densities reported here are
greater than those reported by DePaola et al. (1994), with 0.8 log10, 1.5 log10, and 2 log10
difference for water, sediment, and fish samples, respectively. DePaola et al. 1994 found
that higher densities of V. vulnificus were found in the guts of inshore bottom fish
(including A. probatocephalus, P. cromis, A. felis, L. rhomboides, L. xanthus, M.
undulatus) with the highest density of 6.8 log10 MPN/gram in pigfish and sea catfish
intestines. This study found the highest density of 8.05 log10 copies/gram in a striped
mullet intestine. Some of these differences may be due to methodology as the values
reported in this study are based on qPCR and the DePaola study used an MPN-colony
hybridization method. This study’s direct plating-colony hybridizations detection rates
were similar to those determined previously by MPN.
Higher detection rates of V. vulnificus and V. parahaemolyticus were obtained by
colony hybridization in this study as compared to qPCR, which is likely due to the lower
limit of detection (10 CFU/g vs. ~500 copies/g). However, the qPCR assays reported
higher abundances than colony hybridizations. This was particularly noticed in the case
of V. vulnificus, perhaps due to inhibition of the plating media causing decreased
Page 180
177
recovery of stressed cells. Approximately a 1 log decrease in recovery of V. vulnificus
cells on VVA compared to a non-selective media such as TSA has been observed (Jones,
unpublished data). The discrepancy between qPCR and colony hybridization levels was
greatest in fish intestine samples, possibly due to a higher number of stressed cells than in
other sample types. This difference could also be a result of aggregated or attached cells
in the fish intestine, generating one colony on a plate, but being recognized as multiple
individuals by qPCR. Although possible, it is unlikely dead cells are being detected by
the qPCR as the extraction methods utilized did not allow unprotected DNA to survive
the process. However, further analysis is needed to determine the definitive cause(s)
behind these differences.
This is the first study to date that not only reports the densities of Bacteria 16S
rRNA, Vibrio 16S rRNA, V. vulnificus, and V. parahaemolyticus in fish intestine, oyster,
sediment, and water samples, but also compares these values through culture-dependent
and culture-independent methodology. These data demonstrate strong evidence for fish
intestinal tracts and sediment acting as reservoirs for V. parahaemolyticus and V.
vulnificus, which may help explain the annual resurgence of these organisms in oysters.
Through expulsion with fecal matter, fish may be a link in the Vibrio cycling between the
fish gut, water column, and oysters. Abundance of these pathogens in the environment
can potentially affect human health, and subsequently, the commercial fishing and
aquaculture industry.
Page 181
178
ACKNOWLEDGMENTS
This research was supported by NOAA Oceans and Human Health Initiative
Traineeship S0867882. We thank Catharina Luedeke, Ron Benner, Jr., Tony Previto,
George Doup, Jeff Krantz, Kevin Calci, Chris Lott, Kristin Butler, and Erin Lipp for their
assistance and advice.
Page 182
179
REFERENCES
Anonymous.2010. Quantitative risk assessment on the public health impact of pathogenic
Vibrio parahaemolyticus in raw oysters. U.S. Food and Drug Administration,
Washington D.C.
Aznar, R., W. Ludwig, R.I., Amann, and K.H. Schleifer.1994. Sequence determination of
rRNA genes of pathogenic Vibrio species and whole-cell identification of Vibrio
vulnificus with rRNA targeted oligonucleotide probes. International Journal of
Systematic Bacteriology 44: 330-337.
Baross, J. and J. Liston. 1970. Occurrence of Vibrio parahaemolyticus and Related
Hemolytic Vibrios in Marine Environments of Washington State. Applied
Microbiology 20: 179-186.
Blackstone, G. M., J. L. Nordstrom, M. D. Bowen, R. F. Meyer, P. Imbro, and A.
DePaola. 2007. Use of a real time PCR assay for detection of the ctxA gene of
Vibrio cholerae in an environmental survey of Mobile Bay. Journal of
Microbiology. Methods 68:254-259.
Buchan, A., M. Hadden, and M. Suzuki. 2009. Development and Application of
Quantitative-PCR Tools for Subgroups of the Roseobacter clade. Applied and
Environmental Microbiology 75: 7542-7547.
Campbell, M. S., and A. C. Wright. 2003. Real-time PCR analysis of Vibrio vulnificus
from oysters. Applied & Environmental Microbiology 69:7137-7144.
Centers for Disease Control and Prevention (CDC). COVIS Annual Summary, 2009.
Atlanta, Georgia: US Department of Health and Human Services, CDC, 2011.
Constantin de Magny, G., W. Long, C.W. Brown, R.R. Hood, A. Huq, R. Murtugudde
and R.R. Colwell. 2009. Predicting the distribution of Vibrio spp. in the
Chesapeake Bay: A Vibrio cholerae case study. Ecohealth 6: 378-389.
Cook, D.W., P. O’Leary, J.C. Hunsucker, E.M. Sloan, J.C. Bowers, R.J. Blodgett, and A.
DePaola. 2002. Vibrio vulnificus and Vibrio parahaemolyticus in US retail shell
oysters: a national survey from June 1998 to July 1999. Journal of Food
Protection 65: 79–87.
DePaola, A., G. Capers, and D. Alexander. 1994. Densities of Vibrio vulnificus in the
Intestines of Fish from the U.S. Gulf Coast. Applied and Environmental
Microbiology 60: 984-988.
DePaola, A., S. McLeroy, and G. McManus. 1997. Distribution of Vibrio vulnificus
Phage in Oyster Tissues and Other Estuarine Habitats. Applied and
Environmental Microbiology. 63: 2464-2467.
Page 183
180
DePaola, A., C.A. Kaysner, J. Bowers, and D.W. Cook. 2000. Environmental
Investigations of Vibrio parahaemolyticus in Oysters after Outbreaks in
Washington, Texas, and New York (1997 and 1998). Applied and Environmental
Microbiology 66: 4649-4654.
FAO/WHO. 2011. Risk assessment of Vibrio parahaemolyticus in seafood: Interpretative
summary and technical report. Food and Aquaculture Organization of the United
Nations/ World Health Organization. Microbiological Risk Assessment Series No.
16.
Honda, T. and T. Iida. 1993. The pathogenicity of Vibrio parahaemolyticus and the role
of the thermostable direct haemolysin and related haemolysins. Reviews in
Medical Microbiology 4:106–113.
Iwamoto, M., T. Ayers, B.E. Mahon, and D.L. Swerdlow. 2010. Epidemiology of
Seafood-Associated Infections in the United States. Clinical Microbiology
Reviews 23: 399-411.
Jones, J.L., Y. Hara-Kudo, J.A. Krantz, R.A. Benner Jr., A.B. Smith, T.R. Dambaugh,
J.C. Bowers, and A. DePaola. 2012. Comparison of Molecular Detection
Methods for Vibrio parahaemolyticus and V. vulnificus. Food Microbiol. 30:105-
111.
Kaneko, T. and R. R. Colwell. 1975. Adsorption of Vibrio parahaemoltyicus onto chitin
and copepods. Applied Microbiology 29:269-274.
Kaysner, C.A. and A. DePaola.2004.Vibrio, p. 9.01-9.27. In FDA Bacteriological
Analytical Manual, 9th ed.
Kirs, M., A. DePaola, R. Fyfe, J.L. Jones, J. Krantz, A. Van Laanen, D. Cotton, and M.
Castle. 2011 A survey of oysters (Crassostrea gigas) in New Zealand for Vibrio
parahaemolyticus and Vibrio vulnificus. International Journal of Food
Microbiology, 147: 149-153.
Klappenbach, J.A., P.R. Saxman, J.R. Cole and T.M. Schmidt .2001. rrnDB: the
Ribosomal RNA Operon Copy Number Database. Nucleic Acids Research. 29:
181-184.
Lee, Z.M., C. Bussema 3rd, and T.M. Schmidt, T.M.2009. rrnDB: documenting the
number of rRNA and tRNA genes in bacteria and archaea. Nucleic Acids
Research 37: 1-5.
Lipp, E. K., A. Huq, and R. R. Colwell. 2002. Effects of global climate on infectious
disease: the cholera model. Clinical Microbiology Reviews 15: 757-770.
Liston, J. 1990. Microbial hazards of seafood consumption. Food Technology 44: 56-62.
Page 184
181
MacFarlane, R.D., J.J. McLaughlin, and G.L. Bullock. 1986. Quantitative and Qualitative
Studies of Gut Flora in Striped Bass from Estuarine and Coastal Marine
Environments. Journal of Wildlife Diseases 22: 344-348.
McCarthy S A, DePaola A, Cook D W, Kaysner C A, and W.E. Hill. 1999. Evaluation of
alkaline phosphatase- and digoxigenin-labelled probes for detection of the
thermolabile hemolysin (tlh) gene of Vibrio parahaemolyticus. Letters Applied
Microbiology 28:66–70.
Magueri, T.L., M. Carbone, M.T. Fera, and C. Gugliandolo. 2006. Detection and
differentiation of Vibrio vulnificus in seawater and plankton of a coastal zone of
the Mediterranean Sea. Research in Microbiology 157: 194-200.
Martin-Antonio, B. M. Manchado, C. Infante, R. Zerolo, A. Labella, C. Alonso, J.J.
Borrego. 2007. Intestinal microbiota variation in Senegalese sole (Solea
senegalensis) under different feeding regimes. Aquaculture 38: 1213-1222.
Martinez-Urtaza, J., V. Blanco-Abad, A. Rodriguez-Castro, J. Ansede-Bermejo, A.
Miranda, and M.X. Rodriguez-Alvarez. 2012. Ecological determinants of the
occurrence and dynamics of Vibrio parahaemolyticus in offshore areas. ISME
Journal 6: 994-1006.
Nishibuchi, M. and J.B. Kaper, J.B. 1995. Minireview. Thermostable direct hemolysin
gene of Vibrio parahaemolyticus: a virulence gene acquired by a marine
bacterium. Infection and Immunity 63: 2093–2099.
Nordstrom, J.L., M.C.L. Vickery, G.M. Blackstone, S.L. Murray, and A. DePaola. 2007.
Development of a multiplex real-time PCR assay with an internal amplification
control for the detection of total and pathogenic Vibrio parahaemolyticus bacteria
in oysters. Applied and Environmental Microbiology 73: 5840–5847.
Rippey, S. R. 1994. Infectious diseases associated with molluscan shellfish consumption.
Clinical Microbiology Reviews 7: 419–425.
Sakata, T., 1990. Microflora in the digestive tract of fish and shellfish In Microbiology in
Poecilotherms. ed. R. Lesel, p. 171-176. Amsterdam: Elsevier.
Scallan E., Hoekstra R. M., Angulo F. J., Tauxe R. V., Widdowson M. A., Roy S. L.,
Jones J. L., and P.M. Griffin. 2011. Foodborne illness acquired in the United
States – major pathogens. Emerging Infectious Disease 17: 7–15.
Shirai, H., H. Ito, T. Hirayama, Y. Nakamoto, N. Nakabayashi, K. Kumagai, Y.
Takeda, and M. Nishibuchi. 1990. Molecular epidemiologic evidence for
association of thermostable direct hemolysin (TDH) and TDH-related hemolysin
of Vibrio parahaemolyticus with gastroenteritis. Infection and Immunity. 58:
3568–3573.
Page 185
182
Suzuki, M. T., L. T. Taylor, and E. F. DeLong. 2000. Quantitive Analysis of Small-
Subunit rRNA Genes in Mixed Microbial Populations via 5’ Nuclease Assays.
Applied and Environmental Microbiology 66: 4605-4614.
Tantillo, G.M., M. Fontanarosa, A. DiPinto, and M. Musti, M.2004. Updated
perspectives on emerging vibrios associated with human infections. Letters in
Applied Microbiology. 39: 117–128.
Thompson, J. R., M. A. Randa, L. A. Marcelino, A. Tomita-Mitchell, E. Lim, and M. F.
Polz. 2004. Diversity and dynamics of a North Atlantic coastal Vibrio community.
Applied and Environmental Microbiology 70: 4103-4110.
Vickery, M.C.L., W. B. Nilsson, M.S. Strom, J.L. Nordstrom, A. DePaola. 2007.A real-
time PCR assay for the rapid determination of 16S rRNA genotype in Vibrio
vulnificus, Journal of Microbiological Methods 68: 376-384.
Ward, N.L., B. Steven, K. Penn., B.A. Methé, and W.H. Detrich. 2009. Characterization
of the intestinal microbiota of two Antarctic notothenioid fish species.
Extremophiles 13: 679-685.
Warner, E., J.D. Oliver. 2007. Refined medium for direct isolation of Vibrio vulnificus
from oyster tissue and seawater. Applied and Environmental Microbiology
73:3098-3100.
Wong, H.C., S.H. Liu, L.W. Ku, I.Y. Lee, T.K. Wang, Y.S. Lee, C.L. Lee, L.P. Kuo,
D.Y.C, Shin. 2000. Characterization of Vibrio parahaemolyticus isolates obtained
from foodborne illness outbreaks during 1992 through 1995 in Taiwan. Journal of
Food Protection 63: 900–906.
Wright, A. C., G. A. Miceli, W. L. Landry, J. B. Christy, W. D. Watkins, and J. G.
Morris, Jr. 1993. Rapid identification of Vibrio vulnificus on nonselective media
with an alkaline phosphatase-labeled oligonucleotide probe. Applied and
Environmental Microbiology 50:541–546.
Zimmerman, A.M., A. DePaola, J.C. Bowers, J.A. Krantz, J.L. Nordstrom, C.N. Johnson,
and D.J. Grimes. 2007. Variability of Total and Pathogenic Vibrio
parahaemolyticus Densities in Northern Gulf of Mexico Water and Oysters.
Applied and Environmental Microbiology 73: 7589-7596.
Page 186
183
Table 5.1: Optimal temperatures and sub-optimal temperatures for Bacteria 16S rRNA, Vibrio 16S rRNA, V.
vulnificus, and V. parahaemolyticus abundance defined by CART analysis
Sample Optimal Temperature Abundance Sub-optimal Temperature Abundance
Fish
Bacteria 16S >20.5°C, <24.6 °C 9.50 log10 <20.5°C, >24.6 °C 8.14 log10, 8.82 log10
Vibrio 16S <20.5 °C** 7.85 log10 >20.5 °C 7.04 log10
V. parahaemolyticus >23.5 °C** 4.50 log10 <23.5 °C** 3.12 log10
V. vulnificus >24.1 °C, <24.6 °C 4.94 log10 <24.1 °C** 3.03 log10
Oyster
Bacteria 16S N/A* N/A* N/A* N/A*
Vibrio 16S N/A* N/A* N/A* N/A*
V. parahaemolyticus >23.5 °C 3.32 log10 <23.5 °C** 2.16 log10
V. vulnificus N/A* N/A* N/A* N/A*
Sediment
Bacteria 16S >20.5 °C, <22.8 ° 9.3 log10 >22.8 °C 7.95 log10
Vibrio 16S <23.0 °C 4.70 log10 >23.0 °C 3.41 log10
V. parahaemolyticus >22.0 °C 2.88 log10 <22.0 °C 1.70 log10
V. vulnificus >22.0 °C* 3.01 log10 <22.0 °C* 2.33 log10
Water
Bacteria 16S <22.0 °C* 6.08 log10 >22.0 °C* 5.09 log10
Vibrio16S <22.0 °C* 2.56 log10 >22.0 °C* 1.54 log10
V. parahaemolyticus >23.5 °C 1.08 log10 <23.5 °C** 0.12 log10
V. vulnificus N/A* N/A* N/A* N/A*
*For this assay, salinity was of primary importance in the regression analysis. **For this assay, temperature was of primary
importance and salinity was of secondary importance.
Page 187
184
Table 5.2: Optimal temperatures and sub-optimal temperatures for Bacteria 16S rRNA, Vibrio 16S rRNA, V.
vulnificus, and V. parahaemolyticus abundance defined by CART analysis
Sample Optimal Salinity Abundance Sub-optimal Salinity Abundance
Fish
Bacteria 16S N/A N/A N/A N/A
Vibrio 16S <3.9 psu** 9.24 log10 >3.9 psu** 8.46 log10
V. parahaemolyticus <16 psu, >11 psu** 4.50 log10 <11 psu** 2.32 log10
V. vulnificus >3.8 psu** 3.03 log10 <3.8 psu** 2.15 log10
Oyster
Bacteria 16S >12 psu 8.91 log10 >7.4 psu <12 psu 5.86 log10
Vibrio 16S >10 psu 5.20 log10 >4.6 psu, <10 psu 3.99 log10
V. parahaemolyticus >8.3 psu** 2.16 log10 <8.3 psu** 1.32 log10
V. vulnificus >12 psu 3.14 log10 <6.9 psu 1.62 log10
Sediment
Bacteria 16S N/A* N/A* N/A* N/A*
Vibrio 16S N/A* N/A* N/A* N/A*
V. parahaemolyticus N/A* N/A* N/A* N/A*
V. vulnificus <12 psu 3.10 log10 >12 psu 1.93 log10
Water
Bacteria 16S >12.1 psu 6.58 log10 <12.1 psu 6.01 log10
Vibrio16S >12 psu 3.24 log10 <12 psu 2.56 log10
V. parahaemolyticus >8.3 psu** 0.12 log10 <8.3 psu** -0.48 log10
V. vulnificus <10 psu 0.66 log10 >12 psu 0.11 log10
**For this assay, temperature was of primary importance and salinity was of secondary importance.
Page 188
185
Figure 5.1: qPCR results for A) Fish Intestine, B) Oyster, C) Sediment, and D) Water samples
A)
C)
B)
D)
C) D)
Page 189
186
Table 5.3: Summary of V. vulnificus 16S rRNA Types for sample isolates
Sample Type A Type B Type AB ND Total Tested
Fish 36 5 17 0 58
Oyster 21 2 4 1 28
Sediment 4 1 3 0 8
Water 13 1 15 0 29
Total 74 9 39 1 123
*ND-not determined; untypable
Page 190
187
Table 5.4: Summary of V. parahaemolyticus tdh+/ trh
+ for sample isolates
Sample tdh+
trh+ Total Tested
Fish 0 0 7
Oyster 0 0 1
Sediment 0 1 3
Water 0 0 13
Total 0 1 24
Page 191
188
Table 5.5: Correlations between Colony Hybridization (CH) vs. qPCR for V. vulnificus and V. parahaemolyticus
Sample Type Comparison Slope Intercept tau p
All Vp CH vs. qPCR 1.12 Null 0.27 0.001*
Fish Vp CH vs. qPCR 0.84 1.90 0.26 0.026*
Oyster Vp CH vs. qPCR 0.80 1.80 0.25 0.245
Sediment Vp CH vs. qPCR 1.54 -1.40 0.20 0.040*
Water Vp CH vs. qPCR 0.77 Null 0.13 0.061*
All Vv CH vs. qPCR 0.98 1.36 0.24 0.004*
Fish Vv CH vs. qPCR 0.46 4.77 0.27 0.028*
Oyster Vv CH vs. qPCR 3.59 -6.74 0.16 0.474
Sediment Vv CH vs. qPCR 0.52 -0.63 0.16 0.538
Water Vv CH vs. qPCR -0.80 2.33 -0.29 0.212
*Indicates statistical significance. Vp=V. parahaemolyticus, Vv=V. vulnificus, CH=colony hybridization, qPCR=quantitative
PCR
Page 192
189
Table 5.6: Correlations between Colony Hybridization (CH) vs. qPCR for V.
vulnificus and V. parahaemolyticus
Sample Type Comparison Slope Intercept tau p
All TBC vs Vibrio 1.36 -4.86 0.62 <0.001*
Fish TBC vs Vibrio 0.83 0.94 0.59 <0.001*
Oyster TBC vs Vibrio 0.17 3.60 0.06 0.837
Sediment TBC vs Vibrio 1.08 -5.25 0.86 0.004*
Water TBC vs Vibrio 0.81 -2.44 0.56 0.032*
All TBC vs Vv (CH) 0.47 -1.40 0.30 <0.001*
Fish TBC vs Vv (CH) 0.22 1.16 0.12 0.335
Oyster TBC vs Vv (CH) 0.02 2.87 0.05 0.876
Sediment TBC vs Vv (CH) -0.32 5.11 -0.24 0.371
Water TBC vs Vv (CH) -0.12 1.18 -0.22 0.375
All TBC vs. Vp (CH) 0.56 -2.42 0.30 <0.001*
Fish TBC vs. Vp (CH) 0.36 -0.39 0.10 0.440
Oyster TBC vs. Vp (CH) 0.16 1.03 0.18 0.482
Sediment TBC vs. Vp (CH) 0.05 1.60 0.04 0.928
Water TBC vs. Vp (CH) 0.13 -0.40 0.09 0.754
All Total Vibrio vs. Vv (CH) 0.31 0.47 0.34 <0.001*
Fish Total Vibrio vs. Vv (CH) 0.12 2.16 0.06 0.640
Oyster Total Vibrio vs. Vv (CH) 0.22 1.30 0.22 0.466
Sediment Total Vibrio vs. Vv (CH) 0.07 2.39 0.05 1.000
Water Total Vibrio vs. Vv (CH) -0.11 0.64 -0.24 0.350
All Total Vibrio vs. Vp (CH) 0.35 0.30 0.34 <0.001*
Fish Total Vibrio vs. Vp (CH) 0.25 1.17 0.07 0.594
Oyster Total Vibrio vs. Vp (CH) 0.97 -2.62 0.31 0.295
Sediment Total Vibrio vs. Vp (CH) -0.02 3.05 -0.05 1.00
Water Total Vibrio vs. Vp (CH) 0.00 0.30 0.00 1.00
All Vv vs Vp (CH) 0.90 0.13 0.42 <0.001*
Fish Vv vs Vp (CH) 0.59 1.11 0.26 0.029*
Oyster Vv vs Vp (CH) 1.23 -1.12 0.62 0.010*
Sediment Vv vs Vp (CH) 0.87 0.26 0.36 0.178
Water Vv vs Vp (CH) -0.61 0.18 -0.20 0.421
*Indicates statistical significance. Vp=V. parahaemolyticus, Vv=V. vulnificus,
CH=colony hybridization, qPCR=quantitative PCR
Page 193
190
CHAPTER 6
MICROBIAL COMMUNITIES OF THE CARAPCE AND GUT AS POTENTIAL
SOURCES OF HEMOLYMPH INFECTIONS IN CALLINECTES SAPIDUS1
1 Givens, C.E., K.G. Burnett, L.E. Burnett, and J.T. Hollibaugh. To be submitted to
Marine Biology.
Page 194
191
ABSTRACT
The Atlantic blue crab, Callinectes sapidus, is an important fisheries resource.
Previous studies have reported potentially pathogenic bacteria in the hemolymph of C.
sapidus that may cause disease and mortality. We used culture-independent methods
based on analysis of 16S rRNA genes to characterize and quantify the microflora
community of carapace, gut and hemolymph samples from 7 C. sapidus specimens to
identify potential sources of pathogens and pathways of hemolymph infection. We found
that the carapace, gut, and hemolymph microflora have a core Proteobacteria community
with additional contributions from other phyla including Bacteriodetes, Firmicutes,
Spirochaetes, and Tenericutes. Within this Proteobacteria core, γ-Proteobacteria
(including members of the Vibrionaceae that are closely related to potential pathogens)
dominate. Bacteria closely related to hemolymph pathogens were found on the carapace,
supporting the hypothesis that punctures or broken dactyls are potential causes of
hemolymph infections. These results provide some of the first data on the blue crab
microbiome obtained with culture-independent techniques and offer insights to routes of
infection and potential bacterial pathogens associated with blue crabs.
INTRODUCTION
The Atlantic blue crab, Callinectes sapidus, is an important marine resource
(Phillips and Peeler 1972). As such, diseases of blue crabs are of commercial importance
and factors that affect the risk to humans of handling and consuming blue crabs are of
public health interest. Previous culture-based studies of the microbiome have identified
potential pathogens including Vibrio cholerae, Vibrio parahaemolyticus, and Vibrio
Page 195
192
vulnificus (Sizemore et al. 1975; Davis and Sizemore 1982; Welsh and Sizemore 1985)
associated with C. sapidus (Krantz et al. 1969). These bacteria have been found within
gills, in viscera, in processed meat taken from healthy crabs and within the hemolymph of
diseased crabs held in commercial tanks (Tubiash et al. 1975). The presence of these
pathogens is of concern for human health as pathogenic Vibrio spp. in crab meat have
been implicated in incidences of foodborne illness (Anonymous 1971; Molenda et al.
1972; Anonymous 1976; Anonymous 1999), and V. vulnificus has been linked to
septicemia cases in humans handling and ingesting crabs (Blake et al. 1979).
Based on studies of vertebrates, it has been assumed that hemolymphs of healthy
invertebrates are sterile. However, previous studies have indicated that healthy C. sapidus
naturally harbor low-level populations of bacteria in their hemolymphs that may be
capable of causing infections (Davis and Sizemore 1982; Welsh and Sizemore 1985).
Counts of bacteria within the hemolymph are higher in crabs that are missing appendages,
or that have been injured or stressed during capture and holding (Tubiash et al. 1975;
Welsh and Sizemore 1985). The abundance of bacterial cells in samples of hemolymph
fluids from infected crabs vary widely, from 1.8 X 10³ to 6.7 X 10
5 CFU/mL (Davis and
Sizemore 1982; Welsh and Sizemore 1985). Davis and Sizemore (1982) evaluated 81
crabs and divided the crab population into four categories based on the level of bacterial
infection. Ten percent had light hemolymph infections (<103
CFU/mL), 52% had
moderate infections (103-10
5 CFU/mL), 25% had heavy infections (>10
5 CFU/mL) and
only 12% were found to have sterile hemolymphs. A study of bacteria associated with
freshly captured Cancer magister (Dungeness crabs) also reported low levels of bacteria
in hemolymph fluid (<102
CFU/mL; ref (Faghri et al. 1984)).
Page 196
193
The relative abundance of Vibrio spp. in crab hemolymph bacterial populations is
also highly variable. Monthly mean relative abundance of Vibrio spp. in C. sapidus
hemolymph fluids ranged from 6-64% of total CFU (Welsh and Sizemore 1985).
Incidence of Vibrio spp. within the hemolymph appeared higher in crabs subjected to
commercial handling, in crabs from warmer water, and in those that already had
hemolymph infections (defined as >102 CFU/mL; ref (Welsh and Sizemore 1985)).
Sizemore et al. (1975) reported an average of 21% Vibrio parahaemolyticus within the
hemolymph bacterial community of crabs in Chesapeake Bay during the months of May,
June, and July when concentrations of this bacterium increased in the water. Another
study using crabs from Galveston Bay, Texas reported V. parahaemolyticus in 23% of
hemolymph samples. V. cholerae and V. vulnificus were detected at lower incidences: 2%
and 7%, respectively (Davis and Sizemore 1982). In addition to Vibrio spp., these studies
documented the presence of Pseudomonas sp., Acinetobacter sp., Aeromonas sp., Bacillus
sp., and Flavobacterium sp. in crab hemolymphs (Sizemore et al. 1975).
Most previous studies of C. sapidus microflora, including those discussed above,
relied on culture-based techniques to enumerate and identify bacteria. Culture-based
studies have provided valuable insights into the composition of microbial communities
and yielded isolates for detailed physiological investigation; however, they are known to
provide biased assessments of the microbial community, as typically <1% of the cells
known to be present by direct microscopic enumeration produce colonies on solid media
(Ferguson et al. 1984b; Head et al. 1998a). This bias applies to Vibrio species (Thompson
et al. 2004a), leading to questions of the role of these “viable but non-culturable” bacteria
in the epidemiology of cholera outbreaks (Huq et al. 1990). The goal of the present study
Page 197
194
was to characterize and quantify the C. sapidus microbiome using culture-independent
analysis and to evaluate the potential for microbiome populations associated with the
carapace or the gut to serve as inocula for hemolymph infections. Samples were taken
from crab guts (G), hemolymphs (H), pieces of carapaces (carapace clips – CP) and of the
biofilms found on the crab’s integument (carapace swab - CS). We determined the
abundance of Bacteria in samples from crabs by quantitative PCR (qPCR) and analyzed
microbial community composition by cloning and sequencing 16S rRNA genes. This
study also provides insight into the distribution of blue crab-associated bacterial pathogens
that could affect human health via consumption or through wounds that become infected.
METHODS
Sample Collection and DNA Extraction.
Male C. sapidus (n=7; wet weight range=78.5-207 grams) were caught in a crab
pot (Crabs 1; 4-7) and by trawl (Crabs 2 and 3) in Charleston Harbor, SC during June
2010. The crabs were examined visually and any injuries identified were noted and
categorized as old versus new based on appearance. Crabs were banded, weighed,
measured, and placed in individual holding tanks of well-aerated, static saltwater (30 psu;
24-26 °C), then sampled after holding them in quarantine for 24 hours to allow expulsion
of diet-associated bacteria. Hemolymph samples were taken by sterilizing the carapace
around the pericardial sinus with Betadine (povidone-iodine solution USP, 10%) and
isopropanol, then inserting a 23-gauge needle attached to a 1-mL syringe through the
carapace into the pericardial sinus and collecting 500 µL of hemolymph. Hemolymph
samples were placed in PowerBead tubes (MoBio Laboratories), immediately vortexed,
Page 198
195
and placed on ice. Sterile swabs of the carapace and 10 mm2 clips of the carapace were
collected, put in PowerBead tubes, and processed as above. The same region was
swabbed and clipped for all samples. Once the carapace was removed, the gut (mid to
hindgut) was excised aseptically and placed in PowerBead tubes and processed as above.
DNA extractions were completed using the MoBio PowerSoil DNA Extraction Kit per kit
instructions.
Sequence Analysis.
DNA was amplified using Illustra puReTaq Ready-To-Go PCR Beads (GE
Healthcare) with the Bacteria-specific 16S rRNA primers 27F/1492R (Table 6.1; ref
(Lane 1991b)) with the following PCR conditions: initial denaturation at 95 °C for 5
minutes; 35 cycles of: denaturation at 95 °C for 45 seconds, annealing at 62 °C for 30 s,
and extension at 72 °C for 1 minute; finishing with a final extension at 72 °C for 45
minutes. Amplified DNA was electrophoresed on a 1% agarose gel, bands of the
expected product size were excised, then the DNA in them was extracted and purified
using QIAGEN QIAquick gel extraction kits. DNA extracted from the gel was cloned
with TOPO TA cloning kits (Invitrogen) using the pCR 4.0-TOPO TA vector and
competent E. coli cells. Clones were selected randomly and sequenced using the 27F
primer by Georgia Genomics (Athens, GA) or Genewiz (South Plainfield, NJ). All
sequences were checked for chimeras using the Bellerophon server (Huber et al. 2004).
Taxonomic identities were assigned to each sequence using both RDP SeqMatch (Cole et
al. 2007b; Cole et al. 2009b) and BLAST against the non-redundant nucleotide database
(NCBI GenBank), then grouped phylogenetically. Sequences were assigned to a genus if
Page 199
196
there was >95% sequence similarity (Tindall et al. 2010) and to a species if there was
>97% sequence similarity (Stackebrandt and Goebel 1994; Tindall et al. 2010).
Of a total of 846 sequences (combined libraries for gut, carapace clip, carapace
swab, and hemolymph samples), only 26 sequences (~3%) were discarded because they
were poor quality or chimeric. A total of 239 sequences (415-1118 bp; median=992) was
retrieved from gut libraries; 201 sequences (366-1242 bp; median=827) from the
carapace clip libraries; 189 sequences (693-1129 bp; median =973) from the carapace
swab libraries and 193 sequences (362-1267 bp; median=927) from hemolymph libraries.
Cyanobacteria and chloroplast 16S rRNA sequences contributed 27%, 41%, 0.84%, and
4.2% to the 16S rRNA clone libraries from the carapace clip, carapace swab, gut, and
hemolymph communities, respectively. These sequences were excluded from further
analysis.
Quantitative PCR.
Quantitative PCR (qPCR) was done with a BioRad iCycler and the primers given
in Table 6.1. qPCR cycling conditions followed those published in Buchan et al. (2009b).
qPCR reactions were run in 25 μL with 1x iQ SYBR Green Supermix (BioRad
Laboratories), forward and reverse primers, nuclease free water, and 3 μL of template
DNA. All reactions were run in triplicate with standards ranging from 10
1 to 10
7 copies
per uL-1
. Because there was no robust way to normalize across the different sample types
used in this study, we took care to be consistent from crab to crab in our sampling and
extraction protocols and qPCR data are reported as copies of 16S rRNA genes mL-1
of
final, purified template DNA extract.
Page 200
197
Statistical Analysis.
The software package PRIMER (v.6; ref (Clarke and Gorley 2006b)) was used for
non-metric multidimensional scaling analysis (NMDS) of ribotype distributions and to
compare the composition of clone libraries from crab samples at both phylum and genus
levels of phylogenetic discrimination. Multiresponse permutation procedures (MRPP)
were performed in R (R Core Team 2009) using the vegan statistical package (Oksanen et
al. 2009) to test whether there was a significant difference between clustered groups.
MRPP was run with the Bray-Curtis distance matrix with 999 permutations.
RESULTS
Crab condition.
During pre-quarantine physical inspection, Crab 1 (C1) was found to be missing
part of the tip of a cheliped, Crab 2 (C2) and Crab 4 (C4) were both missing an entire
cheliped, and Crab 4 (C4) had extensive algal growth on his carapace. All injuries
appeared to be pre-entrapment and had healed externally. At the time of the initial
examination, Crab 3 (C3) appeared physically healthy with no injuries; however, after 24
hours in quarantine, C3 became extremely lethargic and moribund. All appendages were
intact on the rest of the specimens and they were outwardly healthy in appearance both
pre-and post-quarantine.
Gut community.
As evident in Figure 6.1a, the composition of the gut microflora varied among
crabs. We detected a total of 8 different bacterial phyla in the 239 sequences retrieved
Page 201
198
from gut samples. Forty seven percent of these ribotypes were assigned to the
Proteobacteria, which was the most frequently encountered taxon. Ribotypes assigned to
Spirochaetes, Bacteriodetes, Fusobacteria, and Firmicutes were found in most gut
samples with relative abundances (all samples) of 10 to 12%. The Fusobacteria
sequences retrieved from specimens C1, C2, C5, and C7 were >97% similar to
Propionigenum maris. C1, C3, and C6 all contained sequences most closely related to
the phylum Tenericutes, which were 90-93% similar to uncultured Mycoplasmataceae.
γ-Proteobacteria were the most abundant class of Proteobacteria, accounting for
71% of all Proteobacteria sequences retrieved (Figure 6.2a). Within the γ-Proteobacteria
46% were most closely related to Photobacterium spp., 26% to Marinobacter sp., 23% to
Vibrio spp., 2.5% to Escherichia spp., and 2.5% to Thalassomonas sp (Figure 6.2b). The
Photobacterium spp. clones could be further assigned at >97% sequence similarity to
either P. damselae subsp. damselae or P. damselae subsp. piscida. Some of the Vibrio
spp. clones could be further assigned at >97% sequence similarity to V. gallicus, V.
harveyi, V. tubiashii, and V. xuii. ε-Proteobacteria were also important, contributing to
27% of the Proteobacteria community. All of the ε-Proteobacteria sequences were >97%
similar to Arcobacter sp.
Carapace community.
Proteobacteria dominated the microbial assemblage found in carapace clip
samples, comprising 59% of all phyla detected (Figure 6.1b). Carapace clip samples
included the bacterial community on the external carapace and that within the layers of
the carapace. As with the gut samples, libraries from crabs C3 and C6 both contained
Page 202
199
sequences representative of the Tenericutes (Mycoplasmataceae). The Proteobacteria
were represented by γ- (54%) and α-Proteobacteria (43%) (Figure 6.2a). Most of the α-
Proteobacteria sequences were >97% similar to either Erythrobacter sp. or to members of
the family Rhodobacteraceae (Oceanicola sp., Roseobacter sp., Roseovarius sp. and
Ruegeria sp.). Thirty seven percent of the γ-Proteobacteria sequences were most similar
to Alteromonas sp., 18% to Pseudoalteromonas sp., and 14% to Vibrio spp. Of the
Vibrio spp. sequences, 25% were most similar to V. harveyi (Figure 6.2b). The ribotypes
found in the carapace swab samples (Figure 6.1c) were similar to those reported for the
carapace clip, with 55% of the ribotypes identified as Proteobacteria. The Proteobacteria
in these samples were comprised of 81% γ-Proteobacteria and 15% α-Proteobacteria
(Figure 6.2a). Fifty-four percent of the γ-Proteobacteria ribotypes were most similar to
Alteromonas sp. with additional smaller contributions from Pseudoalteromonas sp.
(12%), Thalassomonas sp. (10%) and Vibrio spp. (3%) (Figure 6.2b).
Hemolymph community.
Seventy-two percent of the 193 sequences retrieved from hemolymph samples
were identified as belonging to the phylum Proteobacteria (Figure 6.1d). Ribotypes
associated with the Proteobacteria almost completely dominated the hemolymph
assemblages of all crabs except C2 and C6. The library from crab C2 contained primarily
Firmicutes (85% Bacillus sp.) with only a small contribution from Proteobacteria. In
contrast, ribotypes retrieved from the hemolymph of crab C6 were a combination of
Proteobacteria (60%) and Bacteroidetes (32%). A few (~3%) Tenericutes
(Mycoplasmataceae) were found in hemolymph samples from crabs C1 and C7, and
Page 203
200
Mycoplasmataceae ribotypes accounted for 10% of the ribotypes retrieved from the gut
of crab C1. However, no Tenericutes were found in the hemolymph samples of crabs C3
or C6, despite the presence of Tenericute ribotypes in both gut and carapace clip samples
from these crabs. The Proteobacteria assemblage in these hemolymph samples was
comprised of 86% γ-Proteobacteria, 7.8% β-Proteobacteria, and 6.5% α-Proteobacteria
(Figure 6.2a). The majority of the γ-Proteobacteria were Acinetobacter sp. (43%), Vibrio
spp. (24%), and Alteromonas sp. (10%) (Figure 6.2b). The Acinetobacter sp. sequences
were >97% similar to A. junii. Most of the Vibrio spp. ribotypes, including all of those
from crab C3, were >97% similar to V. harveyi.
Statistical Analysis.
We compared the composition of libraries from our samples using NMDS. When
we compared composition at the level of bacterial phylum (Figure 6.3), all gut samples
clustered together and were at least 60% similar to each other. Most of the carapace clip
and carapace swab samples also clustered together with at least 60% similarity. The
libraries from C5 hemolymph, C2 and C7 carapace clip, and C1, C3, and C4 carapace
swab were largely dominated (>75%) by Proteobacteria with slight contributions from
Bacteroidetes (<25%) and clustered together with 80% similarity at the phylum level.
The carapace clip from C6 was the only sample with similar contributions (~42%) of
Bacteroidetes and Proteobacteria and thus did not cluster with any of the other samples.
MRPP indicates that clusters defined at 60% and 80% similarity are significantly
different (p=0.002 and p=0.001, respectively).
Page 204
201
We also compared the composition of γ-Proteobacteria ribotypes in the libraries
from our samples (Figure 6.4). This analysis showed that libraries from hemolymph
samples are distinct from those obtained from carapace and gut samples of the same crab.
Hemolymph samples of crabs C3 and C4 clustered with either gut or carapace samples of
other crabs, but not with the gut or carapace samples from C3 or C4. Carapace clip and
carapace swab samples from crabs C1, C2 and C3 clustered together with at least 60%
similarity. These samples all contained elevated abundances of Alteromonas sp.
ribotypes. Gut samples from crabs C1, C4, C5, and C6 all had higher incidence of both
Photobacterium sp. and Vibrio spp. than other crabs and clustered together with 60%
similarity. The hemolymph sample from crab C3 was dominated by Vibrio spp. related
to V. harveyi and clustered with the gut samples from C1, C4, C5, and C6 with 40%
similarity. MRPP indicates that clusters separated at the 20% 40%, 60%, and 80%
similarity level were all significantly different at p=0.001.
qPCR analysis.
All gut samples had similar bacterial abundances, ranging between 2.1 x 10⁸ and
4.3 x 10⁹ copies of 16S rRNA genes mL
-1 of template (Figure 6.5). Abundances in
carapace swab samples were between 3.8 x 10⁶ and 2.1 X 10
8 copies of 16S rRNA genes
mL-1
of template. Carapace clip samples had bacterial abundances between 2.4 x 10⁶ and
6.5 x 10⁷ copies of 16S rRNA genes mL
-1 of template. Hemolymph samples ranged from
5.8 x 10⁴ to 1.5 x 10
9 copies of 16S rRNA genes mL
-1 of template. These same
hemolymph samples plated on marine agar yielded counts ranging from 0 to 1.5 x 10⁴
CFU mL-1
of hemolymph fluid (Burnett, unpublished data). The hemolymph sample
Page 205
202
from crab C3 had the highest bacterial abundance detected by both qPCR (1.5 x 10⁹
copies of 16S rRNA genes mL-1
of template) and CFU counts (1.5 x 10⁴ CFU mL
-1 of
hemolymph fluid). Bacterial abundances (qPCR) in carapace clip, carapace swab, and
gut samples from crab C3 were similar to those reported in the other crabs.
DISCUSSION
Data from this study show that the microflora of C. sapidus is more diverse than
previously reported (Table 6.2). The carapace, gut, and hemolymph all have a core
Proteobacteria community (47-72% of the ribotypes detected) that is dominated by γ-
Proteobacteria (54-86%). However, other phyla including Acidobacteria, Bacteroidetes,
Firmicutes, Fusobacteria, Lentisphaerae, Planctomycetes, Spirochaetes, Tenericutes,
Verrucomicrobia all contribute to the blue crab microbiome. Of the four sample types,
the gut microbiome was most diverse (Figure 6.1a).
Some of these bacteria, such as Mycoplasmataceae, are notoriously difficult to
culture and so were not found in previous studies using solely culture-based methods.
Although some Mycoplasmataceae have been classified as pathogenic, others have been
observed to be commensal and natural components of bacterial communities (Giebel et
al. 1990b). Mycoplasma sp. have been associated with the gut microflora of a variety of
terrestrial and marine hosts including rats (Giebel et al. 1990b), termites (Hongoh et al.
2003), fish (Holben et al. 2002a; Bano et al. 2007; Ward et al. 2009b), abalone (Tanaka et
al. 2004b; Huang et al. 2010), lobsters (Meziti et al. 2010b), and the marsh fiddler crab
(Gulmann 2004b). None of the Mycoplasmataceae sequences we retrieved clustered with
the Mycoplasma spp. found in the termite (Hungoh et al., 2003) or fish gut studies
Page 206
203
(Holben et al. 2002a; Bano et al. 2007; Ward et al. 2009b). Our sequences did, however,
cluster with uncultured Mycoplasmataceae from guts of the mud crab (Scylla
paramamosain) (Accession Number HE610322) and with symbionts from isopod
midguts (EU646198) (Frane and Zimmer 2008).
We did not retrieve V. cholerae, V. parahaemolyticus, or V. vulnificus from any
part of any of the crabs we sampled; however, we retrieved many sequences that were
similar to other potential pathogens. A. junii, Alteromonas sp., Bacillus sp., E. coli, P.
damselae subsp. damselae, P. damselae subsp. piscida, Pseudoalteromonas sp., and V.
harveyi are all potentially pathogenic and sequences assigned (>97% similarity) to these
species were associated with blue crabs in our study. V. harveyi and both subspecies of
P. damselae are known to be opportunistic pathogens of both finfish and shellfish
(Thyssen et al. 1998b; Fouz et al. 2000a; Austin and Zhang 2006). P. damselae subsp.
damselae is also documented as a human pathogen with 3 cases reported in 2010 and an
incidence of 0.01 per 100,000 persons (Anonymous 2011). A. junii has been documented
to be an occasional, opportunistic human pathogen (Kappstein et al. 2000; Linde et al.
2002).
Previous studies reported that crabs with physical injuries had increased levels of
hemolymph infections. Of the crabs sampled in this study, C1, C2, and C4 had sustained
injuries prior to capture that resulted in partial (dactyl) or complete (chelipeds) loss of
appendages. The hemolymph sample from crab C1 had the second highest abundance of
bacteria in these samples, with 1.5 x 10⁶ copies of 16S rRNA genes mL
-1 of template.
Crabs C2 and C4 had much lower concentrations, in the range of 104-10
5 copies of 16S
rRNA genes mL-1
of template. Crab C3 had no injuries, but at the time of dissection had
Page 207
204
the highest concentration of bacteria in its hemolymph (109 copies of 16S rRNA genes
mL-1
of template), with all clones having >97% sequence similarity to the opportunistic
pathogen V. harveyi. When we assessed the abundance of bacteria in crab hemolymph
samples using published classifications based on plating (Davis and Sizemore 1982),
29% had sterile hemolymphs, 42% had light infections, 29% had moderate infections.
No crabs had high level (>105 CFU mL
-1 of hemolymph fluid) infections. In contrast if
we convert our qPCR data (copies of 16S rRNA genes mL-1
of template) to estimates of
genome (cell) abundance by dividing by an average copy number of 3.3 16S rRNA
genes/genome (the average of the ribosomal gene copy numbers for genera present in this
study’s clone libraries; refs (Klappenbach et al. 2001b; Lee et al. 2009a), we can estimate
abundance as genomes (cells) mL-1
of template. We then use the categories proposed by
(Davis and Sizemore 1982) to classify crab hemolymph samples by qPCR assay: 86%
had moderate infections and 14% had high level infections. Although the previously-
injured crabs C1, C2, and C4 only had light infections and were apparently healthy, their
hemolymph communities were dominated by potential pathogens: A. junii (C1); Bacillus
sp. (C2); and Alteromomas sp., Bacillus sp., P. damselae, and Vibrio spp. (C4).
NMDS suggests the gut microflora community is similar among sampled crabs
and is different from that found in either carapace or hemolymph bacteria communities.
The hemolymph microflora community is not the same as that found on the carapace or
in the gut. However, sequences representing many of the same phyla (Bacteroidetes,
Firmicutes, and Proteobacteria) and even ribotypes (i.e. Alteromonas sp., Escherichia sp.,
and Vibrio sp.) that were found in the carapace and gut samples were also found in the
hemolymph samples.
Page 208
205
ACKNOWLEDGMENTS
This work was supported by NOAA Oceans and Human Health Initiative
Traineeship S0867882 (CEG) and National Science Foundation Grant No. IO-0725245
(KGB, LEB). We thank Nat Johnson and Kristin Stover (Burnett Lab) for their
assistance in collecting specimens.
Page 209
206
REFERENCES
Anonymous. 1971. Vibrio parahaemolyticus gastroenteritis—Maryland, p. 356.
Morbidity and Mortality Weekly Report. Center for Disease Control.
---. 1976. Foodborne and waterborne outbreaks. Annual summary, 1975. Center for
Disease Control.
---. 1999. Outbreak of Vibrio parahaemolyticus infection assoicated with eating raw
oysters and clams harvested from Long Island Sound – Connecticut, New Jersey,
and New York, 1998, p. 48-51. Morbidity and Mortality Weekly Report. Center
for Disease Control.
---. 2011. Vital signs: Incidence and trends of infections with pathogens transmitted
commonly through food - foodborne diseases active surveillance network, 10 U.S.
sites, 1996-2010, p. 749-755. Morbidity and Mortality Weekly Report. Center for
Disease Control.
Austin, B., and X.-H. Zhang. 2006. Vibrio harveyi: a significant pathogen of marine
vertebrates and invertebrates. Letters in Applied Microbiology 43: 119-124.
Bano, N., A. Derae Smith, W. Bennett, L. Vasquez, and J. T. Hollibaugh. 2007.
Dominance of Mycoplasma in the guts of the Long-Jawed Mudsucker, Gillichthys
mirabilis, from five California salt marshes. Environmental Microbiology 9:
2636-2641.
Blake, P. A., M. H. Merson, R. E. Weaver, D. G. Hollis, and P. C. Heublein. 1979.
Disease caused by a marine vibrio. New England Journal of Medicine 300: 1-5.
Buchan, A., M. Hadden, and M. T. Suzuki. 2009. Development and application of
quantitative-PCR tools for subgroups of the Roseobacter clade. Appl. Environ.
Microbiol. 75: 7542-7547.
Clarke, K. R., and R. N. Gorley. 2006. PRIMER v6: User Manual/Tutorial. PRIMER-E.
Cole, J. R. and others 2007. The ribosomal database project (RDP-II): introducing
myRDP space and quality controlled public data. Nucleic Acids Research 35
(Database issue): D169-D172.
Cole, J. R. and others 2009. The Ribosomal Database Project: improved alignments and
new tools for rRNA analysis. Nucleic Acids Research 37 (Database issue):
D141-D145.
Colwell, R. R., T. C. Wicks, and H. S. Tubiash. 1975. A comparative study of the
bacterial flora of the hemolymph of Callinectes sapidus. U.S. National Marine
Fisheries Review 37: 29-37.
Page 210
207
Cook, D. W., and S. R. Lofton. 1973. Chitinoclastic bacteria associated with shell disease
in Penaeus shrimp and the Blue Crab (Callinectes sapidus). Journal of Wildlife
Diseases 9: 154-159.
Davis, J. W., and R. K. Sizemore. 1982. Incidence of Vibrio species associated with blue
crabs (Callinectes sapidus) collected from Galveston Bay, Texas. Appl. Environ.
Microbiol. 43: 1092-1097.
Faghri, M. A., C. L. Pennington, L. S. Cronholm, and R. M. Atlas. 1984. Bacteria
associated with crabs from cold waters with emphasis on the occurrence of
potential human pathogens. Appl. Environ. Microbiol. 47: 1054-1106.
Ferguson, R. L., E. N. Buckley, and A. V. Palumbo. 1984. Response of marine bacteria to
differential filtration and confinement. Appl. Environ. Microbiol. 47: 49-55.
Fouz, B., A. E. Toranzo, M. Milán, and C. Amaro. 2000. Evidence that water transmits
the disease caused by the fish pathogen Photobacterium damselae subsp.
damselae. Journal of Applied Microbioology 88: 531-535.
Frane, S., and M. Zimmer. 2008. Host-specificity of environmentally transmitted
Mycoplasma-like isopod symbionts. Environmental Microbiology 10: 2497-2504.
Giebel, J., A. Binder, and H. Kirchhoff. 1990. Isolation of Mycoplasma moatsii from the
intestine of wild Norway rats (Rattus norvegicus). Veterinary Microbiology 22:
23-29.
Gulmann, L. K. 2004. Gut-associated microbial symbionts of the marsh fiddler crab, Uca
pugnax. Massachusetts Institute of Technology.
Head, I. M., J. R. Sanders, and R. W. Pickup. 1998. Microbial evolution, diversity, and
ecology: a decade of ribosomal RNA analysis of uncultivated microorganisms.
Microb. Ecol. 35: 1-21.
Holben, W. E., P. Williams, M. Saarinen, L. K. Sarkilahti, and J. H. A. Apajalahti. 2002.
Phylogenetic analysis of intestinal microflora indicates a novel mycoplasma
phylotype in farmed and wild salmon. Microb. Ecol. 44: 175-185.
Hongoh, Y., M. Ohkuma, and T. Kudo. 2003. Molecular analysis of bacterial microbiota
in the gut of the termite Reticulitermes speratus (Isoptera; Rhinotermitidae).
FEMS Microb. Ecol. 44: 231-242.
Huang, Z.-B., F. Guo, J. Zhao, W.-D. Li, and C.-H. Ke. 2010. Molecular analysis of the
intestinal bacterial flora in cage-cultured adult small abalone, Haliotis
diversicolor. Aquac. Res. 41: e760-e769.
Page 211
208
Huber, T., G. Faulkner, and P. Hugenholtz. 2004. Bellerophon: a program to detect
chimeric sequences in multiple sequence alignments. Bioinformatics 20: 2317-
2319.
Huq, A. and others 1990. Detection of Vibrio cholerae O1 in the aquatic environment by
fluorescent monoclonal antibody and culture method. Appl. Environ. Microbiol.
56: 2370-2373.
Kappstein, I., H. Grundmann, T. Hauer, and C. Niemeyer. 2000. Aerators as a reservoir
of Acinetobacter junii: an outbreak of bacteraemia in paediatric oncology patients.
Journal of Hospital Infection 44: 27-30.
Klappenbach, J. A., P. R. Saxman, J. R. Cole, and T. M. Schmidt. 2001. rrnDB: the
ribosomal RNA operon copy number database. Nucleic Acids Research 29: 181-
184.
Krantz, G. E., R. R. Colwell, and E. Lovelace. 1969. Vibrio parahaemolyticus from the
Blue Crab Callinectes sapidus in Chesapeake Bay. Science 164: 1286-1287.
Lane, D. J. 1991. 16S/23S rRNA sequencing, p. 115-175. In E. Stackebrandt, and M.
Goodfellow (ed.), Nucleic acid techniques in bacterial systematics. Academic
Press, Chichester, England.
Lee, Z. M., C. Bussema, and T. M. Schmidt. 2009. rrnDB: documenting the number of
rRNA and tRNA genes in bacteria and archaea. Nucleic Acids Research 37: 1-5.
Linde, H. J., J. Hahn, E. Holler, U. Reischl, and N. Lehn. 2002. Septicemia due to
Acinetobacter junii. Journal of Clinical Microbiology 40: 2696-2697.
Meziti, A., A. Ramette, E. Mente., and K. Kormas. 2010. Temporal shifts of the Norway
lobster (Nephrops norvegicus) gut bacterial communities. FEMS Microb. Ecol.
74: 472-484.
Molenda, J. R., W. G. Johnson, M. Fishbein, B. Wentz, I. J. Mehlman, and T. a. J.
Dadisman. 1972. Vibrio parahaemolyticus gastroenteritis in Maryland: laboratory
aspects. Applied Microbiology 24: 444-448.
Noga, E. J., D. P. Engel, T. W. Arroll, S. Mckenna, and M. Davidian. 1994. Low serum
antibacterial activity coincides with increased prevalence of shell disease in blue
crabs Callinectes sapidus. Diseases of Aquatic Organisms 19: 121-128.
Noga, E. J., R. Smolowitz, and L. H. Khoo. 2000. Pathology of shell disease in the blue
crab, Callinectes sapidus Rathbun, (Decapoda: Portunidae). Journal of Fish
Diseases 23: 389-399.
Page 212
209
Oksanen, J. and others 2009. vegan: Community Ecology Package. R package version
1.15-2. 2009.
Phillips, F. A., and J. T. Peeler. 1972. Bacteriological survey of the blue crab industry.
Applied Microbiology 24: 958-966.
R Core Team. 2009. R: A Language and Environment for Statistical Computing. R
Foundation for Statistical Computing.
Sizemore, R. K., R. R. Colwell, H. S. Tubiash, and T. E. Lovelace. 1975. Bacterial flora
of the hemolymph of the Blue Crab, Callinectes sapidus: Numerical Taxonomy.
Applied Microbiology 29: 393-399.
Stackebrandt, E., and B. M. Goebel. 1994. Taxonomic note: A place for DNA-DNA
reassociation and 16S rRNA sequence analysis in the present species definition in
bacteriology. International Journal of Systematic Bacteriology 44: 846-849.
Suzuki, M. T., L. T. Taylor, and E. F. Delong. 2000. Quantitative analysis of small-
subunit rRNA genes in mixed microbial populations via 5'-nuclease assays. Appl.
Environ. Microbiol. 66: 4605-4614.
Tanaka, R., M. Otsubo, T. Sawabe, Y. Ezura, and K. Tajima. 2004. Biodiversity and in
situ abundance of gut microflora of abalone (Haliotis discus hannai) determined
by culture-independent techniques. Aquaculture 241: 453-463.
Thompson, J. R., M. A. Randa, L. A. Marcelino, A. Tomita-Mitchel, E. Lim, and M. F.
Polz. 2004. Diversity and dynamics of a North Atlantic coastal Vibrio
community. Appl. Environ. Microbiol. 70: 4103-4110.
Thyssen, A., L. Grisez., R. Van Houdt, and F. Ollevier. 1998. Phenotypic
characterization of the marine pathogen Photobacterium damselae subsp.
piscicida. Int. J. Syst. Evol. Microbiol. 48: 1145-1151.
Tindall, B. J., R. Roselló-Móra, H.-J. Busse, W. Ludwig, and P. Kämpfer. 2010. Notes on
the characterization of prokaryote strains for taxonomic purposes. Int. J. Syst.
Evol. Microbiol. 60: 249-266.
Tubiash, H. S., R. K. Sizemore, and R. R. Colwell. 1975. Bacterial flora of the
hemolymph of the Blue Crab, Callinectes sapidus: Most Probable Numbers.
Applied Microbiology 29: 388-392.
Ward, N. L., B. Steven, K. Penn, B. A. Methé, and W. H. Detrich. 2009. Characterization
of the intestinal microbiota of two Antarctic notothenioid fish species.
Extremophiles 13: 679-685.
Page 213
210
Welsh, P. C., and R. K. Sizemore. 1985. Incidence of bacteremia in stressed and
unstressed populations of the Blue Crab, Callinectes sapidus. Appl. Environ.
Microbiol. 50: 420-425.
Williams-Walls, N. J. 1968. Clostridium botulinum type F: isolation from crabs. Science
162: 375-376.
Page 214
211
Table 6.1: Primers used in this study
Primers Gene Use Primer Sequences (5’ to 3’) Reference
27F 16S rRNA Sequencing AGAGTTTGATCMTGGCTCAG (Lane 1991b)
1492R 16S rRNA Sequencing GGTTACCTTGTTACGACTT (Lane 1991b)
BACT1369F 16S rRNA qPCR CGGTGAATACGTTCYCGG
(Suzuki et al.
2000a)
PROK1492R 16S rRNA qPCR GGWTACCTTGTTACGACTT
(Suzuki et al.
2000a)
Page 215
212
Table 6.2: Bacteria taxa and concentration identified in the blue crab microbiome in
previous studies using culture-based methods compared with the ribotypes
identified by culture-independent analysis in this study.
Sample Type and Assemblage Composition Concentration Reference
Carapace Clip
Alteromonas sp., Pseudoalteromonas sp., Erythrobacter sp.,
Verrucomicrobia, Vibrio spp. (V. harveyi), Rhodobacteraceae
(Oceanicola sp., Roseobacter sp., Roseovarius sp., and
Ruegeria sp.), Bacteroidetes, Mycoplasmataceae
2.4 X 10⁶-
6.5 x 10⁷ copies
mL-1
This Study
Carapace Swab
Alteromonas sp., Pseudoalteromonas sp., Thalassomonas sp.,
Aestuariibacter sp., Rhodobacteraceae (Roseobacter sp.,
Roseovarius sp., Loktanella sp), Bacteriodetes, Vibrio spp.
3.7 x 10⁶-
2.1 x 10⁸ copies
mL-1
This Study
Vibrio sp., Pseudomonas sp. NR* (Cook and Lofton
1973)
Vibrio spp.; V. cholerae, V. parahaemolyticus, V. vulnificus NR* (Davis and
Sizemore 1982)
Vibrio sp., Pseudomonas ssp., Aeromonas sp., Plesiomonas sp. NR* (Noga et al. 1994)
Achromobacter spp., Acinetobacter spp., Aeromonas spp.,
Plesiomonas spp., Pseudomonas spp., E. coli, Serratia sp.,
Vibrio spp. including V. alginolyticus, V. mimicus, V.
parahaemolyticus, V. vulnificus
NR* (Noga et al. 2000)
Gut
P. damselae (subsp. damselae, piscida), Arcobacter sp.,
Spirochaeta sp., Bacteroidetes, P. maris, Firmicutes (Bacillus
sp., Paenibacillus sp.) Marinobacter sp., Vibrio spp. (V.
gallicus, V. harveyi, V. tubiashii, V. xuii), Mycoplasmataceae,
Escherichia sp., Thalassomonas sp
2.1 x 10⁸-
4.3 x 10⁹ copies
mL-1
This Study
Hemolymph
A. junii, Bacillus sp., Vibrio spp. (V. harveyi), Alteromonas sp.,
Marinobacter sp., Escherichia sp., Bacteroidetes,
Methylobacterium sp., Comamonas sp., Diaphrobacter sp.,
Paenibacillus sp., Thalassomonas sp., Mycoplasmataceae
5.8 x 10⁴-
1.5 x 10⁹ copies
mL-1
This Study
Clostridium botuilinum type F NR* (Williams-Walls
1968)
V. parahaemolyticus NR* (Krantz et al.
1969)
Vibrio spp., V. parahaemolyticus NR* (Colwell et al.
1975)
Vibrio spp. (especially V. parahaemolyticus), Pseudomonas
sp., Acinetobacter sp., Aeromonas sp., Bacillus sp.,
Flavobacterium sp., coliforms
NR* (Sizemore et al.
1975)
Vibrio spp.; V. cholerae, V. parahaemolyticus, V. vulnificus 8.6 x 101 –
3.0 x 10⁷ bacteria
mL-1
(Davis and
Sizemore 1982)
Vibrio spp. 0-9.5 x 10⁴ CFU
mL-1
(Welsh and
Sizemore 1985)
*NR-not reported
Page 216
213
Figure 6.1: Bacteria phyla (% of ribotypes retrieved) detected in a) Gut; b) Carapace Clip; c) Carapace Swab; and d)
Hemolymph samples.
C1-C7 refer to seven different sampled crabs. ALL corresponds to combined results from all sampled crabs.
Page 217
214
Figure 6.2: Contribution of a) Proteobacteria and b) γ-Proteobacteria ribotypes to
libraries of sequences retrieved from Gut (G), Carapace Clip (CP), Carapace Swab
(CS), and Hemolymph (H) samples from all of the crabs that were sampled.
Page 218
215
Figure 6.3: Non-Metric Multidimensional Scaling analysis of the distribution of
Bacteria phyla found in carapace clip (CP), carapace swab (CS), gut (G), and
hemolymph (H) samples. Samples from crabs 1-7 (C1-C7) are displayed in a two-dimensional space and clustered
according to percent similarity of the Bacterial assemblages they contain. Note that in
many instances, the 80% similarity cutoff only included one sample. The C2/CS point
overlaps that of the C3/H sample. Samples not present in plot were below the 40%
similarity cutoff. MRPP indicates that clusters defined at 60% and 80% similarity are
significantly different (p=0.002 and p=0.001, respectively).
Page 219
216
Transform: Fourth root
Resemblance: S17 Bray Curtis similarity
TypeCS
CP
H
G
Similarity20
40
60
80
C1C2
C3
C5
C6C7
C1
C2
C3
C4
C6
C7
C1
C2
C3 C4
C5C6
C7
C1
C2
C3
C4C5 C6
2D Stress: 0.12
Figure 6.4: Non-Metric Multidimensional Scaling analysis of γ-Proteobacteria
ribotypes retrieved from carapace clip (CP), carapace swab (CS), gut (G), and
hemolymph (H) samples. Samples are displayed in a two-dimensional space and clustered according to percent
similarity. Note that in many instances, the similarity cutoff only included one sample.
Samples not present in plot were below the 20% similarity cutoff. MRPP indicates that
clusters separated at the 20% 40%, 60%, and 80% similarity level were all significantly
different at p=0.001.
Page 220
217
1.00E+00
1.00E+01
1.00E+02
1.00E+03
1.00E+04
1.00E+05
1.00E+06
1.00E+07
1.00E+08
1.00E+09
1.00E+10
1 2 3 4 5 6 7
cop
ies/
mL
CFU
/mL
Crab
Carapace Clip
Carapace Swab
Gut
Hemolymph
HemolymphPlating
* *
Figure 6.5: qPCR analysis of the abundance of Bacteria in Carapace Clip,
Carapace Swab, Gut, and Hemolymph Samples. Abundance is reported as copies of 16S rRNA genes/mL of DNA extract from each
sample and thus are comparable across sample types but not between sample types. * =
Hemolymph plates for C6 and C7 had no colony growth.
Page 221
218
CHAPTER SEVEN
CONCLUSIONS
This dissertation used the molecular methods of 454-pyrosequencing, 16S rRNA
clone libraries, and qPCR to 1) determine and compare the gut microflora of 12 finfish
and 3 shark species, 2) assess the effects of food quality and diet-associated bacteria on
gut microflora, 3) gauge the effects of increased water temperature on the abundance
Vibrio spp. within fish guts, and 4) assess whether the fish gut is a reservoir of Vibrio
spp. when growth condition are less favorable and also a vector for Vibrio spp.
distribution. I also determined the composition of blue crab (Callinectes sapidus)
microbiome as an example an invertebrate prey item. Additionally, blue crabs are of
commercial importance and the crab-associated microbiome may affect crab, fish, and
human health.
I found that Proteobacteria ribotypes dominated (>50%) the gut microbiomes of
most (67%) of the 15 fish species examined (reported in Chapter 2). However,
Firmicutes, Fusobacteria, Spirochaetes, and Tenericutes, not Proteobacteria, were the
dominant ribotypes found in the guts of 5 fish species. Our data also suggested that fish-
to-fish variability in composition of the gut microbiome was significant in some species,
suggesting that the composition of the gut microflora community responds to external
factors such as habitat and diet. We did not find a core microbial assemblage that
encompassed all of the fish species. However, many of the OTUs present in one species’
Page 222
219
core group were also found in the core groups of other species. The gut microbiome of
piscivorous fish was less diverse than that of our omnivorous fish, suggesting that a more
varied diet results in increased gut bacterial diversity.
This observation led to experiments designed to test the variability of the
composition of the gut microbiome, and the potential influence of food-borne bacteria on
the apparent composition of the gut microbiome (Chapter 3). I found that diet and diet-
associated bacteria contributed ribotypes to the fish gut microflora, potentially
complicating interpretation of gut microflora samples. However, I found that fish retain
a core group of ribotypes that consistently constitute the bulk of the respective fish’s gut
microbiome. Diet had a greater effect on the composition of the gut microbiome of F.
heteroclitus, which has a simple gut, than for L. rhomboides which has a more complex
and differentiated gut. This may explain why some fish with simple gut tracts (i.e. the
great barracuda) had high fish-to-fish variability of gut microbiome composition in my
comparison study (Chapter 2). Diversity of the gut microflora community was lowest
among L. rhomboides fed a strict carnivorous diet, greater among L. rhomboides fed an
omnivorous diet, and greatest among those with herbivorous diet. Since the composition
of the gut microflora community in F. heteroclitus was more directly related to diet-
associated bacteria, diversity of their gut microflora was directly related to the diversity
of the diet.
Chapter 4 attempted to assess if and how elevated temperature regimes affected
the relative abundance of Vibrio spp. in fish gut microbiomes. Vibrio spp. ribotypes,
including several that are documented fish and human pathogens, are found within fish
guts. Our results from this study were inconclusive. We did not see a correlation
Page 223
220
between the relative abundance of Vibrio spp. 16S rRNA genes and increased
temperature in the L. rhomboides study, in part due to the rapid onset of sepsis in these
fish once tank temperature was raised. In contrast, there was a statistically significant
difference between the relative abundance of both Vibrio 16S rRNA and V. vulnificus
vvh genes in the F. heteroclitus gut from the 20 °C and 32 °C treatments. Chapter 5 used
field data to explore this same problem and provided strong evidence that the fish gut is a
reservoir for V. vulnificus and V. parahaemolyticus during periods of sub-optimal
temperature and/or salinity when these bacteria are apparently absent from oyster or
water column samples. I concluded that fish are a link in the Vibrio life cycle, with
viable cells passing between fish guts, the water column, and oysters through expulsion
with fecal matter.
Lastly, Chapter 6 provided evidence that the crab microbiome was more diverse
than reported previously in culture-based studies. Proteobacteria ribotypes dominated the
crab microbiome; however, there were distinct differences between the microflora
assemblages collected in carapace, gut, and hemolymph samples.
There is a diverse and abundant gut microbiome associated with finfish, sharks,
and blue crabs. These gut microbiomes all have a core Proteobacteria community, which
is in contrast to the human and terrestrial mammalian gut microbiome which is
dominated by Firmicutes and Bacteroidetes ribotypes. This difference may partly be
attributed to the fact that some of these Proteobacteria (such as Vibrio spp. and
Photobacterium spp.) are typically associated with aquatic environments. Further
research is needed to better the underlying mechanisms shaping the gut microbiome and
resulting in differences in these gut microbiomes of fish and mammals. Thus, we need to
Page 224
221
next address the functionality of the gut microflora so we can better understand how they
contribute to fish physiology and health.
Page 225
222
APPENDIX A
CHAPTER 2 SUPPLEMENTARY MATERIAL1
1 Supporting Material for:
Givens, C.E. and J.T. Hollibaugh. To be submitted to The International Society for
Microbial Ecology Journal.
Page 226
223
Supplementary Table 2.1: Number of sequences retrieved for all finfish and shark
samples.
Sequences post-quality control refer to those remaining after the Qiime split_library.py
workflow which filters reads based on length, primer mismatches, and quality score
(<25). Number of chimeras refer to those sequences identified with the Chimera Slayer
program in Qiime. Number of unrooted sequences refer to those sequences not binned as
Bacteria. The last column refers to the total number of sequences used for our analyses
and to calculate alpha and beta diversity metrics.
Sample
Sequences
Post Quality
Control
# of
Chimeras
# of
unrooted
sequences
# of
Chloroplast
Sequences
Total Used
in
Analyses
MC1-C 30498 322 3314 1149 25713
MC2-C 14591 22 745 8556 5268
MC3-C 41963 32 83 40066 1782
MC4-C 35876 104 283 23910 11579
MC5-W 10317 75 622 187 9433
MC6-W 25639 992 2168 1247 21232
MC7-W 18079 134 9523 219 8203
MC8-W 32637 1317 2003 317 29000
PF1-J 16645 42 34 154 16415
PF2-J 13177 159 416 831 11771
PF3-J 57130 583 2812 1190 52545
PF4-J 23316 108 28 581 22599
PF1-A 34671 327 545 323 33476
PF2-A 17660 39 163 323 17135
PF3-A 15694 145 4 4 15541
PF4-A 10031 191 1379 409 8052
SP1 14348 193 748 17 13390
SP2 19381 103 1342 15 17921
SP3 42339 165 31471 445 10258
BSB1 22207 11563 1664 128 8852
Page 227
224
BSB2 13359 14 11959 328 1058
BSB3 18138 32 54 447 17605
HC1 12571 67 222 331 11951
HC2 15050 198 1112 657 13083
HC3 21626 80 5950 328 15268
FL1 44908 100 15081 200 29527
FL2 33274 74 27972 161 5067
FL3 47845 116 38002 29 9698
SPM1 7921 10 7023 51 837
SPM2 18233 25 15610 256 2342
KM1 19880 29 221 0 19630
KM2 8057 61 1321 227 6448
RD1 22746 2691 5003 1154 13898
RD2 22887 2 19970 102 2813
RD3 21740 3044 730 53 17913
JC1 18093 60 14426 223 3384
JC2 8703 117 1008 236 7342
JC3 16052 428 51 18 15555
MH1 26288 22 310 0 25956
MH2 26689 1 116 0 26572
MH3 25337 5 223 1 25108
BR1 21861 3 21001 1 856
BR2 13548 0 17 1 13530
BR3 15302 365 28 0 14909
SHP1 18008 152 121 1 17734
SHP2 7563 54 482 68 6959
SPN1 8447 30 1648 43 6726
Page 228
225
SPN2 11784 148 24 9 14449
SDB1 21498 6 9 0 11769
SDB2 30498 347 25 62 21064
Page 229
226
Supplementary Figure 2.1: Phylum composition (%) of 12 finfish and 3 shark
species with 454-pyrosequencing.
Percent compositions are averaged from 2-4 fish samples depending on species and do
not reflect the sample-to-sample variability.
Page 230
227
APPENDIX B
CHAPTER 6 SUPPLEMENTARY MATERIAL1
1 Givens, C.E., K.G. Burnett, L.E. Burnett, and J.T. Hollibaugh. To be submitted to
Marine Biology.
Page 231
228
Supplementary Table 6.1: Percent (%) Composition of Proteobacteria ribotypes in
Gut, Carapace Clip, Carapace Swab, and Hemolymph sequence libraries
Sample Type Composition
Gut 71.7% γ-Proteobacteria, 25.7% ε-
Proteobacteria, 1.77% α-Proteobacteria, 0.89%
δ-Proteobacteria
Carapace Clip 50.0% γ-Proteobacteria, 46.4% α-
Proteobacteria, 3.64% δ-Proteobacteria
Carapace Swab 81.2% γ-Proteobacteria, 14.9% α-
Proteobacteria, 2.97% ε-Proteobacteria, 0.99%
δ-Proteobacteria
Hemolymph 85.7% γ-Proteobacteria, 6.42% α-
Proteobacteria, 7.86 β-Proteobacteria
Page 232
229
Supplementary Table 6.2: Percent (%) Composition of γ-Proteobacteria ribotypes
to Gut, Carapace Clip, Carapace Swab, and Hemolymph sequence libraries
Sample Type Composition
Gut 45.6% Photobacterium sp., 25.9%
Marinobacter sp., 23.4% Vibrio sp., 2.47%
Escherichia sp., 2.47% Thalassomonas sp.
Carapace Clip 43.6% Alteromonas sp., 14.5% Vibrio sp.,
7.27% Thalassomonas sp., 7.27% Escherichia
sp., 3.63% Enterobacter sp., 1.82% Colwellia
sp., 1.82% Hailea sp., 1.82%
Marinobacterium sp., 1.82%
Pseudoalteromonas sp.
Carapace Swab 54.9% Alteromonas sp., 12.2%
Pseudoalteromonas sp., 10.9%
Thalassomonas sp., 8.54% Aestuariibacter
sp., 3.66% Vibrio sp., 2.44% Hailea sp.,
2.44% Marinobacter sp., 1.22%
Neptuniibacter sp., 1.22% Oceaniserpentilla
sp., 1.22% Salimonas sp., 1.22 % uncultured
γ-Proteobacteria
Hemolymph 43.3% Acinetobacter sp., 24.2% Vibrio sp.,
10.8% Alteromonas sp., 8.33% Marinobacter
sp., 6.67% Escherichia sp., 2.5%
Thalassomonas sp., 1.67% Enterobacter sp.,
0.83% Neptuniibacter sp., 0.83%
Photobacterium sp., 0.83%
Pseudoalteromonas sp.