Inherent optical properties ~IOP’s! such as spectralabsorption a~l!, scattering b~l!, and backscatteringbb~l! coefficients are essential for characterizing themarine optical environment and remote-sensing ap-plications. In recent years significant effort hasbeen devoted to the development of models for esti-mating IOP’s from underwater light-field measure-
When this research was performed, H. Loisel and D. Stramskiwere with the Marine Physical Laboratory, Scripps Institution ofOceanography, University of California at San Diego, La Jolla,California 92093-0238. H. Loisel [email protected]! is now
ith the Laboratoire d’Optique Atmospherique, Universite de Lille, F-59655 Villeneuve d’Ascq Cedex, France. B. G. Mitchell isith the Marine Research Division, Scripps Institution of Ocean-graphy, University of California at San Diego, La Jolla, California2093-0218. F. Fell, B. Lemasle, and M. Babin are with the Labo-atoire de Physique et Chimie Marines, B.P. 08, F06238 Ville-ranche sur Mer Cedex, France. V. Fournier-Sicre is with ACRI,60 route du Pin Montard, B.P. 234, 06904 Sophia Antipolis Cedex,rance.Received 17 July 2000; revised manuscript received 30 January
2384 APPLIED OPTICS y Vol. 40, No. 15 y 20 May 2001
ments and apparent optical properties ~AOPs!.The AOPs commonly used in these models includethe diffuse attenuation coefficient for downwellingirradiance Kd~l!, irradiance reflectance R~l!, andemote-sensing reflectance Rrs~l! ~see Table 1 for
symbols and definitions!. These models are basedon certain assumptions and methods that could limittheir potential application. For example, the modelsinvolve assumptions about the spectral behavior ofIOPs ~see, e.g., Refs. 4, 6, and 7!, require input datafrom measurements at different Sun angles ~see, e.g.,Ref. 2!, or are relatively complex methods for solvingthe problem by use of input data that characterize thevertical profiles of the underwater light-field charac-teristics9 and iterative radiative-transfer simula-tions.5,10
To overcome these limitations, we recently devel-oped a simple inverse model for retrieving a~l!, b~l!,and bb~l! within the surface ocean layer from twobasic AOPs.1 These AOPs are the irradiance reflec-tance just beneath the sea surface R~l, z 5 02! andthe average attenuation coefficient for downwellingirradiance ^Kd~l!&1 between the sea surface and thefirst attenuation depth z1 at which the downwellingirradiance Ed~l! is reduced to 37% of its surface value~note that z1 is a function of l!. Our model can be
fs1
b
rtpdJbc
Table 1. Notation
applied to measurements taken at any solar zenithangle u0. The model accounts for the effect of Ra-man scattering, and thus it can be applied to variouswavelengths in the visible spectrum, perhaps withthe exception of wave bands where strong fluores-cence of biogenic material occurs, for example, near680 nm in waters with high chlorophyll concentra-tion. More important, the model is also independentof the spectral shape of the IOPs. Therefore it pro-vides a suitable tool for testing consistency betweenin situ measurements of IOPs and radiometric quan-tities of the light field. In addition, the model can beapplied to remote-sensing ocean-color data.
The model was previously tested with numericalsimulations of radiative transfer by use of IOPs thatwere assumed to be inputs to these simulations. De-velopment of commercial instrumentation in recentyears has provided a capability to determine IOPsroutinely from in situ measurements. Spectral ab-sorption a~l! and beam attenuation c~l! coefficientsare routinely collected with absorption-attenuationmeters such as ac-9 ~WET Labs, Inc.!.7,11–14 Fromthese data the scattering coefficient b~l! is derivedsimply as the difference between c~l! and a~l!. Thebackscattering coefficient bb~l! can also be estimatedrom in situ measurements with backscattering sen-ors such as Hydroscat-6 ~HOBI Labs, see e.g., Ref.5!.The objective of this study is to examine closure
Symbol Defin
a Total absorption coefficientaw Pure water absorption coefficientap Particle absorption coefficientas Soluble organic matter absorptionb Total scattering coefficientbw Pure water scattering coefficientbp Particle scattering coefficientc Beam attenuation coefficient ~5 abb Total backscattering coefficientbbw Pure water backscattering coefficiebbp Particle backscattering coefficienth Ratio of molecular scattering to totu0 Solar zenith angle in airuv Viewing zenith angle in airfv Viewing azimuth angle in airmw Cosine of solar zenith angle in watl Light wavelength in vacuumz Geometric depthz1 First attenuation depthChl Chlorophyll concentrationEu Upwelling irradiance on a horizontEd Downwelling irradiance on a horizoKd Vertical attenuation coefficient for^Kd&1 Average Kd within the layer betweR Irradiance reflectance ~5 EuyEd!Re Irradiance reflectance in the absenRrs Remote-sensing reflectanceLwn Normalized water-leaving radianceLu In-water upwelling radianceQ Ratio of the upwelling irradiance to
etween data from in situ measurements of IOPs,that is, a~l!, b~l!, and bb~l!, and the retrieval of thesecoefficients from our model based on concurrent mea-surements of R~l, z 5 02! and ^Kd~l!&1. We beginwith a brief description of field measurements and anoverview of the model. Because the model was orig-inally developed with radiative-transfer simulationsfor a vertically homogeneous water column, wepresent a sensitivity analysis for several situations ofdepth-dependent IOPs. We then compare the modelretrievals with IOP measurements made in variousoceanic areas, which include both off-shore andcoastal environments. Finally, a similar closureanalysis is performed within the context of ocean-color remote-sensing application where ^Kd~l!&1 val-ues were estimated from R~l, z 5 02! rather thanfrom direct measurement.
2. Field Measurements
The field data were collected off southern Californiaas part of the California Cooperative Oceanic Fisher-ies Investigations16 ~CalCOFI! and in waters sur-ounding Europe as part of the Coastal Surveillancehrough Observation of Ocean Color ~COASTlOOC!roject. For our analysis we selected the CalCOFIata that were taken at 11 stations during cruises inuly and September 1998. These stations representoth near-shore and off-shore locations with signifi-ant differences in ocean optical properties. For the
Unit
m21
m21
m21
cient m21
m21
m21
m21
m21
m21
m21
m21
ttering ~5 bwyb!
nmmmmg m23
rface W m22
surface W m22
2d ln Edydz! m21
e surface and z1 m21
Raman scatteringsr21
sr21
Wm22 sr21
upwelling radiance ~5 EuyLu! sr
ition
coeffi
1 b!
nt
al sca
er
al suntal
Ed ~5en th
ce of
the
20 May 2001 y Vol. 40, No. 15 y APPLIED OPTICS 2385
ecc
N
p a
t
2
COASTlOOC project, 29 stations representing abroad range of optical water types were selected fromvarious regions. Specifically, the data were col-lected in the coastal zone of the North Sea affected bythe Rhine River discharge, in the open ocean west offEurope and North Africa, and in off-shore as well asnear-shore waters in the proximity of the RhoneRiver in the Lions Gulf, Mediterranean. These datawere collected during cruises in April andSeptember–October 1997.
From the CalCOFI cruises, measurements includedspectral downwelling and upwelling irradiances,Ed~z, l! and Eu~z, l!, the spectral backscattering co-fficient bb~z, l!, and the spectral absorption coeffi-ient a~z, l!. This data set allows us to examine thelosure for a~z, l! and bb~z, l!. The methods and
data-processing procedures for the AOPs were de-scribed by Mitchell and Kahru.16 In brief, the un-derwater vertical profiles of Ed~z, l! and Eu~z, l! weremeasured with a MER-2048 spectroradiometer ~Bio-spherical Instruments! at different wavelengthbands between 340 and 665 nm. These irradiancedata were used to calculate the reflectance R~l, z 502! and the irradiance attenuation coefficient^Kd~l!&1, which are needed as input to our model. Inour analysis we use the data at six wave bands cen-tered at 412, 443, 490, 510, 555, and 665 nm for whichmeasurements of both Ed~z, l! and Eu~z, l! wereavailable. The backscattering coefficient bb~z, l!was determined from measurements with aHydroscat-6 sensor ~HOBI Labs! at six wavelengths,442, 488, 532, 589, 620, and 671 nm. A power func-tion of l was fitted to each set of spectral values ofbb~z, l!. The estimates of bb~z, l! provided by thesefits at wavelengths matching the five wave bands ofMER-2048 will be used in the analysis of closurebetween the measured and the modeled backscatter-ing coefficient.
The absorption spectra a~z, l! were determined asa sum of contributions by pure seawater,17 particles,and soluble materials. The absorption by particlesand soluble materials was measured during the Cal-COFI cruises on water samples taken from discretedepths with the ship’s conductivity–temperature–depth rosette by use of onboard double-beam spectro-photometer. This measurement provided data from300 to 750 nm at 2-nm intervals. The particulateabsorption spectra ap~z, l! were determined with afilter-pad technique.18 The absorption by solublematter as~z, l! was measured in a 10-cm quartz cu-vette on samples filtered through prerinsed 0.2-mm
uclepore filters with Milli-Q water as reference.19
Water samples were usually taken shortly before orafter the optical casts, but occasionally these eventswere separated by more than 1 h. The analysis ofclosure for the absorption coefficient will include thesix MER-2048 wave bands.
The COASTlOOC data include measurements ofEd~z, l!, Eu~z, l!, a~z, l!, and c~z, l!, which also
rovided the scattering coefficient b~z, l!. Thus thisdata set allows us to examine the closure between themeasured and the modeled IOPs for a~z, l! and b~z,
386 APPLIED OPTICS y Vol. 40, No. 15 y 20 May 2001
l!. The COASTlOOC measurements were madewith an in situ optical system that included a Sea-viewing Wide Field-of-view Sensor ~Sea WiFS! pro-filing multichannel radiometer ~SPMR! ~Satlantic!and an ac-9 instrument ~WET Labs, Inc.!. TheSPMR instrument measured Ed~z, l! and Eu~z, l! at15 spectral bands between 411 and 865 nm, and anac-9 meter provided a~z, l! and c~z, l! at nine wave-lengths between 412 and 715 nm. The closure anal-ysis for a and b for the COASTlOOC data will includefive wavelengths, for which there is a good matchbetween the ac-9 and SPMR bands, that is, 412, 440,488, 510, and 555 nm.
3. Overview of the Model
Our model is based on two distinct sets of numericalsimulations of radiative transfer in the ocean, whichare described in detail by Loisel and Stramski.1 Al-though the first set of simulations was made with noRaman scattering by water, the second set includesthis inelastic scattering process. The results fromsimulations in the absence of Raman scattering wereused to establish basic equations of the model, whichrelate the IOPs to irradiance reflectance Re~z 5 02!and the attenuation coefficient ^Kd&1. The super-script e indicates that the variable was obtained un-der the assumption that only elastic scatteringoccurs, that is, there is no Raman scattering by water.~Note that fluorescence processes were ignored in themodel development.! This subscript is omitted for^Kd&1 because the effect of Raman scattering on thisquantity is small ~see, e.g., Ref. 1!. The basic equa-tions are
a 5mw^Kd&1
F1 1 ~2.54 2 6.54mw 1 19.89mw2!
Re~02!
1 2 Re~02!G0.5 ,
(1)
where mw is the cosine of the refracted solar beamangle just beneath the surface,
b 5
aRe~02!
1 2 Re~02!2 bw~0.165 2 0.0358mw!
0.0215 2 0.0149mw, (2)
where bw is the scattering coefficient that is due towater molecules, and
bb 5 ^Kd&110a@Re~02!#d. (3)
The a and d functions are described as
a 5 ~20.83 1 5.34h 2 12.26h2!
1 mw~1.013 2 4.124h 1 8.088h2!, (4)
d 5 0.871 1 0.40h 2 1.83h2, (5)
where h ~5 bwyb! is the ratio of molecular scatteringto total scattering. Equations ~1!–~5! can be appliedt any wavelength l within the visible spectrum.The second set of simulations allowed us to assess
he contribution of Raman scattering to the actual
2
0
~
o#b
tt
Tpt@w1dcnhmo
bc
utul
itt
reflectance R~z 5 0 !. This reflectance representsthe actual situations in the ocean when both elasticscattering and Raman scattering are present. Wedeveloped an iterative scheme for calculating Re~z 5
2! from R~z 5 02!, because it is the hypotheticalreflectance in the absence of Raman scattering Re~z 502! rather than the actual or measured reflectanceR~z 5 02! that is used as input in the final Eqs.1!–~3! of our model.
Our previous tests based on numerical simulationsver a broad range of IOPs and a Sun zenith angle of60° showed the maximal errors in the retrieval of a,, and bb to be 6.5%, 23%, and 20%, respectively.1
The best estimation for a and bb was obtained in theblue and the green parts of the spectrum, where theerrors ranged from a few percent to less than 10%.
4. Sensitivity to the Vertical Structure of InherentOptical Properties
Our model was originally developed for an opticallyhomogeneous water column. To test the sensitivityof the model to the vertical structure of the IOPs, wemade numerical simulations with the Hydrolight 4.0radiative-transfer code20 in a similar way as de-scribed by Loisel and Stramski.1 One major differ-ence is that the IOPs in the present simulations varywith depth. We used the concentration of chloro-phyll a ~Chl! as a basis for generating the verticalstructure of IOPs. Specifically, we used the depthprofiles of Chl, which have the form of the Gaussiandistribution.21
Chl~ z! 5 Chl0 1h
s~2s!1y2 expF2~ z 2 zm!2
2s2 G , (6)
where Chl0 is the constant background for a chloro-phyll a concentration, zm is the depth of the deepchlorophyll maximum ~DCM!, s is the thickness ofhe DCM layer, and h is the parameter that describeshe total biomass above Chl0.
By varying the parameters Chl0, zm, s, and h, wehave generated five profiles @Figs. 1~a! and 1~b!#.
hese profiles can be representative of various tro-hic states of the ocean, from highly productive wa-ers, such as in the eutrophic coastal environmentsFig. 1~a!# to low biomass oligotrophic ocean watersith the DCM at 80 m @Fig. 1~b!#. One profile in Fig.~a! that depicts the greatest variation in Chl withepth was created arbitrarily to model dramatichanges over 2 orders of magnitude in Chl within theear-surface layer. The parameters Chl0, zm, s, andfor the remaining Chl profiles are based on actualeasurements of Chl in the coastal waters and open
cean taken by Platt et al.22
With these Chl~z! profiles we calculated the verti-cal structure of IOPs in two ways. First, we used thebio-optical model of Morel and Gentili,23 in whichoth the absorption and the scattering coefficientsovary with Chl. This set of IOP profiles is referred
to as IOPab-Chl. One example of these profiles for440 nm is shown in Fig. 1~c! for one Chl~z! profile.Second, the absorption coefficient profiles were cal-
culated from Chl~z! as above, but the scattering co-efficient was assumed constant throughout the entirewater column. The value of b~440! was calculatedfrom the relationship between b~550! and Chl24 by
sing the average chlorophyll concentration withinhe layer between the sea surface and the first atten-ation depth at l 5 550 nm in conjunction with the21 spectral dependence of b. This second set of
profiles will be referred to as IOPa-Chl and is used inan attempt to account for the observation that thescattering coefficient is not necessarily correlatedwith Chl.25 One example of these profiles at 440 nmis shown in Fig. 1~d! for the same Chl~z! profile usedn Fig. 1~c!. In these calculations the absorption andhe scattering coefficients of pure seawater wereaken from Pope and Fry17 and Morel,26 respectively.
The performance of our model in the presence ofthe vertical structure of IOPs was tested with numer-ical simulations by use of the Hydrolight code for eachIOP profile from the IOPab-Chl and IOPa-Chl sets.Surface-boundary conditions were described by a
Fig. 1. ~a! Vertical profiles of chlorophyll a concentration charac-terized by a large maximum near the ocean surface, and ~b! theprofiles with no maximum at all and with the significant subsur-face maxima characteristic of open ocean waters. ~c!, ~d! Verticalprofiles of the absorption coefficient ~dashed curves! and the scat-tering coefficient ~solid curves! for one example profile of chloro-phyll, that is, profile 3 in ~b!. ~c! Results of calculations in the casein which both absorption and scattering covary with chlorophyllconcentration; ~d! results of calculations when only absorption co-varies with chlorophyll ~see text for details about these calcula-tions!.
20 May 2001 y Vol. 40, No. 15 y APPLIED OPTICS 2387
na
at
tNmd
turR
ct
F
Fca
2
semiempirical sky model provided with the Hydroli-ght code for clear sky with a Sun zenith angle of 30°and sea-surface roughness corresponding to a windspeed of 5 m s21. The Raman scattering was ne-glected, which is acceptable for such a sensitivityanalysis. One scattering phase function for parti-cles represented by the average Petzold function27
was used in these simulations regardless of depthand wavelength. The reflectance R~l, z 5 02! andthe attenuation coefficient ^Kd~l!&1 resulting fromHydrolight simulations were then used to estimatethe a~l!, b~l!, and bb~l! coefficients from our model,Eqs. ~1!–~5!, at three wavelengths, 440, 550, and 660
m. We compare these IOP estimates ~referred tos the IOPmodel! with the IOPs referred to as IOPtrue.
The IOPtrue values represent the depth-average val-ues within the first attenuation layer, which werecalculated from both sets of vertical profiles, that is,IOPab-Chl~z! and IOPa-Chl~z!.
Figure 2 shows results of this comparison in termsof the relative error:
err~%! 5IOPmodel 2 IOPtrue
IOPtrue3 100. (7)
For typical open-ocean situations that correspond toprofiles from Fig. 1~b!, the vertical structure of theIOPs has a slight effect on the retrieval of a~l!, b~l!,and bb~l! averaged over the first attenuation depth@Figs. 2~c!–2~e! and 2~h!–2~j!#. In these cases the rel-tive errors do not exceed 15% and are similar tohose reported previously by Loisel and Stramski1 for
a uniform water column. The model performs bestfor the retrieval of a~l! with the error less than 6%.In addition, the errors are similar regardless ofwhether we consider the IOPab-Chl or IOPa-Chl profiles.
For waters that are strongly stratified near thesurface @see Fig. 1~a!# the accuracy of the model re-rievals is reduced @Figs. 2~a!, 2~b!, 2~f !, and 2~g!#.evertheless the error for the estimation of a~l! re-ains relatively low ~,15%!. This analysis also in-
icates that the retrieval of b~l! and bb~l! is generallymore sensitive to the vertical structure of IOPs thanthe retrieval of absorption. The errors in the b~l!and bb~l! estimates are as high as 40% in the bluespectral region for IOPa-Chl profiles @Figs. 2~f ! and2~g!#.
5. Closure between the Measured and the ModeledInherent Optical Properties
A. Field Data
The spectral values of R~l, z 5 02! and ^Kd~l!&1,which are used as inputs to our model, show signifi-cant differences between off-shore and near-shoreCalCOFI stations ~Fig. 3!. The off-shore stations inhe open ocean are characterized by the highest val-es of R~l, z 5 02! and the lowest ^Kd~l!&1 in the blueegion of the spectrum ~open circles in Fig. 3!. Also,~l, z 5 02! decreases greatly with wavelength
across the entire spectrum, which is a typical featureof waters with low concentrations of suspended and
388 APPLIED OPTICS y Vol. 40, No. 15 y 20 May 2001
dissolved materials. The surface chlorophyll a con-entrations at these open-ocean stations varied be-ween 0.1 and 0.25 mg m23. At the near-shore
CalCOFI stations with Chl ranging from 0.4 to 2 mgm23, R~l, z 5 02! shows relatively low values andlittle spectral variation in the blue @solid circles in
ig. 3~a!#. In this case the decrease in R~l, z 5 02!becomes significant only as the wavelength increasesfrom the green to the red spectral region. This pat-tern indicates that the near-shore stations havegreater amounts of suspended and dissolved matterin seawater, which result in stronger absorption, par-ticularly at blue wave bands @Fig. 4~a!#, as well asstronger backscattering at all wavelengths @Fig. 4~b!#.This observation is also consistent with higher valuesof ^Kd~l!&1 in the blue, which increase with decreasingwavelength for the near-shore stations @Fig. 3~b!#.
igure 3 also shows data that represent intermediateases ~see triangles in Fig. 3! between the near-shorend the open-ocean stations.The R~l, z 5 02! and ^Kd~l!&1 spectra for near-shore
COASTlOOC stations show even greater deviationfrom the clear-water patterns than the near-shore
Fig. 2. Comparison of errors ~in percent! in the values of absorp-tion, scattering, and backscattering coefficients estimated fromour model when the vertical profiles of IOPs are defined by theIOPab-Chl ~left! or the IOPa-Chl ~right! models as described in thetext. The errors are plotted for the three selected wavelengths,440, 555, and 660 nm, for each chlorophyll profile from Fig. 1, asindicated: circles, errors for the absorption coefficient; squares,those for the scattering coefficient; triangles, those for the back-scattering coefficient.
itppt
wwt
co
iRstehitcrg
t
CalCOFI stations. In areas strongly affected by dis-charge from the Rhone and Rhine Rivers, R~l, z 5 02!shows a well-pronounced maximum in the greenspectral band @see solid circles, Fig. 5~a!#. This max-mum can be attributed to enhanced backscatteringhat is due to the high concentration of suspendedarticles and strong absorption in the blue by sus-ended and dissolved materials. In these turbid wa-ers, R~l, z 5 02! can reach values of greater than
0.04 in the green wave band, which is significantlygreater than the corresponding values observed atother COASTlOOC and CalCOFI stations. Al-though a decrease in R~l, z 5 02! toward the redportion of the spectrum is caused primarily by theincreased absorption of pure seawater, a sharp de-crease toward shorter wavelengths indicates that theRhone and Rhine Rivers discharge large amounts ofsuspended and dissolved materials that absorbstrongly in the blue. This absorption effect is alsoreflected in high values of ^Kd~l!&1 at short wave-lengths @see solid circles, Fig. 5~b!#.
The COASTlOOC data acquired in the Atlantic arecharacterized by a gradual decrease of R~l, z 5 02!with increasing wavelength @open circles, Fig. 5~a!#,
hich is generally representative of case 1 watersith low to moderate concentrations of phytoplank-
on and covarying materials. Because the surface
Fig. 3. ~a! Spectral reflectance just beneath the sea surface and~b! the vertical attenuation coefficient for downwelling irradianceaveraged within the first attenuation layer obtained from mea-surements at CalCOFI stations: Open and solid circles, data col-lected at off-shore and near-shore stations, respectively; triangles,spectral curves intermediate between the off-shore and the near-shore spectra.
oncentration of chlorophyll a at these stations variedver a relatively wide range from 0.14 to 1.3 mg m23,
R~l, z 5 02! shows a correspondingly large variationin the blue spectral region. Similarly, ^Kd~l!&1 var-ies considerably at short wavelengths @see open cir-cles, Fig. 5~b!#. The two remaining examplesdepicted in Fig. 5 ~see triangles! represent the Med-terranean stations with little or no influence fromhone River discharge. Therefore these stations re-emble, to a certain extent, the open-ocean stations inhe Atlantic with low Chl. One remarkable differ-nce is that R~l, z 5 02! in the green spectral regionas higher values at the Mediterranean stations than
n the Atlantic. This result suggests that the rela-ive roles played by backscattering and absorption inontrolling the reflectance are different in these twoegions. The role of backscattering appears to bereater at the Mediterranean stations.Two dimensionless quantities that involve IOPs,
hat is, bya and h ~5bwyb! ranging from 0 to 10 andfrom 0 to 0.2, respectively, were used in the develop-ment of our model.1 These ranges are representa-
Fig. 4. Examples of the ~a! measured spectral absorption coeffi-cient and ~b! the backscattering coefficient averaged within thefirst attenuation layer for off-shore and near-shore CalCOFI sta-tions ~see text for details about the measurements!. These spec-tra correspond to the total absorption and backscatteringcoefficients after the contribution of pure seawater is subtracted.The pure seawater absorption and backscattering spectra are alsoshown for comparison ~dashed curves!. ~b! The solid curves cor-respond to a power function fitted to measurements of backscat-tering at six wavebands, indicated by open and solid circles. Themeasurements of absorption were made with a high spectral res-olution at 2-nm intervals.
20 May 2001 y Vol. 40, No. 15 y APPLIED OPTICS 2389
b
ysat
~p
2
tive of optical variability in most oceanic waterswithin the visible part of the spectrum and are con-sistent with ac-9 measurements at the COASTlOOCstations ~Fig. 6!. The data from ac-9 measurementsare plotted for five spectral bands that match thewave bands available with the SPMR measurementsof R~l, z 5 02! and ^Kd~l!&1. The bya ratio is gen-erally less than 10, with the exception of one stationin the immediate vicinity of the Rhine River mouthand several data points in the green collected at otherstations in turbid waters @Fig. 6~a!#. Because bya isalways greater than 1, the scattering process domi-nates the beam attenuation for the illustrated set ofdata. The parameter h is significantly lower thanthe maximal value of 0.2 used in the development ofthe model, and it shows a decrease with wavelength.The distinctive set of curves with low values of h,generally below 0.02, represents coastal waters withrelatively high turbidity.
B. Comparison of the Measured and Modeled InherentOptical Properties
For a comparison of the measured and the modeledIOPs we use the average values of a~l, z!, b~l, z!, and
b~l, z! obtained from measurements within the up-per ocean down to the first attenuation depth. For
390 APPLIED OPTICS y Vol. 40, No. 15 y 20 May 2001
the COASTlOOC stations these averages were calcu-lated from vertical profiles of a~l, z! and b~l, z! ob-tained with ac-9. For the CalCOFI stations theaveraging process was applied to the vertical profilesof bb~l, z! obtained with Hydroscat-6 and to a fewdiscrete depths for the absorption coefficient obtainedwith an onboard spectrophotometer. Because ourmodel is not intended for low Sun positions, stationswith u0 greater than 75° were excluded from the anal-sis. Although the model was developed for clearkies, some selected stations with overcast conditionsre included in this analysis. At these overcast sta-ions, u0 was ;50°. Radiative-transfer simulations
show that for such a Sun position, our model can stillbe applied regardless of whether clouds are present.
Figure 7 shows that there is reasonably good clo-sure between the modeled and the measured valuesof the absorption coefficient. If all CalCOFI andCOASTlOOC absorption data including the consid-ered wavelengths from the blue-green spectral regionare pooled together and compared with the modeledestimates, the correlation is very high ~r2 5 0.98!@Fig. 7~a!#. The average value and the standard de-viation of the relative difference between the mea-sured and the modeled estimates are 14% and 11%,respectively. Note that this comparison is made forthe absorption coefficient owing to the combined ef-fects of particulate and dissolved materials after sub-tracting the contribution of pure water, a 2 aw.The subscript w is used to denote the contribution ofure seawater.! The values of a 2 aw cover a broad
Fig. 6. Spectral values of ~a! the scattering-to-absorption ratioand ~b! the parameter h calculated from the COASTlOOC data.
Fig. 5. ~a! Spectral reflectance just beneath the sea surface and~b! the vertical attenuation coefficient for downwelling irradianceaveraged within the first attenuation layer obtained from mea-surements at selected COASTlOOC stations: open circles, datacollected in the Atlantic; solid circles, coastal waters affected bydischarge from the Rhone and the Rhine Rivers; triangles, Medi-terranean stations unaffected by the Rhone River discharge.
21
icewbe
srImdit
its
mimb
sss
gms
~
os
range from 0.002 to 0.8 m with most data between0.01 and 0.2 m21. The slope of this relationship dif-fers slightly from the value of 1 that would representthe best match between the measured and the mod-eled values. One possible reason for the observedslope is the overestimation of the measured absorp-tion coefficient that is due to the incomplete correc-tion for the scattering error.11,28 Other possibilitiesnclude errors in the measurements of light-fieldharacteristics or a tendency of the model to under-stimate absorption. In previous tests of the modelith radiative-transfer simulations, no systematicias in the absorption estimates was observed, how-ver ~see Fig. 7 in Ref. 1!.The spectra of the modeled and the measured ab-
orption coefficients within the blue-green spectralegion are compared for several stations in Fig. 7~b!.n general there is good agreement between theodel and the measurements. In some cases the
iscrepancies can be significant, especially at stationsn the Lions Gulf @dashed curve in Fig. 7~b!#. Athese stations the presence of a thin surface layer rich
n suspended particles can adversely affect the re-rieval of the absorption coefficient from the model ashown in Fig. 2.A reasonable closure is also achieved between theodeled and the measured values of the backscatter-
ng coefficient ~Fig. 8!. The comparison between theodel and measurements is made for the particulate
ackscattering, bbp 5 bb 2 bbw, where bbw is taken ashalf of the scattering coefficient of pure seawaterbw.26 Although the slope of the best fit to the data inFig. 8 is less than 1, the relative differences betweenthe modeled and the measured backscattering coeffi-cients do not exceed 20% within the examined rangeof bbp values. The average value and the standarddeviation of the relative difference are 9.5% and 6%,respectively.
In contrast to the absorption and the backscatter-ing coefficients, the differences between the modeledand the measured values of the scattering coefficientare typically large ~Fig. 9!. Even if the open-oceantations in the Atlantic are considered as a separateubset of data, the closure for the particulate-cattering coefficient, bp 5 b 2 bw, is far from
achieved @Fig. 9~b!#. The model estimates of bp areenerally much lower than the values obtained fromeasurements. Note that this discrepancy has no
ignificant effect on the retrieval of bb in this study,although b is involved in the estimation of bb from Eq.3!. The effect of b on the retrieval of bb can, how-
ever, be significant for large Sun zenith angles andhigh backscattering values ~see Fig. 4 in Ref. 1!. Thebserved bias between the modeled and the mea-ured bp is most likely associated with the effects of
the scattering phase function of particles on the per-formance of the model. Our previous study showedthat, although the retrievals of the absorption andbackscattering coefficients from the model dependweakly on the particle phase function, estimates ofthe scattering coefficient are highly sensitive to vari-ations in this function.1 Therefore, assuming thatthe measurement errors are small, the results in Fig.9 indicate that the actual particle phase functions at
Fig. 8. Comparison of the modeled and the measured particlebackscattering coefficient. All data for the blue-green wave bandsand CalCOFI stations considered in this study are included: solidline, linear regression fit to the data points; dashed line, perfectmatch between the model and measurements.
Fig. 7. ~a! Comparison of the modeled and the measured absorp-tion coefficients with the contribution of pure seawater subtracted.All data for the blue-green spectral wave bands from the CalCOFIand the COASTlOOC stations considered in this study are in-cluded: solid line, linear regression fit to the data points; dashedline, an ideal match between the measured and the modeled val-ues. ~b! Comparison of the modeled absorption spectra ~solidlines! and the measured spectral absorption coefficients ~circles,triangles! for selected stations. Dashed line, triangles, specificstation in the Lions Gulf ~see text for more details!.
20 May 2001 y Vol. 40, No. 15 y APPLIED OPTICS 2391
tctohtfba
cim
z
wttww
SaeR
p
2
the COASTlOOC stations could differ significantlyfrom the Petzold phase function used in the develop-ment of our model. The model-derived underesti-mates of bp in Fig. 9 are similar to those observedearlier when the model was tested with a theoreticalparticle phase function representing a generic assem-blage of marine organic particles ~detritus! with a lowrefractive index ~see Fig. 7 in Ref. 1!. The backscat-ering ratio of the detritus phase function was 0.0054ompared with 0.019 for the Petzold function. Thushe data in Fig. 9 could suggest that the assemblagesf suspended particles in the investigated waters ex-ibited a significantly lower probability of backscat-ering than that corresponding to the Petzold phaseunction. The ability to make such a hypothesisased on large discrepancies between the modelednd the measured bp is itself a useful result of this
closure analysis, especially because measurements ofthe scattering function are rare.
C. Estimation of a~l! and bb~l! from R~l, z 5 02!
At a given solar zenith angle u0 our model normallyrequires ^Kd~l!&1 and R~l, z 5 02! as input to thealculation of the IOP coefficients at wavelength l. Its of particular interest, however, to examine the
odel when R~l, z 5 02! is used as the only input
Fig. 9. ~a! Comparison of the modeled and measured particle-scattering coefficient. All data for the blue-green wave bands andCOASTlOOC stations considered in this study are included:short-dashed line, perfect match between the model and measure-ments. ~b! As in ~a!, but the data points are only from the Atlan-tic: long-dashed line, short-dashed line, linear regression fit tothe data points and the perfect agreement, respectively.
392 APPLIED OPTICS y Vol. 40, No. 15 y 20 May 2001
besides u0. In this case ^Kd~l!&1 must be determinedfirst from R~l, z 5 02!. Knowing both ^Kd~l!&1 andR~l, z 5 02!, we can then calculate the IOP coeffi-cients from the equations of the model in a regularway. This particular application of the model pro-vides the capability for retrieval of the IOPs fromremotely sensed ocean color. This is because R~l,
5 02! is linked to the water-leaving radiance Lw~uv,fv, l, z 5 01! in a fairly straightforward manner,27
and Lw~uv, fv, l, z 5 01! can in turn be derived fromradiance measured by a remote sensor after contri-butions from light scattering in the atmosphere andsea surface reflection are corrected.29,30 The zenithand azimuth angles, uv, fv, respectively, define theviewing direction from the point on the sea surfacebeing examined by the sensor.
The relationship between R~l, z 5 02! and Lw~uv,fv, l, z 5 01! can be written as27
LW~uV, fV, l, z 5 01!
5 RR~l, z 5 02!
Q~uV, fV, l, z 5 02!
3 Ed~l, z 5 01!, (8)
here R involves several quantities that account forhe processes of reflection and refraction of light athe air–water interface and Q is the ratio of the up-elling plane irradiance Eu~l, z 5 02! to the up-elling radiance Lu~uv9, fv9, l, z 5 02! just beneath
the surface at z 5 02. The in-air and in-water ze-nith angles, uv and uv9, respectively, are related by
nell’s law, and the azimuth angles are the same inir and water, fv 5 fv9. For many remote-sensingxperiments when uv and uv9 are relatively small and~l, z 5 02! , 0.1, a constant value of 0.54 is often
assumed for the R term.31 The factor of Q generallyranges from 3 to 6 depending on direction, wave-length, water IOPs, and sky conditions. This factorcan be estimated in case 1 waters from the proceduredeveloped by Morel and Gentili.32,33 The satellitesensor POLDER ~polarization and directionality ofthe Earth’s reflectances!, which views one ground
ixel at various angles,34 can also provide the capa-bility to estimate Q.
To estimate ^Kd~l!&1 from reflectance, we first usethe empirical relationship developed by Mueller andTrees35:
^Kd~490!&1 5 0.022 1 0.1FLWN~443!
LWN~555!G21.29966
, (9)
where LWN~l! is the normalized water-leaving radi-ance, which is approximately the water-leaving radi-ance that would exit the ocean toward the zenith inthe absence of atmosphere with the Sun at the ze-nith.30,36 LWN~l! is related to R~l, z 5 02! through
LWN~l! 5F0Rn
QnR~l, z 5 02!, (10)
3
AF
1wi
t
^
o
cfide
c
sAebitt
dee
osim
where F0 is the mean extraterrestrial solar irradi-ance and Rn and Qn are the same variables as in Eq.~8!, but in this case these values are calculated for theupwelling radiance with the direction of photontravel pointing toward the zenith and the Sun at thezenith. Combining Eqs. ~9! and ~10!, we obtain
^Kd~490!&1 5 0.022 1 0.1
FR~443, z 5 02!
R~555, z 5 02!
F0~443!
F0~555!
Rn~443!
Rn~555!
Qn~555!
Qn~443!G21.29966.
(11)
ccording to Neckel and Labs,37 the ratio F0~443!y0~555! is 1.045. The spectral ratios of Rn and Qn
can also be assumed to be close to 1. For example,the radiative-transfer simulations for chlorophyllconcentrations ranging from 0.01 to 10 mg m23 andthe Sun zenith angle of 30° show that the ratioQn~555!yQn~443! varies to within 3% in the vicinity of. To a satisfactory approximation, we can thus re-rite Eq. ~9! by using a ratio of irradiance reflectance
nstead of the normalized water-leaving radiance,
^Kd~490!&1 5 0.022 1 0.1FR~443, z 5 02!
R~555, z 5 02!G21.29966
,
(12)
and we use Eq. ~12! to calculate ^Kd~490!&1. Notehat the ^Kd~490!&1 estimate is independent of the
value of the reflectance at 490 nm. Knowing^Kd~490!&1 and R~490, z 5 02!, we can now apply ourmodel in a regular way to retrieve a and bb at 490 nm.
The next step is to calculate the spectral values ofKd~l!&1 from empirical relationships that relate
^Kd~l!&1 at a given wavelength l to ^Kd~490!&1.These relationships have the general form
^Kd~l!&1 5 A~l!^Kd~490!&1 1 B~l!, (13)
where the coefficients A~l! and B~l! are determinedfrom observations. We use the values of A~l! andB~l! established by Austin and Petzold38 in the bluespectral region at l 5 410 and 440 nm and those ofKishino et al.39 at 510 and 555 nm. @This combina-tion provides the best retrieval of ^Kd~l!&1 for thepresent set of data.# Note that these wavelengthscan represent a shift of a few nanometers comparedwith the nominal wavelengths in our radiometricmeasurements with MER-2048 and SPMR. Thisshift is negligible because the half-bandwidth in thespectral measurements is ;10 nm. The spectralvalues of ^Kd~l!&1 calculated from our measurementsf reflectance by using Eqs. ~12! and ~13! agree well
with direct determinations of ^Kd~l!&1 from our mea-surements at CalCOFI and COASTlOOC stations~Fig. 10!.
Having determined ^Kd~l!&1 from Eqs. ~12! and~13!, we can now use the model of Eqs. ~1!–~5! toalculate the absorption and the backscattering coef-cients and compare these estimates with the valuesetermined from measurements ~Fig. 11!. The mod-led and measured values of the absorption coeffi-
ient, a 2 aw, still show a significant correlation @Fig.11~a!#. However, compared with the case when bothinputs to the model, R~l, z 5 02! and ^Kd~l!&1, areobtained from measurements @see Fig. 7~a!#, thequared correlation is reduced from 0.95 to 0.75.lso, the slope of the relationship between the mod-led and the measured values is reduced significantlyelow the value of 1. The intercept of the regressions greater in Fig. 11~a! than in Fig. 7~a!. Note thathe value of the intercept in Fig. 11~a! is similar tohat for the ^Kd~l!&1 modeled versus ^Kd~l!&1 measured
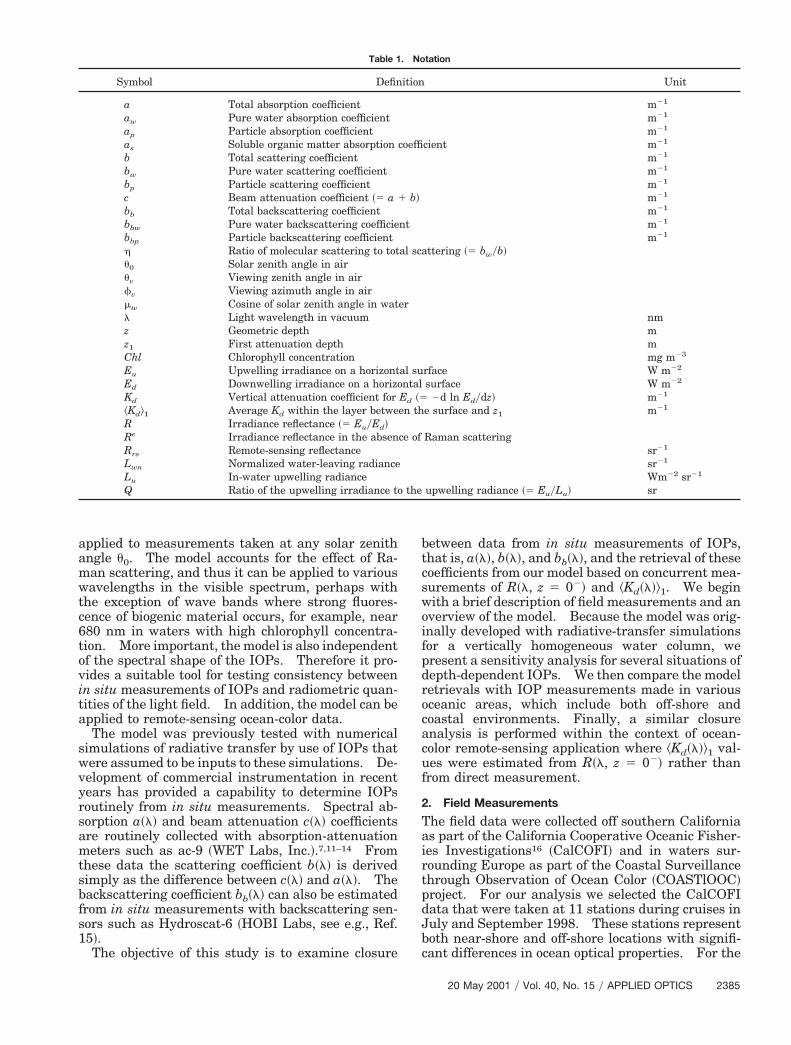
relationship in Fig. 10. Nevertheless Fig. 11~a!emonstrates that the agreement between the mod-led and the measured absorption coefficient is gen-rally good when R~l, z 5 02! is used as the only
measured input to the model. In this case, the av-erage value and the standard deviation of the relativedifference between the measured and the model val-ues are 26% and 16%, respectively.
In a similar way the results for the backscatteringcoefficient bbp are compared in Fig. 11~b!. The slopef the relationship between the modeled and the mea-ured values is 0.7, which is less than the slope shownn Fig. 8 for the case in which both inputs to the
odel, R~l, z 5 02! and ^Kd~l!&1, were taken frommeasurements. The squared correlation coefficientremains almost unchanged ~0.81!, but the interceptparameter increased by 40%. However, the relativedifference between the modeled and the measuredbbp never exceeds 30%, which is similar to the resultsin Fig. 8. The average value for this difference inFig. 11~b! is 17% ~10% for the standard deviation!compared with 9.5% in Fig. 8. We can conclude thatthe use of the estimated values of ^Kd~l!&1 from Eqs.~12! and ~13! instead of measured ^Kd~l!&1 has a rel-atively small effect on the overall agreement between
Fig. 10. Estimates of the vertical attenuation coefficient of down-welling irradiance from the three empirical models plotted versusthe values from our in situ measurements at the CalCOFI and theCOASTlOOC stations. The different symbols represent the var-ious empirical models used for specific wavelengths, as indicated:dashed line, perfect agreement between the model and observa-tions; solid line, linear regression fit to the data points. The stan-dard errors of the slope and intercept of the regression are 0.0447and 0.0112, respectively.
20 May 2001 y Vol. 40, No. 15 y APPLIED OPTICS 2393
esgbc7mI
tOtalfiL
guB
n
2
the modeled and the measured values of the back-scattering coefficient.
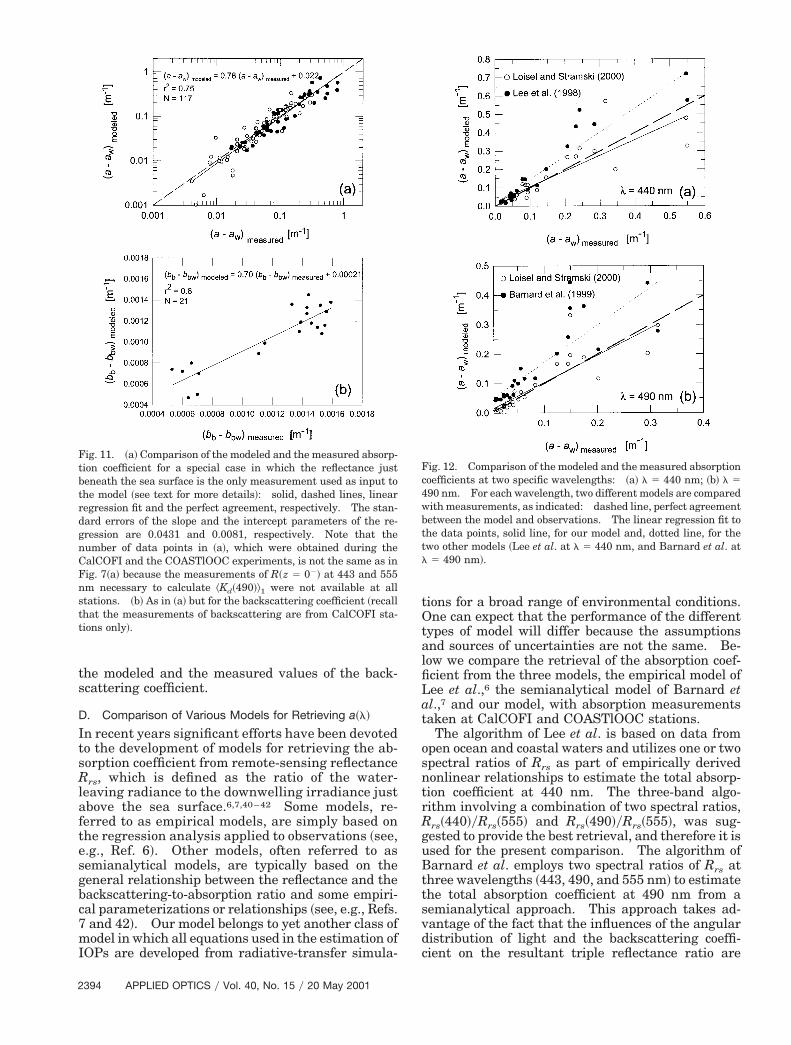
D. Comparison of Various Models for Retrieving a~l!
In recent years significant efforts have been devotedto the development of models for retrieving the ab-sorption coefficient from remote-sensing reflectanceRrs, which is defined as the ratio of the water-leaving radiance to the downwelling irradiance justabove the sea surface.6,7,40–42 Some models, re-ferred to as empirical models, are simply based onthe regression analysis applied to observations ~see,.g., Ref. 6!. Other models, often referred to asemianalytical models, are typically based on theeneral relationship between the reflectance and theackscattering-to-absorption ratio and some empiri-al parameterizations or relationships ~see, e.g., Refs.and 42!. Our model belongs to yet another class ofodel in which all equations used in the estimation of
OPs are developed from radiative-transfer simula-
Fig. 11. ~a! Comparison of the modeled and the measured absorp-tion coefficient for a special case in which the reflectance justbeneath the sea surface is the only measurement used as input tothe model ~see text for more details!: solid, dashed lines, linearregression fit and the perfect agreement, respectively. The stan-dard errors of the slope and the intercept parameters of the re-gression are 0.0431 and 0.0081, respectively. Note that thenumber of data points in ~a!, which were obtained during theCalCOFI and the COASTlOOC experiments, is not the same as inFig. 7~a! because the measurements of R~z 5 02! at 443 and 555
m necessary to calculate ^Kd~490!&1 were not available at allstations. ~b! As in ~a! but for the backscattering coefficient ~recallthat the measurements of backscattering are from CalCOFI sta-tions only!.
394 APPLIED OPTICS y Vol. 40, No. 15 y 20 May 2001
ions for a broad range of environmental conditions.ne can expect that the performance of the different
ypes of model will differ because the assumptionsnd sources of uncertainties are not the same. Be-ow we compare the retrieval of the absorption coef-cient from the three models, the empirical model ofee et al.,6 the semianalytical model of Barnard et
al.,7 and our model, with absorption measurementstaken at CalCOFI and COASTlOOC stations.
The algorithm of Lee et al. is based on data fromopen ocean and coastal waters and utilizes one or twospectral ratios of Rrs as part of empirically derivednonlinear relationships to estimate the total absorp-tion coefficient at 440 nm. The three-band algo-rithm involving a combination of two spectral ratios,Rrs~440!yRrs~555! and Rrs~490!yRrs~555!, was sug-ested to provide the best retrieval, and therefore it issed for the present comparison. The algorithm ofarnard et al. employs two spectral ratios of Rrs at
three wavelengths ~443, 490, and 555 nm! to estimatethe total absorption coefficient at 490 nm from asemianalytical approach. This approach takes ad-vantage of the fact that the influences of the angulardistribution of light and the backscattering coeffi-cient on the resultant triple reflectance ratio are
Fig. 12. Comparison of the modeled and the measured absorptioncoefficients at two specific wavelengths: ~a! l 5 440 nm; ~b! l 5490 nm. For each wavelength, two different models are comparedwith measurements, as indicated: dashed line, perfect agreementbetween the model and observations. The linear regression fit tothe data points, solid line, for our model and, dotted line, for thetwo other models ~Lee et al. at l 5 440 nm, and Barnard et al. atl 5 490 nm!.
RR
ta
N4a@ttaatwr
b
mo
ssmc
Table 2. Parameters of the Linear Regression Analysis Between the
greatly reduced. Empirical relationships betweenthe absorption at 490 nm and other wavelengths43
are involved in the algorithm. These relationshipswere developed from data collected in open ocean andcoastal waters. Although these two models were de-veloped in terms of spectral ratios of Rrs, they can alsobe applied if R~l, z 5 02! is used as input instead of
rs. Because Rrs and R are related through Rrs 5 RyQ, and both R and Q are expected to show weak
wavelength dependence ~see discussion above!, thespectral ratios of Rrs are expected to be similar to thecorresponding ratios of R. To ensure consistency inthe comparison of models and observations, we usethe appropriate spectral ratios of R as input to themodels of Lee et al.6 and Barnard et al.,7 and thevalues of R at a single wavelength are examined asinput to our model.
The models of Lee et al. and Barnard et al. show aendency to overpredict the absorption coefficient,
2 aw, if compared with the estimates from mea-surements ~Fig. 12!. For the Lee et al. model thistendency is clearly seen at higher absorption values@Fig. 12~a!#. In contrast our model shows no system-atic departure from measurements, or perhaps only aslight underprediction, although data points are sig-nificantly scattered, especially when a 2 aw is high.
ote that we have chosen to illustrate the results for40 nm in the case of the Lee et al. model @Fig. 12~a!#nd 490 nm in the case of the Barnard et al. modelFig. 12~b!#, because these models were developed forhese particular wavelengths. The parameters ofhe linear regression analysis between the modelednd the measured absorption coefficients from Fig. 12re displayed in Table 2. These parameters indicatehat our model provides generally better agreementith measurements than the other two models. The
esult that the models of Lee et al. and Barnard et al.yield estimates that are often significantly higherthan the measured values is consistent with a com-parison with a different data set from the Gulf ofCalifornia and Northeast Atlantic Shelf presented byBarnard et al.7
5. Conclusions
We previously developed an inverse model to retrievea~l!, b~l!, and bb~l! within the upper ocean from twoasic apparent optical properties, R~l, z 5 02! and
^Kd~l!&1.1 We have tested the performance of thisodel in the present study by using measurements
aThe standard error of each parameter is in parentheses.
multaneously! with the radiometric measurementsof the downwelling and upwelling plane irradi-ances. The data were collected in both the near-shore and off-shore marine environments duringCalCOFI cruises off southern California and theCOASTlOOC experiment in waters surroundingEurope. A broad range of water optical propertiesfrom clear case 1 waters to sediment-dominated andyellow substance-dominated case 2 waters was in-cluded in these measurements.
The comparison between the modeled and the mea-sured absorption and backscattering coefficientsshows generally good agreement for most environ-mental conditions experienced during the field exper-iments. An exception when the model performancewas significantly degraded was found when there is astrong stratification of the optical properties in thenear-surface layer. Nevertheless for most oceanicsituations the model offers a robust tool for estimat-ing a~l! and bb~l! from measurements of R~l, z 5 02!and ^Kd~l!&1.
The estimation of b~l! from our model is subject tomuch greater uncertainty than the retrieval of a~l!and bb~l!, which is related to the effect of the particle-cattering phase function. Compared with the initu measurements with the ac-9 instrument, theodel largely underestimates the particle-scattering
oefficient bp~l! at COASTlOOC stations. Assum-ing that the measurement errors are small, this re-sult suggests that the actual particle phase functionsin the examined waters differed significantly fromthe Petzold phase function that was used in the de-velopment of our model. We have shown that theuse of a particle phase function with lower probabilityof backscattering than that of the Petzold functionwould provide a better agreement between the mod-eled and the measured bp~l!. This result itself isinteresting because it indicates that a large system-atic difference between the modeled and the mea-sured bp~l! can provide information about the generalshape of the scattering function, which is rarely mea-sured.
One obvious application of our model is when mea-surements of IOPs are not available. Another im-portant application is for verifying the consistencybetween the IOP and the AOP measurements and thequality control of these measurements. The evalu-ation of accuracy and procedures to determine IOPsand AOPs from measurements remains an importantchallenge. For example, the absorption estimatesfrom the ac-9 measurements are subject to the poten-tial error associated with the residual scattering cor-rection.11,28 This correction can be difficult toachieve accurately, especially in turbid waters wherescattering is strong and its angular properties areunknown. Uncertainty also continues regardingpath-length amplification factors for ap~l! deter-mined with the filter-pad method. In a similar way,the determination of bb~l! from Hydroscat-6 is notdirect, because this instrument measures scatteredintensity within a relatively narrow range of scatter-ing angles near 140°, which is then used to estimate
20 May 2001 y Vol. 40, No. 15 y APPLIED OPTICS 2395
15
rt
ro
Ntaio
O~CRIdtwE0HOfttRddtcaA
ing coefficients of natural waters: homogeneous waters,”
2
bb~l!. Thus attempts to understand discrepanciesof closure between measurements and models contin-ues to be important.
We have also tested the model within the context ofthe potential application to remote sensing. In thiscase the only measured apparent optical propertyused as input to the model is the irradiance reflec-tance R~l, z 5 02!. The other apparent property^Kd~l!&1 is derived from reflectance when empiricalelationships are used. Our model equations arehen applied to estimating a~l! and bb~l!. Such an
analysis showed that the model still provides reason-able values of a~l! and bb~l!, although the quality ofetrieval appears to be reduced compared with theriginal model when both input AOPs, R~l, z 5 02!
and ^Kd~l!&1, are taken directly from measurements.evertheless these results are encouraging because
hey suggest the potential to derive informationbout the distribution of inherent optical propertiesn the surface ocean from the satellite imagery ofcean color.
This research was supported by the Environmentalptics Program of the U.S. Office of Naval Research
grant N00014-98-1-0003!. Support for the Cal-OFI data was provided by the U.S. Office of Navalesearch ~N00014-98-1-0247! and the NASA Sensor
ntercomparison and Merger for Biological and Inter-isciplinary Oceanic Studies ~SIMBIOS! project con-ract NAS5-97130. Support for COASTlOOC dataere provided by the European Commission programnvironment and Climate ~contract ENV4-CT96-310!. We acknowledge the crew of the R.V. Victorensen and R.V. Thethys II. We are grateful to G.bolensky for help in collecting data and D. Doxaran
or assistance with data processing. We especiallyhank M. Wernand for the loan of ac-9. The shipime was made available by the Centre National de laecherche Scientifique ~Paris! and Institut Nationales Sciences de l’Univers for the Thetys II, by Ree-ereigemeinschaft Forschungsschiffahrt GmgH forhe R.V. Victor Hensen. Ship time for the CalCOFIruises was supported by the University of Californiat San Diego and National Oceanic and Atmosphericdministration.
References1. H. Loisel and D. Stramski, “Estimation of the inherent optical
properties of natural waters from irradiance attenuation coef-ficient and reflectance in the presence of Raman scattering,”Appl. Opt. 39, 3001–3011 ~2000!.
2. H. R. Gordon, “Absorption and scattering estimates from irra-diance measurements: Monte Carlo simulations,” Limnol.Oceanogr. 36, 769–777 ~1991!.
3. J. T. O. Kirk, “Estimation of the absorption and scatteringcoefficient of natural waters by use underwater irradiancemeasurements,” Appl. Opt. 33, 3276–3278 ~1994!.
4. C. S. Roesler and M. J. Perry, “In situ phytoplankton absorp-tion, fluorescence emission, and particulate backscatteringspectra determined from reflectance,” J. Geophys. Res. 100,13,274–13,294 ~1995!.
5. H. R. Gordon and G. C. Boynton, “Radiance-irradiance inver-sion algorithm for estimating the absorption and backscatter-
396 APPLIED OPTICS y Vol. 40, No. 15 y 20 May 2001
Appl. Opt. 36, 2636–2641 ~1997!.6. Z. P. Lee, K. L. Carder, R. G. Steward, T. G. Peacock, C. O.
Davis, and J. S. Patch, “An empirical ocean color algorithm forlight absorption coefficients of optically deep waters,” J. Geo-phys. Res. 103, 27,967–27,978 ~1998!.
7. A. H. Barnard, J. R. V. Zaneveld, and W. S. Pegau, “In situdetermination of the remotely sensed reflectance and the ab-sorption coefficient: closure and inversion,” Appl. Opt. 38,5108–5117 ~1999!.
8. M. Stramska, D. Stramski, B. G. Mitchell, and C. D. Mobley,“Estimation of the absorption and backscattering coefficientsfrom in-water radiometric measurements,” Limnol. Oceanogr.45, 628–641 ~2000!.
9. R. A. Leathers, C. S. Roesler, and N. J. McCornick, “Oceaninherent optical property determination from in-water lightfield measurements,” Appl. Opt. 38, 5096–5103 ~1998!.
10. H. R. Gordon and G. C. Boynton, “Radiance-irradiance inver-sion algorithm for estimating the absorption and backscatter-ing coefficients of natural waters: vertically stratified waterbodies,” Appl. Opt. 37, 3886–3896 ~1998!.
11. A. Bricaud, C. Roesler, and J. R. V. Zaneveld, “In situ methodsfor measuring the inherent optical properties of ocean waters,”Limnol. Oceanogr. 40, 393–410 ~1995!.
12. M. Sydor and R. A. Arnone, “Effects of suspended particulateand dissolved organic matter on remote sensing of coastal andriverine waters,” Appl. Opt. 36, 6905–6912 ~1997!.
13. J. A. Barth and D. J. Bogucki, “Spectral light absorption andattenuation measurements from a towed undulating vehicle,”Deep Sea Res. 47, 323–342 ~2000!.
14. H. Claustre, F. Fell, K. Oubelkheir, L. Prieur, A. Sciandra, B.Gentili, and M. Babin, “Continuous monitoring of surface op-tical properties across a geostrophic front: biogeochemicalinferences,” Limnol. Oceanogr. 45, 309–421 ~2000!.
15. R. A. Maffione and D. R. Dana, “Recent measurements of thespectral backward scattering coefficient in coastal waters,” inOcean Optics XIII, S. G. Ackleson, ed., Proc. SPIE 2963, 154–159 ~1996!.
16. B. G. Mitchell and M. Kahru, “Algorithms for Sea WIFS de-veloped with the CalCOFI data set,” CalCOFI Rep. 39 ~Cal-FOFI, La Jolla, Calif., 1998!.
17. R. M. Pope and E. S. Fry, “Absorption spectrum ~380–700 nm!of pure water. II. Integrating cavity measurements,” Appl.Opt. 36, 8710–8723 ~1997!.
18. B. G. Mitchell, “Algorithm for determining the absorption co-efficient of aquatic particulate using the quantitative filtertechnique ~QFT!,” in Ocean Optics X, R. W. Spinrad, ed., Proc.SPIE 1302, 137–148 ~1990!.
19. A. Bricaud, A. Morel, and L. Prieur, “Absorption by dissolvedorganic matter of the sea ~yellow substance! in the UV andvisible domains,” Limnol. Oceanogr. 26, 43–53 ~1981!.
20. C. D. Mobley, Hydrolight 4.0 User’s Guide ~Sequoia Scientific,Mercer Island, Wash., 1998!.
21. M. R. Lewis, J. J. Cullen, and T. Platt, “Phytoplankton andthermal structure in the upper ocean: consequences of non-uniformity in chlorophyll profile,” J. Geophys. Res. 88, 2565–2570 ~1983!.
22. T. Platt, S. Sathyendranath, C. M. Caverhill, and M. R. Lewis,“Ocean primary production and available light: further algo-rithms for remote sensing,” Deep-Sea Res. 35, 855–879 ~1988!.
23. A. Morel and B. Gentili, “Diffuse reflectance of oceanic waters:Its dependence on Sun angles as influenced by the molecularscattering contribution,” Appl. Opt. 30, 4427–4438 ~1991!.
24. H. Loisel and A. Morel, “Light scattering and chlorophyll con-centration in case 1 waters: a reexamination,” Limnol.Oceanogr. 43, 847–858 ~1998!.
25. J. C. Kitchen and J. R. V. Zaneveld, “On the noncorrelation of
the vertical structure of light scattering and chlorophyll a in WIFS Technical Report Series, Nasa Tech. Memo. 104566, Vol.
case 1 waters,” J. Geophys. Res. 95, 20,237–20,246 ~1990!.
26. A. Morel, “Optical properties of pure water and pure seawa-ter,” in Optical Aspects of Oceanography, N. G. Jerlov and E.Steeman Nielsen, eds. ~Academic, London, 1974!, pp. 1–24.
27. C. D. Mobley, Light and Water: Radiative Transfer in Natu-ral Waters ~Academic, San Diego, Calif., 1994!.
28. J. R. V. Zaneveld, J. C. Kitchen, and C. C. Moore, “Scatteringerror correction of the reflecting tube absorption meter,” inOcean Optics XII, J. S. Jaffe, ed., Proc. SPIE 2258, 44–55~1994!.
29. H. R. Gordon, “Removal of atmospheric effects from satelliteimagery of the oceans,” Appl. Opt. 17, 1631–1636 ~1978!.
30. H. R. Gordon, “Atmospheric correction of ocean color imageryin the Earth Observing System era,” J. Geophys. Res. 102,17,081–17,106 ~1997!.
31. R. W. Austin, “The remote sensing of spectral radiance frombelow the ocean surface,” in Optical Aspects of Oceanography,N. G. Jerlov and E. Steeman Nielsen, eds. ~Academic, London,1974!, pp. 317–344.
32. A. Morel and B. Gentili, “Diffuse reflectance of oceanic waters.II. Bidirectional aspects,” Appl. Opt. 32, 6864–6879 ~1993!.
33. A. Morel and B. Gentili, “Diffuse reflectance of oceanic waters.III. Implication of bidirectionality for the remote-sensing prob-lem,” Appl. Opt. 35, 4850–4862 ~1996!.
34. P. Y. Deschamps, F. M. Breon, M. Leroy, A. Podaire, A. Bri-caud, J. C. Buriez, and G. Seze, “The POLDER mission: in-strument characteristics and scientific objectives,” IEEETrans. Geosci. Remote Sens. 32, 598–615 ~1994!.
35. J. L. Mueller and C. Trees, “Revised Sea WIFS prelaunchalgorithm for diffuse attenuation coefficient K~490!,” Sea
41, S. B. Hooker and E. R. Firestone, eds. ~NASA GoddardSpace Flight Center, Greenbelt, Md., 1997!, pp. 18–21.
36. H. R. Gordon and D. K. Clark, “Clear water radiances foratmospheric correction of Coastal Zone Color Scanner imag-ery,” Appl. Opt. 16, 2257–2260 ~1977!.
37. H. Neckel and D. Labs, “The solar radiation between 3300 and12500 Å,” Solar Phys. 90, 205–258 ~1984!.
38. R. W. Austin and T. J. Petzold, “The determination of thediffuse attenuation coefficient of sea water using the CoastalZone Color Scanner,” in Oceanography from Space, J. F. R.Gower, ed. ~Plenum, New York, 1981!, pp. 239–256.
39. M. Kishino, J. Ishizaka, H. Satoh, K. Kusaka, S. Saitoh, T.Miyoi, and K. Kawasaki, “Optical characteristics of sea waterin the north Pacific ocean,” in Ocean Optics XIII, S. G. Acklesonand R. Frouin, eds., Proc. SPIE 2963, 173–178 ~1996!.
40. F. E. Hoge and P. E. Lyon, “Satellite retrieval of inherentoptical properties by linear inversion of oceanic radiance mod-els: an analysis of model and radiance measurement errors,”J. Geophys. Res. 101, 16,631–16,648 ~1996!.
41. M. Sydor, R. A. Arnone, R. W. Gould, Jr., G. E. Terrie, S. D.Ladner, and C. G. Wood, “Remote-sensing technique for deter-mination of the volume absorption coefficient of turbid water,”Appl. Opt. 37, 4944–4950 ~1998!.
42. K. L. Carder, F. R. Chen, Z. P. Lee, and S. Hawes, “Semiana-lytic modis algorithms for chlorophyll-a and absorption withbio-optical domains based on nitrate-depletion temperatures,”J. Geophys. Res. 104, 5403–5421 ~1999!.
43. A. H. Barnard, W. S. Pegau, and J. R. V. Zaneveld, “Globalrelationships of the inherent optical properties of the oceans,”J. Geophys. Res. 103, 24,955–24,968 ~1998!.
20 May 2001 y Vol. 40, No. 15 y APPLIED OPTICS 2397