82 HAZARDOUS SOLID WASTE TESTING: FIRST CONFERENCE Acknowledgment The authors would like to acknowledge the American Electric Power Service Corporation for support of this work and for permission to publish this account. References II] Thompson. D. W .• "Elutriate Test Evaluation of Chemically Stabilized Waste Materials:' EPA-600/2-79-154. U.S. Environmental Protection Agency. MERL. Cincinnati, Ohio. July 1979. [2] Bause, D. E. and McGregor. K. T .• "Comparison of Four Leachate Generation Procedures for Solid Waste Characterization in Environmental Assessment Programs," 60017-80-118. U.S. Environmental Protection Agency. IERL. Research Triangle Park. N.C.. May 1980. [J] Ham. R K., Anderson, M. A., Stegmann, R., and Stanforth, R .. "Background Study on the Development of a Standard Leaching Test," EPA-600/2-79-109, U.S. Environmental Protection Agency. Cincinnati, Ohio, May 1979. [4] Ham, R K., Anderson, M. A., Stegmann, R., and Stanforth, R, "Comparison of Three Waste Leaching Tests," EPA-600!2-79-071, U.S. Environmental Protection Agency. MERL, Cincinnati, Ohio, July 1979. [5] Lowenbach, W., "Compilation and Evaluation of Leaching Test Methods," EPA- 600/2-78-095, U.S_ Environmental Protection Agency, MERL, Cincinnati, Ohio, May 1978. [6] Gulledge, W. P. and Webster, W. c., "ASTM Leachate Test Evaluation Program," EPRI FP-1183, RP 1260-6, Electric Power Research Institute, Sept. 1979. [7] Weaver, V. E. and Jackson, L. P., "Analysis of Selected Trace Metals in Leachate from Selected Fossil Energy Materials." U.S. Department of Energy and American Society for Testing Materials. Jan. 1980. [8J California Assessment Manual/or Hazardous Wastes. California Department of Health Ser- vices, Hazardous Materials Management Section, Sacramento, Calif., Aug. 1979. [9] Annual Book oj ASTM Standards, Part 31, American Society for Testing and Materials. 1979. [10) "Hazardous Waste Guidelines and Regulations," proposed by the U. S. Environmental Pro- tection Agency, Federal Register, Part IV, Dec. 18, 1978. II il Standard Methods for the Examination of Water and Wastewater, 14th ed., American Public Health Association, New York, N.Y., 1975. [12] "Methods for Chemical Analysis of Water and Wastes," EPA-SOO/4-79-020, U.S. En- vironmental Protection Agency, Cincinnati, Ohio,_ March 1979. [IJ] MHS-IO Hydride System Manual, Perkin-Elmer Corp., Norwalk, Connecticut, Feb. 1979. [14] Lee, G. F_ and Plumb, R. H., "Literature Review on Research Study for the Development of Dredged Material Disposal Criteria," Contract Report D-74-1, Office of Dredged Material Research, U.S. Army Engineers Waterways Experiment Station, Vicksburg, Miss., 1974. [IS] Weeter, D. W. and Niece, J. E., Proceedings, 29th Industrial Waste Conference, Purdue University, Lafayette, Ind .. May 1974, p. 420. K. Jackson, I J. Benedik, I and L. Jackson I Comparison of Three Solid Waste Batch Leach Testing Methods and a Column Leach Test Method REFERENCE: Jackson, K., Benedik, 1., and Jackson, L., "Comparison of Three Solid Wast. Batch Leach Testing Methods and a Column Leach Test Method," Hazardous Solid Waste Testing: First Conference, ASTM STP 760, R A. Conway and B_ C. Malloy, Eds., American Society for Testing and Materials, 1981, pp. 83-98. ABSTRACT: As a participant in the American Society for Testing and Materials (ASTM) program evaluating U_S. Environmental Protection Agenc), (EPA) and ASTM solid waste extraction procedures, the Laramie Energy Technology Center of the U.S. Department of Energy has been conducting a study comparing various aspects of batch versus column extraction techniques. This study evaluates three batch extraction meth· ods and compares these results with results obtained from column leach tests. A standard fly ash material was leached using three types of mixers, five liquid-to-solid ratios, and leach times ranging from 1 h to 96 h. The leachates were analyzed using an atomic absorption spectrophotometer equipped with a graphite furnace for the following metals: selenium, chromium, arsenic, lead, and cadmium. The pH was also determined on all the leachate samples. The data show that the batch test can be improved by increasing the Iiquid-to-solid ratio. The data also indicate that the leaching time can be decreased. Comparison of the data from the batch and column leach tests indicates that a correlation may exist. KEY WORDS: leaching, trace metals, extraction, leachate, batch, column, EPA, ASTM, NBS, mixer, hazardous solid waste For the past two years. the Laramie Energy Technology Center has worked with the American Society for Testing and Materials (ASTM) to develop a leaching test for solid wastes. During those two years, each time the committee on solid wastes met, many of the same problems concerning the proposed method would surface, Four of those issues were: defining the opti- mum liquid-to-solid ratio; whether a 48 h leach time is necessary; whether the platform shaker does an adequate job of mixing; and finally, how the batch test relates to "real world" conditions. I science technician, U.S. Department of Energy, Laramie Energy Technology Center, laramIe, Wyo. 82071. 83
Transcript
82 HAZARDOUS SOLID WASTE TESTING: FIRST CONFERENCE
Acknowledgment
The authors would like to acknowledge the American Electric Power Service Corporation for support of this work and for permission to publish this
account.
References
II] Thompson. D. W .• "Elutriate Test Evaluation of Chemically Stabilized Waste Materials:' EPA-600/2-79-154. U.S. Environmental Protection Agency. MERL. Cincinnati, Ohio. July 1979.
[2] Bause, D. E. and McGregor. K. T .• "Comparison of Four Leachate Generation Procedures for Solid Waste Characterization in Environmental Assessment Programs," EPA~ 60017-80-118. U.S. Environmental Protection Agency. IERL. Research Triangle Park. N.C.. May 1980.
[J] Ham. R K., Anderson, M. A., Stegmann, R., and Stanforth, R .. "Background Study on the Development of a Standard Leaching Test," EPA-600/2-79-109, U.S. Environmental Protection Agency. Cincinnati, Ohio, May 1979.
[4] Ham, R K., Anderson, M. A., Stegmann, R., and Stanforth, R, "Comparison of Three Waste Leaching Tests," EPA-600!2-79-071, U.S. Environmental Protection Agency. MERL, Cincinnati, Ohio, July 1979.
[5] Lowenbach, W., "Compilation and Evaluation of Leaching Test Methods," EPA-600/2-78-095, U.S_ Environmental Protection Agency, MERL, Cincinnati, Ohio, May 1978.
[6] Gulledge, W. P. and Webster, W. c., "ASTM Leachate Test Evaluation Program," EPRI FP-1183, RP 1260-6, Electric Power Research Institute, Sept. 1979.
[7] Weaver, V. E. and Jackson, L. P., "Analysis of Selected Trace Metals in Leachate from Selected Fossil Energy Materials." U.S. Department of Energy and American Society for Testing Materials. Jan. 1980.
[8J California Assessment Manual/or Hazardous Wastes. California Department of Health Services, Hazardous Materials Management Section, Sacramento, Calif., Aug. 1979.
[9] Annual Book oj ASTM Standards, Part 31, American Society for Testing and Materials. 1979.
[10) "Hazardous Waste Guidelines and Regulations," proposed by the U. S. Environmental Protection Agency, Federal Register, Part IV, Dec. 18, 1978.
II il Standard Methods for the Examination of Water and Wastewater, 14th ed., American Public Health Association, New York, N.Y., 1975.
[12] "Methods for Chemical Analysis of Water and Wastes," EPA-SOO/4-79-020, U.S. Environmental Protection Agency, Cincinnati, Ohio,_ March 1979.
[IJ] MHS-IO Hydride System Manual, Perkin-Elmer Corp., Norwalk, Connecticut, Feb. 1979. [14] Lee, G. F_ and Plumb, R. H., "Literature Review on Research Study for the Development of
Dredged Material Disposal Criteria," Contract Report D- 74-1, Office of Dredged Material Research, U.S. Army Engineers Waterways Experiment Station, Vicksburg, Miss., 1974.
[IS] Weeter, D. W. and Niece, J. E., Proceedings, 29th Industrial Waste Conference, Purdue University, Lafayette, Ind .. May 1974, p. 420.
K. Jackson, I J. Benedik, I and L. Jackson I
Comparison of Three Solid Waste Batch Leach Testing Methods and a Column Leach Test Method
REFERENCE: Jackson, K., Benedik, 1., and Jackson, L., "Comparison of Three Solid Wast. Batch Leach Testing Methods and a Column Leach Test Method," Hazardous Solid Waste Testing: First Conference, ASTM STP 760, R A. Conway and B_ C. Malloy, Eds., American Society for Testing and Materials, 1981, pp. 83-98.
ABSTRACT: As a participant in the American Society for Testing and Materials (ASTM) program evaluating U_S. Environmental Protection Agenc), (EPA) and ASTM solid waste extraction procedures, the Laramie Energy Technology Center of the U.S. Department of Energy has been conducting a study comparing various aspects of batch versus column extraction techniques. This study evaluates three batch extraction meth· ods and compares these results with results obtained from column leach tests.
A standard fly ash material was leached using three types of mixers, five liquid-to-solid ratios, and leach times ranging from 1 h to 96 h. The leachates were analyzed using an atomic absorption spectrophotometer equipped with a graphite furnace for the following metals: selenium, chromium, arsenic, lead, and cadmium. The pH was also determined on all the leachate samples.
The data show that the batch test can be improved by increasing the Iiquid-to-solid ratio. The data also indicate that the leaching time can be decreased. Comparison of the data from the batch and column leach tests indicates that a correlation may exist.
For the past two years. the Laramie Energy Technology Center has worked with the American Society for Testing and Materials (ASTM) to develop a ~tandard leaching test for solid wastes. During those two years, each time the committee on solid wastes met, many of the same problems concerning the proposed method would surface, Four of those issues were: defining the optimum liquid-to-solid ratio; whether a 48 h leach time is necessary; whether the platform shaker does an adequate job of mixing; and finally, how the batch test relates to "real world" conditions.
I Ph~sical science technician, U.S. Department of Energy, Laramie Energy Technology Center, laramIe, Wyo. 82071.
83
84 HAZARDOUS SOLID WASTE TESTING: FIRST CONFERENCE
At the ASTM 034 summer meeting in 1980, the batch leach testing task group decided to conduct a mini-round robin study to test some improvements which had been suggested for ASTM Method A. To conduct this study, it was necessary to answer the first three problems. A research project was set up to try to provide solutions to all four problems. It was not the intent or purpose of this project to find the mechanism or the chemical processes by which the leaching is accomplished.
From past work it was determined that it would be necessary to investigate several variables (such as various liquid-to-solid ratios, multiple leach times, and three types of mixers) in order to answer the first three problems. In an attempt to solve the fourth problem, the batch test was compared with a column test. This column test was chosen to try to simulate real world conditions. an effluent from a fly ash disposal site. The fly ash chosen for this program was the standard fly ash that we have used in past studies,2 The batch test procedures employed were all similar in nature to the ASTM Proposed Methods for Leaching of Waste Materials, Method A.J The column test used is one that U.S. Environmental Protection Agency (EPA) researchers have used for a number of years. 4
Experimental
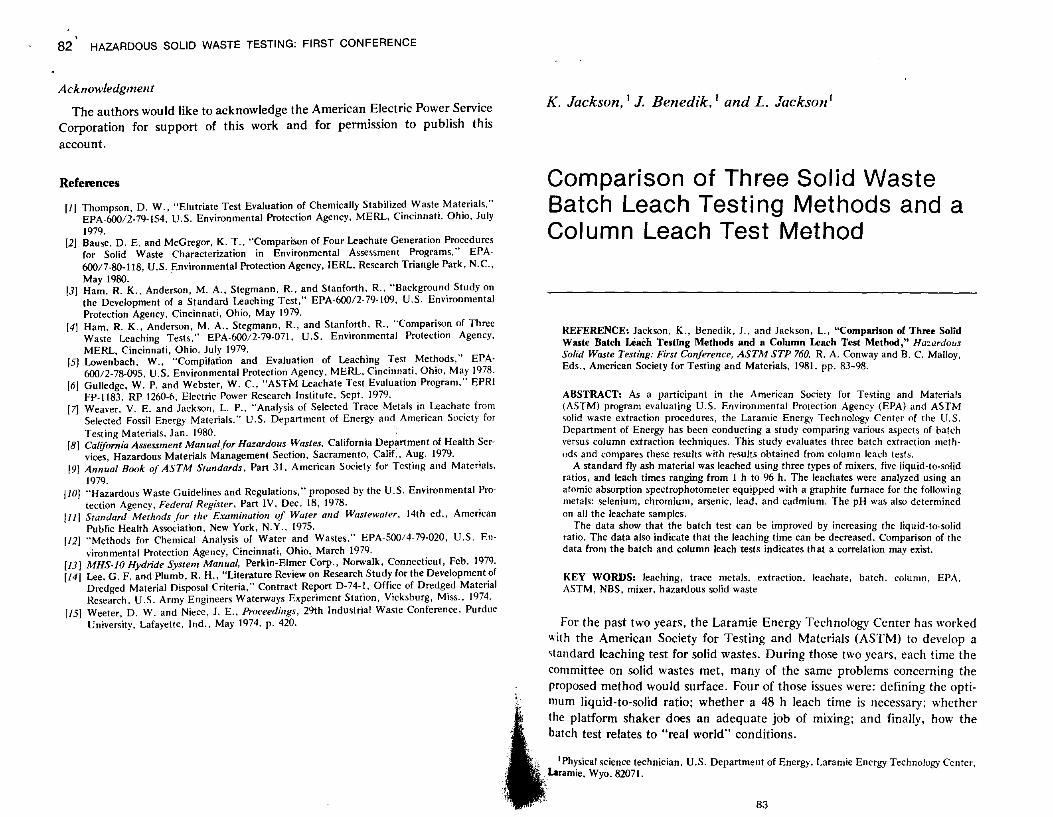
The experimental apparatus used for the batch studies is shown in Figs. and 2. Figure 1 shows both the platform shaker and the roller mill. The platform shaker has been adapted to handle up to 12 extraction containers, and was operated at 70 cpm. Herein, it is referred to as the ASTM mixer. Figure 2 shows the mixer that was designed and built by the National Bureau of Standards (NBS). This is a single-speed mixer which turns at 29 rpm. Figure 3 shows the roller mill, which was operated at both 10 and 20 rpm. The batch tests were conducted using the three mixers, varying the liquid-to-solid ratios from 4/1 to 80/1 and the leach time from 1 h to 96 h (Table 1). The extractions were carried out using distilled water as the leaching fluid. The volume of liquid was held constant at 1400 ml and the solids weight was varied to obtain the different liquid-to-solid ratios. At the end of the stated leach times the entire sample was placed in a pressure filtration apparatus equipped with a 0.45 ILm fiber glass filter, and filtered using a pressure of 275 Pa (40 psi). The pH of the sample was determined and then adjusted to a pH of 2.0 using distilled nitric acid (HNOJ).
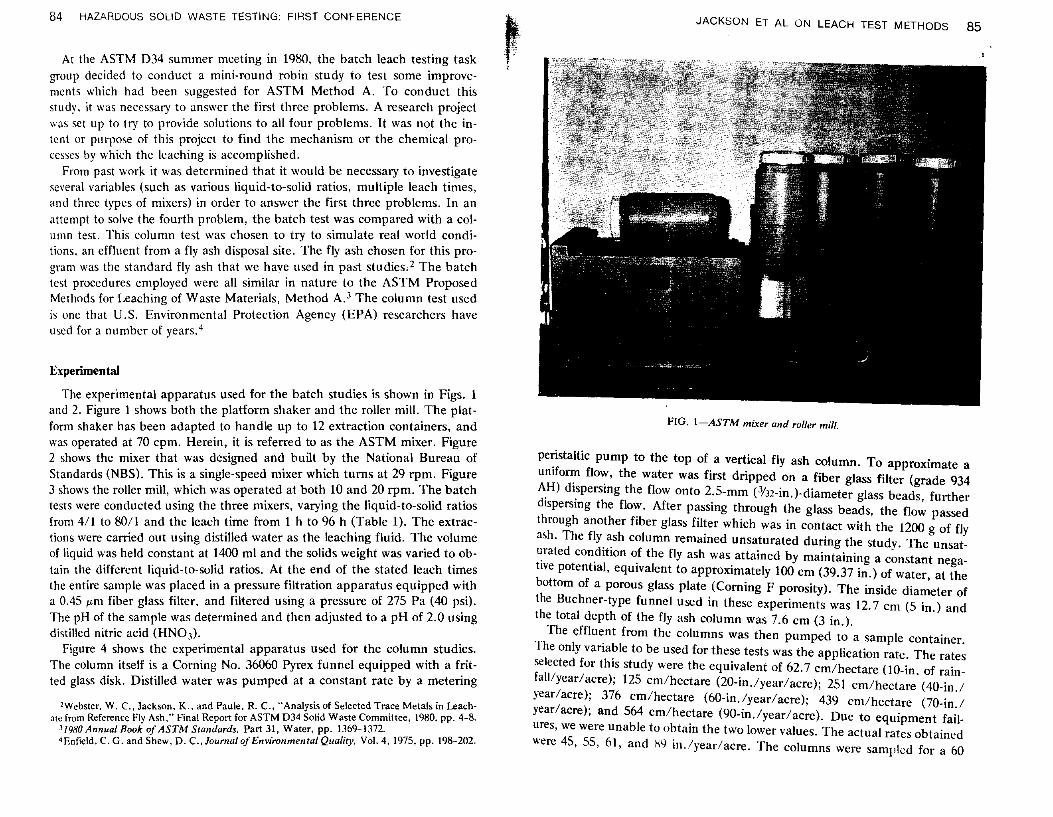
Figure 4 shows the experimental apparatus used for the column studies. The column itself is a Corning No. 36060 Pyrex funnel equipped with a fritted glass disk. Distilled water was pumped at a constant rate by a metering
2Webster, W. c., Jackson, K., and Paule. R. C., "Analysis of Selected Trace Metals in leachate from Reference Fly Ash." Final Report for ASTM 034 Solid Waste Committee. 1980. pp. 4-8.
) 1980 AmlUal Book of ASTM Standards. Part 31, Water, pp. 1369-1372. 4 Enfield, C. G. and Shew. D. c., lournal of Environmental Quality, Vol. 4, 1975, pp. 198-202.
JACKSON ET AL ON LEACH TEST METHODS 85
FIG. 1-ASTM mixer and rolIer mill.
pe~staltic pump to the top of a vertical fly ash column. To approximate a unifon:n flo,:, the water was first dripped on a fiber glass filter (grade 934 ~H) dl,spersmg the flow onto 2.5-mm (J1J2-in,)-diameter glass beads, further dtspersmg the flo,:. After passing through the glass beads, the flow passed through another fIber glass fil~er which was in contact with the 1200 g of fly ash. The fly. ~sh column remamed unsaturated during the study. The unsat~rated con.dltton ~f the fly ash was attained by maintaining a constant negaltve potentIal, equIvalent to approximately 100 cm (39.37 in.) of water, at the bottom of a porous glass plate (Corning F porosity). The inside diameter of the Buchner-type funnel used in these experiments was 12.7 em (5 in.) and the total depth of the fly ash column was 7.6 cm (3 in.).
The eff\u~nt from the columns was then pumped to a sample container. The only vanable to be used for these tests was the application rate. The rates selected for this study were the equivalent of 62.7 cm/hectare (lO-in. of rainfall/year/acre); 125 em/hectare (20-in.!year/aere); 251 em/hectare (40-in./ year/acre); 376 cm/hectare (60-in./year/acre); 439 em/hectare (70-in.! year/acre); and S64 cm/hectare (90-in./year/acre). Due to equipment failures, we were unable to obtain the two lower values. The actual rates obtained were 45, 55, 61, and X9 in.lyear/acre. The columns were sampled for a 60
~ HAZARDOUS SOLID WASTE TESTING: FIRST CONFERENCE
FIG. 2-NBS mixer.
day period and analyzed for the following parameters: pH, selenium, chromium, arsenic, lead, and cadmium. All of the metal analyses were performed using an atomic absorption spectrophotometer equipped with a graphite furnace. The metals analyses were carried out using the standard addition technique and all determinations were done in duplicate.s In addition to these quality-control procedures, every fourth sample was analyzed in duplicate and at different dilution ratios.
Results and Discussion
Two of the main considerations used to evaluate the batch tests were internal consistency of the data and reproducibility of the results.
Throughout the batch tests, the pH of the leachates varied from 9.2 to 10.4 (Table 2). The selenium results are shown in Table 3. The results show that after 1 h of leaching, time does not play an important role. As the Iiquid-tosolid ratio increases, the amount of selenium leached per gram of sample also increases. The same general trends were noted for both the NBS and roller
sU.S. Environmental Protection Agency, "Methods for Chemical Analysis for Water and Waste," March 1979.
JACKSON ET AL ON LEACH TEST METHODS 87
FIG. J-Experimenta/ apparatus used for column studies.
mill mixers: even though larger concentrations of selenium were leached using the NBS mIxer. For the four highest Iiquid-to-solid ratios, the roller mill mixer yielded the most consistent results of the three mixers, while the ASTM mixer gave the least consistent results.
One explanation of these results is the difference in agitation given the sample by. the three typ~s of mixers. The ASTM mixer, operated at 70 cpm, does not gIVe enough agItation to keep the sample mixed. On the other hand, th.e .NBS ~ixer probably causes some particle abrasion because of its rigorous mlxmg actIon. The roller mill gives a gentle but complete mixing of the sample resulting in the most consistent results.
Table 4 shows the results for the chromium determinations. It was found that after 6 h leach time, there was not a significant time relationship for any of the mixers. It should be noted that the same correlation exists for chrol~lium as for ~elenium. As the Iiquid-to-solid ratio increased, the concentration of chromIUm leached per gram of sample used also increased. Cadmium and lead were present in such low concentrations that they were of little value in evaluating the methods; therefore, they have been omitted.
Table 5 shows the last of the four parameters, arsenic. Examination of the results obtained, using the ASTM and NBS mixers, indicates that after 12 h
88 HAZARDOUS SOLID WASTE TESTING: FIRST CONFERtoNGc
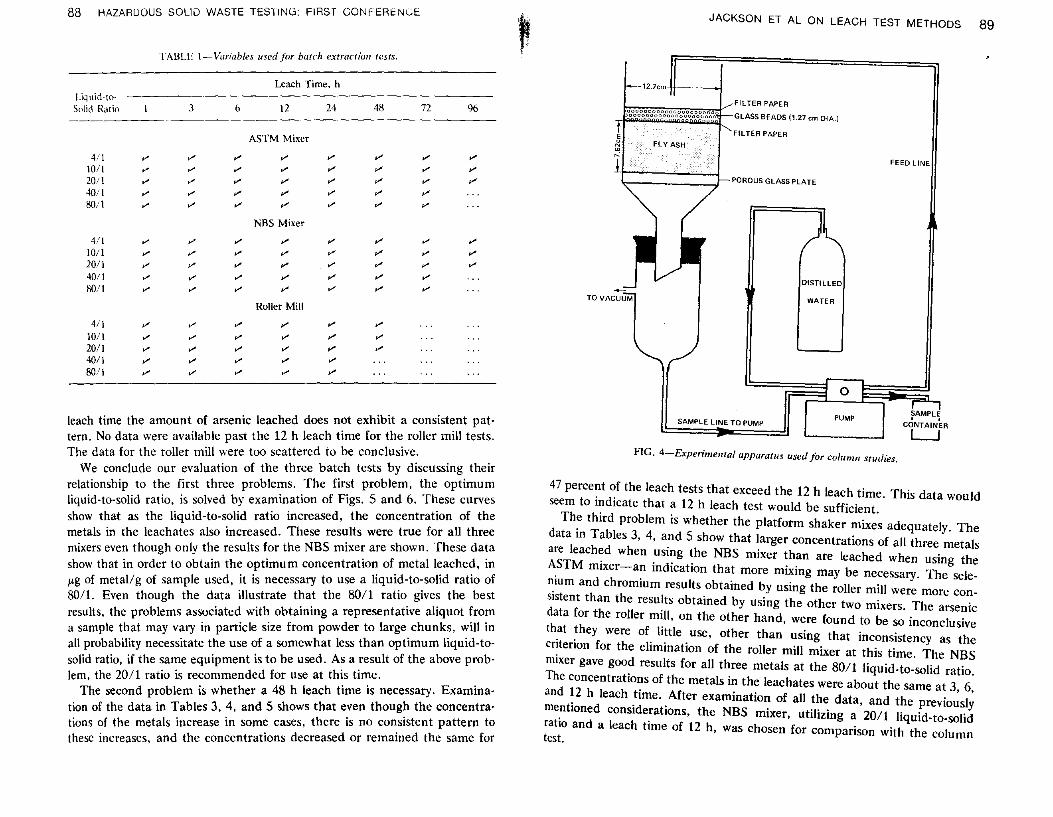
r ABLE 1-Variables used jor batch extraction tests.
Leach Time, h Liquid-to-Solid Ratio 3 6 12 24 48 72 96
ASTM Mixer
4/1 v v v v v v v v 1011 v v v v v v v v 20/1 v v v v v v v v 40/1 v v v v v v v SOil v v v v v v v
NBS Mixer
411 V' V' v v V' V' V V'
lOll V' v v v v v v v 2011 v v V' v v v v V'
40/1 v v V' V' V' V' V'
8011 v V' V' V' V' V' V'
Roller Mill
411 V' v V' V' V' V'
lOll v V' V' V' V' V'
2011 v V' V' V' V' V'
4011 V' V' V' V' V'
SOil V' v V' V' V'
leach time the amount of arsenic leached does not exhibit a consistent pattern, No data were available past the 12 h leach time for the roller mill tests, The data for the roller mill were too scattered to be conclusive,
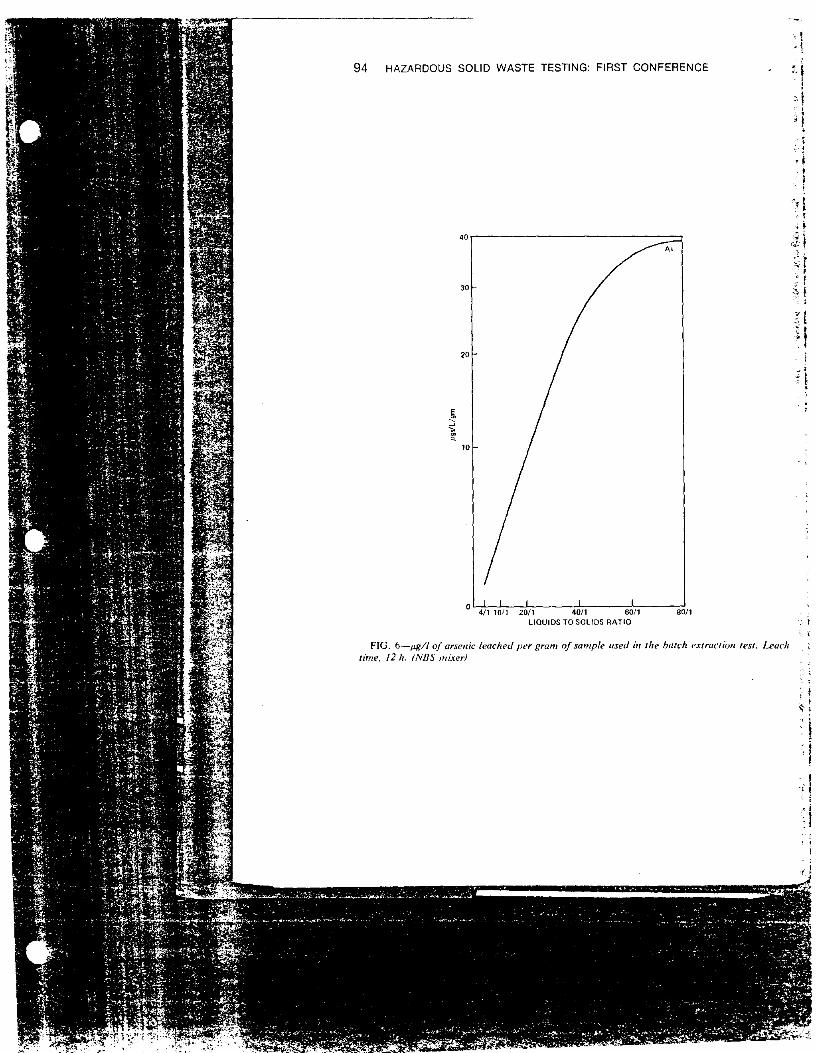
We conclude our evaluation of the three batch tests by discussing their relationship to the first three problems, The first problem, the optimum liquid-to-solid ratio, is solved by examination of Figs, 5 and 6, These curves show that as the Iiquid-to-solid ratio increased, the concentration of the metals in the leachates also increased, These results were true for all three mixers even though only the results for the NBS mixer are shown, These data show that in order to obtain the optimum concentration of metal leached, in Ilg of metal/g of sample used, it is necessary to use a Iiqui~-to:solid ratio of 80/1. Even though the data illustrate that the BO/1 raho gIVes the best results, the problems associated with obtaining a representative aliquot ~ro~ a sample that may vary in particle size from powder to large. chunk~, ,;111 1D
all probability necessitate the use of a somewhat less than optImum hqUld-tosolid ratio, if the same equipment is to be used. As a result of the above problem the 20/1 ratio is recommended for use at this time.
The second problem is whether a 48 h leach time is necessary. Examination of the data in Tables 3, 4, and 5 shows that even though the concentrations of the metals increase in some cases, there is no consistent pattern to these increases, and the concentrations decreased or remained the same for
~. ,
JACKSON ET AL ON LEACH TEST METHODS 89
BEADS 0.27 em DIA.)
FEED LINE
TO WATER
SAMPLE I TO PUMP PUMP
FIG. 4~Experimelltal apparatus used for column studies.
47 percent of the leach tests that exceed the 12 h leach time. This data would seem to indicate that a 12 h leach test would be sufficient.
The third problem is whether the platform shaker mixes adequately. The data in Tables 3, 4, and 5 show that larger concentrations of all three metals are leached when using the NBS mixer than are leached when using the ASTM mixer-an indication that more mixing may be necessary. The selenium and chromium results obtained by using the roller mill were more consistent than the results obtained by using the other two mixers. The arsenic data for the roller mill, on the other hand, were found to be so inconclusive th.at ~hey were of little use, other than using that inconsistency as the criterion for the elimination of the roller mill mixer at this time. The NBS mixer gave good results for all three metals at the 80/1 Iiquid-to-solid ratio. The concentrations of the metals in the leachates were about the same at 3, 6, and ~2 h leach .time. After examination of all the data, and the previously menttoned consIderations, the NBS mixer, utilizing a 20/1 Iiquid-ta-solid ratio and a leach time of 12 h, was chosen for comparison with the column test.
90 HAZARDOUS SOLID WASTE TESTING: FIRST CONFERENCE JACKSON ET AL ON LEACH TEST METHODS 91
TABLE 2-pH values for the batch leach tests. TABLE 4-pg// of chromium leached using the balch extractioll test.
Leach Time. h Leach Time, h
Liquid-to-Liquid-to-
6 12 24 48 72 96 Solid Ratio 3 6 12 24 48 72 90 Solid Ratio 3
TABLE 3-W]1/ of selenium leached usirlg the batch extraction test. The pH values for the column test range from 8.1 to 9.2, while the pH
Leach Time. h values of the batch tests range from 9.8 to 10.4. Figures 7, 8, and 9 graphi-cally depict the rates at which selenium, chromium, and arsenic were leached
Liquid-to-6 12 24 48 72 96 from the four fly ash columns. The selenium concentrations at day one were
Solid Ratio 3 about 2000 ltg/I, but decreased very rapidly, much as would be expected.
NBS Mixer After about day twenty the selenium concentration leveled out at about 250
608 605 714 534 440 470 309 293 ltg/I. and did not drop below that level before the tests were terminated after 4/1
358 3BO 442 248 267 320 330 60 days. The chromium, Fig. 8, was leached much the same way as the se-\011 271 179 238 257 250 186 173 178 171
20/1 Icnium; the only noticeable difference is that the chromium concentrations \03 98 124 100 91 120 92
40/1 58 decreased throughout the entire 60 day test period_ The final concentration BOil 52 SO 60 59 64
ASTM Mixer was about 50 ltg/I.
223 153 179 300 240 300 216 240 The arsenic results, as shown by Fig. 9, present an entirely different pic-4/1
200 2BO 200 220 180 188 174 ture. The amount of arsenic leached the first five days declined very rapidly. 1011 225 132 128 20/1 82 100 87 8S 92 140 and then appeared to level out until day twenty, when the leachates from all
38 36 46 46 67 40 four columns began to increase in arsenic concentration. This upward trend 40/1 48 35 34
BOil 20 19 100 30 had not changed whe;! the tests were terminated; the concentrations were all
Roller Mill above 1500 ltg/I. Examination of the data for the four application rates 4/1 160 180 154 192 360 420
shows the rate at which arsenic is lea.ched to be very dependent on the rate at 260 200 260 240 220 260
1011 which the water is applied to the column_ The higher the application rates, 2011 140 160 160 160 152
4011 BO 100 60 60 70 , the greater the concentration of arsenic in the leachate. This would appear to .. BOil 40 30 28 40 34 be in agreement with the findings of the batch tests, that is, the larger the
92 HAZARDOUS SOLID WASTE TESTING: FIRST CONFERENCE
Liquid-toSolid Ratio
4/1 1011 20/1 4011 8011
4/1 1011 20/1 40/1 80/1
4/1 lOll 20/1 4011 8011
TABLE 5-llgl/ oj arsenic leached using the batch extraction test.
liquid-to-solid ratio, the greater the concentration of arsenic leached per gram of sample. This is probably due to the solubility limiting factor.
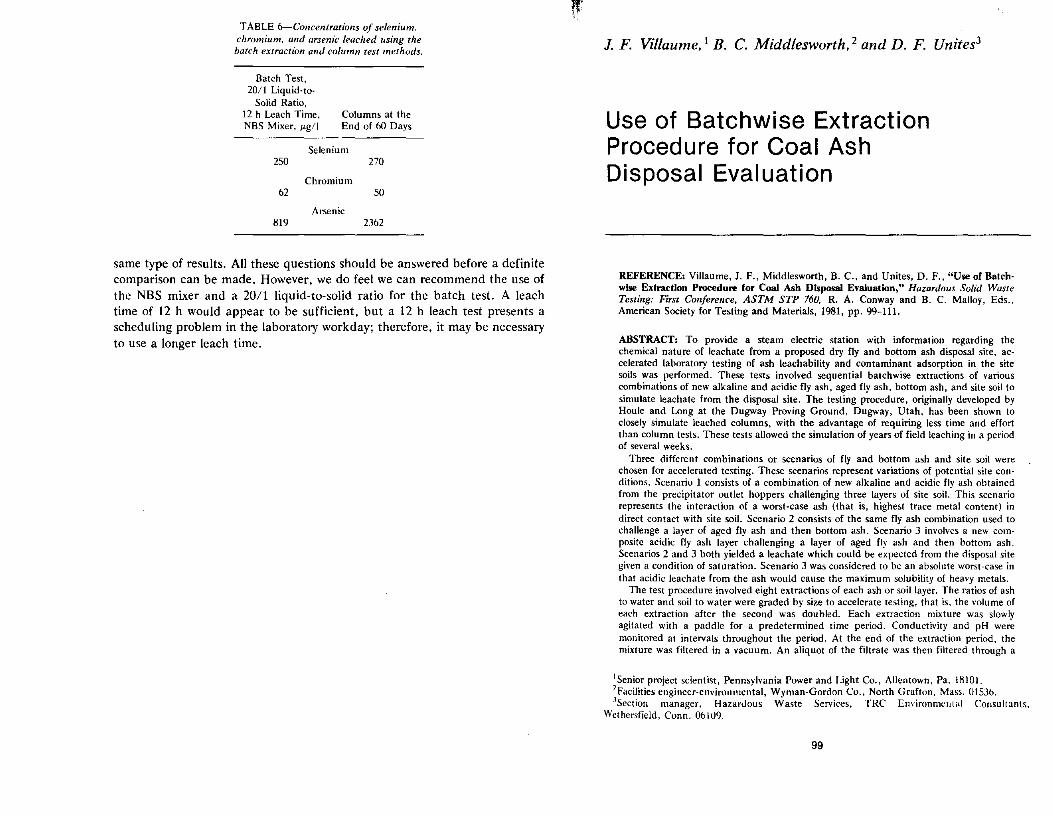
Table 6 shows the final results for both the batch and column tests. We had previously concluded that the 20/1 liquid-to-solid ratio probably would be the most realistic ratio, and if we used the NBS mixer, a leach time of 12 h would be sufficient. In this table we have compared the results obtained using those conditions with the numbers obtained by averaging the results for all four columns at the end of the 60-day test period. There appears to be a relationship between the two methods for selenium and chromium, but the arsenic values do not correspond.
Conclusion
After trying to compare our batch leach test to the column study, it was determined that a tremendous amount of work remained to be done. Some of the questions to be answered are: what are the other major constituents in the samples; how did they respond to the same experimental conditions; how are the metals bound to the waste particles;, what effect does the change in pH have; what are the solubility limiting factors; does particle abrasion play an important part in the batch test; and will the low application rates give the
4.0
30
E
~ 2.0
~
1.0
4/1 lOll
JACKSON ET AL ON LEACH TEST METHODS 93
40/1 UQUID TO SOLIDS RATIO
s,
~ __ -c,
80/1
. FIG. s-p.g// of seleni:WI and chromium leached per gram of sample used IiI the batch t . (lOll lest. Leach time, 12 h. (NBS mixer) , ex ra(-
94 HAZARDOUS SOLID WASTE TESTING: FIRST CONFERENCE
LlaUIDS TO SOLIDS RATIO
FIG. 6-j.Lg// of arsenic leached per gram of sample used in lite hatch extraction test. Leach time, 12 h. (NBS mixer)
(
~ ~! ..
.);t;'
4~
'" '1-
( 80/1
l sample used in the batch extraction test. Leach
"00
1200
1100
1000
900
800
600
.00
200
II \ II \ II \ II \ I I; I I] I " I '\ \ \ \ \ \ \ I \ \ \ \ \ \ \ \ "\ \ '" .... \.
:~~~~~~~~~~~~"m~"~m~m~"~m~m~I~""~m~m!~"m~m~"~m~m~m~"~m~m~"~m~"~'m~~"m~m~~"m~m~m~~"m~'~""~'~"m~~'~~~~~~~~~~~~~~~~~~~~~ ... ~.~ .. ~ .. ! ... ~ .. ~ .. ~ .. ~.~~.~~:l~=~~.~-~~~~~~~~.~ IIIIIIIIIIIIIImilmllmllllllllllllmllllilmilmllmllllilmilmllmllllllmlllmllllllil s, Scenario 1 consists of a combination of new alkaline and acidic fly ash obtained """"""""""""""""""""",,,, the precipitator outlet hoppers challenging three layers of site soil. This scenario
ents the interaction of a worst-case ash (that is, highest trace metal content) in ::I: contact with site soil. Scenario 2 consists of the same fly ash combination used to
nge a layer of aged fly ash and then bottom ash. Scenario 3 involves a new com-
:::::::::::::::::::::::::::::::::::::::::::::::::::::::::::::::::::::::::::::::::::::::;;; ::~~!~£i~§~~~¥.£~;;~i~~~~S§~ ter and soil to water were graded by size to accelerate testing, that is, the volume of extraction after the second was doubled, Each extraction mixture was slowly d with a paddle for a predetermined time period. Conductivity and pH were 'ed at intervals throughout the period, At the end of the extraction period, the
was filtered in a vacuum. An aliquot of the filtrate was then filtered through a
iec! scientist, Pennsylvania power and Light Co .. Allentown, Pa, 18101. 19ineer-environmental, Wyman-Gordon Co" North Grafton, Mass. 01536. anager, Hazardous Waste Services, TRC Environmc",,,j Consultants,
__ la, Conn. Obl09,
99
90 HAZARDOUS SOLID WASTE TESTING: FIRST CONFERENCE
FIG. 9-j.Lg// of arsenic leached per day ill the column leach test.
97
TABLE 6-Concentrations of selenium. chromium. and arsenic leached using the batch extraction and column test methods.
Batch Test, 20/1 Liquid·to·
Solid Ratio, 12 h Leach Time, NBS Mixer, )Lg/l
Columns at the End of 60 Days
Selenium 250 270
Chromium 62 SO
Arsenic 819 2362
same type of results. All these questions should be answered before a definite comparison can be made. However, we do feel we can recommend the use of the NBS mixer and a 20/1 Iiquid·to·solid ratio for the batch test. A leach time of 12 h would appear to be sufficient, but a 12 h leach test presents a scheduling problem in the laboratory workday; therefore, it may be necessary to use a longer leach time.
1 F. Villaume,l B. C. Middlesworth, 2 and D. F. Unites3
Use of Batchwise Extraction Procedure for Coal Ash Disposal Evaluation
REFERENCE: Villaume, J. F., Middlesworth, B. c., and Unites, D. F., "Use of Batch· wise Extraction Procedure for Coal Ash Disposal Evaluation," Hazardous Solid Waste Testing: First Conference, ASTM STP 760. R. A. Conway and B. C. Malloy, Eds., American Society for Testing and Materials, 1981, pp. 99-111.
ABSTRACT: To provide a steam electric station with information regarding the chemical nature of leachate from a proposed dry fly and bottom ash disposal site, accelerated laboratory testing of ash leachability and contaminant adsorption in the site soils was performed. These tests involved sequential batchwise extractions of various combinations of new alkaline and acidic fly ash, aged fly ash, bottom ash, and site soil to simulate leachate from the disposal site. The testing procedure, originally developed by Houle and Long at the Dugway Proving Ground, Dugway, Utah, has been shown to closely simulate leached columns, with the advantage of requiring less time and effort than column tests. These tests allowed the simulation of years of field leaching in a period of several weeks.
Three different combinations or scenarios of fly and bottom ash and site soil were chosen for accelerated testing. These scenarios represent variations of potential site conditions. Scenario 1 consists of a combination of new alkaline and acidic fly ash obtained from the precipitator outlet hoppers challenging three layers of site soil. This scenario represents the interaction of a worst-case ash (that is, highest trace metal content) in direct contact with site soil. Scenario 2 consists of the same fly ash combination used to challenge a layer of aged fly ash and then bottom ash. Scenario 3 involves a new composite acidic fly ash layer challenging a layer of aged fly ash and then bottom ash. Scenarios 2 and 3 both yielded a leachate which could be expected from the disposal site given a condition of saturation. Scenario 3 was considered to be an absolute worst-case in that acidic leachate from the ash would cause the maximum solubility of heavy metals.
The test procedure involved eight extractions of each ash or soil layer. The ratios of ash to water and soil to water were graded by size to accelerate testing, that is, the volume of each extraction after the second was doubled. Each extraction mixture was slowly agitated with a paddle for a predetermined time period. Conductivity and pH were monitored at intervals throughout the period. At the end of the extraction period, the mixture was filtered in a vacuum. An aliquot of the filtrate was then filtered through a
I Senior project scientist, Pennsylvania Power and Light Co., Allentown. Pa. 18101. 2Facilities engineer-environmental, Wyman-Gordon Co., North Grafton. Mass. 01536. JSection manager, Hazardous Waste Services, TRC Environmcldal Consultants,