Master’s Thesis 2017 60 ECTS Department of Ecology and Natural Resource Management (INA)
Comparison of two models used for forecasting of codling moth (Cydia pomonella) in Norway
Andreas Skoge Strandtun Master of Science in Ecology
Preface
This thesis was written as the conclusion to my Master’s degree in Ecology at the Norwegian
University of Life Sciences (NMBU), and also a part of NIBIO’s codling moth project.
Working on this project has been a valuable experience, and it has given me a lot more
understanding of the work behind pest management.
First, I would like to thank my supervisors, Nina Trandem and Marco Tasin, for helping me
through the process of making this thesis. Nina, your guidance and you helping me correct my
mistakes has been invaluable to me while working on this thesis. I could not have done this
without you. Marco, even though I did not see you often, your answers helped me on the way
to the finish line.
I would like to thank Ole Rudolf Gilhuus and Petter Strande, for letting me use your apple and
plum orchards for my research, and Sigrid Mogan for letting me set up a pheromone trap and
picking apples in your garden. Thanks to Gaute Myren for the help with setting up the delta
traps in Lier, and sharing the workload there by checking up on them every other week. In
addition, thanks to Tone Næss, Gunnhild Jaastad and Jop Westplate for sending me more
material to work with all the way from Telemark.
Norwegian University of Life Sciences, Ås
15.05.2017
____________________________________________
Andreas Skoge Strandtun
i
Abstract
The codling moth (Cydia pomonella L.) is a problematic pest across the world, as well as in
the eastern parts of Norway. The adult emerges in mid to late spring, after having
overwintered as a fifth instar larvae, and the females begin to lay eggs a few days after. The
larva damages crops in apple orchards by digging into the fruit and eating the seeds. In pest
management it is critical to target the larvae before it can enter the fruit. Two forecasting
models are used to find the oviposition and hatching timing in Norway: the traditional model
and RIMpro-Cydia. The plum fruit moth (C. funebrana) is a smaller relative of the codling
moth, and has been reported to have a similar phenology, but has no warning system in place
for alerting growers. The aim of this study was to test how good these two models are for
forecasting attacks of Cydia pomonella in Norwegian apple orchards, in order to improve pest
management for growers.
Fieldwork was conducted in apple orchards in eastern Norway. The flight period was
monitored using sex pheromone baited delta traps, placed in each of the orchards. Larvae
feeding inside of apples were collected, and measurements of the width of their head capsules
were used to estimate the time of oviposition and hatching, and compared with the output
from the traditional model and RIMpro. Damage from codling moth larvae was recorded at
harvest to examine the relationship with pheromone trap catches. The flight period of C.
funebrana was also monitored, in order to compare with the flight period of codling moth,
from both pheromone traps and the forecast from RIMpro.
RIMpro was found to give a good simulation of the codling moth flight period, given that the
delay between male and female emergence is taken into account and that the orchard has a
large population of codling moth. When compared to estimations made from collected larvae,
the traditional model and RIMpro appear to be equally competent at forecasting the start of
oviposition, while which model best predicted the start of hatching varied with orchard. A
moderate correlation was found between codling moth catches and the damage found at
harvest, but because of the low percentage of damage found, this might not be reliable.
Comparing trap data of C. funebrana with trap data of C. pomonella and the RIMpro
simulation shows the two species have similar flight activity in the first month after adult
emergence.
Table of contents
Abstract .................................................................................................................................................... i
Introduction ............................................................................................................................................. 1
Materials and methods ........................................................................................................................... 7
Study area .......................................................................................................................................... 7
Study design ....................................................................................................................................... 9
Statistical methods ........................................................................................................................... 10
Results ................................................................................................................................................... 11
Åsbakken .......................................................................................................................................... 11
Lier .................................................................................................................................................... 14
Ringvold ........................................................................................................................................... 17
Gvarv ................................................................................................................................................ 20
Summing up the phenology at the four sites ................................................................................. 21
Discussion .............................................................................................................................................. 23
Male catches and simulated female flight ..................................................................................... 23
Oviposition and hatching ................................................................................................................ 23
Damage at harvest ........................................................................................................................... 24
Comparison with plum fruit moth ................................................................................................. 24
Conclusion ............................................................................................................................................. 25
Reference list ......................................................................................................................................... 26
Introduction
1 Andreas Skoge Strandtun
Introduction
The codling moth (Cydia pomonella L.) is a pest many apple orchards have problems with
across the world, also in Norway, where some of the northernmost populations can be found
(Rafoss & Sæthre 2003; Sæthre & Hofsvang 2002). In Norway it is found mainly in the
southern and eastern parts of the country. At this latitude, all first generation 5th instar larvae
go into diapause, however it is speculated that the moth can have a second generation in
unusually warm summers (Edland 1977; Edland 1994; Sæthre & Hofsvang 2002). The
codling moth overwinters in a cocoon under loose bark or in the soil near the host tree, before
pupating in spring. Adults usually start emerging in mid to late spring, depending on the
temperature (Edland 1977). The male develops quicker and therefore emerges earlier than the
female in spring (Hagley 1974), by up to approximately two weeks (Mitchell et al. 2008).
Adult flight occurs during twilight, mainly when the temperature is between 10 and 20°C
(Saethre & Hofsvang 2005). Oviposition has been reported to occur at an average
temperatures as low as 12.3°C in Norway, however with a only 40% of the eggs maturing
when the temperature is below an average of 15°C (Sæthre & Hofsvang 2002). The female
usually lays her eggs about two days after having emerged (Isely & Ackerman 1923; Pajač et
al. 2012), with popular oviposition sites being on leaves and twigs near fruit and on the fruit
itself (Sæthre 2001) in areas of the tree that protect against wind and rain (Stoeckli et al.
2008). The larva (figure 1) eats its way into the core of the fruit and feeds on the seeds,
leaving behind a tunnel characteristically filled with frass, and the damage can cause the fruit
to fall off or mature early or facilitate the growth of plant-pathogenic fungi, like Monilinia
fructigena (Edland 1977). In pest management it is critical to target the egg or larva before it
can get a chance to escape to the safe innards of the host fruit, but if the pesticide is sprayed
on too early, growth of the apple and naturally occurring degradation of the pesticide can
decrease the amount of sprayed surface and the concentration (Knight 2007). While the
codling moth has only one generation each year in Norway (figure 2), warmer countries often
have additional, more damaging generations (Blomefield & Giliomee 2014; Edland 1994;
Pajač et al. 2012).
Introduction
2 Andreas Skoge Strandtun
Figure 1: A: External symptoms of codling moth presence between two apples. Frass from the larva is covering
its tunnel. B: A codling moth larva and internal damage in an apple, the characteristic tunnel filled with frass can
be seen on the bottom right of the apple. Photo: Andreas Skoge Strandtun.
Introduction
3 Andreas Skoge Strandtun
Figure 2: A: Life cycle of Cydia pomonella. Based on life-cycle from Edland (1994). B: Life cycle of C.
funebrana. Based on Jaastad.
Delta traps with pheromone lures are commonly used to monitor codling moth presence in
orchards. The traps consist of a transparent, triangle shaped structure made from plastic. A
metal wire holds the pheromone dispenser inside the trap as bait, and tie the trap to the branch
of a tree. A glue-covered plate is inserted at the bottom, inside the trap, where the baited
moths are caught. Male codling moth catches in spring have been found to have a strong,
positive correlation with the amount of infested fruit later in the season (Riedl & Croft 1974).
Introduction
4 Andreas Skoge Strandtun
Figure 3: Transparent delta trap with a red pheromone dispenser, and glue-plate filled with fruitlet mining tortrix
(Pammene rhediella). Photo: Tone Næss.
There are currently two models in use in Norway for forecasting codling moth: the
“traditional model” and RIMpro-Cydia.
The traditional model uses catches of male moths in pheromone traps and counting of day-
degrees. The day-degree counting starts after a biofix has been established. The biofix used
for the traditional model in Norway is the date when three criteria are met: 1) 90-95% petal
fall in the cultivars Lobo and Aroma of apple, 2) 10-20 moths/trap/week and 3) temperatures
of at least 14°C at twilight during at least three days of the period with this catch. When these
three criteria have been met, the assumption is that an amount of oviposition sufficient to
damage the apples has started. The model assumes that hatching of eggs starts after 90
degree-days have accumulated after the biofix, with a threshold temperature for egg
development of 10°C.
RIMpro is a model developed by Trapman et al. (2008), and starts a simulation of codling
moth development using climate data starting January 1st. The model has a lower
development threshold of 10°C and an upper threshold of 31°C, with 28°C as the maximum
development speed. The graphical output given by the software shows the relative values and
Introduction
5 Andreas Skoge Strandtun
distribution of the female flight period, the oviposition period and first instar larva, but it does
not know anything about the population levels of codling moth in the target orchard. RIMpro
also has the option to be adjusted for the first pheromone trap catch, but this is not used in
Norway. Both models use data from weather stations at a 60-minute interval to calculate the
development time of codling moth in heat units.
The plum fruit moth (Cydia funebrana) is a smaller, close relative to the codling moth.
However, there is currently no warning system in place to alert plum growers in Norway. The
adult of the plum fruit moth start emerging in mid to late May (Edland 1977; Gratwick 1992)
(figure 2B), and pheromone traps can be deployed at the same time as for codling moth. The
same type of pheromone trap is used to monitor both codling moth and plum fruit moth.
Comparing Trapman et al. (2008) and IvAN et al. (1996) shows that the codling moth and the
plum fruit moth have similar day-degree requirements for their first generation flight periods,
with day-degree counting starting January 1st and a 10°C threshold.
Introduction
6 Andreas Skoge Strandtun
The goal of this study was to test how good the traditional model and RIMpro are for
forecasting attacks of Cydia pomonella in Norwegian apple orchards, in order to improve pest
management for the growers. The objectives were as follows:
1. Investigate the relationship between male catches in pheromone traps and simulated
female flight period in RIMpro.
I predicted that the male catches would start earlier than the female flight in the
RIMpro graph, but the temporal distribution for the two to follow the same pattern.
2. Investigate if the estimated time for onset of oviposition and hatching of collected
larvae fits with the output from RIMpro and the traditional model.
I predicted that the timing of oviposition and hatching would be the same from
collected larvae and the outputs from RIMpro and the traditional model.
3. Investigate the relationship between pheromone trap catches and damage at harvest.
I predicted that there is a positive relationship between the trap catches and crop loss
from attacks by codling moth larvae at the time of harvest.
4. Compare the phenology of C. funebrana to that of C. pomonella.
I predicted the two species to have a similarity in their flight activity.
Materials and methods
7 Andreas Skoge Strandtun
Materials and methods
Study area
The study area consisted of three different orchards (Table 1) (figure 4), as well as smaller
patches of apple trees near the Lier orchard and the four apple trees in a park near NIBIO
(Høyskoleveien 7) near Åsbakken. These sites were chosen for different reasons: Åsbakken
was chosen because the close proximity to the university made it very practical, Lier was
chosen because the orchard has had many problems with Cydia pomonella in the past,
Ringvold was chosen because it is one of the largest orchards in the country. The orchards at
Åsbakken and Ringvold have also been part of codling moth monitoring with pheromone
traps for many years prior to this study. In addition, I was sent damaged apples and
pheromone catch data from an organic orchard in Gvarv, Telemark, as part of a larger project.
The information from this orchard was mainly used for comparisons with the other orchards.
Table 1: Basic information about the study sites.
Location Åsbakken
(Akershus)
Lier
(Buskerud)
Ringvold
(Buskerud)
Gvarv
(Telemark)
Coordinates
of orchard
59°40'06.1"N
10°46'08.8"E
59°45'20.5"N
10°13'36.9"E
60°08'00.6"N
10°16'17.8"E
59°22'38.5"N
9°13'12.6"E
Nearest
weather
station
59°40'06.8"N
10°46'08.1"E
59°47'27.0"N
10°15'34.6"E
60°08'25.1"N
10°15'58.0"E
59°22'56.0"N
9°12'42.8"E
Cultivars Discovery Gravenstein,
Aroma
Aroma James Greve,
Katja,
Discovery
Pesticide
treatment?
No Steward and
Calypso
(Indoxacarb and
Thiacloprid)
(June 27th)
Not in the
sampled area
Not in the
sampled area
Tree density 2x4m 2.5x4m 1.5x4m 1.25x4m
Materials and methods
8 Andreas Skoge Strandtun
Figure 4: Satellite photos of the study areas. All maps are from www.google.no/maps. A: Åsbakken. The red
colored areas indicate the area that apples were collected from in the orchard, while the blue square in the lower
right area of the map is the location of the apple trees in the park near NIBIO. Black and yellow triangle indicate
location of pheromone trap for codling moth, black and blue triangle indicates trap for plum fruit moth B: Lier.
The red area indicates the area examined at Lier. Black and yellow triangles indicate location of pheromone traps
for codling moth, back and blue triangles indicate location of pheromone traps for plum fruit moth in nearby
plum orchard. C: Ringvold. The black and yellow triangle indicates the approximate area of the codling moth
pheromone trap closest to the study area. D: Map of the southern part of Norway, with red markers showing the
locations of the study areas.
Materials and methods
9 Andreas Skoge Strandtun
Study design
The codling moth flight period was monitored using transparent delta traps baited with sex
pheromones from Pherobank (Table 2). The traps were placed at head height, well into the
canopy of a tree. One trap was placed at Åsbakken, with an additional one in the park near
NIBIO. Two traps were placed in the Lier orchard: one in a tree cv Gravenstein, and the other
one in a tree cv Aroma approximately 70 meters away from the first one, as well as another
one in a private garden about 5 km away to have an unsprayed garden to compare with. Five
traps were placed at Ringvold. The traps at Åsbakken and Ringvold were a part of the national
codling moth surveillance (https://www.vips-landbruk.no/). In addition to the codling moth
traps, two traps for C. funebrana were placed in plum trees in the Lier orchard, and one in
Åsbakken. The flight period, as measured by male capture in the pheromone traps, was used
for comparing with the output from RIMpro Cydia and the catches from the C. funebrana
traps. The traps at Åsbakken and the park near NIBIO were checked daily until July 8th, after
which traps were checked once a week, while the traps at Lier and Ringvold were checked
once a week during the whole period. All traps were checked during daylight, before moths
would start flying that day.
Table 2: The period of trap deployment at the three different orchards, and date pheromone dispensers were
changed. The star marks dates where the grower or another person affiliated with the project changed the
pheromone dispensers in the traps.
In order to collect codling moth larvae, damaged apple fruitlets were searched for in each
orchard once a week from July 7th until September 6th. Approximately 30 minutes were spent
searching for and collecting damaged apples at each visit to the Lier and Ringvold orchards,
because of time-restrictions from using public transport. In Lier, one new row of trees was
examined on each trip, each row consisting of about 20 trees. At Ringvold, 2-3 rows were
examined each trip, making it approximately the same amount of trees being searched as in
Lier. New rows were searched every week for 4 weeks, until all trees in the designated area
Location Åsbakken Lier Ringvold Gvarv
Traps deployed May 13th May 18th May 18th May 13th
Traps removed August 3rd June 29nd June 29th September 23rd
Dispensers
changed
July 8th June 24th * June 16th * (not known) *
Materials and methods
10 Andreas Skoge Strandtun
had been searched, after which I started over again from the first row to look for new larvae.
At Åsbakken, approximately one hour was spent each visit, in different areas of the orchard,
searching for damaged apples. Larvae were not collected from Gvarv. Collected apples were
brought to a laboratory at NIBIO in Ås to examine the presence of larvae.
To extract larvae from collected apples, the damaged parts of the fruits were carefully
examined using a box cutter. Larvae found were then stored in glass vials with 70% ethanol.
Apples not examined on the day of retrieval were stored at 5°C until examination, to prevent
the larvae from developing. The approximate age of the larvae was estimated by measuring
head capsule width in order to determine the larval instar (Weitzner & Whalon 1987). A
dissection binocular microscope with an ocular scale was used in order to measure the heads.
The time of oviposition and egg hatch was estimated from the instar of larvae found in the
orchards, using heat units required for development between the different stages, based on
data from Trapman et al. (2008). Heat units were calculated from minimum and maximum
daily temperatures from weather stations near the orchards, with a threshold temperature of
10°C.
Codling moth damage was also recorded at harvest. This was done by randomly selecting 3-4
trees in each orchard and picking all apples on each of those trees. Approximately 50 apples
were randomly selected for each tree, and if a tree had less than that, more apples were
selected from the next tree. Type of damage, if any, on each selected apple was recorded, but
only the codling moth damage was required for this paper.
Statistical methods
Excel 2013 was used for all statistical analyses. The correlation function was used to find the
correlation between pheromone trap catches of codling moth and the level of damage. Linear
regression was used to examine the fit between the RIMpro simulation and catches of plum
fruit moth.
Results
11 Andreas Skoge Strandtun
Results
The result section is structured after the study sites, starting with the most often visited
orchard, Åsbakken. In the end of the results is a section containing graphs and a table, for
comparison of data between all four study areas.
Åsbakken
A total of 9 male codling moths were caught in pheromone traps in this orchard, with an
additional 8 in the trees in the park near NIBIO. 15 C. pomonella larvae were found feeding
on apples in the orchard, and 26 in the apples from outside of NIBIO. The first codling moth
catch in Åsbakken was May 29th, and in the trees in the park near NIBIO May 28th (figure
5A). The codling moth stopped appearing in traps after June 6th, until three more catches
appeared June 19th, 25th and 26th. Moths started appearing in traps a few days earlier than
RIMpro predicted. The long female flight period simulated by RIMpro (figure 6) was not
observed in the traps.
Because less than 10 moths per week were caught in traps, no biofix would normally be
established for the traditional model in this orchard, but if the trap catch criteria is lowered to
5 moths/trap/week, the estimated start of oviposition would be June 3rd and the start of egg
hatch June 19th. RIMpro simulated that the moths started laying eggs June 1st, and egg hatch
to start June 16th. The earliest estimated oviposition, found from examining larvae from figure
7 and 8, was June 23rd in the orchard (figure 9A) and June 8th from the trees in the park near
NIBIO (figure 10A). The earliest estimated hatching of larvae was July 9th from the orchard
(figure 9B) and June 24th in the trees in the park near NIBIO (figure 10B).
No codling moth larvae were found at harvest date (September 16th) at Åsbakken or in the
trees in the park near NIBIO.
Cydia funebrana appeared in traps 4 days earlier than C. pomonella, and trap catches were
larger and persisted for much longer than for codling moth (figure 5B). Plotting the
pheromone trap catches of plum fruit moth against the female flight of codling moth
simulated by RIMpro revealed that the model fits poorly (r2 = 0.0752) (P=0,0716) (figure 11).
Using this test at a daily level often gave a zero on the x-axis, skewing the linear regression.
Calculation at a weekly level could have given a better result. The delay between first plum
fruit moth caught in a trap and the first female codling moth flight in the simulation was seven
days.
Results
12 Andreas Skoge Strandtun
Figure 5: A: Daily pheromone trap catches of Cydia pomonella from the orchard in Åsbakken and from the park
near NIBIO. B: Daily pheromone trap catches of C. funebrana from the orchard in Åsbakken until July 7th, after
which traps were checked once a week. The weekly catches have been evenly distributed within their respective
periods.
Figure 6: Output from RIMpro for the Åsbakken orchard as shown July 30th.
02468
1014
.05.
17.0
5.20
.05.
23.0
5.26
.05.
29.0
5.01
.06.
04.0
6.07
.06.
10.0
6.13
.06.
16.0
6.19
.06.
22.0
6.25
.06.
28.0
6.Mot
hs p
er tr
ap ♂
A
Åsbakken C. pomonella NiBIO C. pomonella
02468
10
14.0
5.17
.05.
20.0
5.23
.05.
26.0
5.29
.05.
01.0
6.04
.06.
07.0
6.10
.06.
13.0
6.16
.06.
19.0
6.22
.06.
25.0
6.28
.06.
01.0
7.04
.07.
07.0
7.10
.07.
13.0
7.16
.07.
19.0
7.22
.07.
25.0
7.28
.07.
31.0
7.03
.08.M
oths
per
trap
♂
B
Åsbakken C. funebrana
Results
13 Andreas Skoge Strandtun
Figure 7: Distribution of codling moth instars found in apples in the Åsbakken orchard at six sampling
occasions. The same row of trees were checked July 22nd, August 2nd and August 9th. Larvae were only found in
the row containing unkempt trees. N = 15 larvae.
Figure 8: Distribution of codling moth instars found in apples from the park near NIBIO at seven sampling
occasions. Not all trees in the area had codling moth larvae. N = 26 larvae.
Figure 9: Temporal distribution of estimated (earliest) oviposition time and temperature at sunset (A) and
hatching time (B) for codling moth larvae found in the Åsbakken orchard (N = 15).
Figure 10: Temporal distribution of estimated (earliest) oviposition time and temperatures at sunset during the
period (A) and hatching time (B) for codling moth larvae found in the trees in the park near NIBIO (N = 26).
0
5
10
08.07. 15.07. 22.07. 29.07. 02.08. 09.08.
Num
ber o
f lar
vae
Instar 1 Instar 2 Instar 3 Instar 4 Instar 5
0
5
10
08.07. 15.07. 22.07. 29.07. 03.08. 09.08. 15.08.
Num
ber o
f lar
vae
Instar 1 Instar 2 Instar 3 Instar 4 Instar 5
Results
14 Andreas Skoge Strandtun
Figure 11: Catches of Cydia funebrana caught in pheromone traps, at Åsbakken, plotted against the relative
numbers of codling moth female flight, simulated by RIMpro. The delay in time (seven days) between first trap
catch and first simulated female flight removed. P = 0.0716.
Lier
A total of 110 male codling moths were caught in pheromone traps in this orchard, averaging
55 per trap, and 164 codling moth larvae were found in collected apples. The first trap catch
for was recorded the 2nd of June (figure 12). The most moths were found in traps the weeks
before June 2nd and 16th, while the weeks before June 8th and 22nd had less catches. No
weather-related explanation was found for the first decrease in moth catches, while rainfall in
the week before June 22nd is probably the cause of the second valley. The trap catches started
the same week as RIMpro simulated the female flight to begin (figure 13).
The onset of oviposition in RIMpro was June 2nd, and the peaks of oviposition were June 18th
and June 24th (figure 13). Larval data, calculated using the data in figure 14 as a basis,
suggests the oviposition started June 4th and peaked on June 30th, July 8th and July 19th (figure
15A). Using only the collected 1st instar larvae to estimate oviposition times (figure 16),
shows June 21st as the start, with June 25th as the peak. June 1st is the date that fits with all the
biofix criteria for the traditional model, meaning female moths would start laying eggs, and
using that gives June 13th as the start of egg hatching. Application of pesticide sprays
targeting eggs would be recommended for application before they hatch. RIMpro predicted
egg hatch to start June 16th and peak between July 11th and 14th, with a second peak almost 2
weeks later, while my data suggests egg hatch started around June 21st and peaked July 16th,
21st and 30th (figure 15B).
Of 167 apples examined at the date of harvest (September 14th), 9 of them had damage caused
by codling moth larvae, making it 5.3% of the examined apples.
y = -38.2x + 418.5R² = 0.08
0
500
1000
0 1 2 3 4 5 6 7 8 9RIM
pro
rela
tive
num
ber
C. funebrana in traps
Results
15 Andreas Skoge Strandtun
Plum fruit moth had no zero-point in my data, as it was found in traps already on May 25th
(figure 12). Catches of C. funebrana and C. pomonella had peaks and valleys in their traps in
the same periods. The plum fruit moth had its largest peak June 2nd, while the codling moth
had its largest peak June 16th. Plotting the pheromone trap catches of plum fruit moth against
the female flight of codling moth simulated by RIMpro revealed that there is some fit between
the two data sets (r2 = 0.4451) (P = 0.148) (figure 17). The delay between first plum fruit
moth caught in a trap and the first female codling moth flight in the simulation was set to six
days in this calculation.
Figure 12: Weekly pheromone trap catches in the Lier commercial orchard; Cydia pomonella in ‘Aroma’ and
‘Gravenstein’ (apple) and C. funebrana in ‘Opal’ and ‘Jubileum’ (plum). Catches of C. pomonella from the trap
in the nearby private garden is also shown. The dates are when traps were checked, and show catches from the
week before. The trap in ‘Aroma’ was stopped earlier because it was also a part of another project.
Figure 13: Output from RIMpro for the Lier orchard as shown July 31st.
0
5
10
15
20
25
30
25.05. 02.06. 08.06. 16.06. 22.06. 29.06.
Mot
hs p
er tr
ap ♂
C. pomonella 'Aroma' C. pomonella 'Gravenstein'
C. pomonella private garden C. funebrana 'Opal'
C. funebrana 'Jubileum'
Results
16 Andreas Skoge Strandtun
Figure 14: Distribution of codling moth instars found in apples in the Lier orchard at ten sampling occasions.
Dates with a star (*) means apples collected that day were ‘Aroma’. The rest of the dates, apples collected were
‘Gravenstein’. N = 164 larvae.
Figure 15: Temporal distribution of estimated (earliest) oviposition time and temperatures at sunset during the
period (A) and hatching time (B) for codling moth larvae found in the Lier orchard (N = 164).
Figure 16: Temporal distribution of estimated (earliest) oviposition time for codling moth larvae found in the
Lier orchard, using only collected 1st instar larvae (N = 19).
0
2
4
6
8
10
12
08.07. 12.07. 19.07. 26.07. 02.08.* 09.08. 16.08.* 23.08. 30.08. 06.09.
Num
ber o
f lar
vae
Serie1 Serie2 Serie3 Serie4 Serie5
0
2
4
6
8
10
21.06. 25.06. 05.07. 15.07. 21.07. 24.07. 28.07. 05.08.
Num
ber o
f egg
s
Eggs
Results
17 Andreas Skoge Strandtun
Figure 17: Weekly catches of Cydia funebrana caught in pheromone traps, at Lier, plotted against the relative
numbers of codling moth female flight, simulated by RIMpro of equivalent periods. The delay in time (six days)
between first trap catch and first simulated female flight has been removed. P = 0.148.
Ringvold
A total of 188 male codling moths were caught in pheromone traps at this orchard, an average
of around 38 moths per trap. 55 C. pomonella larvae were found in collected apples. The first
recorded catch was May 26th (figure 18). The most moths were caught between that day and
June 2nd. In the graph given by RIMpro, female flight was predicted to start in the first week
of June (figure 19).
In RIMpro, the onset of oviposition was June 4th and it peaked around June 16th and 24th
(figure 19). Data from examining larvae (figure 20) suggests that oviposition started June 2nd
and peaked June 10th (figure 21A). June 2nd is the first date that fits with the biofix-criteria for
the traditional model, and the hatching is then predicted to start June 17th. RIMpro predicted
that egg hatch would start June 21st and peak around July 12th. Data from examining the
larvae indicates that egg hatch started June 18th and peaked around June 26th (figure 21B).
Of 202 apples examined at harvest (September 22nd), one had damage caused by codling moth
larvae (0.5% damage).
A plum fruit moth was found in the pheromone trap already the first time it was checked
(figure 18). The number of moths found in traps increased for the second period the traps
were checked for both species. However, the codling moth catches decreased earlier and more
than the plum fruit moth. Plotting the pheromone trap catches of plum fruit moth against the
female flight of codling moth simulated by RIMpro revealed that the model fits poorly (r2 =
0.0561) (P = 0.651) (figure 22). The delay between first plum fruit moth caught in a trap and
the first female codling moth flight in the simulation was set to five days in this calculation.
y = 137.08x + 617.51R² = 0.45
0
1000
2000
3000
4000
5000
0 5 10 15 20 25RIM
pro
rela
tive
num
ber
C. funebrana in traps
Results
18 Andreas Skoge Strandtun
Figure 18: Weekly catches from the pheromone traps in the Ringvold orchard. Dates shown are when traps were
checked. Station 1 through 5 are baited for Cydia pomonella, and the last trap is for C. funebrana, placed in the
nearby plum orchard.
Figure 19: Output from RIMpro for the Ringvold orchard.as shown July 31st.
0
5
10
15
20
25
30
26.05. 02.06. 09.06. 16.06. 23.06. 30.06.
Mot
hs p
er tr
ap ♂
Station 1 C. pomonella Station 2 C. pomonella
Station 3 C. pomonella Station 4 C. pomonella
Station 5 C. pomonella Cydia funebrana
Results
19 Andreas Skoge Strandtun
Figure 20: Distribution of codling moth instars found in apples in the Ringvold orchard at ten sampling
occasions. N = 55 larvae.
Figure 21: Temporal distribution of estimated (earliest) oviposition time and temperatures at sunset during the
period (A) and hatching time (B) for codling moth larvae found in the Ringvold orchard (N = 55 larvae).
Figure 22: Weekly catches of Cydia funebrana caught in pheromone traps, at Ringvold, plotted against the
relative numbers of codling moth female flight, simulated by RIMpro of equivalent periods. The delay in time
(five days) between first trap catch and first simulated female flight has been removed. P = 0.651.
0
2
4
6
8
10
12
07.07. 14.07. 21.07. 28.07. 04.08. 11.08. 18.08. 25.08. 01.09. 08.09.
Num
ber o
f arv
ae
Instar 1 Instar 2 Instar 3 Instar 4 Instar 5
y = 49.64x + 2078.4R² = 0.06
0
1000
2000
3000
4000
5000
6000
0 5 10 15 20 25
RIM
pro
rela
tive
num
ber
C. funebrana in traps
Results
20 Andreas Skoge Strandtun
Gvarv
A total of 40 male codling moth were found in pheromone traps at this orchard. No larvae
were collected. The first recorded pheromone trap catch was May 27th (figure 23). The most
moths were caught between June 3rd and June 10th. In the graph given by RIMpro, female
flight was predicted to start in the first week of June (figure 24).
Of 900 apples selected at harvest (August 18th, 19th and 24th), 30 had damage caused by
codling moth larvae (3.33%).
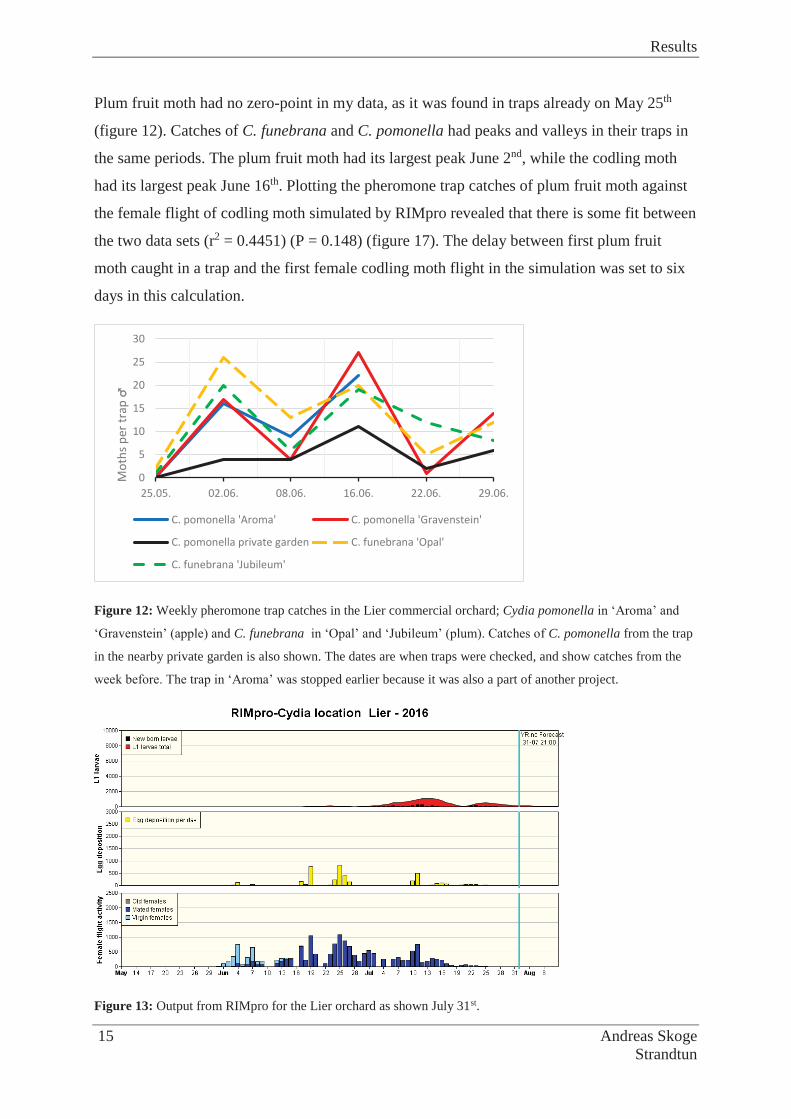
Figure 23: Weekly codling moth catches from the pheromone traps in the Gvarv orchard. Catches from all 5
traps in the orchard are added together. Traps were checked at the dates shown.
Figure 24: Output from RIMpro for the Gvarv orchard.
0
5
10
15
20
25
20.0
5.
27.0
5.
03.0
6.
10.0
6.
17.0
6.
24.0
6.
01.0
7.
08.0
7.
15.0
7.
22.0
7.
29.0
7.
05.0
8.
Mot
hs in
all
trap
s ♂
Results
21 Andreas Skoge Strandtun
Summing up the phenology at the four sites
The comparisons of the three datasets and Gvarv (table 3) contains the data of first flight, first
oviposition and first egg hatch for all the study sites, as found by pheromone traps and
estimated by the models and examination of larvae.
Measuring the width of head capsules of codling moth larvae was found to be a good
indicator for determining the larval instars, because there was no overlap found between the
head sizes of different instars (figure 25).
The maximum male moth catches for any week was had a moderate positive correlation with
the level of damage in the examined orchards (figure 26).
Table 3: Comparisons of codling moth phenology, as found by observation and predicted by models, at the three
study sites and Gvarv.
1 The criteria for establishing a biofix were not met at this location. If the 10-20 moths/trap/week criteria for a
biofix is lowered, the dates in parenthese are what the model would predict. 2 Trees in the park near NIBIO.
Site
Traditional model RIMpro Examination of larvae
First
flight
(observed
in traps)
♂
Oviposition
start
Hatching
start
First
flight
♀
Oviposition
start
Hatch
start
Oviposition
start
Hatching
start
Lier May 25th-
June 2nd
May 31st June 13th May
30th
June 2nd June
16th
June 4th June 21st
Ringvold May 18th-
May 26th
June 2nd June 17th May
31st
June 3rd June
21st
June 2nd June 18th
Åsbakken May 29th
(May
28th)2
N/A1
(June 3rd)
N/A1
(June 19th)
June
1st
June 1st June
16th
June 23rd
(June 8th)2
July 9th
(June
24th)2
Gvarv May 20th-
May 27th
June 2nd June 17th June
1st
June 3rd June
27th
Results
22 Andreas Skoge Strandtun
Figure 25: Head capsule measurement of all larvae from all study sites, and the assigned instars.
Figure 26: The relationship between the maximum weekly trap catch of codling moth for any week and the level
of damage (measured at harvest or earlier).
0
0,5
1
1,5
2
2,5
1 2 3 4 5
mill
imet
ers
Assigned instar
y = 0.75x + 5.08R² = 0.41
y = 0.14x - 0.43R² = 0.3
0
5
10
15
20
25
30
35
0 5 10 15 20 25 30
Leve
l of d
amag
e
Max. male moth catches per week
Max. Larvae per 30minute search. r=0,64
% damage at harvest.r=0,54
Discussion
23 Andreas Skoge Strandtun
Discussion
Male catches and simulated female flight
As predicted, the flight of male codling moth started earlier than the female flight simulated
by RIMpro at all four locations. At Åsbakken and the park near NIBIO, males were caught
four and five days earlier than RIMpro’s simulated female flight. For Lier, Ringvold and
Gvarv, the trap catches occurred during the week before RIMpro’s simulation. This is in
agreement with Hagley (1974), Light et al. (2001) and Mitchell et al. (2008), who showed that
males fly earlier than females The graphs of codling moth trap catches show similar curves to
the simulated female flight in RIMpro in Lier and Ringvold, and approximately a week in
difference between the traps and the simulation. The male codling moth catches from
Åsbakken and Gvarv, however, show very little similarity to the simulated female flight. In
general, RIMpro appears to be a good model for simulating both the first flight of codling
moth and the flight curve during the season, if a time-delay of approximately a week between
male and female flight is taken into account.
The low number of male codling moths caught in traps at Åsbakken, compared to the other
orchards, is likely an indicator that the population of codling moth in and near the orchard is
very low. The low population numbers is most likely why there is no apparent similarity
between the pheromone trap catches and RIMpro’s simulation at this orchard. For further
research, perhaps a trap that attracts both sexes of codling moth could give a better
representation in an orchard with a low population.
Oviposition and hatching
The timings of oviposition from the traditional model and RIMpro are close to what was
calculated from collected larvae in Lier and Ringvold, as was predicted, while in Åsbakken
the difference was near 3 weeks (around 1 week for the park near NIBIO). The peaks of
estimated oviposition are also close to the peaks of simulated oviposition in RIMpro in Lier
and Ringvold. The similarity in oviposition starts between the traditional model, RIMpro and
estimations from examined larvae, with the exception of Åsbakken, suggests that both models
are equally competent at forecasting when oviposition begins.
The estimated timing of egg hatch from examining larvae was close to both the traditional
model and RIMpro in the Ringvold orchard. In Lier and Åsbakken there was instead
Discussion
24 Andreas Skoge Strandtun
approximately a week in difference between hatching estimations from collected larvae and
the two models. For Gvarv there was a ten days difference in when egg hatch was predicted to
start between RIMpro and the traditional model. Which model was closest to the hatching
estimations I made from collected data varied with orchard, meaning what model should be
focused on for determining when eggs begin to hatch could depend on the area: In Lier,
RIMpro was closest to my estimations, while the traditional model was closest in Ringvold
and Åsbakken.
Looking at the temperatures at sunset for the days when oviposition peaked in RIMpro, and
taking into account that I used mean heat units to calculate from larval instars, it is entirely
possible that the peaks from the larval data actually belongs to the same dates RIMpro had
peaks. The low amounts of larvae caught in Åsbakken supports the idea that the codling moth
population there is low, and data collected from this orchard is probably not accurate enough
to draw strong conclusions about the models.
Damage at harvest
A moderate positive correlation between male codling moth catches and the damage found at
harvest suggests that there could be a relation between the two. In contrast, Riedl and Croft
(1974) found that cumulative pheromone trap catches in the early part of the season correlated
well with codling moth damage later on. However, I believe the data I found is not strong
enough to describe accurately the relationship between trap catches and damage at the time of
harvest. Unlike in the study by Riedl and Croft (1974), apples that had fallen off due to
natural thinning during the growing period, as well as manual thinning done by the grower,
were not examined. According to Hagley (1974), this could be the cause of low damage at
harvest in my data. Another factor could be that the orchard in Lier was sprayed with
Indoxacarb and Thiacloprid June 27th.
Comparison with plum fruit moth
Pheromone trap catches show the strongest similarities in flight patterns between codling
moth and plum fruit moth in Lier, and in Ringvold the early parts of the graphs were very
similar. This fits with the similar day-degree requirements for development for the two
species, found by comparing Trapman et al. (2008) and IvAN et al. (1996). In contrast,
comparing plum fruit moth catches from pheromone traps with the simulated female codling
Discussion
25 Andreas Skoge Strandtun
moth flight in RIMpro shows a poor fit between the two for Ringvold and Åsbakken, and a
44.5% fit for Lier. Common for the graphs comparing RIMpro and pheromone catches of
plum fruit moth in Lier and Ringvold, is that r squared would be much higher if only the first
four periods of trap catches were used. These results suggest that both codling moth and plum
fruit moth have similar patterns in their flight during the first month of adult activity,
however, more research is needed to confirm this.
Conclusion
The male C. pomonella trap catches in shared much of the pattern of the RIMpro simulation
for female moths for the entirety of the time traps were deployed. The oviposition and
hatching times estimated from the collected larvae came close to what both the traditional
model and RIMpro forecasted. If these findings are representative for the study sites, RIMpro
should be as good a tool for finding oviposition and hatching times as pheromone traps, in
commercial, non-organic orchards, as long as the delay between male and female emergence
is taken into account.
Natural and manual thinning of apples done by the farmers during the growth season removes
most of the infested apples long before harvest. Because of this, only a very low percentage of
apples were found damaged by codling moth at harvest in all of the orchards in this study. My
conclusion for this is that counting damage at harvest is likely not a good estimate for level of
damage in the orchard. Instead, I think that examining the crop earlier in the season would
give the growers a much better picture of what is going on in their orchards.
Used together with pheromone traps aimed at plum fruit moth, RIMpro can be used by plum
growers to get a picture of first month of moth flight, but the difference between trap catches
and RIMpro gets too big after that, making it unreliable.
Reference list
26 Andreas Skoge Strandtun
Reference list
Blomefield, T. & Giliomee, J. (2014). Validation of the phenology model for the codling moth, Cydia pomonella (Lepidoptera: Tortricidae), in South African pome fruit orchards. African Entomology, 22 (1): 30-48.
Edland, T. (1977). Eple og plommeviklar. Gartneryrket, 67 (15): 444-449. Edland, T. (1994). Observasjonar og forsøk med epleviklar. Garnteryrket, 8: 26-30. Gratwick, M. (1992). Plum fruit moths. In Crop Pests in the UK, pp. 123-125: Springer. Hagley, E. A. (1974). Codling moth: emergence, sex ratio, and abundance. The Canadian
Entomologist, 106 (04): 399-402. Isely, D. & Ackerman, A. J. (1923). Life history of the codling moth in Arkansas with special
reference to factors limiting abundance. IvAN, H., KOCOUREK, F., BERÁNKOVÁ, J. & KULDOVÁ, J. A. (1996). Temperature
models for predicting the flight activity of local populations of Cydia funebrana (Lepidoptera: Tortricidae) in central Europe.
Jaastad, G. Plommevikler: NIBIO. Available at: https://www.plantevernleksikonet.no/l/oppslag/39/ (accessed: 19.04).
Knight, A. (2007). Adjusting the phenology model of codling moth (Lepidoptera: Tortricidae) in Washington state apple orchards. Environmental entomology, 36 (6): 1485-1493.
Light, D. M., Knight, A. L., Henrick, C. A., Rajapaska, D., Lingren, B., Dickens, J. C., Reynolds, K. M., Buttery, R. G., Merrill, G. & Roitman, J. (2001). A pear-derived kairomone with pheromonal potency that attracts male and female codling moth, Cydia pomonella (L.). Naturwissenschaften, 88 (8): 333-338.
Mitchell, V. J., Manning, L. A., Cole, L., Suckling, D. M. & El‐Sayed, A. M. (2008). Efficacy of the pear ester as a monitoring tool for codling moth Cydia pomonella (Lepidoptera: Tortricidae) in New Zealand apple orchards. Pest management science, 64 (3): 209-214.
Pajač, I., Božena, B., Mikac, M. K. & Pejić, I. (2012). New insights into the biology and ecology of Cydia pomonella from apple orchards in Croatia. Bulletin of Insectology, 65 (2): 185-193.
Rafoss, T. & Sæthre, M. G. (2003). Spatial and temporal distribution of bioclimatic potential for the Codling moth and the Colorado potato beetle in Norway: model predictions versus climate and field data from the 1990s. Agricultural and Forest Entomology, 5 (1): 75-86.
Riedl, H. & Croft, B. (1974). A study of pheromone trap catches in relation to codling moth (Lepidoptera: Olethreutidae) damage. The Canadian Entomologist, 106 (05): 525-537.
Saethre, M. & Hofsvang, T. (2005). Diurnal flight activity of codling moth Cydia pomonella (Lepidoptera: Tortricidae) males in relation to temperature and twilight. Norwegian Journal of Entomology, 52 (2): 75.
Stoeckli, S., Mody, K. & Dorn, S. (2008). Influence of canopy aspect and height on codling moth (Lepidoptera: Tortricidae) larval infestation in apple, and relationship between infestation and fruit size. Journal of economic entomology, 101 (1): 81-89.
Sæthre, M.-G. (2001). Cydia pomonella L.(Lepidoptera: Tortricidae): studies on distribution, oviposition behaviour, flight activity and bioclimatic potential to improve prognoses in Norway: Agricultural University of Norway, The Norwegian Crop Research Institute, Plant Protection Centre, Department of Entomology and Nematology.
Sæthre, M.-G. & Hofsvang, T. (2002). Effect of temperature on oviposition behavior, fecundity, and fertility in two northern European populations of the codling moth (Lepidoptera: Tortricidae). Environmental Entomology, 31 (5): 804-815.
Reference list
27 Andreas Skoge Strandtun
Trapman, M., Helsen, H. & Polfliet, M. (2008). Development of a dynamic population model as a decision support system for Codling Moth (Cydia pomonella L) management. Ecofruit-13th International Conference on Cultivation Technique and Phytopathological Problems in Organic Fruit-Growing: Proceedings to the Conference from 18thFebruary to 20th February 2008 at Weinsberg/Germany. 247-251 pp.
Weitzner, P. & Whalon, M. E. (1987). Head capsule widths as an indicator of the larval instar of codling moth (Lepidoptera: Olethreutidae). Great Lakes Entomologist, 20: 147-150.