Page 1
Comparison of Vehicle-to-Grid versus Other Grid Support Technologies
A Master’s Project submitted in partial fulfillment of the requirements for the Master of Environmental Management degree in the Nicholas School of the Environment of
Duke University.
Prepared By: Zhiyu “Nick” Duan
Submitted On: April 2012
Dr. Lincoln F. Pratson, Primary Advisor Truman and Nellie Semans/Alex Brown and Sons Professor of Earth and
Ocean Sciences, Nicholas School of the Environment
Dr. Claude C. Gravatt, Jr. (Cary), Secondary Advisor Executive in Residence & Adjunct Professor, Nicholas School of the
Environment
Page 2
Comparison of Vehicle-to-Grid versus Other Grid Support Technologies
1
Table of Contents
Acknowledgements ............................................................................................................................. 2
1 Executive Summary ...................................................................................................................... 3
2 Introduction .................................................................................................................................... 4
3 Ancillary Services, Regulation, and V2G ................................................................................ 5
3.1 Ancillary Services ................................................................................................................................. 5 3.2 Regulation ............................................................................................................................................... 6 3.3 V2G Power ............................................................................................................................................... 9 3.4 V2G for Regulation ............................................................................................................................ 10
4 Grid Support Technologies ...................................................................................................... 12
4.1 Generation-‐based Technologies ................................................................................................... 12 4.1.1 Efficiencies of Gas Turbines ...................................................................................................................... 13 4.1.2 Emissions of Gas Turbines ........................................................................................................................ 14
4.2 Storage-‐based Technologies .......................................................................................................... 15 4.2.1 Hydroelectric Pumped Storage ............................................................................................................... 15 4.2.2 Battery Banks .................................................................................................................................................. 17 4.2.3 Flywheels .......................................................................................................................................................... 18 4.2.4 V2G ...................................................................................................................................................................... 20
5 Analysis Methods ........................................................................................................................ 21
5.1 Fuel-‐to-‐grid Scope ............................................................................................................................. 21 5.2 Obtaining Efficiency .......................................................................................................................... 21 5.3 Calculating Emissions ...................................................................................................................... 22
6 Efficiency and Emission Comparisons ................................................................................. 23
6.1 Efficiency Comparison ..................................................................................................................... 23 6.2 Emission Comparison ...................................................................................................................... 25
7 Conclusions ................................................................................................................................... 27
8 References ..................................................................................................................................... 28
Page 3
Comparison of Vehicle-to-Grid versus Other Grid Support Technologies
2
Acknowledgements
I would like to express my gratitude to the General Electric Company (GE) and the following
professionals from GE, who kindly served as my clients and provided invaluable resources and
guidance to the development of this project:
Ms. Beth Comstock, Senior Vice President and Chief Marketing Officer, GE
Ms. Debora Frodl, Chief Strategy Officer, GE Capital Fleet Services
Dr. Matthew Nielsen, Electrical Technologies and Systems, GE Global Research
I would also like to thank Dr. Dalia Patino-Echeverri, Gendell Assistant Professor of Energy
Systems and Public Policy at the Nicholas School of the Environment, for her invaluable
guidance to the communication of the analysis results of this project.
Page 4
Comparison of Vehicle-to-Grid versus Other Grid Support Technologies
3
1 Executive Summary
With the accelerating adoption of electric vehicles, using the batteries in the existing vehicle fleet
to discharge to the power grid when needed (vehicle-to-grid, V2G) provides a potential
alternative for supplying grid support. While many studies have suggested V2G to be highly
competitive in providing regulation service, a segment of grid support, it is necessary to compare
V2G versus other available grid support technologies before its actual competitiveness can be
determined.
This master project focused on the often-overlooked side of V2G, the energy efficiency, and
compared V2G versus other grid support technologies in terms of their efficiencies and
emissions. Given V2G is most suitable for regulation service, other available technologies
serving regulation were selected for the comparison. These technologies fit into two groups:
generation-based and storage-based. Fast-ramping gas turbines were chosen to represent the
generation-based technologies. For storage-based technologies, hydroelectric pumped storage,
battery banks, flywheels, and V2G were analyzed.
The project adopted a fuel-to-grid scope when conducting the comparison among different grid
support technologies, meaning the efficiency at which fuels are converted into final grid support,
along with the associated emissions, were analyzed and compared.
The comparison led to three major findings: (1) energy storage-based technologies achieve a
lower fuel-to-grid efficiency than gas turbines do; (2) V2G is less efficient in delivering grid
support than grid-dedicated battery banks and flywheels; (3) storage-based technologies,
especially V2G, would significantly increase CO2, SO2, and NOx emissions.
However, opportunities still exist for the commercialization of V2G given its great mobility in
supplying power at load as well as the lower financial burden to utilities. To address the lower
efficiency and increased emissions associated with V2G, the electric power sector should rely
more on clean and efficient power generation mechanisms, such as natural gas and renewables.
Page 5
Comparison of Vehicle-to-Grid versus Other Grid Support Technologies
4
2 Introduction
Electric vehicles (EVs), also referred to as electric drive vehicles (EDVs), with an electric-drive
motor powered by batteries, a fuel cell, or a hybrid drivetrain, have been widely recognized as a
key pathway to enhance national energy security, mitigate greenhouse gas emissions, and
promote economic growth. In his 2011 State of the Union address, President Obama called for
putting one million electric vehicles on the road by 2015. This goal represents not only a
milestone in transforming our national vehicle fleet, but a challenge as well as an opportunity for
the electric power system.
With a minimum battery capacity of 4 kWh (defined by IEEE), gridable electric vehicles, such
as plug-in hybrid electric vehicles and battery-electric vehicles, have the ability to discharge their
batteries and send electricity back to the power grid when they are parked and connected to an
electrical outlet. The electricity flowing from electric vehicles to the power grid is then called
“vehicle-to-grid” power, or V2G.
V2G provides a potential alternative for supplying grid support. Studies have always looked at
the economic implications of V2G. Among the ancillary services for grid support, V2G is
suggested to be highly competitive for the most expensive regulation service. However, the
energy efficiency (the ratio of the energy delivered to that consumed) of V2G for regulation
should be analyzed before the economics of V2G for regulation can make sense.
This project focuses on comparing the efficiency and emissions of V2G versus other grid support
technologies, covering conventional generation-based and storage-based technologies. Chapter 3
introduces the concepts of ancillary services, regulation, and V2G, followed by a brief summary
of opposing opinions about the application of V2G. Chapter 4 evaluates each grid support
technology individually. Chapter 5 explains the methods used in the quantitative analysis while
Chapter 6 presents the comparison results. Conclusions and recommendations are provided at the
end of the report in Chapter 7.
Page 6
Comparison of Vehicle-to-Grid versus Other Grid Support Technologies
5
3 Ancillary Services, Regulation, and V2G
3.1 Ancillary Services
Managed by the Independent System Operators (ISOs) and Regional Transmission Organizations
(RTOs), ancillary services support the reliability of an electric power system. The Federal
Energy Regulatory Commission (FERC) defines the ancillary services as "those services
necessary to support the transmission of electric power from seller to purchaser given the
obligations of control areas and transmitting utilities within those control areas to maintain
reliable operations of the interconnected transmission system".
Ancillary services differ in their control method, response time, duration of power dispatch,
contract terms, price and terminology. The Oak Ridge National Laboratory distinguishes the
ancillary services into regulation, spinning reserve, supplemental reserve, replacement reserve,
and voltage control based on their different response timeframes. Table 1 summarizes the
features of the timeframes of the five key ancillary services.
With the restructuring of the electricity industry, ancillary services that used to be bundled in the
generation of vertically integrated utilities are now provided by various industry participants,
ranging from generation to the demand. In market-based systems, separate markets are usually
created to trade these services. The PJM Interconnection (mid-Atlantic and mid-West), for
instance, currently operates two markets for ancillary services: Synchronized Reserve and
Regulation. The Synchronized Reserve market supplies electricity when an unexpected power
shortage occurs. The Regulation corrects for short-term changes in electricity such as frequency
and voltage. PJM makes the remaining ancillary service, Black Start service, compulsory.
Nationwide, ancillary services account for 5-10% of the annual electricity cost, or $12 billion, of
which 80% goes to regulation and spinning reserve services [1].
Page 7
Comparison of Vehicle-to-Grid versus Other Grid Support Technologies
6
Table 1. Definitions of key ancillary services. Adapted from Frequency Regulation Basics and
Trends (p. 3) by Oak Ridge National Laboratory, 2004.
The importance of ancillary services stems from their potential to deliver or withdraw electric
power or other resource upon request. Consequently, the value of ancillary services must be
measured by their ability to respond when needed, for instance, the response time. In practice
however, ancillary services are usually compensated for based on the clearing price and the
bidding capacity. Such a discrepancy in service performance and compensation mechanism
should be corrected.
3.2 Regulation
Regulation, or frequency regulation, is one type of ancillary services that fine-tunes the grid to
maintain the frequency at a stable level (60 Hz in the U.S., 50 Hz in the Europe). It is designed to
handle rapid fluctuations in load and unintended small changes in generation. In the PJM
Page 8
Comparison of Vehicle-to-Grid versus Other Grid Support Technologies
7
example, generation and demand resources willing to perform regulation must be able to provide
as small as 0.1 MW of regulation capacity [2].
Online generation, storage, or load that is equipped with automatic generation control (AGC) and
that can change output quickly (within minutes) is capable of providing regulation. However,
generation-based technologies, such as natural gas-fired power plants and hydropower plants,
prevail in the regulation service. When the load exceeds the generation, causing frequency to
drop, a regulation control signal calling for a positive correction will be sent to the generators,
requiring them to “regulation up” their generation. When excessive generation increases the
frequency, a signal calling for a negative correction will be sent to ask for “regulation down”.
Large frequency deviations are harmful and may lead to a collapse of the power system. Since
electricity generators are designed to operate within a relatively narrow range of frequencies,
when the frequency falls too low, protection devices will disconnect the generators from the grid
to prevent potential damages. Such disconnections exacerbate generation deficit, causing the
frequency to further drop and more generators to be disconnected.
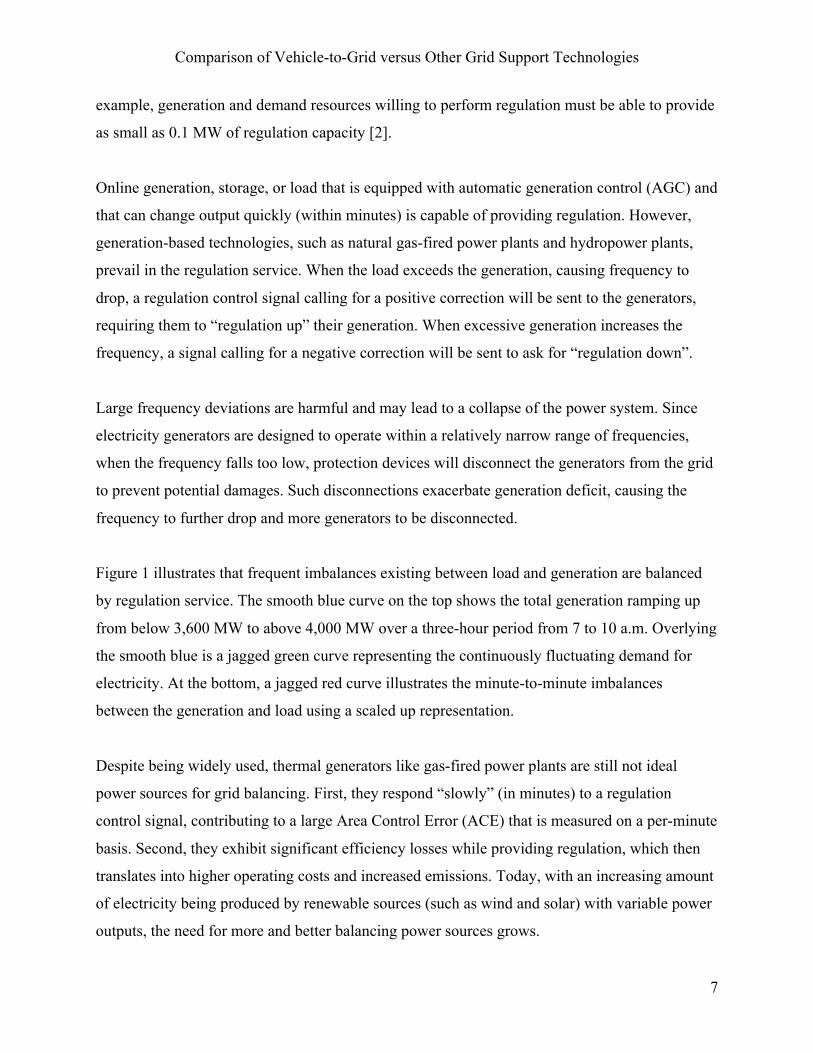
Figure 1 illustrates that frequent imbalances existing between load and generation are balanced
by regulation service. The smooth blue curve on the top shows the total generation ramping up
from below 3,600 MW to above 4,000 MW over a three-hour period from 7 to 10 a.m. Overlying
the smooth blue is a jagged green curve representing the continuously fluctuating demand for
electricity. At the bottom, a jagged red curve illustrates the minute-to-minute imbalances
between the generation and load using a scaled up representation.
Despite being widely used, thermal generators like gas-fired power plants are still not ideal
power sources for grid balancing. First, they respond “slowly” (in minutes) to a regulation
control signal, contributing to a large Area Control Error (ACE) that is measured on a per-minute
basis. Second, they exhibit significant efficiency losses while providing regulation, which then
translates into higher operating costs and increased emissions. Today, with an increasing amount
of electricity being produced by renewable sources (such as wind and solar) with variable power
outputs, the need for more and better balancing power sources grows.
Page 9
Comparison of Vehicle-to-Grid versus Other Grid Support Technologies
8
Figure 1. Regulation compensates for minute-to-minute imbalances between load and generation.
Adapted from Frequency Regulation Basics and Trends (p. 5) by Oak Ridge National Laboratory,
2004.
Some energy storage-based technologies however, including solutions based on lithium-battery
technology, have emerged as technologically and environmentally superior to traditional
generation-based technologies for regulation. Since regulation represents keeping short-term grid
fluctuations in balance, it neither generates nor consumes energy over a measurable amount of
time, enabling an energy storage system with a finite capacity to accomplish regulation service
successfully. In addition, energy storage can respond virtually instantaneously (in milliseconds)
and precisely without the wear and tear or efficiency loss associated with performing regulation.
As a result, more generators can be relieved from performing regulation, improving asset
utilization. The table below summarizes the key requirements for an energy storage technology
to perform regulation.
Page 10
Comparison of Vehicle-to-Grid versus Other Grid Support Technologies
9
Table 2. Energy storage characteristics required to perform regulation. Adapted from Frequency
Regulation Basics and Trends (p. 19) by Oak Ridge National Laboratory, 2004.
Cycle Life (20-year) 500,000
Round-trip Efficiency High
Response Time 1 – 10 minutes
Energy Delivery Duration 10 – 15 minutes
Service Duty Continuous
Potential Technologies Flywheels, battery banks, V2G
3.3 V2G Power
The fundamental concept of vehicle-to-grid (V2G) power is using gridable electric vehicles to
provide electric power to the grid while they are parked and properly connected. The electric
vehicles can be fuel cell vehicles, plug-in hybrids, or battery-electric vehicles. Most vehicles are
parked an average of 95 percent of the time a day, the electrochemistry energy stored in their
batteries are therefore, able to provide electricity to power grid when connected, with economic
benefits both for the utilities and the vehicle owners [3].
To be able to provide V2G power, the vehicle must have three required elements [4]: (a) a
connection to the grid for electric energy flow, (b) control or logical connection necessary for
communication with the grid operator, and (c) controls and metering on-board the vehicle.
In contrast to the traditional one-way trip from grid to the vehicles, the electricity now flows
two-way between the gird and the connected vehicles as needed. Illustrated in Figure 2, the
electric power system operator (labeled ISO, Independent System Operator) sends out a control
signal wirelessly, requesting for electricity. The signal can go directly to each individual vehicle
(upper right of Figure 2), or to a fleet manager controlling a fleet of parked vehicles (lower right
of Figure 2), or through a third-party aggregator managing dispersed individual vehicles’ power
(not shown in figure).
Page 11
Comparison of Vehicle-to-Grid versus Other Grid Support Technologies
10
Figure 2. Illustrative schematic of power line and wireless control connections between vehicles
and the electric power grid. Adapted from Vehicle-to-grid Power Fundamentals: Calculating
Capacity and Net Revenue (p. 269) by W. Kempton, & J. Tomić, 2005.
3.4 V2G for Regulation
As discussed earlier, energy storage-based technologies are considered technically superior to
traditional generation-based technologies for regulation. Generally, there are two reasons. First,
an energy storage system with a finite capacity can accomplish regulation because regulation is a
“zero-energy” service – it neither generates nor consumes energy over a measurable amount of
time. Second, energy storage can respond virtually instantaneously and provide the power asked
for precisely without significant efficiency losses associated with performing regulation.
V2G emerged as a side product with the introduction of electric vehicles to transportation. It is
considered highly competitive for regulation by some researchers. Three reasons are presented in
supporting V2G to be suitable for regulation by Tomić and Kempton in their study: (a)
regulation service has highest market value for V2G, (b) stresses on battery are minimized, and
(c) battery-electric vehicles are well suited to provide regulation services [5]. Their study
suggests that “large profits come from providing V2G for regulation up and down” while
admitting the estimated $290 annual net income may be too small to justify transaction costs [6].
Page 12
Comparison of Vehicle-to-Grid versus Other Grid Support Technologies
11
Some other analysts have questioned the economic merits behind V2G based on the fact that the
profit depends on the efficiency of battery systems and the difference in peak and off-peak
electricity prices. First, if the efficiency works for V2G, then the grid-dedicated battery storage
systems like battery banks would be more suitable for grid support. Second, with the mass
adoption of EVs to provide V2G power, the price of grid balancing would eventually fall and
thus make V2G no longer profitable.
The price issue is not within the scope of our analysis. However, a brief understanding of how
the regulation prices are determined in a market-based power system is necessary. In practice,
the opportunity costs associated with maneuvering generation assets performing regulation are
driving the high market prices. First, to be able to perform regulation, the generator has to
operate at a reduced power output instead of the rated output. Second, when a generator is
required to regulation down, it further incurs an opportunity costs for being unable to sell more
electricity. There is also an opportunity cost for regulation-performing generators to keep
running at minimal capacity even if the electricity prices are lower than their marginal costs.
Lastly, regulation requires frequent ramping up and down; the increased cost of wear and tear
and reduced efficiency must also be compensated for.
It is not yet clear about the long-term effects of using V2G for regulation on battery’s cycle life
(typically defined as the number of times a battery can be charged and discharged before its
capacity falls below 70 to 80 percent of its original capacity or nameplate energy). However,
unlike thermal generators, battery-electric vehicles already have energy storage that is designed
for large and frequent power fluctuations over short time periods, making V2G a strong
candidate for supplying grid-balancing power. Interestingly, it was noted in a demonstration
project of V2G for regulation in California that the battery capacity increased by about 10%
during the testing [7].
Page 13
Comparison of Vehicle-to-Grid versus Other Grid Support Technologies
12
4 Grid Support Technologies
4.1 Generation-‐based Technologies
In the U.S., about one percent of the total generation capacity is used to correct frequency
deviations. Traditionally, fast-ramping generators such as natural gas-fired power plants and
hydropower plants are called upon to provide grid balancing. In areas where the balancing
capacity of natural gas and hydro is insufficient, coal-fired power plants would also be
employed, even though they are more suitable for supplying base load given their design for
steady outputs and lower fuel costs.
Because the construction of a hydropower plant is limited by geological requirements, cold,
quick-starting, fast-ramping gas-fired power plants are taken as the primary generation-based
technology for regulation service in the analysis. Two types of gas-fired power plants are widely
commissioned for generation in the U.S., open-cycle gas turbine (OCGT) plants and combined-
cycle gas turbine (CCGT) plants. OCGT plants are used to meet peak-load demand with
efficiency of between 35% and 42% at full load. CCGT plants are similar to OCGT except that
gas turbine exhaust is reused in a heat recovery steam generator (HRSG) to improve the overall
efficiency, which currently falls within the range 52%–60% [8].
Table 3 below summarizes the average efficiency of electricity generation reported at full load
conditions by power plant type in the U.S. These efficiencies represent the status quo of the
entire electricity generation sector instead of the performance of a few newly installed generating
units. The average efficiency is used because of the stronger incentives for the less efficient and
less economical power plants to participate in the expensive regulation market. According to the
table below, the most efficient use of fossil fuels is to put natural gas through a combined cycle
plant (CCGT), converting nearly 45% of the energy embedded in natural gas into the form of
electricity. However, when providing regulation to grid with high ramp rates, CCGTs may have
to operate as OCGTs because their heat recovery steam generators would be damaged by the
“frequent, rapid, high amplitude balancing” [9]. In our analysis, the 29.44% efficiency for gas
turbine (OCCT) is used instead of the 44.78% for combined cycle.
Page 14
Comparison of Vehicle-to-Grid versus Other Grid Support Technologies
13
Table 3. Average generation efficiency by energy source and prime mover. Converted with data
from Electric Power Annual 2010, updated in Nov. 2012, U.S. EIA.
Power Source Prime Mover Efficiency Net Summer Capacity (MW)
Coal Steam turbine 33.64%
316,800 Combined cycle W
Natural Gas
Steam turbine 32.76%
407,028 Gas turbine 29.44%
Internal combustion 34.41%
Combined cycle 44.78%
Petroleum
Steam turbine 33.29%
55,647 Gas turbine 25.49%
Internal combustion 32.72%
Combined cycle 32.58%
Note: Efficiency is converted from heat rates that are reported at full load conditions for electric
utilities and independent power producers. W = Withheld to avoid disclosure of individual
company data.
4.1.1 Efficiencies of Gas Turbines
Gas turbines are most efficient at their rated outputs. To be able to ramp up and down quickly,
they must operate at reduced outputs. Such reduced outputs impose heat rate losses with the
significance depending on the ratio of the reduced output to rated output. According to Willem
Post’s study [9], gas turbines running at 80%, 50%, and 20% of the rated output have an average
heat rate (equivalent to efficiency) degradation of 5.3%, 17.6%, and 81.8%, respectively.
Therefore, gas turbines rarely operate below 40% of the rated output given the huge degraded
heat rates. In addition, fast ramping up and down would further incur wear and tear on the
generator and losses in heat rate. According to a study by KEMA Inc. [10], gas turbines
performing regulation exhibit increased fuel consumption on the order of 0.5% to 1.5%. In this
report, a 0.7% increase in fuel consumption (equivalent to efficiency) is assumed as KEMA did
in their study. The table below presents the corrected efficiency for natural gas turbines
providing regulation at an average 80% and 50% of rated output, respectively.
Page 15
Comparison of Vehicle-to-Grid versus Other Grid Support Technologies
14
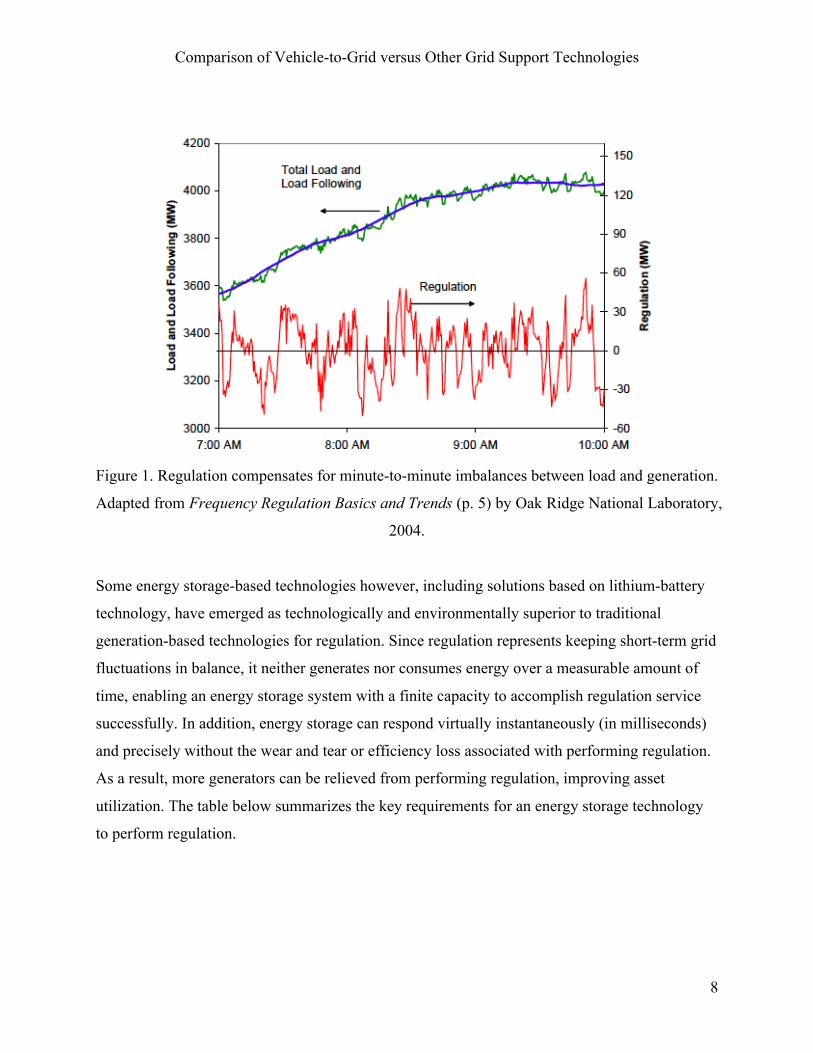
Table 4. Corrected efficiencies for natural gas turbines performing regulation.
Prime Mover At 100% of Rated Output At 80% of Rated Output At 50% of Rated Output
Gas Turbine 29.44% 27.76% 24.86%
These efficiency losses would then translate into higher operating costs and increased emissions.
Such situation is worsened now as the electricity generation is being mandated to include more
renewables across the nation through the renewable portfolio standards (RPSs) [11], increasing
the demand for gas turbines to balance the variable power output of renewables. Therefore,
energy storage technologies with high efficiency, fast response, and great cycle life seem to be a
better fit for the ancillary services, especially regulation.
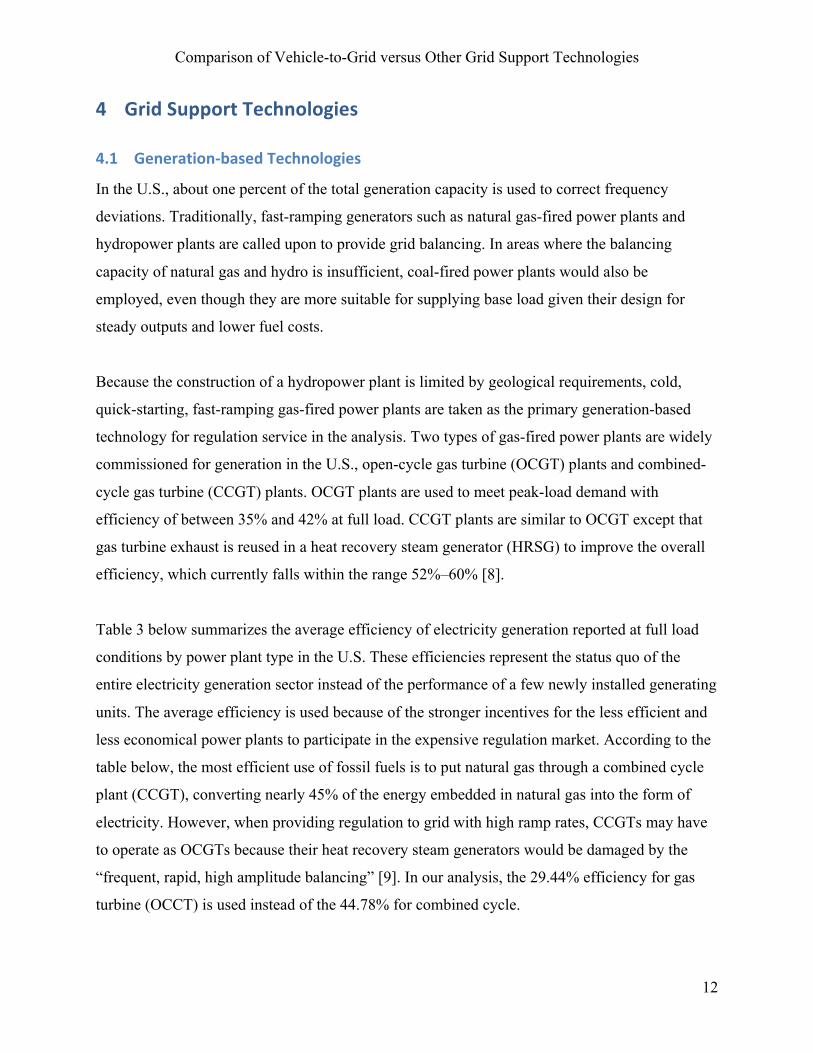
4.1.2 Emissions of Gas Turbines
Even though natural gas is the cleanest fossil fuel, as evidenced by the emission level
comparison in Table 9, burning it still releases large quantities of gas emissions into the
atmosphere. Large-scale emission preventative technology, Carbon Capture and Sequestration
(CCS), has been developed to address carbon emissions from a conventional power plant.
However, the commercialization of CCS is expensive and limited by geological formation to
safely store carbon dioxide. Therefore, this project assumes no CCS is applied to a gas turbine in
the analysis. The estimated emission levels for gas turbines are presented in Table 5 below.
Table 5. Emissions of Gas Turbines (lbs. per MWh).
Pollutant\Efficiency 29.44% (rated output) 27.76% (80% output) 24.86% (50% output)
Carbon Dioxide 1,356.030 1,437.895 1,605.854
Nitrogen Oxides 1.066 1.131 1.263
Sulfur Dioxide 0.012 0.012 0.014
Page 16
Comparison of Vehicle-to-Grid versus Other Grid Support Technologies
15
4.2 Storage-‐based Technologies
Storage-based technologies do not directly generate electricity from fuels. Instead, they store
electricity from the grid and send it back when needed. The term round-trip efficiency is usually
used to describe the efficiency of storage systems. It is the ratio of electricity recovered from
system to the electricity consumed for storage. Although the operation of storage-based
technologies alone is almost emission-free, the electricity they consume and store is produced
with a mix of fuels that are not free from emissions. As discussed in detail in Chapter 5, the
reason for including the electricity generation, transmission and distribution into the analysis for
storage-based technologies is due to the fuel-to-grid scope adopted in this project. In the U.S.,
the transmission and distribution losses average about 7% of the output according to U.S. EIA’s
estimate [12].
4.2.1 Hydroelectric Pumped Storage
Hydroelectric pumped storage (HPS) is the only conventional, mature commercial grid-scale
electricity storage option available to date. Its use however, is strictly limited by the geographical
requirements. Many of the best sites today have been taken already. Pumped storage represents
the largest capacity versus other grid electricity storage options in the U.S., with an installed
capacity of 20,538 MW in 2010 (U.S. EIA). This technology stores energy by pumping water to
a high storage reservoir during off-peak hours, using excess baseload capacity from the grid.
During peak-hours, the stored water is released through turbines to produce electric power.
Pumped storage comes online very quickly, typically within seconds, and provides hundreds to
thousands of megawatts in a single facility, making them highly efficient in smoothing out
transient fluctuations in generation and load. Their ramping rate can exceed hundreds of
megawatts per minute. Built between 1976 and 1982 at Dinorwig, North Wales, the pumped
storage project there has the world’s fast response time, able to provide 1320 MW in 12 seconds
[13].
The round-trip efficiency of hydroelectric pumped storage varies with plants. An old-fashioned
pumped storage can have a round-trip efficiency (the ratio of electricity generated over the
electricity consumed for pumping water) lower than 60%. To date, the Federal Energy
Page 17
Comparison of Vehicle-to-Grid versus Other Grid Support Technologies
16
Regulatory Commission (FERC) has authorized a total of 24 pumped storage projects that are
constructed and in operation. Most of them were authorized more than 30 years ago. According
to Electricity Storage Association (ESA), the round-trip efficiency for a current pumped storage
project using a closed-loop system falls within the 70% to 85% range.
Figure 3. Illustrative schematic of a hydroelectric pumped storage project. Adapted from Federal
Energy Regulatory Commission.
The environmental impact of pumped storage is usually considered relatively small for two
reasons. First, the pumped storage requires a much smaller water reservoir than that of a
conventional hydroelectric power station. In addition, the typical design life of a pumped storage
station is 80-100 years. As a result, the environmental impact of pumped storage construction
and operation is very low.
Table 6. Key features about a hydroelectric pumped storage project.
Round-trip Efficiency 75% (nominal, by IEEE)
Life 80 – 100 years
Response Speed Within seconds
Power Hundreds to thousands of MW
Page 18
Comparison of Vehicle-to-Grid versus Other Grid Support Technologies
17
4.2.2 Battery Banks
With the technological advances in battery technology and the unlimited mobility in contrast to
pumped storage, battery banks have been utilized for maintaining the grid’s reliability for a few
years. The world’s largest installed battery bank is the 27 MW 15 minute nickel-cadmium
battery bank in Fairbanks, Alaska, switched on in 2003. Earlier this year however, a 36 MW
battery storage project was launched in China, using ferrous battery technology from a domestic
solar and auto company, BYD.
The battery storage usually suffers from three drawbacks: (1) large upfront and maintenance
costs, (2) a limited lifespan, and (3) a small capacity size (especially compared to pumped
storage). However, researchers from Stanford University have developed a new electrode that
can withstand 40,000 charging/discharging cycles in the laboratory. Even after the test this
electrode could still return to more than 80% of its original capacity [14].
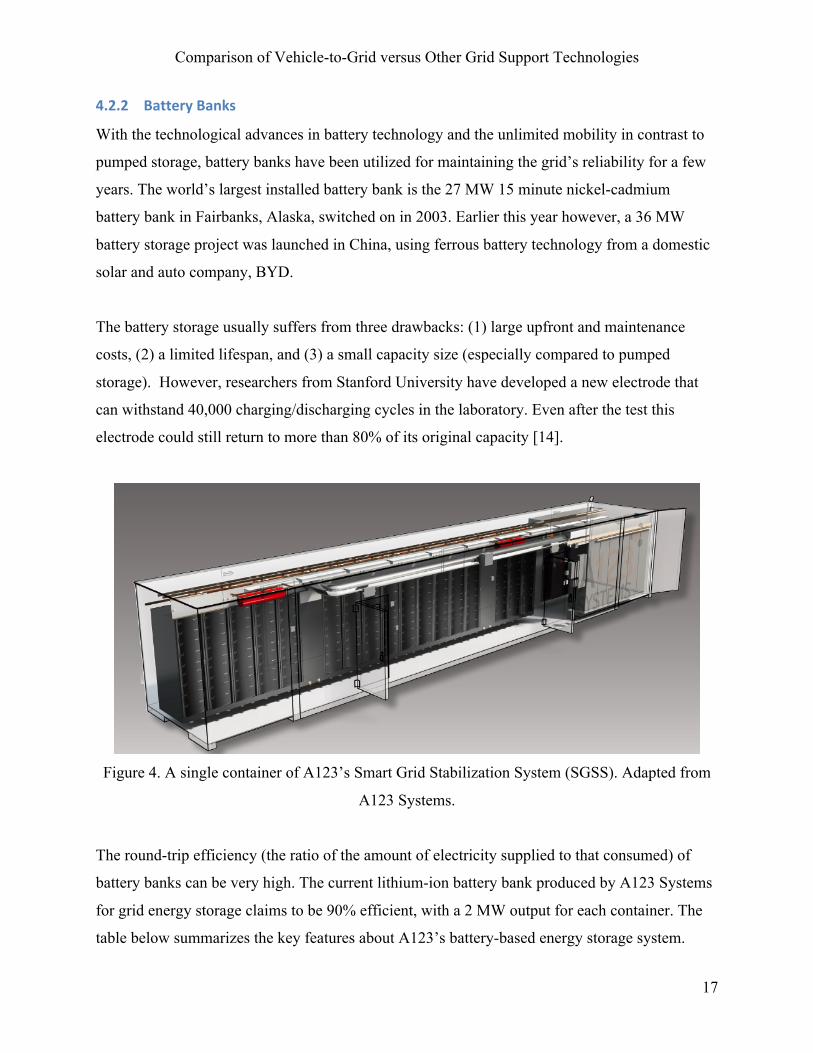
Figure 4. A single container of A123’s Smart Grid Stabilization System (SGSS). Adapted from
A123 Systems.
The round-trip efficiency (the ratio of the amount of electricity supplied to that consumed) of
battery banks can be very high. The current lithium-ion battery bank produced by A123 Systems
for grid energy storage claims to be 90% efficient, with a 2 MW output for each container. The
table below summarizes the key features about A123’s battery-based energy storage system.
Page 19
Comparison of Vehicle-to-Grid versus Other Grid Support Technologies
18
Table 7. Key features about a single container of A123’s Smart Grid Stabilization System
(SGSSTM). Data extracted from Grid Stability Battery Systems for Renewable Energy Success by
Charles Vartanian from A123 Systems.
Round-trip efficiency 90%
Cycle life 10,000 – multiple 100,000
depending on actual energy throughout
Response Speed 20 milliseconds
Energy Delivery Duration 15 minutes (at maximum power output)
Power 2 MW
Capacity 500 kWh
Like pumped storage, the operation of battery banks itself does not generate any emissions.
However, electrochemical energy stored in the battery comes from the grid, which in term comes
from a mix of fossil fuels, nuclear and renewables. Besides, improper disposure of batteries can
be very harmful to the environment. Appropriate regulation needs be enforced to make sure the
battery banks will be properly disposed when they are retired in the future.
4.2.3 Flywheels
A flywheel is a mechanical cylindrical assembly, or rotor, that stores energy as rotational energy.
When absorbing energy, the motor connected to the flywheel draws power from the grid to spin
the rotor at a high speed. When discharging, the motor switches to a generator mode and
converts the inertia energy of the rotor back to electric power. In other words, the flywheel
system is a kinetic, or mechanical battery, spinning at very high speeds to store energy that can
be instantly available when needed. Friction must be kept minimum to prolong the storage
duration, which is often achieved by placing the flywheel in a vacuum and using magnetic
bearings, tending to make this method expensive. Another cost contributor is the strong material
such as steel or composite materials required by high flywheel speeds.
Page 20
Comparison of Vehicle-to-Grid versus Other Grid Support Technologies
19
Figure 5. A single Smart Energy 25 Flywheel. Adapted from Beacon POWER.
A flywheel energy storage system can achieve a round-trip efficiency level as high as 85% [15].
Beacon POWER, a leading company in the flywheel-based energy storage solutions for grid-
scale frequency regulation services, claims that “for the frequency regulation application,
flywheel mechanical efficiency is over 97 percent, and total system round-trip charge/discharge
efficiency is 85 percent”. The table below summarizes the key features about Beacon POWER’s
flywheels.
Page 21
Comparison of Vehicle-to-Grid versus Other Grid Support Technologies
20
Table 8. Key features about a single Smart Energy 25 Flywheel produced by Beacon POWER.
Data extracted from Fact Sheet: Frequency Regulation and Flywheels by Beacon POWER.
Round-trip
efficiency 85%
Cycle Life Over 150,000 (full charge/discharge cycles at a constant full power
charge/discharge rate; 6,000 – 8,000 effective cycles per year)
Response Time < 4 seconds
Energy Delivery
Duration 15 minutes (at 16,000 rpm, maximum)
Power 100 kW (at 16,000 rpm, maximum)
Capacity 25 kWh (at 16,000 rpm, maximum)
4.2.4 V2G
Essentially, the technology of V2G is similar to that of battery banks. They both use batteries to
store electric power. For vehicle batteries to store and supply electricity to grid, the electric
power first goes through a conversion from alternate current (AC) to direct current (DC) before it
is later stored as electrochemical energy and stored in the battery. On its trip back to the grid, the
electrochemical energy is converted to DC power and eventually AC. The whole process can add
up to 20% or more losses of energy. Since V2G is still in its very early testing phase (only one
single EV has been tested for V2G to date in PJM [16]), the information on V2G is limited. For
the analysis, 80% is suggested by our project client General Electric and therefore assumed as
the round-trip efficiency for V2G.
Page 22
Comparison of Vehicle-to-Grid versus Other Grid Support Technologies
21
5 Analysis Methods
This project applies a fuel-to-grid scope to the analysis. For each grid support technology, their
fuel-to-grid efficiencies are calculated based on the efficiency of each process involved within
the scope. The emissions are then derived. The rest of this chapter gives a general introduction to
the methods used for the analysis while efficiency data have been presented in Chapter 4.
5.1 Fuel-‐to-‐grid Scope
To compare storage-based technologies to generation-based technologies, a fuel-to-grid scope is
adopted for the efficiency analysis. In other words, the efficiency at which fuels are converted to
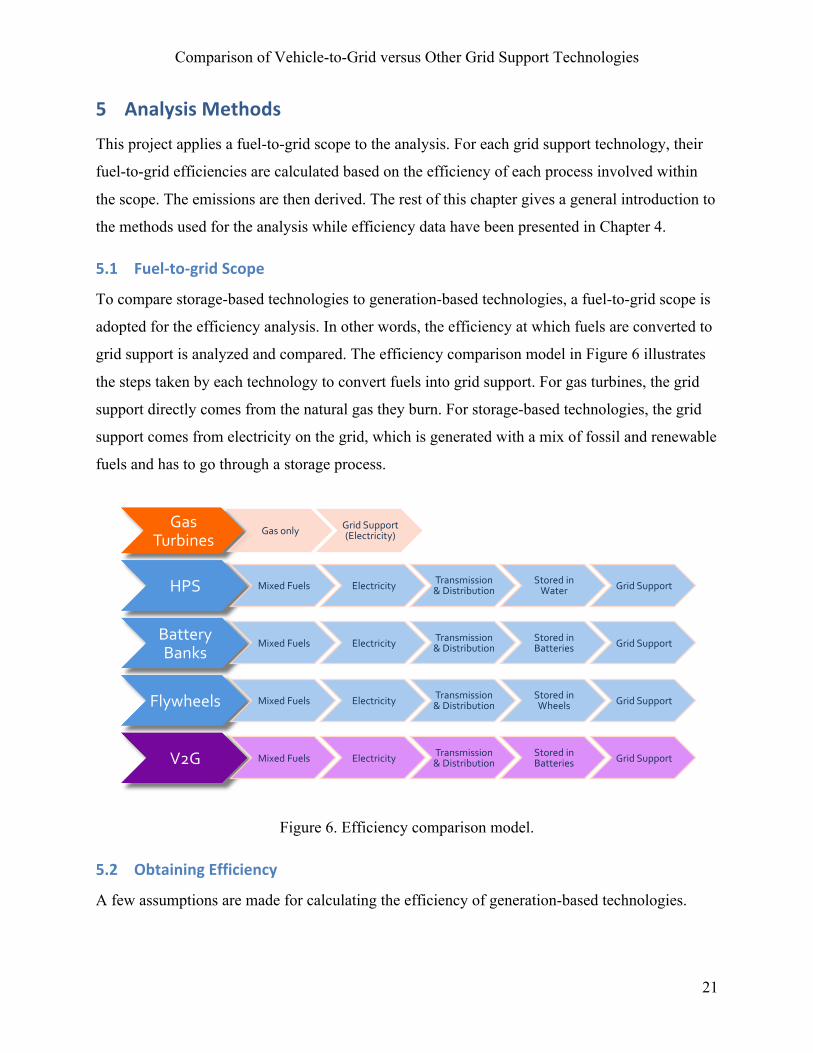
grid support is analyzed and compared. The efficiency comparison model in Figure 6 illustrates
the steps taken by each technology to convert fuels into grid support. For gas turbines, the grid
support directly comes from the natural gas they burn. For storage-based technologies, the grid
support comes from electricity on the grid, which is generated with a mix of fossil and renewable
fuels and has to go through a storage process.
Figure 6. Efficiency comparison model.
5.2 Obtaining Efficiency
A few assumptions are made for calculating the efficiency of generation-based technologies.
Gas Turbines
Gas only Grid Support (Electricity)
HPS Mixed Fuels Electricity Transmission & Distribution
Stored in Water Grid Support
Battery Banks
Mixed Fuels Electricity Transmission & Distribution
Stored in Batteries Grid Support
Flywheels Mixed Fuels Electricity Transmission & Distribution
Stored in Wheels Grid Support
V2G Mixed Fuels Electricity Transmission & Distribution
Stored in Batteries Grid Support
Page 23
Comparison of Vehicle-to-Grid versus Other Grid Support Technologies
22
First, open-cycle natural gas turbines are picked to represent the generation-based technologies;
and their industry average heat rate (generation efficiency) is used as basis. Second, the
efficiency for gas turbines is adjusted to efficiency losses that are caused by providing
regulation. Third, Carbon Capture & Sequestration (CCS) is excluded from the scope of our
analysis. The calculation uses U.S. EIA 2010 data as input.
For storage-based technologies, including HPS, battery banks, flywheels, and V2G, their
efficiencies are obtained through public information. In particular, for HPS, a nominal efficiency
rate by IEEE is used. For battery banks and flywheels, efficiencies of their current
commercialized products are used. For V2G, its efficiency is estimated based the nature of this
technology.
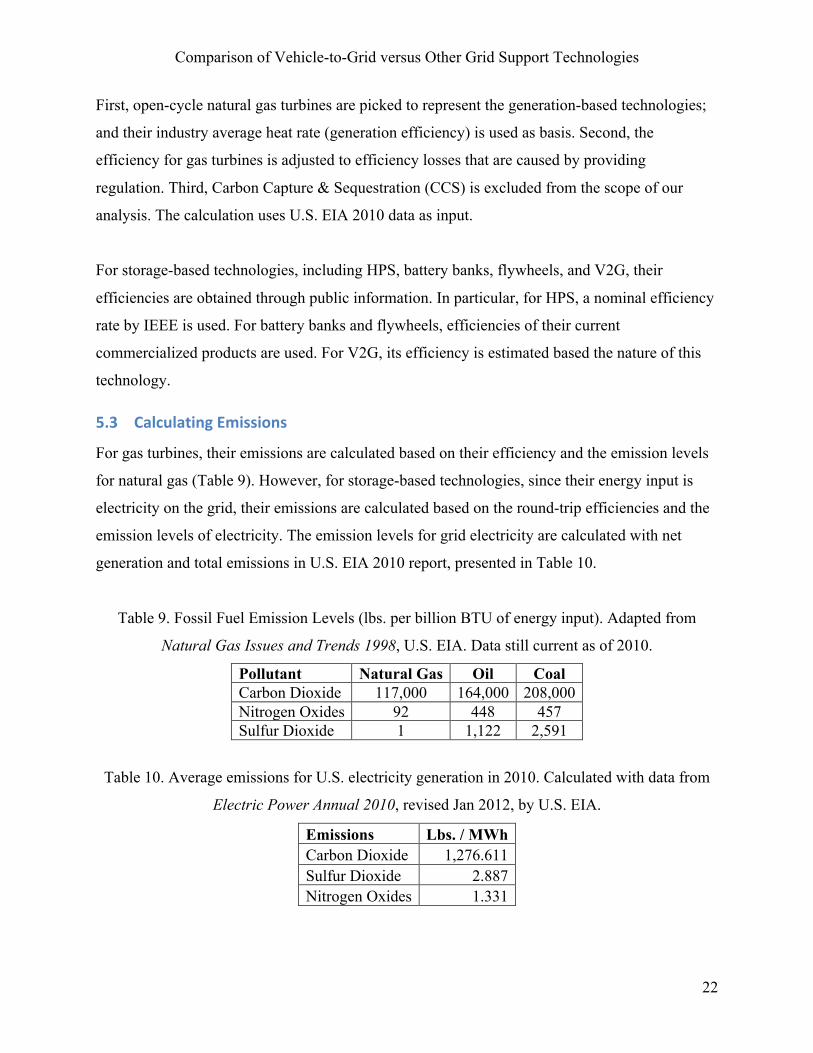
5.3 Calculating Emissions
For gas turbines, their emissions are calculated based on their efficiency and the emission levels
for natural gas (Table 9). However, for storage-based technologies, since their energy input is
electricity on the grid, their emissions are calculated based on the round-trip efficiencies and the
emission levels of electricity. The emission levels for grid electricity are calculated with net
generation and total emissions in U.S. EIA 2010 report, presented in Table 10.
Table 9. Fossil Fuel Emission Levels (lbs. per billion BTU of energy input). Adapted from
Natural Gas Issues and Trends 1998, U.S. EIA. Data still current as of 2010.
Pollutant Natural Gas Oil Coal Carbon Dioxide 117,000 164,000 208,000 Nitrogen Oxides 92 448 457 Sulfur Dioxide 1 1,122 2,591
Table 10. Average emissions for U.S. electricity generation in 2010. Calculated with data from
Electric Power Annual 2010, revised Jan 2012, by U.S. EIA.
Emissions Lbs. / MWh Carbon Dioxide 1,276.611 Sulfur Dioxide 2.887 Nitrogen Oxides 1.331
Page 24
Comparison of Vehicle-to-Grid versus Other Grid Support Technologies
23
6 Efficiency and Emission Comparisons
6.1 Efficiency Comparison
Table 11 below summarizes the efficiencies for different grid support technologies. It is clear
that storage-based technologies have much higher efficiencies by themselves. This is mostly due
to their technological nature of storing already-tapped energy instead of generating from the
fuels. Among the storage-based technologies, battery banks rank number one with 83.70%
efficiency while V2G is nearly 10% less efficient. Therefore, if efficiency is the only measure,
V2G seems to be an inferior option to battery banks for supplying regulation.
Table 11. Efficiency by grid support technology.
Grid Support Technology Efficiency Gas turbines, 80% 27.76% Gas turbines, 50% 24.86%
HPS 75.00% Battery Banks 90.00%
Flywheels 85.00% V2G 80.00%
To be able to compare generation-based technologies with storage-based technologies from a
fuel-to-grid perspective, the efficiency of electricity generation must be known. Unfortunately it
is unclear that how efficient the electricity is produced when the fuels include renewables. There
is no measure on energy inputs for renewables. However, it is clear that the fossil fuels are
converted into electricity at an average efficiency of 33% (which remained the same all the way
back to 1957 [17]). If 33% is used to represent the electricity generation efficiency, the resulting
fuel-to-grid efficiencies are still good enough for comparison purpose. The calculated fuel-to-
grid efficiencies are then presented in Table 12 and compared in Figure 7. From the comparison
it seems only battery banks are efficient enough to compete with gas turbines, assuming fossil
fuels are the only source for electricity generation. However, since highly efficient natural gas
generators and fossil fuel-free renewables are being added to generation, the lower efficiencies of
other grid support technologies can be considerably mitigated and may eventually become
irrelevant.
Page 25
Comparison of Vehicle-to-Grid versus Other Grid Support Technologies
24
Table 12. Fuel-to-grid efficiency by grid support technology, assuming electricity on the grid is
generated with fossil fuels only.
Grid Support Technology Fuel-to-grid Gas turbines, 80% 27.76% Gas turbines, 50% 24.86%
HPS 23.02% Battery Banks 27.62%
Flywheels 26.09% V2G 24.55%
Figure 7. Fuel-to-grid efficiency comparison by technology, assuming electricity on the grid is
generated with fossil fuels only.
23.02% 24.55% 24.86% 26.09%
27.62% 27.76%
HPS V2G Gas turbines, 50%
Flywheels Battery Banks Gas turbines, 80%
Fuel-‐to-‐grid EfSiciency by Grid Support Technology
Page 26
Comparison of Vehicle-to-Grid versus Other Grid Support Technologies
25
6.2 Emission Comparison
Based on emission and efficiency information discussed in previous chapters, Table 13 exhibits
the emissions caused by each grid support technology in lbs. to provide 1 MWh of grid-
supporting electricity. One general pattern can be observed from the table when comparing
generation-based to storage-based technologies – all of the storage-based technologies have
caused higher CO2, SO2, and NOx emissions.
Table 13. Emissions to provide 1 MWh of electricity for grid support in lbs. (Emissions for
storage-based technologies come from the grid electricity they consume, which in turn comes
from mixed fuels.)
Technology \ Emissions
Gas turbines, 80%
Gas turbines, 50% HPS Battery
Banks Flywheels V2G
Carbon Dioxide 1,438 1,606 1,830 1,525 1,615 1,716 Sulfur Dioxide 0.012 0.014 4.138 3.449 3.652 3.880
Nitrogen Oxides 1.131 1.263 1.909 1.591 1.684 1.789
The different emission levels of fossil fuels may explain the observation above. Table 9 shows
burning natural gas instead of coal will lead to a 43% reduction in CO2, 80% in NOx and almost
100% in SO2. In other words, generating electricity exclusively through natural gas is much
cleaner than that from a portfolio primarily consisting of coal and natural gas. Consequently,
storage technologies that consume grid electricity will increase the emissions. Figure 8, 9 and 10
illustrate the percentage changes in the amounts of emissions caused by grid support
technologies to provide 1 MWh of electricity for grid support in lbs. The baseline here is the
original amounts of emissions for 1 MWh of electricity on the grid (Table 10).
Page 27
Comparison of Vehicle-to-Grid versus Other Grid Support Technologies
26
Figure 8. Percentage changes in CO2 emissions compared to original emissions of producing 1
MWh of electricity.
Figure 9. Percentage changes in SO2 emissions compared to original emissions of producing 1
MWh of electricity.
Figure 10. Percentage changes in NOx emissions compared to original emissions of producing 1
MWh of electricity.
43.37% 34.41%
25.79% 26.50% 19.47%
12.63%
HPS V2G Gas turbines, 50%
Flywheels Battery Banks Gas turbines, 80%
Percentage Changes in CO2
43.37% 34.41%
-‐99.52%
26.50% 19.47%
-‐99.57%
HPS V2G Gas turbines, 50%
Flywheels Battery Banks Gas turbines, 80%
Percentage Changes in SO2
43.37% 34.41%
-‐5.15%
26.50% 19.47%
-‐15.07% HPS V2G Gas turbines, 50%
Flywheels Battery Banks Gas turbines, 80%
Percentage Changes in NOx
Page 28
Comparison of Vehicle-to-Grid versus Other Grid Support Technologies
27
7 Conclusions
Energy storage can relieve power generators from supplying grid support and hence improve
their performance. As the electricity generation is shifting towards more renewables, energy
storage can also help balance the variable power output of renewables, making them a more
reliable power source. When selecting the most suitable storage-based technology for grid
support or power balancing, the efficiency and emissions play an important role in the decision-
making process.
Three general conclusions can be drawn from the analysis of this project given the current U.S.
generation efficiency and fuel mix. First, energy storage-based technologies achieve a lower
fuel-to-grid efficiency than conventional gas turbines do. Second, V2G is less efficient in
delivering grid support than grid-dedicated battery banks and flywheels. Finally, storage-based
technologies, especially V2G, would significantly increase carbon dioxide, sulfur dioxide, and
nitrogen oxides emissions.
The application of V2G would seem unfavorable from an efficiency and emission perspective.
However, further studies on the technical feasibility and financial implications of large-scale
V2G application will be necessary before any firm conclusions can be made. Opportunities still
exist for the commercialization of V2G given its great mobility in supplying power at load as
well as the lower financial burden to utilities.
In order to address the efficiency and emission issues associated with V2G and other storage-
based technologies, the electricity generation efficiency must be improved and the fuel mix
become cleaner. In the short-term, old and inefficient power plants, especially coal-fired power
plants can be retired and replaced with both natural gas and renewables. Over the long run, a
significant shift towards renewables in electricity generation would be ideal for achieving an
efficient and environment use of electricity.
Page 29
Comparison of Vehicle-to-Grid versus Other Grid Support Technologies
28
8 References 1. Letendre, S.E., The V2G concept: A new model for power? Public Utilities Fortnightly, 2002.
140(4): p. 16-‐26. 2. PJM Manual 11: Energy & Ancillary Services Market Operations, PJM, Editor 2012, PJM. p. 54. 3. Car Prototype Generates Electricity, And Cash. 2007 [cited 2012 Jan 20]; Available from:
http://www.sciencedaily.com/releases/2007/12/071203133532.htm. 4. Kempton, W. and J. Tomić, Vehicle-‐to-‐grid power implementation: From stabilizing the grid to
supporting large-‐scale renewable energy. Journal of Power Sources, 2005. 144(1): p. 280-‐294.
5. Tomić, J. and W. Kempton, Using fleets of electric-‐drive vehicles for grid support. Journal of Power Sources, 2007. 168(2): p. 459-‐468.
6. Kempton, W. and J. Tomić, Vehicle-‐to-‐grid power fundamentals: Calculating capacity and net revenue. Journal of Power Sources, 2005. 144(1): p. 268-‐279.
7. Brooks, A.N., Vehicle-‐to-‐Grid Demonstration Project: Grid Regulation Ancillary Service with a Battery Electric Vehicle, 2002, AC Propulsion, Inc.
8. A.J., S. Gas-‐Fired Power. 2010 [cited 2012 Mar. 4]; Available from: http://iea-etsap.org/web/Highlights PDF/E02-gas_fired_power-GS-AD-gct 1.pdf.
9. Post, W. Wind Power And CO2 Emissions. 2011 [cited 2012 Feb. 30]; Available from: http://theenergycollective.com/willem-post/64492/wind-energy-reduces-co2-emissions-few-percent.
10. Emissions Comparison for a 20 MW Flywheel-‐based Frequency Regulation Power Plant, 2007, KEMA Inc.
11. Database of State Incentives for Renewables & Efficiency. 12. How much electricity is lost in transmission and distribution in the United States? 2011 [cited
2012 Feb. 25]; Available from: http://www.eia.gov/tools/faqs/faq.cfm?id=105&t=3. 13. Schainker, R.B. Executive overview: energy storage options for a sustainable energy future. in
Power Engineering Society General Meeting, 2004. IEEE. 2004. 14. 3. Enabling grid scale battery storage systems. Inside R&D 2011 [cited 2012 22 Feb.];
Available from: http://go.galegroup.com/ps/i.do?id=GALE%7CA275852351&v=2.1&u=duke_perkins&it=r&p=ITOF&sw=w.
15. 2. Flywheel technology for grid frequency regulation. Inside R&D 2011 [cited 2012 20 Feb.]; Available from: http://go.galegroup.com/ps/i.do?id=GALE%7CA268480596&v=2.1&u=duke_perkins&it=r&p=ITOF&sw=w.
16. Kempton, W., et al., A Test of Vehicle-‐to-‐Grid (V2G) for Energy Storage and Frequency Regulation in the PJM System, 2008, University of Delaware.
17. Casten, S. Power Plant Efficiency Hasn't Improved Since 1957. 2008 [cited 2012 Mar. 10, 2012]; Available from: http://cleantechnica.com/2008/06/26/electricity-generation-efficiency-its-not-about-the-technology/.