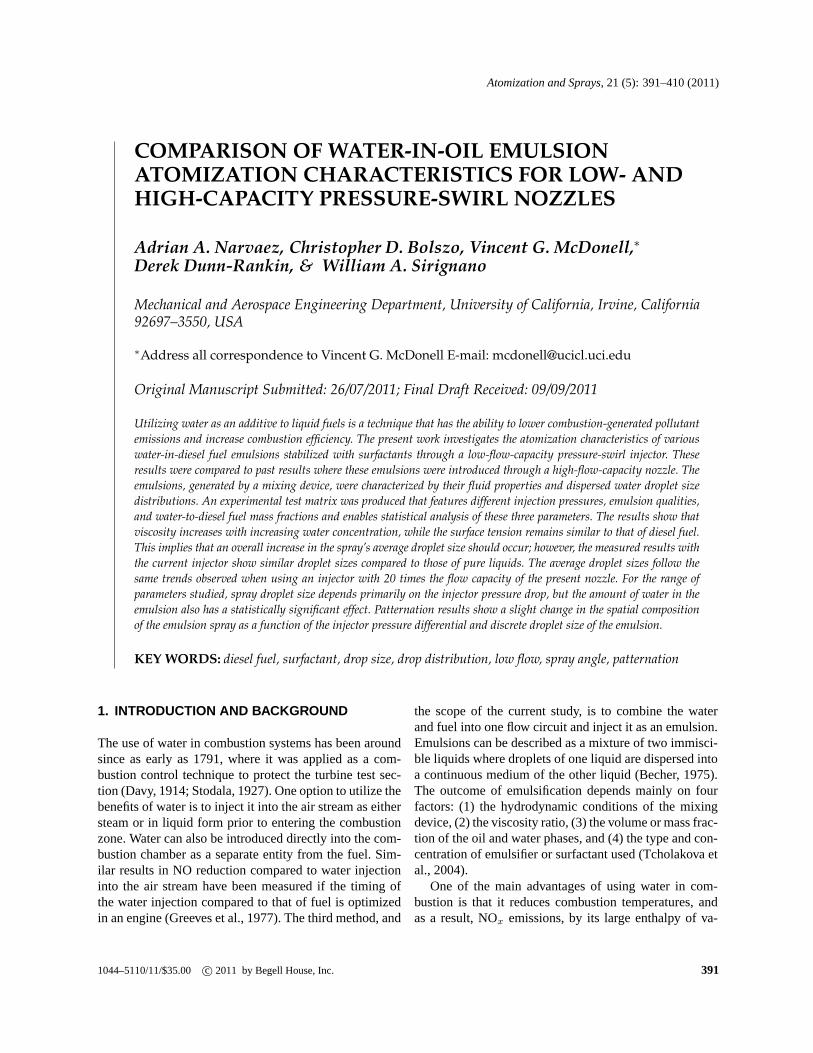
Atomization and Sprays, 21 (5): 391–410 (2011) COMPARISON OF WATER-IN-OIL EMULSION ATOMIZATION CHARACTERISTICS FOR LOW- AND HIGH-CAPACITY PRESSURE-SWIRL NOZZLES Adrian A. Narvaez, Christopher D. Bolszo, Vincent G. McDonell, * Derek Dunn-Rankin, & William A. Sirignano Mechanical and Aerospace Engineering Department, University of California, Irvine, California 92697–3550, USA * Address all correspondence to Vincent G. McDonell E-mail: [email protected]Original Manuscript Submitted: 26/07/2011; Final Draft Received: 09/09/2011 Utilizing water as an additive to liquid fuels is a technique that has the ability to lower combustion-generated pollutant emissions and increase combustion efficiency. The present work investigates the atomization characteristics of various water-in-diesel fuel emulsions stabilized with surfactants through a low-flow-capacity pressure-swirl injector. These results were compared to past results where these emulsions were introduced through a high-flow-capacity nozzle. The emulsions, generated by a mixing device, were characterized by their fluid properties and dispersed water droplet size distributions. An experimental test matrix was produced that features different injection pressures, emulsion qualities, and water-to-diesel fuel mass fractions and enables statistical analysis of these three parameters. The results show that viscosity increases with increasing water concentration, while the surface tension remains similar to that of diesel fuel. This implies that an overall increase in the spray’s average droplet size should occur; however, the measured results with the current injector show similar droplet sizes compared to those of pure liquids. The average droplet sizes follow the same trends observed when using an injector with 20 times the flow capacity of the present nozzle. For the range of parameters studied, spray droplet size depends primarily on the injector pressure drop, but the amount of water in the emulsion also has a statistically significant effect. Patternation results show a slight change in the spatial composition of the emulsion spray as a function of the injector pressure differential and discrete droplet size of the emulsion. KEY WORDS: diesel fuel, surfactant, drop size, drop distribution, low flow, spray angle, patternation 1. INTRODUCTION AND BACKGROUND The use of water in combustion systems has been around since as early as 1791, where it was applied as a com- bustion control technique to protect the turbine test sec- tion (Davy, 1914; Stodala, 1927). One option to utilize the benefits of water is to inject it into the air stream as either steam or in liquid form prior to entering the combustion zone. Water can also be introduced directly into the com- bustion chamber as a separate entity from the fuel. Sim- ilar results in NO reduction compared to water injection into the air stream have been measured if the timing of the water injection compared to that of fuel is optimized in an engine (Greeves et al., 1977). The third method, and the scope of the current study, is to combine the water and fuel into one flow circuit and inject it as an emulsion. Emulsions can be described as a mixture of two immisci- ble liquids where droplets of one liquid are dispersed into a continuous medium of the other liquid (Becher, 1975). The outcome of emulsification depends mainly on four factors: (1) the hydrodynamic conditions of the mixing device, (2) the viscosity ratio, (3) the volume or mass frac- tion of the oil and water phases, and (4) the type and con- centration of emulsifier or surfactant used (Tcholakova et al., 2004). One of the main advantages of using water in com- bustion is that it reduces combustion temperatures, and as a result, NO x emissions, by its large enthalpy of va- 1044–5110/11/$35.00 c 2011 by Begell House, Inc. 391
Transcript
AtomizationandSprays, 21 (5): 391–410 (2011)
COMPARISON OF WATER-IN-OIL EMULSIONATOMIZATION CHARACTERISTICS FOR LOW- ANDHIGH-CAPACITY PRESSURE-SWIRL NOZZLES
Adrian A. Narvaez, Christopher D. Bolszo, Vincent G. McDonell,∗Derek Dunn-Rankin, & William A. Sirignano
Mechanical and Aerospace Engineering Department, University of California, Irvine, California92697–3550, USA
∗Address all correspondence to Vincent G. McDonell E-mail: [email protected]
Original Manuscript Submitted: 26/07/2011; Final Draft Received: 09/09/2011
Utilizing water as an additive to liquid fuels is a technique that has the ability to lower combustion-generated pollutantemissions and increase combustion efficiency. The present work investigates the atomization characteristics of variouswater-in-diesel fuel emulsions stabilized with surfactants through a low-flow-capacity pressure-swirl injector. Theseresults were compared to past results where these emulsions were introduced through a high-flow-capacity nozzle. Theemulsions, generated by a mixing device, were characterized by their fluid properties and dispersed water droplet sizedistributions. An experimental test matrix was produced that features different injection pressures, emulsion qualities,and water-to-diesel fuel mass fractions and enables statistical analysis of these three parameters. The results show thatviscosity increases with increasing water concentration, while the surface tension remains similar to that of diesel fuel.This implies that an overall increase in the spray’s average droplet size should occur; however, the measured results withthe current injector show similar droplet sizes compared to those of pure liquids. The average droplet sizes follow thesame trends observed when using an injector with 20 times the flow capacity of the present nozzle. For the range ofparameters studied, spray droplet size depends primarily on the injector pressure drop, but the amount of water in theemulsion also has a statistically significant effect. Patternation results show a slight change in the spatial compositionof the emulsion spray as a function of the injector pressure differential and discrete droplet size of the emulsion.
KEY WORDS: diesel fuel, surfactant, drop size, drop distribution, low flow, spray angle, patternation
1. INTRODUCTION AND BACKGROUND
The use of water in combustion systems has been aroundsince as early as 1791, where it was applied as a com-bustion control technique to protect the turbine test sec-tion (Davy, 1914; Stodala, 1927). One option to utilize thebenefits of water is to inject it into the air stream as eithersteam or in liquid form prior to entering the combustionzone. Water can also be introduced directly into the com-bustion chamber as a separate entity from the fuel. Sim-ilar results in NO reduction compared to water injectioninto the air stream have been measured if the timing ofthe water injection compared to that of fuel is optimizedin an engine (Greeves et al., 1977). The third method, and
the scope of the current study, is to combine the waterand fuel into one flow circuit and inject it as an emulsion.Emulsions can be described as a mixture of two immisci-ble liquids where droplets of one liquid are dispersed intoa continuous medium of the other liquid (Becher, 1975).The outcome of emulsification depends mainly on fourfactors: (1) the hydrodynamic conditions of the mixingdevice, (2) the viscosity ratio, (3) the volume or mass frac-tion of the oil and water phases, and (4) the type and con-centration of emulsifier or surfactant used (Tcholakova etal., 2004).
One of the main advantages of using water in com-bustion is that it reduces combustion temperatures, andas a result, NOx emissions, by its large enthalpy of va-
Cd nozzledischarge coefficientd droplet diameterdo fuel nozzle diameterDF2 low-sulfur diesel fuel #2FN flow numberHLB hydrophilic–lipophilic balanceMMD mass median diameter (Dv50)ReN nozzle Reynolds numberSMD Sauter mean diameter (D32)t liquid film thickness
Greek Symbolsρ density
σ surface tensionµ dynamic viscosity∆P injector pressure differentialΦ water-to-diesel mass
fractionm injector mass flow rateβ spray angleθ spray half angle
SubscriptsA airL liquidW water
porization and its larger capacity to absorb heat com-pared to dry air (Wagner et al., 2008). This helps reducethermal stress on the components and prolongs the in-tegrity of the materials in the combustion system (Tsenev,1983). For water and fuel emulsions, the addition of wa-ter produces a reduction in viscosity, enabling the benefitsof easier handling and pumping (Marcano and Williams,1991). Upon introduction of an emulsion into the com-bustion zone, water droplets within the fuel can promotethe phenomena of microexplosions, where the water flashvaporizes within the fuel droplet after atomization, in-ducing secondary droplet breakup. This can potentiallyimprove mixing and can increase both the combustionand thermal efficiencies while lowering sooting propen-sity (Kadota and Yamasaki, 2002). Finally, as mentionedin related work by the authors (Bolszo et al., 2010), awater-in-oil emulsion system would have minimal enginemodifications when compared to water injection into theair stream or direct injection into the combustion zonewhere additional hardware would be needed and wouldincrease manufacturing costs.
Several challenges exist with water and fuel emulsionsthat hinder its widespread implementation and use. Theamount of energy needed to form a certain type of emul-sion is fairly large, due to the fact that most of the en-ergy is lost as heat (thermal dissipation) or converted intomomentum for phase contacting (hydrodynamic mixing)(Walstra, 1993). The challenge lies in designing mixingequipment that properly utilizes the energy dissipationwhere it would be most beneficial (Fradette et al., 2007).The mixing of the two liquids (phases) and the result-
ing stability of an emulsion can also cause problems withrepeatable formation and consistency (Sjogren, 1977). Afew of these obstacles are addressed in the present work.
Macroemulsions have been traditionally made withmechanical devices that force a mixture of two com-ponents (phases) through small passages to create high-shear interactions. Magnetic stirrers and continuous pas-sage through gear pumps were also utilized to producecoarse emulsions (Tsenev, 1983). The current researchuses a variable geometry and speed rotor/stator mixingdevice to form a repeatable and controlled water and fuelmixture. Various two- and three-phase emulsions can re-sult, depending on the mass fractions of each fluid and,if used, the amount and type of surfactant involved. Asurfactant is a substance that when present has the prop-erty of adsorbing onto the surfaces or interfaces of a sys-tem (component liquids), altering to a degree the sur-face or interfacial free energies of those surfaces or in-terfaces (Rosen, 1989). They are classified based on theirhydrophilic–lipophilic balance (HLB). HLB values canrange from 1 to 18; between 3 and 6 a water-in-oil emul-sion is formed, and between 6 and 12 an oil-in-wateremulsion is formed. The interfacial free energy is the min-imum amount of work required to create that interface.Therefore surfactants significantly change the amount ofwork required to expand the water and oil interfaces. Thisallows smaller droplets to be formed and reduces the abil-ity for these droplets to coalesce into larger ones (Sajjadi,2007; Fradette et al., 2007). Surfactants can also stabilizean emulsion, which can be convenient for studying theatomization behavior in a systematic manner.
Different atomization strategies are presently utilizedfor use in combustion technologies. Previous literature forwater and oil emulsions used both twin-fluid and pressureatomizers. Air-blast and air-assist atomizers expose theliquid fuel as a jet or sheet to a stream of high-velocityair, using momentum to break the liquid into droplets,while pressure atomizers rely on the conversion of pres-sure into kinetic energy to achieve a high relative velocitybetween the liquid and the surrounding air. Pressure atom-izers are more common in gas turbine applications and arethe type of atomizer utilized in our current investigation.The effective flow area of a pressure atomizer is usuallydescribed by its flow number (FN), which is expressed asthe ratio of the mass flow through the nozzle to the squareroot of the fuel injection pressure differential and liquiddensity:
FN =m√
ρL∆P(1)
Atomization characteristicssuch as representativedroplet diameters, like Sauter mean diameter (SMD orD32) and mass median diameter (MMD orD50), are oneof the many ways to characterize a spray. Lefebvre (1989)formulated an SMD correlation for pressure simplex noz-zles defined as
SMD = 2.25σ0.25L µ0.25
L m0.25L ∆P−0.5
L ρ−0.25a (2)
whereσL is the fluid surface tension,µL is the fluid vis-cosity,ρA is the air density,∆PL is the injector pressuredrop, andmL is the fuel mass flow rate. Wang and Lefeb-vre (1987) further optimized the correlation by includingthe film thickness and spray cone angle,
SMD = 4.52(
σµ2L
ρA∆P 2L
)0.25
(t cos θ)0.25
+ 0.39(
σρL
ρA∆PL
)0.25
(t cos θ)0.75 (3)
Heret is thefilm thickness, andθ is the spray cone half-angle. The film thickness can be calculated using the fol-lowing equation, which includes the discharge orifice di-ameter,do:
t = 2.7[dOFNµL√
∆PLρL
]0.25
(4)
Both thesecorrelations can be compared with experimen-tal data to quantify the change in droplet size betweenemulsions and its component liquids.
The majority of previous research focuses on the for-mation of emulsions and their performance in different
combustion technologies without delving much into theatomization and synergy and the relationship among thethree. For solely observing engine performance, this is ac-ceptable; however, understanding the atomization of theemulsion fuel can help explain and closely predict differ-ent trends for general application in various combustiontechnologies. Recent work has examined the role of emul-sion characteristics on atomization behavior for a large-capacity injector (Bolszo et al., 2010). The present workexpands this prior work to include the role of injector ca-pacity in the atomization behavior of pressure atomizersinjecting water and diesel fuel emulsions.
2. OBJECTIVE AND APPROACH
The objectives of the current study are as follows:
1. Collect spray testing data through a low-flow-capacity pressure-swirl nozzle at different pressures,emulsion qualities, and oil-to-water ratios using laserdiffraction technique, a fabricated patternator, andhigh-speed video.
2. Use analysis of variance (ANOVA) to correlate theobserved spray behavior with the parameters varied.
3. Compare results for a low-flow-capacity nozzle withthose previously obtained for a high-flow-capacitynozzle and assess how the nozzle scale affects therole of the emulsion on atomization characteristics.
3. EXPERIMENT
3.1 Test Fluids
The four test liquids utilized in the study are water, low-sulfur diesel distillate fuel #2 (DF2), a water-soluble sur-factant polyoxyethylene sorbitan trioleate (Tween 85),and an oil soluble surfactant sorbitan monooleate (Span80). These are the same liquids used in the previous studydone at the University of California, Irvine, CombustionLab (UCICL) (Bolszo et al., 2010). The measured fluidproperties of the four liquids are shown in Table 1 as areference.
The same overall HLB value of about 6 is used, whichprovides the most stable water-in-oil emulsion (Song etal., 2000). A Span 80/Tween 85 mass ratio of 75/25 yieldsan HLB value of 5.975, which produces the desired emul-sion type. The same experimental procedure and match-ing generator settings were used during the previous high-flow-nozzle study when making a water-in-oil emulsion(Bolszo et al., 2010).
Volume 21, Number 5, 2011
394 Narvaezet al.
TABLE 1: Liquid of interest and their properties in current study (laboratory ambient condi-tions) (Bolszo et al., 2010)
Water Dieselfuel Tween85 Span80Chemicalformula H2O C10−14H20−28 C60H108O8 (C2H4O)n C24H44O6
Density, kg/m3 1012 825 1028 994Viscosity, kg/m s 1.37E-03 2.93E-03
Surfacetension, kg/s2 0.0693 0.0280HLB value 11 4.3
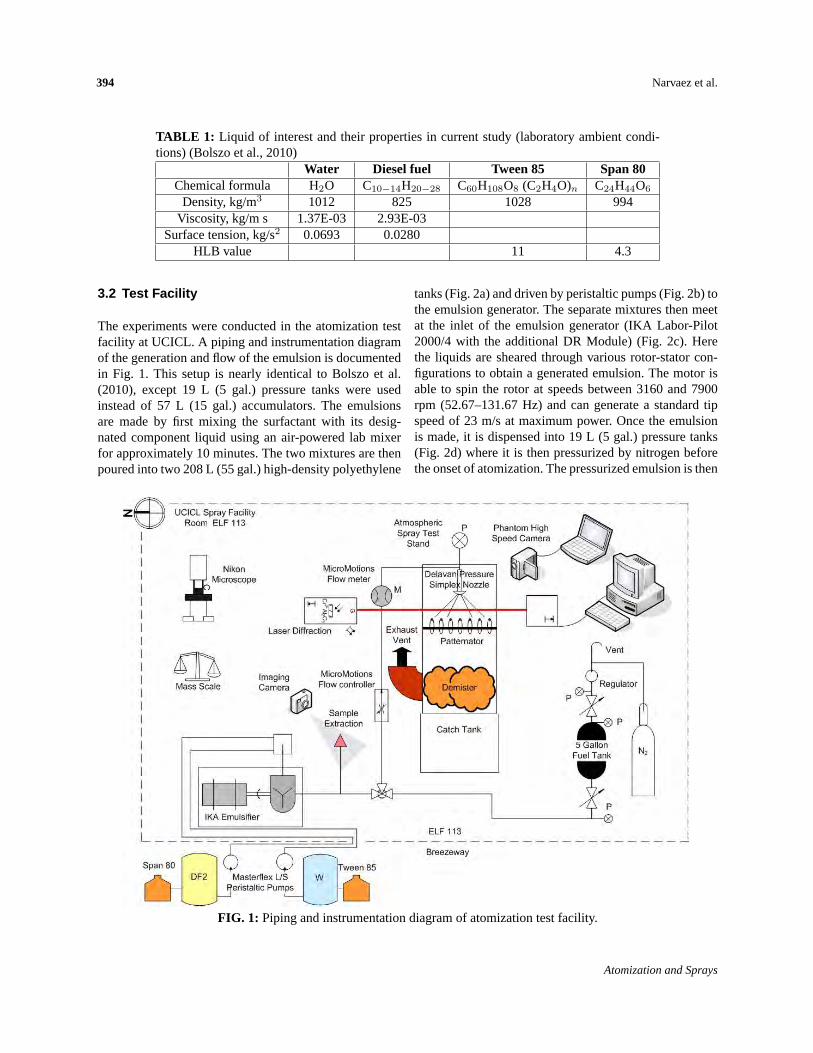
3.2 Test Facility
The experiments were conducted in the atomization testfacility at UCICL. A piping and instrumentation diagramof the generation and flow of the emulsion is documentedin Fig. 1. This setup is nearly identical to Bolszo et al.(2010), except 19 L (5 gal.) pressure tanks were usedinstead of 57 L (15 gal.) accumulators. The emulsionsare made by first mixing the surfactant with its desig-nated component liquid using an air-powered lab mixerfor approximately 10 minutes. The two mixtures are thenpoured into two 208 L (55 gal.) high-density polyethylene
tanks (Fig. 2a) and driven by peristaltic pumps (Fig. 2b) tothe emulsion generator. The separate mixtures then meetat the inlet of the emulsion generator (IKA Labor-Pilot2000/4 with the additional DR Module) (Fig. 2c). Herethe liquids are sheared through various rotor-stator con-figurations to obtain a generated emulsion. The motor isable to spin the rotor at speeds between 3160 and 7900rpm (52.67–131.67 Hz) and can generate a standard tipspeed of 23 m/s at maximum power. Once the emulsionis made, it is dispensed into 19 L (5 gal.) pressure tanks(Fig. 2d) where it is then pressurized by nitrogen beforethe onset of atomization. The pressurized emulsion is then
FIG. 1: Pipingand instrumentation diagram of atomization test facility.
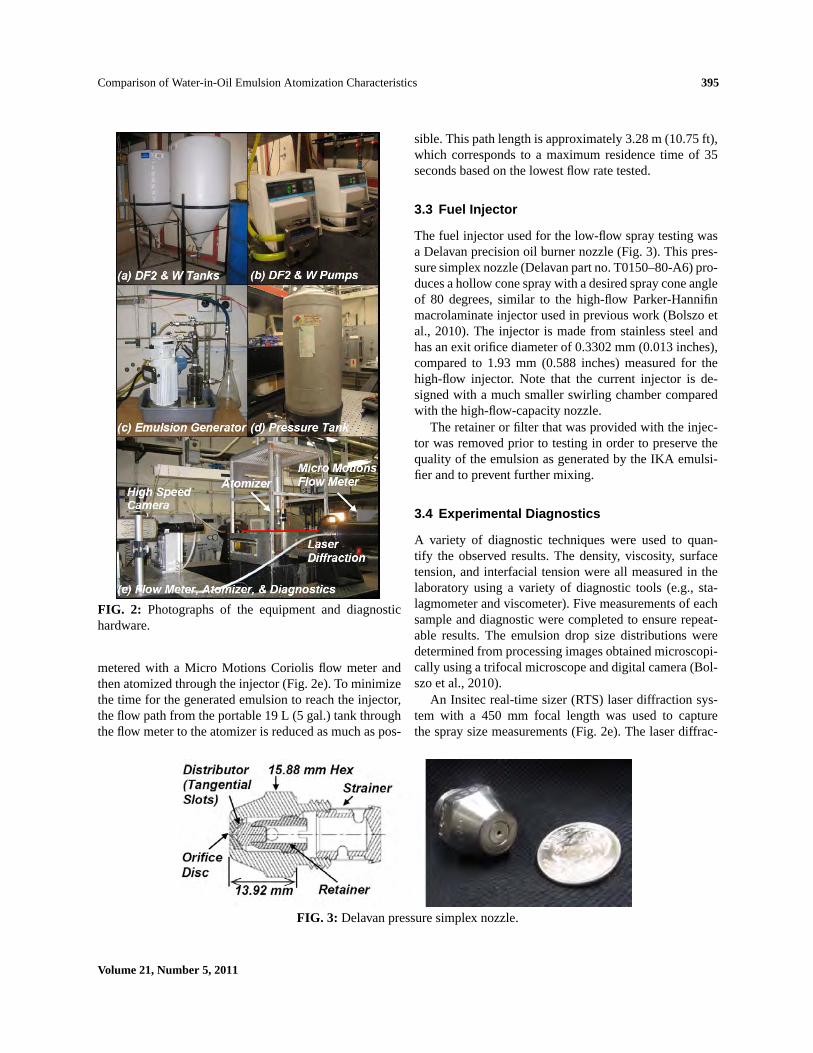
FIG. 2: Photographsof the equipment and diagnostichardware.
metered with a Micro Motions Coriolis flow meter andthen atomized through the injector (Fig. 2e). To minimizethe time for the generated emulsion to reach the injector,the flow path from the portable 19 L (5 gal.) tank throughthe flow meter to the atomizer is reduced as much as pos-
sible. This path length is approximately 3.28 m (10.75 ft),which corresponds to a maximum residence time of 35seconds based on the lowest flow rate tested.
3.3 Fuel Injector
The fuel injector used for the low-flow spray testing wasa Delavan precision oil burner nozzle (Fig. 3). This pres-sure simplex nozzle (Delavan part no. T0150–80-A6) pro-duces a hollow cone spray with a desired spray cone angleof 80 degrees, similar to the high-flow Parker-Hannifinmacrolaminate injector used in previous work (Bolszo etal., 2010). The injector is made from stainless steel andhas an exit orifice diameter of 0.3302 mm (0.013 inches),compared to 1.93 mm (0.588 inches) measured for thehigh-flow injector. Note that the current injector is de-signed with a much smaller swirling chamber comparedwith the high-flow-capacity nozzle.
The retainer or filter that was provided with the injec-tor was removed prior to testing in order to preserve thequality of the emulsion as generated by the IKA emulsi-fier and to prevent further mixing.
3.4 Experimental Diagnostics
A variety of diagnostic techniques were used to quan-tify the observed results. The density, viscosity, surfacetension, and interfacial tension were all measured in thelaboratory using a variety of diagnostic tools (e.g., sta-lagmometer and viscometer). Five measurements of eachsample and diagnostic were completed to ensure repeat-able results. The emulsion drop size distributions weredetermined from processing images obtained microscopi-cally using a trifocal microscope and digital camera (Bol-szo et al., 2010).
An Insitec real-time sizer (RTS) laser diffraction sys-tem with a 450 mm focal length was used to capturethe spray size measurements (Fig. 2e). The laser diffrac-
FIG. 3: Delavan pressure simplex nozzle.
Volume 21, Number 5, 2011
396 Narvaezet al.
tion system is able to obtain time-resolved measurementsof the spray such as representative diameters like thespray SMD and MMD orD50. For the current study thelaser measurement area was positioned 2.54 cm down-stream of the nozzle exit where maximum transmissionwas achieved, compared to 3 cm during the high-flowstudy.
A Vision Research Phantom v7.1 digital high-speedvideo camera (Fig. 2e) was used to record the dynamicsof the spray. A maximum sample rate of 15,037 fps with a2 µs exposure was applied to obtain the fastest resolutionwith effective lighting. These were the same settings usedby Bolszo et al. (2010).
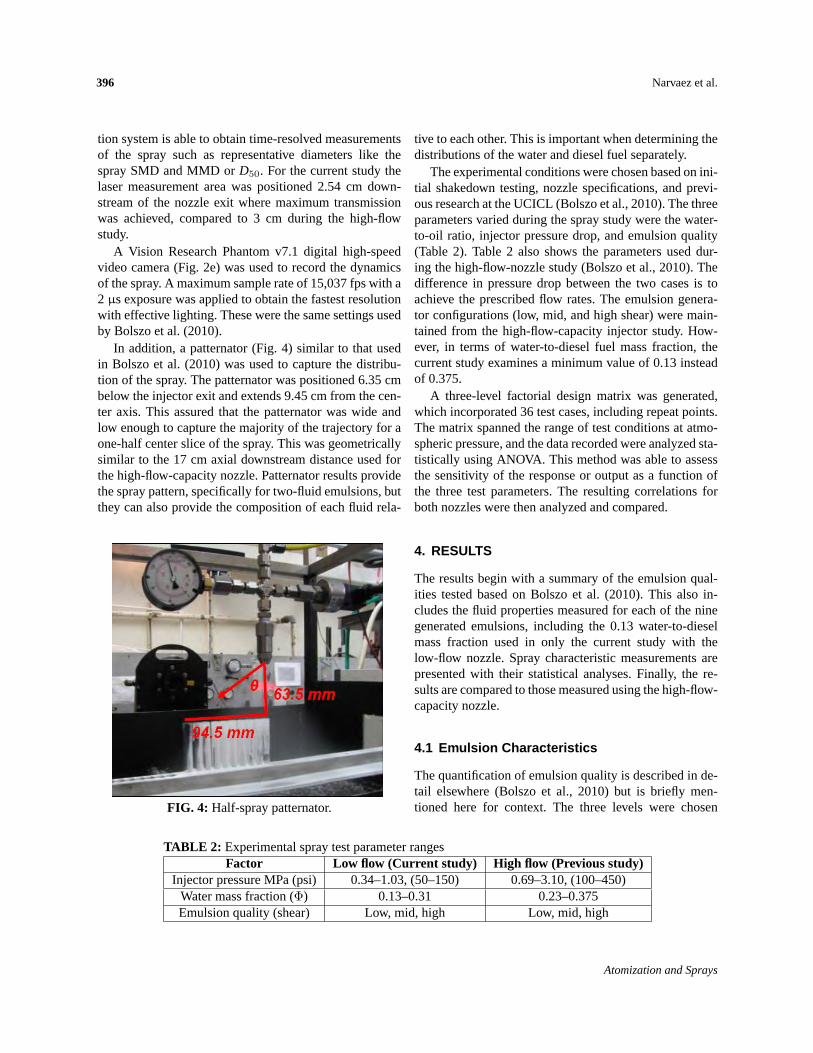
In addition, a patternator (Fig. 4) similar to that usedin Bolszo et al. (2010) was used to capture the distribu-tion of the spray. The patternator was positioned 6.35 cmbelow the injector exit and extends 9.45 cm from the cen-ter axis. This assured that the patternator was wide andlow enough to capture the majority of the trajectory for aone-half center slice of the spray. This was geometricallysimilar to the 17 cm axial downstream distance used forthe high-flow-capacity nozzle. Patternator results providethe spray pattern, specifically for two-fluid emulsions, butthey can also provide the composition of each fluid rela-
FIG. 4: Half-spraypatternator.
tive to each other. This is important when determining thedistributions of the water and diesel fuel separately.
The experimental conditions were chosen based on ini-tial shakedown testing, nozzle specifications, and previ-ous research at the UCICL (Bolszo et al., 2010). The threeparameters varied during the spray study were the water-to-oil ratio, injector pressure drop, and emulsion quality(Table 2). Table 2 also shows the parameters used dur-ing the high-flow-nozzle study (Bolszo et al., 2010). Thedifference in pressure drop between the two cases is toachieve the prescribed flow rates. The emulsion genera-tor configurations (low, mid, and high shear) were main-tained from the high-flow-capacity injector study. How-ever, in terms of water-to-diesel fuel mass fraction, thecurrent study examines a minimum value of 0.13 insteadof 0.375.
A three-level factorial design matrix was generated,which incorporated 36 test cases, including repeat points.The matrix spanned the range of test conditions at atmo-spheric pressure, and the data recorded were analyzed sta-tistically using ANOVA. This method was able to assessthe sensitivity of the response or output as a function ofthe three test parameters. The resulting correlations forboth nozzles were then analyzed and compared.
4. RESULTS
The results begin with a summary of the emulsion qual-ities tested based on Bolszo et al. (2010). This also in-cludes the fluid properties measured for each of the ninegenerated emulsions, including the 0.13 water-to-dieselmass fraction used in only the current study with thelow-flow nozzle. Spray characteristic measurements arepresented with their statistical analyses. Finally, the re-sults are compared to those measured using the high-flow-capacity nozzle.
4.1 Emulsion Characteristics
The quantification of emulsion quality is described in de-tail elsewhere (Bolszo et al., 2010) but is briefly men-tioned here for context. The three levels were chosen
TABLE 2: Experimental spray test parameter rangesFactor Low flow (Current study) High flow (Previous study)
InjectorpressureMPa (psi) 0.34–1.03,(50–150) 0.69–3.10,(100–450)Watermass fraction (Φ) 0.13–0.31 0.23–0.375Emulsionquality (shear) Low, mid, high Low, mid, high
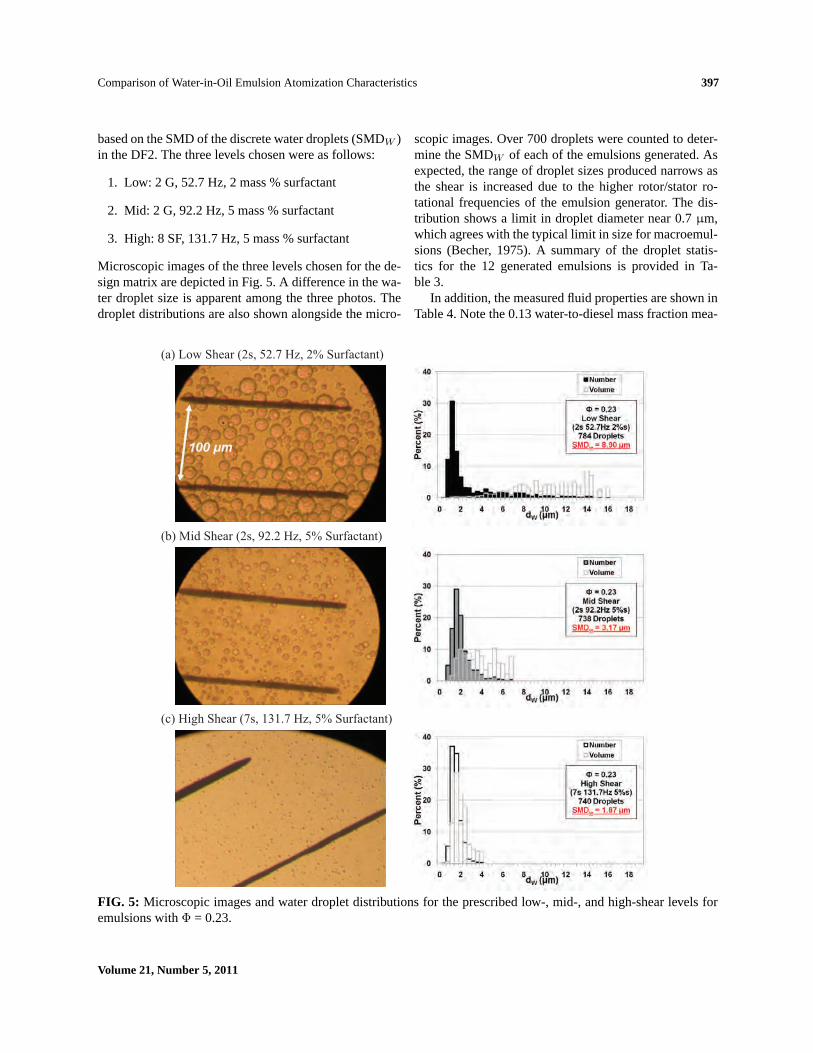
based on the SMD of the discrete water droplets (SMDW )in the DF2. The three levels chosen were as follows:
1. Low: 2 G, 52.7 Hz, 2 mass % surfactant
2. Mid: 2 G, 92.2 Hz, 5 mass % surfactant
3. High: 8 SF, 131.7 Hz, 5 mass % surfactant
Microscopic images of the three levels chosen for the de-sign matrix are depicted in Fig. 5. A difference in the wa-ter droplet size is apparent among the three photos. Thedroplet distributions are also shown alongside the micro-
scopic images. Over 700 droplets were counted to deter-mine the SMDW of each of the emulsions generated. Asexpected, the range of droplet sizes produced narrows asthe shear is increased due to the higher rotor/stator ro-tational frequencies of the emulsion generator. The dis-tribution shows a limit in droplet diameter near 0.7µm,which agrees with the typical limit in size for macroemul-sions (Becher, 1975). A summary of the droplet statis-tics for the 12 generated emulsions is provided in Ta-ble 3.
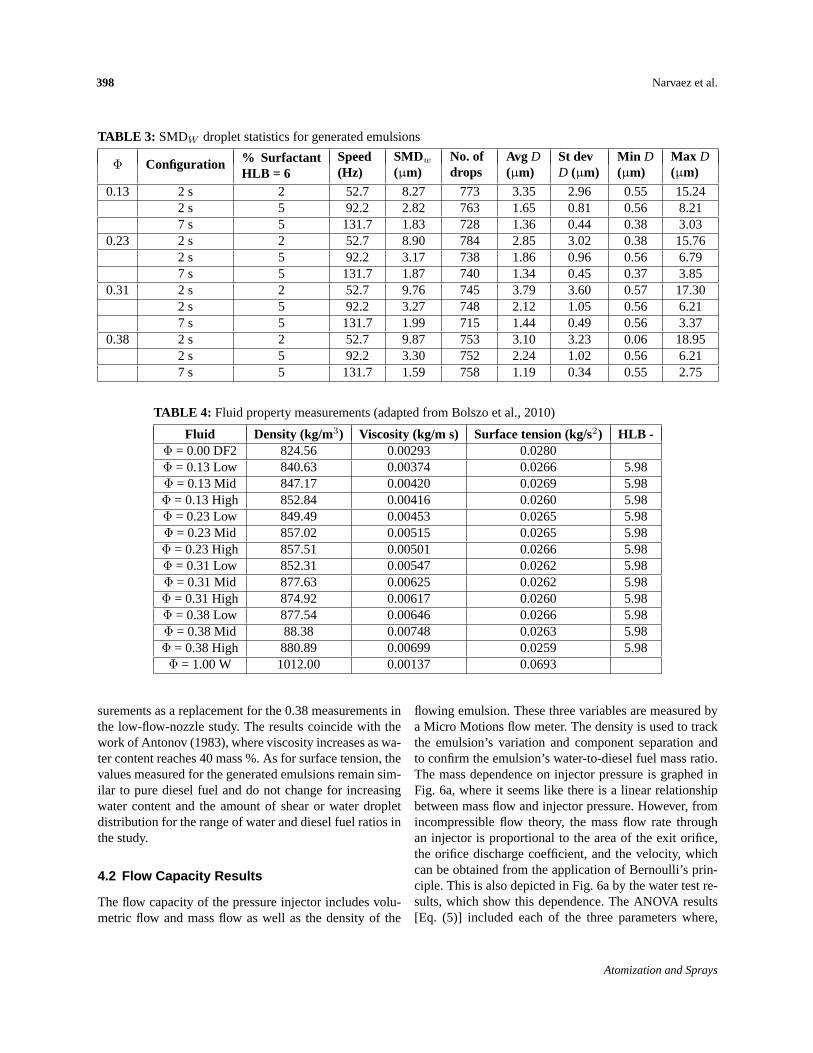
In addition, the measured fluid properties are shown inTable 4. Note the 0.13 water-to-diesel mass fraction mea-
(a) Low Shear (2s, 52.7 Hz, 2% Surfactant)
(b) Mid Shear (2s, 92.2 Hz, 5% Surfactant)
(c) High Shear (7s, 131.7 Hz, 5% Surfactant)
FIG. 5: Microscopicimages and water droplet distributions for the prescribed low-, mid-, and high-shear levels foremulsions withΦ = 0.23.
Volume 21, Number 5, 2011
398 Narvaezet al.
TABLE 3: SMDW droplet statistics for generated emulsions
Φ Configuration % SurfactantHLB = 6
Speed(Hz)
SMDw
(µm)No. ofdrops
Avg D(µm)
St devD (µm)
Min D(µm)
Max D(µm)
0.13 2 s 2 52.7 8.27 773 3.35 2.96 0.55 15.242 s 5 92.2 2.82 763 1.65 0.81 0.56 8.217 s 5 131.7 1.83 728 1.36 0.44 0.38 3.03
0.23 2 s 2 52.7 8.90 784 2.85 3.02 0.38 15.762 s 5 92.2 3.17 738 1.86 0.96 0.56 6.797 s 5 131.7 1.87 740 1.34 0.45 0.37 3.85
0.31 2 s 2 52.7 9.76 745 3.79 3.60 0.57 17.302 s 5 92.2 3.27 748 2.12 1.05 0.56 6.217 s 5 131.7 1.99 715 1.44 0.49 0.56 3.37
0.38 2 s 2 52.7 9.87 753 3.10 3.23 0.06 18.952 s 5 92.2 3.30 752 2.24 1.02 0.56 6.217 s 5 131.7 1.59 758 1.19 0.34 0.55 2.75
TABLE 4: Fluid property measurements (adapted from Bolszo et al., 2010)
surementsasa replacement for the 0.38 measurements inthe low-flow-nozzle study. The results coincide with thework of Antonov (1983), where viscosity increases as wa-ter content reaches 40 mass %. As for surface tension, thevalues measured for the generated emulsions remain sim-ilar to pure diesel fuel and do not change for increasingwater content and the amount of shear or water dropletdistribution for the range of water and diesel fuel ratios inthe study.
4.2 Flow Capacity Results
The flow capacity of the pressure injector includes volu-metric flow and mass flow as well as the density of the
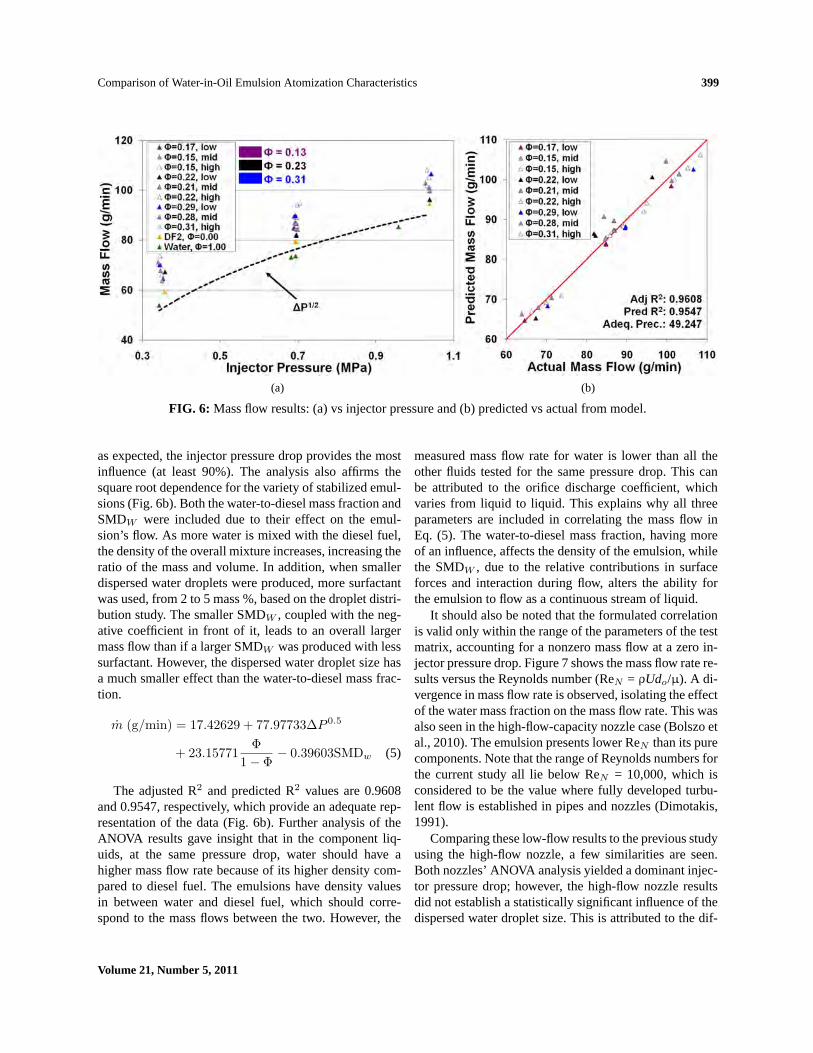
flowing emulsion. These three variables are measured bya Micro Motions flow meter. The density is used to trackthe emulsion’s variation and component separation andto confirm the emulsion’s water-to-diesel fuel mass ratio.The mass dependence on injector pressure is graphed inFig. 6a, where it seems like there is a linear relationshipbetween mass flow and injector pressure. However, fromincompressible flow theory, the mass flow rate throughan injector is proportional to the area of the exit orifice,the orifice discharge coefficient, and the velocity, whichcan be obtained from the application of Bernoulli’s prin-ciple. This is also depicted in Fig. 6a by the water test re-sults, which show this dependence. The ANOVA results[Eq. (5)] included each of the three parameters where,
FIG. 6: Massflow results: (a) vs injector pressure and (b) predicted vs actual from model.
as expected, the injector pressure drop provides the mostinfluence (at least 90%). The analysis also affirms thesquare root dependence for the variety of stabilized emul-sions (Fig. 6b). Both the water-to-diesel mass fraction andSMDW were included due to their effect on the emul-sion’s flow. As more water is mixed with the diesel fuel,the density of the overall mixture increases, increasing theratio of the mass and volume. In addition, when smallerdispersed water droplets were produced, more surfactantwas used, from 2 to 5 mass %, based on the droplet distri-bution study. The smaller SMDW , coupled with the neg-ative coefficient in front of it, leads to an overall largermass flow than if a larger SMDW was produced with lesssurfactant. However, the dispersed water droplet size hasa much smaller effect than the water-to-diesel mass frac-tion.
m (g/min) = 17.42629 + 77.97733∆P 0.5
+ 23.15771Φ
1− Φ− 0.39603SMDw (5)
The adjustedR2 and predicted R2 values are 0.9608and 0.9547, respectively, which provide an adequate rep-resentation of the data (Fig. 6b). Further analysis of theANOVA results gave insight that in the component liq-uids, at the same pressure drop, water should have ahigher mass flow rate because of its higher density com-pared to diesel fuel. The emulsions have density valuesin between water and diesel fuel, which should corre-spond to the mass flows between the two. However, the
measured mass flow rate for water is lower than all theother fluids tested for the same pressure drop. This canbe attributed to the orifice discharge coefficient, whichvaries from liquid to liquid. This explains why all threeparameters are included in correlating the mass flow inEq. (5). The water-to-diesel mass fraction, having moreof an influence, affects the density of the emulsion, whilethe SMDW , due to the relative contributions in surfaceforces and interaction during flow, alters the ability forthe emulsion to flow as a continuous stream of liquid.
It should also be noted that the formulated correlationis valid only within the range of the parameters of the testmatrix, accounting for a nonzero mass flow at a zero in-jector pressure drop. Figure 7 shows the mass flow rate re-sults versus the Reynolds number (ReN = ρUdo/µ). A di-vergence in mass flow rate is observed, isolating the effectof the water mass fraction on the mass flow rate. This wasalso seen in the high-flow-capacity nozzle case (Bolszo etal., 2010). The emulsion presents lower ReN than its purecomponents. Note that the range of Reynolds numbers forthe current study all lie below ReN = 10,000, which isconsidered to be the value where fully developed turbu-lent flow is established in pipes and nozzles (Dimotakis,1991).
Comparing these low-flow results to the previous studyusing the high-flow nozzle, a few similarities are seen.Both nozzles’ ANOVA analysis yielded a dominant injec-tor pressure drop; however, the high-flow nozzle resultsdid not establish a statistically significant influence of thedispersed water droplet size. This is attributed to the dif-
Volume 21, Number 5, 2011
400 Narvaezet al.
FIG. 7: Massflow rate versus ReN results.
ferences in the flow/swirl passages between the currentinjector with the high-flow-capacity injector. Specifically,the passages within the Parker nozzle are significantlylarger (swirl chamber diameter of 9.00 mm with three in-let ports) than those in the Delavan nozzle (swirl chamberdiameter of 2.29 mm with four inlet ports), and a largedifference of the flow rates between the two is noted. Thisorder-of-magnitude difference in the exit orifice diameter,as well as the difference in swirl chamber geometry, canalso account for this exclusion. Figure 8 plots both sets ofmass flow rates for both injectors. The graph shows sim-ilar trends with an increasing injector pressure drop, as isexpected with square root dependency. The key signifi-
cant difference between the two nozzles is that the watermass flow rates for the high-flow nozzle are all greaterthan the emulsion and diesel fuel mass flow rates for agiven pressure drop. This also coincides with the fact thatthe orifice discharge coefficient (Cd) as well as the orificesize varies from liquid to liquid, which was to be expectedand can be attributed to the amount of variation betweencases.
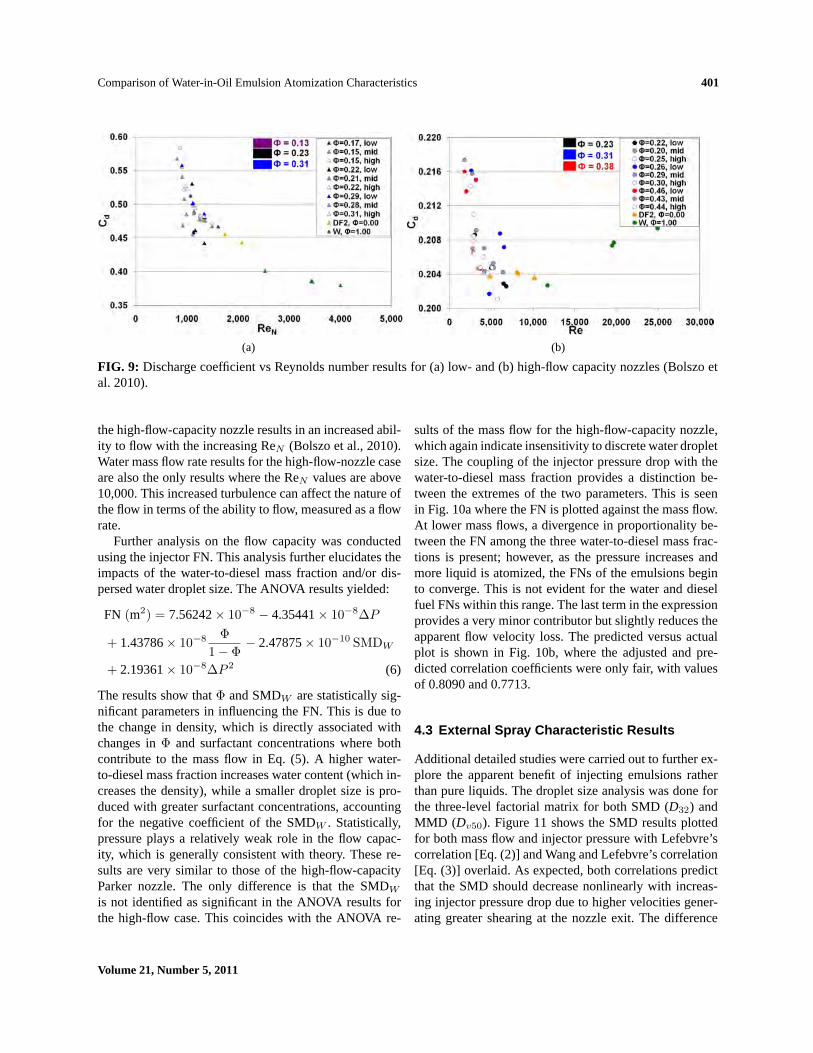
Figure 9 shows this flow rate dependence on the noz-zle discharge coefficient. Both sets of data show similaremulsion and diesel fuel results where as theΦ increased,the Cd decreased at increasing ReN . Water presents theonly significant variation between the two nozzles, where
FIG. 8: Massflow rate vs pressure drop for both low- and high-flow nozzles (Bolszo et al., 2010).
FIG. 9: Discharge coefficient vs Reynolds number results for (a) low- and (b) high-flow capacity nozzles (Bolszo etal. 2010).
the high-flow-capacity nozzle results in an increased abil-ity to flow with the increasing ReN (Bolszo et al., 2010).Water mass flow rate results for the high-flow-nozzle caseare also the only results where the ReN values are above10,000. This increased turbulence can affect the nature ofthe flow in terms of the ability to flow, measured as a flowrate.
Further analysis on the flow capacity was conductedusing the injector FN. This analysis further elucidates theimpacts of the water-to-diesel mass fraction and/or dis-persed water droplet size. The ANOVA results yielded:
FN (m2) = 7.56242× 10⁻⁸ − 4.35441× 10⁻⁸∆P
+ 1.43786× 10⁻⁸ Φ1− Φ
− 2.47875× 10⁻¹⁰ SMDW
+ 2.19361× 10⁻⁸∆P 2 (6)
Theresultsshow thatΦ and SMDW are statistically sig-nificant parameters in influencing the FN. This is due tothe change in density, which is directly associated withchanges inΦ and surfactant concentrations where bothcontribute to the mass flow in Eq. (5). A higher water-to-diesel mass fraction increases water content (which in-creases the density), while a smaller droplet size is pro-duced with greater surfactant concentrations, accountingfor the negative coefficient of the SMDW . Statistically,pressure plays a relatively weak role in the flow capac-ity, which is generally consistent with theory. These re-sults are very similar to those of the high-flow-capacityParker nozzle. The only difference is that the SMDW
is not identified as significant in the ANOVA results forthe high-flow case. This coincides with the ANOVA re-
sults of the mass flow for the high-flow-capacity nozzle,which again indicate insensitivity to discrete water dropletsize. The coupling of the injector pressure drop with thewater-to-diesel mass fraction provides a distinction be-tween the extremes of the two parameters. This is seenin Fig. 10a where the FN is plotted against the mass flow.At lower mass flows, a divergence in proportionality be-tween the FN among the three water-to-diesel mass frac-tions is present; however, as the pressure increases andmore liquid is atomized, the FNs of the emulsions beginto converge. This is not evident for the water and dieselfuel FNs within this range. The last term in the expressionprovides a very minor contributor but slightly reduces theapparent flow velocity loss. The predicted versus actualplot is shown in Fig. 10b, where the adjusted and pre-dicted correlation coefficients were only fair, with valuesof 0.8090 and 0.7713.
4.3 External Spray Characteristic Results
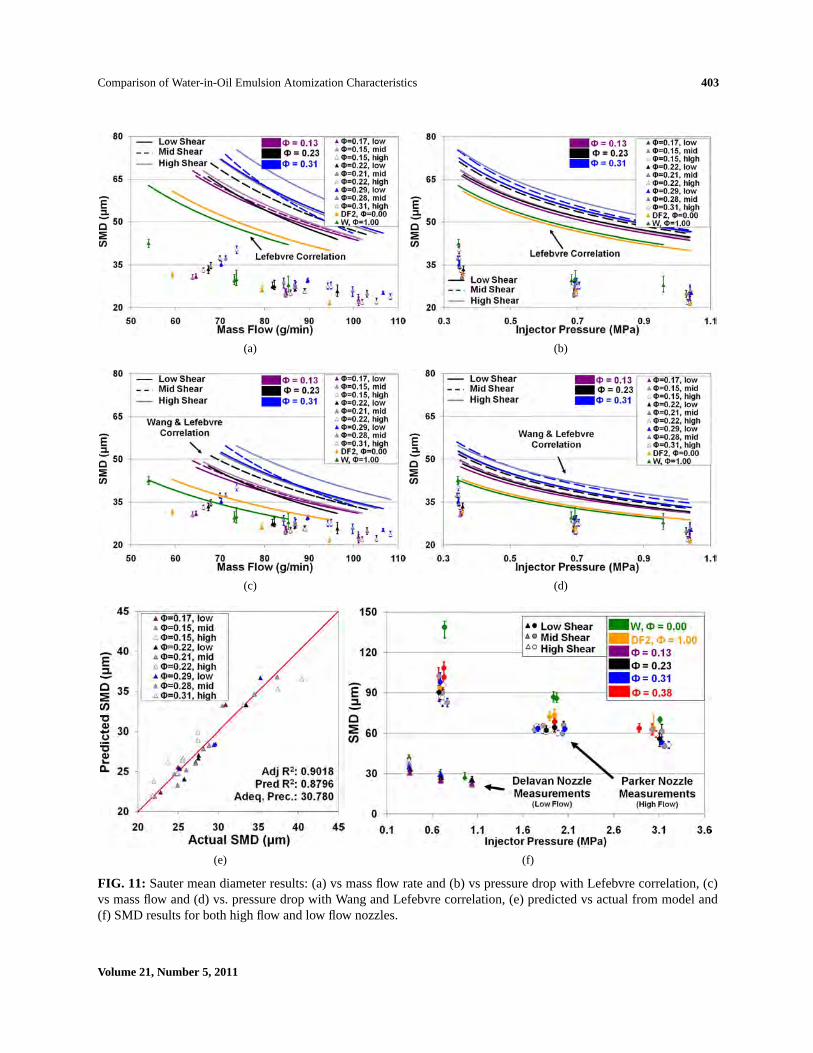
Additional detailed studies were carried out to further ex-plore the apparent benefit of injecting emulsions ratherthan pure liquids. The droplet size analysis was done forthe three-level factorial matrix for both SMD (D32) andMMD (Dv50). Figure 11 shows the SMD results plottedfor both mass flow and injector pressure with Lefebvre’scorrelation [Eq. (2)] and Wang and Lefebvre’s correlation[Eq. (3)] overlaid. As expected, both correlations predictthat the SMD should decrease nonlinearly with increas-ing injector pressure drop due to higher velocities gener-ating greater shearing at the nozzle exit. The difference
Volume 21, Number 5, 2011
402 Narvaezet al.
(a) (b)
FIG. 10: Flow number results: (a) vs mass flow rate and (b) predicted vs actual from model.
in SMD is also captured by the correlations where largerdroplets are produced for emulsions with more water con-tent due to the increase in viscosity. In addition, the com-ponent liquids have lower measured SMD values for agiven mass flow compared to the emulsions in relation toboth Eqs. (2) and (3), and this can also be seen in Fig. 11.The level of shear, or dispersed water droplet size, is alsocaptured by the correlations (dotted, dashed, and solidlines) due to the viscosity difference. Additionally, theWang and Lefebvre correlation predicts lower SMD val-ues compared to Lefebvre’s correlation, where the Wangand Lefebvre correlation more closely matches the exper-imental results. This was also expected due to the inclu-sion of two additional factors: spray angle and film thick-ness, which provide an overall better prediction. Theseobservations using both correlations are exactly the sameas the observations mentioned in the high-flow-nozzlecase. One difference between the current study and Bol-szo et al. (2010) is that the coefficients in Eqs. (2) and (3)were optimized to correspond to the measured data. Bol-szo et al. (2010) used coefficients of 2.7 instead of 2.25 inEq. (2) and 1.12 and 0.8 instead of 4.52 and 0.39, respec-tively, in Eq. (3). The original coefficients in Eqs. (2) and(3) were used to define the geometries of a specific noz-zle; therefore, these values can be changed from nozzleto nozzle. From the previous study (Bolszo et al., 2010)the ANOVA model yielded a better correlation than eitherof the two modified equations, suggesting that these twocorrelations do not fully capture the behavior of the emul-sions through the high-flow-capacity nozzle. For the cur-rent study, modified coefficients were experimented with
as well, and it was concluded that the ANOVA model cor-related with the data better than the modified Lefebvreand Wang and Lefebvre equations. Therefore, for the sakeof the figures, the original coefficients were used to plotboth Eqs. (2) and (3).
The laser diffraction measured SMDs are also depictedin Fig. 11. The component liquids resulted in slightlylower SMD values than the majority of the emulsion re-sults for a given pressure drop. This is portrayed betterin Figs. 11b–11d where the measured component liquidsfollow the correlation and water produces larger dropletsthan diesel fuel. These low-flow-capacity nozzle resultsdiffer from the high-flow nozzle where the componentliquid droplet sizes had larger SMD values than the emul-sions (Bolszo et al., 2010). However, the range in SMDvalues produced for the high-flow nozzle is double (al-most triple in some cases) that for the low-flow-nozzleresults (Fig. 11f), adding to this slight difference is SMDvalues of the component liquids versus emulsions. Theemulsions also follow the correlation for different water-to-diesel mass fractions, where more water content pro-duces larger drops. This result is consistent to those of thehigh-flow-capacity nozzle case, where the difference inthe shear or dispersed water droplet size does not seem toimpact the spray SMD substantially. Interestingly, mea-surements above 60 g/min for the current study result inSMD values within the same range between 20 and 35µm, indicating that for the current nozzle, a minimumlimit in SMD is reached as more mass is flowed. This con-tradicts the correlated values where the emulsion SMDsshould be larger over the range tested. This suggests that
FIG. 11: Sautermean diameter results: (a) vs mass flow rate and (b) vs pressure drop with Lefebvre correlation, (c)vs mass flow and (d) vs. pressure drop with Wang and Lefebvre correlation, (e) predicted vs actual from model and(f) SMD results for both high flow and low flow nozzles.
Volume 21, Number 5, 2011
404 Narvaezet al.
the fluid properties and/or water-dispersed droplet sizesdo not significantly affect the spray breakup behavior inthe manner expected (from the correlations), resulting inmuch lower SMD values.
The comparison of droplet sizes places focus on theeffect of swirl and swirl chamber size in breakup anddroplet formation. The average calculated film thick-nesses for all experimental cases of the two nozzles are1.9 and 0.116 mm for the high-flow and low-flow noz-zles, respectively. The emulsion itself also plays a roll inthe film thickness, where its value is larger than thosefor the pure liquids (approximately 15–20% higher thandiesel fuel). The film thickness expression is a func-tion of FN and the orifice discharge diameter [Eq. (4)],which account for the difference between the two noz-zles. This order-of-magnitude difference contributes tothe large variation between the calculated droplet sizesusing the Wang and Lefebvre expression [Eq. (3)]. Theemulsion droplet results mimic the component liquid re-sults more than what was predicted [from Eqs. (2) and(3)], adding to its ability to interchange with diesel fuelin an engine regardless of its viscosity. Similarly, withthe high-flow-nozzle results the surfactants used to cre-ate the emulsions are limited by the rapid change of sur-face area development during atomization. The very shorttime scales within the injector prevent the transport of sur-factant molecules to newly created surfaces, neglectingthe surfactant’s overall contribution to the fuel properties(Leal-Calderon et al., 1998).
The ANOVA analysis for the SMD results producedEq. (7). As expected, ANOVA indicates that the injectorpressure drop and water-to-diesel mass fraction are signif-icant based on Bolszo et al. (2010). However, the analysisdid not find the dispersed water droplet term (SMDW ) tobe a significant contributor. This is in contrast to the massflow and FN for which the ANOVA indicated that the dis-persed phase droplet size was significant. Thus the typeof shear on water droplet formation does not significantlyaffect the SMD results. This exclusion of the SMDW termfurther suggests that the surfactants, shear rate, and/orthe combination of both do not affect the overall dropletsizes within the range of the test parameters. Thereforethe atomization of surfactant-containing emulsions maybehave as unstable emulsions that result in similar spraycharacteristics to those of the separate component liquids.The results found in the current study use the same termsdeemed significant by the high-flow-nozzle case (Bolszoet al., 2010). The injector pressure drop dominates theoverall SMD, accounting for approximately 80% of thevalue, while theΦ accounts for only 20% of the SMD.
The adjusted and predictedR2 values for the design are0.9018 and 0.8796, respectively. The predicted versus ac-tual SMD plot is provided in Fig. 11e.
SMD(µm) = 45.23− 50.20∆P + 15.69Φ
1− Φ+ 24.19∆P 2 (7)
TheDv50 or MMD was the other representative dropletanalyzed. The data follow trends similar to those ofthe SMD (Fig. 12a). Diesel fuel produces the smallestdroplet sizes, while the higher water content emulsionsproduce the largest. The ANOVA analysis yielded thesame terms as the SMD analysis, where the injector pres-sure drop plays the dominant role in establishing the over-all spray MMD, promoting shorter breakup lengths andhigher velocities. Increasing the pressure drop decreasesthe droplet sizes, while more water in the emulsion leadsto greater droplet spray sizes. This generally agrees withthe results from the larger nozzle but at three times theMMD throughout the experimental conditions (Figs. 12cand 12d). Note the spread in data is represented by the er-ror bars, but are smaller due to the relative scale (30 to 70µm for the low-flow nozzle compared to 30 to 240µm forthe high-flow nozzle, where the error bars are not readilyseen).
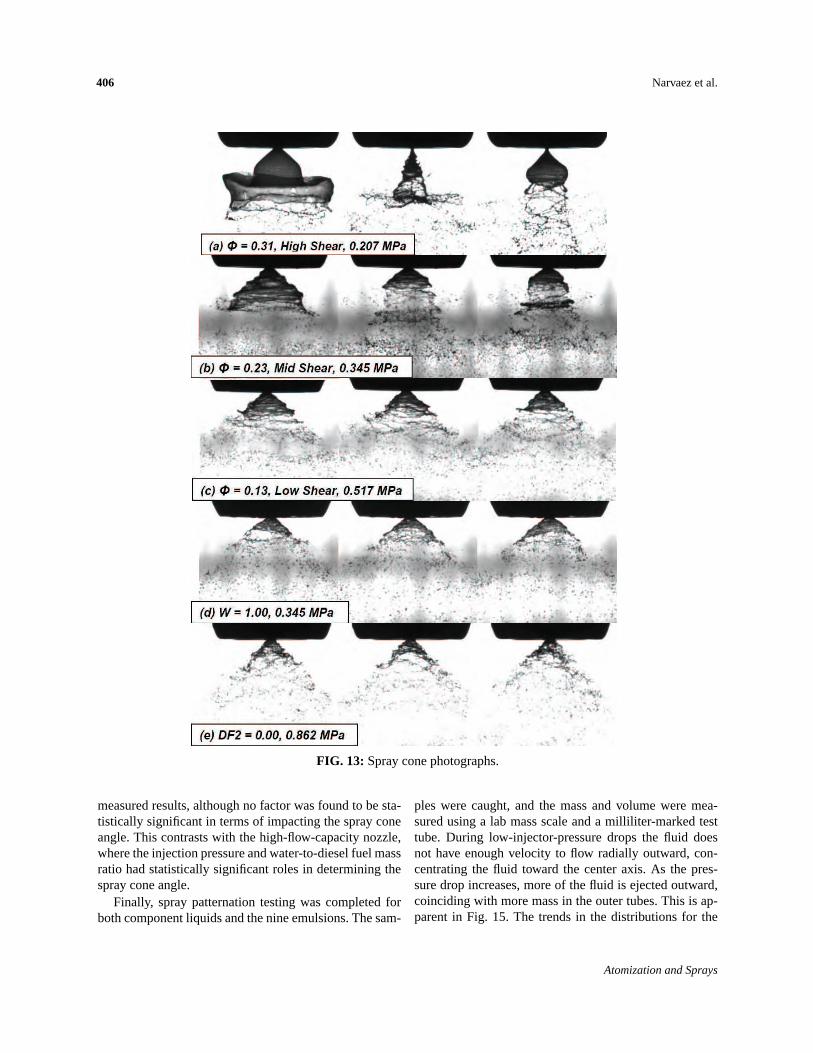
Spray cone angle analysis was also completed and wasable to explain some of the results obtained from thedroplet size analysis. A few 2µs exposure photographsfrom both component liquids and three different emul-sions are depicted in Fig. 13. The photographs, depictedfor each test liquid at different injector pressures, werethree of the 125 random images taken from the high-speedvideo recording and subsequently analyzed (Media Cy-bernetics Image Pro). A Sobel edge detection algorithmis applied to isolate the spray edge. Figure 13a showsthe highest water content and smallest dispersed waterdroplet emulsion at the lowest pressure drop (0.207 MPa,30 psi). As shown in the three images, the spray cone an-gle and overall liquid breakup process is quite dynamic.This suggests that the spray is not fully developed at theprescribed injector pressure drop due to the intact liquidsheet, which is one of the reasons why the lower limit ofthe parameter 0.345 MPa was selected. Figure 13b depictsa mid-shear, water-to-diesel mass fraction of 0.23 at a0.345 MPa injector pressure drop where the fluctuation isnot as pronounced but is still recognizable (93.2◦ ± 1.0◦).However, the component liquids are fully developed at0.345 MPa (Fig. 13d) (94.2◦ ± 0.7◦). Above 0.517 MPathe sprays for all the liquids were seen to be fully devel-oped (Figs. 13c and 13e). The only major difference is
FIG. 12: Massmedian results: MMD vs (a,c) mass flow rate and (b,d) injector pressure.
that the breakup length for the emulsions is longer com-pared to the component liquids at the same injector pres-sure. This is attributed to the difference in viscosity andthe differences in the structure of emulsions, which posesa fine distribution of discrete droplets throughout, mod-ifying its flow and Newtonian behavior. This transitionto non-Newtonian behavior is attributed to the rise of theinterfacial and surface forces between the two compo-nents.
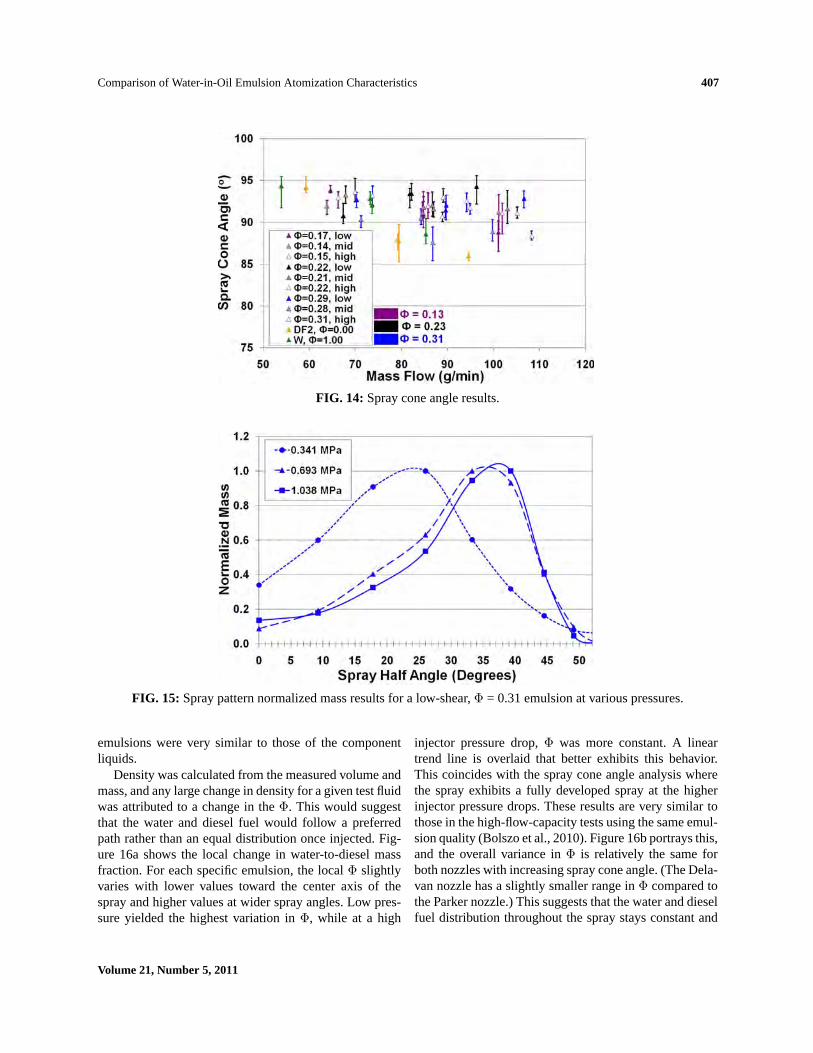
Spray cone angle measurements are shown in Fig. 14.The component liquids exhibit decreasing spray cone an-gle with increasing injector pressure drop, which con-tradicts the expected increase in the spray cone anglefor pressure simplex hollow cone sprays. The increase inpressure provides additional momentum in the tangentialdirection, which increases the spray cone angle. Increas-ing the water content should also increase the spray coneangle due to a greater density of the emulsions. Surface
tension has no affect on the spray angle, while a larger vis-cosity dictates that a decrease in spray angle should occurdue to an increase in friction within the nozzle (Lefebvre,1989). The measurements all show a somewhat decreas-ing spray cone angle with increasing pressure drop, whileno distinction could be made among the various emulsionqualities and water content. All the measured spray an-gles fall within an 85–95 degree range, which is slightlyhigher than the prescribed spray cone angle of 80 degreesfor the current Delavan nozzle. These results differ fromthose of the high-flow Parker nozzle where an increasein mass flow results in a wider spray. Larger amounts ofwater concentrations would also result in a decrease ofthe spray angle at a given flow rate. This difference fromthe current study suggests that the smaller passageways ofthe current low-flow nozzle stabilize the spray cone an-gle, regardless of the pressure drop or mass flow withinthe current flow ranges. ANOVA was performed on the
Volume 21, Number 5, 2011
406 Narvaezet al.
FIG. 13: Spraycone photographs.
measured results, although no factor was found to be sta-tistically significant in terms of impacting the spray coneangle. This contrasts with the high-flow-capacity nozzle,where the injection pressure and water-to-diesel fuel massratio had statistically significant roles in determining thespray cone angle.
Finally, spray patternation testing was completed forboth component liquids and the nine emulsions. The sam-
ples were caught, and the mass and volume were mea-sured using a lab mass scale and a milliliter-marked testtube. During low-injector-pressure drops the fluid doesnot have enough velocity to flow radially outward, con-centrating the fluid toward the center axis. As the pres-sure drop increases, more of the fluid is ejected outward,coinciding with more mass in the outer tubes. This is ap-parent in Fig. 15. The trends in the distributions for the
FIG. 15: Spraypattern normalized mass results for a low-shear,Φ = 0.31 emulsion at various pressures.
emulsions were very similar to those of the componentliquids.
Density was calculated from the measured volume andmass, and any large change in density for a given test fluidwas attributed to a change in theΦ. This would suggestthat the water and diesel fuel would follow a preferredpath rather than an equal distribution once injected. Fig-ure 16a shows the local change in water-to-diesel massfraction. For each specific emulsion, the localΦ slightlyvaries with lower values toward the center axis of thespray and higher values at wider spray angles. Low pres-sure yielded the highest variation inΦ, while at a high
injector pressure drop,Φ was more constant. A lineartrend line is overlaid that better exhibits this behavior.This coincides with the spray cone angle analysis wherethe spray exhibits a fully developed spray at the higherinjector pressure drops. These results are very similar tothose in the high-flow-capacity tests using the same emul-sion quality (Bolszo et al., 2010). Figure 16b portrays this,and the overall variance inΦ is relatively the same forboth nozzles with increasing spray cone angle. (The Dela-van nozzle has a slightly smaller range inΦ compared tothe Parker nozzle.) This suggests that the water and dieselfuel distribution throughout the spray stays constant and
Volume 21, Number 5, 2011
408 Narvaezet al.
(a) (b)
FIG. 16: Local change inΦ for a mid-shear,Φ ≈ 0.31 emulsion at various pressures for (a) the low-flow-capacitynozzle and (b) both high- and low-flow-capacity nozzles.
is independent of the flow nozzle capacity. These resultselucidate a better understanding of the behavior of emul-sions and further demonstrate it as an attractive option inits applicability in liquid fired combustion systems. It wasconcluded in Bolszo et al. (2010) that the local disparityin Φ was due to the differences in the radial momentumof the water and diesel fuel.
Table 5 summarizes the ANOVA results of the datacollected for both the low-flow and high-flow-capacitynozzles. While SMDW was not deemed statistically sig-nificant for the high-flow-capacity nozzle, it was impor-tant for the lower capacity nozzle. This suggests key ratiosbetween passage size and SMDW may exist that will dic-tate when SMDW is important to the nozzle flow charac-teristics. No significant factor was identified that affectedthe spray angle for the low-flow-capacity nozzle.
5. CONCLUSIONS
The following paragraphs outline the conclusions drawnfrom this work.
The mass flow and volume flow of the emulsionsthrough a low-flow pressure simplex nozzle were largerthan those for either component liquid. This difference isattributed to the change in the orifice discharge coefficient(i.e., FN) for the different fluids.
The ANOVA results for the current Delavan nozzle in-clude the dispersed water droplet size within the dieselfuel as a factor in predicting the flow rate and FN. Thiswas not apparent with the high-flow-capacity nozzle. Thisdisconnect in the ANOVA results is due to the smallerpassages and swirl chamber within the low-flow noz-zle that capture the dispersed water droplet size effect.The passages in the current nozzle are only approxi-mately 1.5 orders of magnitude greater than the small-est SMDW -produced emulsion, compared to almost 3orders of magnitude for the high-flow-capacity nozzlecase.
The measured spray SMDs are smaller than those pre-dicted from published correlations. The previous corre-lations for pressure simplex nozzles, utilized to comparethe results, were developed by Lefebvre and coworkers.
TABLE 5: Summary of significant factors impacting low-flow and high-flow-capacity spray char-acteristics
Atomization characteristic Low flow (Current study) High flow (Bolszo et al., 2010)Massflow ∆P,Φ,SMDW ∆P,Φ
These measured emulsion spray SMDs were similar tothose of diesel fuel. This is an important result that im-plies (1) emulsification can generate finer droplets than acombination of individual sprays of water and diesel fuel,and (2) existing correlations are not sufficient to predictthe spray size resulting from the atomization of emul-sions (within the range of the parameters studied). Thelow-flow-capacity droplet results follow the same trendsas the previous study with the high-flow-capacity nozzle.This suggests that flow capacity does not affect the trendsseen in the SMD versus injection pressure or mass flowrate.
The injection pressure drop has the greatest impact onthe overall emulsion spray SMD, but the water-to-dieselfuel mass fraction also plays a role. These results coincidewith those found in the previous study for the high-flow-capacity nozzle.
The average droplet size and distribution of the waterwithin the diesel fuel does not have a statistically signif-icant impact on the resulting spray droplet sizes. This re-sult was not expected and is likely a result of the absolutevalues of emulsion droplets produced. It is expected thatif the emulsion droplet sizes would reach a critical value,some impact on the atomization would be observed. Abetter understanding of the flow phenomena implies thatemulsions can be used effectively as a water additionstrategy, but the preparation process must achieve at leastsome minimum size of the dispersed phase (most likelyapproaching the macroemulsion limit of a single microm-eter with the amount of shear expended in the flow sys-tem, avoiding large discrete phase globules and nonuni-formities).
The spray cone angle does not vary drastically for theemulsions and component liquids. No large variation inspray angle was evident above injector pressure dropslarger than 0.517 MPa. The measurements all show aslight decreasing spray cone angle with increasing pres-sure drop, although all the measured angles fell within an85–95 degree range, residing close to the nominal spraycone angle (80 degrees with a tolerance of +/- 5 degrees)of the Delavan nozzle chosen. This again affirms the ef-fectiveness of emulsification as a water addition strategywithout affecting spray dispersion.
The water-to-diesel fuel mass fraction throughout theemulsion spray slightly varies with spray angle. Lowerwater fraction remains closer to the spray centerline,while more water is dispersed toward the outer areas ofthe spray. This result coincides with those found in thehigh-flow-nozzle study and implies that the centrifugalforce imparted by the atomization process is consistent
with flow capacity and appears to be independent of noz-zle size.
ACKNOWLEDGMENTS
The research at the University of California, Irvine, waspartially supported by Siemens Power Generation. Theauthors would like to thank Merna Ibrahim, GuillermoGomez, and James Hu for their help in data analysis andaid in experimentation, and Richard Hack for technicalguidance with the atomization setup.
REFERENCES
Antonov, V. N., Features of preparation of water-fuel emulsionsfor diesel engines,Chem. Technol. Fuels Oils, vol. 19, pp.606–609, 1983.
Becher, P., Ed.,Encyclopedia of Emulsion Technology, Dekker,New York, 1975.
Bolszo, C. D., Narvaez, A. A., McDonell, V. G., Dunn-Rankin, D., and Sirignano, W. A., Pressure swirl atomizationof water-in-oil emulsions,Atomization Sprays, vol. 20, no.12, pp. 1077–1099, 2010.
Davy, N., The Gas Turbine, pp. 206–210, Constable & Com-pany, New York, 1914.
Fradette, L., Brocart, B., and Tanguy, P. A., Comparison of mix-ing technologies for the production of concentrated emul-sions,Chem. Eng. Res. Des., vol. 85, no. A11, pp. 1553–1560, 2007.
Greeves, G., Khan, I. M., and Onion, G., Effects of waterintroduction on diesel engine combustion and emissions,Sym. (Int.) Combust. [Proc.], vol. 16, no. 1, pp. 321–336,1977.
Kadota, T. and Yamasaki, H., Recent advances in the combus-tion of water fuel emulsions,Prog. Energy Combust. Sci., vol.28, pp. 385–404, 2002.
Lefebvre, A. H.,Atomization and Sprays, p. 7, 140, ch. 8, Hemi-sphere Publishing, 1989.
Marcano, N. and Williams, A., Characterization of sprays ofbitumen-in-water emulsions,Proc. of the 5th Int’l. Conf. onLiquid Atomization and Spray Systems, Gaithersburg, MD,July 15–18, 1991.
Rosen, M. J.,Surfactants and Interfacial Phenomena, John Wi-ley & Sons, Inc., Canada, 1989.
Sajjadi, S., Formation of fine emulsions by emulsification athigh viscosity or low interfacial tension; a comparative study,Colloids Surf., A,vol. 299, pp. 73–78, 2007.
Sjogren, A., Burning of water-in-oil emulsions,Sym. (Int.) Com-bust. [Proc.], vol. 16, no. 1, pp. 297–305, 1977.
Volume 21, Number 5, 2011
410 Narvaezet al.
Song, M. G., Jho, S. H., Kim, J. Y., and Kim, J. D., Rapid eval-uation of water-in-oil (W/O) emulsion stability by turbidityratio measurements,J. Colloid Interface Sci., vol. 230, pp.213–215, 2000.
Tcholakova, S., Denkov, N. D., and Danner, T., Role of sur-factant type and concentration for the mean drop size duringemulsification in turbulent flow,Langmuir, vol. 20, pp. 7444–7458, 2004.
Tsenev, V. A., Features of diesel operation on water-fuel emul-sions,Chem. Technol. Fuels Oils, vol. 19, no. 12, pp. 575–
578, 1983.
Wagner, U., Eckert, P., and Spicher, U., Possibilities of simulta-neous in- cylinder reduction of soot and NOx emissions fordiesel engines with direct injection,Int. J. Rotating Mach.,vol. 2008, Article ID 175956, 2008.
Walstra, P., Principles of emulsion formation,Chem. Eng. Sci.,vol. 48, no. 2, pp. 333–349, 1993.
Wang, X. F. and Lefebvre, A. H., Mean drop sizes frompressure-swirl nozzles,J. Propul. Power, vol. 3, pp. 11–18,1987.