Page 1
International Journal of Fisheries and Aquaculture Research
Vol.1, No.1, pp.15-30, December 2015
___Published by European Centre for Research Training and Development UK (www.eajournals.org)
15
COMPARISON OF ZOOPLANKTON COMMUNITY STRUCTURES IN THREE
POLYCULTURE MODELS OF PONDS STOCKING CTENOPHARYNGODON
IDELLUS
Yun Zhang, Jinchai Deng, Bangxi Xiong, Xuefen Yang, Xufa Ma*
Huazhong Agricultural University, Wuhan, Hubei Province 430070, China.
ABSTRACT: The Zooplanktons community structures in three polyculture models of pods,
stocking mainly grass carp (Ctenopharyngodon idellus) were enumerated. We focused on the
variability of a zooplankton community structure and compared its differences in the three
polyculture models. Environmental factors and zooplankton abundance differed significantly
among models. Nevertheless, model 2 had the minimum biomass of crustacean and
zooplankton. Statistical analysis revealed that, NO2--N, COD, NO3
--N, T, DO, PO43--P and pH
are the most important environmental variables acting on the zooplankton assemblage. The
differences in community structure of zooplankton and the growth rate of fish in the three
Polyculture models showed that the model 2 was the most reasonable and efficient culture
method, and Paddlefish (Polyodon spathula) can make more valuable contributions to market
demand than bighead carp (Aristichthys nobilis).
KEYWORDS: Zooplankton Community Structure, Pond Polyculture Model, Environmental
Factors, Ctenopharyngodon Idellus
INTRODUCTION
Polyculture is one of the most important models of pond aquaculture system in China, in which,
Cyprinidae fish is the main stocking species. Pond fish culture accounted for 70.6% of the
freshwater aquaculture production in China (Fisheries statistic in China 2013). Though, China
is the leading pond aquaculture production, but the problems of the unreasonable introduction
of exotic species (Specify species, fish or other) and use of aquaculture drug become
increasingly prominent during the culture period. These problems have restricted the further
development of pond culture system. However, deformity of the ecological structure, blocking
of material circulation and serious pollution of fresh water is the existing problems in
aquaculture production system in China.
Zooplankton plays an important role in the water ecosystem structure and function. As a
consumer of primary producers, it regulates the abundance of phytoplankton through predation,
and as food of planktivorous fish. And its abundance directly impacts the resources of fish
(Boudreau and Dickie 1992). Distribution of zooplankton is influenced by abiotic limitations.
Some zooplankton species are limited by temperature, dissolved oxygen, salinity and other
physicochemical factors; this may depends on the background of local environmental
conditions. Compared with the large water area, such as reservoirs and lakes, the habitats of
zooplankton communities in individual ponds may be different, due to the limited geographic
range of certain species and chance events associated with colonization. Zooplankton
community structure is influenced by many factors, such as predation, competition, but
predation is the most important factor for variation of zooplankton assemblage. Some species
Page 2
International Journal of Fisheries and Aquaculture Research
Vol.1, No.1, pp.15-30, December 2015
___Published by European Centre for Research Training and Development UK (www.eajournals.org)
16
have even been shown to have different environmental preferences in different regions (Patalas
1971).
Paddlefish (Polydon spathula)was introduced from the United States 20 years ago. Early
investigations indicated that paddlefish is primarily planktivores and insectivores (Kofoid 1900;
Eddy and Simmer 1929). Many studies had confirmed that paddlefish was an indiscriminate
filter feeder on zooplankton, especially cladoceran (Rosen and Hales 1981; Michaletz et al.
1982). Paddlefish are suitable to be stocked in large areas of reservoirs and lakes. But in ponds,
there are few reports about the model of using paddlefish as Polyculture fish in China. In Chen
et al. (2011) replaced bighead carp (Aristichthys nobilis) with paddlefish in polyculture ponds
to compare the variety of water quality factors (chlorophyll a, transparence, total ammonia
nitrogen, total nitrogen, and total phosphorus). And also, replacing bighead carps with
paddlefish in pounds of mainly stocking grass carp. This study was designed to explore the
relationship between zooplankton community and environmental factors, and to compare
models that is most suitable for Polyculture system.
MATERIAL AND METHODS
Study Area
The study was conducted from June to October in 2010 in nine ponds near the “Shaotanhe”
reservoirs. They are located in Hubei Province, China (30°50′N, 114°58′E). The nine ponds
have the same area (110 m2) and similar depth (1.2 ± 0.2 m, mean ± SD). The water quality in
“Shaotanhe” Reservoir is fresh and meets the water quality criteria in aquaculture.
Experimental Design
The experiment was designed into three polyculture models, stocking mainly, grass carp with
few silver carp (Hypophthalmichthys molitrix), bighead carp, crucian carp (Carassius auratus)
and paddlefish. The nine reconstructed ponds were divided into three groups, with triplicates
in each group. Group one (model 1) including 250 Grass Carp, 35 Silver Carp, 40 Big head
Fish, and 15 Goldfish, group two (model 2) 250 Grass Carp, 35 Silver Carp, 20 Big head Fish,
20 Paddlefish, and 15 Goldfish, and group three (model 3 ) 250 Grass Carp, 35 Silver Carp,
and 15 Goldfish respectively. The individual weight of Grass Carp, Silver Carp, Big head Fish,
Goldfish and Paddlefish was 87.31±9.19 g, 63.66±7.30 g, 55.01±3.89 g, 63.66±7.30 g and
150.15±11.9 g, respectively. The environmental factors of the three models were measured
throughout the experimental period (Table 5). The experiment was conducted during the
aquaculture production period in central China.
Pond Preparation and Fish Stocking
Prior to the trial, ponds were renovated with the same silt substrate. Aquatic vegetation, fish
and other larger aquatic organisms were eradicated. Ponds were subsequently treated with lime
(CaO, 250 kg ha-1) and filled with water from “Shaotanhe” Reservoir. During the cultural
period (June-October), 1/3 of the pond water was changed weekly. Ponds were unfertilized no
longer during the entire experimental period.
On day 12, fingerlings collected from “Shaotanhe” Reservoir aquaculture farm; were released
into the ponds. The fish were fed at a daily commercial floating juveniles grass carp feed to
Page 3
International Journal of Fisheries and Aquaculture Research
Vol.1, No.1, pp.15-30, December 2015
___Published by European Centre for Research Training and Development UK (www.eajournals.org)
17
satiation during the culture period. All of the fish were harvested by fishing net in December.
The daily weight and net weight of paddlefish and bighead carp were calculated from the
correlation formula (Chen et al. 2012).
Sampling of Zooplankton
Zooplankton samples were collected monthly (Jun 22, July 24, Aug 23 and Sep 23) at 08:30-
10:30 in the morning. Horizontal hauls sampling (for qualitative samples), were taken, using a
64-μm mesh zooplankton net on the surface of water.
Laboratory Analysis
The collected samples were preserved in 5% buffered formaldehyde solution. Observation and
identification of zooplankton to species level were done with the aid of an Olympus model
microscope (magnification×400) model 230485 (Olympus America Inc., Center Valley, PA,
USA) in the zooplankton laboratory. All cladoceran, Copepoda, rotifersand protozoan were
identified to species using keys of Chiang and Du (1979), Sheng (1979), Shen (1990) and
Wang (1965).
Rotifers and protozoan quantitative samples were obtained by filtering 1L water through a
plankton net (mesh size 64 μm) and preserved in 5% buffered formaldehyde solution. The
samples subsided for 48hrs in glass columns; then the supernatant was removed carefully and
concentrated to 30 ml. Rotifer and protozoan samples were counted using 1 ml and 0.1 ml
Sedgwick-R after counting chamber, respectively.
Crustacean and zooplankton samples were taken monthly. At each point, 10L mixed water,
collected at two depths (0.5 m below the surface and 0.5 m away from the bottom), was filtered
by a plankton net (mesh size 64 μm) and preserved with 5% formalin. Crustacean and
zooplankton samples were all counted siding a 1Ml. Sedgwick-R after counting chamber.
Biomass of crustaceans were calculated from regression equations (Huang et al. 1984) of wet
body weight and body length. Length measurements of cladoceran were made from the top of
the head (helmet of Daphnia excluded) to the base of the shell spine; in Copepoda (copepodite
and adult), from the top of the head to the end of the caudal Remus (Yang et al. 1999). Average
body length of crustacean was calculated from 20 animals. Weight of maple was estimated to
be 0.003 mg. Samples were collected from mid-layers of the ponds so as to determine physical-
chemical parameter using a 2.5 L organic glass hydrosphere, and preserved with chloroform.
Dissolved oxygen (DO), water temperature (T) and pH were measured in HQd Meters and
IntelliCALTM Probes (Hach Co., Loveland, CO, USA). Transparency (SD) was measured with
a Secchi disc. All the water quality parameters, including total phosphorus (TP), phosphate
(PO43--P), Ammoniacal nitrogen (NH3-N), nitrite nitrogen (NO2
--N), nitrate nitrogen (NO3--N),
total nitrogen (TN), chemical oxygen demand (COD) and chlorophyll a (Chl-a) were measured
within 24hrs in the hydration laboratory according to following standard methods (Greenberg
et al. 1992; National Environmental Protection Bureau 2002).
Statistical Analysis
The software packages IBM SPSS Statistics 19 and CANOCO version 4.5 (Braak and Smilauer
2002) were used for statistical analyses. Redundancy analysis (RDA) was widely used to
explain the relationship between the zooplankton communities and environmental factors
(Marta 2012).
Page 4
International Journal of Fisheries and Aquaculture Research
Vol.1, No.1, pp.15-30, December 2015
___Published by European Centre for Research Training and Development UK (www.eajournals.org)
18
The variation of zooplankton density and biomass in different model ponds were analysed by
SPSS 19.0. Diversity of zooplankton community was assessed using Simpson diversity index
(Simpson 1949), Shannon-Wiener diversity index (Shannon et al. 1949) and Pielou index
(Pielou 1975).
The dominant species of zooplankton were calculated according to Xu (1989), the
computational formula is, where, Ni means the abundance of the species I, Imeans the
occurrence frequency of this species, and N indicates the total abundance of zooplankton. A
species are confirmed as the dominant species when the value of Y ≥ 0.02.
The relationship between zooplankton and environmental factors and sampling Units
Redundancy analysis (RDA) was used to describe the relationships between the zooplankton
abundance and the environmental variables (CANOCO program; Ter Braak and Smilauer
2002). RDA was chosen because the length of the gradient of the first DCA (Detrended
Correspondence Analysis) axis running on zooplankton density data was 0.163; therefore, we
used linear ordination techniques (Ter Braak and Prentice 1988). All zooplankton density data
were log (x+1) transformed. Environmental factors (TP, PO43--P, NH4+-N, NO2
--N, NO3--N,
TN, COD, DO, pH, T and Chl-a) were selected by the automatic forward selection with 499
unrestricted Monte Carlo permutations. Bi-plot of relationship between environmental factors
and zooplankton abundance (Fig. 3) And relationship between sampling units and zooplankton
abundance (Fig. 4) Were presented using Cano Draw of CANOCO 4.5 (ter Braak and Smilauer
2002).
RESULTS
Zooplankton Community Composition
The dominant species of zooplankton in the three models were almost similar, which were
absolutely dominated by protozoa and rotifer. Urotricha factual and Lagynophrya conifers
were the dominant species of protozoan, ratifiers were dominated by Trichocerca possible,
Cladocera were dominated by Moina micrura and Copepoda dominated by Thermocyclops
holiness. The zooplankton assemblage consisted of 133 genera (233 species), among which
protozoan represented the highest number of species (154), approximately 66.5% of the total
species of zooplankton, rotifers (60), which accounted for 25.4%. Cladocera (15) and
Copepoda (4) accounted for 6.4% and 1.7%, respectively.
Density and biomass
Protozoa dominated the zooplankton assemblage in the three different models, with the highest
density and biomass, followed rotifer the second dominant taxa, Cladocera and Copepoda
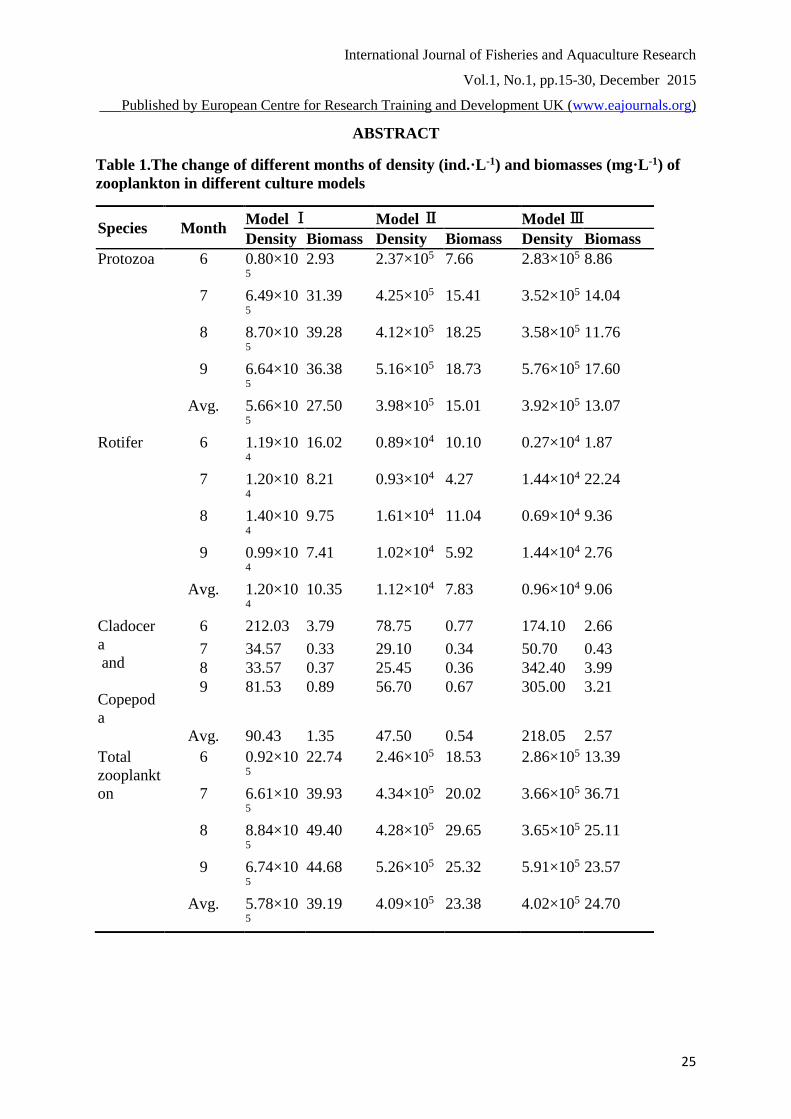
accounted for only a small proportion (Table 1 and Table 2). The highest biomass of the total
zooplankton occurred in model 1 (39.19 mg·L-1), while model 2 and model 3 were very similar,
their biomass were 24.70 mg·L-1 and 23.32 mg·L-1, respectively (Table1). The highest density
and biomass of microzooplankton (Protozoa and Rotifer) was model 1 (5.78×10⁵ Ind·L-1, 37.84
mg·L-1), while model 2 (4.09×10⁵ Ind·L-1, 22.85 mg·L-1) and model 3 (4.02×10⁵ Ind·L-1, 22.12
mg·L-1) had similar value.
Page 5
International Journal of Fisheries and Aquaculture Research
Vol.1, No.1, pp.15-30, December 2015
___Published by European Centre for Research Training and Development UK (www.eajournals.org)
19
Model 3 had the highest biomass (2.57 mg·L-1) of macrozooplankton (Cladocera and
Copepoda), while model 2 showed the least value (0.54 mg·L-1). There was significant
difference of macrozooplankton biomass between model 3 and model 2 (P<0.05), also between
model 3 and model 1 (P<0.05).
Biodiversity Variation of Zooplankton
The results of the three diversity indices indicated that the biodiversity of zooplankton
gradually reduced in the sequence of model 1, model 2 and model 3. The diversity indices of
the three models showed a similar trend (Table 3).
Growth Parameters of Bighead Carp and Paddlefish
The parameters showed that the daily weight and net weight of bighead carp in model 2
significantly higher than model1 (P<0.05); in model 2, the daily weight and net weight of
paddlefish significantly higher than bighead carp (Table 4).
Water Quality Parameters
Water temperature and pH showed a similar temporal trend in the three model ponds. The level
of DO was low during the whole experiment. The concentrations of TP, PO43--P and TN were
low in model 2, and there was a significant difference between model 1 and model 2 (P<0.05),
model 3 and model 2 (P<0.05), there was no significant difference between model 1 and model
3. NH4+-N, NO3
--N and COD decreased in order of sequence; model 1, 2 and 3. NO2--N was
significantly high in June, and its concentration of model 1 and model 3 was lower than model
2.
Relationship between Zooplankton and Environmental Factors
In the current study Eigenvalues of the first and second axis were 0.794 and 0.156, respectively,
and the two axes accounted for 92.1% of the variance in the zooplankton-environmental
relationship (Table 6). Automatic forward selection indicated that the most significant variable
of the 11 environmental variables were NO2--N, which explained 36% of the total variance,
followed by COD (28%), NO3--N (10%), T (8%), DO (7%), PO4
3--P (5%), pH (4%). Axis 1
was positively related to TN (the correlation coefficient was 0.6097) and negatively related to
NO2--N (-0.6409). Axis 2 was positively related to TP (0.6961) and NH4
+-N (0.6217), it was
negatively related to DO (-0.8576) (Table 7).
As it is indicated on Fig.3, the protozoa and rotifer showed a positive relationship to COD,
NH4+-N and TP but were negatively related to DO and T. Cladocera was positively related to
PO43--P, TN and TP but negatively related to NO2
--N and DO, while Copepoda showed a
positive relationship with T, TN and PO43--P but was negatively related to NO2
--N and COD.
(Fig. 4) Showed the relationship between the four taxa of zooplankton and sampling units.
This bi-plot showed that the nine culture ponds were divided into three groups, the first group,
including ponds 1, 2 and 3, which belongs to model 1 in this study. The second group, including
pond 4, 5, 6 and 7 belongs to model 2 (except pond 7), Ponds 8 and 9 were the third group
belonging to model 3. The largest abundance of protozoa and rotifer was the first group,
followed by the second and third group; the second group had the least abundance of Cladocera,
while the third group had the largest abundance of Cladocera and Copepoda.
Page 6
International Journal of Fisheries and Aquaculture Research
Vol.1, No.1, pp.15-30, December 2015
___Published by European Centre for Research Training and Development UK (www.eajournals.org)
20
DISCUSSION
Variation of zooplankton community structure and composition in three model culture
ponds
The result of GU (1994), GU and Liu (1996) indicated that the average biomass of zooplankton
in pounds of high production is about 10-20 mg/L in China, and microzooplankton (protozoa
and rotifer) always dominated in these ponds, while macrozooplankton (Cladocera and
Copepoda) is relatively low. It has been demonstrated that zooplanktivorous fish selectively
prey on larger and more conspicuous zooplankton, mainly the large cladoceran (Elhigzi et al.
1995). Yang et al. (2011) also reported, zooplanktons were dominated by protozoa and rotifer
in polyculture pond of grass carp, silver carp and common carp (Cyprinus Carpio). All these
results of the various studies were similar to this research. Both silver carp and bighead carp
can pray zooplankton (Cremer and Smitherman 1980), but the feeding capacity of bighead carp
for zooplankton was greater than silver carp (Dong and Li 1995). Bighead carp has great water
absorbing capacity and it can prey on Cladocera and Copepoda efficiently.
Yang and Huang (1992) studied the influence of silver carp and bighead carp on zooplankton
community structure using the enclosure method, they found that in the enclosures where silver
carp and bighead carp were stocked, the protozoa and some small-sized ratifiers were
dominated, while crustacean and large-sized ratifiers were less. Similarly, Arcifa et al. (1986)
have the same conclusion in their enclosure experiment.
In the present study, small-sized rectifiers, such as Trichocerca possible and Trichocerca
gracilis and protozoa were the dominant species in all the ponds. The activities of fish also
influence the zooplankton community composition. The activity of crucian carp can make the
resting eggs of rotifer hatched, increases the biomass of rotifer (Liu 1992). Macrozooplankton
consume a broader size spectrum of particles and have a lower threshold food density below
which they cannot maintain metabolic demand (Burns 1968). Some cyclopoids are omnivorous
and prey on protozoans and rotifers. So the fish culture ponds, the number of small species was
much greater than zooplankton.
Comparing with the average biomass of macrozooplankton (Cladocera and Copepoda) in the
three model culture ponds, we found that model 3 had the largest value (10.40%), because there
were no bighead carp and paddlefish in model 3. The biomass of Cladocera in model 2 was
significantly lower than in model 1 and 3; due to a replacement of 6% bighead carp from model
1 to model 2. Paddlefish fed on zooplankton, especially Cladocera, it also preyed on
Chironomidae larvae, juvenile fish and prawn, and its feeding habit, living habits and living
space were similar with bighead carp (John and David 1986). Zhu et al. (2009) studied the food
selection of paddlefish and pointed out that larval and juvenile paddlefish had the obvious food
selection; they almost prey on cladoceran only, less copepods and aquatic insects, and barely
prey on rotifers and phytoplankton. This shows paddlefish has great predation pressure on large
zooplankton (Cladocera and Copepoda).
Relationship of environmental factors and zooplankton composition
The composition of zooplankton was influenced by physical, chemical, biological and
geographic factors (MacArthur 1967). Olive and Pastuchova (2012) suggested that nutrients
and dissolved oxygen were the most important physical-chemical factors for plankton diversity
when they investigated the zooplankton communities with different traffic conditions in two
Page 7
International Journal of Fisheries and Aquaculture Research
Vol.1, No.1, pp.15-30, December 2015
___Published by European Centre for Research Training and Development UK (www.eajournals.org)
21
catchments. Karl et al. (2001) pointed out ponds with clear-water state was characterized by
large cladoceran species and low chlorophyll-a concentration, unlike in the turbid-water ponds,
high abundances of rotifers and inverse environmental conditions appeared.
In this present study, RDA indicated that most environmental factors were positively related to
protozoa and rotifer, such as COD, NH4+-N, chlorophyll-a, NO3
--N and TP, and these variables
were all had the highest concentrations in model 1. As the flood of zooplankton, phytoplankton
biomass is closely related to zooplankton biomass, and the concentration of chlorophyll-a can
reflect the phytoplankton biomass. The bi-plot of the RDA indicated that ammonium showed
the closest relationship with chlorophyll-a. Due to the favourable energy requirement,
ammonium utilization is preferred by algae (Ward and Wetzel 1980), therefore, a slight
increasing tendency of phytoplankton biomass can be expected even in the eutrophic-
hypertrophic range. So ammonium influenced zooplankton indirectly. Guevara et al. (2009)
also suggested that the enhancement of eutrophication could possibly increase rotifer
abundance since they are able to thrive in the traffic environment.
In the current study, model 1 has the highest concentration of nutrients and highest abundance
of protozoa and rotifer. This was consistent with the conclusion that with the increasing of
nutrient concentration and eutrophication, small-sized species dominated in the zooplankton
community (Chen et al. 2012), while Copepoda was highly negatively related to nutrient
concentrations (Tadesse 2011). The bi-plot of Redundancy Analysis for zooplankton and
environmental variables (Fig. 3) also showed similar results.
Feasibility analysis of polyculture of grass carp, silver carp, bighead carp, crucian carp
and paddlefish
Grass carp, silver carp, bighead carp, crucian carp and paddlefish move at different water layers
and feed on different preys in polyculture ponds; they enable a more efficient utilization of
pond resources. Shi (2013) studied that during the period of juvenile, the feed coefficient of
bighead carp is significantly higher than paddlefish, this indicates that paddlefish has higher
utilization rate and conversion efficiency on zooplankton than bighead carp. GU et al. (2012)
compared the benthic macroinvertebrates in three culture model stocking grass carp ponds, and
deduced that the paddlefish can make valuable contributions to the biodiversity and ecosystem
stability of fish ponds. Paddlefish has high value of ornament, nutrition and medicine (Chen
2011), and Chen (2011) discussed the value of replacing bighead carp with paddlefish, he
concluded that paddlefish has higher economic value and social value than bighead carp. In
this study, model 2 has lower biomass of zooplankton, especially macrozooplankton than
model 1, which indicated that paddlefish can make higher utilization of zooplankton than
bighead carp. In addition, the daily weight and net weight of paddlefish were significantly
higher than bighead carp in model 2, and the market value of paddlefish is much higher than
bighead carp in the Chinese market today, therefore, paddlefish more accords with the demand
of people in China, and replacing bighead carp with paddlefish in polyculture pond is feasible.
CONCLUSIONS
The microzooplankton (protozoa and rotifer) dominated in the polyculture ponds, and
associated with most of nutrients in the water, while macrozooplankton (Cladocera and
Copepoda) were less in the three culture models, among which model 2 has the least biomass
Page 8
International Journal of Fisheries and Aquaculture Research
Vol.1, No.1, pp.15-30, December 2015
___Published by European Centre for Research Training and Development UK (www.eajournals.org)
22
of Cladocera and Copepoda. In addition, model 2 is the best aquaculture model of the three
models. From this, we concluded that the first and second group (model 1 and model 2) was
dominated by microzooplankton (protozoa and rotifer), while the third group had the largest
abundance of macrozooplankton (Cladocera and Copepoda) compared to the former two
groups. To confirm suitable combinations of fish species stocked in polyculture ponds, the
factors of the utilization of fish for space resource, water, environment, the stability of ponds
and market requirements should be taken into consideration.
Acknowledgments
This study was financially supported by a grant from the Major State Basic Research
Development Program of China (973 Program) (No. 2009CB118706).
REFERENCES
Arcifa, M. S., Northcote, T. G. and Froehlich, O. (1986) Fish-zooplannkton interactions and
their effects on water quality of a tropical Brazilian reservoir, Hydrobiologia, 139 49−58.
Boudreau, P. R. and Dickie, L. M. (1992) Biomass spectra of aquatic ecosystem in relation to
fisheries yield, Canadian Journal of Fisheries and Aquatic Sciences, 49 1528-1538.
Burns, C. W. (1968) The relationship between body-size of filter-feeding zooplankton and the
maximum size of particle ingested, Limnology and Oceanography, 13 675-678.
Chen, F. Z., Ye, J. L., Shu, T. T., Sun, Y. and Li, J. (2012) Zooplankton response to the lake
restoration in the drinking-water source in Meiliang Bay of subtropical eutrophic Lake
Taihu, China, Limnologica, 42 189-196.
Chen, J. W., Zhu, Y. J., Zhao, J. H., Feng, X.B. and Yang, D. G. (2011) Water Quality and N
& P Utilization in Polyculture Ponds with Paddlefish Polydon spathula, Hubei
Agricultural Sciences, 50 1434-1438.
Chen, J., Xiong, B. X., Zhu, Y. T., Gu, Q. H., Huang, J. and Wang, Q. (2012) Comparative on
Fish Growth and Efficiency of Three Polyculture Models in Grass Carp Mainly Culture
Pond, Journal of Hydroecology, 33 108-112.
Chen, J. Y. (2011) Discussion of value of replacing big head carp with paddlefish, Current
Fisheries, 6 62-66.
Chiang, S. C. and Du, N. S. (1979) Fauna Sinica, Crustacea, Freshwater Cladocera. Science
Press, Academia Sinica, Beijing.
Cottenie, K., Nuytten, N., Michels, E. and Meester, L. D. (2001) Zooplankton community
structure and environmental conditions in a set of interconnected ponds, Hydrobiologia,
442 339-350.
Cremer, M. C. and Smitherman, R. O. (1980) Food habits and growth of silver and bighead
carp in cages and ponds, Aquaculture, 20 57-64.
Dong, S. L. and Li, D. S. (1995) Comparative studies on the feeding capacity of silver carp
(Hypophthalmichthys molitrix) and bighead carp (Aristichthys nobilis), Oceanologia et
Limnologia Sinica, 26 53-57.
Eddy, S. and Simmer, P. A. (1929) Notes on the food of paddlefish, Transactions of the Illinois
State Academy of science, 21: 59-68.
Elhigzi, F. A., Haider, R. and Larsson, S. A. P. (1995) Interactions between Nile tilapia
(Oreochromis niloticus) and cladocerans in ponds (Khartoum, Sudan), Hydrobiologia,
307 263-272.
Page 9
International Journal of Fisheries and Aquaculture Research
Vol.1, No.1, pp.15-30, December 2015
___Published by European Centre for Research Training and Development UK (www.eajournals.org)
23
Greenberg, A. E., Clesceri, L. S. and Eaton, A. D. (1992) Standard Methods for the
Examination of Water and Wastewater, 18th ed. American Public Health Association,
Washington, DC.
Gu, Q. H, Xiong, B. X., Zhu, Y. T., Yang, X. F. and Shi, P. S. (2012) Comparison of benthic
macroinvertebrates in three polyculture models of ponds stocking mainly
Ctenopharyngodon idellus, Desalin Water Treat, 45 26-39.
Gu, X. H. (1994) Preliminary analysis on the community structure of the plankton in different
types of fish ponds, Journal of Lake Sciences, 6 276-282.
Gu, X. H. and Liu, G. Y. (1996) Impact of sliver carp and big head carp in fish ponds on
plankton, Rural Eco-Environment, 12 6-10.
Guevara, G., Lozano, P. and Reinoso, G. (2009) Horizontal and seasonal patterns of tropical
zooplankton from eutrophic Prado reservoir (Colombia), Limnologica, 39 128–139.
Huang, X. F., Chen, X. M., Wu, Z. T. and Hu, C. Y. (1984) Studies on changes in abundance
and biomass of zooplankton in Lake Donghu, Wuhan, Acta Hydrobiologica Sinica, 8
345-358.
Illyova, M. and Pastuchova, Z. (2012) The zooplankton communities of small water reservoirs
with different trophic conditions in two catchments in western Slovakia, Limnologica, 42
271-281.
John, S. B. and David, R. B. (1986) Impact of paddlefish on plankton and Water Quality of
Catfish Ponds, The Progressive Fish-Cuiturist, 48 177-183.
Karl, C., Nele, N., Erik, M. and Luc, D. M. (2001) Zooplankton community structure and
environmental conditions in a set of interconnected ponds, Hydrobiologia, 442 339–350.
Kofoid, C. A. (1900) Notes on the natural history of Polyodon. Science 11 252.
Liu, Q., Zhao, Y. B., Wang, Y. and Li, Y. H. (1992) Investigations on plankton of high yield
fish ponds in Zhenlai district, Jilin Prov, Journal of Dalian Fishes College, 6 14-27.
MacArthur, R. H. and Wilson, R. O. (1967) The Theory of Island Biogeography. Princeton
University Press. Princeton, New Jersey.
Michaletz, P. H., Rabeni, C. F., Taylor, W. W. and Russell, T. R. (1982) Feeding ecology and
growth of young of the year paddlefish in hatchery ponds, Transactions of the American
Fisheries Society, 111 700-709.
National Environmental Protection Bureau (2002) Guide of Analytical Method on Monitoring
Water and Waste Water. Environmental Science Press, Beijing, pp. 1-199.
Patalas, K. (1971) Crustacean plankton communities in forty-five lakes in the Experimental
Lakes Area, northwestern Ontario, Journal of the Fisheries Research Board of Canada,
28 231-244.
Pielou, E. C. (1975) Ecological Diversity. Wiley, New York.
Rudolph, A. R. and Donald, C. H. (1981) Feeding of paddlefish, Polyodon spathula. COPEIA,
2 441-455.
Shannon, C. E. and Weaver, W. (1949) The Mathematical Theory of Communication. Urbana,
pp. 125.
Shen, Y. F., Zhang, Z. S., Gong, X. J., Gu, M. R., Shi, Z. X. and Wei, Y. X. (1990) Modern
Biomonitoring Techniques using Freshwater Microbiota. Beijing, China.
Sheng, J. R. (1979) Fauna Sinica, Crustacea, Freshwater Copepoda. Beijing, China.
Shi, P. S. (2013) Cloning and expression of fatty acid synthase gene and comparison on growth,
muscle quality of Polyodon spathula and Aristichthys nobilis. Wuhan, Huazhong
Agricultural University.
Simpson, E. H. (1949) Measurement of species diversity, Nature, 163 688.
Page 10
International Journal of Fisheries and Aquaculture Research
Vol.1, No.1, pp.15-30, December 2015
___Published by European Centre for Research Training and Development UK (www.eajournals.org)
24
Tadesse, F., Seyoum, M., Michael, S. (2011) Zooplankton community structure and ecology
of the tropical-highland Lake Hayq, Ethiopia, Limnologica, 41 389-397.
Ter Braak, C. J. F. and Prentice, I. C. (1988) A theory of gradient analysis, Advances in
Ecological research, 18 93-138.
Ter Braak, C. J. F. And Smilauer, P. (2002) CANOCO reference manual and CanocoDraw for
Windows User's guide: Software for Canonical Community Ordination (version 4.5).
Microcomputer Power, Ithaca, NY, US.
Wang, J. J. (1965) Fauna Sinica, Rotifer. Beijing, China .
Ward, A. K. and Wetzel, R. G. (1980) Interactions of light and nitrogen source among
planktonic blue-green algae, Archiv für Hydrobiologie, 90 1–25.
Xu, Z. L. and Chen, Y. Q. (1989) Aggregated intensity of dominant species of zooplankton in
autumn in the East China Sea and Yellow Sea, Journal of Ecology, 8 13-15.
Yang, J. L., Gao, Q. F., Dong, S. L., Wang, F. and Tian, X. L. (2011) Effect of silver carp
culture on the composition of plankton and suspended particulate matter in polyculture
ponds, Periodical of Ocean University of China, 41 23-29.
Yang, Y., Huang, X. F. and Liu, J. K. (1999) Long-term changes in crustacean zooplankton
and water quality in a shallow, eutrophic Chinese lake densely stocked with fish,
Hydrobiologia, 391 195-203.
Yang, Y. F. and Huang, X. F. (1992) The influence of silver carp and bighead on the
zooplankton community structure, Journal of Lake Sciences, 4 78-86.
Zhu, A. M., Liang, Y. Q., Huang, D. M., Hu, X. J., Wu, S. G. and Hu, C. L. (2009) Study on
starting-feeding size and food selection of larval and juvenile paddlefish, Acta
Hydrobiologica Sinica, 33 1202-1206.
Page 11
International Journal of Fisheries and Aquaculture Research
Vol.1, No.1, pp.15-30, December 2015
___Published by European Centre for Research Training and Development UK (www.eajournals.org)
25
ABSTRACT
Table 1.The change of different months of density (ind.·L-1) and biomasses (mg·L-1) of
zooplankton in different culture models
Species Month Model Ⅰ Model Ⅱ Model Ⅲ
Density Biomass Density Biomass Density Biomass
Protozoa 6 0.80×10⁵
2.93 2.37×10⁵ 7.66 2.83×10⁵ 8.86
7 6.49×10⁵
31.39 4.25×10⁵ 15.41 3.52×10⁵ 14.04
8 8.70×10⁵
39.28 4.12×10⁵ 18.25 3.58×10⁵ 11.76
9 6.64×10⁵
36.38 5.16×10⁵ 18.73 5.76×10⁵ 17.60
Avg. 5.66×10⁵
27.50 3.98×10⁵ 15.01 3.92×10⁵ 13.07
Rotifer 6 1.19×10⁴
16.02 0.89×10⁴ 10.10 0.27×10⁴ 1.87
7 1.20×10⁴
8.21 0.93×10⁴ 4.27 1.44×10⁴ 22.24
8 1.40×10⁴
9.75 1.61×10⁴ 11.04 0.69×10⁴ 9.36
9 0.99×10⁴
7.41 1.02×10⁴ 5.92 1.44×10⁴ 2.76
Avg. 1.20×10⁴
10.35 1.12×10⁴ 7.83 0.96×10⁴ 9.06
Cladocer
a
and
Copepod
a
6 212.03 3.79 78.75 0.77 174.10 2.66
7 34.57 0.33 29.10 0.34 50.70 0.43
8 33.57 0.37 25.45 0.36 342.40 3.99
9 81.53 0.89 56.70 0.67 305.00 3.21
Avg. 90.43 1.35 47.50 0.54 218.05 2.57
Total
zooplankt
on
6 0.92×10⁵
22.74 2.46×10⁵ 18.53 2.86×10⁵ 13.39
7 6.61×10⁵
39.93 4.34×10⁵ 20.02 3.66×10⁵ 36.71
8 8.84×10⁵
49.40 4.28×10⁵ 29.65 3.65×10⁵ 25.11
9 6.74×10⁵
44.68 5.26×10⁵ 25.32 5.91×10⁵ 23.57
Avg. 5.78×10⁵
39.19 4.09×10⁵ 23.38 4.02×10⁵ 24.70
Page 12
International Journal of Fisheries and Aquaculture Research
Vol.1, No.1, pp.15-30, December 2015
___Published by European Centre for Research Training and Development UK (www.eajournals.org)
26
Table 2.The percentage of mean density and biomass of protozoa, rotifer, Cladocera
and Copepoda among the total zooplankton
Models
Percentage of mean density from the
total (%)
Percentage of mean biomass from the
total (%)
Total
(×105·L-
1)
Protoz
oa (%)
Rotif
er(%
)
Cladoc
era
(%)
Copep
oda
(%)
Total
(mg·L-
1 )
Proto
zoa
(%)
Rotife
r (%)
Cladoc
era (%)
Copepo
da (%)
Model Ⅰ 5.78 97.924 2.060 0.007 0.009 39.19 70.16
2
26.40
6 2.314 1.118
Model Ⅱ 4.09 97.250 2.738 0.003 0.009 23.38 64.21
0
33.50
0 0.922 1.368
Model Ⅲ 4.02 97.565 2.381 0.015 0.039 24.70 52.91
1
36.68
3 4.029 6.377
Table 3. Average diversity indices of zooplankton in each month in different culture
models
Diversity
Index Models Jun Jul Aug Sep Average
Simpson
index
Model
Ⅰ 9.4395 10.0782 13.7885 16.6463 12.4881
Model
Ⅱ 4.7070 11.5470 14.6039 15.3586 11.5541
Model
Ⅲ 4.0273 10.2802 14.0140 17.1775 11.3748
Shannon-
Wiener
index
Model
Ⅰ 2.8864 2.9359 3.0898 3.2558 3.0420
Model
Ⅱ 2.3052 2.8817 3.1759 3.1271 2.8725
Model
Ⅲ 2.1425 2.8713 3.0389 3.1541 2.8017
Pielou
index
Model
Ⅰ 0.4656 0.4613 0.5004 0.5238 0.4878
Model
Ⅱ 0.3710 0.4703 0.5164 0.5102 0.4670
Model
Ⅲ 0.3409 0.4582 0.4958 0.5112 0.4515
Page 13
International Journal of Fisheries and Aquaculture Research
Vol.1, No.1, pp.15-30, December 2015
___Published by European Centre for Research Training and Development UK (www.eajournals.org)
27
Table 4. Growth parameters of bighead carp and paddlefish in the three polyculture
models
Growth
parameters
Bighead carp paddlefish
Model 1 Model 2 Model 2
Initial weight (g) 55.01±3.89 55.01±3.89 150.09±6.88
Harvest weight (g) 140.33±8.95a 176.83±13.72b 323.56±11.10c
Daily weight (g▪d-
1)
0.71±0.05a 1.02±0.09b 1.45±0.05c
Net weight (g) 85.32±5.87a 121.82±10.71b 173.47±6.36c
Note: Values with different letters in the same row indicated significant differences (P<0.05).
Quoted from Chen et al. (2012)
Table 5.The results of physico-chemical parameters of water in three model ponds
Models Time
TP,
mg.L-1
PO43--
P,
mg.L-
1
NH4+-
N,
mg.L-1
NO2--
N,
mg.L-1
NO3--
N,
mg.L-1
TN,
mg.L-1
COD,
mg.L-1
DO,
mg.L-
1
pH T, ℃
Chlorop
hyll a,
mg.L-1
Model
Ⅰ
Jun. 0.125 0.066 0.504 0.011 0.131 0.888 6.952 2.307 7.977 28.967 0.041
Jul. 0.119 0.072 0.554 0.000 0.030 0.916 6.344 4.277 8.137 30.200 0.094
Aug. 0.123 0.010 0.212 0.000 0.000 1.650 6.344 2.187 7.497 30.267 0.229
Sep 0.095 0.022 0.346 0.002 0.000 1.254 6.890 1.813 7.200 24.933 0.179
Oct. 0.109 0.024 0.310 0.002 0.086 1.548 6.833 2.937 7.227 20.800 0.356
Mean 0.114 0.039 0.385 0.003 0.049 1.251 6.672 2.704 7.607 27.033 0.180
Model
Ⅱ
Jun. 0.048 0.013 0.484 0.027 0.178 0.756 6.578 4.263 8.083 28.533 0.058
Jul. 0.055 0.023 0.557 0.000 0.039 1.029 6.410 5.010 8.050 30.333 0.087
Aug. 0.092 0.010 0.216 0.000 0.000 0.947 6.410 3.173 7.580 30.500 0.155
Sep. 0.073 0.032 0.405 0.002 0.000 0.961 5.980 2.327 7.133 25.100 0.152
Oct. 0.085 0.037 0.075 0.003 0.008 1.311 6.593 4.497 7.283 20.833 0.275
Mean 0.071 0.023 0.347 0.007 0.045 1.001 6.394 3.854 7.626 27.060 0.145
Model
Ⅲ
Jun. 0.070 0.023 0.399 0.006 0.101 0.863 7.473 2.933 7.820 29.233 0.053
Jul. 0.109 0.032 0.520 0.000 0.018 1.214 5.929 3.853 7.850 30.600 0.094
Aug. 0.092 0.014 0.149 0.000 0.000 1.212 5.929 3.467 7.613 30.900 0.173
Sep. 0.095 0.049 0.303 0.002 0.000 1.379 5.048 2.223 7.277 25.167 0.141
Oct. 0.090 0.053 0.088 0.005 0.000 1.470 5.563 5.230 7.667 21.267 0.261
Mean 0.091 0.034 0.292 0.003 0.024 1.228 5.989 3.541 7.645 27.433 0.144
Page 14
International Journal of Fisheries and Aquaculture Research
Vol.1, No.1, pp.15-30, December 2015
___Published by European Centre for Research Training and Development UK (www.eajournals.org)
28
Table 6.Summary statistics of RDA
Axes 1 2 3 4
Eigenvalues 0.794 0.156 0.041 0.009
Species-environmental correlations 1.000 1.000 1.000 1.000
Cumulative percentage variance of species
data 79.4 95.0 99.1 100
Sum of all eigenvalues 1.000
Sum of all canonical eigenvalues 1.000
Table 7.Redundancy analysis Inter-set correlations of environmental variables with
axes
Environment variable Axis 1 Axis 2 Axis 3 Axis 4
TP, mg.L-1 0.3518 0.6961 -0.3731 0.3684
PO43--P, mg.L-1 0.5402 0.4662 -0.2380 0.1882
NH4+-N, mg.L-1 0.0254 0.6217 0.0627 0.5939
NO2--N, mg.L-1 -0.6409 -0.3914 0.5469 -0.2402
NO3--N, mg.L-1 -0.2508 0.4296 0.7235 -0.0149
TN, mg.L-1 0.6097 0.4333 -0.5291 0.1825
COD, mg.L-1 -0.2338 0.6179 -0.5728 -0.0566
DO, mg.L-1 -0.2703 -0.8576 0.2117 -0.2859
pH 0.0459 -0.3534 0.1139 -0.3320
T, ℃ 0.5052 -0.5516 -0.2860 0.3104
Chl-a, mg.L-1 0.0901 0.5767 -0.5265 0.2637
Fig 1.The biomass of zooplankton in each month in different stocking models (a, b, c
represent model Ⅰ, Ⅱ, Ⅲ, respectively)
Page 15
International Journal of Fisheries and Aquaculture Research
Vol.1, No.1, pp.15-30, December 2015
___Published by European Centre for Research Training and Development UK (www.eajournals.org)
29
Fig 2.The biomass of crustacean in each month in different stocking models
Fig 3. Bi-plot of the Redundancy Analysis for zooplankton abundance and
environmental variables. Broken arrows represent taxa of zooplankton whereas bold
arrows are environmental variables (rotifer-rotifer; protozoa-protozoa; cladocera-
cladocera; copepods- copepods)
-1.0 1.0
-1.0
1.0
protozoa
rotifer
cladocer
copepods
TP
PO43--P
NH4+-N
NO2--N
NO3--N TN
COD
DO
pH
T
Chl-.a
Page 16
International Journal of Fisheries and Aquaculture Research
Vol.1, No.1, pp.15-30, December 2015
___Published by European Centre for Research Training and Development UK (www.eajournals.org)
30
Fig 4. Bi-plot of the Redundancy Analysis for zooplankton abundance and sampling
units (1, 2 and 3 were three ponds of model Ⅰ, 4, 5 and 6 were three ponds of model Ⅱ,
7, 8 and 9 were three ponds of model Ⅲ)
-1.0 1.0
-1.0
1.0
protozoa
rotifer
cladocer
copepods
12
3
4
5
6
7
8
9