/// ,:_/ NASA Technical Memorandum 107339 ASME 96-GT-239 Army Research Laboratory Technical Report ARL-TR-1108 Comparisons of Rig and Engine Dynamic Events in the Compressor of an Axi-Centrifugal Turboshaft Engine A. Karl Owen Vehicle Propulsion Directorate U.S. Army Research Laboratory Lewis Research Center Cleveland, Ohio Duane L. Mattem NYMA, Inc. Brook Park, Ohio Dzu K. Le Lewis Research Center Cleveland, Ohio Prepared for the 41 st Gas Turbine and Aeroengine Congress sponsored by the International Gas Turbine Institute of the American Society of Mechanical Engineers Birmingham, United Kingdom, June 10-13, 1996 National Aeronautics and Space Administration U.S. ARMY RESEARCH LABORATORY https://ntrs.nasa.gov/search.jsp?R=19970002986 2020-05-08T07:28:12+00:00Z
Transcript
/// ,:_/
NASA Technical Memorandum 107339
ASME 96-GT-239
Army Research Laboratory
Technical Report ARL-TR-1108
Comparisons of Rig and Engine DynamicEvents in the Compressor of an
Axi-Centrifugal Turboshaft Engine
A. Karl Owen
Vehicle Propulsion Directorate
U.S. Army Research Laboratory
Lewis Research Center
Cleveland, Ohio
Duane L. Mattem
NYMA, Inc.
Brook Park, Ohio
Dzu K. Le
Lewis Research Center
Cleveland, Ohio
Prepared for the
41 st Gas Turbine and Aeroengine Congress
sponsored by the International Gas Turbine Institute of
COMPARISONS OF RIG AND ENGINE DYNAMIC EVENTS IN THE COMPRESSOR OF AN AXl-
CENTRIFUGAL TURBOSHAFT ENGINE
A. Kad Owen
U.S. Army Vehicle Propulsion DirectorateNASA Lewis _h Center
Cleveland, Oh, USA
byDuane L iVlanem I
NYMA, Inc.NASA Lewis Research Cente¢
Cleveland, Oh, USA
Dzu K. Le
Elect_nic and Control Systems DivisionNASA Lewis Resea_h Center
Cleveland, Oh, USA
I. Now with Scientific Monitoring Inc.., Tempe, Az, USA
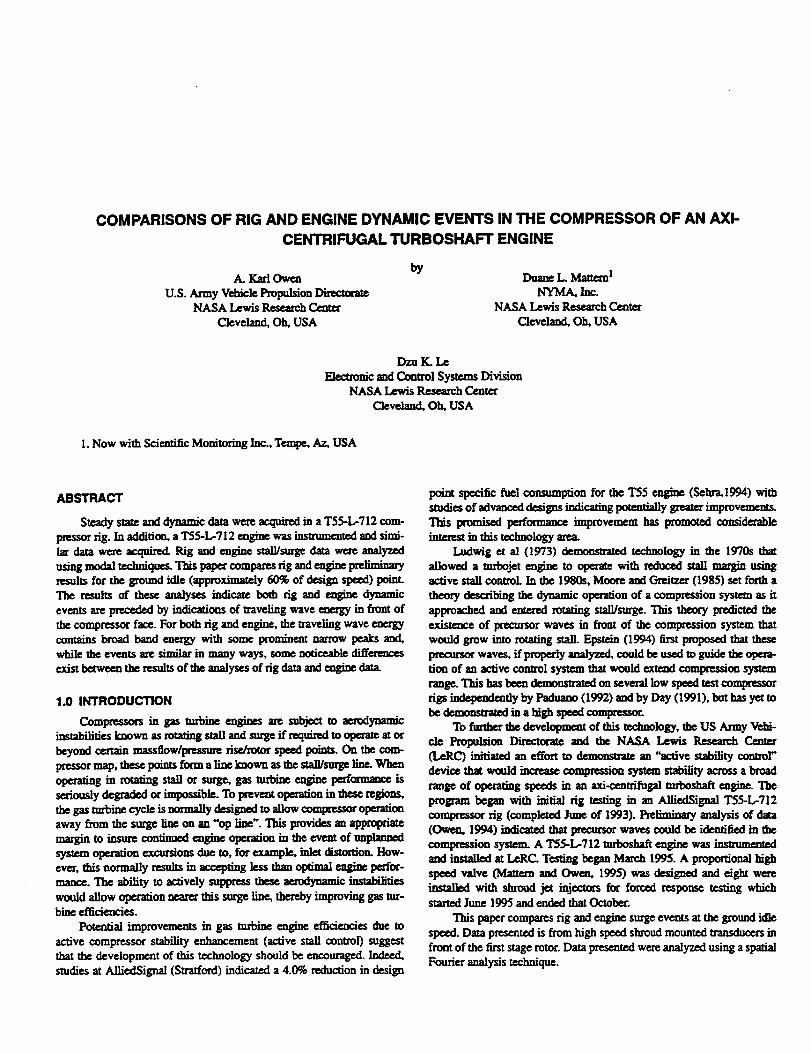
ABSTRACT
Steady state and dynamic data were acquired in a T55-L,-712 com-pressor rig. In addition, a T55-1.,-712 engine was insmmcnted and simi-lar data were acquired. Rig and engine stall/surge data were analyzedudng modal techniques. This paper compares ng and engine preliminaxyresults for the ground idle (approximately 60% of dedgn speed) point.The results of these analyses indicate both rig and engine dynamic
events are preceded by indications of traveling wave energy in front ofthe compressor face. For both rig and engine, the traveling wave energycontains broad band energy with some prominent narrow peaks and.while the events are dmilar in many ways, some noticeable differencesexist between the results of the analyses of rig data and engine data.
1.0 INTRODUCTION
Compressors in gas turbine engines are subject to aerodynamicinstabilities known as rotating sta_ and surgn if Rquix_ to opera_ ator
beyond ce_in massflow/pgcssure risehotor speed points. On the com-Wessor map, these points form a line known as the stall/surgn line. Wlzaoperating in rotating stall or surge, gas turbine engine performame isseriously degraded or impossible. To prevent operation in these tzgions,the gas turbine cycle is normally designed to allow compressor operationaway from the surge line on an "op line". This provides an appropriatemargin to insure continuedengine operation in the event of unplanned
operation excu_ons due to, for example, inlet disto_on. How-ever. this nozmaHy results in accepting less than optimal engine perfor-mance. The ability to actively mppzess these aerodynamic insu_ilities
would allow operation nearer this surge line, thereby improving gas tur-bine efficiencies.
Potential improvements in gas turbine engine efficiendes due to
active compressor stability enhancement (active stall control) suggestthat the development of this technology should be encouraged. Indeed,studies at A11iedSigml (Stratford) indicated a 4.0% reduction in design
point specific fuel consumption for the T55 engine (Sehra,1994) withstudies of advanced designs indicating potentially greater improvements.This promised performance improvement has promoted considerableinten_ in this technology area.
Ludwig et al (1973) demonstrated technology in the 1970s thatallowed a turbojetengine to operate with reduced stall maxginusingactive stall controL In the 1980s, Moore and Greitzer (1985) set forth a
theory describing the dynamic operation of a compre_on system as itapproached and entered rotating stall/mtge. This theo_ predicted the
existence of precursor waves in front of the compression system thatwould grow into rotating stall. Epstein (1994) first proposed that theseprecursor waves, if properly analyzed, could be used to guide the opera-tion of an active control system that would extend common systemrange. This has been demonsuated on several low speed test compressorrigs independently by Paduano (1992) and by Day (1991), but has yet tobe demomumd in a highspeed compmsu)r.
To further the development of this technology, the US Army Vehi-cle PropulsionDirectorateand theNASA _ Research Center(LeRC) initiated an effort to demonstrate an "active stability control"device that would increase cown system stability across a broadrange of operating speeds in an axi-centrifugal Inrboshaft engine. The
program began with initial rig testing in an AlliedSignal T55-L-712compressor rig (completed June of 1993). PreEminaxy analysis of data(Owen, 1994) indicated that precursor waves could be identified in thecompression system. A T55-I.,-712 mrboshaR engine was insmmlantedand installed at LeRC. Testing began March 1995. A proportional highspeed valve (Mattern and Owen. 1995)was designedand eight wereinstalled with shroud jet injecton for forced t_SlX)nse testing whichstarted June 1995 and ended that Octobe¢.
This paper compares rig and engine surge events at the ground idlespeed.Dam presentedis fromhighspeedshroudmountedtransducersinfront of the first stage rotor. Data presented were analyzed using a spatialFourier analysis technique.
RigRig Mounting Plane
Bleed Collecting Scroll \ Exhaust Manifold
Drive Shaft
Engine
Stage I Pressure TransducersBleed Opening
Combustor
Engine Mounts
Figure 1. Cutaway Meridional/Radial Views of the Rig and engine Test Facilities
2.0 TEST AND ANALYSIS FACILITIES
2.1 Introduction
References by Owen (1993) and Etter and Hingorani (1993) detailthe facility, testing, instnunentation, insmmtentafion locations, dataacquisition, and data reduction methodologies and equipment for the rigtesting while Owen (1995) and a NASA Lewis Research Center Pam-
phiet (1993) provide similar information for the engine testing. Spaceconsiderations p_clude an extensive review of Ibis information and theinterested reader is referred to these referencas.
Engine testing was divided into two phases, a low speed (groundidle) test and an "aft speed" test. The low speed engine testing was con-ducted with the power turbine locked, since the available dynamometercould not accept the engine power. Engine airflow was measured by inte-grating massflow at the inlet using total and static pressures and mea-sured temperatures. The compressor operating point was controlled witha start bleed over the sixth stage stator. For "all speed testing", whichinchtded additional ground idle testing, a waterbrake system and cali-brated bellmonth were acquired, on loan, from AlliedSignaL The water-
brake allowed engine operation over the emire power envelope. Thebellmonthimprovedengineairflow measuremems to an accuracy within
+ 0.5%. Hnally, a combustorinbleed system was designed and in-stalled to allow a more realistic compressor stage matching during theapproach to stall/surge.
2c) Differences Between Enoine and Ri?Differences existedbetween rig and engine test facilities. Figure 1
shows cross sectional views of both the rig and engine. The compressor
rig, shown in the upper half of fig. 1, consisted of two sequentialresearch inlet bellmouths, the second attached around an operationalengine inlet, a compressor with a standard operational geometry, adownstream plenum nominally sized to simulate a comhustor in volume,and an exit throttle valve.
Bleed air was collexted in an exit scroll, identified in fig. I, andexhausted from the building through a duct and controller valve. The rigcompressor drive shaft was mounted through the rig to a gearbox andwas driven by three T55 engines. In the engine, the downsueam plenumwas replaced with a combnstor and the exit throttle with a turbine. The
rig speed was accurately conlrolled with the three T55 engines while, inthe engine, a hydromechanical control unit provided the speed controLNotice in fig. 1 that the compressor rig casing was cantilevered off theplenum housing while the engine was mounted to a test stand at threehard points, two at the 4 and 8 o'clock positions near the first stage of the
compressor (two of the operational mounting points) and a single hardpoint at the 6 o'clock position at the comhustor.
2.3 Instrumentation
Differences existed betweenthe rig and engine instrument configu-rations. Rig i_tzumentation included a single flush mounted shroudstaticpressuretransducer at every stage starting after stage three andthree ciraunferentially equidistant shroud _ at the impellerexitEngineinstrumentation included flush mounted hub (wafer) trans-ducers at the exits of the first three stages that confirmed rotating stallbegan in the tip region. Six Math probes were located appmximateiy 1chord length upstream of rotor 1 for the initial portion of the low speedengine testing but were later removed, insuring that these probes wouldnot effect modal wave development.
Significant similarities also existed between rig and engine instm-mentatio_ At each of the first three stages, a set of eight transducers wasflush mounted on the shroud at the same axial location. Both rig andengine wan.uttmers were at the same circumferential locations and were
numbered in order increasing in the direction of rotation. Circumferen-tial increments were approximately 45°.Transducer sizes at a given
location, i.e. 15 psi absolute for the stage 1 transducer set, were kept thesame betwe_ rig and engine and, when pos._'ble, the samewere used. Figure 1 shows the meridionai/radial positions of the flushmounted transducers in front of stage 1.
2.4 Data Acquisition and ReductionFor all tes_ steady data were acquL-ed consisting of both research
andoporadoc_alpanmeters sampled at 1Hz.For dyna_c evens on therig, high bandwidthrig testdata (pres-uansducers) were recorded on analog tape for later analysis at the
LeRC Low speeddynamic data (up to 80% of design speed) wererecordedat 30 ]PS Crechesper secondtape speed),providing a band-widthof 20 ]d_ Rig testdatawerelaterdigitized at approximately9000
samples/sec/channel, providing a bandwidth of 3.6 kHz. Engine datawere recorded digitally using either the LeRC central data acquisition
systemof, later,anin-facility data acquisitionsystm. High speedchan-nels were digitized at a rate of about 12750 samples/second/channel,providing a bandwidth of approximately 5 kHz. Critical high speed datawere also backed up on tape at a tape speed of at least 30 IPS.
3.O TEST RESULTS
3.1 IntroductionThis section provides comparison of rig and engine dynamic
even_. A spatialFourier analysis (SFA) is included in thesecompari-sons.The SFA accomplished on all data used Syed's (1993) implemonta-don of Gamier's (1989) method. Although data from all three stages
were analyzed, only the data fi'om the shroud pressure um3sduce_located one chord length upstream of the stage l rotor are presented. Inthis data,as in all high responsedataacquiredduring these tests,strong
spati_dtraveling wave energy _ at the rotor fi_luency. This fre-quency information was retained for all presented plots, although datawere also processed with this signalremoved using a notch filte_ Data
minimally _ by lowpass filtering at 500 Hz. Both rig
and engine data were processed using the same software and filteringtechniques. This low pass limit (at over2.5 rotor frequency) wasdeemedhighenough to allowallperdnemmodal informationto pass butlowenough m eliminate mmecessary noise.
:_._ Ria and Encline Surge EventsTo assessd_aences in surgeevents causedby the differem meth-
odsof inducing sm'geandin testarticle configurations,the engine wassurgedwith both comb_tor inbleedand with start bleed closing.Theengine was also surged with and without the inlet Mach probes. Figure 2shows surge event static pressure traces vs time for shroud mountedtransducers; one in the rig (fig. 2a) and the othersin the engine (one withstart bleed and Mach probes(fig. 2b) and one with combustor inbleedand no Mach probes (fig. 2c)). These pa_icular pressure_racesweretaken from the pressure u'ansduce_ located at position I, approximatelytop dead center on the casing and appmxim_ly one chord lengthupstream ofthefirststagerotor.
Figure 2a shows two surgepulses(surge frequency -9 Hz). Super-imposed upon these surge pulses, rotating stall cells are discernible.Notice that the distance bexween rotating stall peaks is greater during the
deepest part of the serge event, indicating a changein stall f_equencyfrom roughly 65% to 42% of the rotor speed.
Another inte_sdng f_ apparent in this plot is in the develop-mere of the second surge lmlse. Pdor to the first surge event (about 8.86scc), a dngle rotating stall _11 dc_lops but prior to the second surgeevent (about 8.99 sec) there appear to exist several (probably four) rotat-
ing stall cells which merge into a single slzonger cell later in the event.Thisseemsto indicate that the boundary conditionsthecomp_emion
eL
a_
...... ....:.....
8,111 |.11_ $.9l $.9S V.II t.|,_ 9.1l
Time (Sec)
Figure 2a. Compressor Rig Surge
....... : ....... _ " .' ....... I i • -'
Z.Z_ ?.)1 2.35 Z.,I ?.*$ Z.Sl Z.$$
Time (Sec)
Figure 2b. Engine Surge with Mach
Probes Using Start Bleed Band
i ! : : i
11
eL
: ...... : ..... '.: .... _. ..
:
: : : : :
_._I 6.iS ?.H :.IS ,7.11 _'.:S 7.29
Tune (Sec)
Figure 2c. Engine Surge Without MachProbes Using Combustor Inbleed
system operates with can effect the number of developing stall ceils.During the second evem, _urization to the surge occurred muchmore rapidly than prior to the first pulse, for example.
Figure 2b is a developing engine dynamic event using start bleedclosure and with the inlet Mach probes in position. Apparent are similar-ities to the rig surge in the shape and frequency of the rotating stall ceU.Here, however, the rotating stall appears to develop more slowly, takingtwice as many rotations to grow to its largest extent (at 2.37 see). Thepresence of the inlet Mach probes did not inhibit the development of thisdynamic event. The most striking difference here is the lack of a clearmrge pulse. There appears to be a reduction in both steady and peak-to-peak pressure variations or a small partial "clearing" of the event at 2.44seconds foUowed by a subsequent deepening of the rotating stall. Whileit is difficult to accurately measure the length of time between the start of
the event and this "clearing", it would appear that it is nearly the same asthe time between rig surges (about 0.125 see).
Figure 2c shows an engine dynamic event similar to the one shownin fig. 2b. However, this event was initiated using combustor inbleed andwithout the inlet Mach probes. The rotating stall develops more rapidly.This event also shows little indication of sm'ge. Tram required for thedevelopment of the rotating stalls is the result of the rate at which the test
article is driven beyond the stalYsurge line. It was difficult to approachand initiate dynamic events in the engine with con_stency.
The lack of a clear surge at low speed in the engine is due to the
compressor exit boundary conditions. The occurrence of surges, asopposed to rotating stall, are a function of the volume dynamics of thecompression system. Since no clear surge pulses occurred, the effective
volume in the rig did not match the engine volume. This may, in part, bethe resultof the engine flameout which occurs immediately after rotatingstall begins. The loss of energy input to the air in the combustor mayunchoke the turbine, allowing the down$_ engine volume to becomea part of the system volume. Unfortunately, the low bandwidth of thesteady state data acquisition system precluded a direct assessment of this
possibility. The use of a rig bleed soroU and throttle valve, since theyclearly change the effective system volume, also play a part.
Nonetheless, it is apparent that rotating stalis in this compressor atthis speed are similar in both rig and engine, whether induced by startbleed, combustor inbleed, or throttle closure. However, the rate at which
rotating stalls are induced can profoundly affect their development.Lastly, it is interesting to note that the rotating stall event remained
present during the entire rig surge event, indicating a very "mild" eventwith little reverse flow.
3.3 Spatial Fourier _4Jnalwli_
ALldata shown below were analyzed using a spatial Fourier analy-sis technique developed by the Massachusetts Institute of Technologyand based on the work of Moore and Greitzer. This well known approachpostulates the existence of very mild momentum di_ces that travelcircumferentially about the front face of the compression system. As thecompressor approaches the surge line, the system approaches neutral sta-bility and these disturbances grow. At the rotating stall/surge point, thedisturbances initiate or deveiop into rotating stall/surge. Spatial and tem-poral variations (in this instance, pressure) sensed in the inlet of the
compressor are decomposed into their Fonrier components in spaceabout the cixcumference of the compressor inlet. The number of Fourier
components (spatial modes) that can be resolved is a function of the
number of sensors. For this application, three rotating modes _ beresolved (seven required sensors). Derailed explanations of the tech-
nique are prmmted in Paduano (1992), Gamier (1989), and Tryfonidis(_994).
To develop active stall control devices for mflxmmchinety appfica-tions at least one and possibly three _ pieces of informationmust be extracted by this analysis of the data. _ the aplmmch ofrotating stall/surgemust be detecud with adequate warningtimetorespond. Second, if two dimensional acn_on is de_md to inhibit thedevelopme_ of rotating stall/surge, the spatial location in time of those
aerodynamic features that promote the development of the dynamiceveat must be identified. Lastly, the transfer function for the control
inputs must be detennin_ The spatial Fourier analysis is designed, inpart, to provide that information. This paper presents an analysis of datato identify the first two pieces of required information.
The figures included in the following sections present analyzed damfor approximately the last second prior to the recorded dyna_c events.This time interval is a compromise. On one hand, it is a short enoughinterval to allow a more detailed look at the development of the dynamicevents. On the other, the interval is long enough to identify changes thatcan be used to sigml the onset of stall/sarge. While this paper cannotpresent a detailed explanation of the spatial Fourier analysis, a shortexplanation of the figures is included to help orient the reader.
Figures 3 and 4 show the results of this analysis on rig (figs. 3) andensine (figs. 4)testdata.Figure3a and 4a display the time traces of the
eight circemferentially mounted uansducen in front of the gage 1 rotor.In these figures, the direction of rotor rotation is up.
Figures 3b and 4b plot the location of the modal wave peak (phaseangle) vs non-dimemional time. If a single rate of movement of any ofthe first three peaks becomes dominant, the rate ofchangeinlocationbecomes co_ - the line becomes slraight. Note that in fig. 3b, modes2 and 3arevirtuallyoverlakland difficulttodistinguish.Figures 3cand4c show the magnitudes of the modal waves.
Figures 3d,e,f and 4d,e,f txe.umt the power spectral densities (PSD)for the first, second, and third modes for their respective data sets. Theseplots present the overall power as a function of frequency for theacquired datasets. These are plotted with frequency on the abscissa and a
non-dimensional magnitude on the ordinate. In these plots the "travelingwave" is indicated by the diffenmce between the two plotted lines at agiven frequencies. If the plotted solid line has a greater magnitude at agiven frequency than the dotted line, the wave is moving in the directionof roUgion. If both the solid line and the dashed line are the same magni-tude, the wave is spalially stationary. Large diffmmu:es between the twolines, such as those shown in fig. 3d at I rotor frequency (RS) indicate astrong modal energy at that frequency. These plots indicate at what fre-quencies the largest traveling wave energies exist. To assess if certainfrequency ranges become more promineatas the machine apprmclz,sstall/surge, this calculation is done using a "traveling window" andshown in figs. 3h_i,j and 4h,i,j. These magnitudes are calculated for a
window fifty samples wide. They are calculated and displayed every tensample steps during the approach to staU/mrse.
Figures 3g and 4g show a non-dimensionalintegrated total travel-ing wave energy vs time from Tryfonidis (1994). Th_ retnesents the
total modal or traveling energy for all frequencies contained in the data.All of these types of information have been used previously to iden-
tify theapproach to rotating sta/I/surge in various compression systems.
4
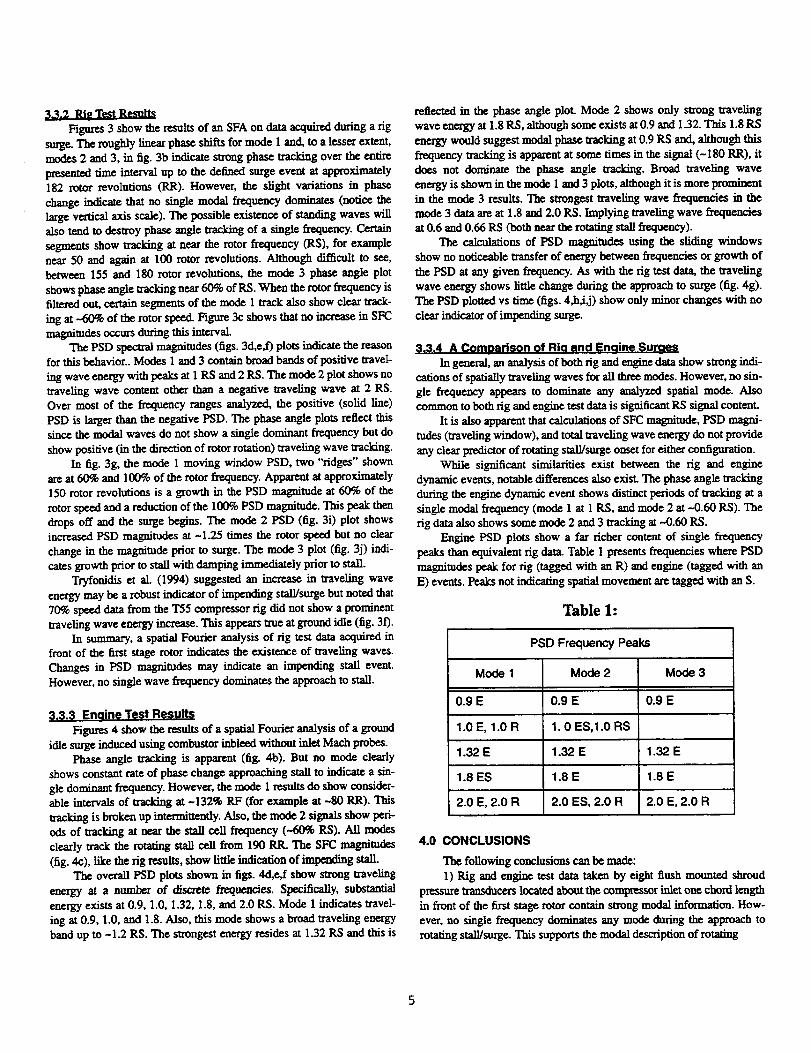
3.3.2 Ri_ Test Results
Figures 3 show the results of an SFA on data acquired during a rig
surge. The roughly linear phase shifts for mode 1 and, to a lesser extent,
modes 2 and 3, in fig. 3b indicate strong phase tracking over the entire
presented time interval up to the defined surge event at approximately
182 rotor revolutions (RR). However, the slight variations in phase
change indicate that no single modal frequency dominates (notice the
large vertical axis scale). The possible existence of standing waves willalso tend to desU'oy phase angle tracking of a single frequency. Certain
segments show tracking at near the rotor frequency (RS), for examplenear 50 and again at 100 rotor revolutions. Although difficult to see,
between 155 and 180 rotor revolutions, the mode 3 phase angle plot
shows phase angle tracking near 60% of RS. When the rotor frequency isfiltered out, certain segments of the mode 1 track also show clear track-
ing at -60% of the rotor speed. Figure 3c shows that no increase in SFC
magnitudes occurs during this intervalThe PSD spectral magnitudes (figs. 3d,e,_f) plots indicate the reason
for this behavior.. Modes 1 and 3 contain broad bands of positive travel-
ing wave energy with peaks at 1 RS and 2 RS. The mode 2 plot shows notraveling wave content other than a negative traveling wave at 2 RS.Over most of the frequency ranges analyzed, the positive (solid line)
PSD is larger than the negative PSD. The phase angle plots reflect this
since the modal waves do not show a single dominant fiequency but do
show positive(inthedirectionof rotor rotation)traveling wave wacking.
In fig.3g, the mode 1 moving window PSD, two "ridges"shown
are at 60% and 100% of the rotor frequency. Apparent at approximately
150 rotor revolutions is a growth in the PSD magnitude at 60% of the
rotor speed and a reduction of the 100% PSD magnitude. This peak then
drops off and the surge begins. The mode 2 PSD (fig. 3i) plot showsincreasedPSD magnitudes at-1.25 times the rotorspeed but no clear
change in the magnitude priorto surge.The mode 3 plot(fig.3j)indi-
catesgrowth prior to stall with damping immediately prior to stall.
Tryfonidiset aL (1994) suggestedan increasein traveling wave
energy may be a robust indicator of impending stalFsurge but noted that
70% speed data from the T55 compressor fig did not show a prominent
traveling wave energy increase. This appears true at ground idle (fig. 30.
In summary, a spatial Fourier analysis of rig test data acquired in
front of the first stagerotor indicates the existence of traveling waves.
Changes in PSD magnitudes may indicate an impending stall event.
However, no singlewave frequencydominatesthe approach tostall.
3,3,3 Enaine Test Results
Figures 4 show the resultsof a spatialFourieranalysisof a ground
Mode 1 Power Spectral Density vs FrequencyFigure 3d.
_0 "1C .
I-
o 10-%1
ge
_= Io-:2
10-_3
0.0
Gom;e_ met_
PSO2 1
C.5 1.0 _ .5 2-0 2.5 3.0
FreCluermy/'Rotor Frequency
Figure 3e. Mode 2 Power Spectral Density vs Frequency
10-10
G_rn;e_ mett_<_
PSO3
Forward Traveling _/_
:0-11
10 "13 .... ' - " ' - - , ; , , , , t
0.0 0.5 1.0 I-5 2.0 .2.5 3.0
F_-.cluency/Rot or Ft'equeno/
Figure 3f. Mode 3 Power Spectral Density vs Frequency
Figure 3. Spatial Fourier Analysis,Rig Dynamic Event, Continued
10 -11 ' ' " , .... L " ' • , .... , - - - , ....
Forward II co,._,,_e_
z0-:2
i I0-13
10--75| .... I .... , .... r , , , , , ,
0.0 0.5 %.0 1.5 2.0 2.5 3.0
Frequency�Rotor FPeq_ee¢ 7
Figure 4d. Mode 1 Power Spectral Density vs Frequency
:_ 10 -_3
^ , , .
. _ . . .
0.0 0.5 1.0 _ .5 2.0 2.5
_'rc_uee_y/R ot or Frequency
3.0
Figure 4e. Mode 2 Power Spectral Density vs Frequency
IO- :: _: " "
%0-14
Forward
0.0 0.5 _ .0 1.5 2.0 2.5 3.0
FrequenCy/Rotor F_lue_cy
Figure M. Mode 3 Power Spectral Density vs Frequency
Figure 4. Spatial Fourier Analysis,Engine Dynamic Event, Continued
10000,0
t 000.0_
t O0.Oq
t_ODE: t
_00£ 2
[I
t -I
tO.O0
A0.10 ]
0.01
0 50 100 150 2_
ROt"OR REVOt.t.mO_S
Figure 3g. Traveling Wave Energy vs Time
t0.000
5 o.loo
i
0.010
0.00 t
_K)OE
UOOE
i
metho_
J
.... .... ,;o'''ROTO_R_V0U_110_
20C
Figure 4g. Traveling Wave Energy vs Time
Figure 3h. Mode I PSD vs Frequency vs T'=me Figure 4h. Mode I PSD vs Frequency vs Time
¢,o.-e_-
Q
_o,=_-
¢n i
Figure 3i. Mode 2 PSD vs Frequency vs Time
Figure 3. Spatial Fourier Analysis,Rig Dynamic Event, Continued
w
=S¢=¢O.¢l.
_ev°/¢-: " _otor t:_<t_encv
Figure 4i. Mode 2 PSD vs Frequency vs Time
Figure 4. Spatial Fourier Analysis,Engine Dynamic Event, Continued
_,t "" "l:reque'"'
Figure 3j. Mode 3 PSD vs Frequency vs Time
Figure 3. Spatial Fourier Analysis,Rig Dynamic Event, Continued
Figure 4j. Mode 3 PSD vs Frequency vs Time
Figure 4. Spatial Fourier Analysis,Engine Dynamic Event, Continued
stall/surge development.2) The modal analysis of both rig and engine data does not provide
a robust indication of the onset of rotating stall/surge. However, consid-erably more work must be done to improve the results of this analysis.
3) Significant _ between the results of modal analyses ofrig and engine data sugge_ that the development of an active stabilityenhancementdevicerequitesananalysisofbothrigandenginedam.
4)The rateat which the compressor is forced into rotating stall/sm'ge may significantly effect the development of the event. This could
explain some of the differences between the modal analysis results of therig and engine dynamic events. In addition, the rel_vely npidsurizafionpriortothesecondfigsurgepulseapp_ ledtomultiple
5) Both rig and engine rotating stall events are similar in shape andf_quency. However, the engine lacks a distinct surge pulse at 60% ofdesign speed. It is not clear whether this is the result of the differences ingeomu'y or _st _.
ACKNOWLEDGMENTS
Theaetho__sh _ peb._ recogn_ sever_pmonsandorga_-zafions _ to this p_Fam. Mr. Stephen Eaer, Dr. Anm Sehra, Mr.Sanjay Hingorani, _ Steve Curry, aad the entre staff of the Stra_ord
faci_ty of AlliedSignalprovidedextensiveand confirmingsupportof
both rig and engine testing. Dr. Don Bx,maz, Mr. Omm" Syed, Mr. TomGriffin, Mr. Barry Piendl and the enlire ECRL staff are thanked for thelong days during _ying times. Mr. George Bobula, Ik Walt Menill, andMr. Jim May provided unwave_ug support.
This program is a part of JDAPS dynamic engine modeling efforts.
Day, Ij.,"Active Suppression of Rotating Stall and Stage in Axial
Compressor", ASME Paper 91-GT-87, June 1991.Epstein,A.I-L,FfowcsWdliams,F.E.,and _, E.M.,"Active
Etter, S. and Hingor_, S., "I'55-L-712 Start-Up Stall Investiga.tion, Conlract NAS3-26698, TEST PLAN", May 5, 1993,(Proprietary).
Gamier, V.H., "Experimental Investigation of Rotating Waves as aRota_g Stall InceptionIndicationinCompressors", Gas Tm_ne Labo-
ratory Repo_ GTL #198, Massachusetts Institute of Technology, Nov1989.
Ludwig, G.R., Neuni, J.P. and _ R.H., "Investigation ofRotating Stall in Axial Flow Coors and the Development of aPrototype Rotating Stall Control System", Technical Report AFAPL-TR-73-.45, May, 1973.
Matte_ D.L., and Owen A.K. "A Voice Coil Actuated Air Valve
for Use in CompressorForcedResponseTesting", presented at the 1995SPIE Aerosense Conference, Orlando, 1=1,SPIE Vo12494, paper #2494-19.
Moore, FJL, and Greltzer, EM.,"A Theory of Post-Stall Transientsin Axial Compression Systems: Parts I-IF', ASME Paper No. 85-GT-172, 1985.
Owen, A.K., "Analysis of Rig Test Data for an Axial/CentrifagalCompressor in the 12 Kg/Sec Class", Presented at the AGARD 82_PEP, Montreal, Can., Oct 4-8, 1993.
Owen, A.IC and Bobela, G.A., "Analysis of Dynamic Rig Test
Data for an Axial/Cenuifagal CompressorOperatingat Design Speed",Presented at the AHS 50 thAnnual Forum and Technology Display, MayI1-13, 1994.
Owen, A.K., "An Analysis ofUnsteady AerodynamicEvems in aCras _ _ Compressor, presented at tbe 19th Army Sci-ence Confemace,Orlando, H, Jone 20-23, 1994.
Owon, A.K.,"Comparisons Between _y AerodynamicEvents in a Gas Turbine Generator and an Iden_cal Compressor Rig",Presented at the AGARD $5thPEP, Derby, GB, May 8-12,1995.
Paduano, J.D, "Active Control of Rotating Stall in Axial Compres-
sors", PhD Dissertation, Massachusetts _ of T_hnology, GTLP.eportrz0s, Mar_ 1992
Sehra, A.K., "The Promise of Active conlrol for Helicopter andTank Engines", Workshop on Intelligent "13zrbineEngines for ArmyApplications, Cambridge, Ma, March 21-22,1994.
Syed, O.A. Personal communication, March 1994.
"The EugineComponents Research La_ram_, AeropropulsionFacilities and Experiments Division, Lewis Research C.en_, Aug 1993.
Tryfonidis, M., E_hevers, O., Paduano, J.D., Epstein, A.I-L andHendricks GJ.,"Pre-Stall Behavior of Several High-Speed Compres-sors", Presented at the ASME IGTL the Hague, Netherlands, Jun 1994.
I Form Approv_REPORT DOCUMENTATION PAGE OMBNo. 0704-0188
DaMs Highway, Suite 1204, AdlnGlon,VA 22202-4302, and to the Office ol Manal_t and BudgeL PapecwomPmouoJont'ro_c_ lu_,Pu _ml, asmngmn.
11. AGENCY USE ONLY (Leave b/ank) 2. REPORTDATE 3. He:pOFIT TYPE AND DATES COVERED
October 1996 Technical Memecandam
4. TITLE AND SUBITrLE 5. FUNDING NUMBERS
Comparisons of Rig and Engine Dynamic Events in the Compressorof an Axi-Cenlrifugal Turboshaft Engine
is. AUTHOR(S)
A. Karl Owen, Duane L. Mattern, and Dzu K. Le
7. PERFORMING ORGANIZATION NAME(S) AND ADDRESS(ES)
NASA Lewis Research Cealer
C]eve]md, Ohio 44135-3191
"vehicle_ _teU.S. Army Re=caleb_C3evehmd.Ohio 44135--3191
9. SPONSORING/MONITORING AGENCY NAME(S) AND ADDRESS(ES)
Nadomd Aeroeaadcs and Space Administration
Washington, D.C. 20546-43001
andU.S. Army Rew.amhLaboratoryAddOd, Mary_d 20783-1145
WU-505--62-0L
8. PERFORMING ORGANIZATION
REPORT NUMBER
E--10478
10. SPONSORING/IK)NITOfllNGAGENCY REPORT NUMBER
NASA TM-107339
ARL-TR-1108
ASME 96-GT-239
11. SUPPLEMENTARY NOTES
Prepared for the 41st Gas Turbine and Aeroengine Congress _ored by the International Gas Turbine Instku_e of the AmericanSociety of Mechanical Eng--, Birmingham, United Kingdom, June 10-13, 1996. A. Karl Ower_ Vehicle Propulsion Directorate,U.S. Army Research I.,aboratory,NASA Lewis Research Center;,Duane L. Maaem, NYMA, Inc., 2001 Aerospace Parkway, BrookPark, Ohio 44142 (work funded by NASA Contract NAS3--27186) now with Scientific Monitoring, Inc., Tempe, Arizona; Dz_ K. Le,NASA Lewis Research Center. Responsible person, A. Karl Owen, organization code 2760 (216) 433--5895.
12a. DISTRIIBUTK_N/AV#JI.ABILITY STATEMENT
Unclassified - Unlimited
Subject Catcgocy 07
This publication is available from the NASA Center for AeroSpace Infomuuion, (301) 621-0390.
12b. DISTRIBUTION CODE
13. ABSTRACT (Maximum 200 words)
Steady state and dynamic data were acquired in a T55-L--712 compressor rig. In addition, a T55-L-12 engine was insma-
mented and similar data were acquired. Rig and engine stall/surge data were analyzed using modal techniques. This paper
compares rig and engine preliminary results for the ground idle (approximately 60% of design speed) point. The results of
these analyses indicate both rig and engine dynamic event are preceded by indications of wavering wave energy in front of
the compressor face. For both rig and engine, the traveling wave energy contains broad band energy with some prominent
narrow peaks and, while the events are similar in many ways, some noticeable differences exist between the results of the