Comparisons of Styrene Ionomers Prepared by Sulfonating Polystyrene and Copolymerizing Styrene with Styrene Sulfonate R. A. WEISS,* R. D. LUNDBERG, and S. R. TURNER,+ Corporate Research Laboratories, Exxon Research and Engineering Company, Route 22 East, Annandale, New Jersey 08801 Synopsis As part of a continuing study of ioncontaining polymers, a comparison has been made on styrene-based sulfonate ionomers obtained by two different processes. Copolymers of styrene with sodium styrene sulfonate (SSS) have been compared with corresponding polymers ob- tained by the sulfonation/neutralization of preformed polystyrene (S-PS). The former system covered a range of sulfonate level from 1 to 30 mol %, while the latter ranged from about 1 to 7 mol %. The characterization of these materials has been conducted using solubility behavior, dilute solution viscometry, thermal mechanical analysis, density measurements, and water adsorption studies. At low (ca. 1%) levels the solubility behavior of the SSS copolymers and the sulfonated polystyrenes were similar. However, at higher sulfonate levels the solubility behavior in different solvents and the dilute solution viscometry were significantly different for the two systems. Similarly, thermal analysis studies (DSC)showed that the glass transition of the sulfonated polystyrene increased linearly with sulfonate level, while the TR for the SSS copolymer increased modestly, up to about 7 mol % sulfonate content, and then remained constant. Significant differences in the softening behavior and water absorption characteristics were also observed for these two classes of ionomers. Although molecular weights and mo- lecular weight distributions are not now available for these ionomers, the differences in their behavior does not appear to be due simply to differences in molecular weight. It is postulated that the differences in the copolymer and the S-PS ionomers may originate with differences in sulfonate distribution. It is suggested that the SSS monomer units are incorporated as blocks in the copolymer as opposed to a more random distribution in the S-PS ionomer. Indirect evidence in support of his argument is found, for example, in the case of the copolymer in the solubility behavior, the relative independence of T, on sulfonate concentration and the apparent existence of a second, high temperature transition tentatively attributable to an ion- rich phase. Additional studies are required to confirm this hypothesis. INTRODUCTION The incorporation of small amounts of ionic functionality into a predom- inantly hydrocarbon polymer provides a unique method for controlling poly- mer properties. These materials, ionomers, have received considerable at- tention in recent years, as evidenced by several monographs13 and review articles.4~~ While any acid functionality can be used to prepare ionomers, carboxylic acid derivatives comprise the majority of ionomers. Over the past several years there has been considerable interest in sulfonate-containing ionomers, and systems based on polystyrene,616 EPDM,7-23 polysulfone,24 * Present address: Institute of Materials Science, University of Connecticut, Storrs, CT 06268. + Present address: Eastman Kodak Company, Research Laboratories, Rochester, NY 14650. Journal of Polymer Science: Polymer Chemistry Edition, Vol. 23, 549568 (1985) @ 1985 John Wiley & Sons, Inc. CCC 0360-6376/85/020549-20$04.00
Transcript
Comparisons of Styrene Ionomers Prepared by Sulfonating Polystyrene and Copolymerizing
Styrene with Styrene Sulfonate
R. A. WEISS,* R. D. LUNDBERG, and S. R. TURNER,+ Corporate Research Laboratories, Exxon Research and Engineering Company, Route
22 East, Annandale, New Jersey 08801
Synopsis
As part of a continuing study of ioncontaining polymers, a comparison has been made on styrene-based sulfonate ionomers obtained by two different processes. Copolymers of styrene with sodium styrene sulfonate (SSS) have been compared with corresponding polymers ob- tained by the sulfonation/neutralization of preformed polystyrene (S-PS). The former system covered a range of sulfonate level from 1 to 30 mol %, while the latter ranged from about 1 to 7 mol %. The characterization of these materials has been conducted using solubility behavior, dilute solution viscometry, thermal mechanical analysis, density measurements, and water adsorption studies. At low (ca. 1%) levels the solubility behavior of the SSS copolymers and the sulfonated polystyrenes were similar. However, at higher sulfonate levels the solubility behavior in different solvents and the dilute solution viscometry were significantly different for the two systems. Similarly, thermal analysis studies (DSC) showed that the glass transition of the sulfonated polystyrene increased linearly with sulfonate level, while the TR for the SSS copolymer increased modestly, up to about 7 mol % sulfonate content, and then remained constant. Significant differences in the softening behavior and water absorption characteristics were also observed for these two classes of ionomers. Although molecular weights and mo- lecular weight distributions are not now available for these ionomers, the differences in their behavior does not appear to be due simply to differences in molecular weight. It is postulated that the differences in the copolymer and the S-PS ionomers may originate with differences in sulfonate distribution. It is suggested that the SSS monomer units are incorporated as blocks in the copolymer as opposed to a more random distribution in the S-PS ionomer. Indirect evidence in support of his argument is found, for example, in the case of the copolymer in the solubility behavior, the relative independence of T, on sulfonate concentration and the apparent existence of a second, high temperature transition tentatively attributable to an ion- rich phase. Additional studies are required to confirm this hypothesis.
INTRODUCTION
The incorporation of small amounts of ionic functionality into a predom- inantly hydrocarbon polymer provides a unique method for controlling poly- mer properties. These materials, ionomers, have received considerable at- tention in recent years, as evidenced by several monographs13 and review articles.4~~ While any acid functionality can be used to prepare ionomers, carboxylic acid derivatives comprise the majority of ionomers. Over the past several years there has been considerable interest in sulfonate-containing ionomers, and systems based on polystyrene,616 EPDM,7-23 polysulfone,24
* Present address: Institute of Materials Science, University of Connecticut, Storrs, CT 06268. + Present address: Eastman Kodak Company, Research Laboratories, Rochester, NY 14650.
Journal of Polymer Science: Polymer Chemistry Edition, Vol. 23, 549568 (1985) @ 1985 John Wiley & Sons, Inc. CCC 0360-6376/85/020549-20$04.00
550 WEISS, LUNDBERG, AND TURNER
polypentenamer?zsB and fluorinated hydrocarbons (NationsP have been described. These materials are prepared by sulfonating the preformed poly- mer.
More recently, several laboratories have prepared sulfonate ionomers by copolymerizing a sulfonated monomer and either a vinyl or diene hydro- carbon m o n ~ m e r . ~ , ~ ~ The chemistry by which these copolymers have been prepared is complicated and was recently described by Turner, Weiss, and Lundberg,3z and it has been demonstrated that these materials exhibit many of the properties associated with i0nome1-s.~~ In this article we describe the similarities and differences between styrene ionomers prepared by copo- lymerization of styrene and sodium styrene sulfonate and the chemically equivalent material prepared by sulfonation of polystyrene.
EXPERIMENTAL
Materials Styrene monomer was freshly distilled at 145°C prior to use. The re-
mainder of the reactants, sodium styrene sulfonate (SSS), sodium lauryl sulfate (emulsifier), diisopropylbenzene hydroperoxide (initiator), triethy- lenetetramine (reducing agent), sodium pyrophosphate (buffer), and l-do- decanethiol (chain transfer agent) were used as received. Water was distilled and boiled prior to use.
Polymerizations
Free-radical emulsion copolymerizations were carried out in beverage bottles at room temperature. The reactions were terminated by the addition of hydroquinone and the polymers were stabilized with 2,Z1-methylene-bis(4- methyl-6-t-butyl phenol). Whenever possible, the polymers were recovered either by precipitation in methanol or by the addition of NaCl to the latex.
TABLE I Summary of Copolymerization Reaction Formulationsa
Reaction Reaction Sample Styrene sss temperature time Conversionb
designation (g) (g) (OC) (h) (%)
C1.6 C2.9 (2.1 C8.1 c9.3 c11.9 C17.7c C31.2*
106.4 106.4 106.4 106.4 106.4 106.4 53.2 26.6
3.5 6.9
13.8 26.6 39.9 53.2 33.7 33.7
23 23 23 23 23 23 22 22
21 94 21 > 100 16 > 100 16 80
> 100 > 100
ca. 18 ca. 18
a Standard recipe: 2.65 g of diisopropylbenzene hydroperoxide, 2.65 g of triethylenetetramine, 12.2 g of sodium lauryl sulfate, 0.74 g of dodecanethiol, 1.6 g of sodium pyrophosphate, 266 g of water.
Based on styrene charge. Used one-half the standard recipe, except for water (266 g). Used onequarter the standard recipe, except for water (266 9).
COMPARISONS OF STYRENE IONOMER 551
In those cases where the latex displayed unusually high stability, e.g., at the higher concentrations of SSS, the copolymer was recovered by evapo- rating the latex to dryness. Each copolymer was subsequently dissolved or swelled in a suitable solvent, reprecipitated in methanol, and dried under vacuum. A summary of the reactions is given in Table I.
Polystyrene (PS) was polymerized by the same procedures used in the copolymerizations. Sulfonated polystyrene (SPS) was prepared in 1 ,2-dich- loroethane solution at 50°C using acetyl sulfate as the sulfonating agent.34 The sulfonic acid derivative was converted to the sodium salt by titrating with excess sodium acetate.
Polymer Characterization
Sulfur content was determined by Dietert sulfur analysis35 and was used to calculate the copolymer composition. Wherever the thiol chain transfer agent was used, the sulfur due to the thiol was subtracted from the total sulfur when determining the sulfonate concentration. Sodium concentra- tions were determined by emission spectroscopy.
Glass transition temperatures T, were measured with a Perkin-Elmer differential scanning calorimeter (DSC) model 2 using a scanning rate of 20"/min and a nitrogen atmosphere. T, was taken as the temperature at which the change in the heat capacity associated with the transition reached one-half of its ultimate value. Softening behavior was measured under a helium atmosphere with a Perkin-Elmer TMS-2 thermomechanical ana- lyzer (TMA) using a quartz compression probe with a hemispherical tip (1.52-mm radius) and a heating rate of 10"C/min.
The molecular weights and molecular weight distributions of the poly- styrene homopolymers were determined by high-speed gel permeation chro- matography. Dilute solution viscosities were determined in various solvents using a Ubbelohde capillary viscometer for which the kinetic energy cor- rection was negligible. The Huggins equation
was used to calculate the intrinsic viscosity [q] and the Huggins constant k'.
RESULTS AND DISCUSSION The styreneSSS copolymers and the sulfonated polystyrenes (SPS) de-
scribed in this article are summarized in Table 11. Some of the sulfur in these materials originates with the thiol chain-transfer agent and must be accounted for if the sulfur analysis is to be used to calculate the sodium sulfonate concentration. If all of the charged thiol reacted, it will account for 0.11% sulfur in the product. This is in fair agreement with the sulfur analysis (0.16%) of the PS homopolymer, prepared from the same recipe. The excess sulfur due to unremoved emulsifier is believed to be negligible, an assumption supported by the sodium analysis of the PS sample (0.01%). As a consequence, the sulfonate concentrations and the sulfur/sodium ratios given in Table I were calculated after subtracting 0.11% S from the original sulfur analyses in column 2.
a Calculated from sulfur concentration adjusted to account for sulfur due to thiol (0.11%).
A plot of the sulfur analysis versus the feed composition for the copo- lymerization experiments is given in Figure 1. The data fall on a straight line with an intercept at zero SSS charge of 0.29% sulfur. This corresponds to a slightly higher value of residual sulfur than can be accounted for by the thiol concentration, which suggests that some emulsifier may remain in these polymers. In any event, it is estimated that the experimental uncertainty in the sulfonate concentration corresponds to the difference between this extrapolated residual sulfur result and the sulfur due to thiol- i.e., 0.18% sulfur or 0.6 mol % sulfonate.
The sulfonated polystyrenes were prepared from a styrene homopolymer synthesized using the identical formulation employed in the copolymeri- zation experiments, but without the SSS comonomer. This homopolymer, PS, had an intrinsic viscosity of 0.33 dL/g in 90% toluene/lO% methanol
t 4-
3 6 Y J
0 10 20 30 40 5 0
SSS CHARGE (mol %)
Fig. 1. Sulfur content of copolymers versus sodium styrene sulfonate monomer concentra- tion in the copolymerization charge.
COMPARISONS OF STYRENE IONOMER 553
at 25”C, which corresponds to a viscosity average molecular weight of 79,000.36 Gel permeation chromatography yielded the following molecular weights: M, = 23,000, M, = 91,000, M, = 233,000, and M,,, = 498,000.
Molecular weights and molecular weight distributions of ion-containing polymers are difficult to determine because of the strong ionic associations which prevail even in dilute solution! Therefore, the traditional methods for characterizing polymer molecular weights, such as intrinsic viscosity, yield at best apparent molecular weights and are likely to be strongly dependent on the solvent used. On the basis of intrinsic viscosity measure- ments under conditions which minimize ionic associations, Lundberg and Makowski7 concluded that the sulfonation/neutralization process has no significant effect on the backbone molecular weight of the polymer at sul- fonate contents as high as 5 mol %. GPC studies on SPS by Siebourg, Lundberg, and L e d 2 suggest, however, that some molecular weight deg- radation may occur during these processes. This conflict arises primarily because of the difficulties in interpreting experimental data which may be affected by hydrodynamic volume perturbations resulting from intramo- lecular interactions. The molecular weights of the copolymers are even more difficult to determine, because in this case there is no preformed non-ionic polymer to use as a reference.
In the discussion that follows comparisons are made of the styreneSSS copolymers and SPS polymers. It is assumed that these materials have similar molecular weights and that the effects of differences in molecular weight and molecular weight distribution are minor. In order to demon- strate to some degree what effect molecular weight has on the properties of SPS, some data are presented for SPSs prepared from a polymer of higher molecular weight (M, = 106,000 and M, = 288,000). In light of the diffi- culties in obtaining reliable GPC measurements of sulfonated polymers as pointed out in Ref. 12, no attempts were made to measure the molecular weights of either the copolymers or the SPS by GPC. Instead all discussion of molecular weight is based either on the molecular weight of the starting PS in the case of SPS or inferred from dilute solution viscosity in the case of the copolymers.
Solubility Behavior
Ionomers, particularly sulfonate-containing ionomers, exhibit such strong ionic associations that dissolution in solvents of low polarity is difficult. Depending upon the concentration of ionic groups, and to some degree upon the polymer concentration, attempts to dissolve a sulfonate ionomer in a hydrocarbon solvent, such as toluene, results in either an extremely viscous solution or insolubility.
The addition of a small amount of a polar cosolvent such as an alcohol, which selectively solvates the ionic species, weakens the ionic association and permits dissolution of the ionomer. Lundberg3I has explained this be- havior as a n equilibrium between a solvated species and an aggregated species of multiple ion-pairs.
An alternative to the mixed solvent approach is to use a solvent of higher polarity, i.e., higher dielectric constant E than a hydrocarbon solvent. It has recently been demonstrated that SPS is soluble in many single solvents,
554 WEISS, LUNDBERG, AND TURNER
TABLE I11 Solubility of StyreneSSS Copolymers and Sodium-Sulfonated Polystyrene
such as dioxane ( E = 2.21, tetrahydrofuran ( E = 7.61, 2-methoxy-ethanol ( E = 16.91, cyclohexanone ( E = 18.21, dimethylformamide ( E = 36.71, and dimethylsulfoxide ( E = 46.71.% Solubility in these solvents is, of course, dependent on the sulfonate level, and, in general, the higher the dielectric constant, the better the solvent is for the more highly sulfonated polysty- renes. For example, whereas sulfonated polystyrene with 6 mol % sodium sulfonate is insoluble in tetrahydrofuran (THF), it is soluble in dimethyl- formamide (DMF).
The solubility of the copolymers and SPS in several solvent systems are given in Table 111, and the results are consistent with the above discussion. Up to a sulfonate concentration of about 3 mol %, the copolymers are soluble in toluene alone. Above this concentration, the addition of 10% methanol as a cosolvent improves the solubility, but above about 4 mol % the copoly- mers are not completely soluble in the mixed solvent. The solubility is improved with DMF, but for the higher sulfonated materials complete sol- ubility is still not attained.
The solubility characteristics of the SPSs are somewhat different. Above 1.5 mol % sodium sulfonate these materials, too, are insoluble, in toluene; however, over the entire range studied, 1-7 mol %, the SPSs are completely soluble in 90% toluene/lO% methanol and in DMF. These differences in the solubility behaviors of the copolymers and SPS may be a result of differences in sulfonate group distribution as will be discussed later in this article. Data will be presented later in this paper that suggest that the SSS is incorporated in the copolymers in a blocky manner.
Density
In a recent discussion of clustering in ionomers, E i ~ e n b e r g ~ ~ showed that a plot of the density of styrene-sodium methacrylate copolymers as a func- tion of carboxylate concentration exhibits an appreciable change in slope
COMPARISONS OF STYRENE IONOMER 555
1.021 0 5 10 15 20 25 30
SULFONATE CONC. (mol %) Fig. 2. Density of styrene-co-sodium styrene sulfonate copolymers (0) and sodium sulfon-
ated polystyrene (0) versus sulfonate concentration.
at ca. 6 mol % which he attributed to the onset of clustering in these materials. He then calculated the fraction of ions in the clusters from the integrated intensities of the two dielectric peaks observed in the glass tran- sition region40 and showed that the density varied linearly with this vari- able. From this and other results presented in that paper, Eisenberg concluded that the clusters dominate the properties of ionomers.
The densities of the styrene-SSS copolymers and the SPS’s were measured with a pychnometer and are plotted against sulfonate concentration in Figure 2. The data for both materials fall on a straight line, and contrary to Eisenberg’s results for styrene-sodium methacrylate copolymers, neither of the two sulfonate ionomer systems exhibits a change in the slope of the density-concentration curve. This result may be a consequence of differ- ences in the ion association between sulfonate and carboxylate ionomers as demonstrated by the thermomechanical analysis, melt rheology, and dilute solution behavior reported by Lundberg and Makowski7 for polysty- rene ionomers. If indeed, as suggested by Eisenberg, the density of an io- nomer is extremely sensitive to the morphology of the ionic aggregation, one is tempted to conclude from Figure 2 that the morphologies of the copolymers and SPS are similar. This conclusion is somewhat puzzling in light of the differences in the thermal behavior and water uptake of the two systems as will be discussed later in this article.
Solution Behavior
The viscosity of ionomers in dilute solutions can provide important in- formation concerning the interactions of the ionic species as well as delin- eate differences between materials. Whereas the behavior of poly- electrolytes in dilute solution has received considerable attention, (cf. Ref. 11, very few studies have considered the behavior of ionomers in solution. In this regard, the work of Lundberg et a1.37.38 probably represents the most definitive investigation of ionomers using solution techniques.
Lundberg and Phillips% have shown that the solution behavior of SPS can vary from classical polyelectrolyte behavior to that characteristic of
556 WEISS, LUNDBERG, AND TURNER
~ 0.4
k 3 0.3 0 2 > 0.2 n W
W
0 0.5 1.0 1.5 2.0 CONC. (g/dl)
Fig. 3. Reduced viscosity versus polymer concentration for sulfonated polystyrenes in tol- uenelmethanol (90/10): (0) 0.5 mol % sodium sulfonate, (0) 1.0%, (D 1.5%, (0) 4.1%, 0 5.7%, (A) 7.2%.
ion-pair interactions depending upon the solvent polarity. In solvents of low polarity, ion-pair interactions predominate. At polymer concentrations greater than ca. 0.5% the solution viscosity exceeds that of an unfunction- alized polymer because of intermolecular associations, while at lower poly- mer concentrations the viscosity can be lower than that of the corresponding u,ifunctionalized polymer as a result of intramolecular interactions.
In more polar solvents, the charges are effectively separated. In dilute solution the fully ionized anions repel each other resulting in an expansion of the polymer coil and a marked increase in the solution viscosity. This “polyelectrolyte effect” which is well known for highly functionalized poly- mers such as poly(sodium acrylate) or fully sulfonated polystyrene can be eliminated by the addition of simple salts which associate with the anions and, as a consequence, shield them from each other. In principle, this is what happens in solvents of low polarity where the ion pair is not fully ionized.
The dilute solution behavior of SPS is shown for two different solvents, 90% toluene/lO% methanol and DMF, in Figures 3 and 4. In the mixed solvent the intrinsic viscosity decreases with increasing sulfonate concen-
1.2,
0 0.5 1.0 1.5 2.0 2.5
CONC. (gldll Fig. 4. Reduced viscosity versus polymer concentration for sulfonated polystyrenes in DMF (0) 0.5 mol % sodium sulfonate, (0) 1.0%, (A) 1.5%, (0) 4.1%, 0 5.7%, (A) 7.2%.
COMPARISONS OF STYRENE IONOMER 557
TABLE IV Intrinsic Viscosity and Huggin's Constant of SPS and Styrene-SSS Copolymers in 90%
tration (cf. Table IV) and this result is thought to be a consequence of increasing intramolecular ionic associations and not of decreasing molec- ular weight. The linear relationship between the reduced viscosity and concentration persists up to a polymer concentration of 2%. The effect of the polystyrene molecular weight on the dilute solution viscosity of SPS is demonstrated in Figure 5 by reduced solution viscosity for an SPS sample described in this paper and a sample with comparable sulfonate concen- tration, but based on a polymer with a number average molecular weight of about five times that of the PS used in this study. The data have been normalized with the intrinsic viscosities of the starting polystyrenes. It is clear that the effects of sulfonation are more pronounced in the higher- molecular-weight material, and this may be a consequence of the greater
1 a 0.4
0.2
0- 0 0.5 1.0 1.5 20
C0"IRATK)N (old) Fig. 5. Reduced viscosity of sulfonated polystyrenes containing about 6 mol % sodium
sulfonate normalized with respect to the intrinsic viscosity of the parent polystyrene versus polymer concentration in toluene/methanol (90/10): (0) M, (PS) = 23,000, (0) M. (PS) = 106,000.
558 WEISS, LUNDBERG, AND TURNER
number of ionic species per chain in these materials. While the viscosity- concentration curves for the lower-molecular-weight polymers are linear over the entire concentration range studied, the curve for the higher sul- fonated, higher-molecular-weight material becomes nonlinear above ca. 0.6% polymer concentration. This upswing in the curve is indicative of strong intermolecular nteractions that increase the apparent polymer mo- lecular weight.
The effect of the reduced viscosity on polymer concentration in DMF solutions is shown in Figure 4 for the SPS samples. Polymers containing greater than 1.5 mol % sodium sulfonate groups clearly exhibit a poly- electrolyte effect below polymer concentrations of ca. 2%. These results are consistent with those of Lundberg and Phillips% and indicate that DMF effectively ionizes the sulfonate species.
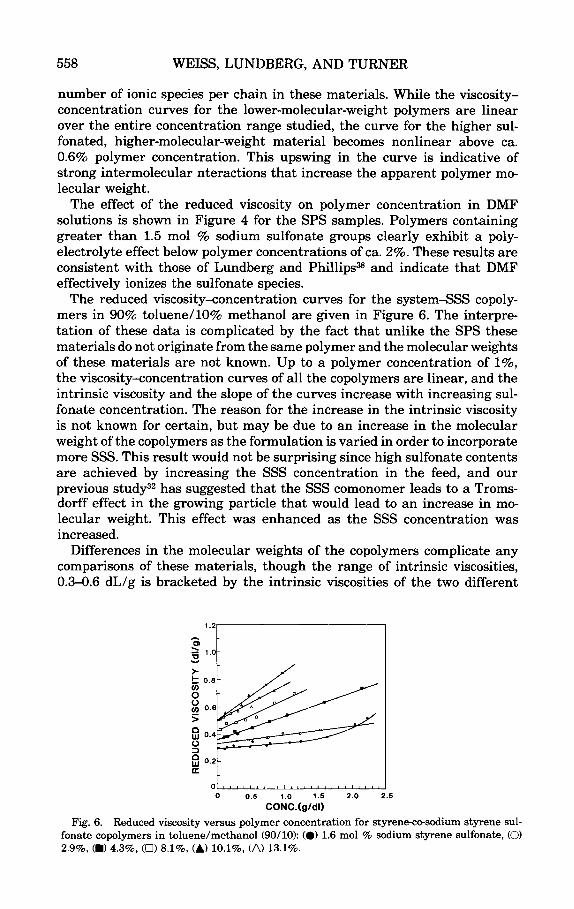
The reduced viscosity-concentration curves for the systemSSS copoly- mers in 90% toluene/lO% methanol are given in Figure 6. The interpre- tation of these data is complicated by the fact that unlike the SPS these materials do not originate from the same polymer and the molecular weights of these materials are not known. Up to a polymer concentration of 1%, the viscosity-concentration curves of all the copolymers are linear, and the intrinsic viscosity and the slope of the curves increase with increasing sul- fonate concentration. The reason for the increase in the intrinsic viscosity is not known for certain, but may be due to an increase in the molecular weight of the copolymers as the formulation is varied in order to incorporate more SSS. This result would not be surprising since high sulfonate contents are achieved by increasing the SSS concentration in the feed, and our previous has suggested that the SSS comonomer leads to a Troms- dorff effect in the growing particle that would lead to an increase in mo- lecular weight. This effect was enhanced as the SSS concentration was increased.
Differences in the molecular weights of the copolymers complicate any comparisons of these materials, though the range of intrinsic viscosities, 0.3-0.6 dL/g is bracketed by the intrinsic viscosities of the two different
Fig. 7. Reduced viscosity versus polymer concentration for styrene-co-sodium styrene sul- fonate copolymers in DMF (0) 1.6 mol % sodium styrene sulfonate, (0) 2.9%, (0) 4.1%, (A) 10.1%, (a 13.1%.
PS’s used to prepare the SPSs. Therefore, as a first approximation the effects of molecular weight on the properties of the copolymers can be estimated from the differences in the two series of SPS.
Although quantitative comparisons cannot be made between the reduced viscosity-concentration data for the copolymers and the SPSs because of differences in molecular weight, one consistent point is found in the curves in Figures 3 and 6. The Huggins constant k’ increases with increasing sulfonate concentration (cf. Table IV); the high values of k’ are indicative of strong polymer-polymer interactions and suggest aggregation of the poly- mers in solution. These results compliment the viscometric study by Misra, Banthia, and Mandid.41 of polystyrenes containing sulfonate end groups in which they showed that in nonpolar solvents such as toluene aggregation occurred, while in more polar THF, polymer association appeared to be absent.
In DMF, the copolymer solution behavior is similar to that of SPS (c.f. Fig. 7). Above the sulfonate concentration of 2.9 mol %, polyelectrolyte behavior is evident, while at a sulfonate concentration of 1.7 mol % the reduced viscosity-concentration curve is linear over the entire concentra- tion range studied.
The solution behavior of the styrene-SSS copolymers and SPS are qual- itatively similar. On the basis of the data given here it would appear that the major differences in the two types of sulfonate ionomers is molecular weight. The discussion that follows, however, will demonstrate that there are some significant differences between these materials, even though these differences do not appear to be manifested in their solution behavior.
Thermal Analysis
Eisenberg’ has reviewed the effect of pendant ionic groups on the glass transition temperatures of carboxylate ionomers. In general, T, increases with increasing ionic group concentration, and the effects of different coun- terions can be superimposed if the cation charge and the distance between
560 WEISS, LUNDBERG, AND TURNER
so I I 0 5 10 15 20 25 30
SULFONATE CONC. (mot%) Fig. 8. Glass transition temperatures versus sulfonate concentrations for styrene-co-sodium
styrene sulfonate copolymers, DSC (0); sulfonated polystyrene-Na salt (0) DSC, this study; (0) torsion pendulum, Ref. 10; sulfonated polystyrene-Zn salt (0) DSC, (A) dynamic mechan- ical.
centers of charge are considered. Studies of the effect of sulfonation on the Tg of polysulfone," polypentenamer,25 Nafion,B polystyrene,1°J4 and EPDM21 yielded similar results. The increase in Tg is a consequence of the reduction in chain mobility that occurs as a result of the ionic interactions.
The Tg of the styrene-SSS copolymers and SPS determined by DSC are plotted versus sulfonate concentration in Figure 8, along with DSC data for a higher-molecular-weight Zn-SPS and the torsion pendulum data of Rigdahl and EisenberglO for Na-SPS prepared from a M, = 30,000 PS. In the latter study Tg was defined as the maximum in tan 6. The DSC data for the two SPS increase linearly with sulfonate concentration, and al- though two different molecular weights and counterions were used, the data fall on a single line. The difference between the Tg's detemined by torsion pendulum and by DSC is about 8" which is attributed to differences in the experimental time scales of the two techniques.
While the Tg data for SPS are consistent with the results of other ionomer systems, the Tg-sulfonate concentration data for the styreneSSS copoly- mers are not. In this case, an increase in Tg is observed up to a sulfonate concentration of ca. 8 mol %, but above this concentration Tg remains unchanged. In contrast to SPS, the increase in Tg below 8 mol % is not linear. In fact, below ca. 3 mol % Na-sulfonate, Tg is actually lower than the Tg of a PS of comparable intrinsic viscosity. These data suggest that either there is a genuine decline in the Tg as a consequence of the first few mol % comonomer incorporation or that the molecular weights of the co- polymers are substantially lower than would be expected on the basis of their intrinsic viscosities. The latter possibility is inconsistent with the reduced viscosity data presented earlier which suggest that, if anything, the copolymers were of higher molecular weight than the PS made by the same procedure.
The alternative explanation that low degrees of SSS incorporation result in a lowering of Tg is not without precedent. For example, in their studies of the chlorination of polyethylene, Schmeider and found that as chlorination increases, the dynamic mechanical p-loss maximum initially
COMPARISONS OF STYRENE IONOMER
c 561
I' I . . I . . . . I . I I . . , ,-
100 150 200 2 5 0
TEMPERATURE Pc) ,
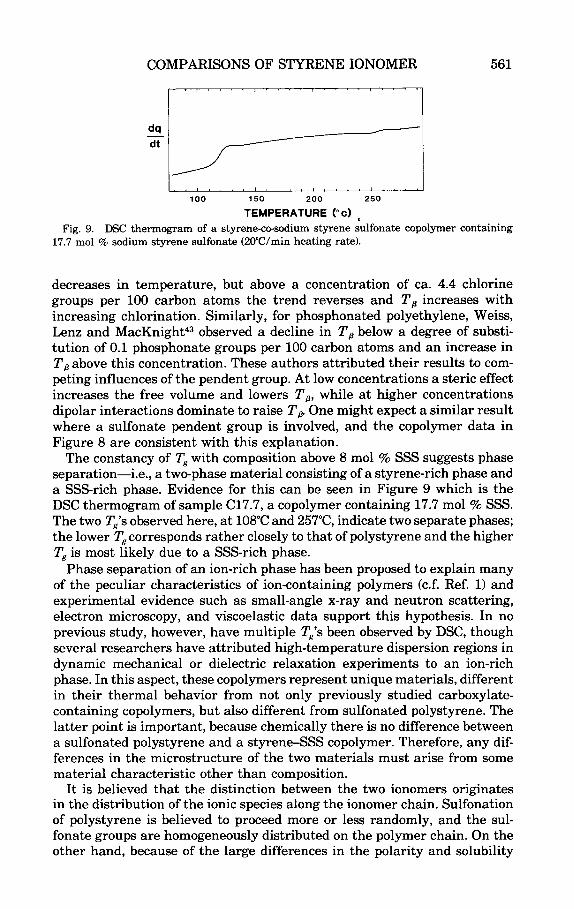
17.7 mol % sodium styrene sulfonate (PWC/min heating rate). Fig. 9. DSC thermogram of a styrene-co-sodium styrene sulfonate copolymer containing
decreases in temperature, but above a concentration of ca. 4.4 chlorine groups per 100 carbon atoms the trend reverses and T, increases with increasing chlorination. Similarly, for phosphonated polyethylene, Weiss, Lenz and M a ~ K n i g h t ~ ~ observed a decline in T, below a degree of substi- tution of 0.1 phosphonate groups per 100 carbon atoms and an increase in T , above this concentration. These authors attributed their results to com- peting influences of the pendent group. At low concentrations a steric effect increases the free volume and lowers T,, while at higher concentrations dipolar interactions dominate to raise T, One might expect a similar result where a sulfonate pendent group is involved, and the copolymer data in Figure 8 are consistent with this explanation.
The constancy of Tg with composition above 8 mol % SSS suggests phase separation-i.e., a two-phase material consisting of a styrene-rich phase and a SSS-rich phase. Evidence for this can be seen in Figure 9 which is the DSC thermogram of sample C17.7, a copolymer containing 17.7 mol % SSS. The two Tg's observed here, at 108°C and 257"C, indicate two separate phases; the lower Tg corresponds rather closely to that of polystyrene and the higher T, is most likely due to a SSS-rich phase.
Phase separation of an ion-rich phase has been proposed to explain many of the peculiar characteristics of ion-containing polymers (c.f. Ref. 1) and experimental evidence such as small-angle x-ray and neutron scattering, electron microscopy, and viscoelastic data support this hypothesis. In no previous study, however, have multiple Tg's been observed by DSC, though several researchers have attributed high-temperature dispersion regions in dynamic mechanical or dielectric relaxation experiments to an ion-rich phase. In this aspect, these copolymers represent unique materials, different in their thermal behavior from not only previously studied carboxylate- containing copolymers, but also different from sulfonated polystyrene. The latter point is important, because chemically there is no difference between a sulfonated polystyrene and a styrene-SSS copolymer. Therefore, any dif- ferences in the microstructure of the two materials must arise from some material characteristic other than composition.
It is believed that the distinction between the two ionomers originates in the distribution of the ionic species along the ionomer chain. Sulfonation of polystyrene is believed to proceed more or less randomly, and the sul- fonate groups are homogeneously distributed on the polymer chain. On the other hand, because of the large differences in the polarity and solubility
562 WEISS, LUNDBERG, AND TURNER
of the two monomers, styrene and SSS, one might expect a random copo- lymerization to be improbable. Recent results32 that show a dramatic change in sulfonate concentration with conversion support a nonrandom copoly- merization reaction. Thus, a copolymer consisting of blocky SSS regions could be expected, and the occurrence of two separate Tg's in such a material would be considered classical behavior for a block system. Unfortunately, because of the chemical similarities of the two systems, it has not been possible to confirm this hypothesis by such techniques as infrared spec- troscopy or 13C- or 'H-NMR.
Thermomechanical Analysis
Intermolecular physical interactions such as occur between ionic species can have profound effects on the mechanical and rheological behavior of a polymer, especially at temperatures above the Tg where the normal relax- ation rates for linear polymers are relatively rapid. For example, Rigdahl and Eisenberg'O showed that the stress relaxation rate of SPS decreases with increasing ion concentration. For a SPS containing 9.7 mol % sodium sulfonate the 10-s relaxation modulus at 150°C is more than two orders of magnitude greater than that of polystyrene, and at 200°C where polystyrene is well into the viscous flow regime, the SPS is still a rubbery solid with a 10-s relaxation modulus of the order of 108 dyn/cm2. These authors attrib- uted this behavior and the failure of time-temperature superposition for the higher sulfonated materials to ionic cluster formation, and they pos- tulated a multiple relaxation mechanism involving diffusion of the ion-poor matrix in the transition region and a secondary process of a purely viscous nature involving yielding of the ion-rich clusters.
( 7 . 2 )
(1.01 \
~ I I I I I I I I I I I I I I I I I I 1 1 1 1 '
25 50 100 150 200 250
TEMPERATURE ("c) Fig. 10. Thermal mechanical analysis penetration thermograms for sulfonated polystyrene:
20 g load (40 g load for 7.2 mol % sample), lWC/min heating rate. The numbers in parentheses represent the mol YO sulfonates.
COMPARISONS OF STYRENE IONOMER
I- z w z w O 5 n
563
I31 2) - I 1 7 7 )
113 1 ) -
Lundberg and Makowski7 compared the thermomechanical and rheolog- ical behavior of polystyrene and the sodium salts of carboxylated and sul- fonated polystyrene. Like Rigdahl and Eisenberg, they found that interactions between ionic groups increased the softening point and the melt viscosity. An important result of their study was that sulfonate and carboxylate ionomers were different in several respects; the ionic associa- tions of the sulfonate groups appeared to be much stronger and persisted to higher temperatures than in the case of the carboxylate groups.
The TMA penetration curves for the various SPS and styrene-SSS co- polymers discussed in this report are given in Figures 10 and 11. The be- havior of the two types of materials is similar; the major difference is in the T, which is consistent with the findings from the DSC. The high tem- perature transition characterizing the onset of viscous flow increases in temperature with increasing sulfonate content for both materials, and with the exception of the lower sulfonate-containing polymers, the softening behavior at elevated temperatures of the SPS and copolymers are similar. At the lower sulfonate concentrations (e.g., 1-2 mol %I the copolymer ex- hibits a small but distinct rubbery plateau which persists to ca. 140"C, while the SPS shows only a single transition region. Although strictly qualitative, this result suggests a subtle difference in the polymer microstructure. The high-temperature transition region results from the intermolecular asso- ciations of the ionic groups, and the location of this transition is a function of the sulfonate concentration and the counterion. Where differences in the sulfonate distribution exist, one might expect phase separation to occur more readily with a blocky distribution than with a random distribution. If such were the case, ionic crosslinking should be more prominent at a lower sulfonate concentration in the blocky material. At higher sulfonate
564 WEISS, LUNDBERG, AND TURNER
concentrations, there would be sufficient interactions in both systems that the TMA responses would be indistinguishable. Other experiments, how- ever, such as quantitative dynamic mechanical analysis or volume swelling might discriminate between such different microstructures.
Water Sorption
Several authorsM7 have attempted to correlate the results of water sorp tion and diffusion experiments with the morphology of ion-containing poly- mers, specifically the nature of the ionic aggregation. Eisenberg and NavratiP observed that the number of water molecules absorbed per so- dium ion in a styrene-sodium methacrylate copolymer varied substantially above and below a salt concentration of ca. 6 mol %. Below this concen- tration, equilibrium was attained after ca. 300 h and the water sorption corresponded to ca. one water molecule per sodium ion, while above 6 mol % salt the water content increased significantly and equilibrium was not reached in some cases even after 4000 h. The authors attributed these results to the presence of predominantly dispersed ion pairs or multiple ion pairs (multiplets) below 6 mol % of the ionic species, with the onset of ionic cluster formation occurring at ca. 6 mol % salt.
considered the water sorption and transport phenom- enon in perfluorosulfonated (Nafion) membranes based on polytetrafluo- roethylene. Mauritz, Hora, and H~pfinger '~ developed a thermodynamical model to predict phase separation in ionomers and correlated this model with experimental water absorption data for sodium Nafion membranes. Cu t l ee studied the transport properties of Nafion membranes at high cur- rent densities and found that in the hydrated state, large hydrated ionic clusters were thermodynamically favored. Takamatsu, Hashiyoma, and
Other
3501
3001
250 - ( u -
G I E 150 -
100-
50 -
1 10 100 1000 10.000
TIME (hrs) Fig. 12. Water sorption isotherms for sulfonated polystyrenes: (0) 1.0 mol % sodium sul-
5.7%, (0) 7.2%. Mo = dry polymer mass, Mt = mass at time fonate, (0) 1.5%, (A) 4.1%, of measurement.
COMPARISONS OF STYRENE IONOMER 565
Ei~enberg '~ observed a secondary absorption process in Nafion films with a low degree of neutralization (ca. 10430%) that was absent in the higher neutralized and the unneutralized materials. This, they suggest, might be due to a structural rearrangement. These authors also observed that, where- as the diffusion of water in samples of low neutralization was Fickian, indicating that segmental mobility of the chains was relatively high, the sorption for samples with a high degree of neutralization becomes non- Fickian, suggesting that segmental mobility was more restricted, probably because of strong intermolecular interactions.
Water sorption experiments are described below for films of SPS and s t y r e n 4 S S copolymers. Dried compression molded films were immersed in water at 25°C and were removed periodically, patted dried with a tissue, and weighed on an analytical balance. While this study was not exhaustive, several interesting trends and differences were observed for the two types of polymers. The water sorption isotherms for various SPS and styrene- SSS copolymers are given in Figures 12 and 13, respectively. The results are qualitatively consistent with those of Eisenberg and Navratil for sty- rene-methacrylate copolymers.44 At low sulfonate concentration water sorp- tion is relatively low and equilibrium is reached fairly rapidly, while at higher sulfonate concentrations the hydration is higher and the approach to equilibrium is much slower. For the sulfonate ionomers the change in hydration behavior occurs between 1-2 mol % ionic groups, as opposed to 6 mol % as observed by Eisenberg and Navratil for the carboxylate ionom- ers. This result is consistent with recent small-angle x-ray scattering results of Peiffer, Weiss, and Lundberg15 that indicate that ionic clusters exist in SPS at sulfonate concentrations as low as 2%.
400-
300 - c u -
x - z :
57;; 200-
"I 1 10 100 1000 10.000
TIME (hrs) Fig. 13. Water sorption isotherms for styreneco-sodium styrene sulfonate co-polymers: (0)
1.6 mol % sodium styrene sulfonate, (0) 2.9%, t D 4.1%. Mo and M, are defined in Fig. 12.
566 WEISS, LUNDBERG, AND TURNER
.. r 500 * *(1.6)
100
50
I - X A
0 R
Fig. 14. Water sorption isotherms for (0) sulfonated polystyrenes and (0) styreneco-sodium styrene sulfonate copolymers. The numbers in parentheses represent the mol % sulfonate. Mo and M, are defined in Fig. 12.
In addition to differences between the sulfonate and carboxylate ionom- ers, the hydration characteristics of the two sulfonate ionomer systems are different. This is seen in Figure 14 in which the sorption isotherms of SPS and the copolymers are compared at two different sulfonate concentrations, ca. 1.5 and 4.1 mol %. At the lower ion concentration, the SPS has a much higher equilibrium hydration and a slower approach to equilibrium. In fact, whereas it takes ca. 100 h to achieve equilibrium in the SPS sample, equi- librium occurs within the first 2 h for the copolymer. At higher sulfonate concentrations, e.g., 4.1 mol %, the hydration of the copolymer was higher than that of the SPS and the rate of hydration was much faster. However, above a sulfonate concentration of 3 mol %, equilibrium was not reached in the time frame of the experiment, ca. 859 h. The copolymer containing 1.5 mol % and the SPS containing 1.6 mol % had equilibrium hydrations corresponding to ca. one water molecule per sodium ion which agrees with Navratil and Eisenberg's result for styrene-sodium methacrylate copoly- mers. Above these sulfonate concentrations, however, the number of water molecules per salt group increased significantly.
Although it would be premature to attempt to attribute the hydration behavior of these materials to a particular morphology on the basis of these limited results, two points are clear: First, the sulfonate-containing styrene ionomers are different from the carboxylate-containing styrene ionomers described by Eisenberg and Navratil. This result supports the conclusion reached by Lundberg and Makowsk? regarding the differences between sulfonate and carboxylate ionomers. Second, the differences between the hydration behaviors of SPS and the styreneSSS copolymers support the hypothesis that the morphologies of these materials are substantially dif- ferent. Again, this is thought to be a consequence of differences in sulfonate group distribution in the two materials.
CONCLUSIONS
It has been shown that there are some significant differences between sulfonated polystyrene ionomers prepared by copolymerization of styrene
COMPARISONS OF STYRENE IONOMER 567
and sodium styrene sulfonate and by the sulfonation/neutralition of poly- styrene. Specific differences include the solubility behavior, the effect of sulfonate concentration on the Ta and the equilibrium hydration and sorp tion kinetics. Although the molecular weights and molecular weight dis- tributions of these ionomers are not well-characterized, the differences in their behavior do not appear to be a consequence simply of differences in molecular weight.
The differences in the copolymer and SPS ionomers may originate with differences in the sulfonate distribution, though additional characteriza- tions are needed in order to confirm this. The solubility behavior, the rel- ative independence of the Tg on sulfonate concentration, and the observation of a second, high temperature glass transition for the copolymers suggest the existence of a two-phase structure which most likely consists of ion- rich and ion-poor regions. Although, phase separation of ion-rich clusters also occurs in SPS, the phenomenon appears to be more apparent in the copolymers. This and the fact that the copolymerization shows a significant change in sulfonate composition with conversion suggest that the SSS mon- omer units are incorporated as blocks in the copolymers as opposed to a more random distribution of the sulfonate group in SPS. Other results, such as the sorption/hydration experiments appear to be consistent with this conclusion.
Additional characterizations of these polymers are warranted in order to assess the hypothesis concerning the sulfonate distributions. Such studies as excimer fluorescence, dynamic mechanical analysis, dielectric analysis, small-angle x-ray scattering, and volume swelling, may provide useful in- formation concerning differences in the polymer microstructure. Studies of the solid-state mechanical properties and melt rheology may provide ad- ditional information concerning differences between these chemically equiv- alent materials.
The authors thank Dr. Warren Thalyer and Dr. Allen Werner for the synthetic work. The contributions of Marty Grossman, William Petrik, and Salvatore Pace are gratefully acknowl- edged.
References 1. A. Eisenberg and M. King, Ion-Containing Polymers, Academic, New York, 1977. 2. L. Holliday, Ed., Ionic Polymers, Applied Science Publishers, London, 1975. 3. A. Eisenberg, Ed., Ions in Polymers, Adv. Chem. Ser. No. 187, Am. Chem. Soc., Washington,
4. E. Otocka, J. Macromol. Sci. Rev. Macromol. Chem., 5(2), 275 (1971). 5. W. J. MacKnight and T. R. Earnest, Jr., J. Polym. Sci. Macromol. Rev., 16, 41 (1981). 6. R. D. Lundberg, Polym. Prep., 19(1), 455 (1978). 7. R. D. Lundberg and H. S . Makowski, in Ions in Polymers, A. Eisenberg, Ed., Adv. Chem.
8. R. D. Lundberg, H. S. Makowski, and L. Westerman, in Ions in Polymers, A. Eisenberg,
9. D. L. Handlin, W. J. MacKnight, and E. L. Thomas, MacromoZecules, 14, 795 (1981).
10. M. Rigdahl and A. Eisenberg, Polym. Prep., 20(2), 269 (1979). 11. T. R. Earnest, J. S. Higgins, and W. J. MacKnight, Polym. Prep., 21(1), 179 (1980). 12. W. Seibourg, R. D. Lundberg, and R. W. Lenz, Macromolecules, 13, 1013 (1980). 13. M. Rigdahl and A. Eisenberg, J. Polym. Sci. Polym. Phys. Ed., 19, 1641 (1981).
WEISS, LUNDBERG, AND TURNER
14. R. A. Weiss, J. Polym. Sci. Polym. Phys. Ed., 20, 65 (1982). 15. D. G. Peiffer, R. A. Weiss, and R. D. Lundberg, J. Polym. Sci. Polym. Phys. Ed., 20, 1503
16. D. J. Yarusso and S. L. Cooper, Polym. Prep., 23(2), 207 (1982). 17. H. S. Makowski, R. D. Lundberg, L. Westerman, and J. Bock, in Ions in Polymers, A.
Eisenberg, Ed., Adv. Chem. Ser. No. 187, Washington, DC, 1980, p. 3. 18. H. S. Makowski and R. D. Lundberg, in Ions in Polymers, A. Eisenberg, Ed., Adv. Chem.
Ser. No. 187, Am. Chem. Soc., Washington, DC, 1980, p. 37. 19. D. Brenner and A. Oswald, in Ions in Polymers, A. Eisenberg, Ed., Adv. Chem. Ser. No.
187, Am. Chem. SOC., Washington, DC, 1980, p. 53. 20. H. S. Makowski, P. K. Agarwal, R. A. Weiss, and R. D. Lundberg, Polym. Prep. 20(2),
281 (1979). 21. P. K. Agarwal, H. S. Makowski, and Robert D. Lundberg, Macromolecules, 13,1679 (1980). 22. P. K. Agarwal and R. D. Lundberg, Polym. Prep., 23(1), 58 (1982). 23. R. D. Lundberg and P. K. Agarwal, Polym. Prep., 23(1), 61 (1982). 24. A. Noshay and L. M. Robeson, J. Appl. Polym. Sci., 20, 1885 (1976). 25. D. Rahrig, W. J. MacKnight, and R. W. Lenz, Macromolecules, 12(2), 195 (1979). 26. D. Rahrig and W. J. MacKnight, in Ions in Polymers, A. Eisenberg, Ed., Adv. Chem. Ser.
27. D. Rahrig and W. J. MacKnight, in Ions in Polymers, A. Eisenberg, Ed., Adv. Chem. Ser.
28. T. R. Earnest, Jr., J. S. Higgins, D. L. Handlin, and W. J. MacKnight, Polym. Prep.,
29. A. Eisenberg and S. C. Yeo, J. Appl. Polym. Sci., 21,875 (1977). 30. R. A. Weiss, R. D. Lundberg, and A. Werner, J. Polym. Sci. Polym. Chem. Ed., 18, 3427
31. B. Siadat, B. Oster, and R. W. Lenz, J. Appl. Polym. Sci., 26, 1027 (1981). 32. S. R. Turner, R. A. Weiss, and R. D. Lundberg, J. Polym. Sci. Polym. Chem. Ed., to appear. 33. R. A. Weiss, S. R. Turner, and R. D. Lundberg, J. Polym. Sci. Polym. Chem. Ed., to appear. 34. H. S. Makowski, R. D. Lundberg, and G. H. Singhal, U.S. Pat. 3,870,841 (March 11,1975)
35. ASTM Standard D-1552, American Society for Testing and Materials. 36. J. Brandrup and E. H. Immergut, Eds., Polymer Handbook, Wiley, New York, 1975. 37. R. D. Lundberg and H. S. Makowski, J. Polym. Sci. Polym. Phys. Ed., 18, 1821 (1980). 38. R. D. Lundberg and R. R. Phillips, J. Polym. Sci. Polym. Phys. Ed., 20, 1154 (1982). 39. A. Eisenberg, in Contemporary Topics in Polymer Science, Vol. 3, M. Shen, Ed., Plenum,
40. I. M. Hodge and A. Eisenberg, Macromolecules, 11, 289 (1978). 41. N. Misra, A. Banthia, and B. M. Mandid, Polym. Prep., 20(2), 273 (1979). 42. K. Schmeider and K. Wolf, Kolloid Z., 143, 149 (1953). 43. R. A. Weiss, R. W. Lenz, and W. J. MacKnight, J. Polym. Sci. Polym. Phys. Ed., 16, 1101
44. A. Eisenberg and M. Navratil, Macromolecules, 6, 604 (1973). 45. K. A. Mauritz, C. J. Hora, and A. J. Hopfinger, Polym. Prep., 19(2), 324 (1978). 46. S. G. Cutler, Polym. Prep., 19(2), 330 (1978). 47. T. Takamatsu, M. Hashiyama, and A. Eisenberg, J. Appl. Polym. Sci., 24, 2199 (1979).
(1982).
No. 187, Am. Chem. Soc., Washington, DC, 1980, p. 77.
No. 187, Am. Chem. Soc., Washington, DC, 1980, p. 91.