Page 1
8/10/2019 compathboiler (1)
http://slidepdf.com/reader/full/compathboiler-1 1/18
Average Boiler Size arb Confidential Page 1
Proposed Regulation to Implement the California Cap-and-Trade Program: Supplemental Materials for the Compliance Pathways Analysis (Staff Report Chapter V and Appendix F)
Available for download at http://www.arb.ca.gov/regact/2010/capandtrade10/capandtrade10.htm10/29/2010
Further references for this spreadsheet (i.e., beyond what is listed below) can be found in the Cap-and-Trade Regulation Staff Report References and/or Appendix F.
Boiler Size Category
(MMBTU/hr)
Unit Size
(MMTBTU/hr)
Efficiency
(percent)
Capacity Factor(staff estimate)
(percent)
Number of Total
Boilers
Fuel Use PerUnit
(MMBTU)2008 Emissions
(MTCO2e)
moun o a uraGas to Produce
Steam
(MMBTU)
Petroleum 34% >60 100 80-83 0.90 282 788,400 35,006,224 222,643,608
Food 64% 10-100 40 82-83 0.80 70 280,320 1,627,120 19,625,123Wood Products 74% >50 60 80-83 0.80 40 420,480 1,193,875 16,700,271
Chemicals 68% >50 60 80-83 0.85 74 446,760 2,557,335 32,899,732Oil and Gas 70% 50-100 65 77-82 0.85 293 483,990 10,724,972 141,650,580
Carbon Intensity ofNatural Gas
(MTCO2e/MMBTU) Hours per Year
0.053 8760
References Einstein et al., 2001 DOE 2002 ARB 2009
Sub-Sector NAICS Code
Total Fuel
(MMBTU)
Fuel to Boilersfor Steam
(MMBTU)
Fuel to CHPfor Steam
(MMBTU)
Fuel to ProcessHeating
(MMBTU)
Fuel Used for Steam
(percent)
Fuel Used forProcess Heating
(percent)
Fuel Used for Steam
(percent)
Fuel Used for Steam
(percent)
Fuel Used for Steam
(percent)Manufacturing 31-33 12,281 2,498 3,162 5,238 46% 43% - - -
Aluminum 3313 120 4 15 92 16% 77% - - - Cement 327310 341 4 10 315 4% 92% - - - Chemicals 325 2,417 771 877 488 68% 20% 42% 47% - Computers and
Electronics 334, 335 87 27 - 27 31% 31% - - - Fabrication and
Metals 332 252 37 2 166 15% 66% - - - Food and Beverage 311, 312 1,009 458 187 260 64% 26% 57% - - Wood Products 321, 322 2,378 411 1,352 386 74% 16% 81% 84% - Foundries 3315 100 6 - 69 6% 69% - - - Glass 3272, 327993 267 15 - 238 6% 89% - - - Machinery 333 93 18 6 26 26% 28% - - - Petroleum 324110 3,020 409 609 1,890 34% 63% 23% 51% - Iron and Steel 3311, 3312 994 67 50 758 12% 76% 10% - - Textiles 313, 316 171 86 16 51 60% 30% - - - TransportationEquipment 336 276 50 7 77 21% 28% - - - Oil and Gas - - - - - - - - - 70%
California Air Resources Board (ARB) (2009): Oil and Natural Gas Production, Processing, and Storage.Einstein et al. (2001): Steam Systems in Industry: Energy Use and Energy Efficiency Improvement Potentials. Lawrence Berkeley National Laboratory.U.S. Department of Energy (DOE) (2002): Steam System Opportunity Assessment for the Pulp and Paper, Chemical Manufacturing, and Petroleum Refining Industry.
U.S. Department of Energy (DOE) (2010): IAC Case Study Database. http://iac.rutgers.edu/database/
DOE 2010
Calculations Assumptions
Sub-Sector Percent of FuelUse By Steam
Page 2
8/10/2019 compathboiler (1)
http://slidepdf.com/reader/full/compathboiler-1 2/18
Replace Boiler arb Confidential
Boiler Size
Category(MMBTU/hr)
Unit Size(MMBTU/hr)
Efficiency(percent)
Capacity Factor
(staff estimate)(percent)
Total Number ofBoilers
Fuel Use Per
Unit(MMBTU/unit)
2008 Emissions(MTCO2e)
moun o a ura
Gas to Produce
Steam(MMBTU)
Petroleum 34% >60 100 80-83 0.90 282 788400 35,006,224 222,643,608
Food 64% 10-100 40 82-83 0.80 70 280320 1,627,120 19,625,123Wood Products 74% >50 60 80-83 0.80 40 420480 1,193,875 16,700,271
Chemicals 68% >50 60 80-83 0.85 74 446760 2,557,335 32,899,732Oil and Gas 70% 50-100 65 77-82 0.85 293 483990 10,724,972 141,650,580
Feasibility(percent)
Efficiency of
Old Unit(percent)
Efficiency of
New Unit(percent)
c ency ncreaseFrom Low
Efficiency Unit(percent) Number of Units
Total Fuel Reduction(MMBTU)
GHG Reduction(MTCO2e)
Feasibility(percent)
Efficiency of Old
Unit(percent)
Efficiency of
New Unit(percent)
c ency ncreaseFrom Med
Efficiency Unit(percent)
Numberof Units
Total
Redu(MMB
Petroleum 15% 80% 88% 10% 42 3,339,654 177,002 20% 82% 88% 7% 56 3,25Food 15% 82% 88% 7% 11 215,398 11,416 20% 83% 88% 6% 14 23
Wood Products 15% 80% 88% 10% 6 250,504 13,277 20% 82% 88% 7% 8 24Chemicals 15% 80% 88% 10% 11 493,496 26,155 20% 82% 88% 7% 15 48Oil and Gas 15% 77% 88% 14% 44 3,035,370 160,875 20% 82% 88% 7% 59 2,07
Total 7,334,421 388,724 6,29
Unit Size
(MMBTU/hr)
Unit Cost for
Size Interest Rate Years Annuity Factor
2020 Price of Fuel
($/MMBTU)
Carbon IntensityNatural Gas
(MTCO2e/MMBTU) Hours per Year
50 1,500,000$ 30% 20 0.301586885 7.69$ 0.053 8760
Price per
Unit
Total Annual
Capital Cost
Total Annual
Savings Abatement Cost
($/MTCO2e) Price per Unit
Total Annual Capital
Cost
Total Annual
Savings Abatement Cost
($/MTCO2e)
Petroleum 3,000,000$ 38,325,566$ 25,681,940$ 71$ 3,000,000$ 51,100,755$ 25,055,551$ 151$
Food 1,200,000$ 3,800,522$ 1,656,408$ 188$ 1,200,000$ 5,067,363$ 1,818,279$ 259$Wood Products 1,800,000$ 3,234,107$ 1,926,376$ 98$ 1,800,000$ 4,312,143$ 1,879,391$ 188$
Chemicals 1,800,000$ 5,996,451$ 3,794,984$ 84$ 1,800,000$ 7,995,268$ 3,702,424$ 168$Oil and Gas 1,950,000$ 25,817,863$ 23,341,992$ 15$ 1,950,000$ 34,423,817$ 15,940,873$ 168$
Total 77,174,509$ 56,401,701$ 102,899,346$ 48,396,518$
Replace Medium Efficiency Boilers (Category 2)Replace Low Efficiency Boilers (Category 1)
Sub-Sector
Percent of
Fuel Use BySteam
Replace Medium Efficiency Boilers (Category 2)
Calculations
Replace Low Efficiency Boilers (Category 1)
Sub-Sector
Assumptions
Sub-Sector
Page 3
8/10/2019 compathboiler (1)
http://slidepdf.com/reader/full/compathboiler-1 3/18
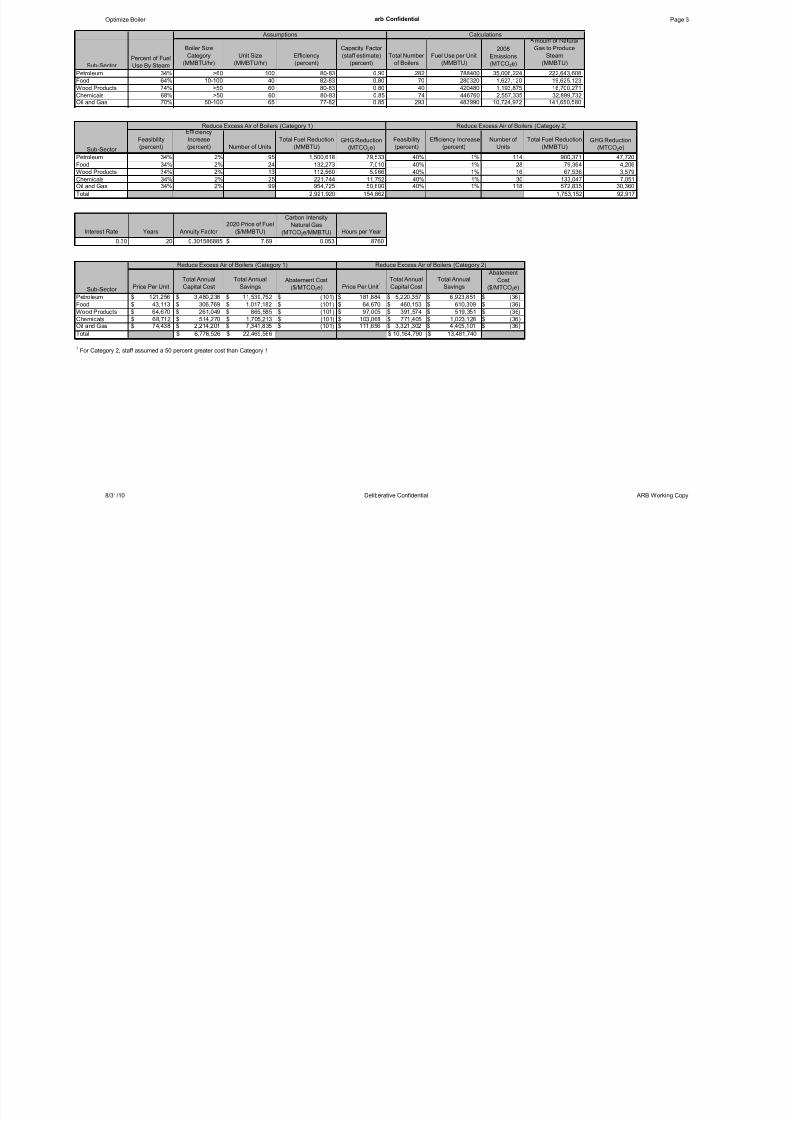
Optimize Boiler arb Confidential Page 3
Boiler Size
Category(MMBTU/hr)
Unit Size(MMBTU/hr)
Efficiency(percent)
Capacity Factor
(staff estimate)(percent)
Total Numberof Boilers
Fuel Use per Unit(MMBTU)
2008
Emissions(MTCO2e)
moun o a ura
Gas to Produce
Steam(MMBTU)
Petroleum 34% >60 100 80-83 0.90 282 788400 35,006,224 222,643,608
Food 64% 10-100 40 82-83 0.80 70 280320 1,627,120 19,625,123Wood Products 74% >50 60 80-83 0.80 40 420480 1,193,875 16,700,271Chemicals 68% >50 60 80-83 0.85 74 446760 2,557,335 32,899,732Oil and Gas 70% 50-100 65 77-82 0.85 293 483990 10,724,972 141,650,580
Feasibility(percent)
c ency
Increase(percent) Number of Units
Total Fuel Reduction(MMBTU)
GHG Reduction(MTCO2e)
Feasibility(percent)
Efficiency Increase(percent)
Number ofUnits
Total Fuel Reduction(MMBTU)
GHG Reduction(MTCO2e)
Petroleum 34% 2% 95 1,500,618 79,533 40% 1% 114 900,371 47,720Food 34% 2% 24 132,273 7,010 40% 1% 28 79,364 4,206Wood Products 34% 2% 13 112,560 5,966 40% 1% 16 67,536 3,579
Chemicals 34% 2% 25 221,744 11,752 40% 1% 30 133,047 7,051Oil and Gas 34% 2% 99 954,725 50,600 40% 1% 118 572,835 30,360
Total 2,921,920 154,862 1,753,152 92,917
Interest Rate Years Annuity Factor
2020 Price of Fuel
($/MMBTU)
Carbon IntensityNatural Gas
(MTCO2e/MMBTU)Hours per Year
0.30 20 0.301586885 $ 7.69 0.053 8760
Price Per Unit
Total Annual
Capital Cost
Total Annual
Savings Abatement Cost
($/MTCO2e) Price Per Unit1
Total Annual
Capital Cost
Total Annual
Savings
Abatement
Cost($/MTCO2e)
Petroleum $ 121,256 $ 3,480,238 $ 11,539,752 $ (101) $ 181,884 $ 5,220,357 $ 6,923,851 $ (36)
Food $ 43,113 $ 306,769 $ 1,017,182 $ (101) $ 64,670 $ 460,153 $ 610,309 $ (36)
Wood Products $ 64,670 $ 261,049 $ 865,585 $ (101) $ 97,005 $ 391,574 $ 519,351 $ (36)Chemicals $ 68,712 $ 514,270 $ 1,705,213 $ (101) $ 103,068 $ 771,405 $ 1,023,128 $ (36)Oil and Gas $ 74,438 $ 2,214,201 $ 7,341,835 $ (101) $ 111,656 $ 3,321,302 $ 4,405,101 $ (36)
Total $ 6,776,526 $ 22,469,566 $ 10,164,790 $ 13,481,740
1 For Category 2, staff assumed a 50 percent greater cost than Category 1
Assumptions
Percent of FuelUse By SteamSub-Sector
Calculations
Reduce Excess Air of Boilers (Category 2)Reduce Excess Air of Boilers (Category 1)
Sub-Sector
Reduce Excess Air of Boilers (Category 2)Reduce Excess Air of Boilers (Category 1)
Sub-Sector
8/31/10 Deliberative Confidential ARB Working Copy
Page 4
8/10/2019 compathboiler (1)
http://slidepdf.com/reader/full/compathboiler-1 4/18
Page 5
8/10/2019 compathboiler (1)
http://slidepdf.com/reader/full/compathboiler-1 5/18
Air Preheater arb Confidential Page 5
Boiler Size
Category(MMBTU/hr)
Unit Size(MMBTU/hr)
Efficiency(percent)
Capacity Factor
(staff estimate)(percent)
Total Numberof Boilers
Fuel Use per Unit(MMBTU)
2008 Emissions(MTCO2e)
moun o a ura
Gas to Produce
Steam(MMBTU)
Petroleum 34% >60 100 80-83 0.90 282 788,400 35,006,224 222,643,608
Food 64% 10-100 40 82-83 0.80 70 280,320 1,627,120 19,625,123Wood Products 74% >50 60 80-83 0.80 40 420,480 1,193,875 16,700,271Chemicals 68% >50 60 80-83 0.85 74 446,760 2,557,335 32,899,732Oil and Gas 70% 50-100 65 77-82 0.85 293 483,990 10,724,972 141,650,580
Feasibility
(percent)
c encyIncrease
(percent) Number of Units
Total Fuel Reduction
(MMBTU)GHG Reduction
(MTCO2e)
Feasibility
(percent)
Efficiency Increase
(percent) Number of Units
Total Fuel Reduction
(MMBTU)GHG Reduction
(MTCO2e)
Petroleum 5% 2% 14 166,983 8,850 6% 1% 17 100,190 5,310Food 5% 2% 4 17,663 936 6% 1% 4 10,598 562
Wood Products 5% 2% 2 15,030 797 6% 1% 2 9,018 478Chemicals 5% 2% 4 31,255 1,657 6% 1% 4 18,753 994Oil and Gas 5% 2% 15 127,486 6,757 6% 1% 18 76,491 4,054
Total 358,416 18,996 215,049 11,398
Interest Rate Years Annuity Factor 2020 Price of Fuel
($/MMBTU)
Carbon Intensity
Natural Gas(MTCO
2e/MMBTU) Hours per Year
0.30 20 0.301586885 7.69$ 0.053 8760
Price Per UnitTotal AnnualCapital Cost
Total AnnualSavings
Abatement Cost
($/MTCO2e) Price Per UnitTotal AnnualCapital Cost
Total AnnualSavings
Abatement Cost
($/MTCO2e)
Petroleum 181,768$ 774,040$ 1,283,279$ (58)$ 181,768$ 928,848$ 769,967$ 30$Food 93,065$ 98,249$ 135,739$ (40)$ 93,065$ 117,899$ 81,443$ 65$
Wood Products 139,598$ 83,606$ 115,509$ (40)$ 139,598$ 100,328$ 69,305$ 65$Chemicals 169,610$ 188,344$ 240,196$ (31)$ 169,610$ 226,013$ 144,118$ 82$Oil and Gas 160,683$ 709,143$ 979,739$ (40)$ 160,683$ 850,972$ 587,843$ 65$
Total 1,853,383$ 2,754,461$ 2,224,059$ 1,652,677$
Sub-Sector
Sub-Sector
Retrofit Boilers with Air Preheaters (Category 1)
Sub-Sector
Retrofit Boilers with Air Preheaters (Category 1)
Percent ofFuel Use By
Steam
Assumptions
Retrofit Boilers with Air Preheaters (Category 2)
Calculations
Retrofit Boilers with Air Preheaters (Category 2)
8/31/10 Deliberative Confidential ARB Working Copy
Page 6
8/10/2019 compathboiler (1)
http://slidepdf.com/reader/full/compathboiler-1 6/18
Blowdown Practices arb Confidential Page 6
Boiler Size
Category(MMBTU/hr)
Unit Size(MMBTU/hr)
Efficiency(percent)
Capacity Factor
(staff estimate)(percent)
Total Numberof Boilers
Fuel Use Per
Unit(MMBTU)
2008 Emissions(MTCO2e)
Amount of Natural Gas
to Produce Steam(MMBTU)
Petroleum 34% >60 100 80-83 0.90 282 788,400 35,006,224 222,643,608
Food 64% 10-100 40 82-83 0.80 70 280,320 1,627,120 19,625,123Wood Products 74% >50 60 80-83 0.80 40 420,480 1,193,875 16,700,271Chemicals 68% >50 60 80-83 0.85 74 446,760 2,557,335 32,899,732Oil and Gas 70% 50-100 65 77-82 0.85 293 483,990 10,724,972 141,650,580
Feasibility(percent)
Efficiency Increase(percent) Number of Units
Total Fuel Reduction(MMBTU)
GHG Reduction(MTCO2e)
Feasibility(percent)
Efficiency
Increase(percent) Number of Units
Total Fuel Reduction(MMBTU)
GHG
Reduction(MTCO2e)
Petroleum 8.5% 1% 24 189,247 10,030 13% 2% 36 567,741 30,090Food 12.3% 1% 9 24,139 1,279 18% 2% 13 72,417 3,838
Wood Products 12.3% 1% 5 20,541 1,089 18% 2% 7 61,624 3,266
Chemicals 8.5% 1% 6 27,965 1,482 13% 2% 9 83,894 4,446Oil and Gas 12.3% 1% 36 174,230 9,234 18% 2% 54 522,691 27,703
Total 436,122 23,114 119.6377945 1,308,367 69,343
Interest Rate Years Annuity Factor 2020 Price of Fuel
($/MMBTU)
Carbon Emissions ofNatural Gas
(MMTCO2e/MMBTU)Hours per Year
0.30 20 0.301586885 $ 7.69 0.053 8760
Price Per
Unit
Total Annual
Capital Cost
Total Annual
Savings Abatement Cost
($/MTCO2e) Price Per Unit
Total Annual
Capital Cost
Total Annual
Savings Abatement Cost
($/MTCO2e)
Petroleum $ 181,768 $ 1,315,868 $ 1,454,383 $ (14) $ 484,715 $ 5,263,473 $ 4,363,148 $ 30Food $ 64,629 $ 167,842 $ 185,510 $ (14) $ 172,343 $ 671,368 $ 556,530 $ 30
Wood Products $ 96,943 $ 142,828 $ 157,862 $ (14) $ 258,514 $ 571,310 $ 473,587 $ 30
Chemicals $ 103,002 $ 194,444 $ 214,912 $ (14) $ 274,672 $ 777,776 $ 644,736 $ 30Oil and Gas $ 111,585 $ 1,211,453 $ 1,338,977 $ (14) $ 297,561 $ 4,845,813 $ 4,016,930 $ 30
Total $ 3,032,435 $ 3,351,643 $ 12,129,740 $ 10,054,930
Sub-Sector
Blowdown Reduction With Controls (Category 1) Blowdown Reduction with Feedwater Cleanup (Category 2)
Sub-Sector
Percent ofFuel Use By
Steam
Calculations Assumptions
Sub-Sector
Blowdown Reduction With Controls (Category 1) Blowdown Reduction with Feedwater Cleanup (Category 2)
8/31/10 Deliberative Confidential ARB Working Copy
Page 7
8/10/2019 compathboiler (1)
http://slidepdf.com/reader/full/compathboiler-1 7/18
Blowdown Heat Recovery arb Confidential Page 7
Boiler Size Range(MMBTU/hr)
Boiler Size(MMBTU/hr)
Efficiency(percent)
Capacity Factor
(staff estimate)(percent)
Total
Numbers ofBoilers
Fuel Use Per
Unit(MMBTU)
2008 Emissions(MTCO2e)
moun o a ura
Gas to Produce
Steam(MMBTU)
Petroleum 34% >60 100 80-83 0.90 282 788400 35,006,224 222,643,608
Food 64% 10-100 40 82-83 0.80 70 280320 1,627,120 19,625,123Wood Products 74% >50 60 80-83 0.80 40 420480 1,193,875 16,700,271Chemicals 68% >50 60 80-83 0.85 74 446760 2,557,335 32,899,732Oil and Gas 70% 50-100 65 77-82 0.85 293 483990 10,724,972 141,650,580
Feasibility(percent)
Efficiency Increase(percent) Number of Units
Total Fuel Reduction(MMBTU)
GHG Reduction(MTCO2e)
Feasibility(percent)
Efficiency
Increase(percent) Number of Units
Total Fuel Reduction(MMBTU)
GHG
Reduction(MTCO2e)
Petroleum 15% 1% 42 333,965 17,700 18% 1% 51 200,379 10,620Food 15% 1% 11 29,438 1,560 18% 1% 13 17,663 936Wood Products 15% 1% 6 25,050 1,328 18% 1% 7 15,030 797
Chemicals 15% 1% 11 49,350 2,616 18% 1% 13 29,610 1,569Oil and Gas 15% 1% 44 212,476 11,261 18% 1% 53 127,486 6,757
Total 650,279 34,465 390,167 20,679
Interest Rate Years Annuity Factor
2020 Price of Fuel
($/MMBTU)
Carbon Emissions ofNatural Gas
(MMTCO2e/MMBTU)Hours in Year
0.30 20 0.301586885 $ 7.69 0.053 8760
Price Per Unit
Total Annual Capital
Cost
Total Annual
Savings Abatement Cost
($/MTCO2e) Price Per Unit
Total Annual
Capital Cost
Total Annual
Savings Abatement Cost
($/MTCO2e)
Petroleum $ 121,179 $ 1,548,080 $ 2,566,558 $ (58) $ 121,179 $ 1,548,080 $ 1,539,935 $ 1
Food $ 43,086 $ 136,457 $ 226,232 $ (58) $ 43,086 $ 136,457 $ 135,739 $ 1
Wood Products $ 64,629 $ 116,120 $ 192,515 $ (58) $ 64,629 $ 116,120 $ 115,509 $ 1Chemicals $ 68,668 $ 228,758 $ 379,257 $ (58) $ 68,668 $ 228,758 $ 227,554 $ 1Oil and Gas $ 74,390 $ 984,921 $ 1,632,898 $ (58) $ 74,390 $ 984,921 $ 979,739 $ 1
Total $ 3,014,336 $ 4,997,459 $ 3,014,336 $ 2,998,475
Sub-Sector
Blowdown Heat Recovery (Category 1) Blowdown Heat Recovery (Category 2)
Assumptions Calculations
Sub-Sector
Percent of Fuel
Use By Steam
Sub-Sector
Blowdown Heat Recovery (Category 1) Blowdown Heat Recovery (Category 2)
8/31/10 Deliberative Confidential ARB Working Copy
Page 8
8/10/2019 compathboiler (1)
http://slidepdf.com/reader/full/compathboiler-1 8/18
Optimize Steam Quality arb Confidential Page 8
2008 Emissions
(MTCO2e)
Amount of Natural Gas
to Produce Steam(MMBTU)
Petroleum 34% 35,006,224 222,643,608Food 64% 1,627,120 19,625,123
Wood Products 74% 1,193,875 16,700,271Chemicals 68% 2,557,335 32,899,732Oil and Gas 70% 10,724,972 141,650,580
Feasibility(percent)
Efficiency Increase(percent)
Total Fuel Reduction(MMBTU)
GHG Reduction(MTCO2e)
Feasibility(percent)
Efficiency Increase(percent)
o a u e
Reduction(MMBTU)
GHG Reduction(MTCO2e)
Petroleum 5.8% 1.0% 129,133 6,844 7.0% 0.5% 77,480 4,106
Food 11.3% 1.0% 22,176 1,175 13.6% 0.5% 13,306 705Wood Products 11.3% 1.0% 18,871 1,000 13.6% 0.5% 11,323 600
Chemicals 5.8% 1.0% 19,082 1,011 7.0% 0.5% 11,449 607Oil and Gas 11.3% 1.0% 160,065 8,483 13.6% 0.5% 96,039 5,090
Total 349,328 18,514 209,597 11,109
Interest Rate Years Annuity Factor
2020 Price of Fuel
($/MMBTU)
Carbon Emissions ofNatural Gas
(MMTCO2e/MMBTU) Hours in Year
0.30 20 0.301586885 $ 7.69 0.053 8760
Total Capital CostTotal AnnualCapital Cost Total Annual Savings
Abatement Cost($/MTCO2e) Total Capital Cost
Total AnnualCapital Cost
Total AnnualSavings
Abatement Cost($/MTCO2e)
Petroleum $ 1,488,603 $ 448,943 $ 992,402 $ (79) $ 1,488,603 $ 448,943 $ 595,441 $ (36)Food $ 255,642 $ 77,098 $ 170,428 $ (79) $ 255,642 $ 77,098 $ 102,257 $ (36)
Wood Products $ 217,542 $ 65,608 $ 145,028 $ (79) $ 217,542 $ 65,608 $ 87,017 $ (36)Chemicals $ 219,969 $ 66,340 $ 146,646 $ (79) $ 219,969 $ 66,340 $ 87,988 $ (36)
Oil and Gas $ 1,845,175 $ 556,481 $ 1,230,117 $ (79) $ 1,845,175 $ 556,481 $ 738,070 $ (36)Total $ 1,214,470 $ 2,684,621 $ 1,214,470 $ 1,610,772
Sub-Sector
Sub-Sector
Sub-Sector Percent of FuelUse By Steam
Calculations
Optimize Steam Quality (Category 1) Optimize Steam Quality (Category 2)
Optimize Steam Quality (Category 2)Optimize Steam Quality (Category 1)
8/31/10 Deliberative Confidential ARB Working Copy
Page 9
8/10/2019 compathboiler (1)
http://slidepdf.com/reader/full/compathboiler-1 9/18
Optimize Condensate Recovery arb Confidential Page 9
2008 Emissions(MTCO2e)
Amount of Natural
Gas to Produce Steam(MMBTU)
Petroleum 34% 35,006,224 222,643,608
Food 64% 1,627,120 19,625,123Wood Products 74% 1,193,875 16,700,271Chemicals 68% 2,557,335 32,899,732Oil and Gas 70% 10,724,972 141,650,580
Feasibility(percent)
Efficiency
Increase(percent)
Total Fuel Reduction(MMBTU)
GHG Reduction
(MTCO2e)
Feasibility(percent)
Efficiency
Increase(percent)
Total Fuel
Reduction(MMBTU)
GHG
Reduction
(MTCO2e)
Petroleum 20% 0.4% 178,115 9,440 24% 0.2% 106,869 5,664Food 20% 0.4% 15,700 832 24% 0.2% 9,420 499Wood Products 20% 0.4% 13,360 708 24% 0.2% 8,016 425
Chemicals 20% 0.4% 26,320 1,395 24% 0.2% 15,792 837Oil and Gas 20% 0.4% 113,320 6,006 24% 0.2% 67,992 3,604
Total 346,815 18,381 208,089 11,029
Interest Rate Years Annuity Factor
2020 Price of Fuel
($/MMBTU)
Carbon Emissions ofNatural Gas
(MMTCO2e/MMBTU)Hours per Year
0.30 20 0.301586885 $ 7.69 0.053 8760
Total Capital
Cost
Total Annual
Capital Cost Total Annual Savings Abatement Cost
($/MTCO2e)
Total Capital
Cost
Total Annual
Capital Cost
Total Annual
Savings
Abatement
Cost($/MTCO2e)
Petroleum $ 3,422,077 $ 1,032,053 $ 1,368,831 $ (36) $ 3,422,077 $ 1,032,053 $ 821,298 $ 37
Food $ 301,642 $ 90,971 $ 120,657 $ (36) $ 301,642 $ 90,971 $ 72,394 $ 37
Wood Products $ 256,687 $ 77,413 $ 102,675 $ (36) $ 256,687 $ 77,413 $ 61,605 $ 37Chemicals $ 505,675 $ 152,505 $ 202,270 $ (36) $ 505,675 $ 152,505 $ 121,362 $ 37Oil and Gas $ 2,177,198 $ 656,614 $ 870,879 $ (36) $ 2,177,198 $ 656,614 $ 522,527 $ 37
Total $ 2,009,557 $ 2,665,311 $ 2,009,557 $ 1,599,187
Sub-Sector
Sub-Sector
Sub-Sector Percent of FuelUse By Steam
Calculations
Optimize Condensate Recovery (Category 2)Optimize Condensate Recovery (Category 1)
Optimize Condensate Recovery (Category 1) Optimize Condensate Recovery (Category 2)
8/31/10 Deliberative Confidential ARB Working Copy
Page 10
8/10/2019 compathboiler (1)
http://slidepdf.com/reader/full/compathboiler-1 10/18
Page 11
8/10/2019 compathboiler (1)
http://slidepdf.com/reader/full/compathboiler-1 11/18
Minimize Vented Steam arb Confidential Page 11
2008 Emissions(MTCO2e)
Amount of Natural Gasto Produce Steam
(MMBTU)
Petroleum 34% 35,006,224 222,643,608
Food 64% 1,627,120 19,625,123
Wood Products 74% 1,193,875 16,700,271Chemicals 68% 2,557,335 32,899,732Oil and Gas 70% 10,724,972 141,650,580
Feasibility(percent)
Efficiency
Increase(percent)
Total Fuel Reduction(MMBTU)
GHG Reduction(MTCO2e)
Feasibility(percent)
Efficiency
Increase(percent)
Total Fuel
Reduction(MMBTU)
GHG
Reduction(MTCO2e)
Petroleum 4.1% 2.5% 228,210 12,095 4.9% 1.3% 136,926 7,257
Food 6.4% 2.5% 31,400 1,664 7.7% 1.3% 18,840 999Wood Products 6.4% 2.5% 26,720 1,416 7.7% 1.3% 16,032 850
Chemicals 4.1% 2.5% 33,722 1,787 4.9% 1.3% 20,233 1,072Oil and Gas 6.1% 2.5% 216,017 11,449 7.3% 1.3% 129,610 6,869
Total 536,070 28,412 321,642 17,047
Interest Rate Years Annuity Factor
2020 Price of Fuel
($/MMBTU)
Carbon IntensityNatural Gas
(MTCO2e/MMBTU)
Hours per
Year
0.30 20 0.301586885 $ 7.69 0.053 8760
Total Capital
Cost
Total Annual
Capital Cost Total Annual Savings Abatement Cost
($/MTCO2e)
Total Capital
Cost
Total Annual
Capital Cost
Total Annual
Savings
AbatementCost
($/MTCO2e)
Petroleum $ 876,907 $ 264,464 $ 1,753,814 $ (123) $ 876,907 $ 264,464 $ 1,052,289 $ (109)
Food $ 120,657 $ 36,389 $ 241,314 $ (123) $ 120,657 $ 36,389 $ 144,788 $ (109)Wood Products $ 102,675 $ 30,965 $ 205,349 $ (123) $ 102,675 $ 30,965 $ 123,210 $ (109)
Chemicals $ 129,579 $ 39,079 $ 259,159 $ (123) $ 129,579 $ 39,079 $ 155,495 $ (109)Oil and Gas $ 830,057 $ 250,334 $ 1,660,113 $ (123) $ 830,057 $ 250,334 $ 996,068 $ (109)
Total $ 621,231 $ 4,119,749 $ 621,231 $ 2,471,849
Sub-Sector
Percent of Fuel
Use By Steam
Calculations
Minimize Vented Steam (Category 1)
Minimize Vented Steam (Category 1)
Sub-Sector
Minimize Vented Steam (Category 2)
Minimize Vented Steam (Category 2)
Sub-Sector
8/31/10 Deliberative Confidential ARB Working Copy
Page 12
8/10/2019 compathboiler (1)
http://slidepdf.com/reader/full/compathboiler-1 12/18
Minimize Vented Steam arb Confidential Page 12
8/31/10 Deliberative Confidential ARB Working Copy
Page 13
8/10/2019 compathboiler (1)
http://slidepdf.com/reader/full/compathboiler-1 13/18
Insulation Maintenance arb Confidential Page 13
2008
Emissions(MTCO2e)
moun o a ura
Gas to Produce
Steam(MMBTU)
Petroleum 34% 35,006,224 222,643,608
Food 64% 1,627,120 19,625,123Wood Products 74% 1,193,875 16,700,271Chemicals 68% 2,557,335 32,899,732Oil and Gas 70% 10,724,972 141,650,580
Feasibility(percent)
Efficiency
Increase(percent)
Total Fuel Reduction(MMBTU)
GHG Reduction
(MTCO2e)
Feasibility(percent)
Efficiency
Increase(percent)
Total Fuel
Reduction(MMBTU)
GHGReduction
(MTCO2e)
Petroleum 40% 3.5% 3,117,011 165,202 5% 7.5% 834,914 44,250Food 40% 3.5% 274,752 14,562 5% 7.5% 73,594 3,900Wood Products 40% 3.5% 233,804 12,392 5% 7.5% 62,626 3,319
Chemicals 40% 3.5% 460,596 24,412 5% 7.5% 123,374 6,539Oil and Gas 40% 3.5% 1,983,108 105,105 5% 7.5% 531,190 28,153
Total 6,069,270 321,671 1,625,697 86,162
Interest Rate Years
Annuity
Factor
2020 Price of Fuel
($/MMBTU)
Carbon IntensityNatural Gas
(MTCO2e/MMBTU) Hours per Year
0.30 20 0.301586885 $ 7.69 0.053 8760
Total Capital Cost
Total Annual
Capital Cost
Total Annual
Savings Abatement Cost
($/MTCO2e)
Total Capital
Cost
Total Annual
Capital Cost
Total Annual
Savings
Abatement
Cost($/MTCO2e)
Petroleum $ 47,909,075 $ 14,448,749 $ 23,954,537 $ (58) $ 19,249,182 $ 5,774,755 $ 6,416,394 $ (15)
Food $ 4,222,989 $ 1,273,598 $ 2,111,494 $ (58) $ 1,696,737 $ 509,021 $ 565,579 $ (15)
Wood Products $ 3,593,611 $ 1,083,786 $ 1,796,806 $ (58) $ 1,443,862 $ 433,158 $ 481,287 $ (15)Chemicals $ 7,079,456 $ 2,135,071 $ 3,539,728 $ (58) $ 2,844,424 $ 853,327 $ 948,141 $ (15)Oil and Gas $ 30,480,768 $ 9,192,600 $ 15,240,384 $ (58) $ 12,246,737 $ 3,674,021 $ 4,082,246 $ (15)
Total $ 28,133,804 $ 46,642,950 $ 11,244,283 $ 12,493,647
Sub-Sector
Sub-Sector Percent of FuelUse By Steam
Calculations
Insulation Maintenance (Category 1) Insulation Maintenance (Category 2)
Sub-Sector
Insulation Maintenance (Category 1) Insulation Maintenance (Category 2)
8/31/10 Deliberative Confidential ARB Working Copy
Page 14
8/10/2019 compathboiler (1)
http://slidepdf.com/reader/full/compathboiler-1 14/18
Insulation Maintenance arb Confidential Page 14
8/31/10 Deliberative Confidential ARB Working Copy
Page 15
8/10/2019 compathboiler (1)
http://slidepdf.com/reader/full/compathboiler-1 15/18
Steam Trap Maintenance arb Confidential Page 15
2008
Emissions
(MTCO2e)
Amount of Natural Gas
to Produce Steam(MMBTU)
Petroleum 34% 35,006,224 222,643,608
Food 64% 1,627,120 19,625,123Wood Products 74% 1,193,875 16,700,271
Chemicals 68% 2,557,335 32,899,732Oil and Gas 70% 10,724,972 141,650,580
Feasibility
(percent)
Efficiency
Increase
(percent)
Total Fuel Reduction
(MMBTU)GHG Reduction
(MTCO2e)
Feasibility
(percent)
Efficiency Increase
(percent)
Total Fuel
Reduction
(MMBTU)
GHGReduction
(MTCO2e)
Petroleum 50% 3% 3,339,654 177,002 30% 5.0% 3,339,654 177,002Food 50% 3% 294,377 15,602 30% 5.0% 294,377 15,602
Wood Products 50% 3% 250,504 13,277 30% 5.0% 250,504 13,277Chemicals 50% 3% 493,496 26,155 30% 5.0% 493,496 26,155Oil and Gas 50% 3% 2,124,759 112,612 30% 5.0% 2,124,759 112,612
Total 6,502,790 344,648 6,502,790 344,648
Interest Rate Years AnnuityFactor
2020 Price of Fuel($/MMBTU)
Carbon Intensity
Natural Gas(MTCO2e/MMBTU) Hours per Year
0.30 20 0.301586885 $ 7.69 0.053 8760
Total Capital
Cost
Total Annual
Capital Cost Total Annual Savings Abatement Cost
($/MTCO2e)
Total Capital
Cost1
Total Annual
Capital Cost
Total Annual
Savings
AbatementCost
($/MTCO2e)
Petroleum $ 25,665,576 $ 7,740,401 $ 25,665,576 $ (101) $ 38,498,364 $ 11,549,509 $ 25,665,576 $ (80)
Food $ 2,262,316 $ 682,285 $ 2,262,316 $ (101) $ 3,393,473 $ 1,018,042 $ 2,262,316 $ (80)Wood Products $ 1,925,149 $ 580,600 $ 1,925,149 $ (101) $ 2,887,723 $ 866,317 $ 1,925,149 $ (80)
Chemicals $ 3,792,566 $ 1,143,788 $ 3,792,566 $ (101) $ 5,688,849 $ 1,706,655 $ 3,792,566 $ (80)Oil and Gas $ 16,328,983 $ 4,924,607 $ 16,328,983 $ (101) $ 24,493,475 $ 7,348,042 $ 16,328,983 $ (80)
Total $ 15,071,681 $ 49,974,589 $ 22,488,565 $ 49,974,589
1 For Category 2, staff assumed a 50 percent greater cost than Category 1
Steam Trap Maintenance (Category 1) Steam Trap Maintenance (Category 2)
Steam Trap Maintenance (Category 2)
Sub-Sector
Sub-Sector Percent of FuelUse By Steam
Calculations
Sub-Sector
Steam Trap Maintenance (Category 1)
8/31/10 Deliberative Confidential ARB Working Copy
Page 16
8/10/2019 compathboiler (1)
http://slidepdf.com/reader/full/compathboiler-1 16/18
Steam Trap Maintenance arb Confidential Page 16
8/31/10 Deliberative Confidential ARB Working Copy
Page 17
8/10/2019 compathboiler (1)
http://slidepdf.com/reader/full/compathboiler-1 17/18
Steam Leak Maintenance arb Confidential Page 17
2008
Emissions
(MTCO2e)
moun o a ura
Gas to Produce
Steam(MMBTU)
Petroleum 34% 35,006,224 222,643,608
Food 64% 1,627,120 19,625,123Wood Products 74% 1,193,875 16,700,271
Chemicals 68% 2,557,335 32,899,732Oil and Gas 70% 10,724,972 141,650,580
Feasibility
(percent)
EfficiencyIncrease
(percent)
Total FuelReduction
(MMBTU)GHG Reduction
(MTCO2e)
Feasibility
(percent)
EfficiencyIncrease
(percent)
Total FuelReduction
(MMBTU)
GHGReduction
(MTCO2e)
Petroleum 20% 2.5% 1,113,218 59,001 30% 1.0% 667,931 35,400Food 20% 2.5% 98,126 5,201 30% 1.0% 58,875 3,120
Wood Products 20% 2.5% 83,501 4,426 30% 1.0% 50,101 2,655Chemicals 20% 2.5% 164,499 8,718 30% 1.0% 98,699 5,231Oil and Gas 20% 2.5% 708,253 37,537 30% 1.0% 424,952 22,522
Total 2,167,597 114,883 1,300,558 68,930
Interest Rate Years AnnuityFactor
2020 Price of Fuel($/MMBTU)
Carbon IntensityNatural Gas
(MTCO2e/MMBTU) Hours per Year
0.30 20 0.301586885 $ 7.69 0.053 8760
Total Capital
Cost
Total Annual
Capital Cost
Total Annual
Savings Abatement Cost
($/MTCO2e)
Total Capital
Cost1
Total Annual
Capital Cost
Total Annual
Savings
AbatementCost
($/MTCO2e)
Petroleum $ 12,832,788 $ 3,870,201 $ 8,555,192 $ (79) $ 19,249,182 $ 5,805,301 $ 5,133,115 $ 19
Food $ 1,131,158 $ 341,142 $ 754,105 $ (79) $ 1,696,737 $ 511,714 $ 452,463 $ 19
Wood Products $ 962,574 $ 290,300 $ 641,716 $ (79) $ 1,443,862 $ 435,450 $ 385,030 $ 19Chemicals $ 1,896,283 $ 571,894 $ 1,264,189 $ (79) $ 2,844,424 $ 857,841 $ 758,513 $ 19Oil and Gas $ 8,164,492 $ 2,462,304 $ 5,442,994 $ (79) $ 12,246,737 $ 3,693,455 $ 3,265,797 $ 19
Total $ 7,535,840 $ 16,658,196 $ 11,303,761 $ 9,994,918
1 For Category 2, staff assumed a 50 percent greater cost than Category 1
Steam Leak Maintenance (Category 1) Steam Leak Maintenance (Category 2)
Steam Leak Maintenance (Category 2)Steam Leak Maintenance (Category 1)
Sub-Sector Percent of FuelUse By Steam
Calculations
Sub-Sector
Sub-Sector
8/31/10 Deliberative Confidential ARB Working Copy
Page 18
8/10/2019 compathboiler (1)
http://slidepdf.com/reader/full/compathboiler-1 18/18
Steam Leak Maintenance arb Confidential Page 18
8/31/10 Deliberative Confidential ARB Working Copy


![1 1 1 1 1 1 1 ¢ 1 , ¢ 1 1 1 , 1 1 1 1 ¡ 1 1 1 1 · 1 1 1 1 1 ] ð 1 1 w ï 1 x v w ^ 1 1 x w [ ^ \ w _ [ 1. 1 1 1 1 1 1 1 1 1 1 1 1 1 1 1 1 1 1 1 1 1 1 1 1 1 1 1 ð 1 ] û w ü](https://static.documents.pub/doc/80x56/5f40ff1754b8c6159c151d05/1-1-1-1-1-1-1-1-1-1-1-1-1-1-1-1-1-1-1-1-1-1-1-1-1-1-w-1-x-v.jpg)


![[XLS] · Web view1 1 1 2 3 1 1 2 2 1 1 1 1 1 1 2 1 1 1 1 1 1 2 1 1 1 1 2 2 3 5 1 1 1 1 34 1 1 1 1 1 1 1 1 1 1 240 2 1 1 1 1 1 2 1 3 1 1 2 1 2 5 1 1 1 1 8 1 1 2 1 1 1 1 2 2 1 1 1 1](https://static.documents.pub/doc/80x56/5ad1d2817f8b9a05208bfb6d/xls-view1-1-1-2-3-1-1-2-2-1-1-1-1-1-1-2-1-1-1-1-1-1-2-1-1-1-1-2-2-3-5-1-1-1-1.jpg)


![1 1 1 1 1 1 1 ¢ 1 1 1 - pdfs.semanticscholar.org€¦ · 1 1 1 [ v . ] v 1 1 ¢ 1 1 1 1 ý y þ ï 1 1 1 ð 1 1 1 1 1 x ...](https://static.documents.pub/doc/80x56/5f7bc722cb31ab243d422a20/1-1-1-1-1-1-1-1-1-1-pdfs-1-1-1-v-v-1-1-1-1-1-1-y-1-1-1-.jpg)