28
Compendium of Resource Partner Contributions 2013
Compendium of Resource Partner Contributions
2013
Front Cover: © UNICEF/NYHQ2013-1053/Bassel Halabi
Syrian Arab Republic - on 16 November 2013, displaced children participating in UNICEF-supported psychosocial activities play tug of war, in a shelter in the city of Homs, capital of Homs Governorate. The humanitarian situation throughout Homs continues to deteriorate, with many areas experiencing daily shelling and fighting.
By November 2013, 9.3 million people had been affected by the escalating conflict. Of these, 6.5 million people – over 2.9 million of them children – have been internally displaced. Syrians have also fled abroad, with more than 2.2 million people registered or awaiting registration with the United Nations High Commission for Refugees in Egypt, Iraq, Jordan, Lebanon and Turkey. Ongoing UNICEF initiatives inside the Syrian Arab Republic include the distribution of school bags with supplies to over 600,000 children; programmes in water, sanitation and hygiene; supporting the Ministry of Health in reaching children with medical check-ups and primary health care services via mobile medical teams and fixed centers; and the provision of psychosocial support services that are reaching more than 110,100 children. Following the confirmation of 13 cases of wild polio virus in the country, more than 1.2 million children have been vaccinated against the disease as part of an ongoing nationwide immunization campaign led by the Ministry of Health in coordination with UNICEF and the World Health Organization. In line with the country’s inter-agency 2014 Strategic Response Plan, UNICEF is requesting US$222,192,000 to meet the humanitarian needs of children in Syria in 2014.
1
UN
ICE
F C
om
pen
diu
m o
f C
on
trib
uti
on
s 20
13
Partnering for results . . . . . . . . . . . . . . . . . . . . . . . . . . . . . . . . . . . . . . . . . . . . . . . . . . . . . . . . . . . . . . . . . . . . . . 2
Executive Summary . . . . . . . . . . . . . . . . . . . . . . . . . . . . . . . . . . . . . . . . . . . . . . . . . . . . . . . . . . . . . . . . . . . . . . . 3
Resources by type of funding, 2004-13 . . . . . . . . . . . . . . . . . . . . . . . . . . . . . . . . . . . . . . . . . . . . . . . . . . 4
Core funds crucial to UNICEF’s drive for results . . . . . . . . . . . . . . . . . . . . . . . . . . . . . . . . . . . . . . . . 5
Total revenue by type of Resource Partner, 2013 . . . . . . . . . . . . . . . . . . . . . . . . . . . . . . . . . . . . . . . . 6
Top 20 Public and Private Sector Resource Partners, 2013 . . . . . . . . . . . . . . . . . . . . . . . . . . . . . 7
Top 20 Government Resource Partners, 2013 . . . . . . . . . . . . . . . . . . . . . . . . . . . . . . . . . . . . . . . . . . . . 8
Top 20 National Committee Resource Partners, 2013 . . . . . . . . . . . . . . . . . . . . . . . . . . . . . . . . . . . 9
Core Resources (Core) by type of Resource Partner, 2013 . . . . . . . . . . . . . . . . . . . . . . . . . . . . . . 10
Other Resources (OR) by type of Resource Partner, 2013 . . . . . . . . . . . . . . . . . . . . . . . . . . . . . . 11
Other Resources – Regular (ORR) by type of Resource Partner, 2013 . . . . . . . . . . . . . . . . . . 12
Other Resources – Emergency (ORE) by type of Resource Partner, 2013 . . . . . . . . . . . . . . . . . 13
Thematic revenue, 2013 . . . . . . . . . . . . . . . . . . . . . . . . . . . . . . . . . . . . . . . . . . . . . . . . . . . . . . . . . . . . . . . . . . 14
Thematic funds support UNICEF’s drive for results . . . . . . . . . . . . . . . . . . . . . . . . . . . . . . . . . . . . 15
Contributions received through Inter-organizational Arrangements, 2007-13 . . . . . . . 16
Total UNICEF revenue, 2012-13 . . . . . . . . . . . . . . . . . . . . . . . . . . . . . . . . . . . . . . . . . . . . . . . . . . . . . . . . . . 17
Total UNICEF revenue by Resource Partner, 2013 . . . . . . . . . . . . . . . . . . . . . . . . . . . . . . . . . . . . . . . 18
Development Assistance Committee (DAC) total revenue to UNICEF compared to ODA, ODA per capita and GNI per capita, 2013 . . . . . . . . . . . . . . . . . . . . . . . . . 21
Development Assistance Committee (DAC) Core Resources to UNDP, UNICEF and UNFPA, 2013 . . . . . . . . . . . . . . . . . . . . . . . . . . . . . . . . . . . . . . . . . . . . . . . . . . . . . . . 22
Glossary . . . . . . . . . . . . . . . . . . . . . . . . . . . . . . . . . . . . . . . . . . . . . . . . . . . . . . . . . . . . . . . . . . . . . . . . . . . . . . . . . . . . 23
Abbreviations and Acronyms . . . . . . . . . . . . . . . . . . . . . . . . . . . . . . . . . . . . . . . . . . . . . . . . . . . . . . . . . . . . . 24
Contents
2
UN
ICE
F C
om
pen
diu
m o
f C
on
trib
uti
on
s 20
13
Partnering for results
Last year, UNICEF and Member States came together to develop the organization’s new Strategic Plan for 2014-17, which was approved at our Executive Board in September. The Plan outlines an ambitious set of jointly agreed results for children. In order to deliver on the Plan, we will need the continued support of all our partners.
Under the banner of A Promise Renewed, governments from Bangladesh to Zambia, and India to Liberia, are setting bold, new targets for maternal, newborn and child survival. In Nigeria, that accounts for one in every eight child deaths globally, the Government aims at saving the lives of a million women and children by 2015 through the initiative Saving One Million Lives.
As the Syrian crisis has entered its fourth year and with a tragic estimate of 5.4 million children affected, UNICEF and partners continue scaling-up life-saving interventions, with particular focus on routine vaccinations, special campaigns for polio, management of acute malnutrition, and scaling up water, sanitation and hygiene services.
The overall revenue of UNICEF grew by 23 per cent in 2013 compared with 2012 and totaled an unprecedented $4.9 billion invested in delivering results for children in development and humanitarian settings. UNICEF is greatly appreciative of the trust in the organization and the commitment to children’s rights that every dollar represents.
While UNICEF’s resources have grown significantly, our core resources declined once more in 2013, putting at risk the organization’s ability to deliver efficiently on all strategic areas. Together with the Strategic Plan, UNICEF has for the first time introduced an integrated budget, linking results to resources, as well as allocating more core resources to programmes. The organization is therefore also more dependent than before on core resources to achieve its Plan.
UNICEF continues to put highest priority on accountability, efficiency and transparency throughout its work. We began publishing financial and performance information as per the International Aid Transparency Initiative (IATI) standard in June 2013. We are, further, committed to strong financial management and oversight, as well as responsible risk management in the volatile environments where we operate. Initiatives, such as the implementation of a Global Shared Service Centre (GSSC), are being put in place to enhance efficiency. The Centre is expected to start in 2015 and to be fully operational by mid-2016. Core resources strengthen all these efforts, as they allow long-term planning and streamlined administrative and management practices.
This year, 2014, marks the 25th anniversary of the Convention on the Rights of the Child. While celebrating the progress made in the last 25 years, we renew our commitment alongside our partners to address the remaining obstacles and contribute to shaping the Post-2015 Agenda.
In partnership for a better future for every child, everywhere,
Elhadj As SyDirectorPublic-Sector Alliances and Resource Mobilization Office (PARMO)New York, April 2014

3
UN
ICE
F C
om
pen
diu
m o
f C
on
trib
uti
on
s 20
13
Executive Summary
The Compendium of Contributions 2013 comprises information on contributions from public and private sector resource partners to UNICEF1. Information presented in the Compendium demonstrates the results of extensive policy and programme partnerships between UNICEF and its resource partners. The Compendium is not an official UNICEF financial document, but it draws largely on financial data and is predominantly intended as a practical and illustrative report for resource partners.
Development aid rose by 6.1 per cent globally in 2013 to reach the highest level ever recorded, despite continued pressure on budgets since the start of the global economic crisis, according to the Organisation for Economic Co-operation and Development (OECD)2. Public-sector resource partners provided a total of $134.8 billion in net Official Development Assistance (ODA), marking a rebound after two years of falling volumes, as a number of governments stepped up their spending on foreign aid.
The total revenue to UNICEF increased from $3,945 million in 2012 to $4,853 million in 2013, representing an increase of 23 per cent (or $908 million)3. Core Resources amounted to $1,265 million – a decrease of 2 per cent (or $23 million) compared to 2012. Other Resources (OR) increased significantly, by 35 per cent (or $931 million) from $2,657 in 2012 to $3,588 million in 2013. The total OR consisted of $2,256 million or 63 per cent in Other Resources - Regular (ORR) and $1,332 million or 37 per cent in Other Resources - Emergency (ORE).
Public sector revenue, largely from Government and Inter-Governmental partners as well as Inter-organizational Arrangements, constituted 69 per cent (or $3,327 million) of the total revenue, an increase of 27 per cent (or $706 million) compared to 2012. Private sector revenue, mainly driven by National Committees,
was $1,437 million or 30 per cent of the total UNICEF revenue, representing an increase of 16 per cent (or $193 million) over 2012 levels.
According to the Development Assistance Committee (DAC) Multilateral Aid Report, earmarked funding through multilaterals is the fastest growing component of ODA4. The rationale behind this trend is that non-core contributions allow for tracking results more easily, provide greater influence over specific use, and better visibility of contributions. Yet, the OECD finds that “earmarked aid to multilateral organisations contributes to fragmentation”. The Quadrennial Comprehensive Policy Review (QCPR) resolution encouraged UN member states to strengthen Core Resources and quality earmarked contributions that result in greater efficiencies and value for money5.
1 All figures in this report have been rounded.
2 OECD website URL www.oecd.org/development/aid-to-developing-countries-rebounds-in-2013-to-reach-an-all-time-high.htm accessed on 9 April 2014.
3 The figures for 2012 in this report have been restated to reflect the results of the 2012 audit. The figures for 2013 are provisional and are subject to audit.
4 2012 DAC Report on Multilateral Aid, OECD.
5 The General Assembly resolution (67/226) on the Quadrennial Comprehensive Policy Review (QCPR) of UN operational activities for development adopted on 21 December 2012.
From UNSAS to IPSAS
United Nations system organizations, including UNICEF, have prepared their financial reporting in accordance with United Nations Systems Accounting Standards (UNSAS) since 1993. Through a General Assembly resolution, member states requested UN organizations to adopt International Public Sector Financial Reporting Standards (IPSAS) to enhance the quality of organizational-level financial reporting by ensuringimproved transparency, accountability and governance. UNICEF adopted IPSAS effective January 1, 2012.
A meaningful analysis of trends in revenue from one period to the next requires comparable data. The change in accounting standards in 2012 from UNSAS to IPSAS may not allow meaningful comparisons between 2012 figures and earlier years. Under IPSAS, revenue is recorded at the earlier stage of either cash received or signatureof a formal agreement with the resource partner.

4
UN
ICE
F C
om
pen
diu
m o
f C
on
trib
uti
on
s 20
13Resources by type of funding, 2004-13
The proportion of Core Resources to Other Resources continues to decrease as the growth in earmarked OR funding has surpassed the growth of un-earmarked Core funding by manifolds. In 2013, Core Resources were only 26 per cent of the total revenue – a decline from 50 per cent at the turn of the new millennium.
Core Resources from the Government resource partners continued to decline, from $646 million in 2011 to $601 million in 2012, and most recently to $587 million in 2013. This latest decline comes despite the pledge by
member states in the General Assembly QCPR Resolution to increase core contributions to United Nations Funds and Programmes, as well as ensure a complementary balance between core and earmarked funds. Optimizing this proportionality and complementarity is critical to drive predictable results for the most vulnerable and marginalized populations.
0
500
1000
1500
2000
2500
3000
3500
4000
4500
5000
2004 2005 2006 2007 2008 2009 2010 2011 20132012
1,978
2,761
1,187
1,949
791 812
2,781
1,725
1,056
3,013
1,907
1,106
3,390
2,305
1,085
3,256
2,190
1,066
3,682
2,717
965
3,711
2,633
1,078
3,945
2,657
1,288
4,853
3,588
1,265
US
$ m
illio
ns
ShareCore/OR 40%/60% 37%/63% 26%/74% 26%/74%
Core Resources
Other Resources
Total
Cha
nge
in a
ccou
ntin
g po
licy
from
UN
SA
S t
o IP
SA
S m
ay n
ot a
llow
m
eani
ngfu
l com
paris
ons
betw
een
2012
figu
res
and
prio
r ye
ars.
Contributions from all Resource Partners
2013 Contributions by Funding Type
Other Resources(Emergency)
$1,332 M 27%
Core Resources
$1,265 M 26%
$2,256 M 47%
Other Resources(Regular)
ToTAl US: $4,853 million
Please visit www.unicef.org/parmo to see the Regular Resources video as shown at the 1st Regular Session of the UNICEF Executive Board in 2014.

5
UN
ICE
F C
om
pen
diu
m o
f C
on
trib
uti
on
s 20
13
Core funds crucial to UNICEF’s drive for results
Case study - Madagascar
The critical nature of core resources has been evident in Madagascar, which has been in the throes of political upheaval for five years. Following a coup d’état in 2009, a big portion of foreign aid was suspended, with catastrophic consequences for a nation that heavily relies on overseas support. During the crisis, available Government resources were also mostly invested in efforts to maintain economic stability rather than in social services.
“In a context of prolonged crisis, core resources have been essential to keep up basic social services in order to meet the needs of children and mothers. Without core resources, it would have been impossible for UNICEF to fund interventions in maternal and child health, nutrition, access to safe drinking water and latrines, education and child protection”, Steven Lauwerier, UNICEF Madagascar Representative, highlights.
UNICEF, for example, used core resources to fund 70 per cent of its activities in maternal and child health in 2013. Immunization coverage has also been a big concern in the country since the beginning of the crisis, with more than 108,948 children not or only partly vaccinated. Core resources made up 50 per cent of UNICEF’s total budget to maintain the immunization coverage in 2013.
Core resources were also essential in bringing a pilot on water, sanitation and hygiene to scale. The objective was to support community led sanitation programmes and positively change behaviour by improving infrastructure in schools and health centres. Between July and November 2013, the pilot reached approximately 80,000 people. “The successful results garnered additional funding that now allow UNICEF to scale the project to reach nearly 600,000 people” explains Steven Lauwerier. “Without the
flexibility that core resources offer, this type of leveraging and scaling-up of successful efforts would not be possible” he asserts.
The total amount of Core Resources used in Madagascar in 2013 was $12 million; the whole Country Office budget was $67 million.
Results for health in 2013 in Madagascar
� 91 per cent of 3.2 million children between 9 months and 5 years of age vaccinated against measles during the second round of the Mother and Child Health Week campaign;
� National rollout of the pneumococcal vaccine;
� 59 solar refrigerators, 13 cold rooms, 3,500 Fridge-Tag 2 monitors, 3,650 vaccine carriers and 315 bicycles provided in programme regions to strengthen the cold chain and outreach capacity;
� The capacity of 92 basic health centres was strengthened to deliver basic emergency obstetric and neonatal care;
� 943 community health workers in the three target districts were trained to offer care to pregnant women and newborns. As a result, key indicators in the three districts improved between 2012 and 2013: the coverage of antenatal care increased from 25 to 35 per cent, institutional deliveries from 27 to 33.5 per cent, and postnatal consultations from 16 to 55 per cent.
© UNICEF/NYHQ2009-1236/Giacomo Pirozzi. Children play at a UNICEF child-friendly space in Antananarivo, Madagascar.

6
UN
ICE
F C
om
pen
diu
m o
f C
on
trib
uti
on
s 20
13Total Revenue by type of Resource Partner, 2013
The total revenue to UNICEF increased from $3,945 million in 2012 to $4,853 million in 2013, representing an increase of 23 per cent (or $908 million). Core Resources amounted $1,265 million – a decrease of 2 per cent (or $23 million) compared to 2012. Other Resources increased significantly, by 35 per cent (or $931 million) from $2,657 in 2012 to $3,588 million in 2013.
Public sector revenue constituted 69 per cent (or $3,327 million) of the total revenue, an increase of 27 per cent (or $706 million) compared to 2012. This was made up mostly by contributions from Government and Inter-Governmental partners.
Private sector revenue was $1,437 million or 30 per cent of the total UNICEF revenue, representing an increase of 16 per cent (or $193 millions) over 2012 levels. This was largely driven from National Committees.
Other revenue, including income from interest, procurement services and other sources, was $89 million or 2 per cent of total UNICEF revenue.
1 Inter-governmental Organizations include: African Development Bank, Asian Development Bank, European Commission, Inter-American Development Bank, OPEC Fund and Secretariat of Pacific Community.
2 Revenue from Private Sector includes global funds, foundations, Non-governmental Organizations, National Committees and country office private sector fundraising.
3 Other revenue includes income from interest, procurement services and other sources.
4 Inter-organizational Arrangements include: FAO, IFAD, ILO, PAHO, UNAIDS, UNAMI, UNDP, UNDPKO, UNFPA, UNHCR, UN Human Security Trust Fund, UNMAS, UNOCHA, UNODC, UNOPS, UN Secretariat, UN Women, WFP, WHO, World Bank (including Global Partnership for Education), as well as UN Joint Programme where UNICEF is the Administrative Agent.
5 Total revenue includes financial adjustments and refunds.
0
500
1000
1500
2000
2500
3000
3500
2004 2005 2006 2007 2008 2009 2010 2011 20132012
61 55
555
1,165
1,3611,543
190
799
1,792
176
868
1,969
108
987
2,295
89
916
2,251
55
1,188
2,440
55
1,089
2,568
80
1,244
2,621
89
1,437
3,327
US
$ m
illio
ns
Public Sector
Private Sector
Other
Inter-organizationalArrangements4
$334 M 7%
Other Revenue3
$89 M 2%
Governments andInter-governmental
Organizations1
$2,993 M 62%
$1,437 M 30%
Private Sector2
ToTAl US: $4,853 million5
Cha
nge
in a
ccou
ntin
g po
licy
from
UN
SA
S to
IPS
AS
may
not
allo
w
mea
ning
ful c
ompa
rison
s be
twee
n 20
12 fi
gure
s an
d pr
ior y
ears
.
UNICEF Contributions trend by Resource Partner Category, 2004-13

7
UN
ICE
F C
om
pen
diu
m o
f C
on
trib
uti
on
s 20
13
Top 20 Public and Private Sector Resource Partners, 2013
The top 20 resource partners contributed $3,450 million or 71 per cent of the total revenue to UNICEF. These partners provided 73 per cent of total Core Resources and 70 per cent of total Other Resources. Revenue received through Inter-organizational Arrangements is excluded from this ranking as it originates primarily from the same group of major UNICEF Government resource partners.
Public sector (Governments and Inter-governmental Organizations) contributed 73 per cent of the revenue of the top 20 resource partners, while the remaining 27 per
cent was provided by private sector resource partners.
In 2013, the top five resource partners continue to be from the public sector. These comprised Governments of the United Kingdom, United States, Japan, and Norway; and the European Commission as an Inter-governmental Organization. These five resource partners contributed more than half of the total contributions of the top 20 resource partners.
0 100 15050 200 250 300 400350 450 500 600550US$ millions
Core Resources
Other Resources (Regular)
Other Resources (Emergency)
United Kingdom
European Commission
United Statesof America
Japan
Norway
United Statesof America NC
Sweden
Netherlands
Canada
Japan NC
Germany NC
Republic ofKorea NC
Sweden NC
Netherlands NC
France NC
Spain NC
UnitedKingdom NC
Germany
Denmark
Kuwait
Rank 2013
Rank 2012 Resource Partners Core Resources
(US$)other Resources(regular) (US$)
other Resources(emergency) (US$) Total (US$)
1 1 United Kingdom 62,415,519 318,322,693 174,649,000 555,387,212 2 4 European Commission - 231,268,510 200,096,350 431,364,861 3 2 United States of America 125,168,000 86,903,155 113,284,090 325,355,246 4 5 Japan 22,722,303 55,447,052 184,849,281 263,018,636 5 3 Norway 82,134,000 147,121,718 12,050,469 241,306,187 6 14 United States of America NC 34,304,666 161,630,156 31,486,343 227,421,165 7 7 Sweden 69,395,071 106,202,506 30,838,467 206,436,044 8 9 Netherlands 44,502,600 127,972,035 3,750,000 176,224,635 9 6 Canada 16,814,088 118,413,908 26,321,820 161,549,817 10 8 Japan NC 106,654,403 10,347,918 17,280,060 134,282,381 11 11 Germany NC 57,235,466 27,320,451 24,627,932 109,183,850 12 17 Republic of Korea NC 70,044,216 13,791,327 3,779,690 87,615,232 13 16 Sweden NC 40,308,800 39,057,640 8,035,206 87,401,645 14 15 Netherlands NC 42,730,236 15,963,533 15,154,097 73,847,867 15 10 France NC 47,418,889 17,708,520 7,519,348 72,646,757 16 22 Spain NC 42,466,333 6,450,510 12,327,194 61,244,037 17 19 United Kingdom NC 15,336,655 28,650,753 16,910,882 60,898,290 18 18 Germany 8,662,446 10,247,021 40,854,324 59,763,791 19 20 Denmark 31,920,611 12,293,941 15,448,483 59,663,035 20 102 Kuwait 200,000 - 55,000,000 55,200,000

8
UN
ICE
F C
om
pen
diu
m o
f C
on
trib
uti
on
s 20
13Top 20 Government Resource Partners, 20131
In 2013, a total of 129 Governments contributed to UNICEF resources. The top 20 Government resource partners contributed $2,382 million or 49 per cent of the total revenue to UNICEF. These partners provided 44 per cent of total Core Resources and 51 per cent of total Other Resources. Of these top 20 resource partners, all except Kuwait and Saudi Arabia were from to the Development Assistance Committee (DAC) of OECD. Contributions received through Inter-organizational Arrangements are
excluded from this ranking as they originate primarily from the same group of major UNICEF Government resource partners.
In 2013, the top five resource partners in this category included United Kingdom, United States, Japan, Norway, and Sweden. These five resource partners contributed 67 per cent of the contributions of the top 20 government partners.
0 100 200 300 400 500 600
Core Resources
Other Resources (Regular)
Other Resources (Emergency)
United Kingdom
United Statesof America
Japan
Norway
Sweden
Netherlands
Canada
Germany
Denmark
Kuwait
Australia
Finaland
Switzerland
Belgium
Republic of Korea
Ireland
France
Italy
Spain
Saudi Arabia
15050US$ millions 250 350 450 550
Rank 2013
Rank 2012 Resource Partners Core Resources
(US$) Rank other Resources(regular) (US$) Rank other Resources
(emergency) (US$) Rank Total (US$)
1 1 United Kingdom 62,415,519 4 318,322,693 1 174,649,000 2 555,387,212 2 2 United States of America 125,168,000 1 86,903,155 6 113,284,090 3 325,355,246 3 4 Japan 22,722,303 9 55,447,052 7 184,849,281 1 263,018,636 4 3 Norway 82,134,000 2 147,121,718 2 12,050,469 10 241,306,187 5 6 Sweden 69,395,071 3 106,202,506 5 30,838,467 6 206,436,044 6 7 Netherlands 44,502,600 5 127,972,035 3 3,750,000 17 176,224,635 7 5 Canada 16,814,088 10 118,413,908 4 26,321,820 7 161,549,817 8 9 Germany 8,662,446 13 10,247,021 14 40,854,324 5 59,763,791 9 10 Denmark 31,920,611 6 12,293,941 13 15,448,483 9 59,663,035 10 34 Kuwait 200,000 49 - - 55,000,000 4 55,200,000 11 8 Australia - - 35,490,253 8 18,293,096 8 53,783,349 12 11 Finland 27,787,750 7 7,923,832 16 10,988,447 11 46,700,029 13 13 Switzerland 22,975,890 8 15,963,395 10 7,091,680 15 46,030,965 14 12 Belgium 13,865,591 11 9,722,954 15 10,926,006 12 34,514,551 15 21 Republic of Korea 3,200,000 19 15,290,814 11 7,985,933 14 26,476,74716 14 Ireland 10,472,548 12 6,389,952 20 1,348,763 21 18,211,263 17 15 France 4,403,578 15 12,401,676 12 135,685 30 16,940,939 18 18 Italy 3,926,700 16 6,554,261 19 3,219,825 18 13,700,786 19 17 Spain 3,536,112 18 353,707 36 8,248,981 13 12,138,799 20 16 Saudi Arabia 1,144,200 26 3,500,006 22 4,731,139 16 9,375,345
1 Excludes Inter-governmental Organizations.
9
UN
ICE
F C
om
pen
diu
m o
f C
on
trib
uti
on
s 20
13
Top 20 National Committee Resource Partners, 2013
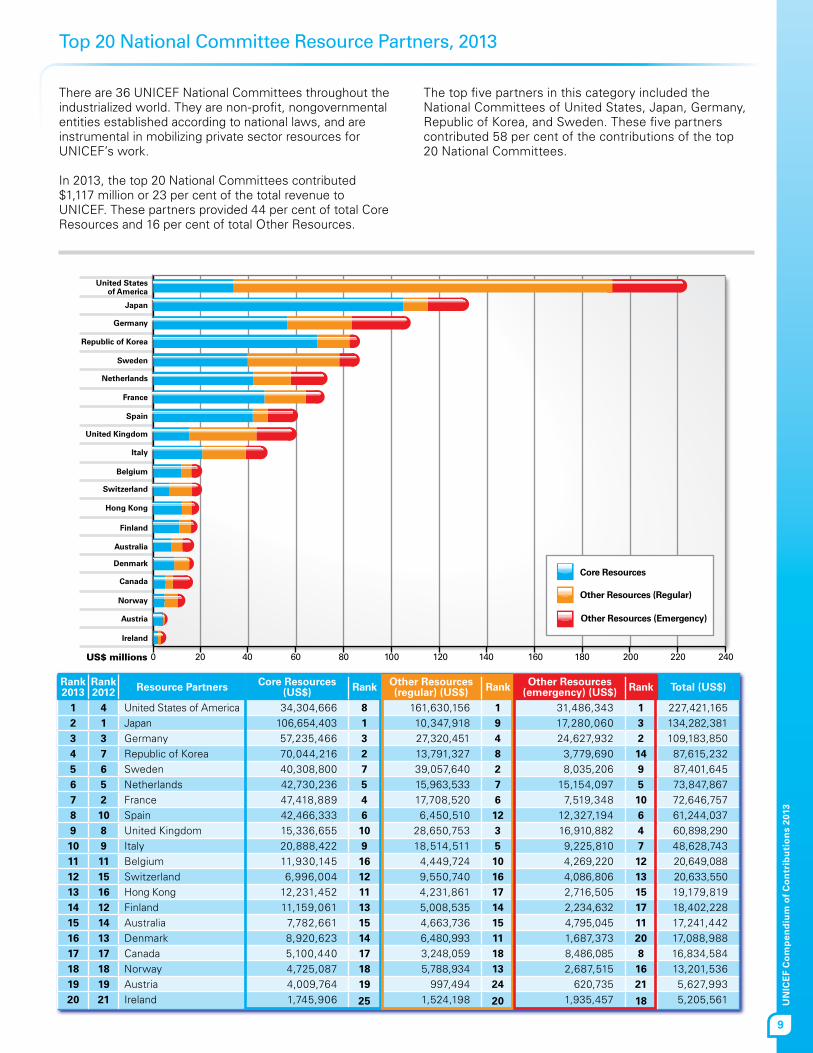
There are 36 UNICEF National Committees throughout the industrialized world. They are non-profit, nongovernmental entities established according to national laws, and are instrumental in mobilizing private sector resources for UNICEF’s work.
In 2013, the top 20 National Committees contributed $1,117 million or 23 per cent of the total revenue to UNICEF. These partners provided 44 per cent of total Core Resources and 16 per cent of total Other Resources.
The top five partners in this category included the National Committees of United States, Japan, Germany, Republic of Korea, and Sweden. These five partners contributed 58 per cent of the contributions of the top 20 National Committees.
0 604020 10080 160140120 180 240220200
United Statesof America
Japan
Germany
Republic of Korea
Sweden
Netherlands
France
Spain
United Kingdom
Italy
Belgium
Switzerland
Hong Kong
Finland
Australia
Denmark
Canada
Norway
Austria
Ireland
Core Resources
Other Resources (Regular)
Other Resources (Emergency)
US$ millions
Rank 2013
Rank 2012 Resource Partners Core Resources
(US$) Rank other Resources(regular) (US$) Rank other Resources
(emergency) (US$) Rank Total (US$)
1 4 United States of America 34,304,666 8 161,630,156 1 31,486,343 1 227,421,165 2 1 Japan 106,654,403 1 10,347,918 9 17,280,060 3 134,282,381 3 3 Germany 57,235,466 3 27,320,451 4 24,627,932 2 109,183,850 4 7 Republic of Korea 70,044,216 2 13,791,327 8 3,779,690 14 87,615,232 5 6 Sweden 40,308,800 7 39,057,640 2 8,035,206 9 87,401,645 6 5 Netherlands 42,730,236 5 15,963,533 7 15,154,097 5 73,847,867 7 2 France 47,418,889 4 17,708,520 6 7,519,348 10 72,646,757 8 10 Spain 42,466,333 6 6,450,510 12 12,327,194 6 61,244,037 9 8 United Kingdom 15,336,655 10 28,650,753 3 16,910,882 4 60,898,290 10 9 Italy 20,888,422 9 18,514,511 5 9,225,810 7 48,628,743 11 11 Belgium 11,930,145 16 4,449,724 10 4,269,220 12 20,649,088 12 15 Switzerland 6,996,004 12 9,550,740 16 4,086,806 13 20,633,550 13 16 Hong Kong 12,231,452 11 4,231,861 17 2,716,505 15 19,179,819 14 12 Finland 11,159,061 13 5,008,535 14 2,234,632 17 18,402,228 15 14 Australia 7,782,661 15 4,663,736 15 4,795,045 11 17,241,442 16 13 Denmark 8,920,623 14 6,480,993 11 1,687,373 20 17,088,988 17 17 Canada 5,100,440 17 3,248,059 18 8,486,085 8 16,834,584 18 18 Norway 4,725,087 18 5,788,934 13 2,687,515 16 13,201,536 19 19 Austria 4,009,764 19 997,494 24 620,735 21 5,627,993 20 21 Ireland 1,745,906 25 1,524,198 20 1,935,457 18 5,205,561
10
UN
ICE
F C
om
pen
diu
m o
f C
on
trib
uti
on
s 20
13Core Resources (Core) by type of Resource Partner, 2013
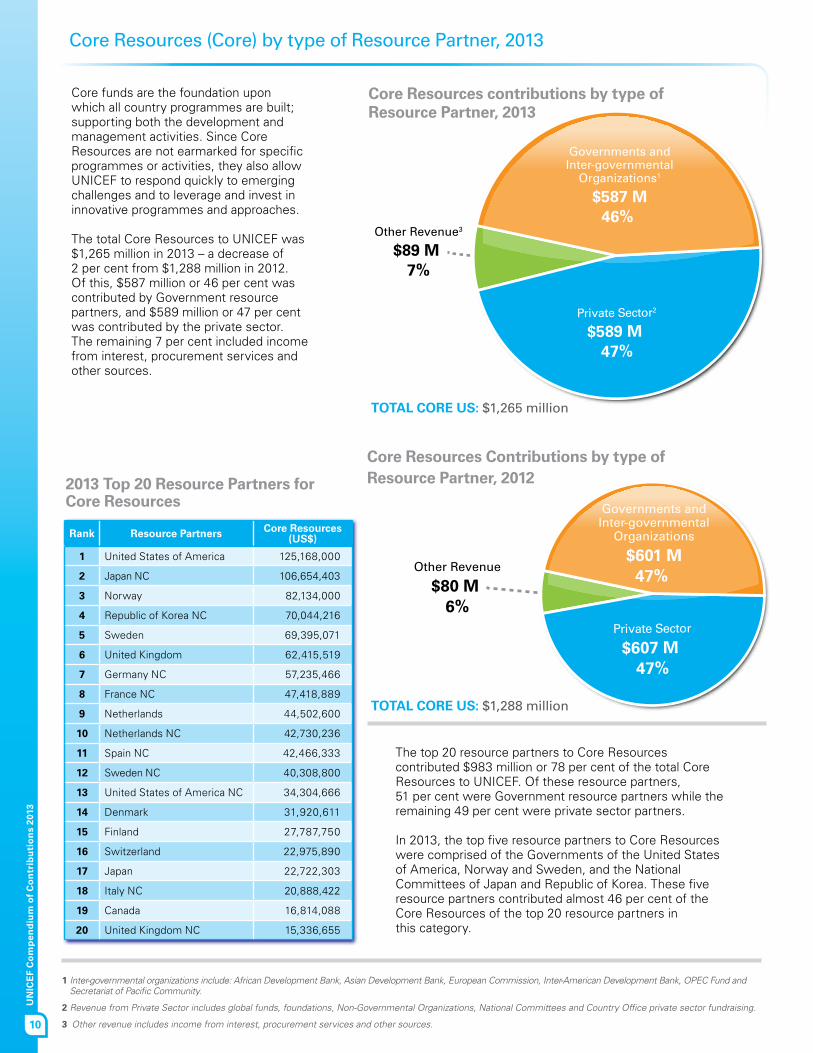
Core funds are the foundation upon which all country programmes are built; supporting both the development and management activities. Since Core Resources are not earmarked for specific programmes or activities, they also allow UNICEF to respond quickly to emerging challenges and to leverage and invest in innovative programmes and approaches.
The total Core Resources to UNICEF was $1,265 million in 2013 – a decrease of 2 per cent from $1,288 million in 2012. Of this, $587 million or 46 per cent was contributed by Government resource partners, and $589 million or 47 per cent was contributed by the private sector. The remaining 7 per cent included income from interest, procurement services and other sources.
The top 20 resource partners to Core Resources contributed $983 million or 78 per cent of the total Core Resources to UNICEF. Of these resource partners, 51 per cent were Government resource partners while the remaining 49 per cent were private sector partners.
In 2013, the top five resource partners to Core Resources were comprised of the Governments of the United States of America, Norway and Sweden, and the National Committees of Japan and Republic of Korea. These five resource partners contributed almost 46 per cent of the Core Resources of the top 20 resource partners in this category.
1 Inter-governmental organizations include: African Development Bank, Asian Development Bank, European Commission, Inter-American Development Bank, OPEC Fund and Secretariat of Pacific Community.
2 Revenue from Private Sector includes global funds, foundations, Non-Governmental Organizations, National Committees and Country Office private sector fundraising.
3 Other revenue includes income from interest, procurement services and other sources.
2013 Top 20 Resource Partners for Core Resources
Core Resources contributions by type of Resource Partner, 2013
Rank Resource Partners Core Resources (US$)
1 United States of America 125,168,000
2 Japan NC 106,654,403
3 Norway 82,134,000
4 Republic of Korea NC 70,044,216
5 Sweden 69,395,071
6 United Kingdom 62,415,519
7 Germany NC 57,235,466
8 France NC 47,418,889
9 Netherlands 44,502,600
10 Netherlands NC 42,730,236
11 Spain NC 42,466,333
12 Sweden NC 40,308,800
13 United States of America NC 34,304,666
14 Denmark 31,920,611
15 Finland 27,787,750
16 Switzerland 22,975,890
17 Japan 22,722,303
18 Italy NC 20,888,422
19 Canada 16,814,088
20 United Kingdom NC 15,336,655
Other Revenue3
$89 M 7%
Governments andInter-governmental
Organizations1
$587 M46%
Private Sector2
$589 M 47%
Other Revenue
$80 M 6%
Governments andInter-governmental
Organizations
$601 M47%
Private Sector
$607 M 47%
ToTAl CoRE US: $1,265 million
Core Resources Contributions by type of Resource Partner, 2012
ToTAl CoRE US: $1,288 million

11
UN
ICE
F C
om
pen
diu
m o
f C
on
trib
uti
on
s 20
13
Other Resources (OR) by type of Resource Partner, 2013
Other Resources are received for a specific strategic priority or country/region. These are further categorized as Other Resources - Regular (ORR) and Other Resources – Emergency (ORE). The total OR revenue to UNICEF increased by 35 per cent (or $931 million) from $2,657 million in 2012 to $3,588 million in 2013. The total OR consisted of $2,256 million or 63 per cent in ORR and $1,332 million or 37 per cent in ORE.
Of the total OR, $2,740 million or 76 per cent was contributed by the public sector. This was mainly driven by Government and Inter-governmental resource partners as well as Inter-organizational Arrangements. Private sector contributed $848 million or 24 per cent of the total OR revenue. This was primarily contributed by National Committees as well as Global Programme Partners and other Non-governmental Organizations.
The top 20 resource partners to OR contributed $2,779 million or 77 per cent of the total OR revenue to UNICEF. Of these top 20 partners, 86 per cent came from public sector resource partners while the remaining 14 per cent from the private sector.
The top five OR resource partners were comprised of the Governments of the United Kingdom, Japan and the United States of America; the European Commission; and the National Committee of the United States. These five partners contributed more than half of the OR contributions of the top 20 OR resource partners.
1 Inter-governmental organizations include: African Development Bank, Asian Development Bank, European Commission, Inter-American Development Bank, OPEC Fund and Secretariat of Pacific Community.
2 Revenue from Private Sector includes global funds, foundations, Non-Governmental Organizations, National Committees and country office private sector fundraising.
3 Inter-organizational Arrangements include: FAO, IFAD, ILO, PAHO, UNAIDS, UNAMI, UNDP, UNDPKO, UNFPA, UNHCR, UN Human Security Trust Fund, UNMAS, UNOCHA, UNODC, UNOPS, UN Secretariat, UN Women, WFP, WHO, World Bank (including Global Partnership for Education), as well as UN Joint Programme where UNICEF is the Administrative Agent.
2013 Top 20 Resource Partners and Funding Sources - oR
other Resources Contributions by Type of Resource Partner, 2012
other Resources contributions by type of Resource Partner, 2013
Rank Resource Partners other Resources (US$)
1 United Kingdom 492,971,693
2 European Commission 431,364,861
3 Japan 240,296,333
4 United States of America 200,187,246
5 United States of America NC 193,116,499
6 Norway 159,172,187
7 Canada 144,735,729
8 Sweden 137,040,973
9 Netherlands 131,722,035
10 UNOCHA 125,914,243
11 UNDP 83,714,004
12 Kuwait 55,000,000
13 Australia 53,783,349
14 Global Partnership for Education 53,197,127
15 Germany NC 51,948,384
16 Germany 51,101,345
17 GAVI Alliance 47,402,896
18 Sweden NC 47,092,845
19 United Kingdom NC 45,561,635
20 United Nations Joint Programme 33,853,727
Inter-Organizational Arrangements3
$334 M 9%
Governments andInter-governmental
Organizations1
$2,406 M67%
Private Sector2
$848 M 24%
Inter-Organizational Arrangements
$349 M 13%
Governments andInter-governmental
Organizations
$1,671 M63%
Private Sector
$637 M24%
ToTAl oR US: $2,657 million
ToTAl oR US: $3,588 million

12
UN
ICE
F C
om
pen
diu
m o
f C
on
trib
uti
on
s 20
13Other Resources - Regular (ORR) by type of Resource Partner, 2013
The total ORR revenue to UNICEF increased by 23 per cent (or $422 million) from $1,834 million in 2012 to $2,256 million in 2013. Of this, $1,603 million or 71 per cent was mobilized from the public sector. This was mainly driven by Government and Inter-governmental resource partners as well as Inter-organizational Arrangements. Private sector contributed $653 or 29 per cent of the total ORR revenue. This was primarily contributed from National Committees as well as Global Programme Partners and other Non-governmental Organizations.
The top 20 resource partners to ORR contributed $1,741 million or 77 per cent of the total ORR revenue to UNICEF. Of these top 20 Resource Partners, 79 per cent were public sector partners while the remaining 21 per cent were private sector resource partners.
The top five ORR Resource Partners were comprised of the Governments of the United Kingdom, Norway and Netherlands; the European Commission; and the National Committee of the United States. These five partners contributed more than half of the ORR contributions of the top 20 ORR resource partners.
1 Inter-governmental Organizations include: African Development Bank, Asian Development Bank, European Commission, Inter-American Development Bank, OPEC Fund and Secretariat of Pacific Community.
2 Revenue from Private Sector includes global funds, foundations, Non-Governmental Organizations, National Committees and Country Office private sector fundraising.
3 Inter-organizational Arrangements include: FAO, IFAD, ILO, PAHO, UNAIDS, UNAMI, UNDP, UNDPKO, UNFPA, UNHCR, UN Human Security Trust Fund, UNMAS, UNOCHA, UNODC, UNOPS, UN Secretariat, UN Women, WFP, WHO, World Bank (including Global Partnership for Education), as well as UN Joint Programme where UNICEF is the Administrative Agent.
4 Inter-organizational Arrangements via UNDP (Including MDTFs and Delivering as One funding and contribution from the Global Fund to fight AIDS, Tuberculosis, and Malaria received via UNDP).
2013 Top 20 Resource Partners and Funding Sources - oRR
other Resources Regular Contributions by type of Resource Partner, 2012
other Resources Regular contributions by type of Resource Partner, 2013
Rank Resource Partners other Resources Regular (US$)
1 United Kingdom 318,322,693
2 European Commission 231,268,510
3 United States of America NC 161,630,156
4 Norway 147,121,718
5 Netherlands 127,972,035
6 Canada 118,413,908
7 Sweden 106,202,506
8 United States of America 86,903,155
9 Japan 55,447,052
10 Global Partnership for Education 53,197,127
11 GAVI Alliance 47,402,896
12 UNDP4 44,853,921
13 Sweden NC 39,057,640
14 Australia 35,490,253
15 United Nations Joint Programme 33,853,727
16 Rotary International 28,789,686
17 United Kingdom NC 28,650,753
18 Germany NC 27,320,451
19 United Nations Foundation Inc. 25,825,339
20 UNFPA 23,081,440
Inter-Organizational Arrangements3
$174 M 8%
Governments andInter-governmental
Organizations1
$1,429 M63%
Private Sector2
$653 M 29%
Inter-Organizational Arrangements
$172 M 9%
Governments andInter-governmental
Organizations
$1,094 M60%
Private Sector
$568 M31%
ToTAl oRR US: $2,256 million
ToTAl oRR US: $1,834 million

13
UN
ICE
F C
om
pen
diu
m o
f C
on
trib
uti
on
s 20
13
Other Resources - Emergency (ORE) by type of Resource Partner, 2013
In 2013, the total ORE revenue to UNICEF was $1,332 million, representing an increase of 62 per cent (or $509 million) from the 2012 level of $823 million. This increase is attributed primarily to funding for humanitarian crises in the Philippines and the Syrian Arab Republic. UNICEF sought $1.8 billion in 2013 for humanitarian action.
Of the total ORE revenue in 2013, $1,138 million or 85 per cent was contributed by the public sector, primarily driven by Government and Inter-governmental resource partners as well as Inter-organizational Arrangements. Private sector (through National Committees and Country Office Fundraising) contributed $195 million or 15 per cent of the total ORE revenue.
The top 20 resource partners to ORE contributed $1,165 million or 87 per cent of the total ORE revenue to UNICEF. Of these top 20 resource partners, 90 per cent were public sector partners while the remaining 10 per cent were private sector resource partners.
The top five ORE resource partners were comprised of the European Commission; the Governments of Japan, the United Kingdom, and the United States of America; as well as UNOCHA. These five partners contributed 69 per cent of the ORE contributions of the top 20 ORE resource partners.
1 Inter-governmental Organizations include: African Development Bank, Asian Development Bank, European Commission, Inter-American Development Bank, OPEC Fund and Secretariat of Pacific Community.
2 Revenue from Private Sector includes global funds, foundations, Non-Governmental organizations, National Committees and Country Office private sector fundraising.
3 Inter-organizational Arrangements include: FAO, IFAD, ILO, PAHO, UNAIDS, UNAMI, UNDP, UNDPKO, UNFPA, UNHCR, UN Human Security Trust Fund, UNMAS, UNOCHA, UNODC, UNOPS, UN Secretariat, UN Women, WFP, WHO, World Bank (including Global Partnership for Education), as well as UN Joint Programme where UNICEF is the Administrative Agent.
4 Contributions received through UNOCHA mostly originate from the same group of major UNICEF Government and Inter-governmental donors and mainly CERF funding.
5 Inter-organizational Arrangements via UNDP (Including MDTFs and Delivering as One funding).
2013 Top 20 Resource Partners and Funding Sources - oRE
Rank Resource Partners other Resources Emergency (US$)
1 European Commission 200,096,350
2 Japan 184,849,281
3 United Kingdom 174,649,000
4 UNOCHA4 125,914,243
5 United States of America 113,284,090
6 Kuwait 55,000,000
7 Germany 40,854,324
8 UNDP5 38,860,083
9 United States of America NC 31,486,343
10 Sweden 30,838,467
11 Canada 26,321,820
12 Germany NC 24,627,932
13 Australia 18,293,096
14 Japan NC 17,280,060
15 United Kingdom NC 16,910,882
16 Denmark 15,448,483
17 Netherlands NC 15,154,097
18 Spain NC 12,327,194
19 Norway 12,050,469
20 Finland 10,988,447
other Resources Emergency contributions by type of Resource Partner, 2012
other Resources Emergency contributions by type of Resource Partner, 2013
Inter-Organizational Arrangements3
$160 M 12%
Governments andInter-governmental
Organizations1
$977 M73%
Private Sector2
$195 M 15%
Inter-Organizational Arrangements
$177 M 21%
Governments andInter-governmental
Organizations
$577 M70%
Private Sector
$69 M8%
ToTAl oRE US: $823 million
ToTAl oRE US: $1,332 million

14
UN
ICE
F C
om
pen
diu
m o
f C
on
trib
uti
on
s 20
13Thematic revenue, 2013
Thematic funds are soft-earmarked pooled funds categorized as Other Resources (OR) that directly support and achievement of key results aligned to the Strategic Plan focus areas and humanitarian action. These funds allow long-term planning, sustainability and savings in transaction costs for both UNICEF and resource partners. In 2013, overall thematic funding for the five Strategic Plan focus areas was $211 million (an increase of 7 per cent over 2012), and thematic humanitarian action was $148 million (increase by 66 per cent).
Thematic funding constituted only 10 per cent of total OR revenue in 2013. UNICEF looks to work with its partners to strengthen resourcing of thematic windows, in line with QCPR shared commitments. UNICEF continued to enhance
thematic fund allocations, programme implementation, and quality results reporting.
The top 10 resource partners to thematic funding contributed $269 million or 75 per cent of the total thematic revenue to UNICEF. These resource partners provided 84 per cent of total thematic funding for the Strategic Plan focus areas and 62 per cent of humanitarian action thematic funding.
The top three resource partners comprised Governments of Norway and Sweden, and the National Committee of the United States. These three partners contributed almost half of the total contributions of the top 10 resource partners to thematic funding.
oR Contributions 2006-13: Thematic vs Non-thematic
Top 10 Resource Partners to Thematic Funding Thematic Revenue, 2013: US$359 million
Policy Advocacyand Partnerships
$8 M 2%
HIV-AIDS &Children$10 M
3%
Child Protection$17 M
5%
Humanitarian Action
$148 M 41%
Young Child Survival and Development
$64 M 18%
Basic Education and Gender Equality
$112 M 31%
100.3
58.4
17.9 17.5 14.8 14.2 14.1 11.4 11.0 9.9
92.3
58.4
1.8 12.2
0.6 0.7 7.6 3.4
8.0
16.1 17.3 2.6 13.6 13.5 3.8 11.0 6.5
0
10
20
30
40
50
60
70
80
90
100
110
Nor
way
Sw
eden
Uni
ted
Sta
tes
Fund
NC
Japa
n N
C
Rep
ublic
of
Kor
ea N
C
Ger
man
y N
C
Uni
ted
Kin
gdom
NC
Net
herl
ands
N
C
Finl
and
Spa
in N
C
Thematic ORE
Thematic ORR
Total
9% 11% 9% 11% 9% 7% 7% 6%
8% 4% 6% 3% 12%
7% 3% 4%
82% 85% 85% 87% 79% 86% 89% 90%
0%
10%
20%
30%
40%
50%
60%
70%
80%
90%
100%
2006 2007 2008 2009 2010 2011 2012 2013
$1,725M $1,907M $2,305M $2,190M $2,717M $2,633M $2,657M $3,588M
Thematic ORR Thematic ORE Non-thematic
Cha
nge
in a
ccou
ntin
g po
licy
from
UN
SA
S to
IPS
AS
may
not
allo
w
mea
ning
ful c
ompa
rison
s be
twee
n 20
12 fi
gure
s an
d pr
ior y
ears
.

15
UN
ICE
F C
om
pen
diu
m o
f C
on
trib
uti
on
s 20
13
Thematic funds support UNICEF’s drive for results
Whether contributed at the global, regional or country level, thematic funding is UNICEF’s first choice when resource partners choose to earmark contributions. These funds are allocated to achieve results aligned to UNICEF’s Strategic Plan. The strategic, aggregated results that thematic funds will allow include, as examples:
� ≤ 20 under-five mortality rate (as pledged in A Promise Renewed) worldwide by 2035
� 90 per cent of children under 15 years access to HIV prevention and treatment globally by 2017
�All countries with policies on inclusive education covering children with disabilities by 2017
To achieve these results, a funding pool has been established for each of the Strategic Plan 2014-17 outcome areas as well as for humanitarian action and gender. The specific gender equality pool responds to the Executive Board’s call for UNICEF to give prominence to the empowerment of girls and women, and gives resource partners the option to contribute directly in support of this work.
UNICEF is committed to increasing the support it receives through thematic funding pools, and encourages resource partners to fund through these windows in line with commitments made in the QCPR and for optimized efficiency in realizing the rights of every child, especially the most disadvantaged.
For more information on the benefits and operating mechanism of thematic pooled funds, see A Guide to UNICEF Thematic Funding (available on PARMO’s internet pages: www.unicef.org/parmo/files/A_Guide_ to_UNICEF_Thematic_Funding_2014-17_14Feb2014.pdf).
Case study - Expanding Access for Children with Disabilities in Bhutan, 2013
Based on a groundbreaking study showing critical prevalence data on children with disabilities, UNICEF supported the Bhutanese Ministry of Education in drafting a policy on Special Needs Education. In parallel, UNICEF worked with the Government to raise awareness on how to address the needs and improve the education of children with disabilities. This included supporting pre-service teacher training programmes and conducting trainings on the UN Convention on the Rights of Persons with Disabilities. As a result of these efforts:
�A national plan to provide education for the deaf has been developed and approved;
�A steering group of teachers, education officials and Civil Society Organization members has been established to promote the rights of persons with disabilities;
� Two special units and eight schools are now officially recognized as “inclusive schools”, offering education to 424 children with disabilities across the country;
�Better monitoring tools have been developed. Rapid Neurodevelopment Assessment (RNDA) and the Rapid Functional Assessment (RFA) have been integrated in the monitoring practices of education and health personnel as well as early childhood program facilitators.
Thanks to this momentum, Bhutan has been recognized as a model in the South Asia region and beyond, and a joint seminar organized with the Ministry of Education provided a platform for sharing knowledge and good practices of inclusive education, focusing on children with disabilities from Bhutan and across the region, providing a concrete set of recommendations to participating countries. Thematic funds complemented Core and Other Resources to make these results possible.UNICEF Strategic Plan 2014-17
Thematic Windows:
GENdER
HUMANITARIAN ACTIoN
oUTCoME AREAS
CRoSS-CUTTING AREAS
1HEALTH
2HIV & AIDS
3WASH
4NUTRITION
5EDUCATION
6CHILD
PROTECTION
7SOCIAL
INCLUSION
SURvIvEFRoM ARRIvAl
To THRIvEINTo AdUlTHood

16
UN
ICE
F C
om
pen
diu
m o
f C
on
trib
uti
on
s 20
13Contributions received through Inter-organizational Arrangements, 2007-131
UNICEF continued its participation in UN coherence and Inter-organizational Partnership Arrangements through a variety of pooled funds and Multi-Donor Trust Funds (MDTFs). Contributions from Inter- organizational Arrangements fell by 4 per cent (or $15 million) from $349 million in 2012 to $334 in 2013.
The leading contributors to UNICEF included UNOCHA, UNDP, the Global Partnership for Education, UN Joint Programme, and UNFPA. Funding received from the Central Emergency Response Fund (CERF) totaled $117 million.
1 Inter-organizational Arrangements include: FAO, IFAD, ILO, PAHO, UNAIDS, UNAMI, UNDP, UNDPKO, UNFPA, UNHCR, UN Human Security Trust Fund, UNMAS, UNOCHA, UNODC, UNOPS, UN Secretariat, UN Women, WFP, WHO, World Bank (including Global Partnership for Education), as well as UN Joint Programme where UNICEF is the Administrative Agent.
2 Other MDTFs include Sierra Leone MDTF, Darfur Peace & Stability Fund, UNPRPD, Un Action Against Sexual Violence, Nepal UN Peace Fund, UN Trust Fund to End Violence against Women and Human Rights Mainstreaming Trust Fund.
Multi-donor Trust Funds, 2013 (excluding CERF) (US$ Millions)
Inter-organizational Arrangements 2009-13 (US$ Millions)
59 93
137 101 110
134
99
256
296 307
356 349334
109
121
102 110 83
98
94
98
104
129 117
0
50
100
150
200
250
300
350
400
2008 2009 2010 2011 2012 2013
Central Emergency Response Fund (CERF)
Multi-Donor Trust Funds (MDTFs)
Other Inter-organizational Arrangements
37.0
15.5
9.6
8.8
8.5 3.3
Joint Programmes via MPTFO
ERF
Other MDTF2
CHF
One Fund
Peacebuilding Fund
50
100
150
200
250
300
350
400
2007 2008 2009 2010 2011 20132012
234
175
59
256
165
91
296
156
140
356
160
196
307
163
145
349
177
172
334
160
174US
$ m
illio
ns
ORR
ORE
Total
ToTAl US: $334 million
Cha
nge
in a
ccou
ntin
g po
licy
from
UN
SA
S t
o IP
SA
S m
ay n
ot a
llow
m
eani
ngfu
l com
paris
ons
betw
een
2012
figu
res
and
prio
r ye
ars.

17
UN
ICE
F C
om
pen
diu
m o
f C
on
trib
uti
on
s 20
13
Total UNICEF revenue, 2012-13 (US$ millions)
2012 2013 Change
1. Governments and Inter-governmental Organizations1 2,272 2,993 722 32%
a) Core Resources (Net) 601 587 -14 -2%
b) other Resources 1,671 2,406 736 44%
i. Regular 1,094 1,429 336 31%
ii. Emergencies 577 977 193 16%
2 . National Committees, non-governmental, and other Private Sector Sources2 1,244 1,437 193 16%
a) Core Resources 607 589 -18 -3%
b) other Resources 637 848 211 33%
i. Regular 568 653 85 15%
ii. Emergencies 69 195 126 183%
3 . Inter-organizational Arrangements3 349 334 -16 -4
a) Core Resources
b) other Resources 349 334 -16 -4
i. Regular 172 174 2 1%
ii. Emergencies 177 160 -17 -10%
SUB-ToTAl INCoME 3,865 4,764 899 23%
4 . Other revenue (Core Resources)4 80 89 9 0%
GRANd ToTAl INCoME 3,945 4,853 908 23%
1 Inter-governmental Organizations include: African Development Bank, Asian Development Bank, European Commission, Inter-American Development Bank, OPEC Fund and Secretariat of Pacific Community.
2 Revenue from Private Sector includes global funds, foundations, Non-governmental Organizations, National Committees and Country Office private sector fundraising.
3 Inter-organizational Arrangements include: FAO, IFAD, ILO, PAHO, UNAIDS, UNAMI, UNDP, UNDPKO, UNFPA, UNHCR, UN Human Security Trust Fund, UNMAS, UNOCHA, UNODC, UNOPS, UN Secretariat, UN Women, WFP, WHO, World Bank (including Global Partnership for Education), as well as UN Joint Programme where UNICEF is the Administrative Agent.
4 Other revenue includes income from interest, procurement services and other sources.

18
UN
ICE
F C
om
pen
diu
m o
f C
on
trib
uti
on
s 20
13Total UNICEF revenue by Resource Partner, 20131
Core Resources Other Resources2
Resource Partner
Public sector Private sector3 Public sector Private sector
TotalGovernment
Inter-organizational Arrangments
National Committees
Other contributions Government
Inter-organizational Arrangments
National Committees
Other contributions
Afghanistan 4,181 - - - - - - - 4,181Algeria - - - - - - - 12,437 12,437 Andorra 97,998 - 90,119 - - - 324,768 - 512,884 Angola 1,660,000 - - - - - - - 1,660,000 Argentina 180,000 - - 5,488,548 - - - 16,396,793 22,065,342 Armenia 116,590 - - - - - - - 116,590 Australia - - 7,782,661 - 53,783,349 - 9,458,781 - 71,024,791 Austria 1,532,568 - 4,009,764 - 2,164,380 - 1,618,229 - 9,324,941 Azerbaijan - - - - - - - 61,362 61,362 Bangladesh 34,500 - - - - - - - 34,500 Barbados 189,000 - - - - - - 66,885 255,885 Belgium 13,865,591 - 11,930,145 - 20,648,960 - 8,718,944 - 55,163,639 Belize - - - - 112,500 - - - 112,500 Benin 24,124 - - - - - - - 24,124 Bolivia 40,000 - - - 225,000 - - - 265,000 Bosnia and Herzegovina 3,698 - - - - - - 17,906 21,604 Brazil 1,632,402 - - 84,874 2,992,260 - - 8,284,345 12,993,880 Bulgaria 67,500 - - 35,292 - - - 772,466 875,258 Burkina Faso 12,425 - - - - - - - 12,425 Cabo Verde 350,000 - - - - - - - 350,000 Cameroon 95,900 - - - - - - - 95,900 Canada 16,814,088 - 5,100,440 - 144,735,729 - 11,734,144 - 178,384,400 Central African Republic 51,576 - - - 316,497 - - - 368,073 Chad 936 - - - - - - - 936Chile 77,000 - - 128,693 75,195 - - 1,759,953 2,040,842 China 1,595,626 - - 21,090 - - - 8,483,121 10,099,837 Colombia - - - - - - - 3,459,416 3,459,416 Comoros 70,000 - - - - - - - 70,000 Congo 748,450 - - - - - - - 748,450 Democratic People’s Republic of Korea 785,000 - - - - - - - 785,000
Democratic Republic of the Congo 320,642 - - - 1,092,758 - - - 1,413,400
Costa Rica 19,643 - - 1,408 - - - 25,241 46,292 Côte d’Ivoire 12,600 - - - 2,230,253 - - - 2,242,853 Croatia 45,000 - 527,053 - - - 2,429,372 3,001,425 Cuba 10,000 - - - - - - - 10,000 Cyprus 6,750 - - 457,408 - - - - 464,158 Czech Republic - - 2,187,527 - 98,683 - 780,725 - 3,066,935 Denmark 31,920,611 - 8,920,623 - 27,742,425 - 8,168,365 - 76,752,024 Dominican Republic 88,000 - - 93 - - - 144,413 232,506 Ecuador - - - 200,677 - - - 1,962,132 2,162,810 Egypt - - - 416 771,460 - - 10,074 781,949 Estonia 77,922 - 2,696 - 1,005,909 - 10,011 - 1,096,538 Ethiopia 355,880 - - - - - - - 355,880 Fiji 3,390 - - - - - - - 3,390Finland 27,787,750 - 11,159,061 - 18,912,279 - 7,243,167 - 65,102,257 France 4,403,578 - 47,418,889 - 12,537,361 - 25,227,868 - 89,587,697 Gabon - - - - 2,500 - - - 2,500Georgia 155,000 - - - - - - - 155,000 Germany 8,662,446 - 57,235,466 - 51,101,345 - 51,948,384 - 168,947,640 Ghana 148,512 - - - - - - - 148,512 Greece - - 2,804,505 - - - 758,108 - 3,562,613 Guatemala - - - - - - - 720,027 720,027 Guinea 350,000 - - - - - - - 350,000 Guinea-Bissau 621,000 - - - 168,021 - - - 789,021 Guyana 1,005 - - - - - - - 1,005Honduras 29,996 - - - - - - - 29,996 Hong Kong, China - - 12,231,452 - - - 6,948,366 - 19,179,819 Hungary 108,563 - 102,430 - 168,178 - 397,479 - 776,651 Iceland 660,873 - 2,120,866 - 870,035 - 894,080 - 4,545,853 India 806,780 - - 30,021 547,326 - - 4,654,153 6,038,280 Indonesia 204,962 - - 297,099 - - - 5,776,835 6,278,897 Iran (Islamic Republic of) 109,542 - - 78,725 - - - 81 188,348 Iraq 48,785 - - - - - - - 48,785 Ireland 10,472,548 - 1,745,906 - 7,738,715 - 3,459,655 - 23,416,824 Israel 100,000 - - - - - 71,746 50,000 221,746 Italy 3,926,700 - 20,888,422 - 9,774,086 - 27,740,321 - 62,329,529 Japan 22,722,303 - 106,654,403 - 240,296,333 - 27,627,978 - 397,301,016 Jordan 2,000,000 - - - - - - 29,657 2,029,657 Kazakhstan 176,970 - - - - - - - 176,970 Kenya 150,000 - - 247 7,000,242 - - 100,036 7,250,525 Kuwait 200,000 - - - 55,000,000 - - - 55,200,000 Kyrgyzstan 50,000 - - - 680,000 - - - 730,000 Lao People’s Democratic Republic 5,350 - - - - - - - 5,350
Lebanon - - - - - - - 83,229 83,229 Lesotho 120,000 - - - - - - - 120,000 Libya - - - - 207,467 - - - 207,467 Liechtenstein 26,455 - - - 137,817 - - - 164,272 Luxembourg 3,595,653 - 894,748 - 5,676,429 - 1,076,158 - 11,242,987 Malaysia 362,735 - - 4,526,774 100,000 - - 5,443,646 10,433,156 Maldives 120,000 - - - - - - - 120,000 Mali 108,500 - - - - - - - 108,500 Malta - - - - 32,595 - - - 32,595 Mexico - - - 57,279 - - - 4,532,782 4,590,061 Monaco 10,430 - - - 191,571 - - - 202,001 Mongolia 105,391 - - - - - - - 105,391 Morocco 128,277 - - - 118,890 - - 4,411 251,578
19
UN
ICE
F C
om
pen
diu
m o
f C
on
trib
uti
on
s 20
13
Total UNICEF revenue by Resource Partner, 20131 (continued)
Core Resources Other Resources2
Resource Partner
Public sector Private sector3 Public sector Private sector
TotalGovernment
Inter-organizational Arrangments
National Committees
Other contributions Government
Inter-organizational Arrangments
National Committees
Other contributions
Mozambique 9,500 - - - - - - - 9,500Myanmar 93,303 - - - - - - - 93,303 Namibia 121,000 - - - - - - - 121,000 Netherlands 44,502,600 - 42,730,236 - 131,722,035 - 31,117,630 - 250,072,502 New Zealand 4,830,900 - 1,833,865 - 3,550,074 - 3,110,387 - 13,325,226 Nicaragua 38,500 - - - - - - 70,000 108,500 Niger 4,000 - - - - - - - 4,000Nigeria 1,427,939 - - 739 21,840,345 - - 735,598 24,004,619 Norway 82,134,000 - 4,725,087 - 159,172,187 - 8,476,449 - 254,507,723 Oman - - - - 996,755 - - 2,797 999,553 Panama 741,750 - - - 300,000 - - 10,160 1,051,910 Papua New Guinea - - - - 325,728 - - - 325,728 Paraguay - - - - - - - 53,505 53,505 Peru - - - 48,484 - - - 775,763 824,247 Philippines 58,703 - - 825,379 - - - 6,011,045 6,895,126 Poland - - 418,116 - 597,022 - 1,776,689 - 2,791,827 Portugal - - 2,971,327 - - - 2,034,475 - 5,005,802 Qatar 100,000 - - - 2,396,458 - - 4,396,459 6,892,917 Republic of Korea 3,200,000 - 70,044,216 - 23,276,747 - 17,571,017 - 114,091,980 Republic of Moldova 60,000 - - - - - - - 60,000 Romania 50,000 - - 578 140,000 - - 709,793 900,371 Russian Federation 1,000,000 - - 588 6,100,000 - - 25,995 7,126,582 Samoa 1,000 - - - - - - - 1,000San Marino - - 1,823 - - - 105,416 - 107,239 Sao Tome and Principe 19,500 - - - - - - - 19,500 Saudi Arabia 1,144,200 - - 765 8,231,145 - - 802,575 10,178,686 Senegal 239,500 - - - - - - - 239,500 Serbia 51,000 - - 260,903 - - - 612,269 924,172 Sierra Leone 384,000 - - - 1,685,027 - - - 2,069,027 Singapore 50,000 - - - - - - - 50,000 Slovakia 13,405 - 41,873 - 80,932 - 125,595 - 261,805 Slovenia 30,400 - 1,116,704 - 81,522 - 516,009 - 1,744,635 Somalia 733,400 - - - - - - - 733,400 South Africa 216,625 - - - 361,411 - - 1,407,289 1,985,325 South Sudan 253,350 - - - - - - - 253,350 Spain 3,536,112 - 42,466,333 - 8,602,687 - 18,777,704 - 73,382,837 Sri Lanka 15,500 - - 10,177 - - - 14,097 39,774 Sudan 131,400 - - - - - - - 131,400 Sweden 69,395,071 - 40,308,800 137,040,973 - 47,092,845 - 293,837,690 Switzerland 22,975,890 - 6,996,004 - 23,055,075 - 13,637,546 - 66,664,515 Tajikistan 32,400 - - - - - - - 32,400 The former Yugoslav Republic of Macedonia - - - - - - - 26,306 26,306
United Republic of Tanzania 22,000 - - - - - - 50,000 72,000 Thailand 248,710 - - 2,315,546 - - - 14,231,851 16,796,108 Timor-Leste 100,000 - - - - - - - 100,000 Togo 26,000 - - - - - - - 26,000 Tunisia 25,316 - - - - - - - 25,316 Turkey 150,000 - 1,038,116 - - - 1,795,737 - 2,983,853 Turkmenistan 65,512 - - - - - - - 65,512 United States 125,168,000 - 34,304,666 - 200,187,246 - 193,116,499 - 552,776,411 Uganda 469,000 - - - - - - - 469,000 United Kingdom 62,415,519 - 15,336,655 - 492,971,693 - 45,561,635 - 616,285,502 Uruguay 93,850 - - 500,540 - - - 2,082,216 2,676,607 United Arab Emirates 100,000 - - 68,496 7,481,821 - - 2,667,678 10,317,996 Uzbekistan 310,000 - - - - - - - 310,000 Venezuela (Bolivarian Republic of) - - - 3,082,269 - - - 640,667 3,722,936
Viet Nam - - - 11,437 - - - 418,641 430,078 Zambia 257,520 - - - - - - - 257,520 Zimbabwe - - - - - - - 155,208 155,208 Other 10,021 - 1,661 491,294 - - - 651,973 1,154,949 Revenue adjustments (37,279) - 465,223 - 75,711,866 - (3,780,473) - 72,359,337 Subtotal 588,414,419 - 568,080,830 19,552,891 1,975,165,298 - 575,242,434 101,832,659 3,828,288,531
INTERGovERNMENTAl oRGANIzATIoNS
African Development Bank Group (AfDB) - - - - 1,000,000 - - - 1,000,000
Asian Development Bank (ADB) - - - - 117,000 - - - 117,000
European Commission (EC) - - - - 431,364,861 - - - 431,364,861 Inter-American Development Bank (IADB) - - - - 150,000 - - - 150,000
OPEC Fund - - - - 940,768 - - - 940,768 Secretariat of the Pacific Community - - - - 41,851 - - - 41,851
Revenue adjustments (1,015,273) - - - (2,724,709) - - - (3,739,982)Subtotal (1,015,273) - - - 430,889,770 - - - 429,874,497
NoN-GovERNMENTAl oRGANIzATIoNS
Bill & Melinda Gates Foundation - - - - - - - 2,476,989 2,476,989
GAVI Alliance - - - - - - - 47,402,896 47,402,896 Global Alliance for Improved Nutrition (GAIN) - - - - - - - 295,203 295,203
International Development Research Centre (IDRC) - - - - - - - 133,686 133,686
Micronutrient Initiative (MI) - - - - - - - 17,162,002 17,162,002

20
UN
ICE
F C
om
pen
diu
m o
f C
on
trib
uti
on
s 20
13Total UNICEF revenue by Resource Partner, 20131 (continued)
Core Resources Other Resources2
Resource Partner
Public sector Private sector3 Public sector Private sector
TotalGovernment
Inter-organizational Arrangments
National Committees
Other contributions Government
Inter-organizational Arrangments
National Committees
Other contributions
Rotary International - - - - - - - 28,789,686 28,789,686 Tetsuko Kuroyanagi, Japan - - - 401,768 - - - 602,652 1,004,419 The Alexander Bodini Foundation - - - - - - - 60,000 60,000
Global Fund to Fight Aids, Tuberculosis and Malaria (GFATM)
- - - - - - - 21,018,120 21,018,120
United Nations Foundation - - - - - - - 25,825,339 25,825,339 Other - - - 1,723 - - - 30,146,491 30,148,214
Revenue adjustments - - - 553,416 - - - (2,761,810) (2,208,394)
Subtotal - - - 956,907 - - - 171,151,253 172,108,160
INTER-oRGANIzATIoNAl ARRANGEMENTS
Food and Agriculture Organization of the United Nations (FAO)
- - - - - 285,018 - - 285,018
Global Partnership for Education - - - - - 53,197,127 - - 53,197,127
International Fund for Agricultural Development (IFAD)
- - - - - 763,738 - - 763,738
International Labour Organization (ILO) - - - - - 50,000 - - 50,000
Pan American Health Organization (PAHO) - - - - - 674,269 - - 674,269
United Nations Department of Peacekeeping Operations (UNDPKO)
- - - - - 99,777 - - 99,777
United Nations Office on Drugs and Crime (UNODC) - - - - - 954,617 - - 954,617
United Nations Entity for Gender Equality and the Empowerment of Women (UN Women)
- - - - - 10,000 - - 10,000
Joint United Nations Programme on HIV/AIDS (UNAIDS)
- - - - - 6,259,493 - - 6,259,493
United Nations Asssitance Mission for Iraq (UNAMI) - - - - - 25,000 - - 25,000
United Nations Development Programme (UNDP)
- - - - - 83,714,004 - - 83,714,004
United Nations Population Fund (UNFPA) - - - - - 23,243,604 - - 23,243,604
Office of the United Nations High Commissioner for Refugees (UNHCR)
- - - - - 309,711 - - 309,711
United Nations Mine Action Service (UNMAS) - - - - - 966,960 - - 966,960
United Nations Office for the Coordination of Humanitarian Affairs (OCHA)
- - - - - 125,914,243 - - 125,914,243
United Nations Office for Project Services (UNOPS) - - - - - 1,521,976 - - 1,521,976
United Nations Trust Fund for Human Security (UNTFHS)
- - - - - 3,837,444 - - 3,837,444
United Nations Development Group joint programmes
- - - - - 33,853,727 - - 33,853,727
United Nations Secretariat - - - - - 169,060 - - 169,060
World Food Programme (WFP) - - - - - 2,036,147 - - 2,036,147
World Health Organization (WHO) - - - - - 2,065,938 - - 2,065,938
World Bank - - - - - 575,229 - - 575,229
Other - 4,750 - - - - - - 4,750
Revenue adjustments - 93 - - - (6,377,399) - - (6,377,307)
Subtotal - 4,843 - - - 334,149,681 - - 334,154,523
other Revenue (Core Resources)4 - - - - - - - - 88,741,869
Grand Total 587,399,146 4,843 568,080,830 20,509,798 2,406,055,068 334,149,681 575,242,434 272,983,912 4,853,167,580
1 Provisional unaudited figures.
2 Includes both other resources ‘regular’ and other resources ‘emergency’.
3 Includes revenue from sales of cards and other UNICEF products and country office private sector fundraising.
4 Other revenue includes income from interest, procurement services and other sources.

21
UN
ICE
F C
om
pen
diu
m o
f C
on
trib
uti
on
s 20
13
Development Assistance Committee (DAC) Member Governments, total revenue to UNICEF Compared to ODA, ODA per capita and GNI per capita, 20131
This table is ranked by total contribution to UNICEF per capita. Total UNICEF contributions include Government and National Committee sources for any given country. In 2013, Norway maintained the first position with a
$50.90 per capita contribution, with Sweden in second position with $30.61 per capita contribution, followed by Luxembourg with $22.49 per capita.
1 The population figures are taken from the UNFPA State of the World Report 2013
2 Weighted average GNI per capita 2013
3 www.oecd.org accessed on April 8, 2013
104,318 59,549
86,200 44,872
61,513 48,285
48,316
84,003 39,358
39,710
45,66651,673
61,235 40,317
39,402 27,212
44,73751,867
29,30443,151
49,24433,330
21,97819,85221,137
18,01212,408
17,172
Norway Sweden
Luxembourg Iceland
Netherlands Denmark Finland
United KingdomSwitzerland
Ireland Canada Belgium Japan
Australia New Zealand
Republic of Korea
United States Germany
Spain FranceAustriaItaly
SlovakiaPoland
Czech RepublicGreece PortugalSlovenia
0 10,000 20,000 30,000 40,000 50,000 60,000 70,000 80,000 90,000 100,000 110,000
50.9 30.6
22.5
14.9 15.2
13.7 12.1
9.8 8.2
5.1 5.1 5.0
3.1 3.0 3.0
2.0 2.3
1.7 1.6 1.4 1.1 1.0 0.8 0.5 0.3 0.3 0.1 0.0
50 40 30 20 10 0 US$
Per Capita Revenue to UNICEF, 2013 Gross National Income Per Capita, 2013
GovtUS$
NatComUS$
TotalUS$
Total odAUS$ millions
odA per capita US$
GNI per capita US$
odA as % of GNI
donor Country 2013 2013 2013 20133 2013 20132 20133
Norway 48.26 2.64 50.90 5,581 1,116 104,318 1.07Sweden 21.50 9.10 30.61 5,831 607 59,549 1.02luxembourg 18.54 3.94 22.49 431 862 86,200 1.00Iceland 5.10 10.05 15.15 35 117 44,872 0.26Netherlands 10.49 4.40 14.89 5,435 324 48,285 0.67denmark 10.65 3.05 13.71 2,928 523 61,513 0.85Finland 8.65 3.41 12.06 1,435 266 48,316 0.55United Kingdom 8.80 0.97 9.77 17,881 283 39,358 0.72Switzerland 5.68 2.55 8.23 3,198 395 84,003 0.47Ireland 3.96 1.13 5.09 822 179 39,710 0.45Canada 4.59 0.48 5.07 4,911 140 51,673 0.27Belgium 3.11 1.86 4.97 2,281 205 45,666 0.45Japan 2.07 1.06 3.13 11,786 93 40,317 0.23Australia 2.31 0.74 3.05 4,851 208 61,235 0.34New zealand 1.86 1.10 2.96 461 102 39,402 0.26Republic of Korea 0.54 1.78 2.31 1,744 35 27,212 0.13Germany 0.72 1.32 2.04 14,059 170 44,737 0.38United States 1.02 0.71 1.73 31,545 99 51,867 0.19Spain 0.26 1.31 1.56 2,199 47 29,304 0.16France 0.26 1.13 1.39 11,376 177 43,151 0.41Austria 0.43 0.66 1.10 1,172 138 49,244 0.28Italy 0.22 0.80 1.02 3,253 53 33,330 0.16Slovenia 0.05 0.78 0.83 60 29 21,978 0.13Portugal 0.00 0.47 0.47 484 46 19,852 0.23Greece 0.00 0.32 0.32 305 27 21,137 0.13Czech Republic 0.01 0.28 0.29 212 20 18,012 0.11Poland 0.02 0.06 0.07 474 12 12,408 0.10Slovakia 0.02 0.03 0.05 85 15 17,172 0.09Average Total 2.27 1.09 3.36 134,835 131 43,585 0.30
Total revenue to UNICEF per capita

22
UN
ICE
F C
om
pen
diu
m o
f C
on
trib
uti
on
s 20
13Development Assistance Committee (DAC) Core Resources to UNDP, UNICEF and UNFPA, 2013
1 Provisional 2013 data provided by respective agencies for revenue.
2 Ranking denotes rank among DAC countries by contribution to regular resources only. Within each of the above agencies, non-DAC donor countries may have higher ranking than some of the DAC donors shown.
UNdP1 UNICEF UNFPA* donor Governments US$ millions % of total Rank2 US$ millions % of total Rank2 US$ millions % of total Rank**
Australia - N/A N/A - N/A N/A 15.6 3.4 12Austria 2.6 0.3 22 1.5 0.3 24 0.1 0.0 27Belgium 15.3 1.7 13 13.9 2.4 11 7.4 1.6 13Canada 93.5 10.4 2 16.8 2.9 10 16.0 3.5 11Czech Republic 0.0 0.0 43 - N/A N/A 0.0 0.0 44Denmark 56.5 6.3 9 31.9 5.4 6 40.4 8.8 5Finland 28.7 3.2 11 27.8 4.7 7 46.8 10.2 4France 17.7 2.0 12 4.4 0.7 15 0.5 0.1 19Germany 29.9 3.3 10 8.7 1.5 13 24.0 5.2 9Greece - N/A N/A - N/A N/A - N/A N/AIceland 0.2 0.0 31 0.7 0.1 32 - N/A N/AIreland 11.4 1.3 14 10.5 1.8 12 4.0 0.9 15Italy 5.2 0.6 17 3.9 0.7 17 1.3 0.3 17Japan 80.5 9.0 5 22.7 3.9 9 24.9 5.4 8Luxembourg 4.0 0.4 19 3.6 0.6 18 3.5 0.8 16Netherlands 74.4 8.3 7 44.5 7.6 5 52.4 11.4 3New Zealand 6.8 0.8 15 4.8 0.8 14 5.1 1.1 14Norway 133.2 14.9 1 82.1 14.0 2 70.6 15.3 1Poland - N/A N/A - N/A N/A 0.0 0.0 57Portugal 0.1 0.0 29 - N/A N/A - N/A N/ARepublic of Korea 5.5 0.6 16 3.2 0.5 16 0.1 0.0 28Slovakia - N/A N/A 0.0 0.0 103 0.0 0.0 73Slovenia 0.0 0.0 44 0.0 0.0 93 - N/A N/ASpain - N/A N/A 3.5 0.6 19 0.4 0.1 23Sweden 84.6 9.4 4 69.4 11.8 3 65.8 14.3 2Switzerland 62.8 7.0 8 23.0 3.9 8 16.1 3.5 10United Kingdom 85.5 9.5 3 62.4 10.6 4 31.5 6.9 6United States of America 79.1 8.8 6 125.2 21.3 1 28.5 6.2 7Total dAC 877.5 98.0 565.3 96.1 455.0 98.9Total Non-dAC 18.2 2.0 23.1 3.9 5.8 1.1Total Contributions 895.7 588.4 460.0
0
50
100
150
200
250
300
350
Au
stra
lia
Au
stri
a
Bel
giu
m
Can
ada
Cze
ch R
epu
blic
Den
mar
k
Fin
lan
d
Fran
ce
Ger
man
y
Gre
ece
Irel
and
Icel
and
Ital
y
Jap
an
Luxe
mb
ou
rg
Net
her
lan
ds
New
Zea
lan
d
No
rway
Pola
nd
Port
ug
al
Rep
ub
lic o
f K
ore
a
Slo
vak
Rep
ub
lic
Slo
ven
ia
Sp
ain
Sw
eden
Sw
itze
rlan
d
Un
ited
Kin
gd
om
Un
ited
Sta
tes
of
Am
eric
a
No
n-D
AC
UNDP
UNICEF
UNFPA
UNICEF 30%
UNDP 46% UNFPA
24%
UNDP 39%
UNFPA 11%
UNICEF 50%
Comparative Core Funding from dAC countries, 2013
Comparative Core Funding from Non-dAC countries, 2013

23
UN
ICE
F C
om
pen
diu
m o
f C
on
trib
uti
on
s 20
13
Glossary
Central Emergency Response Fund (CERF) – An emergency fund administered by the UN Office for the Coordination of Humanitarian Affairs (UNOCHA), from which UN agencies can receive advances for financing emergency operations.
Core Resources (Core) – Core Resources are un-earmarked funds that help sustain UNICEF programmes and enable UNICEF to carry out its mission to improve the lives of children and women. They include income from voluntary annual contributions from governments, un-earmarked funds contributed by National Committees and the public, as well as the net income from UNICEF greeting card sales.
Humanitarian Action for Children (HAC) - HAC is UNICEF’s global appeal, which highlights the challenges faced by children in humanitarian situations, the support required to help them survive and thrive, and the results that are possible in even the most difficult of circumstances. The HAC is in line with United Nations inter-agency Strategic Response Plans.
Inter-organizational Arrangements – These include, among others, contributions received through UNAIDS, UNDG, UNDP, UNESCO, UNFPA, UN Human Security Trust Fund, UNOCHA, WHO, and the World Bank. Funding from these sources are mostly directed to humanitarian responses and include, among other sources, income from various pooled funding mechanisms, such as grants from the UNOCHA managed CERF (see above); and multi-partner trust fund contributions.
International Public Sector Financial Reporting Standards (IPSAS) – UNICEF adopted IPSAS effective January 1, 2012. IPSAS are credible, high-quality, independently produced accounting standards, underpinned by a strong due process and supported by Governments, professional accounting bodies, and international organizations. These standards are specifically tailored to the public sector and integral to UN management reform.
Medium Term Strategic Plan (MTSP) – The MTSP was UNICEF’s strategic plan of action 2006-13 that outlined the organizational priorities, key results areas and targets across the five focus areas for programming. The five focus areas were Young Child Survival and Development; Basic Education and Gender Equality; HIV/AIDS and Children; Child Protection from Violence, Exploitation and Abuse; and Policy Advocacy and Partnerships.
Multi-donor Trust Funds (MdTFs) – The Multi Donor Trust Fund is a funding mechanism which: a) receives and pools contributions from more than one partner; b) holds the funds in trust; c) allocates funds through a designated governance structure; and d) disburses funds through an Administrative Agent/Fund Manager to a number of recipients.
other Resources (oR) – Earmarked contribution for programmes that is supplementary to the contribution for Core Resources and is made for a specific purpose such as a particular programme or strategic priority or an emergency response (ORE).
other Resources Emergency (oRE) – ORE are funds specifically provided by resource partners for UNICEF’s humanitarian action and post-crisis recovery activities. In addition to UNICEF’s traditional resource partners, important sources of funding for ORE are the inter-organisational arrangements including the CERF, and the Multi-Donor Trust Funds (MDTFs) among others. Funding for ORE is raised through the UN Consolidated Appeal (CAP) and Flash Appeals in response to the needs outlined in the UNICEF HAC and other appeals.
other Resources Regular (oRR) – ORR are funds for specific, non-emergency programme purposes and strategic priorities. ORR allow UNICEF to implement the activities of approved country programmes, the MTSP priorities and specific projects at global, regional, and country levels. The effective use of increases in ORR depends on commensurate increases in the Core Resource base. ORR that UNICEF needs most are those that are flexible both in their purpose and in their duration.
Private Sector Revenue – Revenue received from a grouping of donors that includes UNICEF’s National Committees, Non-governmental organizations, foundations and corporate resource partners and individuals.
Public Sector Revenue – Revenue received from a grouping of resource partners and sources of funding that includes Governments, inter-governmental bodies, and Inter-organisational Arrangements.
Strategic Plan – The Strategic Plan 2014-17 outlines the organizational priorities, key results areas and targets across the seven outcome areas for programming and two cross-cutting areas, Humanitarian Action and Gender. The seven outcome areas are Health; HIV and AIDS; Water, Sanitation and Hygiene; Nutrition; Education; Child Protection; and Social Inclusion.
Thematic Funding – Thematic funds are contributions that partners earmark geographically for one of the Strategic Plan outcome areas or gender or humanitarian action.
UNICEF National Committees (NatComs) – There are 36 UNICEF National Committees throughout the industrialized world. They are registered non-profit structures, mostly categorized as non-governmental entities established according to national laws. Committees play a key role in advocating for children’s rights everywhere and are instrumental in mobilizing resources for UNICEF’s work.
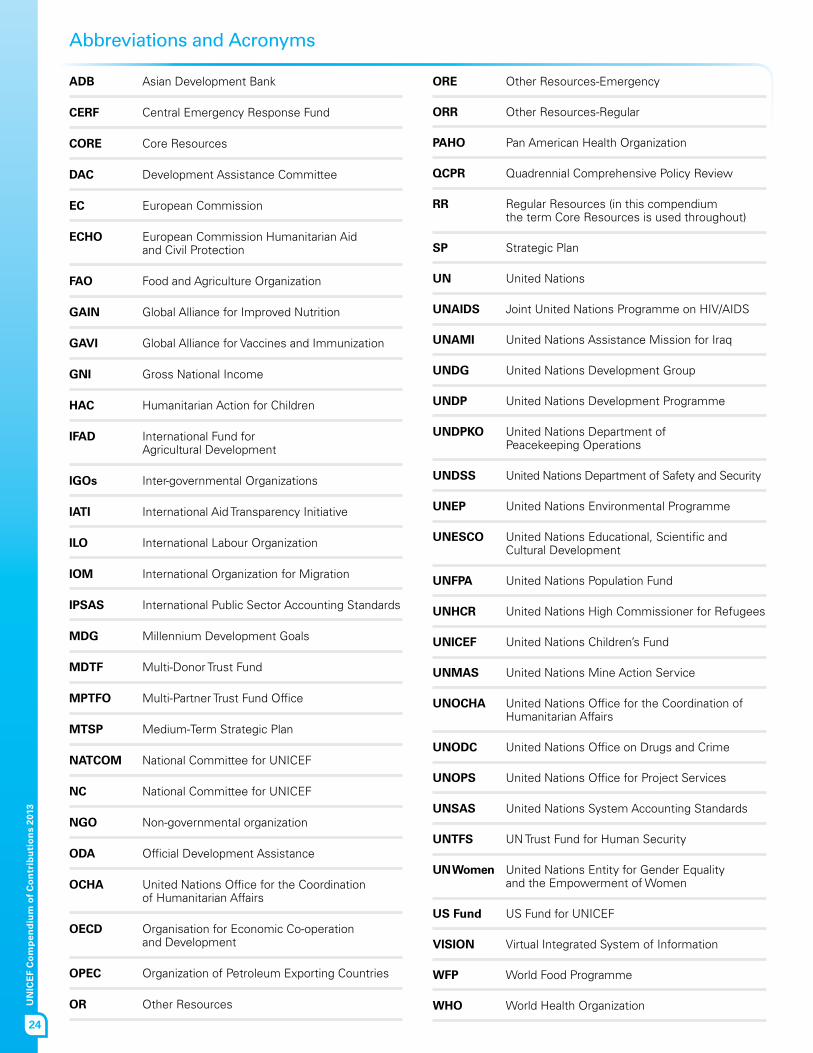
24
UN
ICE
F C
om
pen
diu
m o
f C
on
trib
uti
on
s 20
13Abbreviations and Acronyms
AdB Asian Development Bank
CERF Central Emergency Response Fund
CoRE Core Resources
dAC Development Assistance Committee
EC European Commission
ECHo European Commission Humanitarian Aid and Civil Protection
FAo Food and Agriculture Organization
GAIN Global Alliance for Improved Nutrition
GAvI Global Alliance for Vaccines and Immunization
GNI Gross National Income
HAC Humanitarian Action for Children
IFAd International Fund for Agricultural Development
IGos Inter-governmental Organizations
IATI International Aid Transparency Initiative
Ilo International Labour Organization
IoM International Organization for Migration
IPSAS International Public Sector Accounting Standards
MdG Millennium Development Goals
MdTF Multi-Donor Trust Fund
MPTFo Multi-Partner Trust Fund Office
MTSP Medium-Term Strategic Plan
NATCoM National Committee for UNICEF
NC National Committee for UNICEF
NGo Non-governmental organization
odA Official Development Assistance
oCHA United Nations Office for the Coordination of Humanitarian Affairs
oECd Organisation for Economic Co-operation and Development
oPEC Organization of Petroleum Exporting Countries
oR Other Resources
oRE Other Resources-Emergency
oRR Other Resources-Regular
PAHo Pan American Health Organization
QCPR Quadrennial Comprehensive Policy Review
RR Regular Resources (in this compendium the term Core Resources is used throughout)
SP Strategic Plan
UN United Nations
UNAIdS Joint United Nations Programme on HIV/AIDS
UNAMI United Nations Assistance Mission for Iraq
UNdG United Nations Development Group
UNdP United Nations Development Programme
UNdPKo United Nations Department of Peacekeeping Operations
UNdSS United Nations Department of Safety and Security
UNEP United Nations Environmental Programme
UNESCo United Nations Educational, Scientific and Cultural Development
UNFPA United Nations Population Fund
UNHCR United Nations High Commissioner for Refugees
UNICEF United Nations Children’s Fund
UNMAS United Nations Mine Action Service
UNoCHA United Nations Office for the Coordination of Humanitarian Affairs
UNodC United Nations Office on Drugs and Crime
UNoPS United Nations Office for Project Services
UNSAS United Nations System Accounting Standards
UNTFS UN Trust Fund for Human Security
UN Women United Nations Entity for Gender Equality and the Empowerment of Women
US Fund US Fund for UNICEF
vISIoN Virtual Integrated System of Information
WFP World Food Programme
WHo World Health Organization


Public-Sector Alliances and ResourceMobilization office (PARMo)3 United Nations Plaza, H-12ANew York, NY 10017, USAwww .unicef .org/parmo
The Compendium of Resource Partner Contributions 2013 has been printed on 100 per cent PCW recycled paper.
For the online version, scan this QR code or go to www .unicef .org/parmo/66662_66837 .html
© United Nations Children’s FundApril 2014


