Page 1
H E A L T H W E A L T H C A R E E R
C O M P E N S A T I O NP L A N N I N G F O R 2 0 1 6E M E A F O R E C A S T SA N D T R E N D S
OCTOBER 28 2015
Alyson Callin, UKNuno-Filipe dos Santos Gomes, UAENicol Mullins, South AfricaDavid Wreford, UK
Page 2
© MERCER 2015 1
T O D AY ’ S S P E A K E R S
ALYSON CALLINLondon, UK
NUNO GOMESDubai, UAE
NICOL MULLINSSouth Africa
DAVID WREFORDLondon, UK
Page 3
© MERCER 2015 2
Context forPlanning
MercerSurveyInsights
Trends for2016 andBeyond
Call toAction
A G E N D A F O R O U R S E S S I O N T O D AY
Page 4
© MERCER 2015 3© MERCER 2015 3
CONTEXT FORPLANNING
C O M P E N S A T I O N P L A N N I N G F O R 2 0 1 6
Page 5
© MERCER 2015 4
E U R O P EE C O N O M I C C O N T E X T 2 0 1 5
-5%
0%
5%
10%
15%
20%
25%
30%
35%U
nite
dSt
ates
Bra
zil
Chi
na
Indi
a
Irela
nd
Switz
erla
nd
Gre
ece
Spai
n
Den
mar
k
Fran
ce
Italy
Ger
man
y
UK
Lith
uani
a
Slov
enia
Hun
gary
Pola
nd
Rom
ania
Serb
ia
Turk
ey
Rus
sia
Ukr
aine
Kaz
akhs
tan
Salary increases Inflation GDP Unemployment
Source: Global Compensation Planning Report, July 2015
Page 6
© MERCER 2015 5
E U R O P EE C O N O M I C A N D M A R K E T C O N T E X T
5
1. Stabilised economies and low inflation2. Sustained war for the best talent3. Diversity and inclusion agenda driving need for:
• Fairer rewards• Flexible rewards
4. Post-recession emphasis on maintaining good governance• From cost control to targeted investments• Distributed responsibility and function effectiveness
5. Increased transparency• Better educated managers• More informed employees
Page 7
© MERCER 2015 6
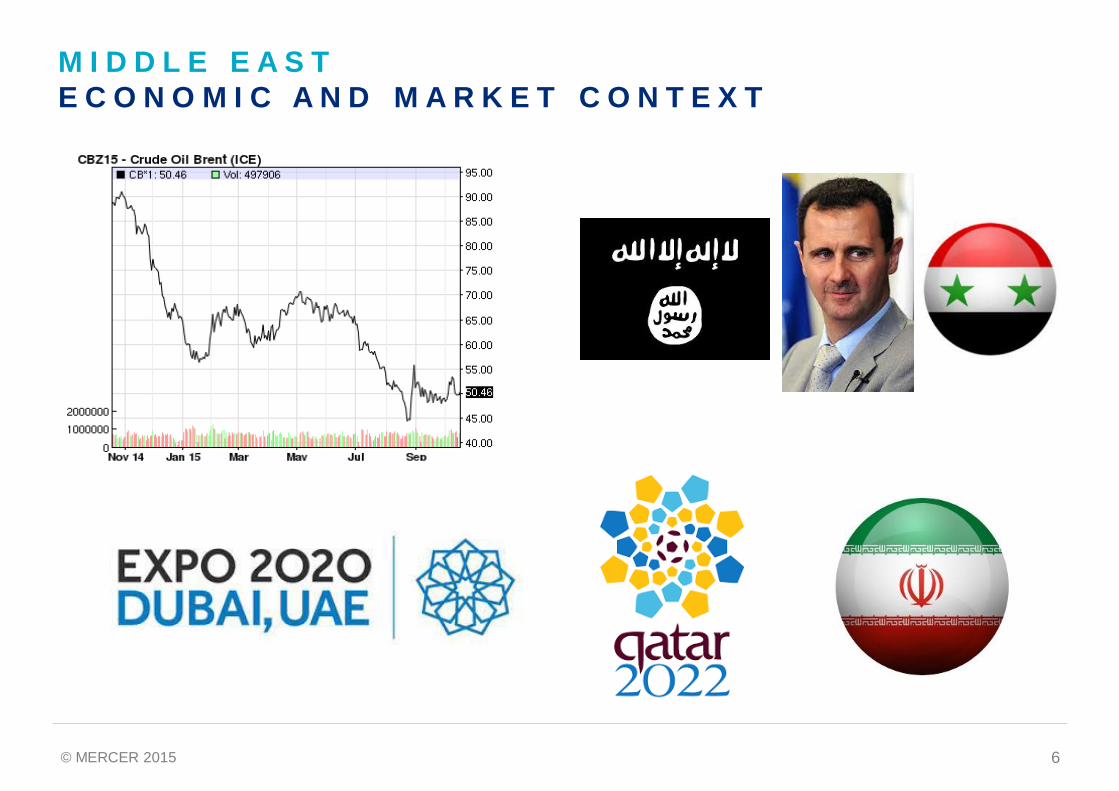
M I D D L E E A S TE C O N O M I C A N D M A R K E T C O N T E X T
Page 8
© MERCER 2015 7
A F R I C AE C O N O M I C A N D M A R K E T C O N T E X T
• 55 recognised African States
• Tough economic conditions– Legislation changes
• Tougher infrastructure challenges– Lack of dependable infrastructure
• Developed markets turning to emerging markets
• Africa is one of the earmarked growth regions globally
Page 9
© MERCER 2015 8© MERCER 2015 8
MERCER SURVEYINSIGHTS
C O M P E N S A T I O N P L A N N I N G F O R 2 0 1 6
Page 10
© MERCER 2015 9
4,823 PARTICIPANTS
S A L A R Y M O V E M E N T S N A P S H O T S U R V E YP A R T I C I P A N T P R O F I L E – S E P T E M B E R 2 0 1 5
79MARKETS
Source: Mercer EMEA SMS September 2015
376 UNIQUEORGANISATIONS
Page 11
© MERCER 2015 10
S A L A R Y M O V E M E N T S N A P S H O TP A R T I C I P A N T P R O F I L E
16%
4%
13%
7%
10%
12% 5%7%
14%
ENERGYHIGH TECHCONSUMER GOODS LIFE SCIENCESOTHER DURABLEGOODS MANUFG
SERVICES FINANCIAL SERVICES
11%
RETAIL & WHOLESALEOTHEROTHER NON-DURABLEMANUFACTURING
Page 12
© MERCER 2015 11
To what extent do your employees understand the basis upon whichtheir pay and incentives are determined?
L I V E P O L LQ U E S T I O N 1
A – Not at all
B – To a slight extent
C – To a moderate extent
D – To a great extent
E – To a very great extent
0% 20% 40% 60%
To a very great extent
To a great extent
To a moderate extent
To a slight extent
Not at all
Results
Based on 183 responses
Page 13
© MERCER 2015 12© MERCER 2015 12
MERCER SURVEYINSIGHTSAFRICA
C O M P E N S A T I O N P L A N N I N G F O R 2 0 1 6
Page 14
© MERCER 2015 13
S A L A R Y I N C R E A S E F O R E C A S T S F O R 2 0 1 6A F R I C A – A L L R E S P O N S E S
Source: Mercer EMEA SMS September 2015 (Median)
Country Increase Country IncreaseMalawi 14.0% Algeria 6.9%Ghana 12.0% Uganda 6.9%Egypt 10.0% Tunisia 6.3%Ethiopia 9.9% Mauritius 5.5%Nigeria 9.9% Mozambique 5.5%Kenya 8.0% DRC 4.8%Zambia 7.7% Morocco 4.5%Tanzania 7.1% Ivory Coast 4.1%Angola 7.0% Senegal 4.0%South Africa 7.0% Gabon 3.1%
Page 15
© MERCER 2015 14© MERCER 2015 14
TRENDS FOR 2016 ANDBEYONDAFRICA
C O M P E N S A T I O N P L A N N I N G F O R 2 0 1 6
Page 16
© MERCER 2015 15
2 0 1 5 E C O N O M I C F R E E D O M H E A T M A PW O R L D AV E R A G E 6 0 . 4
Source: The Heritage Foundation, 2015 Economic Freedom Heat Map, http://www.heritage.org/index/heatmap
Page 17
© MERCER 2015 16
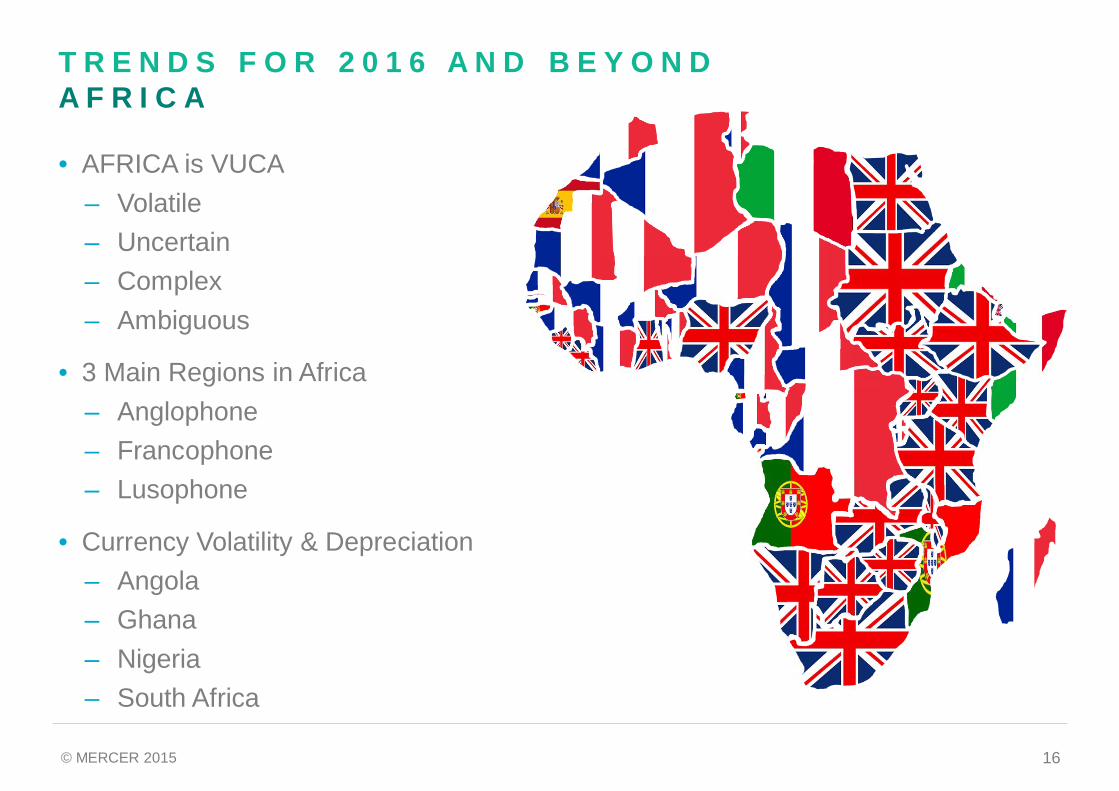
• AFRICA is VUCA– Volatile– Uncertain– Complex– Ambiguous
• 3 Main Regions in Africa– Anglophone– Francophone– Lusophone
• Currency Volatility & Depreciation– Angola– Ghana– Nigeria– South Africa
T R E N D S F O R 2 0 1 6 A N D B E Y O N DA F R I C A
Page 18
© MERCER 2015 17
T R E N D S F O R 2 0 1 6 A N D B E Y O N DA F R I C A
- 2 5 %
0 %
2 5 %
5 0 %
7 5 %
1 2 5 %
J A N 1 , 2 0 1 4 J U L 1 , 2 0 1 4 J U L 1 , 2 0 1 5J A N 1 , 2 0 1 5
1 0 0 %
U S $ /Z A R3 9 . 5 2 %
U S $ /RUB1 0 3 . 8 2 %
U S $ /A O A3 8 , 6 4 %
U S $ /N G N2 4 . 2 2 %
AV E R A G E B I D R AT E F O R T H E W E E K O F M O ND AY, S E P 2 8 , 2 0 1 5 TO SUNDAY,O C T 4 , 2 0 1 5 @ +/ - 0 %
U S $ /GHS7 2 . 8 5 %
Page 19
© MERCER 2015 18
• Sustained high inflation– IMF latest projections as October
- slow down in CPI- small growth in GDP
• Sustained high market increases– Real wage increases
• Sustained high levels of compensation
• Focus is on cash and benefits– Base salary not relevant benchmark
• Skill scarcity– High demand low supply– Most companies buy skills – very few build
• Opportunities bountiful – but for the brave …
T R E N D S F O R 2 0 1 6 A N D B E Y O N DA F R I C A
Page 20
© MERCER 2015 19
To what extent do you proactively adapt your compensation policiesto address your talent issues?
L I V E P O L LQ U E S T I O N 2
A – Not at all
B – To a slight extent
C – To a moderate extent
D – To a great extent
E – To a very great extent
Results
Based on 160 responses
0% 10% 20% 30% 40% 50%
To a very great extent
To a great extent
To a moderate extent
To a slight extent
Not at all
Page 21
© MERCER 2015 20© MERCER 2015 20
MERCER SURVEYINSIGHTS
C O M P E N S A T I O N P L A N N I N G F O R 2 0 1 6
MIDDLE EAST
Page 22
© MERCER 2015 21
S A L A R Y I N C R E A S E F O R E C A S T S F O R 2 0 1 6M I D D L E E A S T / A S I A – A L L R E S P O N S E S
Source: Mercer EMEA SMS September 2015 (Median)
Country Increase Country IncreaseIran 20.0% Iraq 5.5%Pakistan 11.6% Bahrain 5.0%Yemen 9.0% Kuwait 5.0%Uzbekistan 9.0% Oman 5.0%Kazakhstan 8.6% Qatar 5.0%Azerbaijan 8.0% Saudi Arabia 5.0%Syria 8.0% UAE 5.0%Lebanon 5.9% Israel 3.1%Jordan 5.7%
Page 23
© MERCER 2015 22© MERCER 2015 22
TRENDS FOR 2016 ANDBEYONDMIDDLE EAST
C O M P E N S A T I O N P L A N N I N G F O R 2 0 1 6
Page 24
© MERCER 2015 23
T R E N D S F O R 2 0 1 6 A N D B E Y O N DM I D D L E E A S T
SIMPLIFICATION OF COMPENSATION
FOCUS ON BENEFITS – STRONGER RETENTION
MANAGING WORKFORCE AND MARKET DIVERSITY
Page 25
© MERCER 2015 24
T R E N D S F O R 2 0 1 6 A N D B E Y O N DM I D D L E E A S T
IS THE CONCEPT OF TOTAL REWARDS FINALLY RESONATING IN THE MIDDLE EAST?
COMPENSATIONDirect monetary rewards provided in exchangefor employee time and performance.• Base Pay• Allowances• Short Term Incentive Plans• Long Term Incentive Plans
CAREERSRewards offered to improve employees’ skillsand advance their careers.• Performance Management• Promotion & Lateral Moves• Formal and Informal Training• Tuition Reimbursement
WORK-LIFERewards offered to enhance an employee’severyday work experience and contribute toquality of life.• Job Design and Flexibility• Recognition• Health & Well-Being• Dependent Care
BENEFITSRewards offered to protect the health and long-term financial security of the employee.• Health and Welfare• Paid Time Off• Retirement Plans• Perquisites and Other Benefits
Page 26
© MERCER 2015 25
PREVALENCE OF ALLOWANCES – UAE
T R E N D S F O R 2 0 1 6 A N D B E Y O N DM I D D L E E A S T
0% 10% 20% 30% 40% 50% 60% 70% 80% 90% 100%
Transportation Allowance
Housing Allowance
Meal Allowance
Shift Allowance
Furniture Allowance
Utilities Allowance
National Allowance
Other Guaranteed Allowance
Consolidated Allowance
2014 2015
19%
Source: Mercer 2015 UAE Total Remuneration Survey
Page 27
© MERCER 2015 26
To what extent do your pay and bonus programmes differentiate theemployee attributes you feel are important to drive business performance?
L I V E P O L LQ U E S T I O N 3
A – Not at all
B – To a slight extent
C – To a moderate extent
D – To a great extent
E – To a very great extent
Results
Based on 127 responses
0% 10% 20% 30% 40%
To a very great extent
To a great extent
To a moderate extent
To a slight extent
Not at all
Page 28
© MERCER 2015 27© MERCER 2015 27
MERCER SURVEYINSIGHTSEUROPE
C O M P E N S A T I O N P L A N N I N G F O R 2 0 1 6
Page 29
© MERCER 2015 28
S A L A R Y I N C R E A S E F O R E C A S T S F O R 2 0 1 6W E S T E R N E U R O P E – A L L R E S P O N S E S
Source: Mercer EMEA SMS September 2015 (Median)
Country Increase Country IncreaseGermany 3.0% France 2.3%Norway 3.0% Finland 2.2%UK 2.9% Ireland 2.2%Austria 2.7% Belgium 2.0%Denmark 2.5% Portugal 2.0%Italy 2.5% Spain 2.0%Luxembourg 2.5% Switzerland 2.0%Netherlands 2.5% Greece 1.7%Sweden 2.5%
Page 30
© MERCER 2015 29
S A L A R Y I N C R E A S E F O R E C A S T S F O R 2 0 1 6C E N T R A L / E A S T E R N E U R O P E – A L L R E S P O N S E S
Source: Mercer EMEA SMS September 2015
Country Increase Country IncreaseBelarus 12.0% Bosnia and Herzegovina 3.0%Ukraine 10.0% Estonia 3.0%Russia 8.0% Latvia 3.0%Turkey 7.8% Lithuania 3.0%Moldova 7.0% Montenegro 3.0%Georgia 6.9% Slovakia 3.0%Armenia 5.9% Albania 2.9%Serbia 5.4% Macedonia 2.9%Romania 4.5% Croatia 2.8%Bulgaria 4.0% Czech Republic 2.8%Hungary 3.5% Slovenia 2.8%Poland 3.1% Cyprus 1.5%
Page 31
© MERCER 2015 30© MERCER 2015 30
TRENDS FOR 2016 ANDBEYONDEUROPE
C O M P E N S A T I O N P L A N N I N G F O R 2 0 1 6
Page 32
© MERCER 2015 31
0%
1%
2%
3%
4%
5%
6%
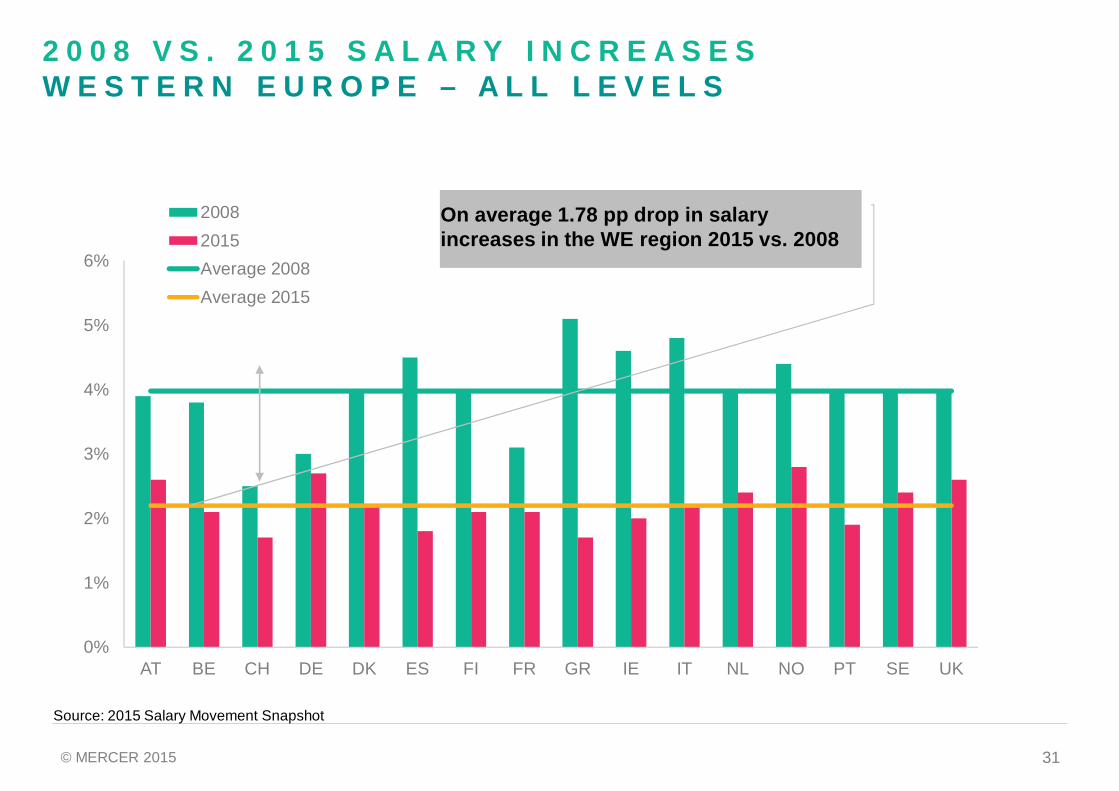
AT BE CH DE DK ES FI FR GR IE IT NL NO PT SE UK
20082015Average 2008Average 2015
On average 1.78 pp drop in salaryincreases in the WE region 2015 vs. 2008
2 0 0 8 V S . 2 0 1 5 S A L A R Y I N C R E A S E SW E S T E R N E U R O P E – A L L L E V E L S
Source: 2015 Salary Movement Snapshot
Page 33
© MERCER 2015 32
0%
2%
4%
6%
8%
10%
12%
14%
16%
18%
20%
BG CZ EE HR HU KZ LT LV PL RO RU RS SK SI TR UA
2008 2015 Average 2015 Average 2008
2 0 0 8 V S . 2 0 1 5 S A L A R Y I N C R E A S E SC & E E U R O P E – A L L L E V E L S
On average 5.84 pp drop in salaryincreases in the CEE region 2015 vs 2008
Source: 2015 Salary Movement Snapshot
Page 34
© MERCER 2015 33
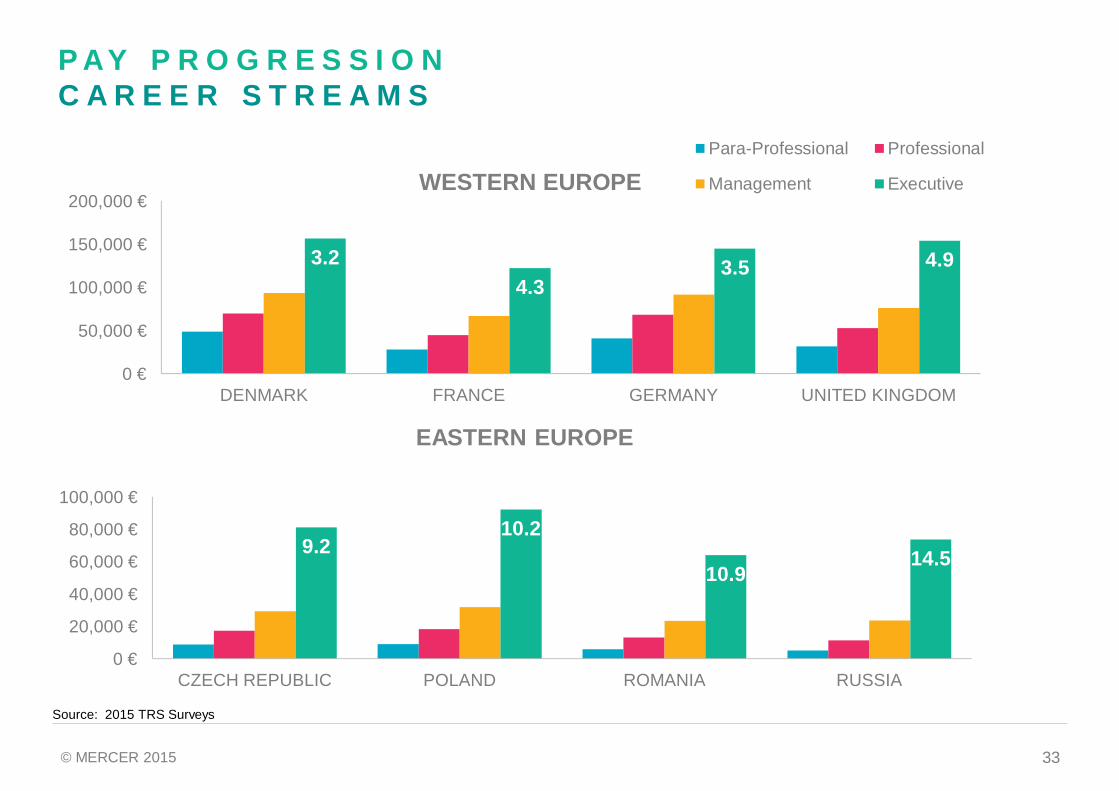
P AY P R O G R E S S I O NC A R E E R S T R E A M S
3.24.3
3.5 4.9
0 €
50,000 €
100,000 €
150,000 €
200,000 €
DENMARK FRANCE GERMANY UNITED KINGDOM
Para-Professional Professional
Management ExecutiveWESTERN EUROPE
9.210.2
10.914.5
0 €
20,000 €
40,000 €
60,000 €
80,000 €
100,000 €
CZECH REPUBLIC POLAND ROMANIA RUSSIA
EASTERN EUROPE
Source: 2015 TRS Surveys
Page 35
© MERCER 2015 34
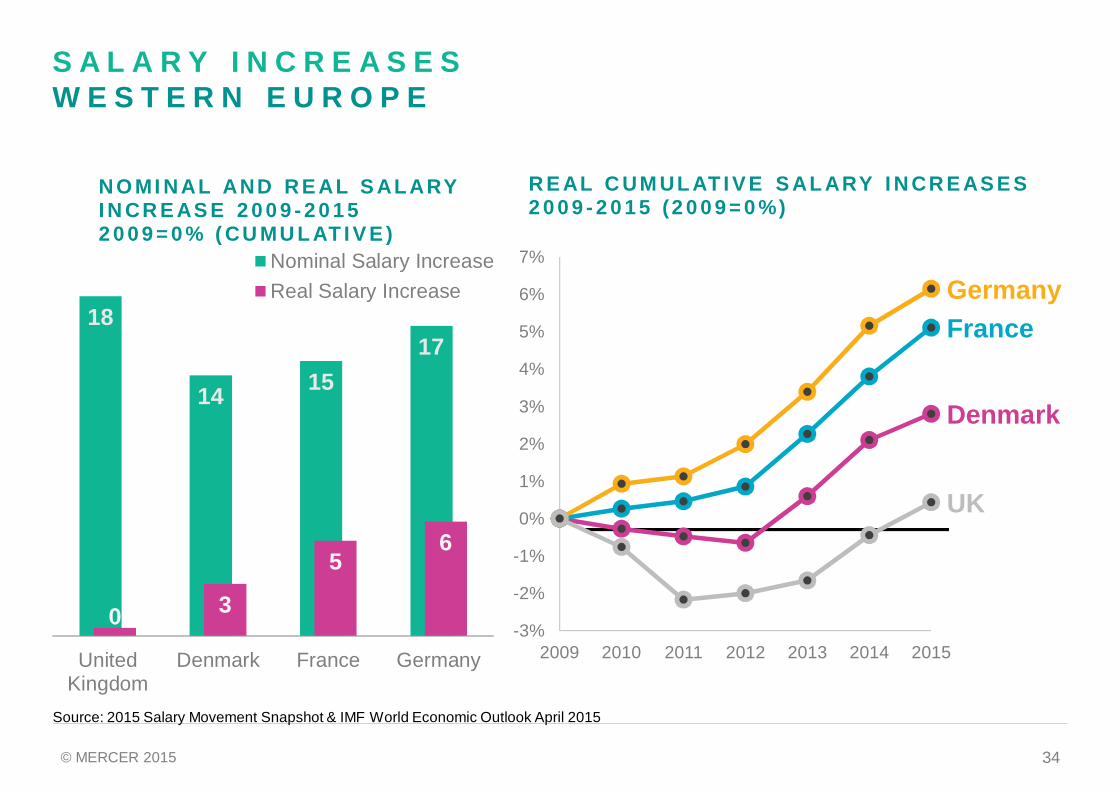
18
14 1517
0 3
56
UnitedKingdom
Denmark France Germany
NO MI NAL AND RE AL S ALARYI N CR E AS E 2 0 0 9 - 2 0 1 52 0 0 9 = 0 % ( CU MU L AT I V E )
Nominal Salary IncreaseReal Salary Increase
S A L A R Y I N C R E A S E SW E S T E R N E U R O P E
Denmark
FranceGermany
UK
-3%
-2%
-1%
0%
1%
2%
3%
4%
5%
6%
7%
2009 2010 2011 2012 2013 2014 2015
R E AL C UM UL AT I V E S AL ARY I N CR E AS E S2 0 0 9 - 2 0 1 5 (2 0 0 9 = 0 %)
Source: 2015 Salary Movement Snapshot & IMF World Economic Outlook April 2015
Page 36
© MERCER 2015 35
32
19
61
24
5 7 7 10
Romania CzechRepublic
Russia Poland
NO MI NAL AND RE AL S ALARYI N CR E AS E 2 0 0 9 - 2 0 1 52 0 0 9 = 0 % ( CU MU L AT I V E )
Nominal SalaryIncreaseReal SalaryIncrease
S A L A R Y I N C R E A S E SE A S T E R N E U R O P E
CzechRepublic
Poland
Romania
Russia
-4%
-2%
0%
2%
4%
6%
8%
10%
12%
2009 2010 2011 2012 2013 2014 2015
R E AL C UM UL AT I V E S AL ARY I N CR E AS E S2 0 0 9 - 2 0 1 5 (2 0 0 9 = 0 %)
Source: 2015 Salary Movement Snapshot & IMF World Economic Outlook April 2015
Page 37
© MERCER 2015 36
2 0 1 5 A C T U A L S A L A R Y I N C R E A S E SP E R F O R M A N C E M A T R I X
0%1%2%3%4%5%
Denmark France Germany UK
Average actualsalary increase 2015
Top Performers
Standard Performers
Low Performers
Market Average
Source:September 2015 Salary Movement Snapshot
25%
65%
10%
0%1%2%3%4%5%
Denmark France Germany UK
Average forecastsalary increase 2016
Top Performers
Standard Performers
Low Performers
Market Average
25%
65%
10%
4.1%
3.7% 3.6%4.1%
3.5% 3.2%4.0%
4.3%
Page 38
© MERCER 2015 37
2 0 1 5 A C T U A L S A L A R Y I N C R E A S E SP E R F O R M A N C E M A T R I X
0%2%4%6%8%
10%
Czech Republic Poland Romania Russia
Average actualsalary increase 2015
Top Performers
Standard Performers
Low Performers
Market Average
Source: September 2015 Salary Movement Snapshot
25%
65%
10%
0%2%4%6%8%
10%
Czech Republic Poland Romania Russia
Average forecastsalary increase 2016
Top Performers
Standard Performers
Low Performers
Market Average
25%
65%
10%
10.5%
4.7%5.5%
8.3%
4.4%5.6%
6.8%
11.6%
Page 39
© MERCER 2015 38
To what extent are your employees consistently paid for the workthey do?
L I V E P O L LQ U E S T I O N 4
A – Not at all
B – To a slight extent
C – To a moderate extent
D – To a great extent
E – To a very great extent
Results
Based on 136 responses
0% 10% 20% 30% 40% 50%
To a very great extent
To a great extent
To a moderate extent
To a slight extent
Not at all
Page 40
© MERCER 2015 39© MERCER 2015 39
CALL TO ACTION
C O M P E N S A T I O N P L A N N I N G F O R 2 0 1 6
Page 41
© MERCER 2015 40
I N D U S T R Y D A T A2 0 1 6 F O R E C A S T S
AFRICARetail/Wholesale
Consumer Goods
Life Sciences
High TechServicesEnergy
Mining & MetalsFinancial Services
TransportationEquipment
Ins/reinsurance
MIDDLE EASTLife Sciences
Consumer Goods
High Tech
TransportationEquipmentServices
Retail/WholesaleEnergy
Ins/reinsuranceMining & Metals
Financial Services
W EUROPERetail/Wholesale
High TechIns/reinsuranceLife SciencesTransportation
EquipmentMining & Metals
Consumer Goods
Services
FinancialServices
Energy
E EUROPEConsumer Goods
Life Sciences
Retail/Wholesale
TransportationEquipmentHigh TechServicesEnergy
Mining & MetalsIns/Reinsurance
Financial Services
ALL INDUSTRY
ABO
VEBE
LOW
Source: Mercer EMEA SMS September 2015 40
Page 42
© MERCER 2015 41
P A S T – P R E S E N T – F U T U R E S T A T E
41
One size fitsall
Segmentation&
differentiationPersonalisation
CompetitivePay Fair pay Responsible
pay
Fixedemployment
costs
Flexibleemployment
costs
Multiple fullyflexible
PA S T P R E S E N T F U T U R E
Page 43
© MERCER 2015 42
C A L L T O A C T I O NW H E R E T O F O C U S F O R 2 0 1 6
ü Clear alignment between organisational and workforce plans, EVP and rewardprogrammes (incl. analytics)
ü Integrated reward and talent programmes that support each other
ü Grading structures that clearly define career levels and expectations
ü Clear definition of drivers that define factors that determine and progress reward
ü Thoughtful segmentation and differentiation
ü Transfer of benefit risk, choice and cost to employees
ü Tighter governance of reward resulting in:§ Clear definition of function design and priorities§ greater cost control and can limit overspending and result in less
attraction/retention risk
ü Well managed and transparent reward structures, and managers who areconsistent advocates of rewards result in better employee perception ofinternal equity
ü Better understanding of rewards resulting in increased employee satisfactionand commitment to their employers
Page 44
© MERCER 2015 43© MERCER 2015 43
QUESTIONS
C O M P E N S A T I O N P L A N N I N G F O R 2 0 1 6
Page 45
© MERCER 2015 44
Q U E S T I O N S
QUESTIONSPlease type your questions in the Q&A section of the toolbarand we will do our best to answer as many questions as wehave time for.
To submit a question while in full screen mode, use the Q&Abutton, on the floating panel, on the top of your screen.
CLICK HERE TO ASK A QUESTIONTO “ALL PANELISTS”
FEEDBACKPlease take the time to fill out thefeedback form at the end of this webcastso we can continue to improve. Thefeedback form will pop-up in a newwindow when the session ends.
www.mercer.com/webcastsView past recordings and sign up forupcoming webcasts
ALYSON CALLIN NUNO GOMES DAVID WREFORDNICOL MULLINS
Page 46
© MERCER 2015 45
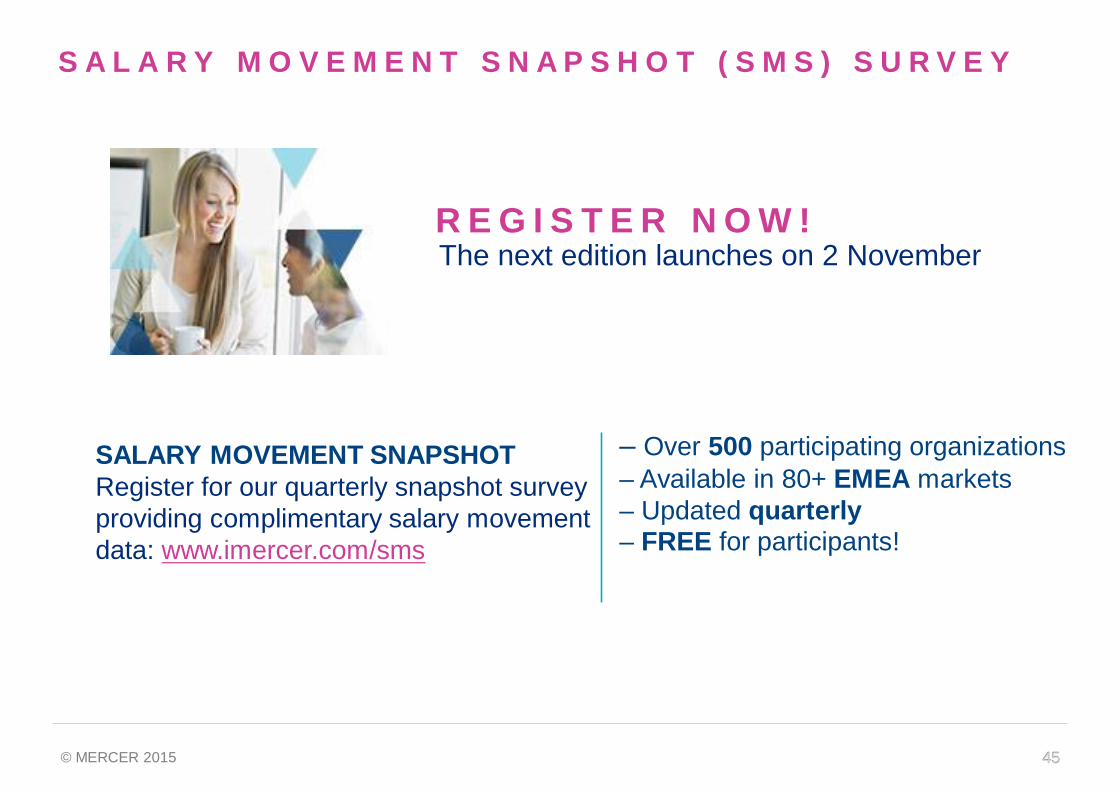
S A L A R Y M O V E M E N T S N A P S H O T ( S M S ) S U R V E Y
45
SALARY MOVEMENT SNAPSHOTRegister for our quarterly snapshot surveyproviding complimentary salary movementdata: www.imercer.com/sms
– Over 500 participating organizations– Available in 80+ EMEA markets– Updated quarterly– FREE for participants!
R E G I S T E R N O W !The next edition launches on 2 November