100
Our way ahead Competence Competitiveness Continuity 2010 Annual Report

Our way aheadCompetence Competitiveness Continuity
2010 Annual Report


Our way aheadCompetence Competitiveness Continuity
2010 Annual Report

2
Contents
» 40 years of working together towards new goals 4
» Financial data 6 » Comer Industries at a glance 8 » 2010 highlights 10
1 Competence 12 » People: at the heart of change 14 » New development drivers from the green economy 16 » Cutting-edge engineering and technological solutions 17 » The future-oriented program of R&D 18
2 Competitiveness 20 » Comer Production System: the road to excellence 22 » The renewal of the ICT infrastructures 26 » The new industrial plan 28 » Growth, cornerstone of competitiveness 30 » Business development in China 31 » BRIC, emerging markets for growth 32
3 Continuity 34 » A solid financial base for development 36 » Committed to sustainability and safety 37 » Outlook for 2011 38
» Our first 40 years 40
» Extract from the report on operations accompanying the consolidated financial statements at December 31, 2010 42 » Extract from the consolidated financial statements
at December 31, 2010 52 » Auditors’ report 92 » Board of statutory auditors’ report 93
» Board of directors and management 94 » Contacts 95
3

Forty years of constant growth and inno-vation, financial stability and investments in the service of our customers. Forty years of competition and challenges overcome in all markets of the world. But, in particular, forty years whose value is based on the participation and enthu-siasm of the men and women who have built the history of Comer Industries.We began as four in 1970. Along with myself, there were my brothers Fabrizio and Oscar as well as my cousin Aimone; we were all driven by the core values of our business model: honesty, respect for one’s peers, perseverance and group spirit.These same values – which were also shared and nurtured by all of our staff over the past decades – represent the solid roots which have allowed us to realize the dream of a great industrial ven-ture and create, within Comer Industries, an expansive, cohesive and united com-munity that is enriched each day by the talent and skills of more than 1,200 peo-ple from Italy to China and from Europe to the United States.
Leaders in change: competent andmotivated individualsThe people in our company are, in fact, the creators of the new philosophy based on the principles of lean organization, continuous improvement, sustainability and widespread innovation, which has become part of our new corporate cul-ture.Thanks to this transformation, we have been more effective in tackling even the recent difficult global economic situation.The solid foundation of technical and managerial knowledge, as well as the interpersonal and human relations skills of our employees, has allowed us to
manage and effectively implement this change with a level of flexibility and re-sponsiveness that is greater than aver-age. In this manner, we have successfully adapted to new market needs as well as to critical factors within the world eco-nomic system.
2010: finally a recoveryStarting with ourselves, and our great corporate family, is truly the best way to celebrate our first forty years as a com-pany. A splendid achievement which, in 2010, we have hailed with the spirit of renewed optimism for our accomplish-ments and for our future prospects.As the year closed, our company had
grown 15%, with total revenues of 277 million euros. This occurred within an en-vironment of generalized recovery for our market sectors of reference.Within the industrial field, we reported im-proved levels of performance, particularly in the segments for compact construc-tion and road machinery. With regards to renewable energy, revenues from our ap-plications for wind generators increased further – this is particularly due to the excellent performance of the Chinese market.More comforting signs of recovery were also noted in the sector for agricultural applications; this was driven by wide-spread growth in demand following the
general increase in prices of agricultural commodities which occurred – even as a result of incidental factors – in the second half of 2010.
Stronger and more competitiveBesides growth in volumes, profitability index is also positive, and our consoli-dated financial position exhibits a signifi-cant indebtedness reduction: this is an extra advantage for us in the arena of international competition.In addition, we established the basis of the reorganization schedule for our manufacturing structures, planning a se-ries of investments which, starting from 2011, will involve all our production sites.
The main objective is to respond more effectively to the increasingly challenging demands of our global customers, with a strong sense of constructive partnership.
An efficient and sustainabledevelopment modelThe general picture provided by these factors leads us to believe that the worst, associated with the internation-al crisis, is now over, and that we can look to the future with more optimism. Uncertainty factors threatening the persistence of the recovery still remain – such as Chinese decisions regard-ing monetary policy, the rising costs of raw materials, the consequential infla-
40 years of working together towards new goals
The solid foundation of technical and managerial knowledge, as well as the interpersonal and human relations skills of our employees, has allowed us to manage and effectivelyimplement this change with a level of flexibility and responsiveness that is greater than average. In this manner,we have successfully adapted to new market needs as well as to critical factors within the global economic system.
4

tionary trends and an increased level of competition, a rebound in demand as a result of the inventory build-up and, equally important, social-political tensions in the North African region and the repercussions of the natural disasters in Japan – but we know that we can rely on our solid and sustain-able growth model.A model inspired by the integrat-ed management system typical of excellence-oriented companies, which makes the development of new prod-ucts one of its fundamental features.
Our level of innovation is constantly increasing and today about 30% of the turnover is generated by new solutions introduced in the last three years.Thanks to this solid foundation, in 2010 we could concentrate on the identification of new development drivers, represented – in the produc-tion area – by transmissions for elec-tric applications in the automotive sector and – in the sales area – by the focus on emerging markets, such as Brazil, Russia and India.
Still together, towards new goalsWhen people manage to unite around shared values and join together in a common mission, they can achieve extraordinary results. This is what we’ve realized in our first forty years, and this is how we will con-tinue to grow, ready to meet the new global challenges.
Fabio StorchiPresident and CEOComer Industries Spa
5

Financial data
Revenues
EBITDA
2010 27,818 + 86.3%
2009 14,930 - 51.0%
2008 30,489 (thousand euros)
2010 10,690 +735.2%
2009 1,280 - 89.6%
2008 12,352 (thousand euros)
2010 79,104 + 19.0%
2009 66,472 - 1.4%
2008 67,440 (thousand euros)
2010 276,534 + 14.6%
2009 241,328 - 27.0%
2008 330,785 (thousand euros)
Net profit
Net shareholders’ equity
6

Turnover by sector
Turnover by geographical area
Net financial position
2010 27,870 - 42.2%
2009 48,187 - 39.7%
2008 79,898 (thousand euros)
2010 1,217 + 6.3%
2009 1,145 - 15.2%
2008 1,350 (units)
Personnel
51.3%Agriculture
47.6%Industry
1.1%Other
35.3%EU countries
27.7% North America
14.9%Italy
17.2%China
4.9%Rest of the world
7

Comer Industries is a global leader in the design and production of advanced engineering systems and mechatronic solutions for power transmission. Our customers are the main manufacturers of agricultural equipment, industrial machinery and renewable energy applications worldwide.
Comer Industries at a glance
» Combine harvester and self-propelled machines » Fertilizing machines » Forage harvesting, processing and distribution machines » Forestry machines » Harvesting machines » Irrigation and crop treatment equipment » Land preparation machines » Multi-utility vehicles » Professional gardening and landscaping equipment » Soil tillage machines
» Airport equipment » Construction and earth moving machinery » Cranes and lifting equipment » Marine industry » Material handling and logistics vehicles » Municipal equipment » Parks and entertainment » Road construction equipment » Stationary industry
» Wind generators » Biogas machines » Solar panels
Agricultural applications
Industrial applications
Energy applications
COMER INDUSTRIES Inc. - Charlotte, NC, USA
Applications
8

» Control systems and electronic adjustment devices for hydrostatic transmissions
» Driveshafts, safety devices for driveshafts, mechanical clutches and safety devices
» Electric wheel drive units, electric and hydraulic steering gears » Gearboxes, speed changes gears, parallel and right angle shaft speed
increasers and reducers » Modular planetary gear drives, planetary track and wheel drives, slew drives,
special planetary gear drives for industrial applications » Orbital motors » Rigid and steering axles
Advanced engineering systems and mechatronic solutions
COMER INDUSTRIES U.K. Ltd. - Desford, LE, United Kingdom
COMER INDUSTRIES Sarl - St. Thibault des Vignes, France
COMER INDUSTRIES GmbH - Kornwestheim, GermanyShanghai Branch Office, China
COMER INDUSTRIES (SHAOXING) CO. Ltd. - Shaoxing, China
Products
COMER INDUSTRIES Spa - Headquarters, Reggiolo (RE), Italy
Mechatronics Research Center - Reggiolo (RE), Italy
Comer Academy - Reggiolo (RE), Italy
Operating Units:
• AXLES & WHEEL DRIVE UNITS - Reggiolo (RE), Italy
• GEARBOXES - Reggiolo (RE), Italy
• DRIVESHAFTS - Pegognaga (MN), Italy
• PLANETARY DRIVES - Cavriago (RE), Italy
• COMER INDUSTRIES COMPONENTS Srl - Matera, Italy
• COMER INDUSTRIES (SHAOXING) CO. Ltd. - Shaoxing, China
9

Comer Industries is finalist in Confindustria’s“Awards for Excellence”February, Turin, Italy
The innovating force of Comer Industries is highlighted among the
examples of “Made in Italy” excellence at the 2010 edition of the
“Awards for Excellence”, the event organized by Confindustria to
celebrate its anniversary.
Comer Industries is chosen among the three finalists in the category
“Business champion of innovation” for its promotion and exploita-
tion of innovation interpreted as the ability to invest in research and
development, human resources and technology.
The award is presented to Fabio Storchi by the President of
Confindustria Emma Marcegaglia (see picture).
2010 highlights
The company celebrates its first forty yearsMarch, Reggiolo, Italy
Comer Industries celebrates 40 years of business. The notarial deed
with which Fabio, Fabrizio and Oscar Storchi founded the unlimited
partnership CO.ME.R. – Costruzioni Meccaniche Riduttori – special-
ized in the manufacture of mechanical transmissions for agricultural
machinery, is dated March 24, 1970.
It was the beginning of the success story of Comer Industries, global
leader in the design and production of advanced engineering sys-
tems and mechatronic solutions supplied to major manufacturers of
agricultural equipment, industrial machinery and renewable energy
applications worldwide (see picture, 40th anniversary logo).
Smart irrigation gives rise to a new approachApril, Reggio Emilia, Italy
Comer Industries presents its mechatronic GP2 solution for hose reel
irrigators during the “Innovation Day”, the research and development
event organized by the Faculty and Department of Sciences and
Engineering Methods in the University of Modena and Reggio Emilia.
The revolutionary system (see picture), developed in collaboration
with other companies in the industry and with public bodies includ-
ing ENAMA (National Institute for Agricultural Mechanization), helps
to safeguard the environment, ensuring a smart management of the
irrigation process and optimizing water distribution.
Comer Academy, second year of activityMay, Reggiolo, Italy
Comer Academy, the internal training and management school with
the objective of enhancing the professional skills of personnel and of
promoting organizational and cultural change, continues its intensive
training activities. 88 courses held, 8,600 training hours offered, 71%
of personnel involved in 2010.
The new MyComer.com portalJune, Reggiolo, Italy
A new structure, new contents and a new look for Comer
Industries’ intranet portal on SAP platform.
MyComer.com has been developed to provide staff with a tool
for collecting and sharing information and company procedures.
Aimed at optimizing relations both internally and with partner or-
ganizations, the project is destined to grow over time, supporting
change for the continuous improvement of processes.
SECOND quARTERFIRST quARTER
10

The innovation of Comer Industries at Expo 2010July, Shanghai, China
Comer Industries takes part in the “Italy of innovators” exhibition,
during Expo 2010, with its mechatronic hose reel irrigation system
E-GPF, selected among 454 projects to represent the cutting edge
technology of Italian companies.
The event was held from July 24 to August 7 in the Italian pavil-
lion (see picture), one of the most visited during the great show in
Shanghai. The solution developed by Comer Industries receives
unanimous appreciation for its ability to integrate the drive with the
electronic wireless control and the GPS positioning system for a
complete automation of all the operating phases and for a sustain-
able use of the water resources.
Awarded as one of the most innovative Italian companiesJuly, Rome, Italy
Comer Industries, selected out of 671 participating companies,
receives a special mention (see picture) in the 2010 edition of the
“Enterprise Award for Innovation”, a competition organized by
Confindustria in collaboration with Associazione Premio Qualità Italia
(Italian Quality Award Association).
ThIRD quARTER
Meeting with the Kaizen guru October, Reggiolo, Italy
A day at Comer Industries with Professor Masaaki Imai. The father of
the Kaizen method (Kaizen = change for the better) and founder of
the Kaizen Institute is the company’s guest for a public conference on
the Kaizen concepts concerning organization excellence.
Visiting the production sites in Reggiolo, Professor Imai (see picture,
between Fabio and Fabrizio Storchi) appreciates the progress made
by Comer Industries since the introduction of this method and gives
useful advice for continuing along the path of change.
EIMA 2010 Technical Innovation AwardNovember, Bologna, Italy
A new prize for Comer Industries’ capacity for innovation. The
AJC (Active Jump Control) mechatronic system wins the Technical
Innovation Award at the 2010 edition of EIMA, the most important
trade fair dedicated to farming mechanization.
The AJC patented system – designed for cutting bars and other har-
vesting equipment – ensures uniform results in variable land surface
conditions.
The Comer Industries case study at SAP World TourNovember, Milan, Italy
The ICT model project supporting the Comer Production System
(CPS) is presented at a conference during the “SAP World Tour
2010”, held at the Congress Center in Assago Milanofiori. The event
is an opportunity for the multinational German leader in the manage-
ment software sector to meet and exchange views with a number of
its important Italian customers.
FOuRTh quARTER
11

12

Competence
13

Involvement, constructive attitude, com-mon aims, attainment of objectives for continuous improvement. These are the aspects characterizing the partici-pation of Comer Industries’ employees and collaborators in the deep cultural change introduced in the company since 2009.To face the evolution in the macroe-conomic scenario and with a view to promoting growth in the long-term, the company is committed to simplify and rationalize its processes, to create a lean organization able to react quickly to evolving demand. The excellence of Comer Industries is achieved through its people, called upon to upgrade their professional level and broaden their skills.
Comer Academy, a driver of changeIn its second year of activity – estab-lish mid-2008 – Comer Academy, the in-house training and management school, has played an important role in developing human resources and en-hancing abilities through an intensive and targeted training program. The 88 courses held in 2010, for a total of around 8,600 education hours of-fered, involved 71% of company per-sonnel. The main areas covered were the CPS-Kaizen (accounting for 35.1% of the Academy’s activities), safety and the environment (26.1%), technical-spe-cialist (22.3%) and managerial (16.5%) (see p. 15).
The main training projects started in 2010Comer Academy has been an es-sential vehicle for ensuring the ef-fective implementation of the Comer Production System (CPS) (see p. 22). During 2010 the school held a course at an inter-departmental level for pre-paring Kaizen Coaches: experts in the use of tools associated with this meth-odology lending their professionalism to their colleagues and encouraging the opening of CPS workshops.The personnel in the Production, Times and Methods, Logistics and Quality areas was involved in Total Flow Management (TFM) program, with the goal of learning the principles and techniques for the improvement of flows, with significant benefits in terms
People: at the heart of change
14

of productivity, space arrangement, re-jects reduction and the optimization of process times. Besides lessons held in the classroom, also TWI (Training Within Industry) was applied, a pro-gram based on the learning-by-doing approach, with sessions organized in the production sites where the Kaizen workshops are already operating. A specific training program was set up for the Purchasing department: in particular, a course was designed to examine negotiation tools and tech-niques, with the objective of achieving better results in negotiations with sup-pliers.Executive personnel took part in the Public Speaking workshop, aimed at ameliorating communication in Comer Industries at all levels, and in the Time & People Management course, to identify areas for improvement in time scheduling and for the effective lead-ership of people and work groups. To encourage the diffusion of a par-ticipative culture, Comer Industries arranged meetings with workers, in which the projects for change were explained and shared.
A new work organization: the effects on business and peopleThanks to more productive com-munication, which have gener-ated a strong team spirit, people have welcomed the new approach
focused on better results and ef-ficiency. As a consequence, it was possible to introduce a new work organization model which optimizes the plant exploitation: weekly sched-ules of 17 and 16 shifts were started in the production sites of Moglia and Reggiolo. This allowed Comer Industries to return to growth in the second half of 2010, interrupting the use of social safety net provisions al-most everywhere – Cassa Integrazione Guadagni Ordinaria – Wages Guarantee
Fund – and Contratto Di Solidarietà – Job-security agreements – widely used during 2009.This renewed competitiveness also had positive effects on employment levels: in the last 12 months staff numbers grew by 6%, reaching 1,217 people. Of these, 12% are female, while non-Italian workers account for 16% of total workforce.
Evolution of the ASC projectThe Appraisal System Comer (ASC) project also continued in 2010: after its debut by courses held by Comer Academy, the company system for appraising workers’ performance and conduct, within a growth perspective, was extended to the entire office staff, more than 450 people in Italy and abroad.
Involvement, constructive attitude, common aims, achievement of objectives for continuous improvement. These are the aspects characterizing the participation of Comer Industries’ employees and collaborators in the deep cultural change introduced in the company since 2009.
Comer Academy, the in-house training and management school, has played an important role in developing human resources and enhancing skills through an intensive and targeted training program.
26.1%training re safety-environment
16.5%managerial training
35.1%trainingre CPS-Kaizen22.3%
technical-specialisttraining
Comer Academy - training areas
(% of total internal training hours - 2010 data)
15

Ensuring real and sustainable growth while minimizing pollution, global warming and the exploitation of natu-ral resources: this is the foundation of the green economy, a commit-ment involving the governments of the most developed countries and a rising number of companies.According to the latest “Green Economy” report issued by the United Nations Environment Program, renew-able sources account for around 15% of the global energy demand: a percent-age expected to double by 2050.Closely focused on the evolution of the global scenario, over the years Comer Industries has acquired the ability to respond to the increas-ingly changing requirements of the customers. Its technological and process specialization allows the company to be actively involved in this green revolution, designing and implementing solutions for strategic partners sharing the same environ-ment sustainability goals.
The future of automobiles: electric vehiclesIn 2010, the most interesting improve-ments concerned electric cars. As con-firmed by the increasing investments in Research and Development of automo-bile manufacturers, this is a market with exponential growth rates.According to a survey by the US Department of Energy, considering both private mobility and metropolitan service fleets, the number of electric hybrid vehicles sold jumped from 9,350
in 2000 to 274,210 in 2010. In addition, in line with the forecasts of the Obama Administration, by 2015 one million elec-tric vehicles will be driven on US roads.
Mechanical drive for Mia Electric electric city carsFor Mia Electric, a French company and global leader in the manufacturing of electric vehicles, Comer Industries has designed a mechanical drive for city cars (see pictures). This solution consists of a differential gear distin-guished by high rotation speed able to satisfy demanding efficiency and silent-operation requirements.The drive was developed by Comer Industries starting from partner speci-fications and adopting a New Product
Development pattern typical of the au-tomotive industry. The reference model is the Advanced Product Quality Plan (APQP): to minimize the risk of faults, product and production process are planned jointly. The system is currently undergoing tests and validation at the Reggiolo Mechatronics Research Center.
New development drivers from the green economy
Comer Industries has acquired the ability to respond to the increasingly changing requirements of the customers.Its technological and process specialization allows the company to be actively involved in the green revolution.
16

Comer Industries growth strategies are based on product innovation, as confirmed over recent years by the impact of new solutions on total turn-over: one third of the 2010 revenues comes from products developed in the last three years.Besides the mechanical drive de-signed for electric city cars (see p. 16), Comer Industries also presented other innovative products: the S128 differen-tial axles, solutions for multi-megawatt (MW) wind turbines and drives for high capacity combine harvesters.
S128 differential axles The S128 rigid and steering differen-tial axles can be used both for road vehicles such as sweepers and air-port tractors and for off-road applica-tions such as the telehandler, with a load capacity of up to 3 tons, and the compact front loader, with an empty weight of 6 tons.
This solution features compact di-mensions, excellent load and power transmission capacity, thanks to the top quality of the critical components and cutting-edge CAD simulation programs. Compared to old genera-tion axles, the S128 model ensures upgraded efficiency in order to cater for the growing needs of manufactur-ers in terms of energy saving and cut-ting emissions.
The new solutions for multi-MW wind turbinesAccording to the Global Wind Energy Council, in 2010 installed wind power capacity rose at global level by 22.5% compared to the 12 pre-vious months, reaching 194.4 GW. For the first time, more than half of such power increase has involved markets other than traditional North America and Europe: 16.5 GW of the new 35.8 GW were in fact installed in China, the new world leader in terms
of capacity, followed by the USA.In the Asiatic region, Comer Industries has strengthened its presence in the wind power sector. Thanks to the contribution of the Mechatronics Research Center, in late 2010 the company presented the first drive prototypes for 5 MW wind turbines; this is a specific class of multi-MW turbines, destined to become the standard of the future for offshore wind farms. The Comer Industries product range now includes multi-stage planetary drives such as the PG 3000 pitch drive system, and the PG 6500 yaw drive system. These products adopt engineering solutions to ensure reduced weight and overall dimensions, providing for the specific requirements of the multi-MW class turbines in terms of efficiency, reliability, aerodynamic performance, production capacity in case of low wind speeds and noise reduction.
Cutting-edge engineering and technological solutions
What our customers say about us > Claas
The cutterbar drive for highcapacity combine harvesters
The company Claas, leading German manufacturer of agricultural
machines, is using a drive from Comer Industries in its 10.5 meter
and 12 meter cutterbars for combine harvesters.
«Ever larger combine harvesters with ever higher performance call for cut-terbars with similarly enhanced dimensions and capacity. And, of course, the great thing about higher performance is that it means lower costs.Claas’s cutterbars are driven on both sides via transmissions and driveshafts and are therefore able to meet the most demanding requirements. The tele-scopic driveshaft allows the divided knife to operate at a high cutting fre-quency in all table positions. The synchronized transmission drive makes for optimum low-noise operation while the driveshafts ensure slip-free power transmission – and all with minimal maintenance requirements.The knife drives on each side are protected against overload by shear bolts while protection for the intake auger is provided by a cam-type power inter-ruption clutch. These features mean that harvesting operations can proceed quickly and safely».
17

Investing in organization, product and process innovation is the policy that enabled Comer Industries to grow significantly during its first forty years of business and become global leader in the power transmission sector.
The Mechatronics Research CenterThe Mechatronics Research Center of Reggiolo plays an essential role in developing new solutions. In this fa-cility, which extends over a total sur-face area of 1,500 m2 and features 11 soundproofed test rooms, in 2010, 150 customer requests were complet-ed with a total of about 36,000 testing activities hours.
The partnership between Comer Industries and ENAMAComer Industries can also rely on stra-tegic alliances with the academic world and with public Research Institutes in terms of innovation and research.The important partnership with the National Institute for Agricultural Mechanization (ENAMA) started in
2009 with the mechatronic hose reel irrigation system E-GPF, which took the Gold Medal at the SIMA Innovation Awards 2009; cooperation between Comer Industries and ENAMA contin-ued through 2010, concretizing in the AJC smart package, the first feedback control solution in the agricultural field for the active management of the ad-herence of cutting bars and other har-vesting machinery to the soil.The patented system grants uniform results in variable soil surface condi-tions thanks to a system of anti-detach-ment springs, electronically-controlled shock absorbers, accelerometers and a control unit.The AJC system ensures remarkable advantages: maximization of the prod-uct, reduction of cut irregularities and operating time, lower product contam-ination and less need for maintenance.The great usefulness of the AJC me-chatronic system developed by Comer Industries in increasing the quality of the performed operations is confirmed by the EIMA 2010 Technical Innovation Award.
The future-oriented program of R&D
18

19

20

Competitiveness
21

Comer Production System: the road to excellence
In 2010, Comer Industries has ex-tended the application of the Comer Production System (CPS) to the newly integrated manufacturing pro-cess control model adopted in 2009.Based on Lean Organization princi-ples and according to Kaizen prac-tices, the CPS was introduced in all Operating Units through pilot work-shops in the critical areas of each facility. This method is enabling the compa-ny to boost its performance ratings to world class level, to cater to cus-tomer requirements, reduce stocks and achieve greater flexibility and speed in the logistics and process-ing chain.
Involvement of all personnelCrucial for achieving these results is the deep and widespread involve-ment of all the personnel: more than a technical and process revolution, for Comer Industries CPS is a deep cultural change. All people have been asked to provide ongoing commit-ment to gradually elevate work stand-ards, with a real savings in terms of cost and higher quality: the goal is
excellence, obtained through the zero defects, inventories and acci-dents.In Comer Industries, improvements are departmental, determining the workstation where the problem has appeared. The root causes are iden-tified and eliminated while implemen-tation of a standardized solution pre-vents it from reoccurring.
Thanks to the deep and widespread involvement of all the personnel, the CPS is enabling to boost the company’s performance ratings to world class level, to cater to customer requirements and achieve greater flexibility and speed in the logistics and processing chain.
In 2010, the application of the CPS model has yelded financial benefits to Comer Industries for approximately one million euros. The expectation for 2011 is to decrease production costs by another 1.4 million euros.
22

The CPS temple
A temple is the symbol of CPS struc-ture, whose base contains the main values and seven methodological pil-lars supporting the strategic objectives of Comer Industries:
1. flow production and workplace or-ganization: in order to speed up the production flow, workplaces must be arranged to reduce useless move-ments and upgrade neatness and cleanliness;
2. logistics: Comer Industries requires the integration of its suppliers, asking them to constantly and smoothly supply the lines according to Just In Time logistics. This method allows
the company to produce what the customer demands when necessary, without restrictions of minimum quan-tities while reducing cost and lowering inventories;
3. Total Productive Maintenance (TPM):operator and service technician skills are upgraded to reduce and prevent plant breakdowns and keep them working properly;
4. Total Quality Management (TQM): all people are involved on a daily basis in analyzing any faults detected along the process line with the aim to optimize efforts and total quality (zero defects);
5. safety and environment: procedures are standardized and people are ac-tively committed to reducing accident risks and environmental impacts to the utmost (no injuries, no damage to the environment, see p. 37);
6. New Product Development (NPD): Comer Industries has adopted an automotive model for the product development process, which consid-ers interaction between design, pro-duction, supply chain and quality, to develop innovative solutions able to satisfy customer demands in terms of performance, cost, launch time and reliability;
7. continuous improvement: this re-quires the direct and widespread in-volvement of human resources. In this perspective and with training sessions organized by Comer Academy, Comer Industries set its organization on a path towards excellence, with a CPS Manager in charge of the transforma-tion program. The CPS Manager is supported by seven pillar leaders, with the task of implementing each pillar.
The introduction of CPS is a radical change positively influencing people’s job performances and focusing them on constant improvement. Comer Industries is strongly committed to encouraging the progressive application of this method in all its Operating Units, increasing the efficiency of each of them and of the company as a whole.
People
Continuous Growth
Product and Process Excellence
People involvement
Standard PDCA Motivation Teamwork
1. F
low
pro
duct
ion
and
wor
kpla
ce o
rgan
izat
ion
2. L
ogis
tics
3. T
PM –
Tot
al P
rodu
ctiv
eM
aint
enan
ce
4. T
QM –
Tota
l Qua
lity
Man
agem
ent
5. S
afet
y an
d en
viro
nmen
t
6. N
PD –
New
Pro
duct
De
velo
pmen
t
7. C
ontin
uous
impr
ovem
ent
23

The CPS workshops set up in Comer IndustriesCPS workshops have been set up in all Comer Industries Operating Units, with a total of 25 projects. The most im-portant experiences in terms of results achieved – which received the end-of-year CPS Award – were conducted at Cavriago, Moglia and Reggiolo.In Planetary Drives, the project in-volved the shipping department and the assembly lines of construction machinery products: facility layout was changed to set up a dedicated area, obtaining a significant savings of space and improved workplace organization. Productivity increased from 10% to 30%, depending on the initial conditions of the line involved.In the Moglia plant, machines were positioned according to the machining cell criteria, to produce one piece at a time, reducing inventories and inter-mediate dead times: this allows shorter delivery times to customers by over 10 days. Furthermore, thanks to the “We Make Quality” project, rejects were re-duced by 50%, decreasing the faulty Parts Per Million (PPM). At Reggiolo, in the Gearboxes Operating Unit, 50% of the assembly lines were transformed according to the Kaizen model, elimi-nating activities with no added value, maximizing ergonomics and optimiz-ing occupied space. Overall produc-tivity increased by 20% (with peaks of 35%). In the Zero Defects workshop of the Gearboxes machine department, the number of rejects has already been reduced by 50%.
The benefits of the CPS modelIn 12 months, the application of the CPS model has yielded financial ben-efits to Comer Industries for approxi-mately one million euros. The expecta-tion for 2011 is to decrease production costs by another 1.4 million euros, to partially offset the strong rise in the raw materials costs of the recent months.The importance of the CPS results in boosting the performance of Comer
Industries has been acknowledged by Professor Masaaki Imai, President of the Kaizen Institute, during his visit on October 13, 2010 at the company’s Gearboxes Operating Unit. After seeing the progress made, Imai delivered to Fabio Storchi, President and CEO of Comer Industries, the Kaizen Spirit certificate, affirming that «[…] the application of Kaizen in Comer Industries is achieving, step after step, standards of excellence at
global level. The Kaizen spirit and its values are widely and constantly ap-plied».
The extension of the CPS to the supply chain In 2011 Comer Industries expects to extend the CPS method to the rest of its supply chain, including provid-ers and clients.Considering the important role of the suppliers for the customer value
24

creation process (80% of the cost of the company’s products comes from external supplies), Comer Industries has decided to support them in changing their organiza-tions to attain excellent quality and
service standards.In the customer service area, a new project will review the order man-agement process and sales plan-ning to further upgrade the reliability of information and market delivery.
Masaaki Imai, President of the Kaizen Institute: «The applicationof Kaizen in Comer Industries is achieving, step after step, standards of excellence at global level. The Kaizen spirit andits values are widely and constantly applied».
25

Investments in the Information and Communication Technology (ICT) sys-tem have made a significant contribu-tion to Comer Industries’ competitive-ness during 2010. The entire technological infrastructure has been updated as part of a con-tinuous improvement approach, with a view to optimizing performances, reli-ability and flexibility, and at the same time considerably reducing manage-ment costs.
Strengthening the data network and the benefits of virtualizationIn 2010 Comer Industries moved its SAP systems onto a new technologi-cal platform that allows for virtualiza-tion and for sharing available hardware resources without leaving any of them unexploited, adding equipment as re-quired, ensuring continuity and flexibil-ity for business operations. Comer Industries’ electronic mail system is also new (the server manages around 700 mailboxes): this choice comes from the need to grant greater security and to manage an increasing volume of data for internal and external communication.The strengthening of the 23 data lines that connect the company’s sites to the central Datacenter is the important final complement of a reorganized and updat-ed infrastructure able to support Comer Industries’ growth in the coming years.
ICT supporting the CPSThe evolution of the Information Technology system has fostered Comer Industries’ adoption of a Kaizen approach, started with the introduc-tion of the Comer Production System. In 2010, a new manufacturing flow scheme was set up in the Operating Unit of Matera, identified as a pilot workshop with the aim of improving planning ability, starting from the fore-cast of market trends and the analysis of their impact on the internal produc-tion line and on the supply chain.At the same time in the Reggiolo fac-tory, the procurement system for the assembly lines was optimized and the programs were implemented for inte-grating customers and suppliers deliv-ery schedules into the company’s ICT system. The factory of Cavriago hosted the de-velopment team working on the proto-type for interfacing the machine tools with the central information system, for monitoring the plant in real time.
The entire technological infrastructure has been updated as part of a continuous improvement approach, with a view to optimizing performances, reliability and flexibility, and at the same time considerably reducing management costs.
The renewal of the ICT infrastructures
26

BI projectsBusiness Intelligence (BI), the activities directed towards collecting, organiz-ing and examining data for supporting company strategies, got under way in Comer Industries with the creation of a Data Warehouse for the sales area. Information is now acquired us-ing uniform criteria and codes, mak-ing it possible to extend the range of analyses and to improve the reliability and punctuality of its processing and distribution.In 2011 the BI tools will be consoli-dated and extended to other company areas, with the objective of summariz-ing them in a series of key indicators for management.
ICT for human resourcesDuring the year Comer Industries laid the base for the introduction of a cen-
tralized Human Capital Management system. The functions provided by a special SAP module allow for central administration of all the events con-cerning employees’ working lives: it’s an essential foundation on which to build future development, training and assessment projects for Comer Industries’ personnel.
The new MyComer.com portal Comer Industries’ ICT activities in 2010 included the introduction of the MyComer.com portal: created as an evolution of the Intranet, it is an inte-grated tool for gathering and sharing all company procedures and informa-tion. Further developments are planned in order to strengthen online communi-cation both internally and with partner organizations.
27

Competing and developing on the global markets requires a careful manage-ment of production resources. As part of the changes implemented by Comer Industries for continuous improvement, an analysis of all operating sites has been carried out in relation to company strat-egies. The result has been the approval of an important investment program for the period 2011-2014. The plan takes into consideration many variables: the expected scenario in the next 3-5 years with reference to volumes with break-down of the different market sectors by geographic areas, including emerging countries; the technical evolution of prod-ucts and processes; the manufacturing and service demands of main custom-ers; current output capacities and man-agement costs of the production sites.
The strengthening of Comer Industries ComponentsExtension works of the Matera plant are expected to finish in 2011, with an in-crease of around 8,200 m2 of the total surface area. With an overall investment of around 18 million euros, the manufac-turing lines of planetary drives for wind turbines and their main components will be expanded with the introduction of new robotic machine tools and new systems for heat treatments and for painting finished products.
As a result, the annual output capacity of the Matera Operating Unit will ex-ceed 100 million euros, against the cur-rent value of approximately 60 million.
Integration of the production unitsin CavriagoDuring 2011, the production units of drives for industrial applications and of drive axles will be united into the Cavriago facility with an investment of around 2 million euros. The operation will foster a more efficient
The new industrial plan will allow Comer Industries to make significant enhancements in efficiency and to push qualitative levels towards zero defects, optimize internal logistical resources and improve operators’ working environment and conditions.
The new industrial plan
28

utilization of the site’s industrial capac-ity which, at full stretch, will achieve more than 120 million euros per year.
Rationalization of the agricultural application sector in ReggioloWorks for integration and extension of the Reggiolo factories for the as-sembly of products for agricultural applications will also start in 2011. Investments for more than 12 million euros are planned, with a new in-dustrial area of around 5,000 m2, the complete refurbishment of another 4,800 m2, new assembly plants, a modern painting system and a lo-gistics center. As a result, the output capacity of the Reggiolo facilities for agricultural applications will exceed 135 million
euros per year, against the current value of approximately 90 million. Thanks to the gradual implemen-tation of the Comer Production System (CPS), the new industrial plan will allow the company to make significant enhancements in effi-ciency and to push qualitative lev-els towards zero defects, optimize internal logistical resources and im-prove operators’ working environ-ment and conditions.
Future programs in a globalperspectiveIn the coming years, further invest-ments will involve other product lines and the working processes current-ly in place in China. The goal is to strengthen Comer Industries’ com-
petitiveness on international mar-kets – consistently with consolidated policies that provide for keeping in Italy Research and Development strategic activities and the manu-facture of goods with a high tech-nological content – with a significant consequential increase and upgrade of human resources.The adopted changes aim at satis-fying the demands of large global manufacturers needing for reliable partners throughout the world, also in other countries, where they have established or intend to establish new production sites: to ensure them high value solutions at com-petitive prices directly to their as-sembly lines, with a punctual and efficient service.
29
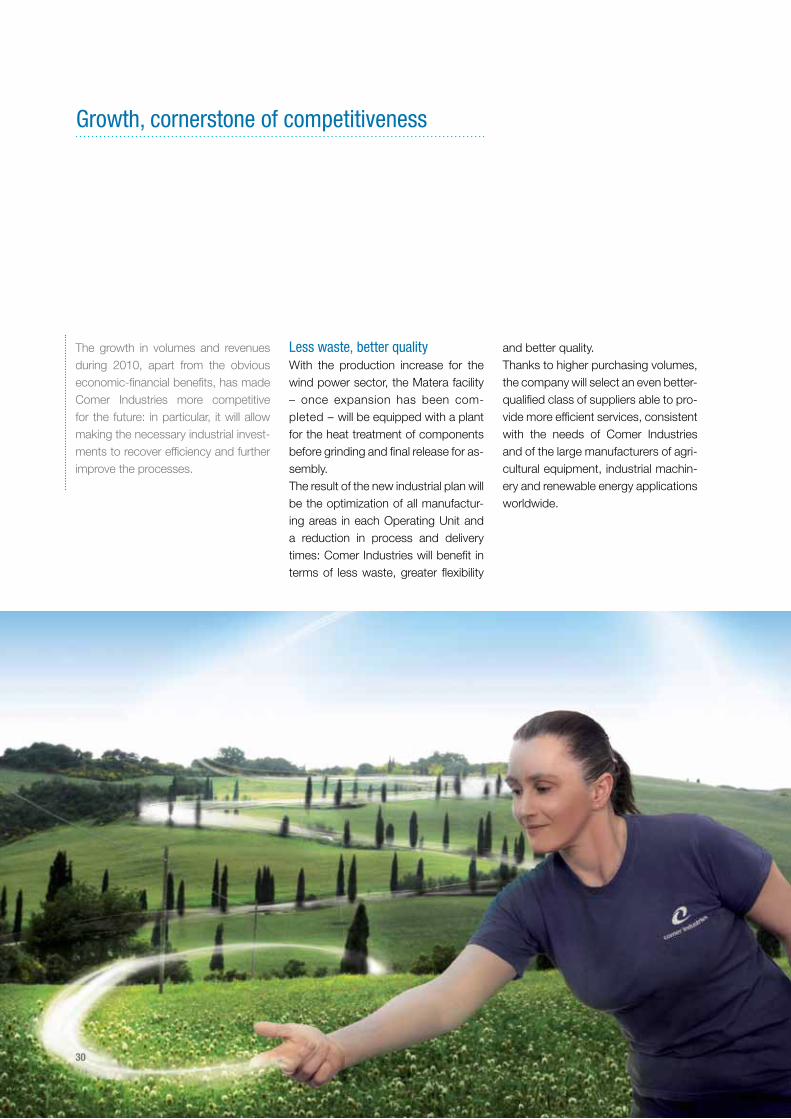
The growth in volumes and revenues during 2010, apart from the obvious economic-financial benefits, has made Comer Industries more competitive for the future: in particular, it will allow making the necessary industrial invest-ments to recover efficiency and further improve the processes.
Less waste, better qualityWith the production increase for the wind power sector, the Matera facility – once expansion has been com-pleted – will be equipped with a plant for the heat treatment of components before grinding and final release for as-sembly. The result of the new industrial plan will be the optimization of all manufactur-ing areas in each Operating Unit and a reduction in process and delivery times: Comer Industries will benefit in terms of less waste, greater flexibility
and better quality.Thanks to higher purchasing volumes, the company will select an even better-qualified class of suppliers able to pro-vide more efficient services, consistent with the needs of Comer Industries and of the large manufacturers of agri-cultural equipment, industrial machin-ery and renewable energy applications worldwide.
Growth, cornerstone of competitiveness
30

Business development in China
In 2010, China became the world second-largest economy after the United States, pushing Japan to third place.Comer Industries has achieved posi-tive results in a market that grew by 10.3% compared to 2009. In 12 months the turnover generated by Comer Industries (Shaoxing) Co. Ltd. almost quadrupled, thanks in particu-lar to the strengthening of the part-nership with the leading Chinese pro-ducers of wind energy. This goal was reached by supplying them planetary drives for pitch and yaw systems. Many of the major European wind pow-er players have also chosen Comer Industries for their local production in China, confirming the company’s strategy of geographical proximity.
Reorganization of the Shaoxing structure The remarkable volume increase in China has been supported by an ex-pansion of the resources dedicated to the administration of the Shaoxing factory, setting up a recruitment and upgrading program for management and for second-level employees. Around fifty new workers were hired, for a total workforce at the end of 2010 of 118 people (in addition to the 17 people working in the sales office in Shanghai).This strengthening has mainly in-volved the production, quality control and logistics departments. Targeted
training – compatible with Comer Industries’ general objectives – and specific courses dedicated to the de-mands of the Chinese market were held for all key personnel.
Strategic suppliesThe reorganization of the Chinese plant also involves the selection and development of qualified local suppli-ers who can adequately support the growth in volumes. The purchasing structure has been enhanced with the introduction of new management personnel for the coor-dination of materials and goods con-nected with Shaoxing’s manufacturing site and of finished products handledby the sales office. With regards to the future, the new set-up of the production structures as part of the general industrial ration-alization plan is currently under review (see p. 28).
Not only wind powerComer Industries is also present in the large Asian market with other products and mechatronic solutions for agricul-tural and industrial application; the de-mand from these sectors is destined to raise significantly in coming months.
The future from the Orient’sperspectiveChina, where Comer Industries has been operating for more than two decades, is getting more and more important as part of the company’s development strategy, a trend that will continue to characterize the next few years. The Chinese Prime Minister, Wen Jiabao, has announced a decrease of the economic growth target for his country to 7% for the five-year period 2011-2015 (the previous forecast of 7.5% in the last six years was always widely exceeded), and a commitment to contain inflation, with a view to more sustainable expansion, also regarding environmental impact.According to the International Monetary Fund, in 2011, economic growth is ex-pected to be slightly under 10%.
In 12 months the turnover generated by Comer Industries (Shaoxing) Co. Ltd. almost quadrupled, thanks to the strengthening of the partnership with the leading Chinese producers of wind energy.
31

BRIC, emerging markets for growth
Comer Industries is a global organiza-tion that adopted geographical prox-imity to its customers as an important competitive strategy: this involves in-vesting in countries where the major manufacturers of machines for agri-culture, industry and the production of renewable energy are focusing their activities, with the aim of meeting their demand in terms of production and service in an increasingly effective way.
The future of businessComer Industries is paying great atten-tion to the development area known as the “BRIC” group of countries (Brazil, Russia, India and China). According to the International Monetary Fund’s World Economic Outlook, China (together with India) is the economy with the highest growth in 2010: GDP expanded by 10.3% over the previous 12 months. To make a comparison, in the same
period the GDP of the advanced econ-omies rose by 3%. Brazil had a bet-ter performance after a difficult 2009, seeing its GDP increase by 7.5%. Russia also registered growth.
Brazil, a new leading playerFor Comer Industries, China and Brazil are enjoying an increasing role in the world economy (see p. 31).In the South American country, where the company is examining the possibil-ity of setting up a sales subsidiary, the agricultural mechanization business is expected to grow at double digit rates and the prospects of expansion of the road and construction industry are even more significant. In view of the football World Cup in 2014 and of the Olympic Games in 2016, Brazil will implement a renewal project including its infrastruc-ture network and city planning.
32

Geographical proximity to the customers as an important competitive strategy: Comer Industries is investing in countries where the major manufacturers are focusing their activities,with the aim of meeting their demand in terms of production and service in an increasingly effective way.
33

34

Continuity
35

A solid financial base for development
The prospects for development of Comer Industries are closely linked to its financial stability. Also in 2010, the company continued to consist-ently and effectively increase its fi-nancial cash position, achieving a sharp reduction in indebtedness: from around 48 million euros in 2009, this figure fell to an amount of less than 28 million euros.
Almost equal to EBITDA This ratio, nearly the same of EBITDA, proves the economic soundness and confirms the company’s poten-tial ability to reimburse its debt in a single fiscal year: an excellent finan-cial condition, especially considering that only a part of Comer Industries’ debt position is short-term. In a competitive global scenario that is only partially recovered in pro-ductivity and profitability, but is still facing financial difficulties, Comer
Industries can put renewed trust in its approach towards the new mar-ket challenges and with regards to the significant investments it is com-mitted to make.This positive situation is the result of the company’s efforts to react quick-ly to an unprecedented economic and financial turmoil: thanks to its solid foundations and evolutionary approach to process controls, all measures have been implemented with determination and flexibility.
Also in 2010, Comer Industries continued to consistently and effectively increase its financial cash position, achieving a sharp reduction in indebtedness.
36

Committed to sustainability and safety
In the last few years, Comer Industries has paid increasing attention to the environmental sustainability of its pro-duction activities and to safety.With the creation of the Environmental Quality Health and Safety (EQHS) Department, these themes have be-come an integral part of company management.
The commitment to sustainabilityWith the aim of gradually reducing its environmental impact, Comer Industries has fixed some voluntary targets, monitoring their achievement by the EQHS department. In 2010, action was focused on the production and supply chain. In the first case, the company implemented strategies for the separate collec-tion of consumable waste materials, replacing throwaway packaging with reusable and returnable solutions and a great effort has been devoted to the process for the disposal of used oils. With regards to the supply chain, Comer Industries’ commitment was reflected in the increased use of raw materials with less environmental im-pact.
Environmental certificationThanks to these improvements, Planetary Drives and Comer Industries Components have obtained the envi-ronmental certification. The company is planning to extend ISO 14001 stand-
ard certification to all Operating Units and to Subsidiaries by the end of 2011.
The focus on safetyOne of the main tasks of EQHS de-partment concerned safety: as set out in the Code of Practice and Conduct, adopted in accordance with Italian Legislative Decree 231/2001, Comer Industries is committed to safeguard-ing the health and safety of its person-nel in the workplace.Thanks to special training courses held in 2009 by Comer Academy to promote safe conduct based on indi-vidual responsibility (see p. 14), in 2010 the company set up the Safety for Us (SFU) pilot project in the Driveshafts and Gearboxes Operating Units. This schedule involves the organiza-tion of daily or weekly meetings in which the relevant team investigates the risks associated with single proc-esses: “near-miss” is the basic con-cept, and focuses on the indicators of potential accidents, even if the event fortunately does not occur. Near-miss management is a powerful tool for assessing risks and identifying system weaknesses and dangers.
Results of the SFu projectThe adopted model has had positive effects on the absolute number of accidents, on the Frequency Index, calculated as the ratio between the accidents occurring in a year and the number of working hours in the same period of time, and on the Severity Index, which expresses the average number of days lost by each worker as a consequence of accidents. Since the introduction of SFU in March 2010 in the Gearboxes machine de-partment in Moglia, no accidents were reported in the following nine months, while in the Gearboxes assembly plant, where the project was applied to a specific production line, the level of accidents decreased by 30% over the previous year.
Future safety initiativesIn 2011 SFU will be extended to other Comer Industries Operating Units, with the objective of implementing an effective safety management system at a general level, to obtain the OHSAS 18001 (Occupational Health and Safety Assessment Series) certification by the end of 2012.
Comer Industries is planning to extend ISO 14001 environmental certification to all Operating Units and to Subsidiaries by the end of 2011. The Safety For Us project has had positive effects on the absolute number of accidents and will be applied in all O.U.
37

According to the International Monetary Fund, the recovery start-ed in 2010 will continue in 2011. On the basis of IMF forecasts, the global economy will grow this year by 4.4%, with an estimate of +4.5% for 2012.
The IMF’s outlookThe large oriental markets will once
again play an increasing role, led by China (+9.6%) and India (+8.2%). The GDP of the United States should rise by 2.8%, in the euro zone by 1.6% (only +1.1% in Italy). Among the emerging countries, the forecast is +4.5% for Brazil and +4.8% for Russia. The prospect of a generalized upturn for the period 2011-2014 is confirmed but the recovery will still, however, be slow in western countries, and particu-
larly in Europe. The macro-economic scenario also contains several elements of risk, such as the repercussions of the natu-ral disasters in Japan at the beginning of March, the impact of political ten-sions in North Africa on oil and energy prices, the return of inflationary trends due to the rising costs of raw materials and the high debt in many countries, especially in the US and euro areas.
Outlook for 2011
38

A year of growth Despite the general situation, Comer Industries’ outlook for development is very positive: the signs for 2011 show a significant recovery of the company’s reference sectors. Total turnover will grow substantially in 2011, with an expected return to the levels of 2008, before the crisis began. Notwithstanding the climate of uncertainty involving a rebound in
demand as a result of the inventory build-up and a rise in commodity prices, a significant volumes expan-sion is foreseen in both the European and North American markets, in the agricultural and industrial segments. For the Chinese area, 2011 should be a year of consolidation for Comer Industries, with a reduced margin-ality due to tougher competition on prices characterizing the wind
power sector, the company’s main business area in the Far East.
The industrial plan For 2011, Comer Industries an-nounced the reorganization plan of manufacturing activities (see p. 28): the first measures involve the exten-sion of the Matera plant, the consol-idation of production units for indus-trial application drives and of rigid and steering axles into the Cavriago facility and, at the end of the year, the expansion of the Reggiolo plant in Via Fermi.These investments, which will af-fect all Operating Units in the period 2011-2014, are aimed at containing costs and optimizing synergies be-tween different company divisions, to respond more effectively to the global customers’ demands and to gain competitiveness on the mar-kets. The new plan provides for the imple-mentation of the Comer Production System throughout the organiza-tion, in the factories as well as in the offices. The CPS method will be applied to the new product develop-ment process and gradually also to the supply chain (see pages 24-25).
New drivers for development 2011 is expected to generate new growth opportunities for Comer Industries, both in the production area, with transmissions for electric applications in the automotive sec-tor (see p. 16), and in the sales area, with a focus on emerging markets, such as Brazil, Russia and India (see p. 32).The company intends to reinforce its commitment to sustainabil-ity expanding standard ISO 14001 to all Operating Units and foreign Subsidiaries, and to safety, with the Safety for Us project in every fac-tory after the positive results ob-tained in 2010 with Driveshafts and Gearboxes (see p. 37).
Despite the general situation, Comer Industries’ outlook for development is very positive. Total turnover will grow substantially in 2011, with a significant volumes expansion in both the European and North American markets, in the agricultural and industrial segments.
39

1985Four foreign subsidiaries are set up to market products in France, Germany, Great Britain and the United States.
1998Opening of the representative office in Beijing for the industrial partner-ship with local suppliers: the first step of the company’s development in China.
1985-1990Comer grows both organically and through acquisitions, thanks to which the strategic diversification of the product range is implement-ed. The industrial line is introduced. Custom-designed solutions for the major customers are offered along-side standard products.
1970The Storchi family founds CO.ME.R. - Costruzioni Meccaniche Riduttori - specialized in the manufacture of mechanical transmissions for agri-cultural machinery.
Our first 40 years
1996Opening of the Mechatronics Research Center, a state-of-the-art laboratory dedicated to the company’s R&D activities. First mechatronic systems.
40
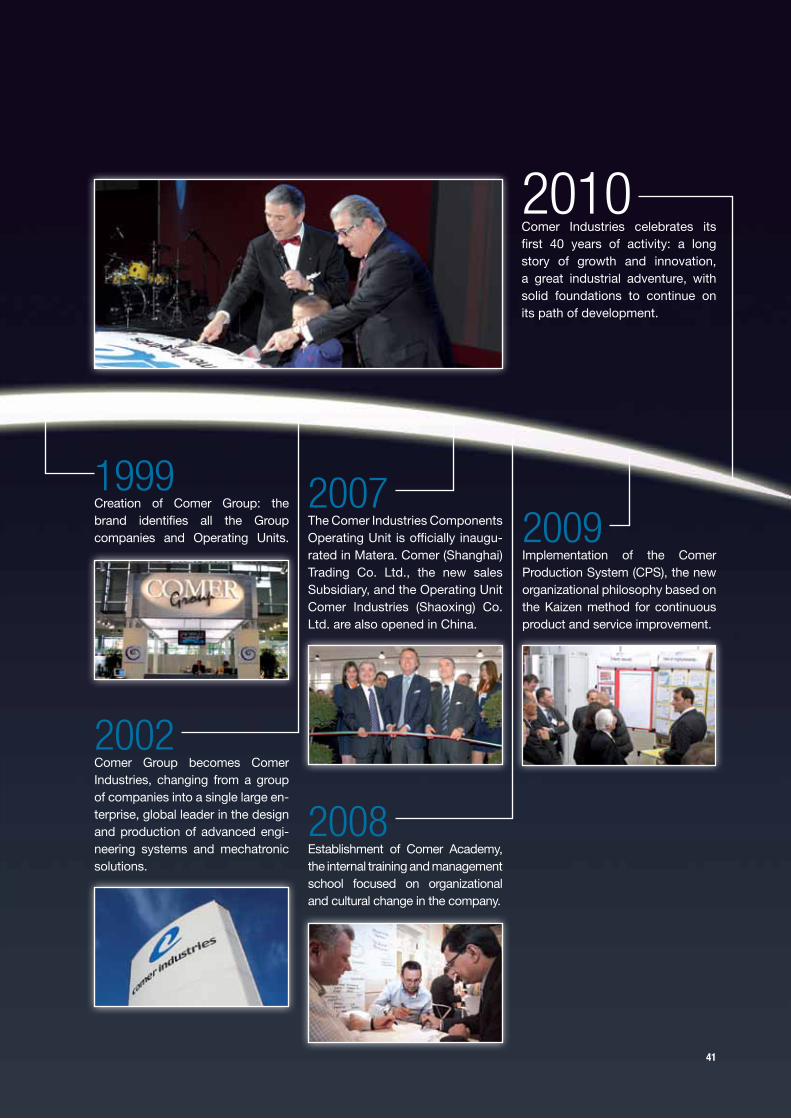
1999Creation of Comer Group: thebrand identifies all the Groupcompanies and Operating Units.
2010Comer Industries celebrates its first 40 years of activity: a long story of growth and innovation, a great industrial adventure, with solid foundations to continue on its path of development.
2009Implementation of the Comer Production System (CPS), the new organizational philosophy based on the Kaizen method for continuous product and service improvement.
2007The Comer Industries Components Operating Unit is officially inaugu-rated in Matera. Comer (Shanghai) Trading Co. Ltd., the new sales Subsidiary, and the Operating Unit Comer Industries (Shaoxing) Co. Ltd. are also opened in China.
2002Comer Group becomes Comer Industries, changing from a group of companies into a single large en-terprise, global leader in the design and production of advanced engi-neering systems and mechatronic solutions.
2008Establishment of Comer Academy, the internal training and management school focused on organizational and cultural change in the company.
41

Extract from the report on operations accompanying the consolidated financial statements at December 31, 2010
42

The figures presented here have been extracted from the report on operations accompanying the 2010 consolidated financial statements of Comer Industries Spa, approved on April 29, 2011 by the Shareholders’ Meeting.For more complete information, please see the full version duly filed at the Milan Chamber of Commerce.
43

Income statement overview
44
Revenues from sales and servicesThe sales figure slightly exceeded 276,500 thousand euros, with a net growth from 2009 of more than 35,000 thousand euros, or +14.59%. Once again this economic indicator was affected by the relationships among currencies, as the US dollar gained 5.2% in average value on the euro, while the Chinese yuan gained approximately 6.2%. Therefore, the net result of these dyna-mics generated a positive effect on the consolidated sales figures, compared to 2009, at approximately 4,900 thousand euros, offsetting a 3,900 thousand euros deconsolidation due to the sale of the Fluid Power Operating Unit at the end of last year. Overall we can observe a general reprise in our reference markets. Specifically, we registered significant performances in the industrial sector, particularly in the segments for compact construction and road machinery. As regards renewable energies, revenues from our wind generator applications increased further – thanks to the brilliant results achieved on the Chinese market. The agricultural application market also delivered more reassuring signs of recovery, driven by a widespread increase in demand, a consequence of the general growth in the prices of agricultural commodities, also linked to contingent factors in the second half of 2010.
Operating result (EBIT)The final absolute result was close to 19,500 thousand euros, with a 7.04% profitability on turnover; this represented a peak of excellence for the Group even compared to the recent pre recession past, as in 2008 this figure was 6.88%.Simplification and rationalization of Comer Industries organization started in 2009, a favourable monetary scenario (with the US dollar and Chinese yuan gaining on the euro), plus early relevant sign of saving and production efficiencies from the new CPS, are the key elements justifying these results, together with a physiological decrease in amortisation and depreciation as a tangible consequence of a reflective spell in production investments. The picture is completed by the internationalisation of certain critical production processes, as a direct consequence of investments mainly carried out between 2007 and 2008 and proximity in logistic and production aspects to a few key clients in the Chinese region.
Interest expense and other net financial chargesThe effect of net financial charges on turnover decreased from 0.87% in 2009 to 0.28% in 2010, so that the “interest co-verage ratio” operational index, as calculated on the EBITDA index, is a non-significant 35.39 times over positive. On the other hand, we should highlight that the EBITDA/net financial debt ratio is getting very close to 1. The financial operation results at -1,305 thousand euros compared to 2009, albeit apparently extraordinary, were expected and actually forecast since the early review of the operating budget, as a consequence of a decrease in the 3-month Euribor rate from a 1.2185% average in 2009 to a 0.815% average on 2010, amplified by an average approximately decrease by 50% of the Group’s debt as a further confirmation of the one-off year-end result of -42.16%.
Foreign exchange gains and lossesHere we have a negative result in absolute value of approximately 1,600 thousand euros (in 2009 Comer Industries registered a negative result of approximately 1,400 thousand euros), partly as a consequence of a constant gain of all major currencies on the euro that generated a 2,700 thousand euros loss to the parent company in coverage operations; these were only partially recove-red through a 1,100 thousand euros profit from foreign branches, in particular from transactions towards the Chinese currency. For coverage policies and exchange risk analysis, please refer to the corresponding section in the notes to the financial statements.
TaxationThis entry includes current income taxes of 5,875 thousand euros (3,111 thousand euros in 2009) and deferred tax costs of 622 thousand euros (compared to 1,823 thousand euros profit in the previous year). In 2009 the overall tax burden was an exceptional 50.16% due to dividend repatriation expenses and the Italian IRAP cost which, being non-proportional to the income, affected the gross operating margin gross of a relevant portion of the working cost that generated it. On the other hand, higher intermediated volumes in 2010 mitigated such distortion effects (particularly IRAP), thus improving the ratio to an adequate 37.80%, more consistent to the Group’s previous historic readings.

thousand euros
Actual IAS12/31/10
Actual IAS12/31/09
A) Revenues from sales and services 276,534 241,328
Other income and revenues 2,451 3,167
Changes in inventories 4,813 (37,520)
B) Ordinary production value 283,798 206,975
Material consumption/purchase costs (171,665) (115,018)
Service supply expenses (25,852) (23,612)
Other operating expenses (302) (385)
C) Added value 85,979 67,960
Labour cost (including effects IAS 19) (53,381) (48,443)
D) Gross operating margin 32,598 19,517
Amortization and depreciation (8,352) (8,796)
Other correction allocations (1,359) (900)
Third-party asset fruition fees (3,421) (3,687)
E) Operating result 19,466 6,134
Interest expense and other net financial charges (786) (2,091)
Foreign exchange gains/(losses) (1,618) (1,422)
Financial assets/liabilities fair values 125 (53)
F) Result before extraordinary entries and taxes 17,187 2,568
Income/(charges) from disposals - -
G) Profit before taxes 17,187 2,568
Income taxes (6,497) (1,288)
H) Result for the year 10,690 1,280
Third-party profit/(loss) - -
I) Parent company profit for the year 10,690 1,280
Consolidated income statement of production realized
45

Financial overview
«Profits are an opinion, cash is a fact».The quote, cited for the first time in 1986 in Alfred Rappaport’s work “Creating Shareholder Value”, is today still considered a landmark in the field of corporate management.The importance of controlling cash flow is now more essential than ever, also with regards to the calculation of the value of an enterprise for which, besides the criteria founded on the application of market multiples, the only credible algorithm is Discounted Cash Flow (DCF), based on the ability to generate liquidity in future periods. With the introduction of the Basle 2 criteria on the part of the banks, the focus on the possibility for a company to repay its debts in short time has become even greater. Today, the aforementioned affirmation is much more pertinent and important considering the increasingly reduced resources made available by the credit system. The global competitive scenario, still facing financial difficulties, is seeing the costs for raising money exacerbated and inflex-ible due to the continuous declassification of sovereign debts. In this context, Comer Industries has organized all its cash management activities in an effective manner, handling liquidity and cash collection successfully to minimize funding costs and to maximize the generation of free cash flow.With the collaboration of a few number of banking institutes, Comer Industries has been able to guarantee correct credit development, while continuing to maintain its economic-financial balance, appropriate equity index and a solid credit rating.The company’s treasury management has secured elasticity in the supply of funds (maintaining revolving, stand-by, im-mediately available and flexible credit lines) and, at the same time, efficiency in terms of the conditions applied, the use of different types of sources of funds and the rational use of overall supplies. The current financial debt structure is balanced between short-term credit lines (necessary to finance working capital) and long/medium-term credit lines (to cover non-current asset investments). For the issue of two new unsecured long/medium-term loans, made in the second half-year for a total of 6 million euros, Comer Industries Spa has not entered into any financial covenants in order to back them. Reference should be made, on the other hand, to the specific chapter of the notes to the accounts for more details regarding covenants in force on previously issued loans. In any case, is should be noted that as at December 31, 2010 all financial covenants had been fully complied with.The loan issued to the American subsidiary, Comer Industries Inc., by the Fifth Third Bank, guaranteed by financial cov-enants, is still in force for a residual amount. New lines of credit were opened in China to support the financial requirements of the Comer Industries (Shaoxing) Co. Ltd. Operating Unit.The prudent management of liquidity risk has required the maintenance of suitable bank credit lines, which at December 31, 2010 were still on the increase, despite the credit crisis, rising to 147,600 thousand euros compared to 139,400 thousand euros in the previous year, with an average use during the year of 35%.At December 31, 2010 the ratio between the net financial position and equity had clearly improved (+51%) compared to the previous year, with a gearing ratio of 0.35. Likewise, the ratio between the net financial position and EBITDA fell to parity for the first time in Comer Industries’ history, against 3.23 of the previous year.The net passive financial position dropped from 48,187 thousand euros at December 31, 2009 to 27,870 thousand euros at December 31, 2010.The continuous decrease in the company’s financial debt is mainly due to the improved result for the year, alongside a situ-ation of substantial balance between net flows of working capital and disbursements for investments.
46

The most significant balance sheet headings are referred to below:
Despite a significant rise in sales, Comer Industries has limited the increase in net working capital, generating a free cash flow a little under that generated in 2009, a year in which the considerable decrease in sales volumes led to a big reduction in working capital.In 2010, together with an operating working capital cash flow (self-financing cash flow) of 21,954 thousand euros, growing sharply compared to the previous year, there was a positive current operating free cash flow of 28,852 thousand euros, arising after changes in working capital.The combined effects of changes in inventories, in receivables, in expenditure for investments, in sales payables and in financial-equity management have generated a positive modification of the net financial position, resulting in a further de-crease in bank debt of 20,317 thousand euros, over 40% more than in the previous year. The positive trend of this indicator, which has fallen by more than 80% from 2009 to today, is therefore confirmed.
The Group’s debt at the end of 2010 breaks down as follows:thousand euros
Short-term for 13,395
Net short-term bank loans 13,395
Medium/long-term for 14,475
Medium/long-term bank loans 12,409
Medium/long-term bonds 2,066
thousand euros
Cash flow generated/(used)Inventories (8,034)
Trade receivables (21,689)
Other receivables/payables 4,667
Trade payables 31,929
Investments (7,685)
47
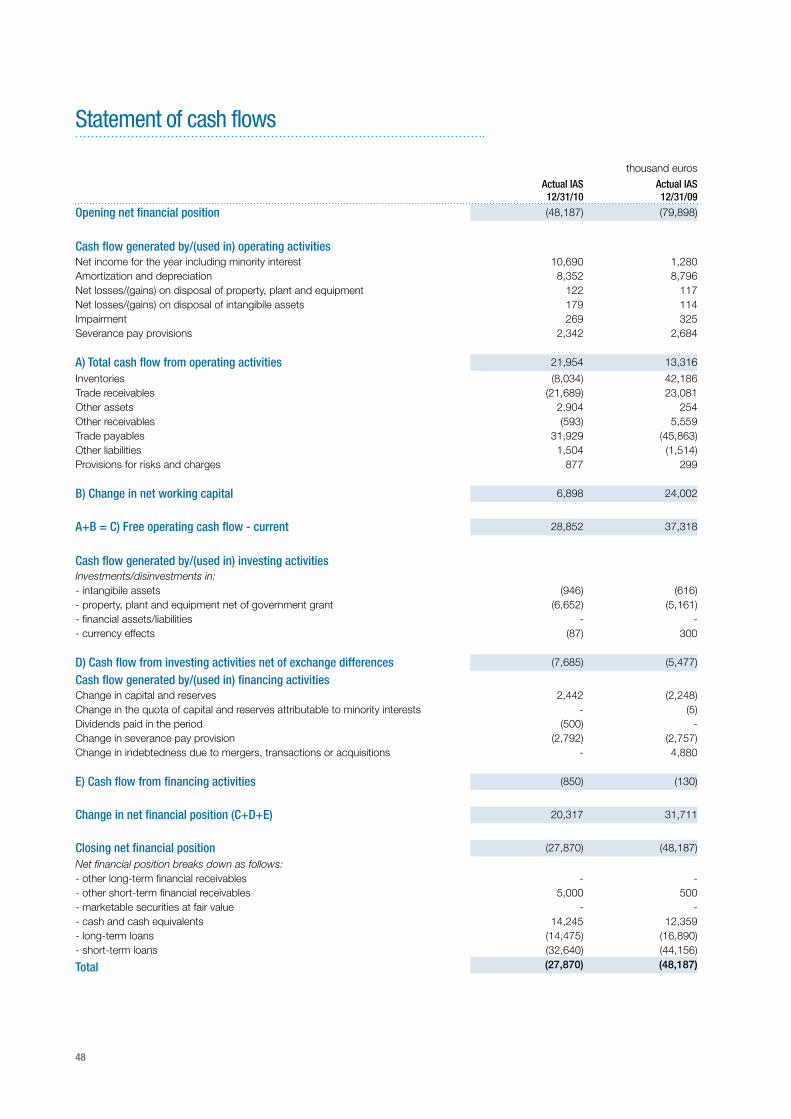
Statement of cash flows
thousand euros
Actual IAS12/31/10
Actual IAS12/31/09
Opening net financial position (48,187) (79,898)
Cash flow generated by/(used in) operating activitiesNet income for the year including minority interest 10,690 1,280Amortization and depreciation 8,352 8,796Net losses/(gains) on disposal of property, plant and equipment 122 117Net losses/(gains) on disposal of intangibile assets 179 114Impairment 269 325Severance pay provisions 2,342 2,684
A) Total cash flow from operating activities 21,954 13,316
Inventories (8,034) 42,186Trade receivables (21,689) 23,081Other assets 2,904 254Other receivables (593) 5,559Trade payables 31,929 (45,863)Other liabilities 1,504 (1,514)Provisions for risks and charges 877 299
B) Change in net working capital 6,898 24,002
A+B = C) Free operating cash flow - current 28,852 37,318
Cash flow generated by/(used in) investing activitiesInvestments/disinvestments in:- intangibile assets (946) (616)- property, plant and equipment net of government grant (6,652) (5,161)- financial assets/liabilities - -- currency effects (87) 300
D) Cash flow from investing activities net of exchange differences (7,685) (5,477)
Cash flow generated by/(used in) financing activitiesChange in capital and reserves 2,442 (2,248)Change in the quota of capital and reserves attributable to minority interests - (5)Dividends paid in the period (500) -Change in severance pay provision (2,792) (2,757)Change in indebtedness due to mergers, transactions or acquisitions - 4,880
E) Cash flow from financing activities (850) (130)
Change in net financial position (C+D+E) 20,317 31,711
Closing net financial position (27,870) (48,187)
Net financial position breaks down as follows:- other long-term financial receivables - -- other short-term financial receivables 5,000 500- marketable securities at fair value - -- cash and cash equivalents 14,245 12,359- long-term loans (14,475) (16,890)- short-term loans (32,640) (44,156)
Total (27,870) (48,187)
48

Balance sheet overview
Tangible and intangible fixed assetsInvestments in tangible and intangible fixed assets totalled approximately 7,590 thousand euros, meaning 2.75% of turnover, obviously inconsistent with later trends and historic readings that fixed such value around 5%, yet representing a sign of prudence towards the extraordinary difficulties we experimented during 2009, partly mitigated by encouraging signs of recovery in 2010, as we already remarked when analysing the Group’s sales figures. Investments were actually operated in an ordinary way, together with narrowly focussed (high added value and return rate) industrial projects and the launch of new strategic products for the company.Concerning industrial projects, we would like to remark: - completion of gear cutting and grinding lines (with robotic loading/unloading station) in Matera and Moglia plants; - new metallography lab, to be completed, and flushing system for wind turbine transmissions in China; - innovative equipment supporting Kaizen workshops serving CPS.
On the other hand, in equipment and test benches serving new products, we should highlight the 128 axle series and new mechanical drive for electric city cars.In addition, the Group expended approximately 500 thousand euros to update ICT structures, servers and licences in order to migrate SAP systems onto a new technological platform that allows virtualisation.Current assets as at December 31, 2010 were substantially reduced to 3,300 thousand euros compared to the previous year, in accordance to commissioning plans for new gear cutters and grinders.
Working or operating capitalThis result shows an approximately 8.5% net decrease in intermediated volumes compared to the previous year. In short, while the Group had worked to offset the 2008 unbalance during the previous year, this year we focussed on improving logistic flow performances crossing the value chain by applying lean techniques to all operating units in order to maximise the ratio between sales figures and total economic factors needed to reach such figures, i.e., working capital. This ratio reached a flattering +23% approximately, in accordance to the concept of “doing more with less”. In further details to the approximately 74,900 thousand euros total, we should highlight a better stock coverage index from 93 to 60 days, as well as a better DSO operating index from 88 to 85 days. Finally, we remark a 5,300 thousand euros collection from the 2nd instalment of VAT credit accrued at the end of 2007.
Employee severance indemnity according to IAS 19The end-of-year value was 8,510 thousand euros, meaning -5.02% compared to 2009, calculated pursuant to ap-plicable laws, subsequently classified in accounting as defined benefits and thus recounted according to an actuarial statistical criterion that keeps into account the effects of financial discounting through the method known as projected unit credit method, with support from data published by ISTAT, INPS and ANIA.The main parameters used are as follows: - discounting rate: 4.55%; - annual inflation index: 2.0%; - average working seniority of company employees: 12.50 years (10.25 in 2009).
According to such principles and starting from the severance fund (TFR) allocation pursuant to Italian GAAP principles, in 2010 a reduction in personnel expenses was effected amounting to 628 thousand euros (compared to 364 thousand euros in 2009) while increasing financial expenses by 358 thousand euros (compared to 417 thousand euros in 2009).Such effects are mainly related to the employees’ average working seniority.
49

Shareholders’ equityTotal equity available to the Group was 79,104 thousand euros, with a relevant increase (approximately +19%) com-pared to 2009. In addition to the structural dynamics related to the operating profits minus dividends distributed to shareholders, with a net positive exchange value of 10,190 thousand euros, we should remark that such an increase is also due to other aspects, among the most relevant: - the US dollar gaining +7.8% from December 31, 2009 had a positive effect of 1,230 thousand euros; - the Chinese yuan gaining +11.48% from December 31, 2009 had a positive effect of 537 thousand euros; - other currencies gaining from December 31, 2009 had a positive effect of 51 thousand euros; - finally, we would like to remark 496 thousand euros from the closure of the negative translation reserve portion pertaining
to Comer Industries AG. In the income statement, such an impact was offset in excess by the higher values in euros of collected dividends.
Equity represented 73.95% of the invested capital, with a strong increase, around 16%, from 2009. The ratio between equity and net fixed assets grew to 1.94 from 1.58 in 2009, thus generating broad spaces for ambitious and relevant investments, as forecast in the 2011-2014 industrial plan, without jeopardising the company’s capital soundness.
Debt and net financial positionAs at December 31, 2010, the net financial debt was 27,870 thousand euros, including 2,066 thousand euros in bond issues.Compared to the previous year, this means a -42.16% variation, an extremely positive result that can be better understood from the spot analysis of working capital and fixed assets. In the “Non-financial debts towards leasing companies” entry, listed separately from financial debts proper, the values from reimbursements and new openings substantially offset each other. In this entry, the end-of-year balance was 138 thousand euros, compared to 202 thousand euros in the previous year.
50

thousand euros
Actual IAS12/31/10
Actual IAS12/31/09
A) Fixed assetsTangible fixed assets 3,799 3,656Intangible fixed assets 35,657 37,050Poclain long-time financial receivables 1,256 1,256Financial fixed assets 4 3
40,716 41,965
B) Working capitalInventories 65,568 57,534Receivables from others 1,951 1,138Trade receivables 78,330 56,565Receivables from parent companies and associates 232 308Other assets - -No CredemFactor trade payables (70,033) (42,009)Provisions for risks and charges (2,324) (1,447)Tax receivables/(payables) 10,334 15,757Payables to parent companies and associates (1,136) (433)Other current receivables/(payables) (8,016) (5,557)
74,906 81,856
C) Invested capital after operating liabilities (A+B) 115,622 123,821
D) Non-financial payables to leasing companies 138 202
E) Employee severance indemnity 8,510 8,960
F) Total invested capital after operating liabilities and employee severanceindemnity (C-D-E) 106,974 114,659
G) Shareholders’ equityPaid-up capital and reserves 68,414 65,192Minority interests - -Profit for the year 10,690 1,280
79,104 66,472
H) Medium/long-term financial debt 14,475 16,890
I) Net short-term financial debt(net monetary availability)
Short-term financial debt 32,640 43,401Short-term bond issues - -Net financial payables/receivables vs. parent companies/associates - 255Monetary availability and other securities (19,245) (12,359)
13,395 31,297
(H+I) Total debt - total financing sources 27,870 48,187
L) Total (G+H+I) 106,974 114,659
Consolidated balance sheet by function
51

Extract from the consolidated financial statements at December 31, 2010
52
The figures presented here have been extracted from the 2010 consolidated financial statements of Comer Industries Spa, approved on April 29, 2011 by the Shareholders’ Meeting. For more complete information, please see the full version duly filed at the Milan Chamber of Commerce.
53

Consolidated statement of financial position
thousand euros
Assets 12/31/10 12/31/09
Non-current assets Tangible assets 35,657 37,050Intangible fixed assets 3,799 3,656Investments 4 3Other investments 1,256 1,256Tax assets and deferred tax receivables 6,678 7,174Other long-term debtors 2,032 1,240Total 49,426 50,379
Current assets Stocks 65,568 57,534Trade debtors 78,562 56,873Other short-term debtors 4,009 3,416Current tax assets 10,372 13,644Other short-term loans 5,000 500Short-term derivative financial instruments 72 -Cash at bank and in hand 14,245 12,359Total 177,828 144,326
Total assets 227,254 194,705
Capital and reserves and liabilities 12/31/10 12/31/09
Subscribed capital and reserves Issued capital 10,000 10,000Other reserves 12,823 6,930Accumulated profits/(losses) 56,281 49,542- Retained earnings 45,591 48,262- Profit for the financial year 10,690 1,280Total 79,104 66,472Minority interest - -Total capital and reserves 79,104 66,472
Non-current liabilities Long-term financing 14,475 16,890Deferred tax liabilities 1,847 1,750Post employment benefits 8,510 8,960Long-term provisions 1,097 1,071Other long-term liabilities - 89Total 25,929 28,760
Current liabilitiesTrade creditors 71,307 42,644Other short-term creditors 12,177 8,911Current tax liabilities 4,870 3,311Short-term financing 32,640 44,156Short-term derivative financial instruments - 75Short-term provisions 1,227 376
Total 122,221 99,473
Total liabilities 227,254 194,705
54

Consolidated statement of income
thousand euros
Consolidated statement of income 12/31/10 12/31/09
Net turnover from sales and services 276,534 241,328
Other operating revenues 2,704 3,167
Variation in stock of finished products and work in progress 4,813 (37,520)
Cost of purchases (171,665) (115,018)
Staff costs (53,381) (48,443)
Other operating charges (30,918) (28,259)
Devaluation (269) (325)
Earnings Before Interest Taxes Depreciation and Amortisation (EBITDA)* 27,818 14,930
Depreciation of tangible assets (7,750) (8,237)
Amortisation of intangible assets (602) (559)
Value adjustments (8,352) (8,796)
Earnings Before Interest and Taxes (EBIT) 19,466 6,134
Net financial income/(charges) (2,279) (3,566)
Profit or loss before income taxes 17,187 2,568
Income taxes on the income of the period (6,497) (1,288)
Net profit 10,690 1,280
of which: minority interests - -
of which: pertaining to the Group 10,690 1,280
Basic profit/(loss) per share (in euros) 1.07 0.13
Diluted profit/(loss) per share (in euros) 1.07 0.13
*EBITDA (Earnings Before Interest Taxes Depreciation and Amortisation) is a financial indicator not defined by the IFRS standards adopted by the company.EBITDA is defined by the Group as the profit/(loss) for the financial year, before amortisation, depreciation of non-current assets, financial income and charges and income taxes on the income of the period.
thousand euros
Consolidated statement of comprehensive income 12/31/10 12/31/09
Net profit 10,690 1,280
Accounting for exchange rate risk hedge derivatives recorded under the Cash Flow Hedge method
- adjustment for recognition of CFH reserve for the period account - -
- adjustment for recording the prior period CFH reserve as a loss under the profit and loss - (749)
Profit/(loss) generated by variations in conversion reserve (foreign companies) 2,442 (624)
2,442 (1,373)
Related taxes - 125
Comprehensive income entirely pertaining to the Group 13,132 32
55

thousand euros
12/31/10 12/31/09
Opening balance of net financial position (48,187) (79,898)
Cash flow provided by/(used for) operating activities
Profit/(loss) for the current year including minority stakes 10,690 1,280
Value adjustments 8,352 8,796
Net loss/(gain) on disposal of tangible assets 122 117
Net loss/(gain) on disposal of intangible fixed assets 179 114
Devaluation 269 325
Provision for employee severance indemnity (TFR) 2,342 2,684
Stocks (8,034) 42,186
Trade debtors (21,689) 23,081
Other assets 2,904 254
Other debtors (593) 5,559
Trade creditors 31,929 (45,863)
Other liabilities 1,504 (1,514)
Provisions for risks and charges 877 299
A - Cash flow provided by operating activities 28,852 37,318
Cash flow provided by/(used for) investing activities
Investments/disinvestments in:
- intangible fixed assets (946) (616)
- tangible assets net of capital contribution (6,652) (5,161)
- financial assets/liabilities - -
- conversion effect on investments and decrease in the period (87) 300
B - Cash flow provided by investing activities net of conversion differences (7,685) (5,477)
Cash flow provided by/(used for) cash management
Variation in capital and reserves 2,442 (2,248)
Variation in the portion of capital and reserves pertaining to third parties - (5)
Dividends distributed in the period (500) -
Variation in TFR (2,792) (2,757)
Variation in borrowing as a result of extraordinary transactions - 4,880
C - Cash flow provided by cash management, bank loans excluded (850) (130)
Variation in the net financial position (A+B+C) 20,317 31,711
Closing balance of the net financial position (27,870) (48,187)
The net financial position consists of:
- other long-term financial credits - -
- other short-term financial credits 5,000 500
- marketable securities at fair value - -
- cash at bank and in hand 14,245 12,359
- long-term financing (14,475) (16,890)
- short-term financing (32,640) (44,156)
Total (27,870) (48,187)
Consolidated statement of cash flow (presented in compliance with the indirect method)
56

Statement of changes in equity
thousand euros
Subscribed capital Other reserves
Profits brought forward
Profit or loss for the
financial year
Total capital and
reserves
Revaluation reserve
Legal reserve
Extraordinary reserve
Conversion reserve
FTAreserve
CFH reserve
Consolidation reserve
Capital and reserves at 12/31/07 10,000 - 923 10,542 (7,781) (5,575) 665 3,543 30,099 10,364 52,780
Dividend distribution - - - - - - - - (1,000) - (1,000)
Allocation of profit or loss for financial year 2007 - - 88 670 - - - - 9,606 (10,364) -
Components of comprehensive income:
- fair value valuation IAS 39 CFH Method - - - - - - (117) - - - (117)
- variation in conversion reserve - - - - 3,349 - 76 - - - -
Profit or loss for financial year 2008 - - - - - - - - - 12,352 12,352
Capital and reserves at 12/31/08 10,000 - 1,011 11,212 (4,432) (5,575) 624 3,543 38,705 12,352 67,440
Dividend distribution - - - - - - - - (1,000) - (1,000)
Allocation of profit or loss for financial year 2008 - - 144 1,651 - - - - 10,557 (12,352) -
Components of comprehensive income:
- fair value valuation IAS 39 CFH Method - - - - - - (624) - - - (624)
- variation conversion reserve - - - - (624) - - - - - (624)
Profit or loss for financial year 2009 - - - - - - - - - 1,280 1,280
Capital and reserves at 12/31/09 10,000 - 1,155 12,863 (5,056) (5,575) - 3,543 48,262 1,280 66,472
Dividend distribution - - - - - - - - (500) - (500)
Allocation of profit or loss for financial year 2009 - - 192 3,259 - - - - (2,171) (1,280) -
Components of comprehensive income:
- variation conversion reserve - - - - 2,442 - - - - - 2,442
Profit or loss for financial year 2010 - - - - - - - - 10,690 - 10,690
Capital and reservesat 12/31/10 10,000 - 1,347 16,122 (2,614) (5,575) - 3,543 56,281 - 79,104
57

In 2010, the liquidation process of Comer (Shanghai) Trading Co. Ltd. was completed, which in November repaid its share capital denominated in US dollars to the sole shareholder Comer Industries AG. On December 14, 2010, Comer Industries Spa transferred to third parties its 100% shareholding in Comer Industries AG.
Accounting standards adoptedComer Industries Spa has adopted the International Financial Reporting Standards, as from 2007, and the effective date of transition to IFRS standards is January 1, 2006. Therefore, for the sake of continuity, the consolidated financial statements as at December 31, 2010 have been prepared in compliance with the IAS/IFRS standards adopted by the European Union.The consolidated financial statements are stated in thousand euros. The financial statements are drawn up according with the cost criterion, except for financial instruments that are measured at fair value.Drawing up the financial statements in compliance with IFRS (International Financial Reporting Standards) calls for express-ing judgements, making estimates and assumptions that may have an impact on assets, liabilities, costs and revenues. Actual results may differ from those resulting from any such estimates.Accounting standards have been uniformly applied at all the companies in the Group and to all the periods reported herein.
Consolidation criteriaSubsidiariesCompanies are defined as subsidiaries when the parent company has the direct or indirect authority to conduct business so as to attain benefits therefrom. In defining controlling interests, consideration is also given to potential voting rights that can presently be freely exercised or converted. The above voting rights are not kept into account for consolidation purposes upon allocation to minority shareholders of the results of operations and the share of capital and reserves they are entitled to. The financial statements of subsidiaries are consolidated as from the date whereon the Group gains control over them, and de-consolidated as from the date whereon any such controlling interest is no longer held.The acquisition of subsidiaries is recorded under the so-called purchase method. The purchase cost is equal to the current value of any assets purchased, shares issued or liabilities undertaken on the date of acquisition. Any acquisition cost in excess of the share of current value of the net assets purchased pertaining to the Group is recorded under balance sheet assets as goodwill (full goodwill method). Any badwill is recorded under the profit and loss account on the date of acquisition.The costs of acquisitions made as from 2009, in compliance with the revised IFRS 3 standard, are expensed in the profit and loss account for the period, of the company that made the acquisition. For subsidiary consolidation purposes, the global integration method has been adopted, involving undertaking the total amount of balance sheet assets and liabilities and all costs and revenues regardless of any share held. The book value
The scope of consolidation at December 31, 2010 includes the parent company and the following subsidiaries:
Company name Office CurrencyShare
capital
2010 Controlling interest %
Parentcompany
Comer Industries Spa Milan - Italy KEUR 10,000 Holding Finregg Spa
Comer Industries GmbH Pfullendorf - Germany KEUR 205 100 Comer Industries Spa
Comer Industries Inc. Charlotte (NC) - USA KUSD 13,281 100 Comer Industries Spa
Comer Industries U.K. Ltd. Leicester - United Kingdom KGBP 265 100 Comer Industries Spa
Comer Industries Sarl St.Thibault des Vignes - France KEUR 305 99.9 Comer Industries Spa
Comer Industries Components Srl Matera - Italy KEUR 5,000 100 Comer Industries Spa
Comer Industries (Shaoxing) Co. Ltd. Shaoxing - PRC KEUR 3,720 100 Comer Industries Spa
58

of consolidated equity investments is therefore offset against any relevant capital and reserves. The shares of capital and reserves and profits pertaining to minority shareholders are separately indicated under a capital and reserve item and a separate line of the consolidated profit and loss account respectively.
Related companiesRelated companies are those companies whereon the Group has a considerable influence, but exercised no control over operations. The consolidated financial statements include the accrued share of profits and losses of related companies, measured under the equity method as from the date whereon any such considerable influence on operation started, until it comes to an end. Similar to what happens for subsidiaries, also the acquisition of related companies is recorded under the purchase method; in the latter instance, any acquisition cost in excess of the share of the current value of net assets acquired pertaining to the Group is included in the value of the equity investment.
Transactions eliminated as part of the consolidation processInfragroup balances and profits and losses originating from infragroup transactions are eliminated in the consolidated finan-cial statements. Infragroup profits originating from transactions with related parties are eliminated as part of the valuation of the equity investment under the equity method. Infragroup losses are eliminated only if evidence is supplied that these were not in detriment of third parties.
Industry-related informationPresently the Group, it being under no obligation to do so, decided not to present any industry-related information on a voluntary basis.
Treatment of transactions in foreign currenciesTransactions in foreign currenciesThe functional and reporting currency adopted by Comer Industries is the euro. Transactions in foreign currencies are converted into euros on the basis of the exchange rate current on the date of transaction. Monetary assets and liabilities are converted at the exchange rate seen on the closing date of accounts. Any exchange rate differences arising out of conversion are charged to the profit and loss account. Non-monetary assets and liabilities measured at the historical cost are converted at the exchange rate current on the date of transaction. Monetary assets and liabilities measured under the fair value method are converted into euros at the exchange rate based on which the fair value was determined.
Conversion of financial statements drawn up in foreign currenciesAssets and liabilities of companies based in non-EU countries, including any adjustments originating from the consolidation process, relating to goodwill and adjustments to the fair value originating from the acquisition of a non-EU foreign company, are converted at the rates current on the closing date of accounts. Revenues and costs of any such companies are con-verted at the average exchange rate seen in the period, closest to the exchange rates seen on the dates whereon individual transactions took place. Any exchange rate differences originating from the conversion process are directly charged to a special provision under capital and reserves called conversion reserve.
59

Property, plants and equipmentOwned assetsProperty, plants and machinery are measured at the historical cost and reported net of depreciation (see section on de-preciation below) and impairment losses. The cost of assets manufactured by the company includes the cost of materials, direct labour and a share of indirect manufacturing costs. The cost of assets purchased from third parties, or manufactured directly, includes incidental costs directly chargeable and necessary to put the asset into operation and, whenever consid-erable in amount, in the presence of contractual obligations, the present value of the cost estimated for pulling down and removing the asset is also considered.Financial charges relating to specific loans used to purchase tangible assets are charged to the profit and loss account on an accrual basis.No assets available for sale do exist.
Assets held under finance leaseAssets held under finance lease agreements are shown in the consolidated financial statements under the so-called “Financial method” set forth in IAS 17. Based on the latter, whereunder these transactions are put on the same level as a purchase of assets and simultaneous assumption of a loan, the value of assets held under finance lease agreements is shown under tangible assets and subject to a depreciation process compliant with the criteria indicated above, while any residual debt in terms of principal amount unexpired instalments is shown under liabilities as “Trade creditors”. Any financial charges connected with any such loan, and depreciation, are charged to the profit and loss account.
Subsequent costs The cost of replacement of certain components of assets is capitalised when it is likely that any such cost will yield future financial benefits and can be measured in a reliable manner. The remaining costs, including those for maintenance and repair, are charged to the profit and loss account as incurred.
DepreciationDepreciation is charged to the profit and loss account on a straight-line basis, and on the basis of the estimated useful life and residual use thereof. Land is not depreciated.
The table below shows the exchange rates applied to conversion of financial statements:
Currency2010
Average exchange rate12/31/10
Exchange rate2009
Average exchange rate12/31/09
Exchange rate
Euro vs. US dollar (USD) 1.325 1.336 1.395 1.440
Euro vs. British pound (GBP) 0.857 0.861 0.891 0.888
Euro vs. Chinese yuan (CNY) 8.971 8.822 9.527 9.835
60

Estimated useful lives lead to the following depreciation rates by consistent category:
The estimated useful life of assets is revised on a yearly basis and any changes in rates, where necessary, are made pro-spectively.As far as assets purchased and/or put into operation in the financial year are concerned, depreciation is calculated on the basis of the above rates, but adapted pro rata temporis to any such set-up date.
GoodwillGoodwill is any cost of acquisition in excess of the share pertaining to the Group of the fair value of existing and potential assets and liabilities on the date of acquisition.Goodwill is recorded at cost, net of impairment losses.Upon acquisition, goodwill is allocated to a “Cash Generating Unit” (CGU). The latter is meant to be the smallest group of assets and liabilities generating cash inflows and outflows (relating to any impaired goodwill) that are largely dependent on cash flows generated by other CGUs. The book value is checked for any impairment losses. Any badwill originating from acquisitions is directly charged to the profit and loss account.
Other intangible fixed assetsCosts of research and developmentResearch expenses incurred to gain new technical know-how are charged to the profit and loss account as incurred.Costs of development incurred to develop new products, versions or accessories, or new production processes are capi-talised if these costs can be determined in a reliable manner; these products, new versions or processes are technically and commercially viable; expected sales volumes and value indicate that costs incurred for any development activities will yield future financial benefits; and the resources exist necessary to complete the development project.Capitalised cost includes materials and the mere cost of direct labour. Other costs of development are charged to the profit and loss account as incurred. The costs of development capitalised are measured at cost, net of any accumulated amortisation (see section on incidental financing cost below) and impairment losses.
Other intangible fixed assetsOther intangible fixed assets, all of which have a defined useful life, are measured at cost and recorded net of any accumu-lated amortisation (see section on incidental financing cost below) and impairment losses.Software licenses are amortised over their useful life (3-5 years).Internal costs incurred to develop trademarks or goodwill are charged to the profit and loss account as incurred.
Buildings 2.5-3%
Light constructions, generic and specific plants 10-15.5%
Mould and die equipment 20-25%
Furniture and fittings 12%
Electronic office machines 18-20%
Motor vehicles and means of transport for internal use 20-25%
61

Subsequent costsSubsequent costs incurred for intangible fixed assets are capitalised only if they increase the future financial benefits of any specific asset capitalised, otherwise they are charged to the profit and loss account as incurred.
Incidental financing costsIncidental financing costs are recorded as a reduction of loans upon outpayment.
AmortisationAmortisation is charged to the profit and loss account on a straight-line basis on the basis of the estimated useful life of assets capitalised. Estimated useful lives are as follows:
Useful lives are reviewed on a yearly basis and any changes in rates, where necessary, are made in prospective terms.
Impairment of assetsThe book value of assets, except for stocks, financial assets regulated by IAS 39, and deferred tax assets, are subject to review on the closing date of accounts, to check for any impairment thereof. If any such review unveils the existence of impairment indicators, the estimated realisable value of asset is calculated in the manners indicated below. It should be noted that the estimated realisable value of goodwill and intangible fixed assets still unused, is assessed at least once a year or more frequently if specific events would indicate that any impairment occurred.Tangible and intangible assets are said to be impaired whenever the book value at which any such asset is recorded in the financial statements can no longer be recouped through use or sale thereof. The purpose of the impairment test as set forth in IAS 36, is to assure that tangible and intangible assets are not recorded at a value that is higher than their realisable value, consisting of the net realisable value or the value in use, whichever is higher.The value in use is the present value of future cash flows that are expected to originate from the asset or the Cash Generating Unit which the asset belongs to. Expected cash flows are discounted back at a pre-tax discount rate that reflects the current market estimate of the ratio of cost of money to the time and specific risks connected with that asset. If the book value is higher than the realisable value, then the asset or the Cash Generating Units they belong to are depreciated until they reflect the realisable value. These impairment losses are recorded in the profit and loss account.If the conditions that led to any such impairment are no longer met, the original value is reinstated on a proportional basis, of assets previously depreciated until reaching at most the value that these assets would have, net of depreciation calculated on the historical cost, had any such impairment losses not occurred. Reinstatements of value are recorded in the profit and loss account.Any goodwill value previously impaired can never be reinstated.
Equity investmentsEquity investments in related companies, except for those held for sale, are measured under the equity method, as set forth in IAS 28.Whenever on the closing date of accounts any impairment losses are found compared to the amount determined as indi-cated above, then any such equity investment is depreciated accordingly.
Patents and trademarks 5 years
Costs of development 3-5 years
Concession of software licenses 5 years
62
Cash and cash equivalentsCash and cash equivalents include cash on hand, bank and postal current accounts and other investments with an original due date of less than three months.
Current financial assets, debtors and other assetsWhen recorded for the first time, current financial assets, trade debtors and other current assets (except for derivative financial instruments) are accounted for on the basis of the purchase cost, including incidental costs. As far as financial assets and liabilities are concerned, it should be noted that Comer Industries does not hold assets avail-able for sale because it complies with the objective and subjective classification requisites of these financial instruments as held to maturity, namely: - all financial instruments held have a defined maturity date and give rise to fixed or determinable payments; - the company intends to hold any such instruments to maturity, and has the economic, financial and legal capacity to hold
them to maturity, to assure long-lasting use and stable investment.Therefore these financial instruments are measured under the amortised cost method.Debtors, the due date whereof falls within the customary commercial terms or that are interest bearing at fair value, are not discounted back and are recorded at cost (coinciding with their nominal value) net of an amortisation allowance, and are shown as a direct reduction of debtors themselves to bring the valuation thereof to their presumed realisable value. Debtors, the due date whereof falls outside customary commercial terms, are initially recorded at fair value and later at the amortised cost under the actual interest rate method, net of any related impairment losses.
Derivative financial instrumentsComer Industries holds derivative financial instruments subscribed for hedging purposes; however, whenever any such derivative financial instruments do not meet all the conditions applicable to hedge accounting as set forth in IAS 39, any changes in the fair value of these instruments are recorded in the profit and loss account as financial charges and/or income.Therefore, derivative financial instruments are recorded in compliance with hedge accounting criteria when at the beginning of hedge, the hedge ratio is formally designated and documented; it is believed that hedge is highly effective; any such ef-fectiveness can be measured in a reliable manner and hedge is highly effective during the designated periods.The fair value of derivative financial instruments hedging forward exchange risks is their market value on the closing date of accounts, which coincides with the discounted back market value of forward. The method of accounting for derivative financial instruments may vary depending on whether the conditions and require-ments set forth in IAS 39 are met.
Cash Flow HedgesWhere a derivative financial instrument for which the hedge ratio to variations in cash flows generated by an asset or a li-ability or a future transaction (underlying hedged item) considered highly probable and that might have effects on the profit and loss account is formally documented, the effective portion thereof, originating from adjustment of the derivative financial instrument to the fair value, is charged directly to a reserve under capital and reserves. When the underlying hedged item shows up, any such reserve is removed from capital and reserves and assigned to the profit and loss account as operating charges and revenues, while any non-effective portion or overhedging of the variation in the value of the hedging instrument, is immediately assigned to the profit and loss account as financial charges and/or income.When a hedging financial instrument comes to maturity, is sold or exercised, or the company changes the connection with the underlying hedged item, and the envisaged transaction initially hedged has not taken place yet, but is still considered probable, then any profits and losses originating from the adjustment of financial instrument to the fair value remain under capital and reserves and are charged to the profit and loss account when the transaction will take place as described above. If the underlying transaction is no longer likely to occur, any profits and losses arising from the derivative contract, originally
63

recorded under capital and reserves, are immediately charged to the profit and loss account.
Monetary asset and liability hedges (fair value hedges)Where a derivative financial instrument is used to hedge any change in value of monetary assets or liabilities already recorded in the financial statements, that may affect the profit and loss account, profits and losses related to any derivative financial instrument fair value variations, are immediately charged to the profit and loss account. Similarly, profits and losses relating to the hedged item result in a change in the book value of any such item and are recorded in the profit and loss account.
StocksStocks are recorded, by homogeneous categories, at the cost of purchase, including incidental charges, or production, or the net realisable or market value on the closing date of accounts, whichever is lower; cost is calculated under the weighted average cost method.As far as goods manufactured by the company are concerned (components, work in progress and finished products), the cost of production includes all directly chargeable costs (raw materials, consumables, energy utilities, direct labour), and manufac-turing expenses (indirect labour, value adjustments, etc.) to the extent of the portion thereof reasonably chargeable to products.Any stocks impairment risks are hedged by the relevant stocks depreciation allowance, recorded as an adjustment to the cor-responding assets item. Amounts thus obtained do not considerably differ from current costs on the closing date of accounts.
Interest bearing financial debtsComer Industries holds financial instruments that can be classified as “held to maturity” and therefore all interest bearing financial debts are valued under the amortised cost method; the difference between any such value and the settlement value is charged to the profit and loss account over the lifespan of loan on the basis of a redemption plan.
Liabilities for employees’ benefitsDefined contribution plansComer Industries participates in public or private defined contribution pension schemes on a mandatory, contractual or voluntary basis. Outpayment of contributions discharges the Group’s obligation towards its employees. Therefore, any such contributions are costs pertaining to the period in which they are payable.
Defined benefit plans for employeesDefined benefit plans granted upon or after termination of employment at the Group, that chiefly include the employee sever-ance indemnity, are calculated separately for each plan, by estimating, with actuarial techniques, the amount of any future benefits accrued to employees during the year and in prior years. Benefits thus determined are discounted back and shown net of the fair value of any related assets. The interest rate used to determine the present value of obligation was determined in compliance with art. 78 of IAS 19. The risk-free rate curve was built on the basis of the polynomial regression to actual interest rate and duration vectors of fixed-rate government securities listed on the Italian stock market on the closing date of accounts.Should the plan benefits increase, then the portion of any such increase relating to the previous employment period is charged to the profit and loss account on a straight-line basis over the period in which any related benefits will be acquired. Should any such rights be acquired right then, the increase is immediately recorded in the profit and loss account.Actuarial profits and losses are recognised in the profit and loss account on an accrual basis (Comer Industries Spa has not adopted the so-called corridor method). Implied financial charges are reclassified in the financial section.
Income taxesIncome taxes shown in the profit and loss account include current and deferred taxes. Income taxes are generally charged to the profit and loss account, unless they are relating to items directly recorded under capital and reserves. Should the
64

latter be the case, also income taxes are charged directly to capital and reserves, as a variation of the amount recorded.Current taxes are taxes calculated by applying the current tax rate on the closing date of accounts to the taxable base, and any adjustments to prior years’ taxation.Deferred taxes are calculated under the so-called liability method on timing differences between the amount of assets and liabilities recorded in the consolidated financial statements and the corresponding values recognised for tax purposes. Deferred taxes are calculated depending on the designated method of reversal of timing differences, on the basis of realistic forecasts of financial charges resulting from application of tax rules and regulations current on the closing date of accounts.Deferred tax assets are recognised only when it is likely that a taxable income will be achieved in future financial years suf-ficient to realise any such deferred taxes.
Provisions for risks and chargesProvisions for risks and charges are relating to costs and charges whose nature has been determined and whose existence is certain or probable, the amount and contingency date whereof could not be determined on the closing date of accounts. Provisions are recognised whenever the existence of a pending liability, real or implicit, arising out of past events is probable; the fulfilment of the obligation will probably be burdensome; the amount of liability can be estimated in a reliable manner. Provisions are recorded at a value reflecting the best estimate of the amount that the company would reasonably pay to settle or transfer the obligation to third parties on the closing date of accounts. Costs that the Group is expecting to incur to implement reorganisation programs are recorded in the financial year in which the program is formally defined and the reasonable expectation raised in any interested parties that the reorganisation will actually be implemented.Provisions are periodically reviewed to reflect any variations in realisation cost and time estimates. Provision estimate reviews are charged to the same profit and loss account item that had previously encompassed that provision.Notes to the financial statements include potential liabilities consisting of: - possible, but not probable liabilities originating from past events, the existence whereof will be confirmed only upon oc-
currence or not of one or more future uncertain events that are not fully under the control of the company; - present liabilities originating from past events the amount whereof cannot be estimated in a reliable manner or the fulfil-
ment whereof will probably be for no consideration.
Current financial liabilities, trade creditors and other creditors Trade creditors and other creditors, the maturity date whereof falls within customary commercial terms, are not discounted back and are recorded at cost (coincident with the nominal value), reflecting their settlement value.Current financial liabilities include the short-term portion of financial creditors, including creditors for cash advances, and other financial liabilities. Financial liabilities are measured at the amortised cost.
RevenuesNet turnover from sales and servicesIncome from sales is charged to the profit and loss account when the risks and benefits connected with the ownership of goods are substantially transferred to purchaser. Income for services provided is recorded in the profit and loss account based on the percentage of progress on the closing date of accounts.
Government grantsGovernment grants are recorded when the reasonable certainty exists that they will be granted and if the Group has met all the conditions to obtain them. Grants received pertaining to the current year for costs incurred are charged to the profit and loss account on a regular basis in the same periods in which the related costs are recorded.Capital contributions are deducted from the book value of the asset concerned as required under IAS 20.
65

CostsRental and operating lease instalmentsOperating lease instalments are charged to the profit and loss account on an accrual basis.
Finance lease instalmentsFinance lease instalments are charged, as far as the principal amount is concerned, in reduction of financial debt, and as to the interest portion thereof, to the profit and loss account, under the financial method set forth in IAS 17.
Financial income and chargesFinancial income and charges are recognised on an accrual basis depending on any interest accrued to the net value of the relevant financial assets and liabilities by applying the actual interest rate. Financial income and charges include exchange gains and losses and profits and losses on derivative instruments that must be charged to the profit and loss account if the requirements for being considered hedges are not met.
Use of estimatesPreparing the consolidated financial statements requires that directors apply accounting standards and methods which, some-times, are based on difficult and subjective valuations and estimates based on past experience and assumptions that are from time to time considered reasonable and realistic depending on circumstances. Applying any such estimates and assumptions has an influence on the amounts shown in the schedules forming the financial statements, i.e. the consolidated statement of financial postion, the consolidated statement of income, the consolidated statement of cash flow, and any information supplied. The final value of items included in the financial statements for which the above estimates and assumptions were used, may differ from those reported in the financial statements due to the uncertainty that is typical of the assumptions and conditions whereon estimates are based. Estimates and assumptions are periodically reviewed and the effects of any variation are recognised in the period in which any such estimates are reviewed, if any such review has an influence only on the current period, or even in subsequent periods if review affects the current and future periods. Items in the financial statements that more than others require a higher degree of discretion by directors in making estimates and due to which any changes in the conditions underlying the assumptions used could have a significant impact on the financial statements are: goodwill, deferred taxes, provision for bad debts, provisions for risks.
Corporate informationDuring the current financial year two initiatives aimed at reorganising and streamlining the corporate control organisation have been completed, as summarised below in chronological order: - in November 2010 the liquidation process of Comer (Shanghai) Trading Co. Ltd., started on January 12 of the same year,
was completed with repayment of the share capital and available reserves, to the sole shareholder Comer Industries AG; - on December 14, 2010 Comer Industries Spa transferred its controlling interest in Comer Industries AG, realising a capital
gain over the individual financial statements prepared on the basis of national standards (where the value of transferred capital and reserves was determined on the basis of Swiss standards), of 496 thousand euros. This capital gain, however, has no impact on the consolidated financial statements drawn up on the basis of international accounting standards according to the dictates of IAS 27.
With reference to the provisions of IAS 21 paras 48 and 49 on disposals of foreign operations, as far as the transfer of Comer Industries AG and the liquidation of Comer (Shanghai) Trading Co. Ltd. are concerned, the aggregate amount of exchange rate differences deferred to the conversion reserve calculated as at December 31, 2009, net of the result achieved in 2010 resulting from repatriation of dividends, was recognised in the profit and loss account, financial section. In compliance with the instruc-tions set forth in IFRS 5 para. 32 on presentation and disclosures, it should be noted that both discontinued operations are not considered of some significance, and therefore a separate analysis of the economic and financial effects of both transactions is considered unnecessary.
66

Notes to the balance sheetTangible assetsVariations in property, plant and equipment and related provisions for depreciation in 2010 are shown in the tables below, in thousand euros, where the value thereof net of government grants received as capital contribution is reported:
The line “Reclassifications” of intangible fixed assets and tangible assets mainly includes the allocation of fixed assets in progress at December 31, 2009 to any economic and technical category they belong to following start up. Also in 2010, the increase in tangible assets of approximately 6,700 thousand euros sets at amounts definitely below past trends, where the Group used to invest in machinery and technology nearly 5% of its turnover. The Group actually did focus its efforts on highly targeted industrial projects (with a high added value and rate of return) mainly connected with the launch of new products and on the equipment in support of Kaizen workshops at the service of CPS. As to industrial projects, the following should be noted: - completion of hobbing and grinding lines (with robot automatic loading/unloading system) at the Moglia and Matera plants; - new fluxing system, expansion of manufacturing lines and start up of the metallurgical laboratory at the Comer Industries
(Shaoxing) Co. Ltd. plant in China; - test equipment and benches for the production of the new 128 series axles and for electric city car mechanical drive.
thousand euros
Land andbuildings
Plants andmachinery
Other fixtures andfittings, tools
and equipment Other
Tangible assets in course
of construction Total
01/01/09 5,150 23,795 9,484 2,044 4,746 45,219
Increase 54 837 3,009 318 943 5,161
Decrease - (3,725) (883) (68) (117) (4,793)
Value adjustments (144) (3,325) (4,196) (572) - (8,237)
Reclassifications - 525 746 65 (1,336) -
Conversion differences (40) (58) (18) (182) (2) (300)
12/31/09 5,020 18,049 8,142 1,605 4,234 37,050
Increase 110 2,184 2,169 709 1,480 6,652
Decrease - (78) (41) (115) (525) (759)
Value adjustments (154) (3,402) (3,628) (566) - (7,750)
Reclassifications - 1,884 882 - (2,766) -
Conversion differences 207 204 9 44 - 464
12/31/10 5,183 18,841 7,533 1,677 2,423 35,657
67

Intangible fixed assets and goodwillBelow the variations in intangible fixed assets are shown in thousand euros, indicating values net of government capital contribution grants:
Intangible fixed assets are broken down as follows:
Goodwill Goodwill is allocated to the Cash Generating Unit (CGU). A CGU is a single business unit with a minimum level of autono-mous cash generating capacity, and is relating to the Tecnostile industrial axle division. The impairment test as defined in IAS 36 was carried out under the value in use method. The cash flows expected for the next three-year period, that take into account any developments in the economic situation of financial markets, have been added to a final value discounted back on the basis of the cost of capital (WACC), net of any related tax effect, estimated to be 9.6%. The perpetual growth rate was estimated to be 0%. The recoverable value of CGU Tecnostile, so determined, has been compared with the net invested capital including goodwill, showing an excess value that made unnecessary any reduction in the value of goodwill for impairment. The company carried out the test by applying a WACC equal to +/- 1% compared to the above mentioned value of reference, thus proving that even though more prudential assumptions were used, no need for a reduction in value would have surfaced.
Cost of development and type approval and intangible assets in progressThe above capitalisations are chiefly relating to internal orders associated with the development of new products on the basis of specific requests and different product versions made directly by customers. During the period, intangible assets in progress and non in progress were capitalised for a total amount of cost of development 416 thousand euros; while the amount of 179 thousand euros is relating to decrease for waived projects. These projects, attended to also by the Mechatronics Research
thousand euros
Goodwill
Research and Development
costsTrademarks
and know howConcessions
licenses trademarksIntangible assets
in progress Total
01/01/09 1,301 379 58 1,094 881 3,713
Increase - 24 5 353 234 616
Decrease - - - - (114) (114)
Value adjustments - (158) (13) (388) - (559)
Reclassifications - 236 - 20 (256) -
Conversion difference - - - - - -
12/31/09 1,301 481 50 1,079 745 3,656
Increase - 38 - 391 517 946
Decrease - - - (22) (179) (201)
Value adjustments - (167) (15) (420) - (602)
Reclassifications - 130 - - (130) -
Conversion difference - - - - - -
12/31/10 1,301 482 35 1,028 953 3,799
68

Center, satisfy the requirements of para. 57 of IAS 38, having the Group ascertained the technical feasibility thereof, as well as the intention to complete the project, to introduce new products in the market, the availability of financial and technical resources, and a reliable identification of own costs. These expenses are amortised on the basis of their probable useful life generally estimated to be 3 to 5 years, depending on the industry they are intended for.
Trademarks and know howThe decrease in the period is due to amortisation.
Concessions, licenses and patentsThe increase in the period amounting to 391 thousand euros is chiefly resulting from investments to purchase licenses neces-sary to migrate the SAP management information system to a new technological platform that makes virtualisation possible.
Other financial assetsThe value of the equity investment in Poclain Hydraulics Industriale Srl, amounting to 1,256 thousand euros, is reclassified in this item, equal to 30% of the share capital. Although it owns this qualified equity investment, the Group has no influence, nor has it any control over it, by virtue of an “Investment agreement” entered into with Poclain Hydraulics SA that sets forth the corporate governance and determines the forward selling price. Therefore, it was considered appropriate to put the value of this financial asset at the original book value (historical cost) or the fair value (fair value in use) on the closing date of accounts, whichever is lower, calculated considering the contractual provisions on forward transfer pricing, set forth in the ”Investment agreement”.
Deferred tax assetsThe breakdown is as follows:
Amounts owed by the tax administration in the long-term essentially consist of the tax credit for incentives to research granted under l. 296/96 art. 1 paras 280 to 283. This item includes both the tax credit for 2008 (339 thousand euros) and that granted for 2009 (amounting to 289 thousand euros). The latter are relating to research projects started before November 29, 2008, which is the effective date of l.d. 185/2008, that turns from automatic into semi-automatic the pos-sibility to use the tax credit, by conditioning same to granting applications until the aggregate amount available for grants is used up. The reason that justifies recording of this item in the financial statements should be sought in the decision made by the first division of the Tax Commission of Pescara to which the parent company submitted an appeal after being denied the “authorisation” to enjoy the tax credit by the inland revenue service. The above ruling, although recognising the right of the tax administration to delay the outpayment thereof for lack of funds, has substantially confirmed the existence of any such right for the parent company, the tax administration having no authority under the law or amendments and supple-ments thereto, to deny tax credits on projects started before November 29, 2008. Therefore the company is waiting for the publication of the Ministerial Decree which should assign the resources already appropriated as part of the State budget, sufficient to payout a first tranche of credits to the extent of 47.53% of the total amount requested. The balance of deferred tax assets is substantially in line with that for the prior year, although many are the effects that
thousand euros
12/31/10 12/31/09
Amounts owed by inland revenue after 12 months (l. 296/2006) 628 599
Prepaid tax assets after 12 months 2,751 5,217
Prepaid tax assets within 12 months 3,299 1,358
Tax assets and deferred tax receivables 6,678 7,174
69
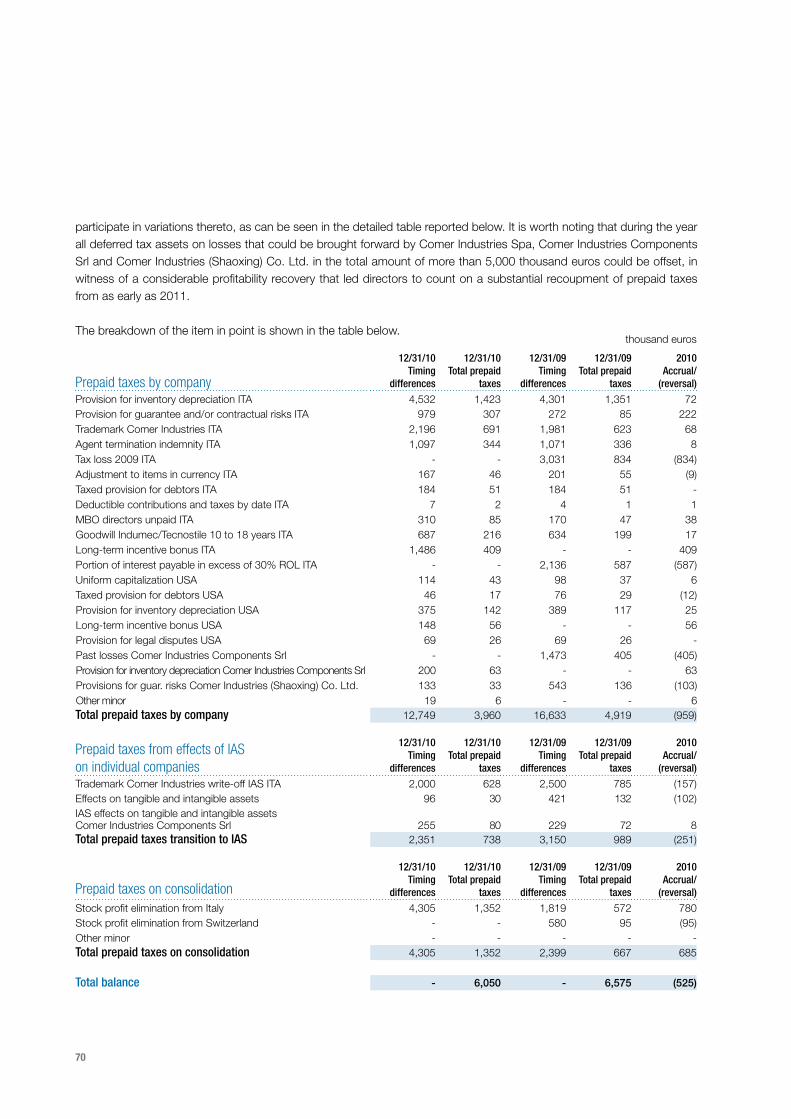
participate in variations thereto, as can be seen in the detailed table reported below. It is worth noting that during the year all deferred tax assets on losses that could be brought forward by Comer Industries Spa, Comer Industries Components Srl and Comer Industries (Shaoxing) Co. Ltd. in the total amount of more than 5,000 thousand euros could be offset, in witness of a considerable profitability recovery that led directors to count on a substantial recoupment of prepaid taxes from as early as 2011.
The breakdown of the item in point is shown in the table below.thousand euros
Prepaid taxes by company
12/31/10Timing
differences
12/31/10Total prepaid
taxes
12/31/09Timing
differences
12/31/09Total prepaid
taxes
2010Accrual/
(reversal)
Provision for inventory depreciation ITA 4,532 1,423 4,301 1,351 72Provision for guarantee and/or contractual risks ITA 979 307 272 85 222Trademark Comer Industries ITA 2,196 691 1,981 623 68Agent termination indemnity ITA 1,097 344 1,071 336 8Tax loss 2009 ITA - - 3,031 834 (834)Adjustment to items in currency ITA 167 46 201 55 (9)Taxed provision for debtors ITA 184 51 184 51 -Deductible contributions and taxes by date ITA 7 2 4 1 1MBO directors unpaid ITA 310 85 170 47 38Goodwill Indumec/Tecnostile 10 to 18 years ITA 687 216 634 199 17Long-term incentive bonus ITA 1,486 409 - - 409Portion of interest payable in excess of 30% ROL ITA - - 2,136 587 (587)Uniform capitalization USA 114 43 98 37 6Taxed provision for debtors USA 46 17 76 29 (12)Provision for inventory depreciation USA 375 142 389 117 25Long-term incentive bonus USA 148 56 - - 56Provision for legal disputes USA 69 26 69 26 -Past losses Comer Industries Components Srl - - 1,473 405 (405)Provision for inventory depreciation Comer Industries Components Srl 200 63 - - 63Provisions for guar. risks Comer Industries (Shaoxing) Co. Ltd. 133 33 543 136 (103)Other minor 19 6 - - 6Total prepaid taxes by company 12,749 3,960 16,633 4,919 (959)
Prepaid taxes from effects of IASon individual companies
12/31/10Timing
differences
12/31/10Total prepaid
taxes
12/31/09Timing
differences
12/31/09Total prepaid
taxes
2010Accrual/
(reversal)
Trademark Comer Industries write-off IAS ITA 2,000 628 2,500 785 (157)Effects on tangible and intangible assets 96 30 421 132 (102)IAS effects on tangible and intangible assetsComer Industries Components Srl 255 80 229 72 8Total prepaid taxes transition to IAS 2,351 738 3,150 989 (251)
Prepaid taxes on consolidation
12/31/10Timing
differences
12/31/10Total prepaid
taxes
12/31/09Timing
differences
12/31/09Total prepaid
taxes
2010Accrual/
(reversal)
Stock profit elimination from Italy 4,305 1,352 1,819 572 780Stock profit elimination from Switzerland - - 580 95 (95)Other minor - - - - -Total prepaid taxes on consolidation 4,305 1,352 2,399 667 685
Total balance - 6,050 - 6,575 (525)
70

Other long-term debtors Variation is as follows:
Amounts owed by La Fondiaria are relating to an insurance policy covering a portion of pension indemnities accrued to employees. The decrease of 195 thousand euros is relating, to the extent of 234 thousand euros, to payments for retire-ment, and of 39 thousand euros for revaluation of same.The amount owed by Regione Basilicata, in the total amount of 1,013 thousand euros, is relating to recording on an accrual basis of a contribution for plants and equipment (Regional authority law dated February 16, 2009, no. 1, for implementation of industrial development plans in the regione Basilicata area) as part of an expansion project of the Matera plant of Comer Industries Components Srl.The above credit was recorded in the financial statements following approval of the industrial development plan, expressed by the regional authority resolution no. 954 dated June 8, 2010. Against any such credit, the collection whereof is forecast within 2012, the cost of assets purchased in 2010 was reduced, as indicated in the business plan submitted to the Regional Authority. Below the value of the above credit broken down by category of asset which the grant is relating to is shown.
thousand euros
12/31/10 12/31/09
Amounts owed by La Fondiaria assicurazioni 904 1,099
Amounts owed by Regione Basilicata 1,013 -
Other minor including guarantee deposits 115 141
Other long-term debtors 2,032 1,240
thousand euros
Appropriation asset 12/31/10
Land and buildings 23
Plants and machinery 319
Other fixtures and fittings, tools and equipment 671
Total 1,013
71

StocksVariation is as follows:
The net increase in stocks of approximately 8,000 thousand euros is substantially in line with the increase in the sales volume seen in the year. Worth noting, in this context, is the increase in stocks at the Chinese subsidiary for approximately 2,700 thousand euros compared to the previous year. It should be noted, for the sake of completeness, that stocks of finished products and goods for resale are shown net of a provision for stock obsolescence in the total amount of 5,306 thousand euros, that shows an increase, net of deletions for scrapping, amounting to 470 thousand euros. The value of finished product stocks also recognises the write-off of unrealised infragroup profits with third parties in the total amount of 4,305 thousand euros (2,399 thousand euros at December 31, 2009) before the tax effect estimated to be 1,352 thousand euros in the aggregate (667 thousand euros at December 31, 2009) recorded under assets of prepaid tax assets. Item “Other variations”, relating to finished products, represents the impact on the financial year of any such calcula-tion. The considerable increase in this adjustment compared to the previous year is substantially resulting from increase in intercompany stocks at the Chinese subsidiary necessary to support the sales increase in that country.
thousand euros
01/01/10Net variation/
increaseOther
movementsConversion differences 12/31/10
Raw materials and packaging 17,317 1,929 - 618 19,864
Provision for depreciation of raw materials and consumables
- - - - -
Raw materials, consumables and packaging 17,317 1,929 - 618 19,864
Semi-finished products 27,018 (3) - 7 27,022
Provision for depreciation of semi-finished products - - - - -
Semi-finished products 27,018 (3) - 7 27,022
Finished products and goods for sale 18,072 6,718 (1,906) 1,104 23,988
Provision for depreciation of finished products (4,873) (470) - 37 (5,306)
Finished products 13,199 6,248 (1,906) 1,141 18,682
Stocks 57,534 8,174 (1,906) 1,766 65,568
72

Trade debtors and other short-term debtors Variation is as follows:
Increase in the balance of trade debtors (+38%) is substantially ascribable to a cyclical effect connected with the quar-terisation of turnover. In fact, in the last quarter of 2010, the Group realised a consolidated turnover of 78,388 thousand euros against 53,890 thousand euros in the same period of 2009 (+45%). This datum is the best indicator of an economy recovery that is starting to come out of the tunnel. During the current year, the Group was not faced with bad debts such as generating notable bad debt losses, nor contingent risks are predicted for any uncollected balance thereof. Average collection days have slightly shortened compared to the previous year (from 88 days in 2009 to 85 in 2010). Finally, the effect of currency variation, with reference to the previous period, generated a considerable increase in the total amount of debtors estimated to be approximately 2,000 thousand euros chiefly as a consequence of the appreciation of the US dollar and Chinese yuan vs. the euro.
The provision for bad debts, amounting to 269 thousand euros, recorded in the profit and loss account under “Devaluations”, is relating to debtors accrued in the year, the collection whereof is uncertain, analytically assessed according with the proce-dures set out by the credit committee which, on a monthly basis, carries out the analysis of all overdue items. The balance sheet variation for the period amounting to 40 thousand euros, is reported net of releases and decreases amounting to 229 thousand euros.
Trade debtors also include amounts owed by associated companies, of which 194 thousand euros are owed to Vimi Fasteners Spa (270 thousand euros in 2009), and 38 thousand euros to the parent company Finregg Spa (38 thousand euros also in 2009), respectively.
Amounts owed by social security institutions are relating to the government grant for ordinary redundancy advanced by the company to employees during the current year, for which as at December 31, 2010, Comer Industries Spa had not received the necessary authorisation by the Entity to recover it by offsetting the payment of social security contributions. Amounts owed by suppliers are relating, for approximately 2,100 thousand euros, to supplies from the Chinese market
thousand euros
01/01/10 Net variationConversiondifferences 12/31/10
Short-term trade debtors 57,672 19,733 1,988 79,393
Provision for bad debts (799) (40) 8 (831)
Trade debtors 56,873 19,693 1,996 78,562
thousand euros
01/01/10 Net variationConversiondifferences 12/31/10
Amounts owed by Simest - 120 - 120
Amounts owed by social security institutions 716 (125) - 591
Deferred liabilities 673 (165) - 508
Amounts owed by suppliers 2,015 532 - 2,547
Other short-term debtors 12 231 - 243
Other short-term debtors 3,416 593 - 4,009
73

invoiced in December 2010 and related to goods not yet owned by Comer Industries Spa, under the contractual provisions regulating returns. The balance, of approximately 400 thousand euros, is relating to payments on account to European suppliers. Deferrals are mainly relating to recording of insurance instalments on an accrual basis.
Current tax assets Variation is as follows:
The VAT credit of approximately 9,800 thousand euros is pertaining to the parent company Comer Industries Spa for ap-proximately 8,000 thousand euros, and for 1,800 thousand euros to the subsidiary Comer Industries Components Srl. In May 2010, the parent company collected the credit claimed in the prior year amounting to 5,200 thousand euros, while at year end the VAT credit claim for 2010 is still pending, amounting to 3,800 thousand euros and relating to financial year 2009, which together with the VAT amounts accruing in the period (4,200 thousand euros), make up the aggregate VAT credit claim at December 31, 2010. In the first quarter of 2011 the company applied for a further VAT refund amounting to 3,000 thousand euros relating to the credit generated in 2010, as commented above.The balance of 143 thousand euros is relating to the VAT credit claim of subsidiary Comer Industries (Shaoxing) Co. Ltd. with respect to the request for export VAT refund.The tax credit of 388 thousand euros is the amount in excess of payments on account of current taxes on the income of the period, by subsidiary Comer Industries Inc.
Financial assets and liabilities, guaranteesOther short-term financial assetsOn January 18, 2010 the loan granted to subsidiary Poclain Hydraulics Industriale Srl for its industrial start-up and amount-ing to 500 thousand euros was repaid.This item also includes 5,000 thousand euros that is a cash investment falling due within 3 months, made with Banca Popolare di Verona - BSGSP, at a particularly favourable rate.
thousand euros
01/01/10 Net variation 12/31/10
VAT 10,989 (1,185) 9,804
Refund of VAT on exports to China 481 (338) 143
Current taxes 1,923 (1,535) 388
Refund of duty on export 54 (17) 37
Other amounts owed by the inland revenue 197 (197) -
Current tax assets 13,644 (3,272) 10,372
thousand euros
Currency Indexation01/01/10
Book value Increase Decrease12/31/10
Book value
12/31/10 Nominal value
(in currency)
Other short-term financial credits EUR Eur3 +1.55% 500 5,000 (500) 5,000 5,000
Total other short-term financing 500 5,000 (500) 5,000 5,000
74

Short-term derivative financial instrumentsThe variation in short-term derivative financial instruments is shown below:
It should be noted that the Group has notable transactions denominated in the currency of non-euro zone countries (chiefly USD, GBP, CAD and CNY).The exchange rate risk is mainly hedged by forward currency purchase and sale contracts (forward hedge or synthetic hedge).The counterparties to these transactions are banks with which the Group operates habitually.The currencies involved are the USD, GBP, and CAD, and any such transactions carried out to hedge cash inflows con-nected with budgeted sales transactions, scheduled on a monthly basis, may well fall within those defined as “highly effec-tive” on “highly probable” future transactions, and their economic effect is recorded on an accrual basis.The efficacy assessment is aimed at proving the high correlation existing between the technical-financial characteristics of the risk being hedged (maturity, amount, etc.) and those of the hedging instrument, by carrying out specific retrospective and prospective tests using the US dollar off-set method. The types of derivative contracts most used are forward sales. The fair value of currency forward contracts is calculated by discounting back the difference between the notional amount determined at the contractual forward exchange rate and the notional amount determined at the forward exchange rate calculated on the closing date of accounts. Whereas the fair value of exchange rate options is calculated by using the Black & Scholes formula.The fair value is correctly calculated by credit institutions, the counterparties to these transactions, and confirmed by the latter in the specific documentation thereon.Hedge transactions are substantially carried out with two primary bank institutions: Deutsche Bank and Banca Akros of Milan.At December 31, 2010, for transactions hedged by credit underlying values, the value of notionals is approximately 13,952 thousand euros, whereas the related negative fair value, recorded on an accrual basis as Earnings Before Interest and Taxes in 2010, amounts to 50 thousand euros.At December 31, 2010 the residual notional amount related to hedge contracts for 2010 amounts to 26,411 thousand euros, and the related fair value records revenues for 122 thousand euros also recorded under the profit and loss account under financial income be-cause these transactions, although being non-speculative in nature, do not meet the stringent parameters of IAS 39 to be considered hedges. All maturity dates of hedges of business transactions planned for 2010, have been carried out directly by Comer Industries Spa, by virtue of the new corporate organisation and fall within the January 31, 2010 and December 31, 2011 timeframe.
thousand euros
12/31/10Notional value
12/31/10 Fair value
12/31/09Notional value
12/31/09 Fair value
Short-term derivative financial instruments on exchange rates with positive fair value 40,364 72 - -
Short-term derivative financial instruments on exchange rates with negative fair value - - 19,972 (75)
Total exchange rates hedging 40,364 72 19,972 (75)
Short-term derivative financial instruments on interest rates with negative fair value - - - -
Total interest rates hedging - - - -
Net value financial instruments 40,364 72 19,972 (75)
75

The table below shows the breakdown of the aforementioned transactions in euro by value and type:
Residual hedges year 2010 CurrencyNominal value
Amounts in currencyNotional value
Amounts in eurosFair value
Amounts in euros
Hedges considered effectiveForward hedges/synthetic forwards USD - - -
Forward hedges/synthetic forwards CAD - - -
Forward hedges/synthetic forwards GBP - - -
Sub total - -
Hedges considered ineffectiveForward hedges/synthetic forwards USD 13,369,263 10,005,436 27,259
Forward hedges/synthetic forwards CAD 3,983,345 2,990,050 (76,477)
Forward hedges/synthetic forwards GBP 823,620 956,863 (929)
Sub total 13,952,348 (50,147)
Total summarised by currency USD 13,369,263 10,005,436 27,259
CAD 3,983,345 2,990,050 (76,477)
GBP 823,620 956,863 (929)
Total of aggregate residual hedges 2010 13,952,348 (50,147)
Hedges considered effectiveForward hedges/synthetic forwards USD - - -
Forward hedges/synthetic forwards CAD - - -
Forward hedges/synthetic forwards GBP - - -
Hedges on loans CNY 50,694,352 5,746,356 60,689
Sub total 5,746,356 60,689
Hedges considered ineffectiveForward hedges/synthetic forwards USD 13,200,000 9,878,761 163,801
Forward hedges/synthetic forwards CAD 10,500,000 7,881,699 (164,433)
Forward hedges/synthetic forwards GBP 2,500,000 2,904,444 61,942
Forward hedges/synthetic forwards CNY - - -
Sub total 20,664,904 61,310
Total summarised by currency USD 13,200,000 9,878,761 163,801
CAD 10,500,000 7,881,699 (164,433)
GBP 2,500,000 2,904,444 61,942
CNY 50,694,352 5,746,356 60,689
Total of aggregate residual hedges 2011 26,411,260 121,999
Total summarised by currency USD 26,569,263 19,884,196 191,060
CAD 14,483,345 10,871,749 (240,910)
GBP 3,323,620 3,861,307 61,013
CNY 50,694,352 5,746,356 60,689
Short-term derivative financial instruments 40,363,608 71,851
76
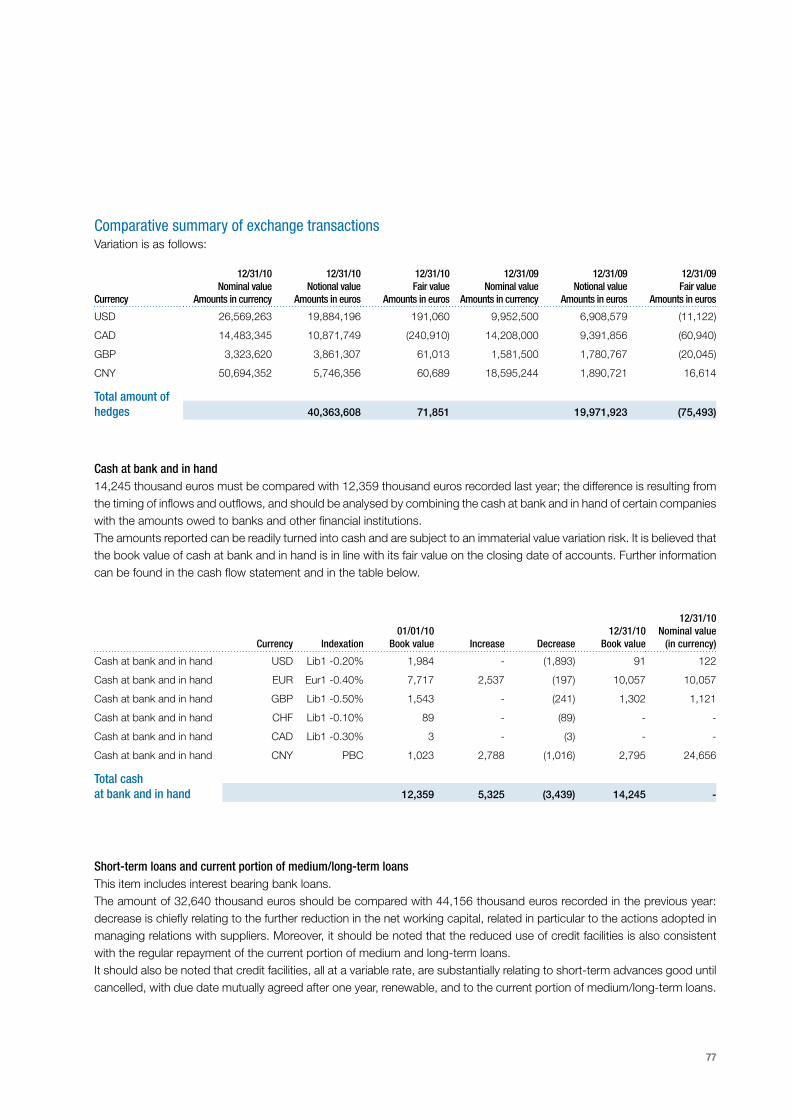
Comparative summary of exchange transactionsVariation is as follows:
Cash at bank and in hand14,245 thousand euros must be compared with 12,359 thousand euros recorded last year; the difference is resulting from the timing of inflows and outflows, and should be analysed by combining the cash at bank and in hand of certain companies with the amounts owed to banks and other financial institutions.The amounts reported can be readily turned into cash and are subject to an immaterial value variation risk. It is believed that the book value of cash at bank and in hand is in line with its fair value on the closing date of accounts. Further information can be found in the cash flow statement and in the table below.
Currency
12/31/10Nominal value
Amounts in currency
12/31/10Notional value
Amounts in euros
12/31/10Fair value
Amounts in euros
12/31/09Nominal value
Amounts in currency
12/31/09Notional value
Amounts in euros
12/31/09Fair value
Amounts in euros
USD 26,569,263 19,884,196 191,060 9,952,500 6,908,579 (11,122)
CAD 14,483,345 10,871,749 (240,910) 14,208,000 9,391,856 (60,940)
GBP 3,323,620 3,861,307 61,013 1,581,500 1,780,767 (20,045)
CNY 50,694,352 5,746,356 60,689 18,595,244 1,890,721 16,614
Total amount ofhedges 40,363,608 71,851 19,971,923 (75,493)
Currency Indexation01/01/10
Book value Increase Decrease12/31/10
Book value
12/31/10Nominal value
(in currency)
Cash at bank and in hand USD Lib1 -0.20% 1,984 - (1,893) 91 122
Cash at bank and in hand EUR Eur1 -0.40% 7,717 2,537 (197) 10,057 10,057
Cash at bank and in hand GBP Lib1 -0.50% 1,543 - (241) 1,302 1,121
Cash at bank and in hand CHF Lib1 -0.10% 89 - (89) - -
Cash at bank and in hand CAD Lib1 -0.30% 3 - (3) - -
Cash at bank and in hand CNY PBC 1,023 2,788 (1,016) 2,795 24,656
Total cashat bank and in hand 12,359 5,325 (3,439) 14,245 -
Short-term loans and current portion of medium/long-term loansThis item includes interest bearing bank loans.The amount of 32,640 thousand euros should be compared with 44,156 thousand euros recorded in the previous year: decrease is chiefly relating to the further reduction in the net working capital, related in particular to the actions adopted in managing relations with suppliers. Moreover, it should be noted that the reduced use of credit facilities is also consistent with the regular repayment of the current portion of medium and long-term loans.It should also be noted that credit facilities, all at a variable rate, are substantially relating to short-term advances good until cancelled, with due date mutually agreed after one year, renewable, and to the current portion of medium/long-term loans.
77

During the current year, also the loan in US dollars was repaid (undertaken by subsidiary Comer Industries Inc.) conditional on compliance with two financial covenants called “Debt to tangible net worth” and “Debt service coverage” respectively. These covenants have been complied with at December 31, 2010.
Currency Indexation01/01/10
Book value Increase Decrease12/31/10
Book value
12/31/10Nominal value
(in currency)
Banks for overdrawn accountsand payments on account EUR Eur1 +0.25% 5,086 - (1,316) 3,770 3,770
Banks for payments on accounton orders EUR Eur1 +0.20% 23,205 - (18,205) 5,000 5,000
Loan Intesamedium/long current portion EUR Eur6 +0.45% 2,995 3,118 (2,995) 3,118 3,118
Loan Mediocredito Italianomedium/long current portion EUR Eur3 +1% - 500 - 500 500
Loan BPERmedium/long current portion EUR Eur6 +0.65% 376 399 (376) 399 399
Loan Mediocredito Italianomedium/long current portion EUR Eur6 +1.50% 1,111 1,111 (1,111) 1,111 1,111
Loan UBImedium/long current portion EUR Eur3 +1.40% 575 591 (575) 591 591
Loan BPER(Comer Industries Components Srl) EUR Eur3 +1% - 981 - 981 981
Loan BSGSP payments on account (Comer Industries Components Srl) EUR Eur1 +0.25% 3,227 - (1,554) 1,673 1,673
Loan Mediocredito Italiano(Comer Industries Components Srl) EUR Eur1 +0.45% 1,714 1,714 (1,714) 1,714 1,714
CredemFactor EUR Eur1 +0.30% - - - - -
Loan Intesa Shanghai EUR Eur1 +1.20% - - - - -
Loan Deutsche Bank Shanghai EUR Eur1 +1.50% 1,899 3,963 - 5,862 5,862
Loan Deutsche Bank Shanghai CNY PBC flat - 363 - 363 3,202
Loan NJ Bank CNY PBC flat - 2,267 - 2,267 19,999
Loan Unicredit Shanghai CNY PBC flat 1,962 1,779 - 3,741 33,003
Loan FTB USD Lib1 +1.50% 1,251 299 - 1,550 2,071
Total short-term loans(I/C excluded) 43,401 17,085 (27,846) 32,640 -
Loan Finregg EUR Eur1 +0.30% 755 - (755) - -
Total short-term loans 44,156 17,085 (28,601) 32,640 -
78

Long-term loans and debenture loansThis item includes financial instruments “held to maturity” with a defined maturity that cause fixed or determinable payments. The Group has the actual intention and the relative economic and financial capacity to keep these instruments until maturity.The book value of medium/long-term financial creditors is close to their fair value.14,475 thousand euros compare with 16,890 thousand euros in the previous year: repayments made during the current year have been offset by net increases amounting to 6,000 thousand euros for unsecured loans granted by Mediocredito Italiano and Banca Popolare dell’Emilia Romagna.Undertaking new loans required no stipulation of covenants, while old loans are still subject to financial covenants, in particular: - UBI Banca: the following ratios with reference to the consolidated financial statements of Comer Industries Spa, all met at
December 31, 2010: “Net financial position to total capital and reserves”, “Net financial position to gross operating margin”, and “Gross operating margin to financial charges”;
- Mediocredito Italiano, with respect to the consolidated financial statements of the parent company Finregg Spa: “Net finan-cial position to total capital and reserves”, “Net financial position to gross operating margin”.
As far as the position of Mediocredito Italiano is concerned, on the basis of the Finregg Spa consolidated pre-actual, the above covenant has been met. Debenture loans, falling due after five years, amount to 2,066 thousand euros and are fully paid-up by shareholders.As indicated for the previous financial year, the composition of borrowing and that of equity proves that non-current assets are abundantly covered, which assures stability and confidence as far as sources of finance are concerned.More information can be found in the specific tables below.
thousand euros
Currency Indexation01/01/10
Book value Increase Decrease12/31/10
Book value
12/31/10Nominal value
(in currency)
Loan Intesamedium/long-term portion EUR Eur6 +0.45% 6,365 - (3,119) 3,246 3,246
Loan Mediocredito Italiano medium/long-term portion EUR Eur3 +1% - 2,500 - 2,500 2,500
Loan BPERmedium/long-term portion EUR Eur6 +0.65% 1,268 - (399) 869 869
Loan Mediocredito Italiano(Comer Industries Components Srl) EUR Eur1 +0.45% 1,714 - (1,714) - -
Loan BPER(Comer Industries Components Srl) EUR Eur3 +1% - 2,019 - 2,019 2,019
Loan Mediocredito Italiano medium/long-term portion EUR Eur6 +1.50% 3,333 - (1,111) 2,222 2,222
Loan UBImedium/long-term portion EUR Eur3 +1.40% 2,144 - (591) 1,553 1,553
Debenture loan EUR TUS +3% 2,066 - - 2,066 2,066
Totalmedium/long-term loans 16,890 4,519 (6,934) 14,475
79

Below is reported the breakdown of bank loans by nature, short and medium/long-term existing at December 31, 2010:
Below is reported the breakdown of debenture loans existing at December 31, 2010:
Capital and reservesThe share capital of the parent company consists of 10,000,000 shares with a nominal value of 1 euro each, fully subscribed and paid-up. During the current financial year no transactions were carried out on capital account items. Other reserves include:
thousand euros
01/01/10Balance
Newoutpayment (repayment)
12/31/10Balance
euro< 1 year
euro> 1 year
euro
Of which: more than
5 years Due date
Loan Unicredit - - - - - - -
Intesa San Paolo 9,360 (2,995) 6,365 3,118 3,247 - 10/31/2012
Loan Intesa Mediocredito 3,428 (1,714) 1,714 1,714 - - 09/30/2011
Loan Mediocredito Italiano 4,444 (1,111) 3,333 1,111 2,222 - 12/31/2013
Loan Mediocredito Italiano - 3,000 3,000 500 2,500 - 09/30/2015
Loan UBI banca 2,719 (575) 2,144 591 1,553 - 05/25/2014
Loan BPER - 3,000 3,000 981 2,019 - 12/31/2013
Loan BPER 1,644 (376) 1,268 399 869 - 07/10/2013
Total 21,595 (771) 20,824 8,414 12,410 -
thousand euros
01/01/10Balance
Newoutpayment (repayment)
12/31/10Balance
euro< 1 year
euro> 1 year
euro
Of which: more than
5 years Due date
Debenture loan 08/01/96 1,188 - 1,188 - - 1,188 08/01/2016
Debenture loan 11/20/85 878 - 878 - 878 - 12/31/2015
Total debenture loans 2,066 - 2,066 - 878 1,188
thousand euros
12/31/10 12/31/09
Legal reserve 1,347 1,155
Extraordinary reserves available 16,122 12,863
Consolidation reserve 3,543 3,543
FTA reserve (First Time Adoption IAS/IFRS) (5,575) (5,575)
Conversion reserve (2,614) (5,056)
Other reserves 12,823 6,930
80

Information on the possibility of distributing reserves can be found in the notes to the financial statements of the parent company Comer Industries Spa. Increase in legal reserve and extraordinary reserve, of 192 and 3,259 thousand euros respectively, can be included in the allocation of the statutory result of the parent company Comer Industries Spa.Increase in the conversion reserve of 2,442 thousand euros is mainly resulting from the appreciation of the US dollar and Chinese yuan versus the euro currency with reference to precise data at December 31 of each year.
Reconciliation between the amount of capital and reserves items and the result of operations shown in the financial state-ments of the parent company Comer Industries Spa drawn up in compliance with the Italian accounting standards at December 31, 2010, and the amounts reported in the consolidated financial statements, drawn up in compliance with international standards, on the same date is as follows:
thousand euros
12/31/10Capital and
reserves
12/31/10Profit or loss for
the financial year
12/31/09Capital and
reserves
12/31/09Profit or loss for
the financial year
Italian GAAP statutory capital and reserves of Comer Industries Spa 60,929 38,307 23,622 3,842
Dividends distributed (500) - (1,000) -
Italian GAAP statutory capital and reserves of Comer Industries Spa 60,429 38,307 22,622 3,842
Effects of IAS/IFRS on the financial statementsof the parent company 1,432 821 611 (16)
IAS/IFRS statutory capital and reserves ofComer Industries Spa 61,861 39,128 23,233 3,826
Differences between adjusted capital and reserves of consolidated equity investments and their value in the financial statements of the parent company net of IAS/IFRS effects 69,130 9,319 57,311 6,809
Write off of infragroup dividends (47,548) (37,598) (9,950) (9,950)
Write off of exchange differences non-cash items in currency - IAS 21 (1,357) 1,034 (2,391) (58)
Recording in the profit and loss account of exchange differences on disposal of assets, deferred to the conversion reserve
(29) 29 - -
Subsidiary equity contribution to the parent company 20,196 (27,216) 44,970 (3,199)
Write off of unrealised infragroup profits with thirdparties net of related tax effects (2,953) (1,222) (1,731) 653
Minority capital and reserves - - - -
Total capital and reserves IAS/IFRS 79,104 10,690 66,472 1,280
81

During the current financial year, Comer Industries Spa resolved upon and distributed dividends to its parent company Finregg Spa in the total amount of 500 thousand euros.Any differences in the equity of individual subsidiaries, originating from application of IAS/IFRS standards have been recognised in the equity contribution of same, net of any devaluations. Dividends collected during the current financial year by the parent company Comer Industries Spa and its subsidiaries in the total amount of 37,598 thousand euros, of which 37,040 thousand euros coming from Comer Industries AG, have been written off when the consolidated financial statements were drawn up. Item “Write off of unrealised infragroup profits” includes write off of the margin on infragroup sales, the goods whereof were still unsold in stock at the purchasing subsidiaries at year-end.All the effects of the foregoing are shown net of any relevant tax liability.
Deferred tax liabilities
Deferred taxes are relating to the tax effect of timing differences between the profit or loss for the year for statutory purposes of each company, and any associated taxable income. The amounts thus defined are detailed in the following table:
thousand euros
12/31/10 12/31/09
Provision for deferred taxation after 12 months 1,507 1,466
Provision for deferred taxation within 12 months 340 284
Deferred tax liabilities 1,847 1,750
thousand euros
12/31/10Timing
differences
12/31/10Total deferred
taxes
12/31/09Timing
differences
12/31/09Total deferred
taxes
2010Accrual/
(reversal)
Deferred tax liabilities company
Full rate difference - pro rata new assets purchased and operated in 2008 Comer Industries Spa 803 221 803 221 -
Adjustment items in currency Comer Industries Spa 395 109 157 43 66
Value adjustments Comer Industries Inc. 542 206 508 188 18
Other timing differences Comer Industries Inc. 113 43 - - -
Debtors, exchange losses and other CH - - 1,012 166 (166)
Other minor 15 4 - - -
Total deferred taxes 1,867 583 2,481 618 (82)
Deferred tax liabilities from transitionto IAS individual companiesEmployee benefits IAS 19 1,448 398 1,177 324 75
Derivative instruments IAS 39 72 20 23 6 13
Differences on admissible capitalisation and related effect value adjustments + leasing
1,522 478 1,623 510 (32)
Deferred taxes on business combination amortments 1,171 368 931 292 75
Total deferred taxes 4,213 1,264 3,754 1,132 132
Total balance 1,847 1,750 50
82

Post-employment benefitsVariation in the provision was as follows:
The economic effects of the period, compared with the prior year, are summarised below:
The employee severance indemnity is relating to employee benefits governed by the rules and regulations in force in Italy and recorded in the financial statements of Italian companies. The Group, on the basis of actuarial valuations and interpretations available on the closing date of accounts, adopted the following differentiations: - employee severance indemnity instalments accruing as from January 1, 2007: this is a “defined contribution plan” in
both the case of option for complementary social security schemes, and in the case of option for the treasury fund of the National Social Security Institution (INPS). The accounting treatment is therefore the same as that in place for the payment of contributions of a different nature;
- employee severance indemnity provision at December 31, 2006: this is still a “defined benefit plan” with the consequent need to make actuarial calculations, which however compared to the calculations made to-date (and reflected in the financial statements for the year ending December 31, 2006) exclude the component relating to future salary and wage increase.
thousand euros
12/31/10 12/31/09
Opening balance 8,960 9,614
Decrease for resigned and advances (610) (516)
Settlement of complementary pension schemes and treasury fund (1,912) (2,069)
Transfer for Fluid Power business transfer (IAS values) - (581)
Appropriation in the current year 2,342 2,459
IAS 19 recalculation effects on the period (before taxation) (270) 53
Closing balance 8,510 8,960
thousand euros
12/31/10 12/31/09 Reclassified under profit and loss account
Current service cost (278) (201) Staff costs
Actuarial loss/(profit) (350) (163) Staff costs
Financial charges 358 417 Financial charges
Aggregate tax effect 74 (15) Income taxes on the income of the period
Aggregate effect (196) 38
83

Liabilities for defined benefit plans have been determined on the basis of the following Group actuarial assumptions:
The favourable effect for the period amounting to 196 thousand euros in terms of lower costs before taxes is chiefly con-firmed by the increase in the average corporate seniority, from 10.25 to a gratifying 12.50 years of seniority.The composition of staff by category, based on average data, is as follows:
At December 31, 2010 the Group headcount was 1,217.
Short and long-term provisionsThe provisions include:
The guarantee provision mainly includes the cost estimate for repairs of products owned by customers and returned to Comer Industries Spa at December 31, 2010, because not meeting expectations. The remaining 100 thousand dollars (69 thousand euros) are relating to the exempt portion at the expense of Comer Industries Inc. to cover an insured accident that will be settled within the first semester of 2011. The provision for agent termination indemnity includes amounts appropriated for indemnity payable should agency agree-ments be terminated, calculated according with the methods indicated in the collective agreement dated March 20, 2002 that regulates agency and sales representation agreements in the areas of industry and cooperation. During the current
Unit ofmeasurement 12/31/10 12/31/09
Discounting back rate % 4.55 4.10
Expected rate of employees resingning before retirement (turnover) % 4.00 4.00
Annual rate of increase in cost of living % 2.00 2.00
Average employeer seniority at the company Years 12.50 10.25
Average number in 2010 Average number in 2009
Managers 29 32
Clerical workers 391 470
Workers 734 742
Total 1,153 1,244
thousand euros
12/31/10 12/31/09
Provision for product risk guarantee 1,158 47
Provision for legal disputes 69 69
Other provisions for risks - 260
Short-term provisions 1,227 376
Provision for agent termination indemnity 1,097 1,071
Long-term provisions 1,097 1,071
84
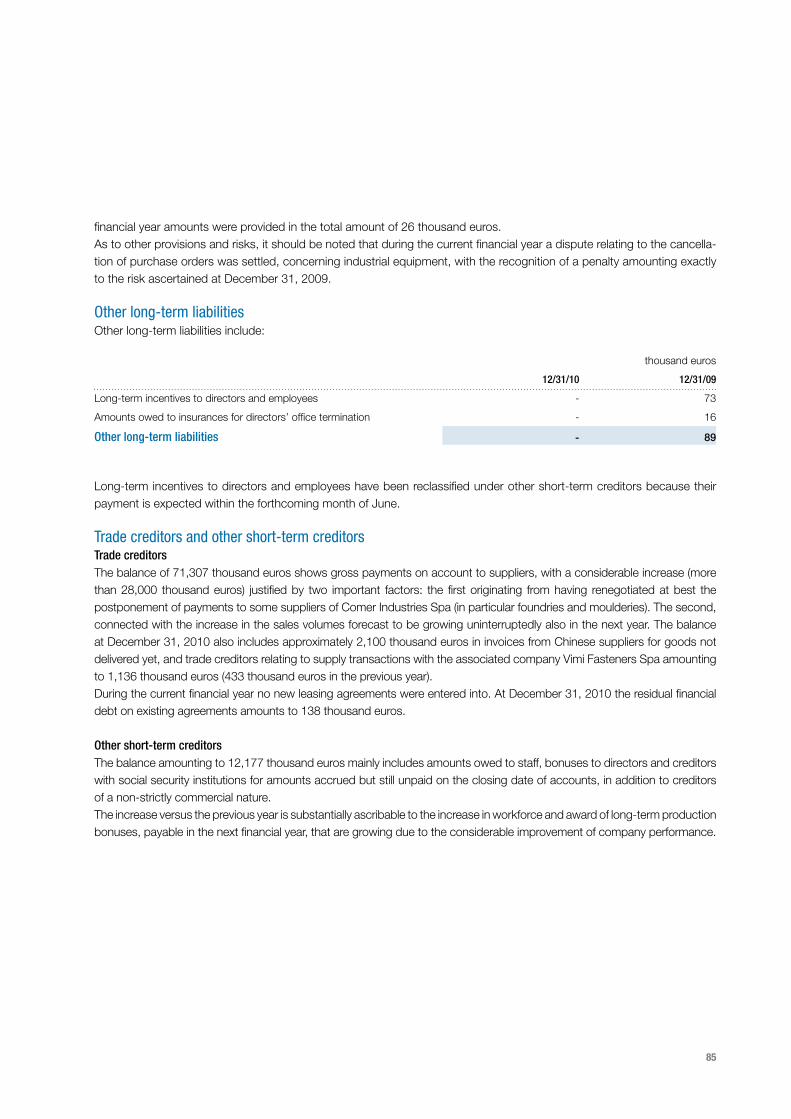
financial year amounts were provided in the total amount of 26 thousand euros. As to other provisions and risks, it should be noted that during the current financial year a dispute relating to the cancella-tion of purchase orders was settled, concerning industrial equipment, with the recognition of a penalty amounting exactly to the risk ascertained at December 31, 2009.
Other long-term liabilitiesOther long-term liabilities include:
Long-term incentives to directors and employees have been reclassified under other short-term creditors because their payment is expected within the forthcoming month of June.
Trade creditors and other short-term creditorsTrade creditorsThe balance of 71,307 thousand euros shows gross payments on account to suppliers, with a considerable increase (more than 28,000 thousand euros) justified by two important factors: the first originating from having renegotiated at best the postponement of payments to some suppliers of Comer Industries Spa (in particular foundries and moulderies). The second, connected with the increase in the sales volumes forecast to be growing uninterruptedly also in the next year. The balance at December 31, 2010 also includes approximately 2,100 thousand euros in invoices from Chinese suppliers for goods not delivered yet, and trade creditors relating to supply transactions with the associated company Vimi Fasteners Spa amounting to 1,136 thousand euros (433 thousand euros in the previous year).During the current financial year no new leasing agreements were entered into. At December 31, 2010 the residual financial debt on existing agreements amounts to 138 thousand euros.
Other short-term creditorsThe balance amounting to 12,177 thousand euros mainly includes amounts owed to staff, bonuses to directors and creditors with social security institutions for amounts accrued but still unpaid on the closing date of accounts, in addition to creditors of a non-strictly commercial nature. The increase versus the previous year is substantially ascribable to the increase in workforce and award of long-term production bonuses, payable in the next financial year, that are growing due to the considerable improvement of company performance.
thousand euros
12/31/10 12/31/09
Long-term incentives to directors and employees - 73
Amounts owed to insurances for directors’ office termination - 16
Other long-term liabilities - 89
85

Current tax liabilitiesThe breakdown is as follows:
Amounts owed to the tax administration for current taxes reflects the improvement of profitability, while the balance for personal income tax withheld sets at an amount substantially in line with the prior year.
Notes to the operating management of the profit and loss accountIncome from sales and servicesIncome is broken down as follows:
Breakdown of income by geographic area is as follows:
The sales turnover for 2010 sets at 276,534 thousand euros, definitely increased compared to the previous year (+14.6%). Comer Industries reaffirms also in 2010 its strong inclination to export its products: the turnover generated outside the Italian boundaries is 84% of total, while the share of non-European markets reaches 50% (increased by 2% compared to the prior year). Therefore, currency fluctuations have a considerable impact on the Group data, and therefore it should be noted that also in 2010 the continued appreciation of the US dollar and Chinese yuan of +5.2% and +6.2% respectively vs. the average exchange rates seen in 2009, contributed to the growth of this value by approximately 4,900 thousand euros.
thousand euros
12/31/10 12/31/09
Balance inland revenue for current taxes 3,128 1,479
Inland revenue for personal income tax withheld 1,508 1,557
Substitute tax EC section release in the short term - 226
Other amounts payable to inland revenue for withholding taxand VAT foreign companies
234 49
Current tax liabilities 4,870 3,311
thousand euros
12/31/10 12/31/09
Sale of goods and products 276,379 240,910
Services 155 418
Income from sales and services 276,534 241,328
thousand euros
12/31/10 12/31/09
Italy 41,859 38,223
Europe 96,652 88,381
China 47,584 30,668
North America 76,495 67,998
Rest of the world 13,944 16,058
Total sales by geographic area 276,534 241,328
86

Specifically, the most noticeable performance was recorded by the industrial division, driven by applications for wind power generators on the Chinese market, and drives for compact construction machinery on the European and American markets. Reassuring signs of recovery are coming from the agricultural application area too, thanks to the rise in prices of agricultural commodities seen in the second half of the year.
Other operating revenuesOther operating income is broken down as follows :
Sale of leftovers and sliver, and recovery from customers of product customisation expenses are in general in line with the course of production.The result for the period of exchange transactions was fully reclassified as financial charges and income, consistent with the equity accounting treatment.Income relating to the tax credit under l. 296/06, recorded for 29 thousand euros in the period, is the balance for 2010 of the benefit pertaining to 2009, the last year in which this benefit was granted.Costs capitalised during the current year for industrial product development projects, as set forth in IAS 38, amount to 416 thousand euros and are shown net of the cost of projects dropped in the period, amounting to 179 thousand euros.
Staff costsIncrease in staff costs (+10.2%) is resulting from the higher impact, in line with the results achieved, of such variable remu-neration policies as performance bonuses, MBO and long-term incentives granted to employees and directors. Moreover, it should be noted that recourse to social safety valves in 2010 occurred to a far lesser extent as compared to the previous year. In fact, the ordinary redundancy fund was activated for the first 4 months of the year only, and later the Job-security agreement was sought for, which on the one side softened the impact of the company crisis, and on the other made it possible to adapt the labour force requirements to production plans.
Other operating charges e devaluationsOther operating charges include indirect charges associated with turnover, production and the corporate organisation structure such as rentals, utilities, leases and maintenance, insurance expenses, sales commissions, expenses related to product quality.This item increased by approximately 2,600 thousand euros (+9.2%) substantially in line with the trend of turnover, which reaffirms the definite focus of the Group on limiting all operating charges.
thousand euros
12/31/10 12/31/09
Recoupment of manufacturing and service cost 1,530 1,505
Sale of scraps 527 208
Recoupment of expenses for training courses 122 66
Capital gains and contingent assets 173 790
Balance of exchange operating management - 163
Tax credit on recruitment 64 64
Tax credit l. 296/06 29 260
Capitalised costs net of divestment costs 237 71
Other income and revenues 22 40
Total other income and revenues 2,704 3,167
87

Value adjustments consist entirely of the provisions for bad debts for the period, before any release thereof.
Earnings Before Interest and Taxes (EBIT)The absolute amount realised is 19,466 thousand euros, equal to 7.04% of the consolidated turnover. This amount in rela-tive terms can be compared with the result for 2008 (6.88%) because, owing to the company crisis, the operating profit for 2009 can be considered non-recurring. Comer Industries Spa, Comer Industries Components and, in particular, Comer Industries (Shaoxing) Co. Ltd. are the companies that more than others participated in generating the Earnings Before Interest and Taxes, thus confirming that the Asian market (in particular the wind area) has driven the recovery seen in the first few months of 2010, while on the Western market and in the traditional industry the Group is dealing with, a marked improvement was experienced especially in the last quarter of current year.Additional information can be found in the management report.
Net financial income/(charges) The breakdown is as follows:
thousand euros
12/31/10 12/31/09
Economic result of hedge transactions fair value at 12/31 72 (53)
Recording in profit and loss account of exchange differences on divested assets, deferred to the conversion reserve 29 -
Exchange gains 1,617 234
Exchange losses and other charges (3,211) (1,656)
Exchange gains and losses (1,493) (1,475)
Bank interest receivable 10 221
Interest receivable from inland revenue 97 79
Interest account contribution export credit l.d. 143/98 2,917 1,036
Other commercial interest 45 221
Total financial income from cash management 3,069 1,557
Interest payable to parent and associated companies (6) (6)
Interest payable for transfers on a non-recourse basis (606) -
Interest payable on bills for discount (1,718) (593)
Interest on advances, loans, and other short-term bank charges (738) (1,731)
Interest on medium/long-term loans (340) (789)
Interest payable on discounting back of TFR (358) (417)
Interest payable on leasing (7) (7)
Interest and charges on debenture loans (82) (105)
Total financial charges from cash management (3,855) (3,648)
Net interest and other financial charges (786) (2,091)
Balance cash management (2,279) (3,566)
88

Exchange gains and lossesThe negative balance of exchange management is chiefly ascribable to the constant appreciation of all currencies versus the euro which, at year end, generated for the parent company, with reference to hedge transactions, exchange losses in the total amount of 2,700 thousand euros, offset by profits realised on transactions in currency carried out in the period by foreign subsidiaries totalling 1,200 thousand euros. In fact, as indicated in the hedge corporate policy, it is the parent company that hedges the exchange risk of foreign subsidiaries for any volumes traded in foreign currencies.The profit totalling 125 thousand euros, reported under item fair value on hedge transactions, is the economic result of the valuation at December 31, 2010 of hedge transactions considered ineffective.
Interest and other net financial charges Liabilities for interest on loans and long and short-term financing halved thanks to the combination of the following three effects: decrease in 6-month Euribor, benchmark for cost of money (the average in 2010 was 1.08% against the average for 2009 of 1.43%), better conditions in terms of spread applied by banks to the parent company, and a considerable recovery of the net financial position at year end (27,870 thousand euros). The amount of 606 thousand euros should also be noted, resulting from interest on transfers on a non-recourse basis of bills of exchange received from Chinese customers and discounted within December 31, 2010.Finally, it should be noted that the parent company has benefited from the interest account contribution under l.d. 143/98 for export credit recorded on an accrual basis (2,917 thousand euros) which in the management view must be properly measured net of costs incurred for discount of “promissory notes”.The above concession enables Italian exporters to offer medium/long-term payment extensions to foreign purchasers/clients on competitive conditions and interest rates, in line with OECD countries. The above concession is granted in the form of interest on loans granted by Italian or foreign banks.
Income taxesThe total tax liability amounting to 6,497 thousand euros, includes current income taxes totalling 5,875 thousand euros (3,111 thousand euros in 2009) and a net liability for deferred taxes amounting to 622 thousand euros (it was a tax benefit of 1,823 thousand euros in the previous year).The consolidated tax liability at December 31, 2010 sets at 37.8%, therefore an uneven contest with the figure recorded in 2009 (50.16%), affected by the weight of IRAP and by the economic crisis, however more reasonably comparable with that for year 2008, when income taxes had an impact of 33.16% on the gross profit. For a better comprehension of reconcili-ation between the tax liability recorded in the financial statements and the hypothetical tax liability, the following explanatory table is reported, where IRAP is taken in no account being the latter a tax with a taxable base different from that applicable to income before taxes, which would give an unrealistic presentation of the results for the one and the other year. Therefore, the reconciliation was determined only on the basis of the corporate income tax in force in Italy, amounting to 27.5%, ap-plied to the result before taxes (see the following explanatory table).
89

thousand euros
Income taxes 12/31/10 12/31/09
Consolidated profit before taxes 17,187 2,568
Hypothetical parent company tax rate 27.50% 27.50%
Hypothetical income taxes on the income of the period 4,726 706
Tax effect of permanent differences Italian companies 150 (92)
Tax penalties from past years 92 -
Effect of foreign tax rates other than Italian hypothetical tax rates (41) (233)
Tax effect of taxation of dividends from consolidated companies 509 137
Tax effect of separate taxation of capital gains on extraordinary transactions 7 (179)
Tax effect of tax concession under “Tremonti ter” Italian companies (260) (65)
Tax effect of the economic impact of consolidation entries recorded as counteritems of conversion reserve (293) (16)
Withholding tax on dividends from Comer (Shanghai) Trading Co. Ltd. collected by Comer Industries AG - -
Other minor including IRAP effect on deferred taxes (115) (6)
Income taxes on the income of the period recorded in the financialstatements, except for IRAP 4,775 252
IRAP 1,722 1,036
Income taxes on the income of the period recorded in the financialstatements (current, deferred) 6,497 1,288
90

Profits per shareAt the bottom of the profit and loss account, the profit/(loss) per basic share is reported, determined in the manners set forth in IAS 33, as summarised below.
Diluted profit per share is equal to the profit per basic share, as the parent company holds no potential shares originating from warrants or shares conditional on stock option plans.
Reggiolo, March 30, 2011Chairman of the Board of directors
(Fabio Storchi)
euro
12/31/10 12/31/09
Consolidated profit for the period pertaining to shareholders of the parent company 10,690,000 1,280,000
Average amount of shares in circulation 10,000,000 10,000,000
Profit per basic share for the current year in euro 1.07 0.13
91

92

Report of the Board of Statutory Auditors on the consolidated financial statements for the year ended December 31, 2010
Dear Shareholders of the parent company Comer Industries Spa,this report relates to the consolidated financial statements of the Comer Industries group companies, prepared according to International Financial Reporting Standards adopted by the European Union.
The report takes into account the tasks assigned to the Board of Statutory Auditors in accordance with Legislative Decree no. 39 of January 27, 2010. For these tasks reference is made to the directors’ report to the statutory financial statements for the year ended December 31, 2010 of the parent company Comer Industries Spa.
In particular, on the basis of the activity performed, we acknowledge that the Board of Statutory Auditors:
• gained knowledge and supervised, as per their remit, the adequacy of the company’s organizational structure and the compliance with the correct administration through direct observation and meetings with the audit company Reconta Ernst & Young Spa in order to exchange significant data and information;
• could examine the auditors’ report issued on April 14, 2011 which is unqualified;
• verified the compliance with the provisions of law governing the consolidated financial statements and the report on operations also in consideration or the recent regulatory changes;
• could ascertain that the financial statements of the main subsidiaries were subject to the audit of the respective Board of Statutory Auditors, by an auditor or by an audit company.
During the Board’s overall oversight activity no significant events emerged so as to be reported herein.To complement the present report, reference should be made to the report prepared by us on the statutory financial statements of Comer Industries Spa, in which all information required by art. 2429 paragraph 2 of the Civil Code is provided.
In light of the above and sharing the opinion expressed by the audit company in respect of the truthfulness and fairness, as indicated in the auditors’ report accompanying the financial statements, we are in favor with the approval of the financial statements as prepared by the Board of Directors.
The Board believes that the report on group operations is consistent with the consolidated financial statements.
Reggiolo (RE), April 14, 2011
The Chairman, Mr. Enrico Corradi
The Standing Auditor, Mr. Mario Monducci
The Standing Auditor, Mr. Claudio Davoli
93

Board of directors
» President and CEO
FABIO STORCHI
» Vice President and Managing Director
FABRIZIO STORCHI
» Vice President Sales and Product Development
GIULIANO SPAGGIARI
» Director
MARINO BATTINI
» Director
AIMONE STORCHI
Management
» Administration and Control
UGO CAPOBIANCO
» Engineering
ACHILLE BRUNAZZI
» Finance
STEFANO TRONI
» Human Resources and Organization
ALESSIO TINTORI
» Industrial Area Operations
GIUSEPPE ZELANO
» Information Technology
GIUSEPPE LOVASCIO
» Internal Auditing
CRISTIAN GRILLENZONI
» New Product Development
FAUSTO MORA
» Purchasing
ULISSE TOMBESI
» Quality and Continuous Improvement
GIANCARLO GAVIOLI
» Sales
MATTEO STORCHI
Board of directors and management
94

Operating Units
AXLES & WHEEL DRIVE UNITS
Jules Gualdi
Via Magellano 39
42046 Reggiolo (RE), Italia
COMER INDUSTRIES COMPONENTS Srl
Roberto Scapicchio
Zona Industriale La Martella
1° traversa Enzo Ferrari
75100 Matera (MT), Italy
COMER INDUSTRIES (SHAOXING) CO. Ltd.
Giacomo Sisto
Chang Zhuang Lou - Hua She District
Shaoxing County, 312033, China
DRIVESHAFTS
Jules Gualdi
Via G. Rossa 10
46020 Pegognaga (MN), Italy
GEARBOXES
Paolo Scalabrini
Via Magellano 27
42046 Reggiolo (RE), Italy
PLANETARY DRIVES
Nobile Gentile
Via Prati Vecchi 37
42025 Cavriago (RE), Italy
Foreign Subsidiaries
COMER INDUSTRIES GmbH
Bernd Jonkmanns
Albert Einstein Straße 1
D-70806 Kornwestheim, Germany
COMER INDUSTRIES Inc.
Arlin Perry
12730, Virkler Drive, Charlotte
NC 28273 - 3882
P.O. Box 410305 Charlotte
NC 28241 - 0305, USA
COMER INDUSTRIES Sarl
Pascal Froment
Parc de l’Esplanade
Rue Paul Henri Spaak 28
77462 St. Thibault des Vignes, France
COMER INDUSTRIES (SHAOXING) CO. Ltd.
Shanghai Branch Office
Claudio Semeghini
Room 2001, No. 398
Jiangsu Road, ChangNing District
200050 Shanghai, China
COMER INDUSTRIES U.K. Ltd.
Vincenzo Vanni
Units 2/3 Heath Road
Merry Lees Industrial Estate, Desford
Leicestershire LE9 9FE, United Kingdom
Contacts
COMER INDUSTRIES Spa - HeadquartersVia Magellano 27, 42046 Reggiolo (RE), Italywww.comerindustries.com - [email protected] +39 0522 974111 - fax +39 0522 973249
95

Credits
COORDINATIONCorporate CommunicationComer Industries Spa
PHOTOGRAPHY/PHOTO CREDITSLorenzo FranziComer Industries ArchiveStudio FranceschinOnline image bank
Comer Industries has chosen to make its staff the protagonists of the pictures included in this publication: we would like to thank all those who took part.
GRAPHIC DESIGN AND LAYOUTIndustree
printed on eco-friendly paper
96


The asset in state-of-the-art engi-neering knowledge, the appropriate integration of product technology and industrial processes, talent, enthusi-asm and professional enrichment of our people for the management and implementation of change.
The ability to adapt to the changing re-quirements of the market and to con-stantly carry on innovation in products, industrial processes and organization to respond to the demands of our cus-tomers in the best way possible and compete at a global level.
Forty years of growth and innovation, a solid financial basis, an organization structure aimed at the continuous improvement, for a lasting, competitive and sustainable development model.


