150
Competition and Firm Recovery Post-COVID-19 Office of the Chief Economist Fall 2021 Europe and Central Asia Economic Update

Competition and Firm Recovery Post-COVID-19Office of the Chief EconomistFall 2021
Europe and Central Asia Economic Update

Competition and Firm RecoveryPost-COVID-19
WORLD BANK ECA ECONOMIC UPDATE FALL 2021
Office of the Chief Economist
© 2021 International Bank for Reconstruction and Development / The World Bank 1818 H Street NW, Washington, DC 20433 Telephone: 202-473-1000; Internet: www.worldbank.org
Some rights reserved
1 2 3 4 24 23 22 21
This work is a product of the staff of The orld Bank with external contributions. The findings, interpretations, and conclusions expressed in this work do not necessarily reflect the views of The orld Bank, its Board of Executive Directors, or the governments they represent. The World Bank does not guarantee the accuracy of the data included in this work. The boundaries, colors, denominations, and other information shown on any map in this work do not imply any judgment on the part of The World Bank concerning the legal status of any territory or the endorsement or acceptance of such boundaries.
Nothing herein shall constitute or be considered to be a limitation upon or waiver of the privileges and immunities of The orld Bank, all of which are specifically reserved.
Rights and Permissions
This work is available under the Creative Commons Attribution 3.0 IGO license (CC BY 3.0 IGO) http://creativecommons.org/licenses/by/3.0/igo. Under the Creative Commons Attribution license, you are free to copy, distribute, transmit, and adapt this work, including for commercial purposes, under the following conditions:
Attribution—Please cite the work as follows: World Bank. 2021. “Competition and Firm Recovery Post-COVID-19” Europe and Central Asia Economic Update (Fall), Washington, DC: World Bank. Doi: 10.1596/978-1-4648-1802-8. License: Creative Commons Attribution CC BY 3.0 IGO
Translations—If you create a translation of this work, please add the following disclaimer along with the attribution: This translation was not created by The World Bank and should not be considered an official World Bank translation. The World Bank shall not be liable for any content or error in this translation.
Adaptations—If you create an adaptation of this work, please add the following disclaimer along with the attribution: This is an adaptation of an original work by The World Bank. Views and opinions expressed in the adaptation are the sole responsibility of the author or authors of the adaptation and are not endorsed by The World Bank.
Third-party content—The World Bank does not necessarily own each component of the content contained within the work. The World Bank therefore does not warrant that the use of any third-party-owned individual component or part contained in the work will not infringe on the rights of those third parties. The risk of claims resulting from such infringement rests solely with you. If you wish to re-use a component of the work, it is your responsibility to determine whether permission is needed for that re-use and to obtain permission from the copyright owner. Examples of components can include, but are not limited to, tables, figures, or images.
All queries on rights and licenses should be addressed to World Bank Publications, The World Bank Group, 1818 H Street NW, Washington, DC 20433, USA; e-mail: [email protected].
ISBN (electronic): 978-1-4648-1802-8DOI: 10.1596/978-1-4648-1802-8
Cover design: Lauren Kaley Johnson

Contents
iii
Acknowledgments . . . . . . . . . . . . . . . . . . . . . . . . . . . . . . . . . . . . . . . . . . . . . . . . . . . . . . . . . . . . . . . vAbbreviations . . . . . . . . . . . . . . . . . . . . . . . . . . . . . . . . . . . . . . . . . . . . . . . . . . . . . . . . . . . . . . . . . . . viiCountry Codes . . . . . . . . . . . . . . . . . . . . . . . . . . . . . . . . . . . . . . . . . . . . . . . . . . . . . . . . . . . . . . . . . . ixRegional Classification Used in this Report . . . . . . . . . . . . . . . . . . . . . . . . . . . . . . . . . . . . . . . . . . . . xExecutive Summary . . . . . . . . . . . . . . . . . . . . . . . . . . . . . . . . . . . . . . . . . . . . . . . . . . . . . . . . . . . . . . . xi
PART I: The Economic Outlook and Long-term Challenges . . . . . . . . . . . . 1
1 COVID-19: In It for the Long Haul? . . . . . . . . . . . . . . . . . . . . . . . . . . . . . . . . . . . . . . . . 3Global Context . . . . . . . . . . . . . . . . . . . . . . . . . . . . . . . . . . . . . . . . . . . . . . . . . . . . . . . . . . . . . . . 3Europe and Central Asia: Recent Developments and Outlook . . . . . . . . . . . . . . . . . . . . . . . . . . 11Long-Term Challenges and Policies . . . . . . . . . . . . . . . . . . . . . . . . . . . . . . . . . . . . . . . . . . . . . . . 28Annex 1.1 Data and Forecast Conventions . . . . . . . . . . . . . . . . . . . . . . . . . . . . . . . . . . . . . . . . . 34References . . . . . . . . . . . . . . . . . . . . . . . . . . . . . . . . . . . . . . . . . . . . . . . . . . . . . . . . . . . . . . . . . . . 35
2 Competition and Firm Recovery Post-COVID-19 . . . . . . . . . . . . . . . . . . . . . . . . . . . . . 41The Private Sector Landscape before COVID-19 . . . . . . . . . . . . . . . . . . . . . . . . . . . . . . . . . . . . . 45How Did Firms Weather the COVID-19 Crisis? . . . . . . . . . . . . . . . . . . . . . . . . . . . . . . . . . . . . . . 53Reallocation from Less Productive to More Productive Firms . . . . . . . . . . . . . . . . . . . . . . . . . . . 62Government Support Measures . . . . . . . . . . . . . . . . . . . . . . . . . . . . . . . . . . . . . . . . . . . . . . . . . . 71Policy Implications . . . . . . . . . . . . . . . . . . . . . . . . . . . . . . . . . . . . . . . . . . . . . . . . . . . . . . . . . . . . . 77Conclusion . . . . . . . . . . . . . . . . . . . . . . . . . . . . . . . . . . . . . . . . . . . . . . . . . . . . . . . . . . . . . . . . . . . 79Annex 2.1 Data and Methodology . . . . . . . . . . . . . . . . . . . . . . . . . . . . . . . . . . . . . . . . . . . . . . . . 81References . . . . . . . . . . . . . . . . . . . . . . . . . . . . . . . . . . . . . . . . . . . . . . . . . . . . . . . . . . . . . . . . . . . 84
PART II: Selected Country Pages . . . . . . . . . . . . . . . . . . . . . . . . . . . . . . . . 89Albania . . . . . . . . . . . . . . . . . . . . . . . . . . . . . . . . . . . . . . . . . . . . . . . . . . . . . . . . . . . . . . . . . . . . . . 91Armenia . . . . . . . . . . . . . . . . . . . . . . . . . . . . . . . . . . . . . . . . . . . . . . . . . . . . . . . . . . . . . . . . . . . . . 93Azerbaijan . . . . . . . . . . . . . . . . . . . . . . . . . . . . . . . . . . . . . . . . . . . . . . . . . . . . . . . . . . . . . . . . . . . 95Belarus . . . . . . . . . . . . . . . . . . . . . . . . . . . . . . . . . . . . . . . . . . . . . . . . . . . . . . . . . . . . . . . . . . . . . . 97Bosnia and Herzegovina . . . . . . . . . . . . . . . . . . . . . . . . . . . . . . . . . . . . . . . . . . . . . . . . . . . . . . . . 99Bulgaria . . . . . . . . . . . . . . . . . . . . . . . . . . . . . . . . . . . . . . . . . . . . . . . . . . . . . . . . . . . . . . . . . . . . . 101Croatia . . . . . . . . . . . . . . . . . . . . . . . . . . . . . . . . . . . . . . . . . . . . . . . . . . . . . . . . . . . . . . . . . . . . . . 103Georgia . . . . . . . . . . . . . . . . . . . . . . . . . . . . . . . . . . . . . . . . . . . . . . . . . . . . . . . . . . . . . . . . . . . . . 105Kazakhstan . . . . . . . . . . . . . . . . . . . . . . . . . . . . . . . . . . . . . . . . . . . . . . . . . . . . . . . . . . . . . . . . . . . 107Kosovo . . . . . . . . . . . . . . . . . . . . . . . . . . . . . . . . . . . . . . . . . . . . . . . . . . . . . . . . . . . . . . . . . . . . . . 109Kyrgyz Republic . . . . . . . . . . . . . . . . . . . . . . . . . . . . . . . . . . . . . . . . . . . . . . . . . . . . . . . . . . . . . . . 111Moldova . . . . . . . . . . . . . . . . . . . . . . . . . . . . . . . . . . . . . . . . . . . . . . . . . . . . . . . . . . . . . . . . . . . . . 113Montenegro . . . . . . . . . . . . . . . . . . . . . . . . . . . . . . . . . . . . . . . . . . . . . . . . . . . . . . . . . . . . . . . . . . 115North Macedonia . . . . . . . . . . . . . . . . . . . . . . . . . . . . . . . . . . . . . . . . . . . . . . . . . . . . . . . . . . . . . 117Poland . . . . . . . . . . . . . . . . . . . . . . . . . . . . . . . . . . . . . . . . . . . . . . . . . . . . . . . . . . . . . . . . . . . . . . 119Romania . . . . . . . . . . . . . . . . . . . . . . . . . . . . . . . . . . . . . . . . . . . . . . . . . . . . . . . . . . . . . . . . . . . . . 121Russian Federation . . . . . . . . . . . . . . . . . . . . . . . . . . . . . . . . . . . . . . . . . . . . . . . . . . . . . . . . . . . . 123Serbia . . . . . . . . . . . . . . . . . . . . . . . . . . . . . . . . . . . . . . . . . . . . . . . . . . . . . . . . . . . . . . . . . . . . . . . 125Tajikistan . . . . . . . . . . . . . . . . . . . . . . . . . . . . . . . . . . . . . . . . . . . . . . . . . . . . . . . . . . . . . . . . . . . . 127Turkey . . . . . . . . . . . . . . . . . . . . . . . . . . . . . . . . . . . . . . . . . . . . . . . . . . . . . . . . . . . . . . . . . . . . . . 129Ukraine . . . . . . . . . . . . . . . . . . . . . . . . . . . . . . . . . . . . . . . . . . . . . . . . . . . . . . . . . . . . . . . . . . . . . . 131Uzbekistan . . . . . . . . . . . . . . . . . . . . . . . . . . . . . . . . . . . . . . . . . . . . . . . . . . . . . . . . . . . . . . . . . . . 133

iv ● World Bank ECA Economic Update Fall 2021
Figures1.1 Global economic activity . . . . . . . . . . . . . . . . . . . . . . . . . . . . . . . . . . . . . . . . . . . . . . . . . . . . . . . . . . . . 41.2 COVID-19 trends . . . . . . . . . . . . . . . . . . . . . . . . . . . . . . . . . . . . . . . . . . . . . . . . . . . . . . . . . . . . . . . . . . 51.3 Major economies . . . . . . . . . . . . . . . . . . . . . . . . . . . . . . . . . . . . . . . . . . . . . . . . . . . . . . . . . . . . . . . . . . 61.4 Global trade and financial indicators . . . . . . . . . . . . . . . . . . . . . . . . . . . . . . . . . . . . . . . . . . . . . . . . . . . 81.5 Commodity markets . . . . . . . . . . . . . . . . . . . . . . . . . . . . . . . . . . . . . . . . . . . . . . . . . . . . . . . . . . . . . . . . 91.6 Global risks . . . . . . . . . . . . . . . . . . . . . . . . . . . . . . . . . . . . . . . . . . . . . . . . . . . . . . . . . . . . . . . . . . . . . . . 111.7 Recent COVID-19 trends in ECA . . . . . . . . . . . . . . . . . . . . . . . . . . . . . . . . . . . . . . . . . . . . . . . . . . . . . . 121.8 Recent economic developments in ECA . . . . . . . . . . . . . . . . . . . . . . . . . . . . . . . . . . . . . . . . . . . . . . . . 131.9 Portfolio and FDI flows in ECA . . . . . . . . . . . . . . . . . . . . . . . . . . . . . . . . . . . . . . . . . . . . . . . . . . . . . . . . 141.10 Macroeconomic Policy in ECA . . . . . . . . . . . . . . . . . . . . . . . . . . . . . . . . . . . . . . . . . . . . . . . . . . . . . . . . 151.11 ECA outlook . . . . . . . . . . . . . . . . . . . . . . . . . . . . . . . . . . . . . . . . . . . . . . . . . . . . . . . . . . . . . . . . . . . . . . 16B1.1.1 Inflation trends and decomposition in ECA . . . . . . . . . . . . . . . . . . . . . . . . . . . . . . . . . . . . . . . . . . . . . . 19B1.1.2 Decomposition of change in ECA government bond yields . . . . . . . . . . . . . . . . . . . . . . . . . . . . . . . . . 202.1 Characteristics of firms in Europe and Central Asia . . . . . . . . . . . . . . . . . . . . . . . . . . . . . . . . . . . . . . . . . 452.2 Market organization, competition policy, public sector employment, and share of public banks
in Europe and Central Asia, by subregion . . . . . . . . . . . . . . . . . . . . . . . . . . . . . . . . . . . . . . . . . . . . . . . 512.3 Labor productivity distributions in Europe and Central Asia . . . . . . . . . . . . . . . . . . . . . . . . . . . . . . . . . 52B2.3.1 Increase in use of digital technologies by firms in Europe and Central Asia, by function
and firm size . . . . . . . . . . . . . . . . . . . . . . . . . . . . . . . . . . . . . . . . . . . . . . . . . . . . . . . . . . . . . . . . . . . . . . 572.4 Changes by firms in Europe and Central Asia during the COVID-19 crisis, by firm size . . . . . . . . . . . . 582.5 Changes by firms in Europe and Central Asia during the COVID-19 crisis, by sector . . . . . . . . . . . . . . 592.6 Changes by firms in Europe and Central Asia during the COVID-19 crisis, by firm age . . . . . . . . . . . . 602.7 Changes by firms in Europe and Central Asia during the COVID-19 crisis, by gender of top manager . . . . 612.8 Firm performance, labor productivity, and BTI market organization index in Europe and Central Asia . . . . 67B2.5.1 Normalized employment change by labor productivity and policy indicators . . . . . . . . . . . . . . . . . . . 702.9 Government support measures in Europe and Central Asia, by type . . . . . . . . . . . . . . . . . . . . . . . . . . 712.10 Percentage of firms in Europe and Central Asia that reported receiving government assistance,
by firm size, sector, age, and gender of top manager . . . . . . . . . . . . . . . . . . . . . . . . . . . . . . . . . . . . . . 75
Boxes1.1 Inflationary pressures in ECA: transitory or persistent? . . . . . . . . . . . . . . . . . . . . . . . . . . . . . . . . . . . . . 182.1 Star firms and competition . . . . . . . . . . . . . . . . . . . . . . . . . . . . . . . . . . . . . . . . . . . . . . . . . . . . . . . . . . . 432.2 Measuring the competitive environment . . . . . . . . . . . . . . . . . . . . . . . . . . . . . . . . . . . . . . . . . . . . . . . . 492.3 Firms’ adoption of digital technology during the COVID-19 crisis . . . . . . . . . . . . . . . . . . . . . . . . . . . . 692.4 Productivity and firm exit during the COVID-19 crisis . . . . . . . . . . . . . . . . . . . . . . . . . . . . . . . . . . . . . . 632.5 Employment reallocation and market regulation . . . . . . . . . . . . . . . . . . . . . . . . . . . . . . . . . . . . . . . . . . 69
TablesE.1 Regional classification used in this report . . . . . . . . . . . . . . . . . . . . . . . . . . . . . . . . . . . . . . . . . . . . . . . xi1.1 Europe and Central Asia growth forecast summary . . . . . . . . . . . . . . . . . . . . . . . . . . . . . . . . . . . . . . . . 171.2 Europe and Central Asia country growth forecasts . . . . . . . . . . . . . . . . . . . . . . . . . . . . . . . . . . . . . . . . 222.1 Characteristics of firms in Europe and Central Asia (percent of total) . . . . . . . . . . . . . . . . . . . . . . . . . . . 462.2 Market organization, competition policy, public sector employment, and share of public banks
in Europe and Central Asia . . . . . . . . . . . . . . . . . . . . . . . . . . . . . . . . . . . . . . . . . . . . . . . . . . . . . . . . . . 502.3 Impact of COVID-19 crisis on firms in Europe and Central Asia (percent of firms, except where
otherwise indicated) . . . . . . . . . . . . . . . . . . . . . . . . . . . . . . . . . . . . . . . . . . . . . . . . . . . . . . . . . . . . . . . . 54B2.4.1 Correlation between firm exit and labor productivity . . . . . . . . . . . . . . . . . . . . . . . . . . . . . . . . . . . . . . 642.4 Correlation between firm performance, labor productivity, and BTI market organization in Europe
and Central Asia . . . . . . . . . . . . . . . . . . . . . . . . . . . . . . . . . . . . . . . . . . . . . . . . . . . . . . . . . . . . . . . . . . . 652.5 Correlation between firm performance, labor productivity, and BTI competition policy in Europe
and Central Asia . . . . . . . . . . . . . . . . . . . . . . . . . . . . . . . . . . . . . . . . . . . . . . . . . . . . . . . . . . . . . . . . . . . 662.6 Correlation between firm performance, labor productivity, and public sector employment share
in Europe and Central Asia . . . . . . . . . . . . . . . . . . . . . . . . . . . . . . . . . . . . . . . . . . . . . . . . . . . . . . . . . . 682.7 Correlation between firm performance, labor productivity, and public bank share in Europe
and Central Asia . . . . . . . . . . . . . . . . . . . . . . . . . . . . . . . . . . . . . . . . . . . . . . . . . . . . . . . . . . . . . . . . . . . 692.8 Types of government support received in Europe and Central Asia (percent of firms, except where
otherwise indicated) . . . . . . . . . . . . . . . . . . . . . . . . . . . . . . . . . . . . . . . . . . . . . . . . . . . . . . . . . . . . . . . . 732.9 Correlation between probability of receiving government assistance and firm characteristics
in Europe and Central Asia . . . . . . . . . . . . . . . . . . . . . . . . . . . . . . . . . . . . . . . . . . . . . . . . . . . . . . . . . . 76A2.1.1 Completion dates of survey fieldwork for World Bank Enterprise Surveys and Business
Pulse Surveys . . . . . . . . . . . . . . . . . . . . . . . . . . . . . . . . . . . . . . . . . . . . . . . . . . . . . . . . . . . . . . . . . . . . . 81A2.1.2 Availability Enterprise Survey COVID-19 data in Europe and Central Asia, by subregion . . . . . . . . . . 82

v
AcknowledgmentsThis Europe and Central Asia (ECA) Economic Update is a product of ECA’s Of-fice of the Chief Economist led by Asli Demirgüç-Kunt, in collaboration with the Macroeconomics, Trade and Investment and the Poverty and Equity Global Practices.
In Part I, Chapter I was prepared in collaboration with the Prospects Group in the Equitable Growth, Finance and Institutions Vice Presidency. The team was led by Collette Mari Wheeler with the assistance of Julia Renee Roseman Nor-fleet, and included Carlos Arteta, Dhruv Devesh Gandhi, Michael Lokshin, Maria Hazel Macadangdang, Rose Mungai, Franz Ulrich Ruch, and Haoyu Wu. Useful comments and inputs were provided by Jasmin Chakeri, Ivailo V. Izvorski, Sand-eep Mahajan, Sebastian-A Molineus, Evgenij Najdov, Ilyas Sarsenov, Ashley Tay-lor, Salman Zaidi, and Bakhrom Ziyaev. Chapter I was closely coordinated with contributions from Part II authors. Chapter II was prepared by the ECA Chief Economist’s team jointly with the Research Group of Development Economics, in collaboration and with inputs from the Finance, Competitiveness & Innova-tion (FCI) and Macro, Trade and Investment (MTI) Global Practices, Enterprise Analysis Unit of Development Economics and the International Finance Corpo-ration (IFC). The team was led by Dorothe Singer and Miriam Bruhn with the assistance of Paul Nicholas Villaflor Pacheco, and included David C. Francis, Leonardo Iacovone, Franklin Okechukwu Maduko, Jesica Torres Coronado, and Trang Thu Tran. Useful guidance and inputs were provided throughout by Meghana Ayyagari, Filip Jolevski, Martha Licetti, Vojislav Maksimovic, Denis Medvedev, Silvia Muzi, Georgiana Pop, Ilias Skamnelos, Stefka Slavova, Kohei Ueda, and Domenico Viganola. Comments were provided by Ali H. Abukumail, Erdem Atas, Reena Badiani-Magnusson, Ana Paula Cusolito, Thomas Farole, Au-guste Tano Kouame, Natasha Kapil, Michael Lokshin, Mariana Iootty De Paiva Dias, Christopher David Miller, Sebastian-A Molineus, Ljudmilla V. Poznans-kaya, Steven N. Schonberger, Renaud Seligmann, and Ivan Torre. The team would like to thank Anna Bjerde, Xiaoqing Yu, and the ECA regional leadership team for their guidance and inputs during the preparation of the report.
Part II was prepared by teams from the Macroeconomics, Trade and Invest-ment Global Practice (led by Andrew Burns, Lalita M. Moorty, Sandeep Mahajan, and Jasmin Chakeri) and the Poverty and Equity Global Practice (led by Salman Zaidi). These teams included the following staff: Azamat Agaidarov, Reena Badi-ani-Magnusson, Javier Eduardo Baez Ramirez, Hans Anand Beck, Olena Bogdan, Tom Bundervoet, Marie-Anne Chambonnier, Marcel Chistruga, Francis Dennig, Mariam Dolidze, Andrei Silviu Dospinescu, Bakyt Dubashov, Olga Emelyanova, Samuel Freije-Rodriguez, Alan Fuchs, Josip Funda, Anastasia Golovach, Gohar Gyulumyan, Alexander Haider, Kiryl Haiduk, Sandra Hlivnjak, Saida Ismailak-hunova, Ivailo V. Izvorski, Charl Jooste, Jonathan George Karver, Tehmina Shau-kat Khan, David Stephen Knight, Milan Lakicevic, Leonardo Ramiro Lucchetti,

vi ● World Bank ECA Economic Update Fall 2021
Sanja Madzarevic-Sujster, Armineh Manookian Salmasi, Monika Anna Matyja, Kristina Cathrine Mercado, Rose Mungai, Besart Myderrizi, Vinayakraj Nagaraj, Evgenij Najdov, Arvind Nair, Metin Nebiler, Trang Van Nguyen, Nga Thi Viet Nguyen, Desislava Enikova Nikolova, Ana Maria Oviedo, Catalin Pauna, Alisher Rajabov, Sjamsu Rahardja, Nadir Ramazanov, Richard James Lowden Record, Natasha Rovo, Ilyas Sarsenov, Cristina Savescu, Marc Tobias Schiffbauer, William Hutchins Seitz, Asli Senkal, Lazar Sestovic, Dhiraj Sharma, Hilda Shijaku, Maryna Sidarenka, David Andrew Stephan, Tihomir Stucka, Thi Thanh Thanh Bui, Esk-ender Trushin, Christoph Ungerer, Benjamin Vuilleminroy, Pinar Yasar, and Bakhrom Ziyaev.
Sandra Gain and Barbara Karni provided the editorial support, and Michael Alwan typeset the report. Indira Chand, Paul Anthony Clare, Carl Patrick Han-lon, Artem Kolesnikov, Sona V. Panajyan, Erin Scronce, and Amy Stilwell pro-vided communications and outreach support. Ekaterina Ushakova oversaw the layout and production of the report.
vii
AbbreviationsBelstat National Statistical Committee of the Republic of BelarusBHAS Agency for Statistics of Bosnia and HerzegovinaBiH Bosnia and Herzegovinabn billionbp basis pointBPS Business Pulse SurveyBTI Bertelsmann Stiftung Transformation Index CA Central AsiaCE Central EuropeCAB Current Account BalanceCAD Current Account DeficitCBA Central Bank of AzerbaijanCBA Central Bank of ArmeniaCBR Central Bank of RussiaCE Central EuropeCEFTA Central European Free Trade Agreement COVAX COVID-19 Vaccines Global AccessCPI Consumer Price IndexCROSTAT Croatian Bureau of StatisticsDSSI Debt Service Suspension InitiativeEAP East Asia and the PacificEBRD European Bank for Reconstruction and DevelopmentECA Europe and Central AsiaECAPOV ECAPOV (ECA Poverty) database of standardized household surveysECB European Central BankECDC European Centre for Disease Prevention and ControlEE Eastern EuropeEEA European Environmental AgencyEFSD European Fund for Sustainable DevelopmentEMDEs emerging markets and developing economiesEPLex Employment Protection Legislation index ES Enterprise SurveyEU European UnionEU-SILK European Union Statistics on Income and Living Conditions FDI foreign direct investmentFX foreign exchangeGCI Global Competitiveness IndexGDP gross domestic productGHG greenhouse gas emissionsHARPEX Harper Petersen Charter Rates IndexH1 first halfIEA International Energy AgencyIFI International Financial InstitutionILO International Labour OrganizationIMF International Monetary FundINSTAT Institute of Statistics (Albania)

viii ● World Bank ECA Economic Update Fall 2021
IOSCO International Organization of Securities CommissionsIPCC Intergovernmental Panel on Climate ChangeITU International Telecommunication UnionKIHS Kyrgyz Integrated Household Surveylhs left-hand sideLICs low-income countriesMONSTAT Statistical Office of MontenegromtCO2e million tons carbon dioxide equvialentQ1 first quarterNBG National Bank of GeorgiaNBK National Bank of KazakhstanNBR National Bank of RomaniaNBS National Bank of SerbiaNBT National Bank of Tajikistan NPL non-performing loanOECD Organisation for Economic Co-operation and DevelopmentOPEC Organization of the Petroleum Exporting CountriesPCE personal consumption expenditurePMI Purchasing Managers’ IndexPMR product market regulationspp percentage pointPPP purchasing power parityq/q quarter over quarterrhs right-hand sidesaar seasonally adjusted annual rateSCC South CaucasusSDR Special Drawing RightsSILC Statistics on Income and Living ConditionsSMEs small and medium-size enterprisesSOE state-owned enterpriseSOFAZ State Oil Fund of the Republic of AzerbaijanTajStat Agency on Statistics of TajikistanTFP total factor productivityUN United NationsUNCTAD United Nations Conference on Trade and DevelopmentUNECE United Nations Economic Commission for EuropeUNESCO United Nations Educational, Scientific, and Cultural OrganizationUNICEF United Nations Children’s FundUNWTO United Nations World Tourism OrganizationUSD US dollarsVAT value added taxVFDI Vivid Economics and Finance for Diversity InitiativeWBK Western BalkansWDI World Development IndicatorsWEF World Economic ForumWTO World Trade Organizationy/y year-over-year

ix
Country CodesAlbania ALBArmenia ARMAustria AUTAzerbaijan AZEBelarus BLRBelgium BELBosnia and Herzegovina BIHBulgaria BGRCroatia HRVCyprus CYPCzech Republic CZEDenmark DNKEstonia ESTFinland FINFrance FRAGeorgia GEOGermany DEUGreece GRCHungary HUNIceland ISLIreland IRLItaly ITAKazakhstan KAZKosovo XKXKyrgyz Republic KGZ
Latvia LVALithuania LTULuxembourg LUXMalta MLTMoldova MDAMontenegro MNENetherlands NLDNorway NORPoland POLPortugal PRTRepublic of North Macedonia MKDRomania ROURussian Federation RUSSerbia SRBSlovak Republic SVKSlovenia SVNSpain ESPSweden SWESwitzerland CHETajikistan TJKTurkey TURTurkmenistan TKMUkraine UKRUnited Kingdom GBRUzbekistan UZB

x
Regional Classification Used in this Report
This report covers 50 countries referred to as Europe and Central Asia (ECA) countries. These are divided into 10 groups: Central Asia, Central Europe and the Baltic Countries, Eastern Europe, Northern Europe, South Caucasus, Southern Europe, Western Balkans, Western Europe, Russia, and Turkey.
TABLE E.1 Regional classification used in this report
Central AsiaCentral Europe and
Baltic Countries Eastern Europe Northern Europe
KazakhstanKyrgyz Republic
TajikistanTurkmenistan
Uzbekistan
BulgariaCroatia
Czech RepublicEstoniaHungary
LatviaLithuaniaPoland
RomaniaSlovak Republic
Slovenia
BelarusMoldovaUkraine
DenmarkFinlandIcelandNorwaySweden
South Caucasus Southern Europe Western Balkans Western Europe
ArmeniaAzerbaijan
Georgia
CyprusGreece
ItalyMalta
PortugalSpain
AlbaniaBosnia and Herzegovina
KosovoRepublic of North Macedonia
MontenegroSerbia
AustriaBelgiumFrance
GermanyIreland
LuxembourgNetherlandsSwitzerland
United Kingdom
Russian Federation Turkey
xi
After nearly two years since COVID-19 first gripped the world, the ongoing pan-demic continues to shape the path of the global economy. Economic activity in the emerging and developing countries of Europe and Central Asia (ECA) is ex-pected to grow 5.5 percent in 2021, higher than initially projected due to a stron-ger-than-anticipated recovery in external demand in the first half of the year, as well as strengthening domestic demand due to vaccinations and support pack-ages. The boost to exports, however, is already fading due to the ongoing global and regional spread of more contagious COVID-19 variants, which has also dampened the recovery in domestic demand. In the global context, this update summarizes recent developments and presents the outlook for the region. It also focuses on competition, which is key to robust recovery after the pandemic, as well as for sustainable, long-term economic growth.
The pace of recovery in 2022 is forecast to be 3.4 percent, as external demand and commodity prices further stabilize, global growth plateaus, and macroeco-nomic policy support is withdrawn. The outlook remains highly uncertain given the continuation of the pandemic, unequal vaccine access, and vaccine hesitancy. The regional recovery has been accompanied by a rapid acceleration in inflation and remains vulnerable to financial stress, which could be triggered by an abrupt tightening of external financing conditions or a sharp rise in policy uncertainty and geopolitical tensions.
Although global economic activity is recovering and output in ECA is expected to grow in 2021, containing COVID-19 remains a challenge in the region. At the onset of the pandemic, the rapid spread of the disease and movement restrictions and lockdowns that were imposed to contain the virus led to sudden supply and demand shocks, which manifested in declines in output and productivity.
This ECA Economic Update assesses the impact of COVID-19 on firms in the region, with a focus on the role of competition during the crisis and recovery. The focus is on competition because it is associated with dynamism, incentivizes firms to innovate, and motivates more efficient firms to enter and grow, while facilitating the exit of less efficient ones. As economies start to recover from the COVID-19 crisis, it will be important to ensure that a competitive business envi-ronment is in place that supports the reallocation of resources from less produc-tive to more productive firms, that is, the process of “creative destruction.”
The COVID-19 pandemic has heightened concerns about limited competition and its potential consequences for economic growth. Smaller firms may find it more difficult to adopt new technologies or business models, are less likely to receive government support, and, as a result, are more likely to exit. In this case, concentration and the dominance of large firms may increase, potentially further limiting competition, just when it is most needed to promote recovery. Percep-tion-based and regulatory indicators suggest that most countries in ECA can im-prove the institutional framework and enforcement of laws for a strong competi-tion environment, particularly in Central Asia and the South Caucasus.
Executive Summary
xii ● World Bank ECA Economic Update Fall 2021
Analysis using firm-level survey data for the emerging and developing coun-tries in the region shows that COVID-19 had a profound and heterogeneous im-pact on firms. On average, in the first round of the survey, conducted between May and November 2020, firms in the region reported a 24 percent drop in monthly sales and a 10 percent decline in the number of full-time employees, compared with the previous year. By the second round of the survey, which was conducted between November 2020 and May 2021, one in four firms reported anticipating falling into arrears on outstanding liabilities in the next six months. Smaller and younger firms were hit harder by the COVID-19 crisis. By the second round of the survey, smaller, younger, and female-run businesses had not yet seen their sales improve since the initial drop.
Crises can be devastating for many firms, but they often have a silver lining, playing a cleansing role. Evidence presented in the report is consistent with this, showing that economic activity in ECA appears to have been reallocated toward more productive firms during the COVID-19 crisis, particularly in countries with more competitive markets. Firms with high pre-crisis labor productivity experi-enced significantly smaller drops in sales and employment than firms with low pre-crisis labor productivity. More productive firms were also more likely to adapt to the crisis by increasing online activity and remote work. Whether the reallocation of economic activity toward more productive firms is long-lasting will depend on whether more productive firms will grow and less productive firms ultimately exit.
Importantly, in countries with more competitive markets and stronger policies that protect competition, the reallocation toward more productive firms was even greater. Similarly, in countries with a larger share of employment in the public sector and higher public ownership of banks, the reallocation from lower productivity to higher productivity firms was weaker, consistent with lower competition and dynamism being associated with a greater role of the state.
Finally, many governments in ECA implemented broad policy support schemes that could promptly address the initial economic fallout from the CO-VID-19 crisis and provide immediate relief to protect firms and workers from the worst effects. The reach of government support varied widely across countries, but on average half the firms reported having received some government sup-port in response to the economic fallout of the pandemic. Overall, government support was more likely to go to less productive firms, larger firms were more likely than smaller firms to receive support in the form of payment deferrals and fiscal relief, and support measures were given to firms regardless of the level of their pre-crisis innovation.
Since the broad support measures implemented at the beginning of the CO-VID-19 crisis appear to have gone to less viable firms irrespective of their pre-crisis innovation, they may have lasting negative consequences for competition and growth. As economies enter the economic recovery phase, it will be impor-tant for policy makers in all countries to phase out broad policy support mea-sures as soon as appropriate and focus on fostering a competitive business envi-ronment. Such an environment is key to a strong recovery, resilience to future crises, and sustainable, long-term economic growth.

PART
The Economic Outlook and Long-term Challenges
I


3
Global ContextAfter nearly two years since COVID-19 first gripped the world, the ongoing pandemic continues to shape the path for the global economy. Although a cyclical recovery has been underway in many economies since the initial collapse in activity in 2020Q2, the pace of the recovery is not envisioned to be sufficient to return global output to its pre-pandemic projection by 2022. Moreover, the strength of the recovery continues to diverge. In major economies, substantial fiscal support and widespread vaccination has helped bolster the rebound in domestic demand; while for many emerging markets and developing econo-mies (EMDEs), the spread of more transmissible COVID-19 variants has prompted re-newed mobility restrictions amid uneven vaccine access and deployment. Obstacles from the pandemic, combined with the continued withdrawal of macroeconomic support, are offsetting some of the benefits of firming external demand and elevated commodity prices for EMDEs. Risks to the global outlook remain tilted to the downside, reflecting a pro-tracted pandemic. The risk of an abrupt tightening of global financing conditions also looms given above-target inflation in major economies. Growth-enhancing policy reforms are critical to set the recovery on a green, resilient, and inclusive development path.
COVID-19 Pandemic and Overall Trends
After the COVID-19 pandemic triggered an estimated 3.4 percent contraction in 2020, global economic activity has rebounded but remains well below pre-pan-demic projections. The baseline forecast, as reported in the June 2021 edition of Global Economic Prospects, envisioned that the global economy would expand 5.6 percent in 2021 (figure 1.1, panel a) (World Bank 2021a). This projected pace of recovery, however, largely reflected strong rebounds in some major economies, partly owing to substantial fiscal support. Despite firming external demand and elevated commodity prices, growth in many EMDEs had been expected to be dampened by severe COVID-19 outbreaks amid limited vaccine access and the partial removal of macroeconomic policy support. The global recovery had then
COVID-19: In It for the Long Haul?
1
4 ● World Bank ECA Economic Update Fall 2021
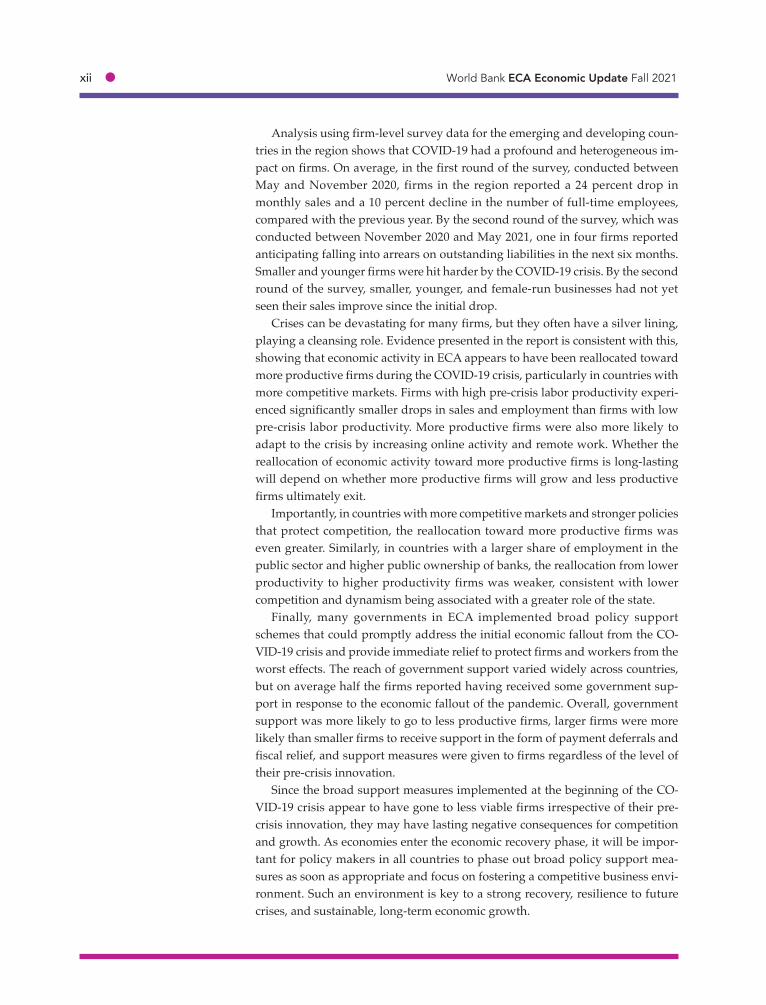
been forecast to continue into 2022, with global growth moderating to 4.3 percent—a pace insufficient to bring output levels in line with pre-pandemic projections.
The pandemic’s devastating effects on per capita income growth, poverty, and inequality will reverberate for a protracted period. Per capita income losses in-curred in 2020 will not be fully unwound by 2022 in a majority of EMDEs, includ-ing a handful in Europe and Central Asia (ECA). Additionally, the per capita in-come catch-up with advanced economies has slowed and even reversed in some cases (figure 1.1, panel b). By end-2021, about 100 million people are expected to fall back into extreme poverty. The pandemic has also exacerbated inequality as it has disproportionately affected vulnerable groups—including women, school-age children, and informal and unskilled workers.
Global activity, while robust, likely plateaued in the first half of 2021, with incoming economic data pointing to a loss of momentum amid the ongoing ef-fects of the Delta variant. The subsequent rise in global new COVID-19 cases has
Sources: Haver Analytics; World Bank.Note: EMDEs = emerging markets and developing economies; GDP = gross domestic product; LICs = low-income countries; PMI = Purchasing Managers’ Index; q/q = quarter over quarter; saar = seasonally adjusted annual rate.a. The shaded area indicates forecasts. Data for 2020 are estimates. Aggregate growth rates are calculated using GDP weights at average 2010–19 prices and market exchange rates. b. Relative per capita income growth is computed as the difference in per capita GDP growth between respective EMDE groups and advanced economies.c. PMI readings above (below) 50 indicate expansion (contraction). The last observation is August 2021.d. Data for 2021Q2 are preliminary and reflect a limited sample of 33 EMDEs and 35 advanced economies due to data availability.
−8
−4
0
4
8
2010 2012 2014 2016 2018 2020 2022
World Advanced economies EMDEs
Perc
ent
−8
−4
0
4
8
World Advancedeconomies
EMDEs EMDEs excluding
China
2021Q1 2021Q2*
Perc
ent,
q/q
saar
FIGURE 1.1 Global economic activity
c. Composite PMIs d. Quarterly GDP figures
a. Global growth b. Per capita income catch-up with advanced economies
−4
−2
0
2
4
EMDEs EMDEsexcl. China
LICs FragileLICs
2021–23 2010–19
Perc
enta
ge p
oint
s
20
30
40
50
60
70
Dec-19
Feb-20
Apr-20
Jun-2
0
Aug-20
Oct-20
Dec-20
Feb-21
Apr-21
Jun-2
1
Aug-21
World Advanced economies EMDEs
Inde
x, 5
0+ =
exp
ansi
on

Chapter 1: COVID-19: In It for the Long Haul? ● 5
corresponded to a steep fall in confidence, with the global Sentix investor confi-dence index nearly halving in 2021Q3 from a three-year high. After expanding at a fast clip in the first half of 2021, the global composite Purchasing Managers’ Index (PMI) eased in the third quarter, as resurgences of new COVID-19 cases dampened services activity, especially in EMDEs (figure 1.1, panel c). Similarly, the expansion in the manufacturing PMI edged down slightly, as new export orders were constrained by global supply bottlenecks and renewed softness in some large EMDEs amid pandemic-related disruptions.
As a result of renewed COVID-19 surges, many countries’ recoveries have faltered (figure 1.1, panel d). This slowdown has been most evident in countries with severe COVID-19 outbreaks; in EMDEs, this has been compounded by low vaccination rates, partly owing to highly unequal vaccine access (figure 1.2, pan-els a and b). Although about 45 percent of the global population has received at least one vaccine dose, the rate falls to only about 2 percent of the population in
Sources: Duke Global Health Innovation Center 2021; Fitch Solutions; Haver Analytics; Our World in Data (database); United Nations; World Bank.Note: EMDEs = emerging markets and developing economies. a. The figure shows the seven-day moving average of daily new COVID-19 cases. The last observation is September 27, 2021. The sample consists of 36 advanced economies and 149 EMDEs. b. The figure shows the share of confirmed vaccine doses purchased as a share of total population. The sample includes 16 advanced economies and 67 EMDEs. Data are as of September 27, 2021.c. Figure shows percent of population fully vaccinated, which is defined as receiving a single-dose vaccine or both doses of a two-dose vaccine. Data for China added on August 12 and August 26. The last observation is September 23, 2021. d. The last observation is September 2, 2021.
FIGURE 1.2 COVID-19 trends
c. Pace of vaccinationsd. Number of booster doses needed to vaccinate
advanced-economy adult population
a. Evolution of the pandemic b. Vaccine procurement in 2021
0
200
400
600
800
Jan-2
0
Mar-20
May-20
Jul-2
0
Sep-20
Nov-20
Jan-2
1
Mar-21
May-21
Jul-2
1
Sep-21
Advanced economies EMDEs
Dai
ly n
ew c
ases
, tho
usan
ds
0
100
200
300
400
500
Advanced economies EMDEs
Perc
ent o
f pop
ulat
ion
0
20
40
60
Dec-20
Jan-2
1
Feb-21
Mar-21
Apr-21
May-21
Jun-2
1Ju
l-21
Aug-21
Sep-21
Advanced economies EMDEs World
Perc
ent o
f tot
al p
opul
atio
n
0
200
400
600
800
Booster dosesneeded
Booster dosesadministered
Mill
ions
6 ● World Bank ECA Economic Update Fall 2021
low-income countries, reflecting substantial procurement and logistical chal-lenges (figure 1.2, panel c). This trend is likely to be sustained, with the COVID-19 Vaccines Global Access (COVAX) facility recently lowering its supply forecast for vaccines by around 30 percent in the near term (Gavi 2021). This comes on the heels of many advanced economies considering providing booster vaccines to their populations (figure 1.2, panel d).
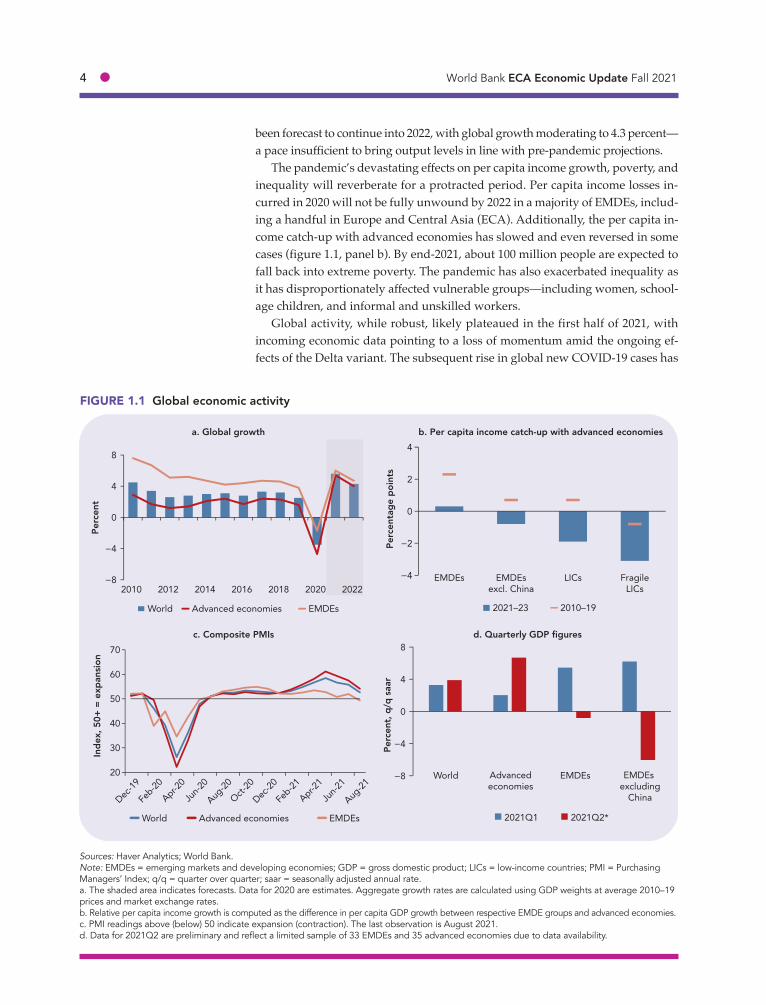
After the U.S. economy contracted 3.4 percent in 2020, substantial fiscal sup-port and reopening efforts helped underpin a robust recovery. Although gross domestic product (GDP) growth rose slightly to 6.6 percent (quarter over quarter (q/q), seasonally adjusted annual rate (saar)) in 2021Q2 from 6.3 percent in 2021Q1, it fell short of market expectations of an 8.5 percent increase. Neverthe-less, the overall strength of the recovery lifted output above its pre-pandemic level by 2021Q2 (figure 1.3, panel a). A sharp resurgence of new COVID-19 cases, however, has clouded the outlook for the second half of 2021. Inflationary pres-sures have increased, with headline and core personal consumption expenditure (PCE) inflation far exceeding the Federal Reserve’s target of 2 percent; however,
Sources: Bloomberg; Consensus Economics; Haver Analytics; World Bank.Note: GDP = gross domestic product; PMI = Purchasing Managers’ Index.a. The last observation is 2021Q2. b. The last observation is September 21, 2021. c. The figure shows the average forecast for the months indicated from Consensus Economics.d. The last observation is September 2021.
FIGURE 1.3 Major economies
c. Consensus GDP growth forecasts for the euro area d. PMIs in the euro area
a. Quarterly GDP in major economies b. Inflation pressures
80
90
100
110
120
2019
Q4
2020
Q1
2020
Q2
2020
Q3
2020
Q4
2021
Q1
2021
Q2
United States China Euro Area
Inde
x, 1
00 =
201
9Q4
0.0
0.4
0.8
1.2
1.6
2.0
1.0
1.4
1.8
2.2
2.6
3.0
Jan-1
9
May-19
Sep-19
Jan-2
0
May-20
Sep-20
Jan-2
1
May-21
Sep-21
United States Euro area (RHS)
Perc
ent
Perc
ent
0
1
2
3
4
5
2021 2022September June
Perc
ent
010203040506070
Jan-2
0
Mar-20
May-20
Jul-2
0
Sep-20
Nov-20
Jan-2
1
Mar-21
May-21
Jul-2
1
Sep-21
Composite ManufacturingNew export orders Services
Inde
x, 5
0+ =
exp
ansi
on

Chapter 1: COVID-19: In It for the Long Haul? ● 7
many Fed officials view the recent increase as largely transitory (figure 1.3, panel b). Fed officials now expect three interest rate increases by the end of 2023—up from two in June—and to start gradually tapering asset purchases by the end of 2021.
In the euro area, output contracted about 6.5 percent in 2020 and remained roughly 2.5 percent below its 2019Q4 level by 2021Q2. Following two consecutive quarters of contraction, GDP growth in the euro area bounced back in 2021Q2, expanding 9.2 percent (q/q, saar), prompting an improvement in private sector forecasts for 2021 growth (figure 1.3, panel c). The rebound had been boosted by firming services activity following the relaxation of mobility restrictions and an accelerated vaccine rollout. Although incoming composite PMI data indicate that activity in the euro area continued to be strong in the third quarter, mounting supply and shipping bottlenecks have weighed on manufacturing production (figure 1.3, panel d). These record-high backlogs, combined with the rise in en-ergy prices, have also contributed to the increase in prices, with inflation reaching a 13-year high of 3.4 percent in September.1
Incoming data point to a continued recovery in China, albeit at a more modest pace, owing to COVID-19 outbreaks and further regulatory tightening. GDP growth slowed to a still strong 7.9 percent (year over year) in 2021Q2. High-fre-quency indicators suggest that activity continued to moderate in 2021Q3 due to a resurgence of COVID-19, with the expansion in the official manufacturing and non-manufacturing PMIs declining while retail sales growth missed market ex-pectations and slowed sharply. About 75 percent of the population in China had been vaccinated with at least one dose by the end of September. Broader pan-demic restrictions, however, remain in place in response to an increased number of localized COVID-19 outbreaks.
After contracting 8.3 percent in 2020, global trade growth started to rebound shortly after its 2020Q2 trough, with goods trade volumes surpassing pre-pan-demic levels by November 2020. By 2021Q2, global goods trade growth slowed sharply to about a third of its pace in the previous quarter and continued to lose momentum in July. Survey data point to further softening moving forward, with the manufacturing PMI for new export orders slipping in 2021Q3 amid substan-tial supply bottlenecks and strains in global value chains. Ongoing shipping de-lays and shortages of raw material resulted in record-high backlogs (figure 1.4, panel a). Meanwhile, services trade continues to be dampened by sustained weakness in tourism, which is expected to be muted for some time owing to lin-gering mobility restrictions and reluctance to travel while the virus is not com-pletely under control (UNWTO 2021).
Although global financing conditions continue to be generally benign, they have diverged across advanced economies and EMDEs, and economic data have surprised on the downside (figure 1.4, panel b). In advanced economies, financ-ing conditions remain broadly accommodative. However, pockets of short-lived market volatility have emerged at times over concerns about the strength of the
1. The European Central Bank (ECB) shifted its monetary policy strategy in July, raising its inflation target to 2 percent—compared with its previous target of close to just below 2 percent—and affirming it would tolerate moderately higher, transitory inflation. Neverthe-less, the ECB recently announced plans to start slowing its pandemic emergency bond purchases.

8 ● World Bank ECA Economic Update Fall 2021
global recovery and the pace of tapering in advanced economies. Equity valua-tions remain at historically high levels in advanced economies despite spreads on corporate borrowers having inched up somewhat. Meanwhile, 10-year U.S. Trea-sury yields fell below 1.3 percent in July—the first time since February—and hovered around that rate throughout most of 2021Q3 amid signs of moderating activity and concerns over the ongoing effects of the Delta variant. U.S. yields rose again in late September following the Federal Reserve’s announcement of its plans to unwind asset purchases later this year and prospects of an additional rate hike, bringing the total anticipated increases to three by the end of 2023.
Sources: Bloomberg; harperpetersen.com; Haver Analytics; Institute of International Finance; World Bank.Note: EMDEs = emerging markets and developing economies; GDP = gross domestic product; PMI = Purchasing Managers’ Index.a. The figure shows the global manufacturing suppliers’ delivery times PMI and the HARPER PETERSEN Charter Rates Index (HARPEX) for container shipping rates. PMI data are inverted by subtracting data from 100; therefore, increasing (decreasing) PMI data indicate faster (slower) delivery times. Container shipping rates are monthly averages of weekly data and reflect price developments on the charter market for container ships. Dashed lines indicate long-term averages over January 1998 to December 2019 for delivery times and February 2018 to December 2019 for con-tainer shipping rates. The last observation is August 2021 for delivery times and September 24, 2021, for container shipping rates.b. The figure shows Citi’s Economic Surprise Index, which measures the degree to which economic data are beating or missing expectations. The last observation is September 28, 2021.c. Based on Goldman Sachs country-specific financial conditions indexes, which track borrowing costs, exchange rates, and equity valuations. GDP-weighted aggregates are calculated using 2021 GDP measured at average 2010–19 prices and market exchange rates. The sample includes 10 ad-vanced economies, the euro area, and 14 EMDEs (excluding China). A reading above 100 indicates tightening of financial conditions. The last ob-servation is September 17, 2021.d. The figure shows the four-week moving average of weekly portfolio flows. The sample includes 16 EMDEs, including China. The last observation is September 24, 2021.
FIGURE 1.4 Global trade and financial indicators
c. Global financing conditions d. EMDE portfolio flows
a. Global shipping times and costs b. Economic Surprise Index
50
150
250
350
450
550
40
50
60
70
80
90
Jan-2
0
Apr-20
Jul-2
0
Oct-20
Jan-2
1
Apr-21
Jul-2
1
Sep-21
Delivery times Container shipping rates (RHS)
Inde
x, 5
0+ =
fast
er
Inde
x, 1
00 =
Jan
uary
202
0
−200
−100
0
100
200
Jan-2
0
Mar-20
May-20
Jul-2
0
Sep-20
Nov-20
Jan-2
1
Mar-21
May-21
Jul-2
1
Sep-21
World Advanced economies EMDEs
Inde
x
99.5
100.0
100.5
101.0
101.5
Jan-2
1
Feb-21
Mar-21
Apr-21
May-21
Jun-2
1Ju
l-21
Aug-21
Sep-21
World Advanced economies EMDEs
Inde
x, 1
00 =
Jan
uary
1, 2
021
−4
−2
0
2
4
6
Jan-21 Mar-21 May-21 Jul-21 Sep-21
US$
bill
ions
,4-w
eek
mov
ing
aver
age

Chapter 1: COVID-19: In It for the Long Haul? ● 9
Sources: Bloomberg; Haver Analytics; World Bank; World Trade Organization.a. The figure shows Brent crude oil prices. The dashed red line indicates the 2021 forecast barrel price, $62, and the dashed orange line indicates the year-to-date (YTD) average, $67. The last observation is September 29, 2021. b. The last observation is August 2021.
FIGURE 1.5 Commodity markets
a. Oil prices in 2021 b. Commodity price indexes
40
50
60
70
80
Jan-2
1
Feb-21
Mar-21
Apr-21
May-21
Jun-2
1Ju
l-21
Aug-21
Sep-21
Forecast YTD average
US$
per
bar
rel
20
40
60
80
100
120
140
Jan-1
9
Apr-19
Jul-1
9
Oct-19
Jan-2
0
Apr-20
Jul-2
0
Oct-20
Jan-2
1
Apr-21
Aug-21
Energy Agriculture Metals
Inde
x, 1
00 =
201
0
In EMDEs, financing conditions have tightened further since June (figure 1.4, panel c). Despite falling U.S. interest rates and robust EMDE bond issuance, EMDE credit spreads widened in July and remain elevated, reflecting policy rate hikes in some EMDEs. Pandemic setbacks and country-specific risks have also continued to push up borrowing costs and weaken domestic currencies in several countries. After a modest uptick in EMDE portfolio inflows at the end of 2021Q2, portfolio outflows resumed in July and August on expectations of sooner than anticipated policy normalization in the United States. Although portfolio flows to EMDEs picked up in September, they continued to be sensitive to broader declines in risk sentiment (figure 1.4, panel d). Underlying vulnerabilities are growing, including rising debt levels and weakening bank balance sheets, espe-cially as COVID-19 relief measures expire.
Commodity prices saw a sharp rise in the first half of 2021, with many now plateauing well above their pre-pandemic levels. Oil prices rallied markedly in 2021, averaging $67/barrel so far—well above the average price previously ex-pected for 2021 as a whole (figure 1.5, panel a) (World Bank 2021a). More recently, oil prices have been somewhat volatile, with Brent crude oil briefly spiking to more than $80/barrel in late September—this follows after a period of easing prices amid the spread of the Delta variant, which triggered concerns of weaken-ing demand, especially in China. As envisioned in June, oil prices are likely to remain elevated and then stabilize alongside the global recovery in 2022. Mean-while, the June forecasts expected metals prices to be 36 percent higher in 2021 on average relative to last year owing to the global recovery, before falling back in 2022 as some supply constraints ease. Agricultural prices have also seen a sub-stantial rise, particularly those of food commodities, with prices previously pro-jected to rise by 16 percent in 2021 before stabilizing in 2022 (figure 1.5, panel b).

10 ● World Bank ECA Economic Update Fall 2021
Global Risks
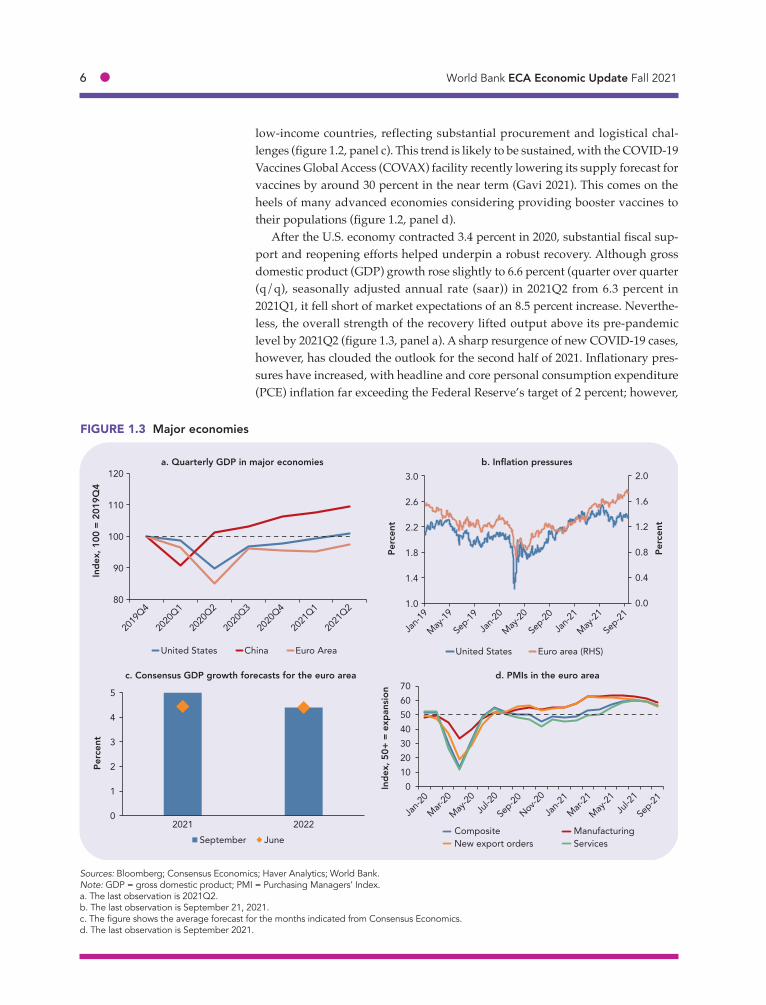
The global growth projections in June expected a rebound of 5.6 percent in 2021—the strongest post-recession pace in 80 years—and then to moderate to 4.3 per-cent in 2022 (figure 1.6, panel a).2 Despite this relatively robust baseline, the out-look continues to be subject to key downside risks, particularly in the context of the pandemic. In a downside scenario of a protracted pandemic, global growth over the next two years would falter to a pace similar to the anemic recovery that followed the global financial crisis (figure 1.6, panel b). A lingering pandemic could further exacerbate the unevenness of the recovery, as limited vaccine access in poorer countries would continue to hinder widespread vaccination.
The continued outbreak of COVID-19—especially in light of the emergence of new variants that are more virulent and resistant to vaccines—has cast a long shadow over the strength of the global recovery. In particular, global growth could falter if the ongoing effects of the Delta variant continue to disrupt activity. Recent developments in East Asia and the Pacific (EAP) highlight the importance of this risk. In EAP, low vaccination rates combined with the more transmissible Delta variant contributed to severe COVID-19 outbreaks and dented activity. As a result, Consensus survey data point to downgrades to near-term growth fore-casts. A further deterioration in growth outcomes in EAP could weaken the ex-ternal outlook for other EMDEs, including those in ECA that rely on industrial commodity exports or have deep trade linkages with EAP. Disruptions from the pandemic have also contributed to existing supply bottlenecks, which, if sus-tained, could slow the recovery in global trade and put further upward pressure on prices (box 1.1).
The risk of financial market stress also remains pronounced, especially follow-ing last year’s rapid buildup of government and corporate debt. This followed on the heels of a decade of rapidly accumulating debt after the global financial crisis (Kose et al. 2020). In an environment of elevated debt, financial stress could be triggered by a number of shocks that unexpectedly increase borrowing costs (Rogoff 2021a). A sudden increase in interest rates could stem from a rise in risk aversion, inflation, or expectations of faster monetary tightening. In some coun-tries, there is a risk that the recent acceleration in inflation due to commodity price increases and currency depreciation could de-anchor inflation expectations. For EMDEs that have borrowed heavily in foreign currency, that have substantial upcoming redemptions that need to be rolled over, or that have limited foreign exchange reserves, a sustained pick-up in inflation could drive further deprecia-tion, exacerbating currency mismatches. This could result in significant outflows of the volatile portfolio flows that are often used to finance current account defi-cits (Ha et al. forthcoming). These pressures could be compounded by monetary policy normalization in some major advanced economies, which could trigger a sudden tightening in global financing conditions (Arteta et al. 2015; Kose et al. 2017).
2. The June baseline outlook was predicated on the assumption that widespread vaccina-tion would allow advanced economies to achieve effective containment of the pandemic by the end of 2021, while it was assumed that many major EMDEs would have substantially reduced local transmission rates.
Chapter 1: COVID-19: In It for the Long Haul? ● 11
Europe and Central Asia: Recent Developments and OutlookEconomic activity in EMDEs in ECA is expected to grow 5.5 percent in 2021. This is considerably higher than initially projected due to a stronger-than-anticipated recovery in domestic demand, especially in the region’s largest economies. The improvement has also reflected robust external demand, which has benefited regional export growth and helped support higher commodity prices. This boost, however, is now fading due to the ongoing global and regional spread of more contagious COVID-19 variants. The cyclical recovery in ECA is forecast to ease to 3.4 percent in 2022, as domestic demand stabilizes, global growth plateaus, and commodity prices edge down. The outlook for 2022 is weaker than previously anticipated, owing to a faster-than-expected removal of macroeconomic support. The outlook remains highly uncertain given the continuation of the pandemic, especially in the context of low vaccination. The regional recovery remains vulnerable to financial stress, which could be triggered by an abrupt tightening of external financing conditions or a sharp rise in policy uncertainty and geopolitical tensions.
Recent Developments
The COVID-19 pandemic continues to shape the economic outlook for EMDEs in ECA after more than 18 months since the first case was detected in the region.3
Since then, COVID-19 has infected more than 28 million people in the region, making ECA the second hardest hit EMDE region in per capita terms. The region
3. In this section, ECA refers to the 23 EMDEs in ECA for which the World Bank forecasts GDP growth.
Sources: Bolt et al. 2018; Guénette and Yamazaki 2021; Kose, Sugawara, and Terrones 2020; Oxford Economics; World Bank.a. Data for 2021–23 used in the “2020” episode are forecasts. The lines show global recession episodes. Multiple years are used when a global re-cession lasted for more than one year.b. Blue bars show baseline gross domestic product (GDP) growth from the Global Economic Prospects June 2021 database. Orange whiskers indi-cate the scenario ranges from Oxford Global Economic Model simulations compared with the baseline scenario, as described in Guénette and Yamazaki (2021).
FIGURE 1.6 Global risks
a. Global output recoveries over history b. Global GDP growth
90
95
100
105
110
115
120
t−2 t−1 t t+1 t+2 t+3
1945–46 1975 19821991 2009 2020
Inde
x, 1
00 =
glo
bal r
eces
sion
0
2
4
6
8
2021 2022 2023
Baseline Scenario Range
Perc
ent

12 ● World Bank ECA Economic Update Fall 2021
has faced several resurgences of the virus this year, with daily new COVID-19 cases and deaths starting to increase once again in early June (figure 1.7, panel a). Five ECA countries—Bosnia and Herzegovina, Bulgaria, Hungary, Montenegro, and North Macedonia—are among the 10 EMDEs with the highest per capita numbers of deaths from COVID-19. Although there are vast differences across ECA, roughly 70 COVID-19 vaccine doses per 100 people have been adminis-tered in the region—lower than the global average of almost 80 doses per 100 people (figure 1.7, panel b).
By the end of September, the share of people fully vaccinated was above the global average in five ECA countries (Azerbaijan, Croatia, Hungary, Poland, and Turkey), while the rest of the region lagged. Although the pace has accelerated
Sources: Fan et al. (2021); Johns Hopkins University; Our World in Data; World Bank.Note: CA = Central Asia; CE = Central Europe; ECA = Europe and Central Asia; EE = Eastern Europe; SCC = South Caucasus; WBK = Western Balkans.a.–b. The figures show seven-day moving averages. a. Retail and mobility data refer to mobility and trends for places like restaurants, cafes, shopping centers, theme parks, museums, libraries, and movie theaters. The baseline for mobility is the median value, for the corresponding day of the week, during January 3 to February 6, 2020. The or-ange line indicates the baseline for retail mobility. Aggregates are calculated as the sum for daily cases and the average for mobility. The sample in-cludes 19 and 23 ECA economies for mobility and COVID-19 cases, respectively. Last observation is September 28, 2021 for new daily cases and September 21, 2021 for mobility data.b. Last observation is September 23, 2021.c. Survey results are based on 236,000 interviews conducted in 18 countries during April 1-30, 2021. The bars indicate the share of the population receiving at least one vaccine dose and responses to a vaccine acceptance question. Responses to the vaccine acceptance question are weighted to reflect the share of population who have not yet received a vaccine. Survey respondents are asked, “If a vaccine to prevent COVID-19 were of-fered to you today, would you choose to get vaccinated?” Aggregates are calculated using population weights.d. The figure shows seven-day moving averages of daily new COVID-19 deaths per 100,000 people for ECA countries above and below the global vaccination rate, which is almost 80 vaccinations per 100 people. The sample includes 23 ECA countries. The last observation is September 28, 2021.
FIGURE 1.7 Recent COVID-19 trends in ECA
c. Willingness to receive a COVID-19 vaccine d. New COVID-19 deaths per 100,000 people in ECA, by vaccination progress
a. COVID-19 daily new cases and mobility b. Number of COVID-19 vaccine doses administered
−80
−40
0
40
0
50
100
150
Feb-20
Apr-20
Jun-2
0
Aug-20
Oct-20
Dec-20
Feb-21
May-21
Jul-2
1
Sep-21
New daily cases (7-day average)Retail and recreation mobility (RHS)
Thou
sand
s
Perc
ent c
hang
e fr
om b
asel
ine
0
50
100
150
Dec-20
Jan-2
1
Feb-21
Mar-21
Apr-21
May-21
Jun-2
1Ju
l-21
Aug-21
Sep-21
Euro area ECA World
Vacc
inat
ions
per
hun
dred
peo
ple
0
25
50
75
100
ECA Turkey CE WBK EE SCC RussianFederation
CA
Vaccinated or willing Hesitant
Perc
ent o
f res
pond
ents
02468
101214
Jan-2
1
Feb-21
Mar-21
Apr-21
May-21
Jun-2
1Ju
l-21
Aug-21
Sep-21
Above global vaccination rateBelow global vaccination rate
Dai
ly n
ew d
eath
s
Chapter 1: COVID-19: In It for the Long Haul? ● 13
Sources: Haver Analytics; World Bank; World Trade Organization.Note: ECA = Europe and Central Asia; GDP = gross domestic product; PMI = Purchasing Managers’ Index.a. Retail sales volume is seasonally adjusted. The last observation is July 2021. The sample for retail sales includes nine ECA countries. The sample for remittances includes six ECA countries. b. The figure is indexed to equal 100 for the same month in 2019. The sample includes 11 and 12 ECA economies for services exports and tourist arrivals, respectively. The last observation is June 2021.c. CA = Central Asia; CE = Central Europe; ECA = Europe and Central Asia; EE = Eastern Europe; RUS = Russian Federation; SCC = South Cauca-sus; TUR = Turkey; WBK = Western Balkans. Data are reported as the quarter-on-quarter seasonally adjusted annual rate, except for Turkey, which is year-on-year due to data volatility. d. PMI readings above (below) 50 indicate expansion (contraction). The last observation is August 2021.
0
20
40
60
80
100
120
140
Jan-2
0Apr-2
0Ju
l-20
Oct-20
Jan-2
1Apr-2
1
Jun-2
1
Services exports International tourist arrivals
Inde
x, 1
00 =
201
9
−10
−5
0
5
10
15
20
25
ECA RUS TUR* WBK CE CA EE
2021Q1 2021Q2
Perc
ent,
q/q
saar
45
50
55
60
Jan-2
1
Feb-21
Mar-21
Apr-21
May-21
Jun-2
1Ju
l-21
Aug-21
Services Manufacturing New export orders
Inde
x, 5
0+ =
exp
ansi
onFIGURE 1.8 Recent economic developments in ECA
c. Quarterly GDP d. PMIs in large ECA economies
a. Economic activity indicators b. Services exports values and international tourist arrivals
−20
−10
0
10
20
30
70
85
100
115
130
Jan-2
0
Mar-20
May-20
Jul-2
0
Sep-20
Nov-20
Jan-2
1
Mar-21
May-21
Jul-2
1
Retail sales Industrial production Remittances (RHS)
Inde
x, 1
00 =
Jan
uary
202
0
Perc
ent,
12m
/12m
mov
ing
aver
age
more recently, the number of vaccine doses was about half or lower than the global rate in a third of the region’s economies, partly owing to high vaccine re-luctance (figure 1.7, panel c). In many ECA countries with low vaccination rates, the increase in new COVID-19 deaths in the third quarter was particularly pro-nounced (figure 1.7, panel d).
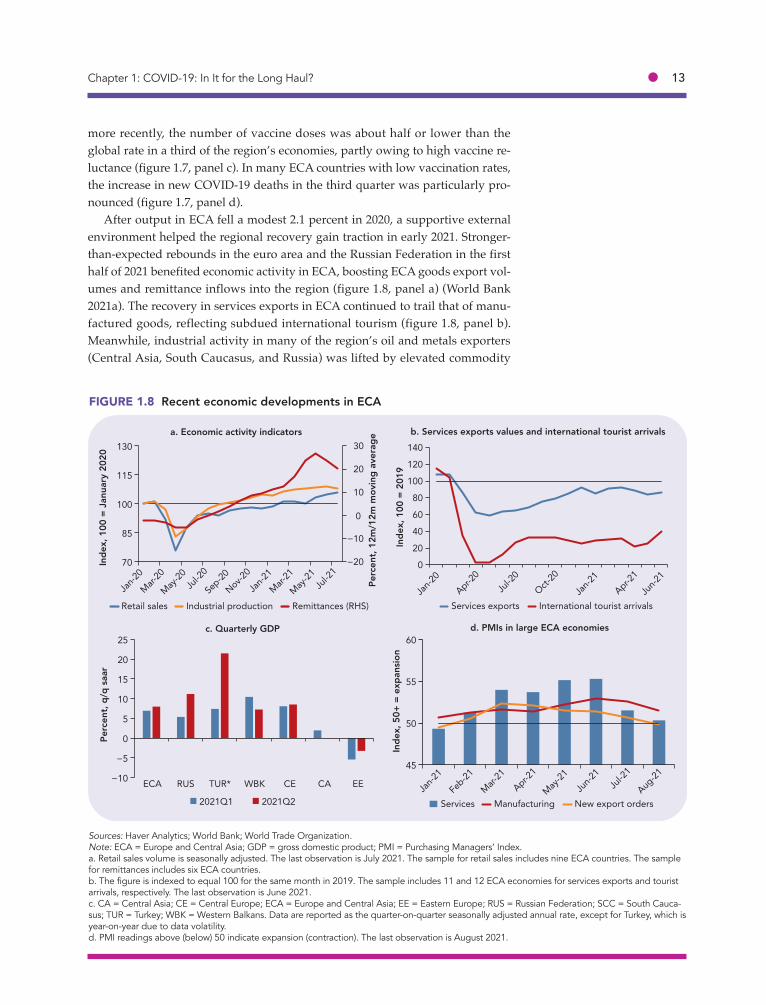
After output in ECA fell a modest 2.1 percent in 2020, a supportive external environment helped the regional recovery gain traction in early 2021. Stronger-than-expected rebounds in the euro area and the Russian Federation in the first half of 2021 benefited economic activity in ECA, boosting ECA goods export vol-umes and remittance inflows into the region (figure 1.8, panel a) (World Bank 2021a). The recovery in services exports in ECA continued to trail that of manu-factured goods, reflecting subdued international tourism (figure 1.8, panel b). Meanwhile, industrial activity in many of the region’s oil and metals exporters (Central Asia, South Caucasus, and Russia) was lifted by elevated commodity
14 ● World Bank ECA Economic Update Fall 2021
prices, owing to an earlier recovery in China and improving demand from the rest of the world.
Aggregate domestic demand gradually firmed in ECA in the first half of 2021, as earlier reopening efforts underpinned an uptick in services activity and retail sales. Nevertheless, the domestic recovery continued to be partly held back by protracted weakness in investment, as elevated policy uncertainty and mounting geopolitical tensions weighed on investor sentiment in many regional economies (Central Asia, Eastern Europe, South Caucasus, and Russia). Moreover, the recov-ery was highly uneven in the first half of 2021—a trend that could continue given varying vaccination progress (figure 1.8, panel c).
The ongoing recovery appears to be decelerating in the second half of 2021, as many ECA countries grapple with the continued effects of the Delta variant. Fol-lowing a deterioration in pandemic trends in mid-2021, the services and manu-facturing PMIs have eased in some large regional economies (figure 1.8, panel d). New export orders have slipped back into contraction amid ongoing supply bottlenecks and softening external demand. Consumer confidence has also waned in the third quarter, as the combination of Delta and rising inflation weighs on household sentiment.
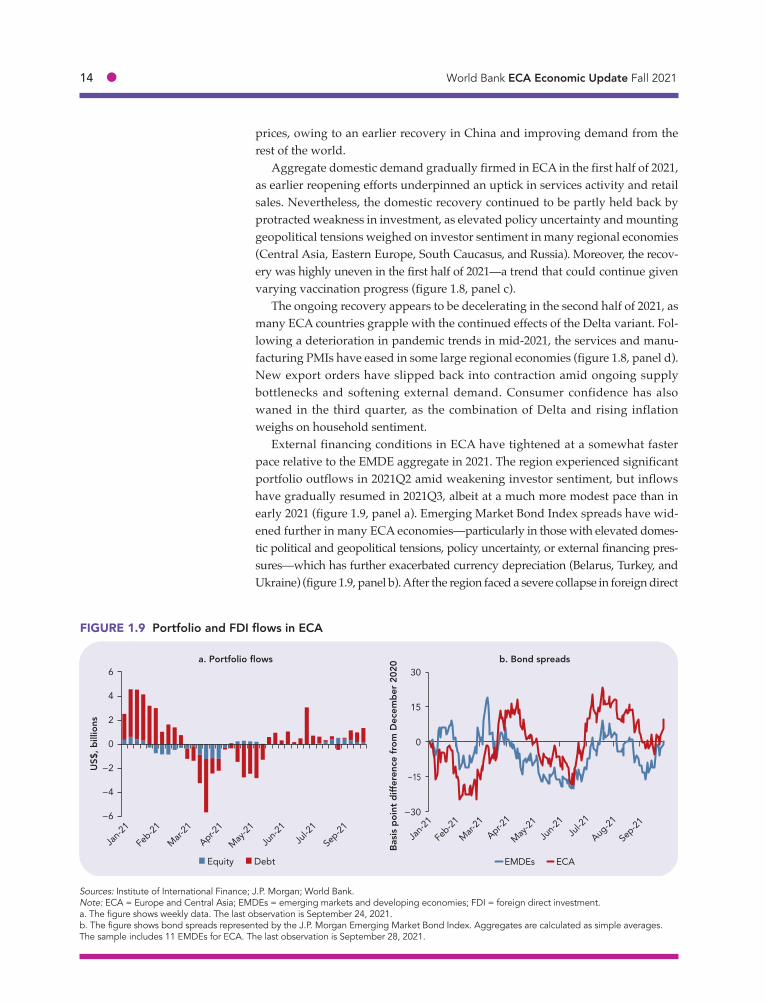
External financing conditions in ECA have tightened at a somewhat faster pace relative to the EMDE aggregate in 2021. The region experienced significant portfolio outflows in 2021Q2 amid weakening investor sentiment, but inflows have gradually resumed in 2021Q3, albeit at a much more modest pace than in early 2021 (figure 1.9, panel a). Emerging Market Bond Index spreads have wid-ened further in many ECA economies—particularly in those with elevated domes-tic political and geopolitical tensions, policy uncertainty, or external financing pres-sures—which has further exacerbated currency depreciation (Belarus, Turkey, and Ukraine) (figure 1.9, panel b). After the region faced a severe collapse in foreign direct
Sources: Institute of International Finance; J.P. Morgan; World Bank.Note: ECA = Europe and Central Asia; EMDEs = emerging markets and developing economies; FDI = foreign direct investment.a. The figure shows weekly data. The last observation is September 24, 2021. b. The figure shows bond spreads represented by the J.P. Morgan Emerging Market Bond Index. Aggregates are calculated as simple averages. The sample includes 11 EMDEs for ECA. The last observation is September 28, 2021.
FIGURE 1.9 Portfolio and FDI flows in ECA
a. Portfolio flows b. Bond spreads
−6
−4
−2
0
2
4
6
Jan-2
1
Feb-21
Mar-21
Apr-21
May-21
Jun-2
1Ju
l-21
Sep-21
Equity Debt
US$
, bill
ions
−30
−15
0
15
30
Jan-2
1
Feb-21
Mar-21
Apr-21
May-21
Jun-2
1Ju
l-21
Aug-21
Sep-21
EMDEs ECA
Basi
s po
int d
iffer
ence
from
Dec
embe
r 202
0

Chapter 1: COVID-19: In It for the Long Haul? ● 15
investment last year, inflows to some economies have remained subdued, especially in large oil exporters owing to anemic extractive investment (UNCTAD 2021).
Earlier currency depreciations, combined with supply-side constraints, have put further upward pressure on prices and prompted policy interest rate hikes in more than half of the region’s economies thus far in 2021 (box 1.1; figure 1.10, panel a). Although the banking sector has adequate liquidity and buffers in many ECA economies, increases in nonperforming and distressed loans are expected as countries continue to phase out regulatory relief and moratoriums on credit obligations.
Large fiscal support packages delivered in 2020—equivalent, on average, to 7.5 percent of GDP—are expected to be partially unwound this year (figure 1.10, panel b). A handful of regional economies, however, have announced additional fiscal support measures in 2021 to confront continued disruptions from the pan-demic (Kazakhstan, North Macedonia, and Russia). In all, the fiscal response to the pandemic, together with last year’s contraction in output, is expected to leave median public debt at 54 percent of GDP by end-2022—nearly 15 percentage points higher than in 2019.
Regional Outlook
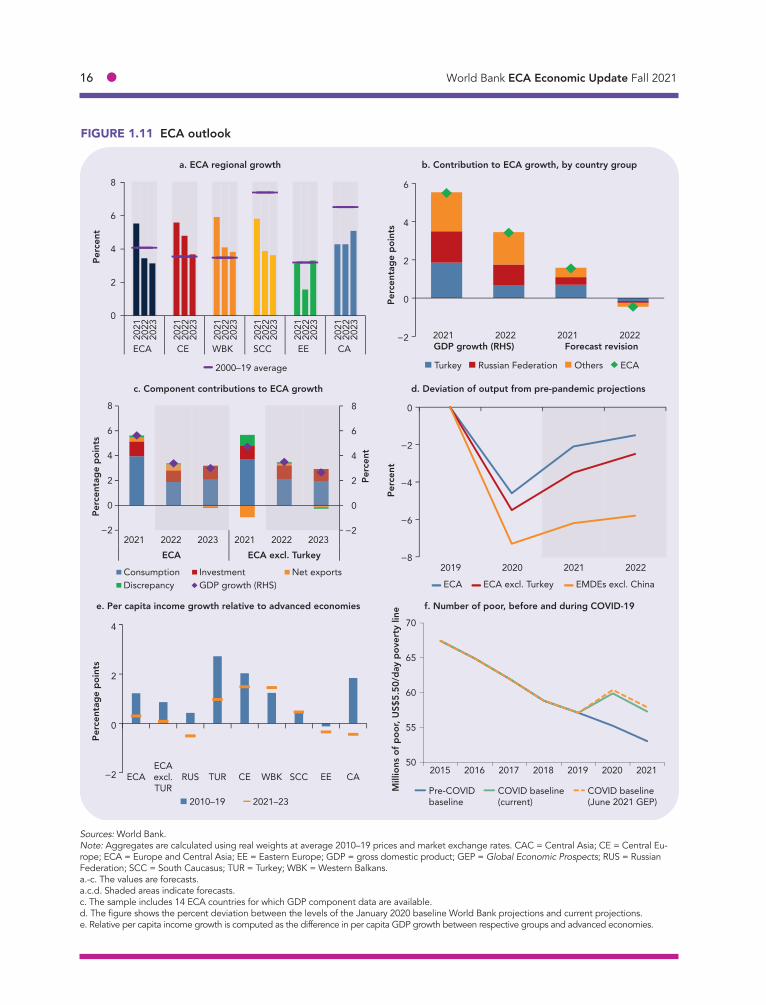
ECA’s economy is expected to expand 5.5 percent in 2021—insufficient to return output to its pre-pandemic projection (figure 1.11, panel a; table 1.1). Neverthe-less, the outlook for 2021 is considerably stronger than previously envisioned, reflecting a release of pent-up demand in the region’s largest economies (figure
Sources: International Monetary Fund; World Bank.Note: CA = Central Asia; CE = Central Europe; ECA = Europe and Central Asia; EE = Eastern Europe; GDP = gross domestic product; SCC = South Caucasus; WBK = Western Balkans.a. The figure shows the share of countries with a positive (loosening fiscal stance), negative (tightening fiscal stance), and unchanged fiscal impulse in 2021 using +/- 0.5 percentage point of potential GDP threshold, and the shares of countries that experienced a policy rate hike (tightening mon-etary policy rate) and cut (loosening monetary policy rate). Fiscal impulse is defined as the negative change in the cyclically-adjusted primary bal-ance from the previous year. Monetary policy stance shows whether countries have had net policy rate hikes/cuts this year. The sample includes 10 ECA countries for fiscal balance and 19 ECA countries for monetary policy rate. The monetary policy rate data are through September 2021. b. The data are through June 2021.
FIGURE 1.10 Macroeconomic Policy in ECA
a. Change in fiscal and monetary stance b. Fiscal stimulus packages
0
25
50
75
100
Fiscal stance Monetary policy rate
Tightening Unchanged Loosening
Perc
ent o
f ECA
cou
ntrie
s
0
3
6
9
12
15
ECA Turkey CE WBK SCC CA RussianFederation
EE
Equity injections
Contingent liabilities
Discretionary measures
Total fiscal
Perc
ent o
f GD
P
16 ● World Bank ECA Economic Update Fall 2021
FIGURE 1.11 ECA outlook
a. ECA regional growth b. Contribution to ECA growth, by country group
c. Component contributions to ECA growth
e. Per capita income growth relative to advanced economies
d. Deviation of output from pre-pandemic projections
f. Number of poor, before and during COVID-19
0
2
4
6
8
2021
2022
2023
2021
2022
2023
2021
2022
2023
2021
2022
2023
2021
2022
2023
2021
2022
2023
ECA CE WBK SCC EE CA
2000–19 average
Perc
ent
−2
0
2
4
6
2021 2022 2021 2022GDP growth (RHS) Forecast revision
Turkey Russian Federation Others ECA
Perc
enta
ge p
oint
s
−2
0
2
4
6
8
−2
0
2
4
6
8
2021 2022 2023 2021 2022 2023ECA ECA excl. Turkey
Consumption Investment Net exportsDiscrepancy GDP growth (RHS)
Perc
enta
ge p
oint
s
Perc
ent
−8
−6
−4
−2
0
2019 2020 2021 2022
ECA ECA excl. Turkey EMDEs excl. China
Perc
ent
−2
0
2
4
ECAECAexcl.TUR
RUS TUR CE WBK SCC EE CA
2010–19 2021–23
Perc
enta
ge p
oint
s
50
55
60
65
70
2015 2016 2017 2018 2019 2020 2021
Pre-COVIDbaseline
COVID baseline(current)
COVID baseline(June 2021 GEP)
Mill
ions
of p
oor,
US$
5.50
/day
pov
erty
line
Sources: World Bank.Note: Aggregates are calculated using real weights at average 2010–19 prices and market exchange rates. CAC = Central Asia; CE = Central Eu-rope; ECA = Europe and Central Asia; EE = Eastern Europe; GDP = gross domestic product; GEP = Global Economic Prospects; RUS = Russian Federation; SCC = South Caucasus; TUR = Turkey; WBK = Western Balkans. a.-c. The values are forecasts. a.c.d. Shaded areas indicate forecasts. c. The sample includes 14 ECA countries for which GDP component data are available.d. The figure shows the percent deviation between the levels of the January 2020 baseline World Bank projections and current projections. e. Relative per capita income growth is computed as the difference in per capita GDP growth between respective groups and advanced economies.

Chapter 1: COVID-19: In It for the Long Haul? ● 17
1.11, panel b). The improvement is broad-based, with growth in 2021 upwardly revised in about 90 percent of ECA’s economies on the back of strengthening domestic demand. Positive spillovers from firming activity in the euro area and higher commodity prices in the first half of this year have also bolstered ECA’s recovery, particularly in exports.
The cyclical recovery in ECA is forecast to ease to 3.4 percent in 2022, as do-mestic demand stabilizes. The earlier boost from external demand is also ex-pected to fade alongside plateauing global growth and easing commodity prices. The near-term outlook has deteriorated, partly reflecting a faster removal of mac-roeconomic support than envisioned, especially in some large ECA economies. Nevertheless, the continued relaxation of OPEC+ production cuts should help buoy activity in the region’s oil exporters. The regional forecast is also predicated on a gradual recovery in investment, particularly in those economies benefiting from sizable EU spillovers and funds (Central Europe and the Western Balkans) (figure 1.11, panel c).
The strength of the earlier recovery has helped limit the amount of scarring from the pandemic in ECA relative to other EMDEs (figure 1.11, panel d). None-theless, per capita GDP is projected to remain about 1.5 percent below its pre-pandemic projection in 2022. As a result, the pace of per capita income growth catch-up with advanced economies is anticipated to slow over the next three
TABLE 1.1 Europe and Central Asia growth forecast summary(real GDP growth at market prices in percent, unless indicated otherwise)
2019 2020 2021f 2022f 2023f
Percentage point differences from June 2021 projections
2021f 2022f 2023f
EMDE ECA, GDPa 2.7 −2.1 5.5 3.4 3.1 1.6 −0.5 −0.4EMDE ECA, GDP excl. Turkey 3.1 −3.1 4.7 3.6 2.9 1.0 −0.1 −0.3
Commodity exportersb 2.5 −2.9 4.3 3.1 2.4 1.0 −0.3 −0.4Commodity importersc 2.8 −1.3 6.8 3.8 3.8 2.2 −0.6 −0.4Central Europed 4.4 −3.6 5.6 4.8 3.7 1.1 0.3 −0.2Western Balkanse 3.7 −3.2 5.9 4.1 3.8 1.5 0.4 0.0Eastern Europef 2.7 −3.2 3.1 1.6 3.3 1.2 −1.2 0.7South Caucasusg 3.8 −5.2 5.8 3.9 3.6 2.2 −0.3 −0.4Central Asiah 4.9 −1.4 4.3 4.3 5.1 0.6 0.0 0.0Russian Federation 2.0 −3.0 4.3 2.8 1.8 1.1 −0.4 −0.5Turkey 0.9 1.8 8.5 3.0 4.0 3.5 −1.5 −0.5Poland 4.7 −2.7 4.5 4.7 3.4 0.7 0.2 −0.5
Source: World Bank.Note: World Bank assumptions are frequently updated based on new information and changing (global) circumstances. Consequently, the working assumptions presented here may differ from those contained in other World Bank documents, even if basic assessments of countries’ prospects do not differ at any given moment. Due to lack of reliable data of adequate quality, the World Bank is currently not publishing economic output, income, or growth data for Turkmenistan, and Turkmenistan is excluded from cross-country macroeconomic aggregates. e = estimate; ECA = Europe and Central Asia; EMDE = emerging market and developing economy; f = forecast; GDP = gross domestic product.a. GDP and expenditure components are measured in average 2010–19 prices and market exchange rates.b. Includes Armenia, Azerbaijan, Kazakhstan, the Kyrgyz Republic, Kosovo, the Russian Federation, Tajikistan, Ukraine, and Uzbekistan.c. Includes Albania, Belarus, Bosnia and Herzegovina, Bulgaria, Croatia, Georgia, Hungary, Moldova, Montenegro, North Macedonia, Poland, Romania, Serbia, and Turkey.d. Includes Bulgaria, Croatia, Hungary, Poland, and Romania.e. Includes Albania, Bosnia and Herzegovina, Kosovo, Montenegro, North Macedonia, and Serbia.f. Includes Belarus, Moldova, and Ukraine.g. Includes Armenia, Azerbaijan, and Georgia.h. Includes Kazakhstan, the Kyrgyz Republic, Tajikistan, and Uzbekistan.

18 ● World Bank ECA Economic Update Fall 2021
Prior to the pandemic, inflation in most economies in Europe and Central Asia (ECA) remained within or below central bank target ranges and inflation expectations were well-anchored. Aggregate ECA inflation had decelerated leading up to the pan-demic alongside easing economic growth and moderating energy prices. In parts of the region, however, underlying inflationary pressures were building to varying degrees (Central Europe and Turkey). In some cases, this reflected rising capac-ity constraints, which were becoming binding amid the combination of positive output gaps and accommodative fiscal policy. In other ECA econo-mies, confidence shocks triggered financial market turbulence and currency depreciation, which con-tributed to a surge in inflation.
At the onset of the pandemic, inflation in ECA initially remained relatively stable, reflecting diverging country trends—most notably a rise in inflation in Turkey and a slowdown in the Russian Federation. Since the start of 2021, however, rising inflationary pressures have prompted many central banks in emerging markets and developing econ-omies (EMDEs)—including in ECA—to respond with policy rate hikes despite output gaps remain-ing negative. Moreover, price pressures have built alongside the recovery in output, with rising capac-ity constraints and global commodity prices con-tributing to the uptick in inflation.
Against this backdrop, this box examines regional inflation trends and monetary policy responses by asking the following questions:
• What are the recent developments and driv-ers in regional inflation?
• What are the near-term prospects for regional inflation?
• What are the policy implications of higher inflation for regional monetary authorities?
Recent inflation developments and drivers in ECA. The global collapse in demand and sub-sequent plunge in oil prices from the pandemic
exerted downward pressure on global inflation throughout most of 2020 (World Bank 2021a; Ha et al. 2021). Regional inflation in ECA also shifted lower in 2020, as the large negative demand shock from COVID-19 more than offset pandemic-related supply shocks that increased inflation, includ-ing lockdowns and mobility restrictions.a These trends and drivers, however, varied widely across the region in 2020. In Turkey, inflation rose due to positive demand and supply shocks, with a rapid expansion of credit buoying demand. Meanwhile, in some oil exporters and Central European econo-mies, inflationary pressures increased on the back of tight supply conditions, which were only partly offset by subdued demand. In contrast, inflation in Russia collapsed alongside demand—in tandem with global trends. In all, the pandemic-induced recession prompted many central banks across the region to cut policy interest rates—in some cases, to record-low rates (Russia).
Price pressures began to build at the start of 2021, as the regional recovery gained traction alongside a robust rebound in demand.b Ongo-ing supply constraints also contributed to the rise in headline and core inflation. In all, ECA inflation accelerated to a 12.5-year high in August 2021, reaching 9.1 percent and outpacing EMDE inflation by 5.1 percentage points (figure B.1.1.1, panel a). These trends are broad-based across the region—of the 17 ECA central banks with inflation targets, more than half reported headline inflation above the upper bound of the target band in 2021.
The pick-up in headline inflation has partly reflected the region’s exposure to global spillovers amid tight global financial and commodity market linkages. For about a quarter of ECA’s economies, the surge in inflation directly mirrored develop-ments in the euro area due to their exchange rate arrangement with the euro.c Many countries in the region experienced a sharp acceleration in food prices due to several idiosyncratic factors, includ-ing drought, low crop yields, and export bans in
Inflationary pressures in ECA: transitory or persistent?BOX 1.1
(Continued next page)
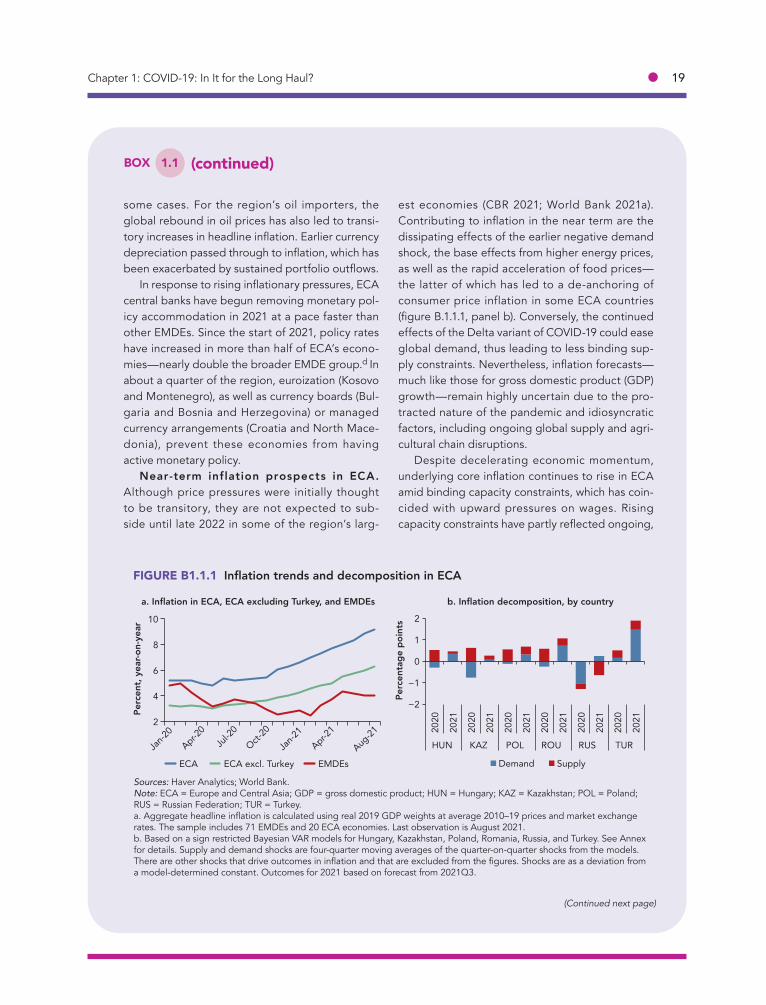
Chapter 1: COVID-19: In It for the Long Haul? ● 19
some cases. For the region’s oil importers, the global rebound in oil prices has also led to transi-tory increases in headline inflation. Earlier currency depreciation passed through to inflation, which has been exacerbated by sustained portfolio outflows.
In response to rising inflationary pressures, ECA central banks have begun removing monetary pol-icy accommodation in 2021 at a pace faster than other EMDEs. Since the start of 2021, policy rates have increased in more than half of ECA’s econo-mies—nearly double the broader EMDE group.d In about a quarter of the region, euroization (Kosovo and Montenegro), as well as currency boards (Bul-garia and Bosnia and Herzegovina) or managed currency arrangements (Croatia and North Mace-donia), prevent these economies from having active monetary policy.
Near-term inflation prospects in ECA. Although price pressures were initially thought to be transitory, they are not expected to sub-side until late 2022 in some of the region’s larg-
est economies (CBR 2021; World Bank 2021a). Contributing to inflation in the near term are the dissipating effects of the earlier negative demand shock, the base effects from higher energy prices, as well as the rapid acceleration of food prices—the latter of which has led to a de-anchoring of consumer price inflation in some ECA countries (figure B.1.1.1, panel b). Conversely, the continued effects of the Delta variant of COVID-19 could ease global demand, thus leading to less binding sup-ply constraints. Nevertheless, inflation forecasts—much like those for gross domestic product (GDP) growth—remain highly uncertain due to the pro-tracted nature of the pandemic and idiosyncratic factors, including ongoing global supply and agri-cultural chain disruptions.
Despite decelerating economic momentum, underlying core inflation continues to rise in ECA amid binding capacity constraints, which has coin-cided with upward pressures on wages. Rising capacity constraints have partly reflected ongoing,
(continued)BOX 1.1
(Continued next page)
Sources: Haver Analytics; World Bank.Note: ECA = Europe and Central Asia; GDP = gross domestic product; HUN = Hungary; KAZ = Kazakhstan; POL = Poland; RUS = Russian Federation; TUR = Turkey.a. Aggregate headline inflation is calculated using real 2019 GDP weights at average 2010–19 prices and market exchange rates. The sample includes 71 EMDEs and 20 ECA economies. Last observation is August 2021. b. Based on a sign restricted Bayesian VAR models for Hungary, Kazakhstan, Poland, Romania, Russia, and Turkey. See Annex for details. Supply and demand shocks are four-quarter moving averages of the quarter-on-quarter shocks from the models. There are other shocks that drive outcomes in inflation and that are excluded from the figures. Shocks are as a deviation from a model-determined constant. Outcomes for 2021 based on forecast from 2021Q3.
FIGURE B1.1.1 Inflation trends and decomposition in ECA
a. Inflation in ECA, ECA excluding Turkey, and EMDEs b. Inflation decomposition, by country
2
4
6
8
10
Jan-2
0Apr-2
0Ju
l-20
Oct-20
Jan-2
1Apr-2
1
Aug-21
ECA ECA excl. Turkey EMDEs
Perc
ent,
year
-on-
year
−2
−1
0
1
2
2020
2021
2020
2021
2020
2021
2020
2021
2020
2021
2020
2021
HUN KAZ POL ROU RUS TUR
Demand Supply
Perc
enta
ge p
oint
s

20 ● World Bank ECA Economic Update Fall 2021
persistent global supply bottlenecks, to which ECA is particularly exposed as a result of the region’s deep integration in global and European value chains. Global value chains and the availability of intermediate goods have been hit by widespread COVID-19 outbreaks at large factories and ship-ping ports, particularly in East Asia and the Pacific, where curtailed operations have generated back-logs of vessels, which could take several weeks to clear. Companies have experienced a sharp rise in freight rates and localized shortages of ship-ping containers—the latter of which have reached record-high prices globally.
Compounding these supply bottlenecks is the incomplete rotation from manufactured goods to the low-trade-intensity domestic service sector, as the ongoing effects of the Delta variant dampen services activity and continue to put pressure on an already overheated manufacturing sector. Although firms have increased their use of digital technologies and diversified suppliers and pro-duction sites to increase resilience and mitigate logistical problems, these efforts have not been sufficient to ease binding constraints (Saurav et al. 2020). As a result, the composite Purchasing Man-agers’ Index input and output price indexes have accelerated this year in EMDEs, including in ECA, but the increase appears to be moderating along-side plateauing global GDP and trade growth.
Implications of high inflation for macroeco-nomic policy in ECA. Although central banks in ECA were among the first in EMDEs to respond to rising inflation with policy rate hikes in the first half of 2021, the acceleration in inflation outpaced the increase in policy rates. Moreover, these policy rate hikes generally had weaker transmission since infla-
tionary pressures were partly driven by external factors, such as accelerating food prices.e
Monetary policy rates have further tightened in the second half of 2021 despite the still negative output gaps, as concerns over de-anchoring infla-tion expectations persist in the region. As a result, several economies in the region are transitioning to a more restrictive monetary policy stance, which will present a drag on economic growth going for-ward. Rising inflationary pressures, combined with normalizing term premiums and rising Emerging Market Bond Index sovereign bond spreads, are starting to put upward pressure on government financing costs, which could increase rollover risks in economies with high short-term external debt levels (figure B1.1.2).
(continued)BOX 1.1
Sources: Andrle et al. 2015; Botha et al. 20917; Ruch 2021; World Bank.Note: ECA = Europe and Central Asia. Based on estimates from a multivariate filter model of Ruch (2021) extended using the expectations hypothesis as in Andrle et al. (2015) and Botha et al. (2017). Actual data up to 2021Q3 and forecasts thereafter.
FIGURE B1.1.2 Decomposition of change in ECA government bond yields
−2
−1
0
1
2
2020 2021Term premium Inflation expectationsReal rates Total change
Perc
enta
ge p
oint
s
a. A negative supply shock lowers output growth but raises inflation, whereas a negative demand shock lowers both output and inflation. A negative supply shock occurs when the production of a good (or service) is disrupted. This could be caused by drought, labor strikes or shortages, and mobility restrictions and lockdowns in the context of COVID-19. Negative demand shocks arise from the loss of income and, in the context of COVID-19, increased precautionary behavior, which lead to a de-crease in the consumption of goods and services.b. The uptick in inflation has been pronounced even in ECA subregions where the economic recovery is not yet fully entrenched (Eastern Europe).c. Following above-target inflation, the European Central Bank announced plans for gradually unwinding its pandemic bond pur-chasing program.d. Armenia, Belarus, Georgia, Hungary, Kazakhstan, the Kyrgyz Republic, Moldova, the Russian Federation, Tajikistan, Turkey, and Ukraine.e. Nevertheless, these monetary policy actions likely helped buoy investor confidence, which is critical in ECA given elevated policy uncertainty and geopolitical tensions.

Chapter 1: COVID-19: In It for the Long Haul? ● 21
years in ECA, but the deceleration varies across the region (figure 1.11, panel e). Weak growth prospects amid lingering structural issues and elevated geopoliti-cal tensions are projected to reverse per capita income catch-up in Eastern Europe and Central Asia—home to some of ECA’s poorest—setting development goals further from reach. In contrast, the pace of catch-up is anticipated to accelerate in the Western Balkans—the only ECA subregion projected to do so—on the back of solid investment and reform progress.
Despite a robust cyclical recovery, the pandemic is estimated to have reversed earlier gains in poverty reduction. By the end of this year, COVID-19 will likely have pushed an additional 4.3 million people under the $5.50 a day poverty line in ECA (figure 1.11, panel f).4 Although this figure is about a third smaller com-pared with previous forecasts, it suggests that the recovery is not complete or inclusive, with household incomes continuing to be dampened by job losses and a reduction in working hours, the removal of policy support, and high inflation, particularly for food items (box 1.1) (ILO 2021).
Trends in Europe and Central Asia: Major Economies and Subregions
Russian Federation
Following a sharp spike caused by the Delta variant in mid-2021, daily new CO-VID-19 cases somewhat stabilized in 2021Q3, albeit at high levels. Moreover, new COVID-19 deaths continue to hover near record-high daily rates, while the excess mortality rate has surged relative to the pre-pandemic baseline. Despite Russia being among the first in the world to start inoculating its population—owing to the early development of domestically produced vaccines, including Sputnik V—vaccination rates trail ECA and the world, with about a third of the popula-tion fully vaccinated. Stubbornly high vaccine reluctance continues to impede inoculation, with over 50 percent of surveyed respondents indicating that they are not ready to get vaccinated against COVID-19 (Levada-Center 2021).
Following the relaxation of various COVID-19 restrictions, activity is esti-mated to have returned to its 2019 level by mid-2021, with GDP growing at its fastest pace in 2021Q2 since 2000. The rebound has since moderated, however, with various PMI indicators falling back into contraction amid waning external demand and disruptions from the pandemic. Macroeconomic policy support has also started to unwind in 2021. After cutting the policy rate to a record low 4.25 percent in 2020, the Central Bank of Russia has raised it five times thus far in 2021, to 6.75 percent, to tackle above-target inflation. The Central Bank of Russia has indicated that it will continue to tighten monetary policy as consumer surveys point to de-anchoring inflation expectations following sustained currency depre-ciation and sharp food price increases.
Output in Russia is projected to grow 4.3 percent in 2021, as the economy is supported by an earlier rebound in domestic demand and elevated energy prices. The forecast for 2021 growth has been revised up substantially, partly reflecting a stronger-than-expected upturn in both domestic and external demand in the
4. For upper-middle-income countries, the $5.50 a day poverty line is most commonly used.

22 ● World Bank ECA Economic Update Fall 2021
first half of 2021 (table 1.2). The improved outlook also reflects additional, albeit modest, fiscal support. The recovery is then expected to moderate to a still solid 2.8 percent in 2022, as demand stabilizes and industrial commodity prices edge down. The outlook is also predicated on a gradual easing of OPEC+ oil produc-tion constraints and the eventual return to the fiscal rule. The escalation of geo-political tensions, including additional U.S. sanctions imposed in 2021, low vac-cination rates, and increases in the policy rate from record lows are weighing on the growth outlook.
Turkey
Shortly after emerging from a sharp resurgence of COVID-19 that peaked in April 2021, Turkey entered another wave of the virus in July, driven by the spread
TABLE 1.2 Europe and Central Asia country growth forecasts(real GDP growth at market prices in percent, unless indicated otherwise)
2019 2020 2021f 2022f 2023f
Percentage point differences from June 2021 projections
2021e 2022f 2023f
Albania 2.1 −4.0 7.2 3.8 3.7 2.8 0.1 0.0
Armenia 7.6 −7.4 6.1 4.8 5.4 2.7 0.5 0.1
Azerbaijan 2.5 −4.3 5.0 3.1 2.7 2.2 −0.8 −0.7
Belarus 1.4 −0.9 1.2 −2.8 2.3 3.4 −4.7 1.1
Bosnia and Herzegovina 3.3 −3.2 4.0 3.0 3.2 1.2 −0.5 −0.5
Bulgaria 3.7 −4.2 3.7 3.8 3.6 1.1 0.5 0.2
Croatia 2.9 −8.0 7.6 6.0 4.2 2.1 −0.2 −1.5
Georgia 5.0 −6.2 8.0 5.5 5.0 2.0 0.5 0.0
Hungary 4.6 −5.0 7.3 5.0 4.3 1.3 0.3 0.0
Kazakhstan 4.5 −2.5 3.5 3.7 4.8 0.3 0.0 0.0
Kosovo 4.8 −5.3 7.1 4.1 4.4 3.1 −0.4 0.3
Kyrgyz Republic 4.6 −8.6 2.3 4.7 4.3 −1.5 0.4 −0.2
Moldova 3.7 −7.0 6.8 3.9 4.4 3.0 0.2 0.6
Montenegro 4.1 −15.3 10.8 5.6 4.8 3.7 1.1 1.3
North Macedonia 3.2 −4.5 4.6 3.7 3.4 1.0 0.2 0.0
Poland 4.7 −2.7 4.5 4.7 3.4 0.7 0.2 −0.5
Romania 4.1 −3.9 7.3 4.8 3.9 1.3 0.3 0.0
Russian Federation 2.0 −3.0 4.3 2.8 1.8 1.1 −0.4 −0.5
Serbia 4.2 −1.0 6.0 4.5 4.0 1.0 0.8 0.1
Tajikistan 7.4 4.5 6.0 5.0 5.0 0.7 −0.6 −1.0
Turkey 0.9 1.8 8.5 3.0 4.0 3.5 −1.5 −0.5
Ukraine 3.2 −4.0 3.8 3.5 3.7 0.0 0.4 0.6
Uzbekistan 5.7 1.7 6.2 5.6 5.8 1.4 0.1 0.0
Source: World Bank.Note: World Bank forecasts are frequently updated based on new information and changing (global) circumstances. Consequently, projections presented here may differ from those contained in other Bank documents, even if basic assessments of countries’ prospects do not significantly differ at any given moment in time. Due to lack of reliable data of adequate quality, the World Bank is currently not publishing economic output, income, or growth data for Turkmenistan, and Turkmenistan is excluded from cross-country macroeconomic aggregates.e = estimate; f = forecast.a. Data are based on GDP measured in average 2010-19 prices and market exchange rates, unless indicated otherwise.

Chapter 1: COVID-19: In It for the Long Haul? ● 23
of the Delta variant. Daily new COVID-19 cases started to accelerate again in September, while deaths remain elevated. After months of slow vaccination progress, the pace quickened in July. As of late September, about two-thirds of the population had received at least one dose of a COVID-19 vaccine—among the highest in the region.
Turkey’s economy was one of the few to avoid a contraction last year, partly owing to substantial credit expansion. Growth strengthened further in the first half of 2021, as the deployment of vaccines permitted relaxing COVID-19 restric-tions, supporting robust services activity and retail sales. Activity was also fueled by a sharp rebound in industrial production and goods exports to the euro area as external demand firmed. Meanwhile, new export orders have remained solid in the third quarter. Tourist arrivals have firmed somewhat although interna-tional tourism remains depressed relative to pre-pandemic levels. And Turkey’s inclusion on travel red lists amid high COVID-19 cases is likely to weigh on in-ternational arrivals in the second half of the year. The country also suffered from floods and wildfires this summer, which caused a devastating loss of life and impacted many popular tourist areas on the coast.
Growth is projected to accelerate to an eight-year high in 2021, reaching 8.5 percent, with export growth surging in tandem with firming external demand, particularly from the euro area. The expansion is set to ease to 3 percent in 2022—slower than previously projected, as the drag on domestic demand from tight financial conditions more than offsets the sustained boost from net exports. Go-ing forward, the outlook assumes that activity will moderate, with growth sup-ported by domestic demand as the contribution from net exports fades.
On the back of a strong cyclical recovery, employment has returned to pre-crisis levels, although not to the same extent for younger people and for those informally employed. At the same time, a combination of a weak lira and rising international commodity prices has raised headline inflation to nearly 20 percent, with producers facing roughly twice as high price increases. Inflationary pres-sures could continue to build in the near term following the policy rate cut in September 2021, which was largely unexpected by the market and triggered the lira to plunge to a new historical low against the U.S. dollar. The economy re-mains vulnerable to abrupt shifts in investor sentiment, which could trigger fi-nancial market pressures and sudden stops in capital flows, especially given the ongoing challenges related to high inflation and policy uncertainty.
Central Europe
New COVID-19 cases in Central Europe fell dramatically in 2021Q2, tumbling from their April peak of 24,000 cases per day to 1,000 cases per day. Moreover, widespread deployment of vaccines in several economies likely contributed to the decline in the number of infected patients hospitalized. Since then, pandemic trends have diverged in Central Europe, with new COVID-19 cases and hospital-izations remaining low and stable in highly vaccinated countries (Hungary and Poland), while a fourth-wave resurgence is underway in Bulgaria and Roma-nia—the two EU countries with the lowest vaccination rates, reflecting high vac-cine hesitancy.

24 ● World Bank ECA Economic Update Fall 2021
Output in Central Europe rebounded in the first half of 2021, with activity surpassing its pre-pandemic level by the second quarter in every economy except Bulgaria. The expansion was partly driven by a recovery in domestic demand, as loosening pandemic restrictions unleashed pent-up demand, particularly for ser-vices, and fueled a pick-up in private consumption. Despite supply bottlenecks, new export orders expanded and industrial production growth surged to record highs in the first half of 2021, owing to solid demand from the euro area. Indus-trial activity has since stabilized in tandem with moderating global goods trade growth. Above-target inflation has prompted some central banks to begin remov-ing policy accommodation, with Hungary increasing the policy rate from 0.6 to 1.65 percent in 2021.
Growth in Central Europe is projected to rebound to 5.6 percent in 2021, sup-ported by an earlier recovery in trade amid improvement in euro area activity. Despite increases in COVID-19 cases due to the spread of the Delta variant in some parts of the subregion, the potential drag on growth is likely to remain more limited relative to previous waves, as policy makers opt for more targeted restric-tions rather than full lockdowns. Growth in Central Europe is forecast to moder-ate to 4.8 percent in 2022, as activity is buoyed by firming domestic demand while the recovery in the euro area stabilizes. The sizable EU fund packages for member states, totaling EUR 1.21 trillion—including for all Central European economies—should help bolster investment. The boost, however, could be tem-pered by low absorption of the funds due to challenges relating to administrative capacity and governance.
Western Balkans
The economies in the Western Balkans were among those most impacted by the spread of the Delta variant in 2021Q3, with the number of new COVID-19 cases approaching or surpassing previous peaks while new deaths continued to in-crease. Vaccination rates lag the world in Albania, Bosnia and Herzegovina, and Kosovo, as general reluctance hinders vaccination progress. The deterioration in pandemic trends in the Western Balkans has prompted travel advisories and bans, as well as renewed restrictions and vaccine mandates in some cases.
As COVID-19 restrictions eased, growth in the Western Balkans remained solid in the first half of 2021, with output reaching its 2019Q4 level by the second quarter. The recovery was fueled by strong export growth on the back of firming external demand, especially from the euro area, and a gradual improvement in tourist arrivals. Strengthening domestic demand also supported activity, particu-larly in Serbia, as restrictions on the economy were lifted. Retail sales and mobil-ity data also increased, pointing to rising services activity. Ongoing accommoda-tive policy measures, including cash payments (North Macedonia and Serbia), continued to support robust household consumption. Early indicators, however, point to moderating momentum in the second half of 2021, as external demand eases and new COVID-19 variants trigger an increase in cases and deaths, par-ticularly in economies with low vaccination rates.
Growth in the Western Balkans is expected to rebound to 5.9 percent in 2021—the fastest pace among the ECA subregions amid strong export performance. The

Chapter 1: COVID-19: In It for the Long Haul? ● 25
recovery is projected to moderate to 4.1 percent in 2022, as the earlier external boost fades and growth becomes more balanced. The outlook also assumes that consumer and business confidence is gradually restored, and that political insta-bility eases. Medium-term growth in Albania and North Macedonia should be boosted by accelerating structural reforms in preparation for EU membership, provided negotiations surrounding the accession process are not further delayed (Rovo 2020). The subregion is also expected to benefit from the European Union’s recently adopted Economic and Investment Plan, which will mobilize funding to support competitiveness and inclusive growth, as well as the green and digital transition.
South Caucasus
The South Caucasus saw an increase in new COVID-19 cases in 2021Q3, with cases rising well beyond previous peak levels in Azerbaijan and Georgia. Al-though new COVID-19 cases have started to fall or stabilize in the South Cauca-sus toward the start of 2021Q4, deaths remain elevated. In a bid to stem the rise in new cases, Azerbaijan and Georgia re-imposed selected restrictions, while Azerbaijan has implemented public and workplace requirements to show proof of COVID-19 vaccination. Workplace vaccination and testing re-quirements are also expected to take effect at the start of the fourth quarter this year in Armenia.
The three economies saw a solid improvement in activity in the year through July, particularly for the service sectors. The rebound in Armenia was supported by a robust pick-up in domestic demand, as well as strong export performance amid firming external demand for oil and metals. Although international tourist arrivals to the South Caucasus have improved somewhat from the troughs expe-rienced in 2020, they remain about 75 and 60 percent below pre-pandemic levels in Georgia and Armenia, respectively. Inflationary pressures, driven in part by an acceleration in food prices, as well as elevated uncertainty, may weigh on the recovery of private consumption in the rest of the year.
Among the ECA subregions, the South Caucasus suffered the sharpest col-lapse in output last year, contracting more than 5 percent, as the impact of CO-VID-19 was exacerbated by armed conflict between Armenia and Azerbaijan. Output is projected to rebound sharply in 2021, expanding 5.8 percent, with ac-tivity boosted by the recovery in consumption and a strong pick-up in exports. In Azerbaijan, growth is expected to be further supported by energy production aided by an increase in OPEC+ production quotas.
The recovery is projected to edge down to 3.9 percent in 2022, as macroeco-nomic support continues to be removed. The current forecast is predicated on political stability and reduction of geopolitical tensions, limited further rounds of pandemic-related restrictions supported by progress on COVID-19 vaccination, and a recovery in tourism alongside improving consumer and business confi-dence. Nevertheless, the recovery in the South Caucasus remains constrained, owing to heightened domestic political tensions and stability risks, as well as tighter monetary policy.
26 ● World Bank ECA Economic Update Fall 2021
Eastern Europe
Vaccination rates in Eastern Europe rank toward the bottom of the ECA subre-gions, where a general reluctance has facilitated low uptake of available supplies. That said, the pace of vaccination picked up in 2021Q3, particularly in Ukraine. As the Delta variant gained a stronghold in Europe, new COVID-19 cases have continued to trend upward in all three Eastern European economies toward the start of the fourth quarter. In response, Ukraine subsequently extended its state of emergency through October 1 to allow local authorities to continue enacting COVID-19 restrictions and introduced antigen testing as part of border controls.
Much like other ECA subregions, economic activity in Eastern Europe was buoyed by improving external demand in early 2021, which helped underpin a robust rebound in industrial production and partly offset the drag from macro-economic tightening. In Ukraine—the subregion’s largest economy—services activity benefited from a temporary easing of COVID-19 restrictions. Rising wages boosted household incomes in Ukraine and Moldova, which helped buoy private consumption. Above-target and accelerating inflation, especially in Ukraine, triggered policy rate hikes in all three economies in 2021.
Growth in Eastern Europe in the near term is projected to be the weakest among the ECA subregions, rising only to 3.1 percent in 2021 before nearly halving to 1.6 percent in 2022. Near-term activity is expected to be dampened by slowing growth in exports and private consumption in some economies, but a gradual improve-ment in domestic demand should help lift growth by 2023. Nevertheless, the outlook, particularly for private investment, remains clouded by ongoing geopo-litical and domestic political tensions in Ukraine and Belarus, with the latter fac-ing newly imposed sectoral economic sanctions. Longer-term growth prospects are also constrained by continued challenges related to slow reform momentum, which has hindered competition and private sector development.
Central Asia
New COVID-19 cases and deaths in Central Asia soared to all-time highs in 2021 as low vaccination rates left large portions of the population vulnerable to the highly contagious Delta variant. Vaccination requirements and renewed restric-tions, which were implemented at the start of 2021Q3, limited operational hours and capacity in some countries. Since then, some mobility restrictions have been eased, as increased vaccine access has helped accelerate vaccination.
Improving domestic demand helped lift economic activity in Central Asia, as a gradual reopening of economies bolstered retail sales. In Kazakhstan—Central Asia’s largest economy—the pick-up in private consumption was also boosted by additional fiscal support. Firming external demand has also boosted export performance for many goods. Nevertheless, the recovery is incomplete—oil ex-ports remain below pre-pandemic volumes and foreign direct investment in-flows continue to be subdued amid weak extractive investment. In the Kyrgyz Republic, weaker-than-expected gold production weighed on the recovery.
In Central Asia, growth is forecast to recover to 4.3 percent in both 2021 and 2022—well below historical averages amid ongoing pandemic challenges.
Chapter 1: COVID-19: In It for the Long Haul? ● 27
Nevertheless, firming investment should help support activity over the forecast horizon. In Uzbekistan, growth should continue to benefit from the implementa-tion of an ambitious reform agenda, which progressed throughout the pandemic despite formidable headwinds. Higher inflation prompted increases in key pol-icy interest rates in Kazakhstan, the Kyrgyz Republic, and Tajikistan.
The medium- to longer-term outlook in Central Asia could be dampened by stability concerns in neighboring countries, including Afghanistan amid height-ened security risks and uncertainty regarding the influx of migrant refugees. The outlook also faces challenges due to rising policy uncertainty, particularly in the Kyrgyz Republic, following political tensions and social unrest. Political tensions have also increased within Central Asia amid conflict over a border dispute be-tween the Kyrgyz Republic and Tajikistan.
Risks to the Regional Outlook
Risks to the regional outlook remain tilted to the downside, reflecting the ongo-ing effects of the protracted pandemic. Despite the pandemic’s persistence, its economic impact in recent resurgences appears to be smaller than the initial wave. Nevertheless, COVID-19 outbreaks are likely to continue to weigh on the recovery amid low vaccination rates. Absent clear and consistent communication to strengthen public trust, inoculations will be hindered by vaccine hesitancy in some ECA countries. The continued circulation of the virus in these places means that countries risk repeatedly cycling between making progress in reducing COVID-19 caseloads and relaxing restrictions, followed by the reemergence of the virus, triggering new lockdowns and renewed declines in activity.
The risk of financial stress also looms over the region’s outlook. Financial stress could be triggered by a number of negative shocks, including a sharp rise in risk aversion or expectations of a faster tapering and removal of monetary policy accommodation in major economies. Both the United States and the euro area face above-target inflation, which could prompt sudden policy rate hikes and, in turn, generate a disorderly tightening of global financing conditions. As a result, the ability of ECA countries to service debt would be more challenging, especially given the sharp uptick in debt last year to confront the pandemic. A rapid deterioration in global financial conditions could derail the global and re-gional recovery over the forecast horizon (CBR 2021). Given tight global financial linkages and the earlier drawdown of buffers from the pandemic, ECA’s econ-omy is vulnerable to shocks emanating from the euro area in particular. The re-cent European Central Bank announcement on reducing the pace of its pandemic emergency purchase program led to some market volatility in ECA, particularly in Central Europe and the Western Balkans, but equity prices have since recouped those losses.
Even absent global financial stress, a worsening of the pandemic, alongside elevated policy uncertainty, could further exacerbate the decline in portfolio in-flows and reignite currency depreciation and reserve losses in the region. As a result, external financing pressures could build, particularly in countries with a large share of foreign currency–denominated debt. The recovery in regional ac-tivity has been accompanied by a rapid acceleration of inflation. Rising price

28 ● World Bank ECA Economic Update Fall 2021
pressures have further constrained the capacity of some central banks to buffer the impact of additional negative external shocks, with more than one-half of the region’s economies forced to raise policy rates in 2021. Meanwhile, global supply disruptions and shipping bottlenecks have also exerted upward pressure on prices in ECA. In an environment of sustained, above-target inflation, a sharper erosion of investor sentiment could abruptly tighten financing conditions and lead to cascading defaults and rising nonperforming loans. Corporate balance sheet pressures have continued to rise as authorities unwind liquidity support and regulatory forbearance, putting strain on the banking sector.
A slower-than-expected recovery in the euro area, ECA’s largest trading part-ner, could generate negative spillovers in economies with tightly linked trade and financial ties (Elekdag, Muir, and Wu 2015; World Bank 2016). Moderating growth in China could be propagated through trade and commodity price chan-nels to Central Asia, as well as metals exporters in the ECA region, which are increasingly reliant on China as an export destination. The region’s energy ex-porters—Azerbaijan, Kazakhstan, and Russia—remain vulnerable to large swings in global commodity prices, particularly when accompanied by height-ened volatility (van Eyden et al. 2019).
The possibility of intensifying geopolitical tensions is also a downside risk in ECA, and could be accompanied by additional sanctions and financial market pressures. The region could be destabilized by an escalation of conflict in Ukraine or between the Kyrgyz Republic and Tajikistan, elevated stability risks following armed conflict between Armenia and Azerbaijan, and security challenges in neighboring Afghanistan—the latter of which could generate a disorderly influx of migrant refugees into ECA. The effects of sectoral economic sanctions on Be-larus’s economy or additional political pressures in the Kyrgyz Republic could weaken the outlook in Eastern Europe and Central Asia. Disagreements between the European Union and other major economies could also lead to additional sanctions that could have spillover effects on some ECA countries. A further rise in policy uncertainty, particularly in some of the region’s large economies, could also undermine the recovery if it triggers financial stress.
Long-Term Challenges and PoliciesThe long-term outlook for EMDEs in ECA will likely be dampened by the pandemic’s lasting legacies. Productivity growth had been projected to lose momentum even before the COVID-19 crisis, and this trend is likely to be exacerbated by the scarring effects of the pandemic. Entrenching a green, resilient, and inclusive development path will require measures that rekindle productivity growth, while also addressing the scars from the pandemic and challenges of climate change. A comprehensive approach to reinvigorate productivity growth includes policies that facilitate technological adoption and innova-tion among firms, promote competition in a growth-friendly macroeconomic and institu-tional environment, and bolster investment in physical and human capital—all while protecting vulnerable groups. In addition, investments in green infrastructure can help achieve development goals and improve resilience to climate change.

Chapter 1: COVID-19: In It for the Long Haul? ● 29
Reinvigorating Firm Productivity Growth
The pandemic is expected to exacerbate the slowdown in productivity growth that had already been projected over the next decade (Dieppe 2020; World Bank 2021a). Even in the decade prior to the pandemic, EMDEs in ECA were among the countries that suffered the steepest deceleration in labor productivity growth—with a large share of the slowdown accounted for by total factor pro-ductivity (TFP) (World Bank 2021b). Firm productivity in EMDEs in ECA had been low relative to advanced economies and may have been impaired by CO-VID-19 through disruptions to organizational effectiveness, increased transac-tion costs, and reduced dynamism, even if some firms have taken the opportu-nity to increase technological adoption (di Mauro and Syverson 2020; Apedo-Amah et al. 2020). Absent reforms to counter the scarring effects of CO-VID-19, the pandemic has likely further diminished prospects for catch-up over the next decade. Measures that address longstanding challenges and cement the foundation for sustainable growth can be implemented to align private sector incentives with broader policy reforms, including those that facilitate technologi-cal adoption and innovation, promote competition, and strengthen institutions.
Facilitating technological adoption and innovation. Accelerating the digital trans-formation could support higher productivity and output in EMDEs in ECA, while also strengthening economic resilience in times of crisis (Hallward-Drie-meir et al. 2020; ITU 2020). Throughout the pandemic, over 50 percent of small and medium-size enterprises (SMEs) surveyed by the Organisation for Economic Co-operation and Development (OECD) have increased the use of digital tools to ensure business continuity in the wake of reduced mobility (OECD 2021a). Pre-liminary evidence also suggests that innovation and digitalization may have helped promote firm survival during the pandemic (Muzi et al. 2021).
Although ECA fairs well relative to other EMDE regions on digital connectiv-ity, weak investment has led to large infrastructure gaps in telecommunications in the region, limiting the capacity for further regional integration (IMF 2014). Moreover, outdated technologies, lagging innovation, misallocation of labor to inefficient sectors, and market rigidities have weighed on productivity and con-tributed to dispersion in TFP across countries and firms (Araujo, Vostroknutova, and Wacker 2017; Bahar 2018; Syverson 2011; Hallward-Driemeir et al. 2020). While the number of individuals using the internet in countries in Central Eu-rope is on par with the rest of the European Union, several of ECA’s poorest EMDEs are below the global average, which will hinder their ability to close the distance to the TFP frontier (UN 2020; Burunciuc 2021). The digital divide also extends to firms, with SMEs trailing larger companies in digital connectivity and adoption, particularly in high-speed broadband and e-commerce tools, which makes narrowing productivity gaps with larger companies even more challeng-ing for SMEs (Hallward-Driemeir et al. 2020; OECD 2021a).
For many ECA countries, improving the digital infrastructure and expanding access to high-quality digital connectivity will require boosting investment in communications infrastructure (Hallward-Driemeir et al. 2020). Liberalized tele-communications, coupled with regulatory independence and efficient taxation of digital services, can catalyze private sector investment that lowers the cost of

30 ● World Bank ECA Economic Update Fall 2021
access and increases internet adoption and access to digital services, with signifi-cant spillovers to the rest of the economy (Arezki et al. 2021; Rodriguez-Castelan et al. 2021). Public investment can also play a role in supporting the digital trans-formation for firms by reducing cost barriers and accelerating the uptake of digi-tal adoption, particularly for finance-constrained SMEs.
Promoting competition in a growth-friendly macroeconomic and institutional envi-ronment. Reforms that strengthen institutions and foster favorable business cli-mates are critical in ECA to promote competition and sustainable growth—espe-cially given the state’s large and expanding footprint (EBRD 2020; World Bank 2021b). Even prior to the pandemic, the region’s slowing reform momentum—and in some cases backsliding—meant that private investment and firm produc-tivity continued to be hampered by weak institutions and governance (World Bank 2018, 2020). Pervasive corruption and crime, weak administrative capacity, regulatory obstacles, and informality remain formidable constraints on the abil-ity of private firms to operate, invest, innovate, and close the productivity gap with high-income countries (Cusolito and Maloney 2018). In over 40 percent of ECA’s EMDEs, at least a quarter of the firms surveyed identified corruption as a major constraint to business (Enterprise Surveys; Albania, Bosnia and Herzegov-ina, Bulgaria, Kosovo, Kyrgyz Republic, Moldova, Poland, Romania, Turkey, and Ukraine). Past major reform initiatives to improve the business climate or gover-nance have been followed by significantly higher TFP growth in the near term and investment growth in the medium term, including in EMDEs in ECA (World Bank 2021a, 2021b). These reforms can be complemented by efforts that improve accountability, including enhancing data transparency and security, which can strengthen institutions and ensure the efficient allocation of resources (Islam and Lederman 2020; World Bank 2021b).
Firm productivity has also been held back by poorly regulated markets through adverse incentives and the lack of creative destruction (Goldberg et al. 2010). Private sector shortcomings, including insufficient competition and ele-vated market concentration, have also weighed on TFP in the region (EBRD 2018). This is why competition is the feature topic of this economic update. Part 2 of this report illustrates the competition landscape in ECA before COVID-19, explores the impact of the pandemic on firms in different competition environ-ments, and investigates government support initiatives and which firms received them. Removing business climate distortions and restrictions on competition—including nontransparent investment regulations, cumbersome tax compliance rules, and differing treatment for state-owned enterprises—as well as better tar-geting of policy support measures are among the policy reforms that could help bolster productivity and support viable firms in the region.
Healing the Pandemic’s Scars and Bolstering an Inclusive Recovery
COVID-19 has cost millions of lives and jobs globally, reversed progress in pov-erty reduction, and is likely to impart harmful health and economic legacies in its wake. The accumulated scars on human capital will be slow to heal, while the pace of accumulation of physical capital is likely to remain subdued for a
Chapter 1: COVID-19: In It for the Long Haul? ● 31
prolonged period (World Bank 2021a). Even prior to the pandemic, all the funda-mental drivers of growth—investment, productivity growth, improvements in education and health, and working-age population growth—had been expected to decelerate over the coming decade in ECA. However, the pandemic has likely exacerbated this slowdown and its negative effects will be acutely felt by the most vulnerable—the poor, women, children, as well as youth, migrant, and in-formal workers (Dieppe 2020; World Bank 2021b).
The pandemic has also eroded earlier gains in human capital through its im-pact on health outcomes, school closures, and prolonged spells of unemploy-ment. Beyond its direct effects on morbidity and mortality, the pandemic has also delayed essential primary health services and increased food insecurity, which could lead to higher maternal and early childhood deaths (Roberton et al. 2020). These effects are also likely to weigh on longer-term productivity, as malnutrition early in life can permanently impair learning abilities. To address these chal-lenges and prevent the entrenchment of economic insecurity, a comprehensive set of macroeconomic policies is needed to help buttress an inclusive recovery, includ-ing measures to reverse scarring and protect the vulnerable (World Bank 2020).
Nurturing the labor market recovery and protecting workers. The COVID-19 reces-sion triggered a sharp yet uneven collapse in employment across sectors. The impact would have been worse absent far-reaching fiscal support, including job protection schemes and targeted cash transfers to vulnerable households. De-spite this support, ECA workers—especially those who are part-time, temporary, young, or unskilled—have suffered considerable income losses and declines in working hours. Moreover, these losses are likely to be sustained in ECA, as the recovery in employment is anticipated to lag the other EMDE regions (ILO 2021). In all, total working hours in ECA are expected to remain 2 percent below 2019 levels by 2022, with an additional 2 million projected to be unemployed in 2022 relative to 2019 and another 1 million estimated to leave the labor force amid discouragement (ILO 2021). As a result of widespread job losses, an overwhelm-ing majority of the respondents surveyed by the OECD indicated their concerns over social and economic insecurity over the next few years (OECD 2021b). These effects are expected to ripple well beyond the next few years, with households that reported a job loss concerned about lacking the necessary skills and knowl-edge to secure a well-paid job in the next decade.
Policy action needs to underpin an inclusive recovery in employment and limit the damage to human capital originating from long spells of unemployment or disengagement. Where appropriate, policy can help accelerate a reallocation of labor across sectors. Measures that facilitate the employment of displaced workers—notably female and young workers—are critical given that many of the occupations in the hardest hit sectors were already highly susceptible to automa-tion (Albanesi and Kim 2021; Hallward-Driemeier and Nayyar 2018; OECD 2021c). Active labor market policies—such as providing employment services, entrepreneurship support, and worker retraining programs—can be pursued to encourage employment in sectors experiencing higher growth (Card, Kluve, and Weber 2018; OECD 2021b; Schmillen 2020; Trebilcock 2014). Coupled with in-come support programs geared toward vulnerable populations, such as targeted

32 ● World Bank ECA Economic Update Fall 2021
cash transfers, active labor market policies can facilitate the movement of labor across sectors and enhance employment prospects for more vulnerable popula-tions to ensure a balanced, inclusive recovery (Escudero and Liepermann 2020; OECD 2021c).
Tackling educational losses and investing in the future. Education for ECA school-children—particularly those from vulnerable households—has been disrupted as partial and full school closures continue to interrupt learning continuity, which could worsen learning outcomes (World Bank 2021a, 2020). This, com-bined with the deskilling associated with prolonged unemployment, could lead to sizable future earnings losses.5 While learning outcomes had improved prior to the pandemic, those gains were not equitable—pointing to the need for struc-tural reforms not only to tackle educational losses from COVID-19, but also to ensure an inclusive recovery (OECD and UNICEF 2021).
Investing in education is needed to mitigate the disruptions to human capital brought about by the pandemic, including learning losses and youth disengage-ment. About 60 percent of low- and lower-middle-income countries—including those in ECA—have cut their public education budgets since the onset of the crisis, reversing a decade-long trend of increased funding (UNESCO 2021). Edu-cation budgets can be bolstered with additional financing deployed to incentiv-ize attendance and educational attainment, improve school facilities, and reform incentive structures for teachers, which can also increase the efficiency of existing education spending (Hui, La-Bhus, and Baoping 2019; World Bank 2021cd). In-vestment in learning infrastructure leads to improved educational outcomes and higher incomes in the long term (Akresh, Halim, and Kleemans 2021).
In ECA, transforming the education system could also help the region become more resilient to crises. Measures that adapt instruction in a new hybrid educa-tional setting, identify struggling students, and streamline the curriculum to tar-get foundational skills can help ensure learning continuity for all students (Saa-dah 2021). Moreover, governments can facilitate access to existing free and open-source education technologies in a way that favors the inclusion of disad-vantaged groups (Burns et al. 2019; UNESCO 2020). Efforts to foster equitable internet access for distance learning can help avoid the widening of the digital divide across income levels.
Ensuring a Sustainable Recovery and Protecting the Future by Boosting Green Investment
Climate change poses substantial downside risks to the longer-term health and economic landscape. As a result of the pandemic, these challenges are magnified in the context of narrower macroeconomic policy space and rising budgetary pressures (Rogoff 2021b). Nevertheless, the cost of inaction is higher—on the cur-rent trajectory, economic damage from climate change alone could shave about 10 percent off global economic output by 2050 relative to a scenario without
5. See Azevedo et al. (2021); Bundervoet, Davalos, and Garcia (2021); UNESCO (2021); and UNICEF (2021) for a discussion of the impact of COVID-19 on education. See Azevedo et al. (2020) and Fasih, Patrinos, and Shafiq (2020) for a discussion of the impact of COVID-19 on future labor earnings through its disruptions to education and employment.

Chapter 1: COVID-19: In It for the Long Haul? ● 33
climate change (Swiss Re 2021). The true cost, however, extends well beyond the economy: as many as one in eight deaths in Europe were attributed to pollution in 2012—the most recent year of analysis available (EEA 2020).
Climate change is anticipated to have a particularly large impact on Europe, including on EMDEs in ECA, with temperatures projected to rise across the con-tinent at a pace faster than the global average regardless of the global warming scenario (IPCC 2021). The frequency of droughts is anticipated to increase, which will decrease production and yields in many of ECA’s large agricultural export-ers. The expected rise in sea levels will leave ECA’s coastal populations vulner-able to flooding and land erosion. Thus, the need for structural transformation is pressing, especially given that half the world’s 20 most carbon-intensive econo-mies are located within the broader ECA region (Bjerde 2021).
Despite slow progress over the past few decades, the recent materialization of climate change risks—including weather-related disasters—has highlighted the urgency of accelerating decarbonization efforts. Countries that represent over two-thirds of global emissions and GDP have committed to achieving net zero emissions by 2050 or 2060 (IEA 2021; Pisani-Ferry 2021). The menu of policy pro-posals is wide ranging and includes carbon taxes, regulatory standards, invest-ments in green energy, and reductions in fossil fuel subsidies—the latter of which accounted for about 1.5 to nearly 7.5 percent of GDP in 2019 for some ECA econo-mies (IEA 2021; Wheeler et al. 2020). The European Commission recently an-nounced plans to cut emissions by an additional 15 percentage points than ini-tially legislated in 2018, aiming to reduce levels by 55 percent of the 1990 baseline by 2030 (European Commission 2021). A minimum carbon tax is envisioned at the national level, but the revamped framework also includes a broadening of the cap-and-trade scheme and additional environmental standards, all of which are anticipated to transform the energy, transportation, housing, manufacturing, ag-riculture, and service sectors (European Commission 2021; Pisani-Ferry 2021).
One of the key policy challenges of decarbonization will be to manage non-negligible transition costs to ensure a sustainable and inclusive recovery. The transition is likely to change the composition of GDP, as resources are directed toward sizable investment needs and away from consumption. Equity issues must be considered in this respect. Although investment gaps can be partly funded by carbon taxes, these taxes tend to be regressive. Moreover, stricter en-vironmental regulations are likely to burden poorer households more than oth-ers. As a result of these costs, additional government transfers to vulnerable households may be warranted and put further pressure on public balance sheets (Pisani-Ferry 2021). In light of these costs and equity considerations, attracting private investment is essential to realizing ambitious green investment goals. This requires a supportive domestic environment, with reduced risks, strong competition, and measures to promote capital flows. Providing an effective regu-latory environment, while enforcing environmental standards, is paramount for this endeavor (Ambec et al. 2011).
Transition costs also include those related to labor market adjustments as countries move away from fossil fuel intensive sectors, which will likely require sizable re- and up-skilling of workers, particularly in Central European countries
34 ● World Bank ECA Economic Update Fall 2021
due to high levels of employment in coal-related sectors (Pisani-Ferry 2021; World Bank 2021d). In all, the impact of transition on 2030 EU GDP is estimated to range from -0.7 to 0.55 percent under various policy scenarios—highlighting the need for the appropriate mechanisms to estimate the economic impact to ensure better growth outcomes (European Commission 2020).
Despite these challenges, economies in Europe are leveraging pandemic-re-lated support packages to ensure a greener, more sustainable recovery. In addi-tion to the European Union’s Multiannual Financial Framework and Next Gen-eration EU Funds, which includes sizable transfers to ECA’s Central European economies, the region has implemented or accelerated measures to boost energy-efficient housing and sustainable transportation, both of which are substantial sources of carbon emissions in ECA (Bjerde 2021). To benefit fully from positive spillovers from these funding arrangements and deliver on the European Green Deal, ECA economies could put in place measures that help increase the absorp-tion of these funds, including those that bolster technical and administrative ca-pacity (World Bank 2021d).
Annex 1.1 Data and Forecast ConventionsThe macroeconomic forecasts presented in this report are the result of an iterative process involving staff from the World Bank Prospects Group in the Equitable Growth, Finance, and Institutions Vice-Presidency; country teams; regional and country offices; and the Europe and Central Asia Chief Economist’s Office. This process incorporates data, macroeconometric models, and judgment.
Data
The data used to prepare the country forecasts come from a variety of sources. National income accounts, balance of payments, and fiscal data are from Haver Analytics; the World Bank’s World Development Indicators; and the Interna-tional Monetary Fund’s (IMF’s) World Economic Outlook, Balance of Payments Statistics, and International Financial Statistics. Population data and forecasts are from the United Nations’ World Population Prospects. Country and lending group classifications are from the World Bank. In-house databases include com-modity prices, data on previous forecast vintages, and country classifications. Other internal databases include high-frequency indicators—such as industrial production, consumer price indexes, housing prices, exchange rates, exports, im-ports, and stock market indexes—based on data from Bloomberg, Haver Analyt-ics, the Organisation for Economic Co-operation and Development’s analytical housing price indicators, the IMF’s Balance of Payments Statistics, and the IMF’s International Financial Statistics. Aggregate growth for the world and all sub-groups of countries (such as regions and income groups) is calculated as the gross domestic product–weighted average (in average 2010–19 prices) of country-spe-cific growth rates. Income groups are defined as in the World Bank’s classifica-tion of country groups.
Chapter 1: COVID-19: In It for the Long Haul? ● 35
Forecast Process
The process starts with initial assumptions about advanced economy growth and commodity price forecasts. These assumptions are used as conditions for the first set of growth forecasts for emerging markets and developing economies, which are produced using macroeconometric models, accounting frameworks to ensure national accounts identities and global consistency, estimates of spillovers from major economies, and high-frequency indicators. These forecasts are then evalu-ated to ensure consistency of treatment across similar economies. This process is followed by extensive discussions with World Bank country teams, which con-duct continuous macroeconomic monitoring and dialogue with country authori-ties. Throughout the forecasting process, staff use macroeconometric models that allow the combination of judgment and consistency with model-based insights.
ReferencesAkresh, R., D. Halim, and M. Kleemans. 2021. “Long Term and Intergenerational Effects of
Education: Evidence from School Construction in Indonesia.” Policy Research Working Paper 9559, World Bank, Washington, DC.
Albanesi, S., and J. Kim. 2021. “The Gendered Impact of the COVID-19 Recession on the US Labor Market.” NBER Working Paper 28505, National Bureau of Economic Re-search, Cambridge, MA.
Ambec, S., M. A. Cohen, S. Elgie, and P. Lanoie. 2011. “The Porter Hypothesis at 20: Can Environmental Regulation Enhance Innovation and Competitiveness?” Resources for the Future Discussion Paper 11-01, SSRN Electronic Journal. https:// papers.ssrn.com/sol3/papers.cfm?abstract_id=1754674.
Andrle, M., P. Blagrave, P. Espaillat, M. K. Honjo, M. B. Hunt, M. Kortelainen, R. Lalonde, M. D. Laxton, E. Mavroedi, M. D. Muir, and S. Mursula. 2015. “The Flexible System of Global Trade Models–FSGM.” International Monetary Fund, Washington, DC.
Apedo-Amah, M. C., B. Avdiu, X. Cirera, M. Cruz, E. Davies, A. Grover, L. Iacovone, U. Kilinc, D. Medvedev, F. O. Maduko, and S. Poupakis. 2020. “Unmasking the Impact of COVID-19 on Businesses: Firm-Level Evidence from across the World.” Policy Research Working Paper 9434, World Bank, Washington, DC.
Arezki, R., V. Dequiedt, R. Y. Fan, and C. M. Rossotto. 2021. “Liberalization, Technology Adoption, and Stock Returns: Evidence from Telecom.” Policy Research Working Paper 9561, World Bank, Washington, DC.
Arteta, C., M. A. Kose, F. Ohnsorge, and M. Stocker. 2015. “The Coming U.S. Interest Rate Tightening Cycle: Smooth Sailing or Stormy Waters?” Policy Research Note 15/02, World Bank, Washington, DC.
Bjerde, A. 2021. “COVID-19 Shock Offers a Historic Opportunity for a Green and Just Transition.” Eurasian Perspectives Blog, World Bank, April 21. https://blogs.worldbank.org/europeandcentralasia/covid-19-shock-offers-historic-opportunity-green-and-just-transition.
Bolt, J., R. Inklaar, H. de Jong, and J. L. van Zanden. 2018. “Rebasing ‘Maddison’: New Income Comparisons and the Shape of Long-Run Economic Development.” GGDC Research Memorandum 174, University of Groningen, Groningen.
Botha, B., S. de Jager, F. Ruch, and R. Steinbach. 2017. “The Quarterly Projection Model of the SARB.” SARB Working Paper WP/17/01, South Africa Reserve Bank, Pretoria, South Africa.

36 ● World Bank ECA Economic Update Fall 2021
Burns, M., M. Santally, Y. Rajabalee, R. Halkhoree, and R. Sungkur. 2019. “Information and Communications Technologies in Secondary Education in Sub-Saharan Africa: Policies, Practices, Trends and Recommendations.” Mastercard Foundation, Toronto.
Burunciuc, L. 2021. “How Central Asia Can Ensure It Doesn’t Miss Out on a Digital Future.” Eurasian Perspectives Blog, World Bank, June 21. https://blogs.worldbank.org/educa-tion/impact-covid-19-labor-market-outcomes-lessons-past-economiccrises.
Card, D., J. Kluve, and A. Weber. 2018. “What Works? A Meta Analysis of Recent Active Labor Market Program Evaluations.” Journal of the European Economic Association16 (3): 894–93.
CBR (Central Bank of Russia). 2021. “Monetary Policy Guidelines for 2022-2024.” CBR, Moscow.
Cusolito, A. P., and F. W. Maloney. 2018. Productivity Revisited: Shifting Paradigms in Analysis and Policy. Washington, DC: World Bank.
di Mauro, F., and C. Syverson. 2020. “The COVID Crisis and Productivity Growth.” VoxEU.org, CEPR Policy Portal, April 16. https://voxeu.org/article/covidcrisis-and-productivity-growth.
Dieppe, A., ed. 2020. Global Productivity: Trends, Drivers, and Policies. Washington, DC: World Bank.
Duke Global Health Innovation Center. 2021. “Launch and Scale Speedometer.” Duke University, Durham, NC. https://launchandscalefaster.org/covid19.
EBRD (European Bank for Reconstruction and Development). 2020. Transition Report 2020-21: The State Strikes Back. London: EBRD.
EEA. 2020. Healthy Environment, Healthy Lives: How the Environment Influences Health and Well-Being in Europe. Luxembourg: EEA.
Elkedag, S., D. Muir, and Y. Wu. 2015. “Trade Linkages, Balance Sheets, and Spillovers: The Germany-Central European Supply Chain.” Journal of Policy Modeling 37 (2).
Escudero, V., and H. Liepmann. 2020. “The Joint Provision of Active Labour Market Policies and Income Support Can Be a Powerful Solution for Improving Workers’ Perspectives.” VoxEU.org, CEPR Policy Portal, September 19. https://voxeu.org/article/ combined-active-labour-market-policies-and-incomesupport-can-improve-workers-perspectives.
Fan, J., Y. Li, K. Stewart, A. R. Kommareddy, A. Garcia, J. Ma, A. Bradford, et al. 2021. “COVID-19 World Symptom Survey Data API.” University of Maryland, College Park, MD. https://covidmap.umd.edu/ api.html.
Gavi, The Vaccine Alliance. 2021. COVAX Global Supply Forecast. Geneva, Switzerland: Gavi.
Goldberg, P., A. K. Khandelwal, N. Pavcnik, and P. Topalova. 2010. “Multiproduct Firms and Product Turnover in the Developing World: Evidence from India.” Review of Eco-nomics and Statistics 92 (4): 1042–49.
Guenette, J. D., and T. Yamazaki. 2021. “Projecting the Economic Consequences of the COVID-19 Pandemic.” Policy Research Working Paper 9589, World Bank, Washington, DC.
Ha, J., A. M. Kose, and F. Ohnsorge. 2021. “One-Stop Source: A Global Database of Infla-tion.” Policy Research Working Paper 9737, World Bank, Washington, DC.
Hallward-Driemeier, M., and G. Nayyar. 2017. Trouble in the Making? The Future of Man-ufacturing-Led Development. Washington, DC: World Bank.
Hallward-Driemeier, M., G. Nayyar, W. Fengler, A. Aridi, and G. Indermit. 2020. Europe 4.0: Addressing the Digital Dilemma. Washington, DC: World Bank.
Harper Petersen & Co. (database). “Harper Petersen Charter Rates Index (HARPEX).” Ac-cessed September 20, 2021. https://www.harperpetersen.com.
Hui, J., F. J. La-Bhus, and S. Baoping. 2019. “Improving the Efficiency and Equity of Public Education Spending: The Case of Moldova.” IMF Working Paper 19/42, International Monetary Fund, Washington, DC.
Chapter 1: COVID-19: In It for the Long Haul? ● 37
IEA (International Energy Agency). 2020. “Sustainable Recovery.” World Energy Outlook Special Report in collaboration with the International Monetary Fund. International En-ergy Agency, Paris. https:// www.iea.org/reports/sustainable-recovery.
———. 2021. Oil 2021. Paris: IEA.
ILO (International Labour Organization). 2021. ILO Monitor: COVID-19 and the World of Work, seventh edition. Geneva: ILO.
IPCC (Intergovernmental Panel on Climate Change). 2021. “Sixth Assessment Report.” Geneva: IPCC.
Islam, A. M., and D. Lederman. 2020. “Data Transparency and Long-Run Growth.” Policy Research Working Paper 9493, World Bank, Washington, DC.
ITU (International Telecommunication Union). 2020. “Economic Impact of COVID-19 on Digital Infrastructure.” GSR-20 Discussion Paper, ITU, Geneva.
Johns Hopkins University (database). 2021. “Coronavirus Resource Center” (accessed Sep-tember 24), https:// coronavirus.jhu.edu/.
Kose, M. A., C. Lakatos, F. L. Ohnsorge, and M. Stocker. 2017. “The Global Role of the U.S. Economy: Linkages, Policies and Spillovers.” Policy Research Working Paper 7962, World Bank, Washington, DC.
Kose, M. A., P. Nagle, F. Ohnsorge, and N. Sugawara. 2020. Global Waves of Debt: Causes and Consequences. Washington, DC: World Bank.
Kose, M. A., N. Sugawara, and M. E. Terrones. 2020. “Global Recessions.” CEPR Discus-sion Paper 14397, Center for Economic Policy Research, London
Levada-Center. 2021. “Coronavirus and Vaccination.” Levada Center, Moscow. https://www.levada.ru/en/2021/09/06/coronavirus-and-vaccination-2/.
Muzi, S., F. Jolevski, K. Ueda, and D. Viganola. 2021. “Productivity and Firm Exit during the COVID-19 Crisis: Cross-Country Evidence.” Policy Research Working Paper 9671, Wor-ld Bank, Washington, DC.
OECD. 2021a. SME and Entrepreneurship Outlook 2021. Paris: OECD.
———. 2021b. “Risks That Matter 2020: The Long Reach of COVID-19.” Tackling Corona-virus (COVID-19): Contributing to a Global Effort. OECD, Paris.
———. 2021c. OECD Employment Outlook 2021: Navigating the COVID-19 Crisis and Recovery. Paris: OECD.
OECD (Organisation for Economic Co-operation and Development) and UNICEF (United Nations Children’s Fund). 2021. Education in Eastern Europe and Central Asia: Findings from PISA. Paris: OECD.
Our World in Data (database). 2021. “Coronavirus Pandemic (COVID-19)” (accessed Sep-tember 24), https:// ourworldindata.org/coronavirus.
Oxford Economics. 2020. “The Oxford Global Economic Model.” Oxford Economics, Ox-ford, U.K.
Pisani-Ferry, J. 2021. “Climate Policy Is Macroeconomic Policy, and the Implications Will Be Significant.” Policy Brief 21-20, Peterson Institute for International Economics, Washington, DC.
Roberton, T., E. D. Carter, V. B. Chou, A. R. Stegmuller, B. D. Jackson, Y. Tam, T. Sawadogo Lewis, and N. Walker. 2020. “Early Estimates of the Indirect Effects of the COVID-19 Pandemic on Maternal and Child Mortality in Low-Income and Middle-Income Coun-tries: A Modelling Study.” The Lancet Global Health 8 (7): e901–e908.
Rodriguez-Castelan, C., R. Granguillhome Ochoa, S. Lach, and T. Masaki. 2021. “Mobile Internet Adoption in West Africa.” Policy Research Working Paper 9560, World Bank, Washington, DC.
38 ● World Bank ECA Economic Update Fall 2021
Rogoff, K. 2021a. “Fiscal Sustainability in the Aftermath of the Great Pause.” Journal of Policy Modeling.
Rogoff, K. 2021b. “Back to the Seventies.” Project Syndicate, August 31. https://www.project-syndicate.org/commentary/america-facing-1970s-style-stagflation-threat-by-kenneth-rogoff-2021-08.
Rovo, N. 2020. “Structural Reforms to Set the Growth Ambition.” Policy Research Working Paper 9175, World Bank, Washington, DC.
Ruch, F. U. 2021. “Neutral Real Interest Rates in Inflation Targeting Emerging and Develop-ing Economies.” Policy Research Working Paper 9711, World Bank, Washington, DC.
Saadah, F. 2021. “From Crisis to Opportunity: Transforming Education in Europe and Cen-tral Asia after COVID-19.” Eurasian Perspectives Blog, World Bank, June 8. https://blogs.worldbank.org/europeandcentralasia/crisis-opportunity-transforming-educa-tion-europe-and-central-asia-after-covid.
Saurav, A., P. Kusek, R. Kuo, and B. Viney. 2020. The Impact of COVID-19 on Foreign Inves-tors: Evidence from the Second Round of a Global Pulse Survey. Washington, DC: World Bank.
Schmillen, A. D. 2020. “Causes and Impacts of Job Displacements and Public Policy Re-sponses.” Research and Policy Brief 33, Malaysia Hub, World Bank, Washington, DC.
Swiss Re. 2021. “The Economics of Climate Change.” Swiss Re, Zurich, Switzerland. https://www.swissre.com/institute/research/topics-and-risk-dialogues/climate-and-natural-catastrophe-risk/expertise-publication-economics-of-climate-change.html.
Topalova, P., and A. Khandelwal. 2011. “Trade Liberalization and Firm Productivity: The Case of India.” Review of Economics and Statistics 93 (3): 995–1009.
Trebilcock, M. J. 2014. Dealing with Losers: The Political Economy of Policy Transition. New York: Oxford University Press.
UN (United Nations). 2020. E-Government Survey 2020. New York: UN.
UNCTAD. 2021. Investment Trends Monitor. Issue 38. Geneva: UNCTAD.
UNESCO (United Nations Educational, Scientific, and Cultural Organization). 2020. Educa-tion in a PostCOVID World: Nine Ideas for Public Action. International Commission on the Futures of Education. Paris: UNESCO.
———. 2021. “COVID-19 Educational Disruption and Response.” UNESCO, Paris. https:// en.unesco.org/covid19/educationresponse.
UNWTO (United Nations World Tourism Organization). 2021. “2020: Worst Year in Tourism History With 1 Billion Fewer International Arrivals.” UNWTO News, January 28.
Van Eyden, R., M. Difeto, R. Gupta, and M. E. Wohar. 2019. “Oil Price Volatility and Eco-nomic Growth: Evidence from Advanced Economies Using More Than a Century’s Data.” Applied Energy 233-234: 612–21.
Wheeler, C. M., J. Baffes, A. Kabundi, G. Kindberg Hanlon, P. S. Nagle, and F. Ohnsorge. 2020. “Adding Fuel to the Fire: Cheap Oil during the COVID-19 Pandemic.” Policy Research Working Paper 9320, World Bank, Washington, DC.
World Bank. 2016. World Development Report 2016: Digital Dividends. Washington, DC: World Bank.
———. 2018. Global Economic Prospects: Broad Based Upturn, but for How Long? Janu-ary. Washington, DC: World Bank.
———. 2019a. Global Economic Prospects: Darkening Skies. January. Washington, DC: World Bank.
———. 2019b. Global Economic Prospects: Heightened Tensions, Subdued Investment. June. Washington, DC: World Bank.

Chapter 1: COVID-19: In It for the Long Haul? ● 39
———. 2019c. World Development Report 2018: Learning to Realize Education’s Promise. Washington, DC: World Bank.
———. 2020. Global Economic Prospects. June. Washington, DC: World Bank.
———. 2021a. Global Economic Prospects. June. Washington, DC: World Bank.
———. 2021b. Europe and Central Asia Economic Update: Data, Digitalization and Gov-ernance. Washington, DC: World Bank.
———. 2021c. “Investing in Human Capital for a Resilient Recovery: The Role of Public Finance Human Capital Project, Ministerial Conclave Conference Draft, World Bank, Washington, DC.
———. 2021d. “Inclusive Growth at a Crossroads: Part One of Strengthening Inclusion and Facilitating the Green Transition.” EU Regular Economic Report. World Bank, Washing-ton, DC.


41
2
41
Economies around the world have been hit hard by the COVID-19 pandemic. In 2020, global economic activity contracted because of the pandemic, resulting in the deepest economic recession since World War II (World Bank 2020a). Although global economic activity is recovering and output in Europe and Central Asia (ECA) is expected to grow in 2021, containing COVID-19 remains a challenge in the region. Indeed, ECA is among the emerging market and developing economy regions with the highest case and death rates per capita (World Bank 2021b). At the onset of the pandemic, the rapid spread of the disease and movement restric-tions and lockdowns imposed to contain the virus led to sudden supply and de-mand shocks, which manifested themselves in declines in output and productivity (Demirgüç-Kunt, Lokshin, and Torre 2021). Widespread uncertainty among busi-nesses and concerns about the risks of increasing financial sector distress limiting firms’ access to credit have compounded these supply and demand shocks.
How did firms fare? This ECA Economic Update builds on the World Bank’s ongoing work with the Enterprise Surveys (ES) COVID-19 Follow-Up Surveys and Business Pulse Surveys (BPS) to assess the impact of COVID-19 on firms in the region, with a focus on the role of competition during the crisis and recovery. Previous work has provided insights into the short-term impacts of the CO-VID-19 crisis on businesses around the world (Apedo-Amah and others 2020; Karalashvili and Viganola 2021) and has examined the reach, targeting, and ef-fectiveness of government policy measures to support firms during the CO-VID-19 crisis (Cirera and others 2021; World Bank 2021c). The focus of this chap-ter is on the role of competition because it is key to sustainable, long-term economic growth. A more competitive business environment is associated with greater dynamism and is likely to contribute to growth through three main chan-nels: (a) by incentivizing firms to innovate and become more efficient (productive efficiency); (b) by shifting resources toward more efficient firms (allocative
Competition and Firm Recovery Post-COVID-19
42 ● World Bank ECA Economic Update Fall 2021
efficiency); and (c) by forcing less efficient firms to exit while more efficient ones grow and new ones enter (market contestability/creative destruction).1
Evidence suggests that in a regulatory environment characterized by pro-competitive product market regulations, economies generally experience higher productivity growth and do a better job of reallocating resources toward more productive firms (Arnold, Nicoletti, and Scarpetta 2011). Countries with a lower regulatory burden for entry also see more firm entry and higher productivity and investment in the economy, thanks to increased competition from new firms (Motta, Oviedo, and Santini 2010). Evidence from the European Union suggests that countries with a sound business and regulatory environment are more resil-ient to negative output shocks and suffer smaller output losses than countries with weaker business and regulatory environments (Sondermann 2018).
As economies start to recover from the COVID-19 crisis, it will be important to ensure that a competitive business environment is in place that supports the reallocation of resources from less productive to more productive firms—a pro-cess Schumpeter (1942) referred to as “creative destruction.” Competition has been identified as an important source of creative destruction (Caballero 2008).
The COVID-19 pandemic has heightened concerns about limited competition and its potential consequences for economic growth. The rise of dominant firms—so-called “star” or “superstar” firms—and their market power was a sub-ject of debate among policy makers years before the pandemic (box 2.1). Evi-dence suggests that a more competitive environment promotes entrepreneurship and produces more star firms and that in advanced economies, the market power of such firms has been increasing since the 1980s. There is a debate, however, over whether firms are becoming larger and more dominant because changes in the economic environment—including globalization and scale-biased technological change related to advances in information and communications technology—re-sult in larger, more efficient firms securing increasingly larger market shares or because of anti-competitive behavior and declining competition caused by weak-ened antitrust enforcement and regulations (Autor and others 2020; Gutierrez and Philippon 2018; Akcigit and others 2021; Diez, Leigh, and Tambunlertchai 2018; IMF 2019). A critical concern for policy makers is to ensure that markets remain contestable and that even in concentrated markets, entrants with new ideas and technologies are able to challenge incumbent firms. Lack of competi-tion and a less favorable business environment are often cited as key factors ex-plaining why Europe generates few global stars and European corporations have fallen behind in recent decades (The Economist 2021). Others argue that weaker antitrust enforcement relative to the European Union explains why market power has risen more in the United States (Gutiérrez and Philippon 2018). In emerging economies, including in ECA, observed increases in corporate market power have been much more limited, possibly because of the weaker starting level in the competitive environment and dynamism that made it less likely for star firms to emerge (IMF 2019).2
1. See Dauda (2020) for a review of the literature. 2. Iootty, Pop, and Pena (2020) explore the drivers of market power trends in Romania and the implications for competition and economic growth there.
Chapter 2: Competition and Firm Recovery Post-COVID-19 ● 43
An extensive body of literature has established that both institutions and the Schumpeterian pro-cess of “creative destruction” matter for economic development and growth (see Acemoglu and Robinson 2012 and Aghion and Howitt 1992). The consensus emerging from this work is that policies fostering competition are important for economic growth.
Recent academic literature in finance and economics points to the growing importance of superstar firms in the United States (Autor and others 2020; Hall 2018; Van Reenen 2018; and De Loecker, Eeckhout, and Unger 2020) and world-wide (Andrews and others 2015). Freund and Pierola (2015) and Gaubert and Itskhoki (2020) show that “granular” forces (exports driven by large individual firms) explain the trade pattern of countries. A few dominant firms can shape the landscape of national economies; competition policies that affect individual firms may therefore have aggregate consequences.
Ayyagari, Demirgüç-Kunt, and Maksimovic (2020) document the incidence of star firms—which they define as firms in the top 10 percent globally in return on invested capital—across industries and countries. They find that star firms are more likely to occur in high-income countries and industries that rely on high intangible capi-tal. There is greater churn in the population of star firms in high-income countries, reinforcing the importance of good institutions and creative destruction for star firms. A good competitive envi-ronment—as measured by competition-enhancing product market regulation, low state ownership of the banking sector, and easier entry regulations—is associated with the rise of star firms.
In an earlier paper, Ayyagari, Demirgüç-Kunt, and Maksimovic (2019) point out that star firms are associated with greater intangible capital invest-ment and are thus most likely to have their prof-
its mismeasured, because traditional accounting standards do not capitalize research and develop-ment, brand capital, or other forms of organiza-tional capital. Even after allowing for the mismea-surement of intangible capital, the joint existence of high profits and markups is not sufficient evi-dence of star firms being detrimental to consumer welfare. Star firms have higher innovation output and more economically important patents than non-stars. At every level of markup, they have higher output and investment than non-stars. Sev-eral other studies highlight the role of intangible capital in contributing to increasing concentration and market power in industries and the overall economy (see Crouzet and Eberly 2019; Autor and others 2020; and Bessen 2017).
Keller and Yeaple (2020) find that the most pro-ductive firms, which charge the highest markups, tend to be attracted to the most competitive mar-kets. Less competitive firms, which charge lower markups, tend to be attracted to less competitive countries.
Together, this body of research suggests that (a) the rise of star firms is reflective of good busi-ness environments and institutions that encourage creative destruction and investment in innovation and (b) star firms are more innovative and efficient than non-star firms.
There may be legitimate concerns that a few dominant firms are able to keep out competi-tion by engaging in mergers and acquisitions, with long-ranging impacts on the incentives to innovate, as Cunningham, Ederer, and Ma (2021); Akcigit and others (2021); and Kamepalli, Rajan, and Zingales (2021) discuss. The critical concern for policy makers should thus be not only to con-trol the exercise of market power by these few firms but to ensure that markets remain contest-able and that entrants with new technologies are able to challenge the current market leaders.
Star firms and competition BOX 2.1
The pandemic may be exacerbating concerns about competition (Akcigit and others 2021). If smaller firms find it more difficult to adapt new technologies or business models; are less likely to receive government support; and, as a result, are more likely to exit, concentration and the dominance of large firms may in-crease, potentially further limiting competition, just when it is most needed to promote recovery.

44 ● World Bank ECA Economic Update Fall 2021
This chapter addresses the following questions: How did COVID-19 affect firms’ growth, employment and technological adaptation? Did the impact vary by firm characteristics such as size, age, sector, or gender of top manager? Is there any evidence of creative destruction so far, with resources allocated to firms that are more productive? Did firms in countries with a stronger pre-COVID-19 com-petition environment see more or less creative destruction? What forms of gov-ernment support did firms receive to help them weather the pandemic? Which firms received government support, and what are the implications for competi-tion and recovery?
The analysis yields four main results:
1. On average, the pre-COVID-19 competitive environment–-measured by various indicators—is stronger in higher-income emerging and develop-ing countries in the region. In countries with a more competitive environ-ment, firms had higher pre-crisis labor productivity, as measured by sales per worker in 2019.
2. COVID-19 had a profound and heterogenous impact on firms in the re-gion. On average, in the first survey round, conducted between May and November 2020, firms in the region reported a drop in monthly sales of 24 percent and a 10 percent decline in the number of full-time employees with respect to the previous year. By round 2, conducted between No-vember 2020 and May 2021, one in four firms reported that they expected to fall into arrears on outstanding liabilities in the next six months. Smaller and younger firms were hit harder by the COVID-19 crisis. By the second round of the survey, smaller, younger, and female-run businesses had not yet seen their sales improve since the initial drop.
3. Economic activity in ECA appears to have been reallocated toward more productive firms during the COVID-19 crisis, particularly in countries with more competitive markets. Firms with high pre-crisis labor produc-tivity experienced smaller drops in sales and employment than firms with low pre-crisis labor productivity. More productive firms were also more likely to adapt to the crisis by increasing online activity and remote work. Whether the reallocation of economic activity toward more pro-ductive firms is long-lasting will depend on whether more productive firms grow and less productive firms ultimately exit.
4. Many governments in ECA implemented broad policy support schemes to promptly address the initial economic fall-out from the COVID-19 crisis and provide immediate relief to protect firms and workers from its worst effects. The reach of government support measures varied widely across countries, but on average half of firms reported having received some gov-ernment support in response to the economic fall-out of the pandemic. Overall, government support was more likely to go to less productive firms, larger firms were more likely than smaller firms to receive support in the form payment deferrals and fiscal relief, and support measures were given to firms regardless of the level of their pre-crisis innovation.
The chapter is organized as follows. The first section describes the competition landscape in ECA before COVID-19. The next section shows how COVID-19
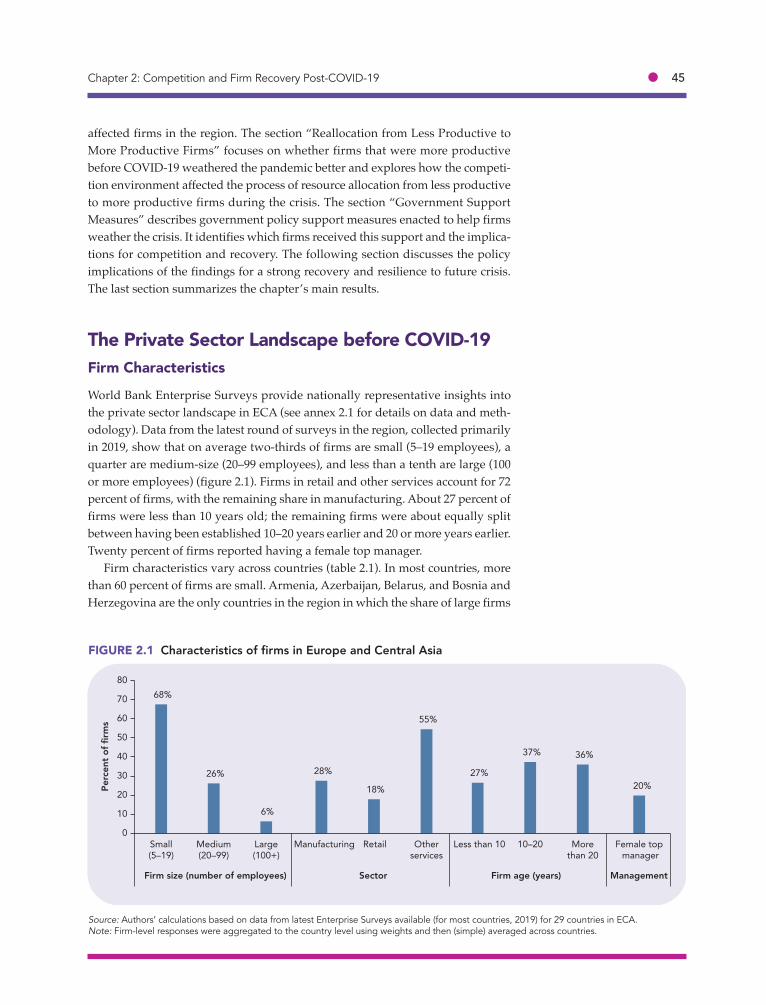
Chapter 2: Competition and Firm Recovery Post-COVID-19 ● 45
affected firms in the region. The section “Reallocation from Less Productive to More Productive Firms” focuses on whether firms that were more productive before COVID-19 weathered the pandemic better and explores how the competi-tion environment affected the process of resource allocation from less productive to more productive firms during the crisis. The section “Government Support Measures” describes government policy support measures enacted to help firms weather the crisis. It identifies which firms received this support and the implica-tions for competition and recovery. The following section discusses the policy implications of the findings for a strong recovery and resilience to future crisis. The last section summarizes the chapter’s main results.
The Private Sector Landscape before COVID-19Firm Characteristics
World Bank Enterprise Surveys provide nationally representative insights into the private sector landscape in ECA (see annex 2.1 for details on data and meth-odology). Data from the latest round of surveys in the region, collected primarily in 2019, show that on average two-thirds of firms are small (5–19 employees), a quarter are medium-size (20–99 employees), and less than a tenth are large (100 or more employees) (figure 2.1). Firms in retail and other services account for 72 percent of firms, with the remaining share in manufacturing. About 27 percent of firms were less than 10 years old; the remaining firms were about equally split between having been established 10–20 years earlier and 20 or more years earlier. Twenty percent of firms reported having a female top manager.
Firm characteristics vary across countries (table 2.1). In most countries, more than 60 percent of firms are small. Armenia, Azerbaijan, Belarus, and Bosnia and Herzegovina are the only countries in the region in which the share of large firms
Source: Authors’ calculations based on data from latest Enterprise Surveys available (for most countries, 2019) for 29 countries in ECA. Note: Firm-level responses were aggregated to the country level using weights and then (simple) averaged across countries.
68%
26%
6%
28%
18%
55%
27%
37% 36%
20%
0
10
20
30
40
50
60
70
80
Small(5–19)
Medium(20–99)
Large(100+)
Manufacturing Retail Otherservices
Less than 10 10–20 Morethan 20
Female top manager
Firm size (number of employees) Sector Firm age (years) Management
Perc
ent o
f firm
s
FIGURE 2.1 Characteristics of firms in Europe and Central Asia

46 ● World Bank ECA Economic Update Fall 2021
TABL
E 2.
1 Ch
arac
teris
tics
of fi
rms
in E
urop
e an
d Ce
ntra
l Asi
a (p
erce
nt o
f tot
al)
Firm
siz
e (n
umbe
r of e
mpl
oyee
s)Se
ctor
Firm
age
(yea
rs)
Reg
ion
or
cou
ntry
Smal
l (5
–19)
Med
ium
(2
0–99
)La
rge
(100
+)M
anuf
ac-
turin
gRe
tail
Oth
er
serv
ices
Less
tha
n 10
10
–20
Mor
e th
an
20
Fem
ale
top
man
ager
ECA
6826
628
1855
2737
3620
Cen
tral
Asi
a66
286
3318
5043
3918
20
Kaz
akhs
tan
7620
417
2062
5238
1126
Kyrg
yz R
epub
lic56
359
3722
4122
4336
33
Tajik
ista
n63
316
4114
4548
3913
7
Uzb
ekis
tan
7026
435
1351
5035
1512
Cen
tral
Eur
ope
and
Bal
tic c
ount
ries
7223
526
2054
2033
4724
Bul
gar
ia68
284
2722
5126
4429
29
Cro
atia
6627
725
4135
2116
6327
Cze
ch R
epub
lic73
235
2812
6016
3053
16
Est
onia
7225
426
1064
2433
4322
Hun
gar
y67
285
2422
5415
3748
22
Latv
ia69
273
2421
5515
3154
33
Lith
uani
a76
204
2124
5526
3440
31
Pola
nd87
112
2218
6023
3542
28
Rom
ania
7124
527
2351
1934
4717
Slov
ak R
epub
lic71
209
3020
4917
4538
23
Slov
enia
7223
532
1058
1923
5719
(con
tinue
d ne
xt p
age)

Chapter 2: Competition and Firm Recovery Post-COVID-19 ● 47
Firm
siz
e (n
umbe
r of e
mpl
oyee
s)Se
ctor
Firm
age
(yea
rs)
Reg
ion
or
cou
ntry
Smal
l (5
–19)
Med
ium
(2
0–99
)La
rge
(100
+)M
anuf
ac-
turin
gRe
tail
Oth
er
serv
ices
Less
tha
n 10
10
–20
Mor
e th
an
20
Fem
ale
top
man
ager
East
ern
Euro
pe
6328
930
1753
2143
3619
Bel
arus
6228
1028
1854
3138
3121
Mol
dov
a69
247
2722
5119
4338
19
Ukr
aine
5833
835
1055
1448
3818
Russ
ian
Fed
erat
ion
7422
516
1272
4248
1024
Sout
h C
auca
sus
5730
1219
2556
3840
2317
Arm
enia
6026
1321
2851
3436
3019
Aze
rbai
jan
5531
1516
2559
2551
2417
Geo
rgia
5734
821
2257
5432
1317
Turk
ey72
254
3116
5324
4035
4
Wes
tern
Bal
kans
6628
631
1257
2238
3915
Alb
ania
6826
626
1758
4037
2318
Bos
nia
and
Her
zeg
ovin
a54
3611
3617
4714
3353
17
Kos
ovo
7323
440
060
2847
253
Mon
tene
gro
6926
523
077
1841
4115
Nor
th M
aced
onia
7025
530
2842
1636
4721
Serb
ia62
316
3311
5617
3647
18
Sour
ce: A
utho
rs’ c
alcu
latio
ns b
ased
on
data
from
late
st E
nter
pris
e Su
rvey
s av
aila
ble
(for m
ost c
ount
ries,
201
9).
Not
es: F
irm-le
vel r
espo
nses
wer
e ag
greg
ated
to th
e co
untr
y-le
vel u
sing
wei
ghts
. EC
A a
nd s
ubre
gion
al a
vera
ges
are
sim
ple
coun
try
aver
ages
.
TABL
E 2.
1 (c
ontin
ued)

48 ● World Bank ECA Economic Update Fall 2021
exceeds 10 percent. In Central Europe and the Baltics, Eastern Europe, and the Western Balkans, almost 40 percent or more of firms are at least 20 years old. The Russian Federation and countries in Central Asia and the South Caucasus show greater dynamism. In Kazakhstan, Tajikistan, Uzbekistan, and Georgia, for ex-ample, about half or more than half of firms are less than 10 years old—twice the ECA average.
On average, there are few differences in the distribution of sectors, but some countries stand out. In Kosovo, the Kyrgyz Republic, and Tajikistan, the share of firms in the manufacturing sector is above average (at about 40 percent); in Azer-baijan, Kazakhstan, and the Russian Federation, it is below average (at about 16 percent).
The share of firms with female top managers is about 20–25 percent for most of the region. It is smaller in Kosovo and Turkey (less than 5 percent) and larger in the Kyrgyz Republic, Lithuania, and Latvia (more than 30 percent).
Competition Environment
The competition environment is characterized by four measures. The first two come from the 2020 Bertelsmann Stiftung Transformation Index (BTI), which sur-veys political and economic transformation around the world based on expert opinion. Two subcomponents of the BTI provide information on the competition environment in 2019: market organization and competition policy. The first mea-sure captures the extent to which the fundamentals of market-based competition have been developed, with a maximum score (10) indicating that “market com-petition is consistently defined and implemented both macroeconomically and microeconomically. There are state-guaranteed rules for market competition with equal opportunities for all market participants. The informal sector is very small.” The minimum score (1) indicates that “market competition is present only in small segments of the economy and its institutional framework is rudimentary. Rules for market participants are unreliable and frequently set arbitrarily. The informal sector is large.” The second measure captures the extent to which safe-guards exist to protect competition and are enforced, with the maximum score (10) indicating that “comprehensive competition laws to prevent monopolistic structures and conduct exist and are strictly enforced.” A score of 1 indicates that “no legal or political measures are taken to prevent monopolistic structures and conduct.”
Although BTI scores are based on perceptions, they are highly correlated with indicators from the OECD’s Product Market Regulation database, which is based on encoding laws and regulations and provides a de jure assessment of the com-petitive environment (it does not reflect the extent or manner in which the laws and regulations are enforced) (box 2.2).
The average score for ECA is 7 for both competition measures, with significant variation across countries (table 2.2). A score of 7 corresponds to an assessment that “market competition has a strong institutional framework, but the rules for market competition are not consistent or always uniform for all market partici-pants. The informal sector is small” and “competition laws to prevent monopo-listic structures and conduct exist, but are enforced inconsistently.” The average

Chapter 2: Competition and Firm Recovery Post-COVID-19 ● 49
The competitive environment of an economy can be defined and measured in various ways. Three datasets provide indicators of the competitive environment across countries:
• OECD Product Market Regulation (PMR) indicators are based on a questionnaire con-taining more than 1,400 questions on econ-omywide and industry-specific regulatory provisions. They are available for 35 OECD and 11 non-OECD countries. The economy-wide indicator PMR 2018 is constructed by aggregating numerical values assigned to each question. It is the simple average of two high-level aggregate indicators: Distortions Induced by State Involvement and Barriers to Domestic and Foreign Entry. Scores range from 0 to 6, with lower values indicating a more competition-friendly regulatory envi-ronment. The most recent scores reflect the situation in each country on January 1, 2018 for most countries (for some it is January 1, 2019).
• The Bertelsmann Stiftung Transformation Index (BTI) is a perception-based measure of the quality of democracy, the market economy, and governance in 137 developing countries and transition economies based on detailed country assessments produced in cooperation with experts from leading universities and think tanks in more than 120 countries. Two subcomponents—market organization and competition policy—pro-vide information on the competition environ-ment in a country. Scores range from 1 to 10, with higher values indicating a more com-petitive, market-based economy. The 2020 scores reflect the situation in each country at the beginning of 2019.
• The World Economic Forum’s Global Com-petitiveness Index (GCI) measures national competitiveness, defined broadly as the
set of institutions, policies, and factors that determine the level of productivity in a country, ranging from the macroeconomic environment to health and primary educa-tion. The index is available for 137 countries. The 2019 dataset includes three subcompo-nents relevant to the competitive environ-ment based on the World Economic Forum’s Executive Opinion Survey based on almost 13,000 interviews with business executives: the distortive effect of taxes and subsidies on competition, the extent of market domi-nance, and competition in services. The three subcomponents are also aggregated into a domestic market competition score. The values of the subcomponents range from 1 to 7; the aggregate score ranges from 0 to 100, with higher values indicating a more competitive environment. The 2019 mea-sures are based on interviews conducted in 2018 and 2019.
PMR indicators provide a de jure assessment of the competitive environment; they do not reflect the extent and manner in which these laws and regulations are enforced. The BTI subcomponents, in contrast, provide a de facto assessment of the competitive environment that is based on detailed expert assessments that reflect both the relevant laws and regulations and the (perceived) extent and manner in which they are enforced. The GCI measures similarly provide a de facto assessment based on an opinion survey of business execu-tives. The measures from the three datasets are highly correlated in many cases.
This chapter uses the two BTI subcomponents on market organization and competition policy to capture the competitive environment because the BTI dataset has the most complete coverage of the ECA countries used in the analysis. The BTI measures also allow for more nuance between countries by using a wider score range than the other two datasets.
Measuring the competitive environmentBOX 2.2
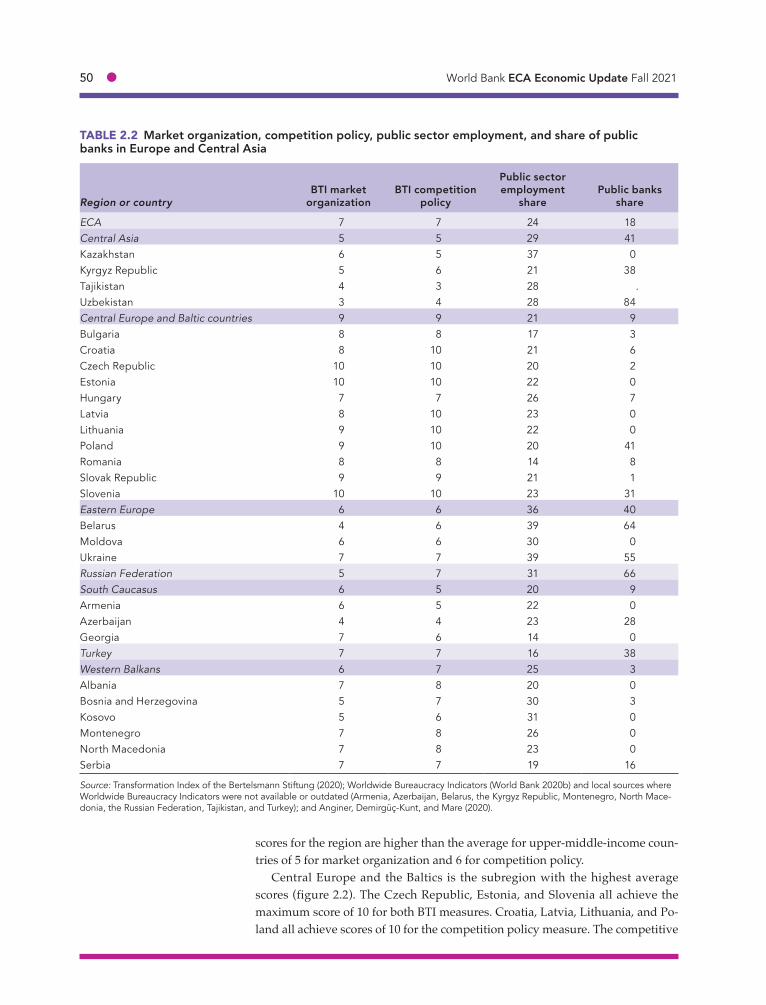
50 ● World Bank ECA Economic Update Fall 2021
TABLE 2.2 Market organization, competition policy, public sector employment, and share of public banks in Europe and Central Asia
Region or countryBTI market
organizationBTI competition
policy
Public sector employment
sharePublic banks
share
ECA 7 7 24 18Central Asia 5 5 29 41Kazakhstan 6 5 37 0Kyrgyz Republic 5 6 21 38Tajikistan 4 3 28 .Uzbekistan 3 4 28 84Central Europe and Baltic countries 9 9 21 9Bulgaria 8 8 17 3Croatia 8 10 21 6Czech Republic 10 10 20 2Estonia 10 10 22 0Hungary 7 7 26 7Latvia 8 10 23 0Lithuania 9 10 22 0Poland 9 10 20 41Romania 8 8 14 8Slovak Republic 9 9 21 1Slovenia 10 10 23 31Eastern Europe 6 6 36 40Belarus 4 6 39 64Moldova 6 6 30 0Ukraine 7 7 39 55Russian Federation 5 7 31 66South Caucasus 6 5 20 9Armenia 6 5 22 0Azerbaijan 4 4 23 28Georgia 7 6 14 0Turkey 7 7 16 38Western Balkans 6 7 25 3Albania 7 8 20 0Bosnia and Herzegovina 5 7 30 3Kosovo 5 6 31 0Montenegro 7 8 26 0North Macedonia 7 8 23 0Serbia 7 7 19 16
Source: Transformation Index of the Bertelsmann Stiftung (2020); Worldwide Bureaucracy Indicators (World Bank 2020b) and local sources where Worldwide Bureaucracy Indicators were not available or outdated (Armenia, Azerbaijan, Belarus, the Kyrgyz Republic, Montenegro, North Mace-donia, the Russian Federation, Tajikistan, and Turkey); and Anginer, Demirgüç-Kunt, and Mare (2020).
scores for the region are higher than the average for upper-middle-income coun-tries of 5 for market organization and 6 for competition policy.
Central Europe and the Baltics is the subregion with the highest average scores (figure 2.2). The Czech Republic, Estonia, and Slovenia all achieve the maximum score of 10 for both BTI measures. Croatia, Latvia, Lithuania, and Po-land all achieve scores of 10 for the competition policy measure. The competitive

Chapter 2: Competition and Firm Recovery Post-COVID-19 ● 51
environment is least developed in Central Asia, with an average score of 5 for both competition measures, with an especially weak competitive environment reported in Tajikistan and Uzbekistan. In the South Caucasus, Azerbaijan scores poorly on the competitive environment and Belarus scores poorly on market or-ganization. Turkey is at the regional average. Market organization in the Russian Federation lags the regional average.
The next two measures that may be associated with the level of competition are proxies for the size and influence of the state in the economy. Countries in which the state plays a relatively large and influential role in the economy may have weaker competition environments. The first proxy is the share of public sector employees in total employment. This share averages 24 percent in ECA and ranges from 16 percent in Turkey to 36 percent in Eastern Europe. Variations in the share are also large within some subregions. In Central Europe and the Baltics, for ex-ample, the share ranges from 14 percent in Romania to 26 percent in Hungary.
The second proxy is the share of public banks in total banking sector assets (where a public bank is a commercial bank in which the state has more than a 50 percent ownership stake). A large body of literature suggests that public banks may be subject to government influence and that their existence may distort credit allocation, introducing inefficiencies (World Bank 2012). The 18 percent average for the region masks wide variation across countries. The share is as high as 84 percent in Uzbekistan, followed by 66 percent in Russia, and 64 percent in Belarus, but 0 in 11 of the 29 countries in the sample.
Source: Transformation Index of the Bertelsmann Stiftung (2020); Worldwide Bureaucracy Indicators (World Bank 2020b) and local sources where Worldwide Bureaucracy Indicators not available or outdated (Armenia, Azerbaijan, Belarus, the Kyrgyz Republic, Montenegro, North Macedonia, the Russian Federation, Tajikistan, and Turkey); and Anginer, Demirgüç-Kunt, and Mare (2020). Note: Subregional averages based on 29 countries in ECA.
FIGURE 2.2 Market organization, competition policy, public sector employment, and share of public banks in Europe and Central Asia, by subregion
5
9
6
5
6
7
6
5
9
6
7
5
7 7
29
21
36
31
2016
25
41
9
40
66
9
38
3
0
10
20
30
40
50
60
70
0
1
2
3
4
5
6
7
8
9
10
CentralAsia
Central Europe & Baltic countries
EasternEurope
RussianFederation
SouthCaucasus
Turkey WesternBalkans
Perc
ent o
f tot
al
BTI r
atin
g
BTI market organization BTI competition policyPublic sector employment as share of total employment Public banks assets as a share of total banking assets

52 ● World Bank ECA Economic Update Fall 2021
Labor Productivity and the Competitive Environment
Productivity is key to economic growth. At the firm level, it captures how effi-ciently a firm converts inputs into outputs.
A firm’s productivity can be measured in different ways. Given the data limi-tations of Enterprise Surveys, productivity measured by straightforward factor ratios such as labor productivity provides a simple but much more robust estimate of productivity than measures of total factor productivity (World Bank 2021a).
Firms in countries with a more competitive environment tend to be more pro-ductive (figure 2.3). This relationship is especially clear when the competitive environment is captured by the BTI market organization or BTI competition pol-icy score. When measuring the competitive environment in terms of the public sector employment share or public banks’ asset share, the difference is not signifi-cant. (This analysis does not control for confounding factors, such as differences in the sectoral distribution of firms within countries, which is further explored in the section Reallocation from Less Productive to More Productive Firms.)
Source: Authors’ calculations based on latest Enterprise Surveys (for most countries, 2019) for 29 countries in ECA; Transformation Index of the Bertelsmann Stiftung (2020); Worldwide Bureaucracy Indicators (World Bank 2020b) and local sources where Worldwide Bureaucracy Indicators were not available or outdated (Armenia, Azerbaijan, Belarus, the Kyrgyz Republic, Montenegro, North Macedonia, the Russian Federation, Tajiki-stan, and Turkey); and Anginer, Demirgüç-Kunt, and Mare (2020). Note: Figure plots the distributions of log(labor productivity) across firms, using scaled survey weights, so that each country has equal weight. Low and high indicators are relative to median values, which were 6 for BTI market organization, 7 for BTI competition policy, 22.3 for the public sector employment share, and 2.6 for public banks’ share of banking assets. BTI market organization is based on responses to the question “To what level have the fundamentals of market-based competition developed?” BTI competition policy is based on the question “To what extent do safeguards exist to protect competition, and to what extent are they enforced?”
FIGURE 2.3 Labor productivity distributions in Europe and Central Asia
0
0.1
0.2
0.3
0.4
0
0.1
0.2
0.3
0.4
0
0.1
0.2
0.3
0.4
0
0.1
0.2
0.3
0.4
Den
sity
0 5 10 15 20Log(labor productivity)
Low market organization High market organization
Den
sity
0 5 10 15 20Log(labor productivity)
a. BTI market organization b. BTI competition policy
c. Public sector employment share d. Public banks share
Weak competition policy Strong competition policy
Den
sity
0 5 10 15 20Log(labor productivity)
High public employment Low public employment
Den
sity
0 5 10 15 20Log(labor productivity)
High public banks share Low public banks share
Chapter 2: Competition and Firm Recovery Post-COVID-19 ● 53
How Did Firms Weather the COVID-19 Crisis?During the COVID-19 crisis, the World Bank conducted ES COVID-19 Follow-Up Surveys around the world, covering 23 countries in ECA (see annex 2.1 for de-tails). Data for the first survey round were collected between May and November 2020. Data for the second round were collected between November 2020 and May 2021. Only 13 of 23 countries participated in both survey rounds.
The surveys ask firms about changes in performance measures, relative to 12 months earlier or since the start of the COVID-19 crisis. The sampling frame for the ES COVID-19 Follow-Up Surveys includes all firms that replied to the most recent pre-COVID-19 Enterprise Surveys, making it possible to link performance during the COVID-19 crisis back to firm characteristics collected through that survey. 3
During the first follow-up survey round, firms reported an average drop in monthly sales of 24 percent compared with one year earlier; these figures ranged from 7 percent in Latvia to 57 percent in Moldova (table 2.3).4 The average drop in sales was considerably smaller than in other regions. Apedo-Amah and others (2020) analyze data from 51 countries, including ECA. They report an average drop in sales of 49 percent across countries. In ECA, the average drop in sales re-ported during the second survey round (23 percent) was similar to that in the first survey round, suggesting that firms faced sustained revenue losses (table 2.3).
The decline in the number of permanent full-time workers (10 percent in round 1 and 13 percent in round 2) was more muted than the drop in sales (see table 2.3), a pattern that is also observed in the global data. Firms adjusted their workforces proportionally less than their drop in sales in part because they relied on other mechanisms to adjust output and labor costs, including granting leave, reducing hours, and lowering wages (Apedo-Amah and others 2020). The wide-spread use of wage subsidies in ECA likely also played a role in limiting layoffs, as discussed later in the chapter.
Table 2.3 does not report firm exit rates, because the percentage of firms that closed permanently during the COVID-19 pandemic was relatively low in ECA. Muzi and others (2021) report an average annualized exit rate of 1.9 percent across countries in ECA—a far lower rate than the 6.2 percent across other coun-tries. The relatively low exit rates in ECA may partly reflect the government as-sistance they received (see later in this chapter). Although most firms in ECA have not exited the market, there are signs of serious financial distress. In the round 2 survey, 26 percent of firms reported that they anticipated falling into ar-rears on outstanding liabilities in the next six months, with the figures ranging from 11 percent in Kazakhstan to 69 percent in Lithuania.
3. The tables and figures in this section present performance measures by survey round using all firms available in each survey round. The findings are similar when restricting the sample to firms that participated in both survey rounds.4. The figures in table 2.3 are constructed using survey weights, which are relative to the stratified distribution of establishments in the country (by sector and firms size group). They do thus not necessarily correspond to changes at the macro level. For example, the drop in sales in table 2.3 may be larger than the drop in GDP, because large firms are weighted based on their often small share of the firm size distribution in table 2.3 but tend to contribute a larger share to GDP.

54 ● World Bank ECA Economic Update Fall 2021
TABL
E 2.
3 Im
pact
of C
OVI
D-1
9 cr
isis
on fi
rms
in E
urop
e an
d Ce
ntra
l Asi
a (p
erce
nt o
f firm
s, e
xcep
t whe
re o
ther
wis
e in
dica
ted)
Perc
enta
ge c
hang
e in
mon
thly
sal
es
rela
tive
to o
ne
year
ear
lier
Perc
enta
ge
chan
ge in
num
ber
of p
erm
anen
t ful
l-tim
e w
orke
rs s
ince
D
ecem
ber 2
019
Redu
ced
num
ber
of p
erm
anen
t ful
l-tim
e w
orke
rs s
ince
D
ecem
ber 2
019
Ant
icip
ate
falli
ng
into
arr
ears
on
outs
tand
ing
liabi
litie
s in
the
ne
xt 6
mon
ths
Star
ted
or
incr
ease
d on
line
busi
ness
act
ivit
y
Star
ted
or
incr
ease
d re
mot
e w
ork
arra
ngem
ents
for
wor
kfor
ce
Reg
ion
or
cou
ntry
Roun
d 1
Roun
d 2
Roun
d 1
Roun
d 2
Roun
d 1
Roun
d 2
Roun
d 1
Roun
d 2
Roun
d 1
Roun
d 2
Roun
d 1
Roun
d 2
ECA
–24
–23
–10
–13
2836
3026
2129
2936
Cen
tral
Asi
a
Kaz
akhs
tan
–21
–12
2511
3444
Uzb
ekis
tana
–10
–11
2418
5018
Cen
tral
Eur
ope
and
Bal
tic c
ount
ries
7223
526
2054
2033
4724
Bul
gar
ia–2
4–2
3–7
–521
3622
229
1710
16
Cro
atia
–17
–19
–3–2
1220
2921
1315
2423
Cze
ch R
epub
lic–1
5–2
4–7
–819
3215
1423
2536
50
Est
onia
–13
–14
–7–1
233
4216
2021
3325
39
Hun
gar
y–1
5–1
4–4
–620
2126
1611
1527
27
Latv
ia–7
–27
–13
–64
6666
1040
1439
3028
Lith
uani
a–1
7–3
2–7
–13
3745
8469
2531
3048
Pola
nd–1
9–1
7–5
–522
2817
2717
3420
35
Rom
ania
–18
–14
–9–1
131
4657
3613
2120
29
Slov
ak R
epub
lic–1
4–2
6–7
–10
2937
3232
1226
2939
Slov
enia
–18
–15
–8–4
3341
2522
1625
3240
(con
tinue
d ne
xt p
age)

Chapter 2: Competition and Firm Recovery Post-COVID-19 ● 55
Perc
enta
ge c
hang
e in
mon
thly
sal
es
rela
tive
to o
ne
year
ear
lier
Perc
enta
ge
chan
ge in
num
ber
of p
erm
anen
t ful
l-tim
e w
orke
rs s
ince
D
ecem
ber 2
019
Redu
ced
num
ber
of p
erm
anen
t ful
l-tim
e w
orke
rs s
ince
D
ecem
ber 2
019
Ant
icip
ate
falli
ng
into
arr
ears
on
outs
tand
ing
liabi
litie
s in
the
ne
xt 6
mon
ths
Star
ted
or
incr
ease
d on
line
busi
ness
act
ivit
y
Star
ted
or
incr
ease
d re
mot
e w
ork
arra
ngem
ents
for
wor
kfor
ce
Reg
ion
or
cou
ntry
Roun
d 1
Roun
d 2
Roun
d 1
Roun
d 2
Roun
d 1
Roun
d 2
Roun
d 1
Roun
d 2
Roun
d 1
Roun
d 2
Roun
d 1
Roun
d 2
East
ern
Euro
pe
Bel
arus
–19
–426
1832
40
Mol
dov
a–5
7–2
9–2
0–1
714
3856
3832
4036
45
Russ
ian
Fed
erat
ion
–28
1815
5355
Sout
h C
auca
sus
Arm
enia
–24
–18
3717
4041
Aze
rbai
jan
–41
–20
2823
6370
Geo
rgia
–47
–29
–37
–18
2631
2835
2736
4552
Turk
eya
–31
–23
–13
1121
2721
4741
3422
Wes
tern
Bal
kans
Alb
ania
–52
–15
2839
1814
Bos
nia
and
Her
zeg
ovin
a–1
6–8
4416
824
Kos
ovoa
–49
–312
4427
8
Mon
tene
gro
–30
–11
3226
196
Nor
th M
aced
onia
–31
–12
3626
2414
Serb
ia–1
7–2
2314
2421
Sour
ce: A
utho
rs’ c
alcu
latio
ns b
ased
on
ES C
OVI
D-1
9 Fo
llow
-Up
Surv
eys
and
Bus
ines
s Pu
lse
Surv
ey.
Not
e: E
CA
ave
rage
s ar
e ba
sed
on d
ata
from
the
ES C
OVI
D-1
9 Fo
llow
-Up
Surv
eys.
Firm
-leve
l res
pons
es fr
om th
e ES
CO
VID
-19
Follo
w-U
p Su
rvey
s ar
e ag
greg
ated
to th
e co
untr
y-le
vel u
sing
wei
ghts
an
d th
en (s
impl
e) a
vera
ged
acro
ss c
ount
ries.
BPS
dat
a fo
r Kos
ovo
and
Turk
ey o
n pe
rcen
tage
cha
nge
in n
umbe
r of w
orke
rs in
clud
es b
oth
full-
time
and
part
-tim
e w
orke
rs a
nd fo
r Kos
ovo,
Tur
key,
and
U
zbek
ista
n th
e pe
rcen
tage
cha
nge
is re
lativ
e to
a b
asel
ine
in 2
020,
not
Dec
embe
r 201
9. B
PS d
ata
for s
tart
ed o
r inc
reas
ed re
mot
e w
ork
arra
ngem
ents
for w
orkf
orce
are
bas
ed o
n a
surv
ey q
uest
ion
on s
hare
of w
orke
rs c
urre
ntly
wor
king
rem
otel
y fro
m h
ome.
a.
Res
ults
are
from
BPS
dat
a, w
hich
are
not
dire
ctly
com
para
ble
to d
ata
in th
e ES
CO
VID
-19
Follo
w-U
p Su
rvey
s, a
s th
e B
PS s
ampl
ed a
diff
eren
t, no
nrep
rese
ntat
ive
sam
ple
of fi
rms.
TABL
E 2.
3 (c
ontin
ued)

56 ● World Bank ECA Economic Update Fall 2021
To respond to the crisis, 29 percent of firms started or increased online busi-ness activity, and 36 percent started or increased remote work arrangements (ta-ble 2.3). These changes show initiative to adapt to the economic environment, but they may provide limited help with weathering the crisis, as among firms that made these changes, the average percentage of online sales was just 8 percent and the average share of the workforce working remotely was just 7 percent.
Most firms use digital technologies for marketing and sales purposes, with fewer firms introducing production planning and supply chain management tools. Box 2.3 presents data on adoption of digital technology by business function.
Which Firms Were Hit Harder by the COVID-19 Crisis?
In other regions, the COVID-19 crisis hit smaller firms harder than larger firms (see De Nicola and others 2021 on East Asia and Pacific and Brucal, Grover, and Reyes Ortega 2021 on South Asia). This pattern is also evident in ECA (figure 2.4). Small firms experienced larger drops in sales than large firms. They also reported larger percentage drops in employment, although these numbers may be skewed, as firm size is defined in terms of number of employees. For firms with fewer employees, any lost job translates into a bigger percentage change. Small firms
Movement restrictions associated with the COVID-19 crisis increased firms’ use of digital technology. For example, digital platforms facilitated online ordering and home delivery in sectors that typi-cally relied on intense face-to-face interactions with consumers, including food services and retail (Hallward-Driemeier and others 2020). The increased digitalization may lead to lasting pro-ductivity gains (Apedo-Amah and others 2020), but adoption has not been even across types of technology and firm size.
Among firms in eight ECA countries that increased their use of digital technology, most did so for marketing and sales purposes, followed by payments methods and service delivery, business administration, and production planning and sup-ply chain management (figure B2.3.1).
Larger firms were more likely than smaller firms to adopt digital technology for all business func-
tions, except payment methods and service deliv-ery. Digital technology for payment methods and service delivery may be easier to adopt for smaller firms because it does not involve large investments and fixed costs, making it less reliant on econo-mies of scale and access to finance. In contrast, increased use of digital technology in production and supply chain management typically requires significant financial investment, managerial capac-ity, and complementary skills, so it is not surpris-ing that large firms were more likely to adopt these technologies.
Overall, these patterns suggest that firms used digital technologies to boost sales and facilitate payments to deal with the logistical challenged posed by the COVID-19 crisis. However, fewer firms, particularly small firms, used the crisis as an opportunity to introduce digital technology for pro-duction planning and supply chain management.
Firms’ adoption of digital technology during the COVID-19 crisis
BOX 2.3
(Continued next page)

Chapter 2: Competition and Firm Recovery Post-COVID-19 ● 57
were slightly less likely to reduce the number of permanent workers than large firms. They appear to face greater difficulties recovering from the crisis, however. In the second ES COVID-19 Follow-Up Survey round, 28 percent of small firms expected to fall into arrears on outstanding liabilities (compared with 29 percent in round 1); among large firms, the figure dropped to 19 percent (from 26 percent in round 1). Small firms were only half as likely to have increased remote work as large firms, possibly because large firms are more likely to have specialized administrative staff that perform tasks that can be done from home.
Firms in the retail sector reported smaller drops in sales and employment than firms in the manufacturing or services sector in round 1 (figure 2.5). However, al-though sales recovered somewhat in the manufacturing sector and stayed about the same in the services sector between round 1 and 2, they dropped in the retail sector. In round 2, firms in all sectors reported similar expectations of falling into arrears.
The youngest firms experienced the largest drops in sales and employment (figure 2.6). They were also most likely to expect to fall into arrears. They were more likely than older firms to adapt to the crisis by increasing their online busi-ness activity.
Firms with male and female top managers experienced similar initial drops in sales (24 percent) (figure 2.7). However, female-run businesses had greater diffi-culty recovering from the crisis. Among firms with female top managers, the
(continued)BOX 2.3
Source: Business Pulse Surveys for eight ECA countries (Bulgaria, Kosovo, the Kyrgyz Republic, Poland, Romania, Tajikistan, Turkey, and Uzbekistan).Note: The figure includes only firms that reported increasing their use of digital technology during the COVID-19 crisis. Firm size is defined in terms of the number of employees.
FIGURE B2.3.1 Increase in use of digital technologies by firms in Europe and Central Asia, by function and firm size
30 3340
43
1623
3035
46
6268
75
48 45 44 42
0
10
20
30
40
50
60
70
80
Mic
ro (0
-4)
Smal
l (5-
19)
Med
ium
(20-
99)
Larg
e (1
00+)
Mic
ro (0
-4)
Smal
l (5-
19)
Med
ium
(20-
99)
Larg
e (1
00+)
Mic
ro (0
-4)
Smal
l (5-
19)
Med
ium
(20-
99)
Larg
e (1
00+)
Mic
ro (0
-4)
Smal
l (5-
19)
Med
ium
(20-
99)
Larg
e (1
00+)
Businessadministration
Production planning& supply chain
Marketing and sales Payment methodsand service delivery
Perc
ent o
f firm
s th
at in
crea
sed
thei
r use
of
digi
tal t
echn
olog
y du
ring
the
COVI
D-1
9 cr
isis

58 ● World Bank ECA Economic Update Fall 2021
Sources: Authors’ calculations based on ES COVID-19 Follow-Up Surveys and Enterprise Surveys for 23 countries in ECA.Note: Firm size is defined in terms of the number of employees. Small firms have 5–19, medium-size firms have 20–99, and large firms have 100 or more. Firm-level responses were aggregated to the country-firm size level using weights and then (simple) averaged across countries. Round 1 re-fers to surveys conducted in 17 countries in ECA between May and November 2020. Round 2 refers to surveys conducted in 19 countries in ECA between November 2020 and May 2021. The countries included in the two rounds differ.
FIGURE 2.4 Changes by firms in Europe and Central Asia during the COVID-19 crisis, by firm size
a. Change in monthly sales comparedwith one year ago
b. Change in number of permanent, full-time workers since December 2019
e. Percent of firms that started or increasedonline business activity
f. Percent of firms that started or increased remote work
c. Percent of firms that decreased number of permanent workers since December 2019
d. Percent of firms that anticipate falling into arrears on outstanding liabilities
−25−23
−17
−25
−19
−14
–30
–25
–20
–15
–10
–5
0
Small Medium Large
Perc
enta
ge c
hang
e ov
er p
ast
12 m
onth
s
Small Medium Large
–11
–9–10
–15
–10
–6
–16
–14
–12
–10
–8
–6
–4
–2
0
Perc
enta
ge c
hang
e si
nce
Dec
embe
r 201
9
26
32
373538 38
0
5
10
15
20
25
30
35
40
Small Medium Large
Perc
ent o
f firm
s
2933
2628
2319
0
5
10
15
20
25
30
35
Small Medium Large
Perc
ent o
f firm
s
21 22 21
2730
33
0
5
10
15
20
25
30
35
Small Medium Large
Perc
ent o
f firm
s
25
33
52
31
41
66
0
10
20
30
40
50
60
70
Small Medium Large
Perc
ent o
f firm
s
Round 1 Round 2 Round 1 Round 2
Round 1 Round 2Round 1 Round 2
Round 1 Round 2Round 1 Round 2
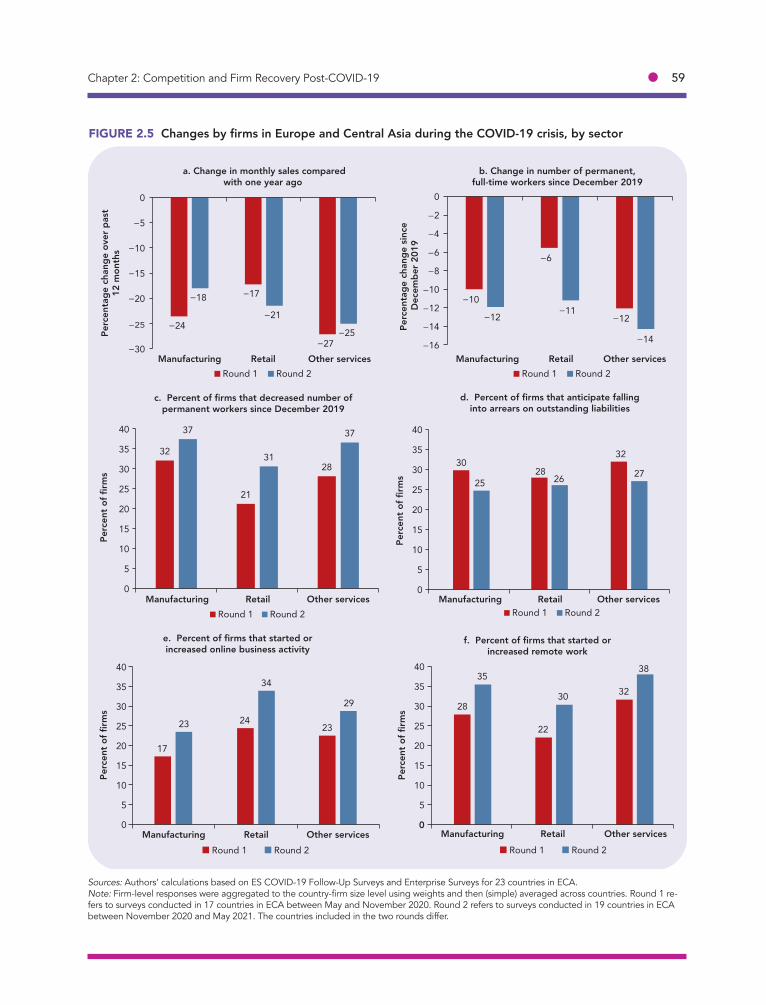
Chapter 2: Competition and Firm Recovery Post-COVID-19 ● 59
Sources: Authors’ calculations based on ES COVID-19 Follow-Up Surveys and Enterprise Surveys for 23 countries in ECA.Note: Firm-level responses were aggregated to the country-firm size level using weights and then (simple) averaged across countries. Round 1 re-fers to surveys conducted in 17 countries in ECA between May and November 2020. Round 2 refers to surveys conducted in 19 countries in ECA between November 2020 and May 2021. The countries included in the two rounds differ.
−24
−17
−27
−18
−21
−25
−30
−25
−20
−15
−10
−5
0
Manufacturing Retail Other services
Perc
enta
ge c
hang
e ov
er p
ast
12 m
onth
s
Perc
enta
ge c
hang
e si
nce
Dec
embe
r 201
9
Round 1 Round 2Manufacturing Retail Other services
Round 1 Round 2
−10
−6
−12−12−11
−14−16
−14
−12
−10
−8
−6
−4
−2
0
FIGURE 2.5 Changes by firms in Europe and Central Asia during the COVID-19 crisis, by sector
a. Change in monthly sales comparedwith one year ago
b. Change in number of permanent,full-time workers since December 2019
c. Percent of firms that decreased number ofpermanent workers since December 2019
d. Percent of firms that anticipate fallinginto arrears on outstanding liabilities
e. Percent of firms that started orincreased online business activity
f. Percent of firms that started orincreased remote work
32
21
28
37
31
37
0
5
10
15
20
25
30
35
40
Manufacturing Retail Other services
Perc
ent o
f firm
s
Round 1 Round 2
3028
32
25 26 27
0
5
10
15
20
25
30
35
40
Manufacturing Retail Other services
Perc
ent o
f firm
s
Round 1 Round 2
17
242323
34
29
0
5
10
15
20
25
30
35
40
Manufacturing Retail Other services
Perc
ent o
f firm
s
Round 1 Round 2 Round 1 Round 2
28
22
3235
30
38
0
5
10
15
20
25
30
35
40
Manufacturing Retail Other services
Perc
ent o
f firm
s

60 ● World Bank ECA Economic Update Fall 2021
Sources: Authors’ calculations based on ES COVID-19 Follow-Up Surveys and Enterprise Surveys for 23 countries in ECA.Note: Firm-level responses were aggregated to the country-firm size level using weights and then (simple) averaged across countries. Round 1 re-fers to surveys conducted in 17 countries in ECA between May and November 2020. Round 2 refers to surveys conducted in 19 countries in ECA between November 2020 and May 2021. The countries included in the two rounds differ. `
−26−24 −24
−30
−22 −22
−35
−30
−25
−20
−15
−10
−5
0
Less than 10 10–20 More than 20Firm age (years)
Firm age (years) Firm age (years)
Firm age (years)Firm age (years)
Firm age (years)Round 1 Round 2
Less than 10 10–20 More than 20
Round 1 Round 2
−14
−11
−8
−15−14
−10
−16
−14
−12
−10
−8
−6
−4
−2
0
Perc
enta
ge c
hang
e ov
er p
ast 1
2 m
onth
s
Perc
enta
ge c
hang
e si
nce
Dec
embe
r 201
9
FIGURE 2.6 Changes by firms in Europe and Central Asia during the COVID-19 crisis, by firm age
a. Change in monthly salescompared with one year ago
b. Change in number of permanent,full-time workers since December 2019
c. Percent of firms that decreased number ofpermanent workers since December 2019
d. Percent of firms that anticipate falling intoarrears on outstanding liabilities
e. Percent of firms that started orincreased online business activity
f. Percent of firms that started orincreased remote work
3027 28
3734 34
0
5
10
15
20
25
30
35
40
Less than 10 10–20 More than 20
Perc
ent o
f firm
s
Round 1 Round 2 Round 1 Round 2
36
3028
34
2523
0
5
10
15
20
25
30
35
40
Less than 10 More than 2010–20
26
20 20
33
28 28
0
5
10
15
20
25
30
35
Less than 10 10–20 More than 20
Perc
ent o
f firm
s
Perc
ent o
f firm
sPe
rcen
t of f
irms
Round 1 Round 2 Round 1 Round 2
27 2730
3633
38
0
5
10
15
20
25
30
35
40
Less than 10 10–20 More than 20

Chapter 2: Competition and Firm Recovery Post-COVID-19 ● 61
Sources: Authors’ calculations based on ES COVID-19 Follow-Up Surveys and Enterprise Surveys for 23 countries in ECA.Note: Firm-level responses were aggregated to the country-firm size level using weights and then (simple) averaged across countries. Round 1 re-fers to surveys conducted in 17 countries in ECA between May and November 2020. Round 2 refers to surveys conducted in 19 countries in ECA between November 2020 and May 2021. The countries included in the two rounds differ.
FIGURE 2.7 Changes by firms in Europe and Central Asia during the COVID-19 crisis, by gender of top manager
a. Change in monthly salescompared with one year ago
c. Percent of firms that decreased number ofpermanent workers since December 2019
e. Percent of firms that started orincreased online business activity
b. Change in number of permanent,full-time workers since December 2019
d. Percent of firms that anticipate falling intoarrears on outstanding liabilities
f. Percent of firms that started orincreased remote work
−24 −24−21
−30−35
−30
−25
−20
−15
−10
−5
0
Male top manager Female top managerPerc
enta
ge c
hang
e ov
er p
ast 1
2 m
onth
s
Round 1 Round 2
Round 1 Round 2
Male top manager Female top manager
Round 1 Round 2
−10−12−12
−16
−20
−15
−10
−5
0
Perc
enta
ge c
hang
e si
nce
Dec
embe
r 201
9
28 29
3539
0
10
20
30
40
50
Male top manager Female top manager
Round 1 Round 2
Male top manager Female top manager
Round 1 Round 2
Male top manager Female top manager
Round 1 Round 2
Male top manager Female top manager
Perc
ent o
f firm
s
30 31
2528
0
5
10
15
20
25
30
35
Perc
ent o
f firm
s
2220
28 29
0
5
10
15
20
25
30
35
Perc
ent o
f firm
s
29
25
37
32
0
10
20
30
40
Perc
ent o
f firm
s

62 ● World Bank ECA Economic Update Fall 2021
drop in sales increased to 30 percent in the second survey round. In contrast, it dropped to 21 percent in firms with male top managers. Female-run businesses were also slightly more likely to anticipate falling into arrears than male-run businesses (28 percent versus 25 percent).
Overall, smaller and younger firms were hit harder by the COVID-19 crisis than larger and older firms. Smaller, younger, and female-run businesses did not see their sales improve after the initial drop. These businesses are the ones most likely to anticipate falling into arrears; insolvencies may be more common in these types of firms.
Reallocation from Less Productive to More Productive FirmsEconomic crises can be devastating for many firms, but they may also have a silver lining. Crises can play a cleansing role, by speeding up the reallocation of economic activity from less productive to more productive firms, leading to greater productivity and economic growth in the longer run. Schumpeter called this reallocation process “creative destruction” (Schumpeter 1942), arguing that “depressions are not simply evils, which we might attempt to suppress, but—perhaps undesirable—forms of something which has to be done, namely, adjust-ment to previous economic change” (Schumpeter 1934, 16).
Creative destruction occurs in part because, in an economic downturn, less productive firms that use outdated technology can more easily become unprofit-able and get pushed out of the market than firms that innovated (Caballero and Hammour 1994). It is not obvious whether this pattern of creative destruction will emerge from the COVID-19 crisis or whether the crisis will instead result in widespread destruction (Bosio and others 2020; De Nicola and others 2021). This crisis is unusual in that it imposed multiple large shocks on most firms, including supply, demand, uncertainty, and financial shocks (World Bank 2021c). One way firms have responded has been to rely increasingly on information technology, which may amplify preexisting patterns of technology adoption and innovation.
The evidence in this section suggests that economic activity in ECA was real-located toward more productive firms during the crisis, consistent with creative destruction. Tables 2.4–2.7 examine the relationship between firms’ pre-crisis la-bor productivity (measured as sales per worker in 2019) and firm performance during the crisis, controlling for the following firm characteristics: size, age, gen-der of the top manager, location of main market, and sector. The analysis also includes interaction terms between labor productivity and country-level mea-sures of competition, to examine whether the relationship between labor produc-tivity and firm performance during the crisis varied with market competition. The country-level measures of competition are de-meaned, so that a value of zero corresponds to the average value of competition across countries. The coeffi-cients on labor productivity in tables 2.4–2.7 thus represent the relationship be-tween productivity and firm performance for a country with the average value of competition. These coefficients show that firms with high pre-crisis labor

Chapter 2: Competition and Firm Recovery Post-COVID-19 ● 63
productivity experienced smaller drops in sales and employment than firms with low pre-crisis labor productivity. More productive firms were also more likely to adapt to the crisis by increasing online activity and remote work.
The magnitudes of the coefficients on labor productivity in tables 2.4–2.7 re-veal that firms in the 10th percentile of the pre-crisis labor productivity distribu-tion experienced a 12-percentage point larger drop in sales and a 9-percentage point larger drop in employment than firms in the 90th percentile. These firms were also 14 percentage points less likely to have increased remote work than firms in the 90th percentile. Firms in the 10th percentile of the pre-crisis labor productivity distribution were 11 percentage points more likely to anticipate fall-ing into arrears than firms in the 90th percentile.
Confirmed exit rates in ECA were low during the COVID-19 crisis (annual-ized 1.9 percent on average). However, a measure of assumed exit that includes both confirmed closures and firms that could not be reached for the follow-up survey is about three times higher (box 2.4). Analysis by Muzi and others (2021) using this assumed upper-bound exit measure suggests that less productive firms were more likely to exit during the COVID-19 crisis.
These results suggest that economic activity in ECA was reallocated toward more productive firms during the COVID-19 crisis. This reallocation may in-crease if more of the least productive firms become insolvent and exit. However,
Is the economic crisis induced by the COVID-19 pandemic “cleansing” out unproductive firms, in line with the creative destruction process postu-lated by Schumpeter (1939)? Or is the crisis dis-placing productive firms, undermining long-run productivity growth?
Muzi and others (2021) use World Bank Enter-prise Surveys from 2019 and 2020 along with the follow-up surveys conducted since the outbreak of the pandemic to assess the effect of COVID-19 on business closures.
The authors created two measures of exit: (a) a conservative measure, consisting only of con-firmed permanently closed businesses, and (b) a measure of assumed exit that also includes firms that could not be reached during fieldwork. The average annualized exit rate in the ECA region was 1.9 percent for the first measure and 6.8 per-cent for the second. Exit rates vary significantly across countries. Confirmed exits ranged from 0.07 percent in Slovenia to 5.3 percent in Bulgaria.
Assumed exit rates ranged from 0.4 percent in Montenegro to 14.3 percent in Romania.
Assumed exit rates were regressed on pre-COVID-19 labor productivity (measured as sales per worker), while controlling for several firm char-acteristics. The results of this global analysis point to a Schumpeterian cleansing process in which less productive firms were more likely to perma-nently shut down than other firms.
Replicating the regressions for 20 ECA coun-tries leads to consistent results with the global analysis (table B2.4.1). The coefficient on sales per worker implies that moving from the 10th percen-tile of labor productivity to the 90th percentile is associated with a 4.2 percentage point drop in the likelihood of exiting. Firms that survived the COVID-19 crisis also tended to be older. Before the COVID-19 crisis, survivors were less likely to spend time dealing with regulations, more likely to have their own website, and more likely to innovate.
Productivity and firm exit during the COVID-19 crisisBOX 2.4
(Continued next page)

64 ● World Bank ECA Economic Update Fall 2021
the destruction of jobs will have a silver lining only if it is followed by increased job creation in more productive firms during the recovery (Caballero and Ham-mour 2005). An appropriate competition environment and regulation may facili-tate both exit and job creation.
The Role of Competition
Competition is an important source of creative destruction (Caballero 2008). When markets are competitive, resources are allocated to the most efficient, most innovative firms, which can adapt to change, rather than to entrenched, con-nected firms. The competition environment also affects the pace of reallocation during a crisis. Evidence from the United States suggests that firms respond more sluggishly to reallocation shocks now than they did decades ago and that regula-tory barriers to business entry and expansion are important reasons for the in-creased sluggishness (Barrero, Bloom, and Davis 2020).
TABLE B2.4.1 Correlation between firm exit and labor productivity
Permanent exit (assumed measure)
Sales per worker (log)
–0.019***(0.005)
–0.017***(0.005)
–0.018***(0.005)
–0.016***(0.005)
–0.016***(0.005)
Age of firm (log) –0.032***(0.009)
–0.031***(0.010)
–0.030***(0.010)
–0.031***(0.010)
Senior management spent time on dealing with regulations (yes = 1, no = 0)
0.029*(0.014)
0.034**(0.014)
0.034**(0.014)
Has its own website (yes = 1, no = 0
–0.033***(0.015)
–0.030***(0.014)
Introduced product innovation (yes = 1, no = 0)
–0.029**(0.015)
–0.033***(0.013)
Number of observations 9,570 9,477 8,017 7,967 7,844
Source: Based on Muzi and others (2021).Note: The table shows logistic regressions. Coefficients are marginal effects. Regressions include sector and country fixed effects as well as firm characteristics (not reported in the table for brevity). Huber-White robust standard errors are in parenthesis and clustered at the sampling region and sector level. Sample size varies because of nonresponse. *** p < 0.01, ** p < 0.05, * p < 0.1.
(continued)BOX 2.4
This analysis provides evidence of a higher likelihood of exit among less productive firms more than a year after the start of the pandemic. Much remains to be learned about the recovery
process. As more data become available, issues such as growth and job creation in surviving firms and the characteristics of new entrants should be explored.

Chapter 2: Competition and Firm Recovery Post-COVID-19 ● 65
The importance of competition has been evident during the COVID-19 crisis. The coefficients on the interaction terms in tables 2.4 and 2.5 show how the rela-tionship between labor productivity and firm performance depends on market competition. For example, the positive coefficient on “Log(labor productivity)*BTI market organization” in the first column of table 2.4 indicates that the relation-ship between labor productivity and the drop in sales was stronger in countries with greater competition. Overall, the coefficients on the interaction terms in ta-bles 2.4 and 2.5 suggest that in ECA countries with more competitive markets and stronger policies that protect competition, there was more reallocation of eco-nomic activity from less productive to more productive firms. A robustness check using 14 countries for which the PMR index is available shows similar results. The results are also robust to controlling for country-sector fixed effects instead of separate country and sector fixed effects.
TABLE 2.4 Correlation between firm performance, labor productivity, and BTI market organization in Europe and Central Asia
Percentage change in
sales
Percentage change in
employmentDecreased
employment
Anticipate falling into
arrears
Increased online
activityIncreased
remote work
Log(labor productivity) 3.998*** 2.908*** –3.016*** –3.474*** 1.487* 4.413***
(0.527) (0.909) (0.891) (0.797) (0.824) (1.354)
Log(labor productivity) * BTImarket organization
0.831** 0.087 –1.699*** –1.217*** 0.094 1.274*
(0.376) (0.505) (0.446) (0.385) (0.393) (0.677)
Log(number of employees) 3.001*** 2.151*** 2.877** –1.638*** 1.373 6.799***
(0.646) (0.784) (1.135) (0.557) (0.938) (1.057)
Log(firm age) 0.688 1.533 –1.940 –3.648 –2.032** 0.290
(1.626) (1.513) (1.765) (2.226) (1.036) (1.710)
Top manager female dummy –7.314*** –3.951* 3.781* 1.635 1.180 0.352
(1.966) (2.071) (2.286) (2.532) (3.528) (2.111)
National market dummy 5.005*** 3.812*** –2.424 0.817 7.971*** 12.082***
(1.295) (1.412) (1.988) (2.295) (2.188) (1.976)
International market dummy 3.469 2.331 1.630 –5.241* 1.912 9.850***
(2.511) (1.878) (3.040) (2.770) (2.631) (3.361)
Constant –75.213*** –56.888*** 70.656*** 82.568*** 3.244 –42.545***
(5.933) (9.439) (9.894) (10.600) (8.797) (13.804)
R2 0.136 0.116 0.069 0.111 0.085 0.167
Number of observations 7,982 6,962 7,976 7,620 8,303 8,210
Source: Authors’ calculations based on most recent ES COVID-19 Follow-Up Surveys and Enterprise Surveys for 23 countries in ECA and Transfor-mation Index of the Bertelsmann Stiftung (2020).Note: Regressions include sector and country fixed effects. BTI market organization is based on responses to the question “To what level have the fundamentals of market-based competition developed?” Change in employment is not available for the Russian Federation. BTI market organiza-tion is centered on its mean to facilitate interpretation of the coefficients. Standard errors are clustered at the country level. *** p < 0.01, ** p < 0.05, * p < 0.1.
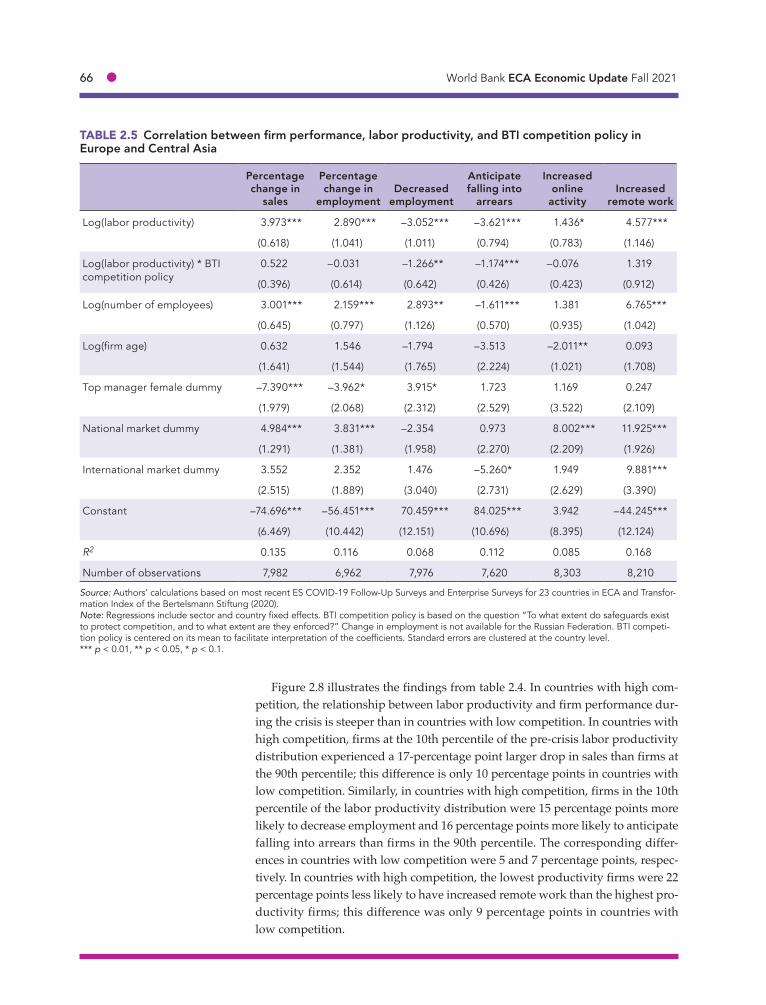
66 ● World Bank ECA Economic Update Fall 2021
Figure 2.8 illustrates the findings from table 2.4. In countries with high com-petition, the relationship between labor productivity and firm performance dur-ing the crisis is steeper than in countries with low competition. In countries with high competition, firms at the 10th percentile of the pre-crisis labor productivity distribution experienced a 17-percentage point larger drop in sales than firms at the 90th percentile; this difference is only 10 percentage points in countries with low competition. Similarly, in countries with high competition, firms in the 10th percentile of the labor productivity distribution were 15 percentage points more likely to decrease employment and 16 percentage points more likely to anticipate falling into arrears than firms in the 90th percentile. The corresponding differ-ences in countries with low competition were 5 and 7 percentage points, respec-tively. In countries with high competition, the lowest productivity firms were 22 percentage points less likely to have increased remote work than the highest pro-ductivity firms; this difference was only 9 percentage points in countries with low competition.
TABLE 2.5 Correlation between firm performance, labor productivity, and BTI competition policy in Europe and Central Asia
Percentage change in
sales
Percentage change in
employmentDecreased
employment
Anticipate falling into
arrears
Increased online
activityIncreased
remote work
Log(labor productivity) 3.973*** 2.890*** –3.052*** –3.621*** 1.436* 4.577***
(0.618) (1.041) (1.011) (0.794) (0.783) (1.146)
Log(labor productivity) * BTIcompetition policy
0.522 –0.031 –1.266** –1.174*** –0.076 1.319
(0.396) (0.614) (0.642) (0.426) (0.423) (0.912)
Log(number of employees) 3.001*** 2.159*** 2.893** –1.611*** 1.381 6.765***
(0.645) (0.797) (1.126) (0.570) (0.935) (1.042)
Log(firm age) 0.632 1.546 –1.794 –3.513 –2.011** 0.093
(1.641) (1.544) (1.765) (2.224) (1.021) (1.708)
Top manager female dummy –7.390*** –3.962* 3.915* 1.723 1.169 0.247
(1.979) (2.068) (2.312) (2.529) (3.522) (2.109)
National market dummy 4.984*** 3.831*** –2.354 0.973 8.002*** 11.925***
(1.291) (1.381) (1.958) (2.270) (2.209) (1.926)
International market dummy 3.552 2.352 1.476 –5.260* 1.949 9.881***
(2.515) (1.889) (3.040) (2.731) (2.629) (3.390)
Constant –74.696*** –56.451*** 70.459*** 84.025*** 3.942 –44.245***
(6.469) (10.442) (12.151) (10.696) (8.395) (12.124)
R2 0.135 0.116 0.068 0.112 0.085 0.168
Number of observations 7,982 6,962 7,976 7,620 8,303 8,210
Source: Authors’ calculations based on most recent ES COVID-19 Follow-Up Surveys and Enterprise Surveys for 23 countries in ECA and Transfor-mation Index of the Bertelsmann Stiftung (2020).Note: Regressions include sector and country fixed effects. BTI competition policy is based on the question “To what extent do safeguards exist to protect competition, and to what extent are they enforced?” Change in employment is not available for the Russian Federation. BTI competi-tion policy is centered on its mean to facilitate interpretation of the coefficients. Standard errors are clustered at the country level. *** p < 0.01, ** p < 0.05, * p < 0.1.
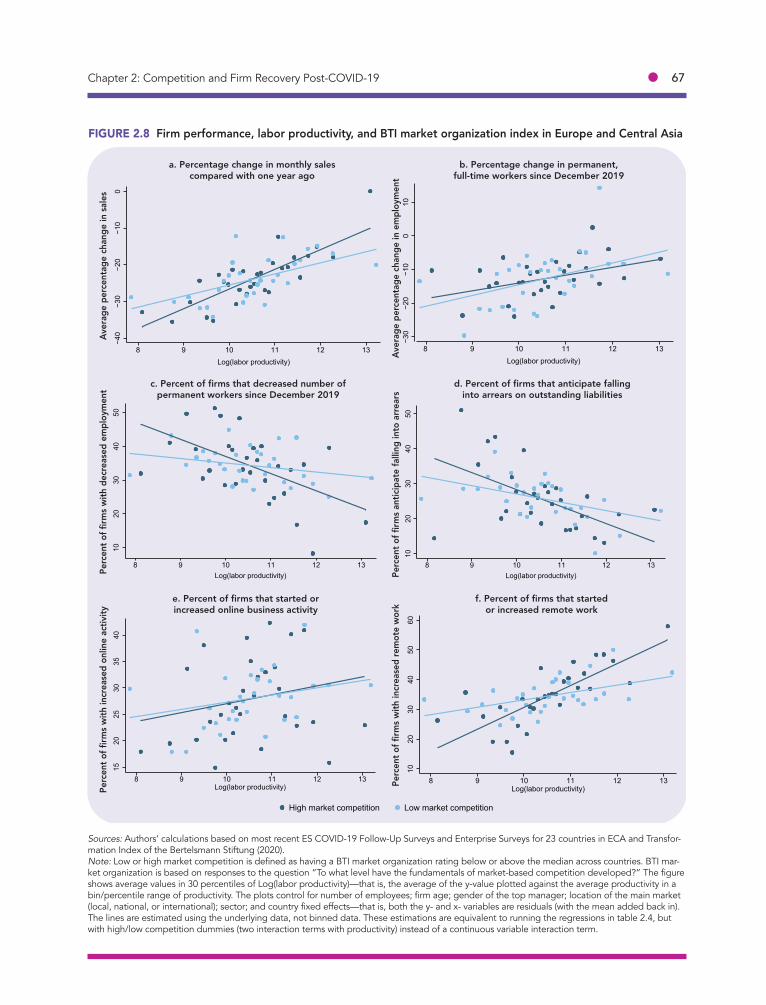
Chapter 2: Competition and Firm Recovery Post-COVID-19 ● 67
FIGURE 2.8 Firm performance, labor productivity, and BTI market organization index in Europe and Central Asia
f. Percent of firms that startedor increased remote work
e. Percent of firms that started orincreased online business activity
d. Percent of firms that anticipate fallinginto arrears on outstanding liabilities
c. Percent of firms that decreased number ofpermanent workers since December 2019
b. Percentage change in permanent,full-time workers since December 2019
a. Percentage change in monthly salescompared with one year ago
Aver
age
perc
enta
ge c
hang
e in
sale
sPe
rcen
t of f
irms w
ith d
ecre
ased
em
ploy
men
tPe
rcen
t of f
irms w
ith in
crea
sed
onlin
e ac
tivity
Perc
ent o
f firm
s with
incr
ease
d re
mot
e w
ork
Perc
ent o
f firm
s ant
icipa
te fa
lling
into
arr
ears
Aver
age
perc
enta
ge c
hang
e in
em
ploy
men
t
Sources: Authors’ calculations based on most recent ES COVID-19 Follow-Up Surveys and Enterprise Surveys for 23 countries in ECA and Transfor-mation Index of the Bertelsmann Stiftung (2020).Note: Low or high market competition is defined as having a BTI market organization rating below or above the median across countries. BTI mar-ket organization is based on responses to the question “To what level have the fundamentals of market-based competition developed?” The figure shows average values in 30 percentiles of Log(labor productivity)—that is, the average of the y-value plotted against the average productivity in a bin/percentile range of productivity. The plots control for number of employees; firm age; gender of the top manager; location of the main market (local, national, or international); sector; and country fixed effects—that is, both the y- and x- variables are residuals (with the mean added back in). The lines are estimated using the underlying data, not binned data. These estimations are equivalent to running the regressions in table 2.4, but with high/low competition dummies (two interaction terms with productivity) instead of a continuous variable interaction term.
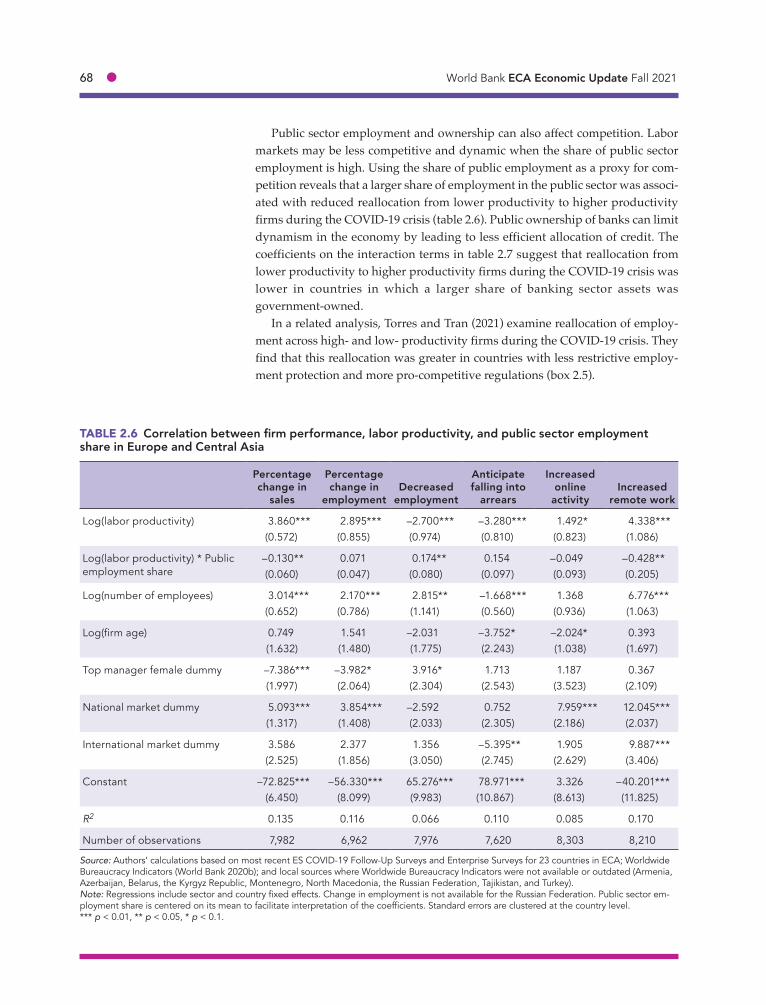
68 ● World Bank ECA Economic Update Fall 2021
Public sector employment and ownership can also affect competition. Labor markets may be less competitive and dynamic when the share of public sector employment is high. Using the share of public employment as a proxy for com-petition reveals that a larger share of employment in the public sector was associ-ated with reduced reallocation from lower productivity to higher productivity firms during the COVID-19 crisis (table 2.6). Public ownership of banks can limit dynamism in the economy by leading to less efficient allocation of credit. The coefficients on the interaction terms in table 2.7 suggest that reallocation from lower productivity to higher productivity firms during the COVID-19 crisis was lower in countries in which a larger share of banking sector assets was government-owned.
In a related analysis, Torres and Tran (2021) examine reallocation of employ-ment across high- and low- productivity firms during the COVID-19 crisis. They find that this reallocation was greater in countries with less restrictive employ-ment protection and more pro-competitive regulations (box 2.5).
TABLE 2.6 Correlation between firm performance, labor productivity, and public sector employment share in Europe and Central Asia
Percentage change in
sales
Percentage change in
employmentDecreased
employment
Anticipate falling into
arrears
Increased online
activityIncreased
remote work
Log(labor productivity) 3.860*** 2.895*** –2.700*** –3.280*** 1.492* 4.338***(0.572) (0.855) (0.974) (0.810) (0.823) (1.086)
Log(labor productivity) * Publicemployment share
–0.130** 0.071 0.174** 0.154 –0.049 –0.428**(0.060) (0.047) (0.080) (0.097) (0.093) (0.205)
Log(number of employees) 3.014*** 2.170*** 2.815** –1.668*** 1.368 6.776***(0.652) (0.786) (1.141) (0.560) (0.936) (1.063)
Log(firm age) 0.749 1.541 –2.031 –3.752* –2.024* 0.393(1.632) (1.480) (1.775) (2.243) (1.038) (1.697)
Top manager female dummy –7.386*** –3.982* 3.916* 1.713 1.187 0.367(1.997) (2.064) (2.304) (2.543) (3.523) (2.109)
National market dummy 5.093*** 3.854*** –2.592 0.752 7.959*** 12.045***(1.317) (1.408) (2.033) (2.305) (2.186) (2.037)
International market dummy 3.586 2.377 1.356 –5.395** 1.905 9.887***(2.525) (1.856) (3.050) (2.745) (2.629) (3.406)
Constant –72.825*** –56.330*** 65.276*** 78.971*** 3.326 –40.201***(6.450) (8.099) (9.983) (10.867) (8.613) (11.825)
R2 0.135 0.116 0.066 0.110 0.085 0.170
Number of observations 7,982 6,962 7,976 7,620 8,303 8,210
Source: Authors’ calculations based on most recent ES COVID-19 Follow-Up Surveys and Enterprise Surveys for 23 countries in ECA; Worldwide Bureaucracy Indicators (World Bank 2020b); and local sources where Worldwide Bureaucracy Indicators were not available or outdated (Armenia, Azerbaijan, Belarus, the Kyrgyz Republic, Montenegro, North Macedonia, the Russian Federation, Tajikistan, and Turkey). Note: Regressions include sector and country fixed effects. Change in employment is not available for the Russian Federation. Public sector em-ployment share is centered on its mean to facilitate interpretation of the coefficients. Standard errors are clustered at the country level. *** p < 0.01, ** p < 0.05, * p < 0.1.

Chapter 2: Competition and Firm Recovery Post-COVID-19 ● 69
TABLE 2.7 Correlation between firm performance, labor productivity, and public bank share in Europe and Central Asia
Percentage change in
sales
Percentage change in
employmentDecreased
employment
Anticipate falling into
arrears
Increased online
activity
Increased remote work
Log(labor productivity) 3.776*** 2.761*** –2.580*** –3.143*** 1.462* 4.067***(0.560) (0.768) (0.967) (0.863) (0.836) (1.556)
Log(labor productivity) * Publicbanks share
–0.047*** –0.030 0.054** 0.056** –0.002 –0.024(0.016) (0.027) (0.027) (0.025) (0.025) (0.046)
Log(number of employees) 3.035*** 2.153*** 2.789** –1.689*** 1.376 6.850***(0.650) (0.780) (1.152) (0.547) (0.943) (1.081)
Log(firm age) 0.734 1.520 –2.027 –3.729* –2.026* 0.373(1.631) (1.511) (1.755) (2.247) (1.041) (1.724)
Top manager female dummy –7.396*** –3.947* 3.939* 1.747 1.172 0.242(1.993) (2.069) (2.303) (2.543) (3.516) (2.110)
National market dummy 5.132*** 3.840*** –2.657 0.697 7.983*** 12.258***(1.337) (1.435) (2.039) (2.312) (2.182) (2.036)
International market dummy 3.628 2.363 1.297 –5.434** 1.932 10.118***(2.541) (1.867) (3.026) (2.751) (2.614) (3.367)
Constant –72.164*** –56.025*** 64.223*** 78.085*** 3.583 –37.961**(5.977) (7.749) (9.089) (11.623) (8.832) (16.078)
R2 0.135 0.116 0.066 0.110 0.085 0.165
Number of observations 7,982 6,962 7,976 7,620 8,303 8,210
Source: Authors’ calculations based on most recent ES COVID-19 Follow-Up Surveys and Enterprise Surveys for 23 countries in ECA and Anginer, Demirgüç-Kunt, and Mare (2020).Note: Regressions include sector and country fixed effects. Change in employment is not available for the Russian Federation. Public banks share is centered on its mean to facilitate interpretation of the coefficients. Standard errors are clustered at the country level. *** p < 0.01, ** p < 0.05, * p < 0.1.
In a recent paper, Torres and Tran (2021) use global data from the BPS and the ES COVID-19 Follow-Up Surveys to explore resource realloca-tion during the COVID-19 crisis. Results for 17 ECA countries suggest that on average, jobs are being reallocated toward more productive firms but that cross-country heterogeneity in the region is significant.
Torres and Tran (2021) examine whether the extent of productivity-enhancing reallocation as a result of the COVID-19 pandemic depends on a country’s labor market regulations and com-petition policies. Employment changes are often
subject to significant adjustment costs (Davis and Haltiwanger 1999). A country’s regulatory envi-ronment can directly alter these adjustment costs by affecting the ease of hiring or firing workers. Lower entry, exit barriers, and other policies that improve competition can increase firms’ incentives to adjust.
The analysis uses the Employment Protection Legislation index (EPLex) of the International Labor Organization (ILO) to measure labor regulation. This index codifies the content of legislation gov-erning the termination of employment in the pri-vate sector, including substantive and procedural
Employment reallocation and market regulationBOX 2.5
(Continued next page)

70 ● World Bank ECA Economic Update Fall 2021
requirements for workers’ dismissals and rules related to severance pay and redress (Aleksynska and Eberlein 2016). A higher value represents a higher level of de jure employment protection.
Competition policies are assessed by the OECD’s economy-wide indicator of product mar-ket regulations (PMR). The PMR index measures the regulatory barriers to firm entry and competition in two areas: distortions induced by state involvement in the economy and barriers to entry and expansion faced by domestic and foreign firms (Vitale and others 2020). A higher score reflects a more pro-competitive de jure regulatory framework.
The results show that in countries with less restrictive employment protection and more pro-competitive regulations, there was more realloca-tion of employment from low- to high-productivity firms (figure B2.5.1). Higher-productivity firms (top 50 percent) experienced smaller drops in employ-ment during the COVID-19 crisis than lower-pro-ductivity firms (bottom 50 percent).a Where labor regulations were more stringent, low-productivity firms shed fewer jobs and high-productivity firms added slightly fewer jobs (panel a); a more pro-
competitive environment was associated with greater increases in employment in high produc-tivity firms and greater decreases in employment in low productivity firms (panel b).
These findings suggest that policies that reduce labor adjustment costs and foster market competition can support productivity growth fol-lowing the pandemic. Lowering labor adjustment costs will not necessarily imply lowering employ-ment protection, as it can be complemented with active labor market measures that help improve workers’ skills, incentivize hiring, and increase worker’s mobility. Pro-competition reforms may include both enacting new policies and improv-ing the implementation of existing policies to reduce the cost of entry, expansion, and exits (by, for example, reducing administrative costs from licensing and permits and reforming the insol-vency framework).
a. Employment change in figure B2.5.1 is relative to its aver-age, which was negative in most countries, indicating that job reallocation was driven mostly by greater job destruction in low-productivity firms, not more job creation in high-produc-tivity firms. Although this reallocation may increase average productivity, it may reduce total economic output and overall welfare, as Bloom and others (2020) note.
(continued)BOX 2.5
Source: Analysis based on Torres and Tran (2021) using BPS and ES COVID-19 Follow-Up Surveys, as well as ILO’s Employment Protection Legislation index and the OECD’s economy-wide indicator of Product Market Regulations, for 11 countries in ECA (panel a) and 15 countries in ECA (panel b). Note: Graphs show local polynomials of normalized firm-level rate of net job changes on the EPLex and PMR indexes for two groups: high- and low-productivity firms (below and above country-sector median sales per worker at baseline). Bandwidth cho-sen for the local polynomials is 20 percent of the range of the independent variable. The analysis uses panel data only. Net job change is defined as the net change of employment between the pre-pandemic baseline (December 2019) and the latest firm survey (which occurred between October 2020 and March 2021) as a share of the average employment in the two time periods. Employment change is normalized by obtaining residuals from regressing firm-level net job change on country, sector, size fixed effects and mobility from the first and second surveys. Firm’s labor productivity is proxied using sales per worker, both measured at the baseline (Dec 2019), and normalized as deviations from country means.
FIGURE B2.5.1 Normalized employment change by labor productivity and policy indicators
a. By employment protection indicator b. By economy-wide Product Market Regulation Index
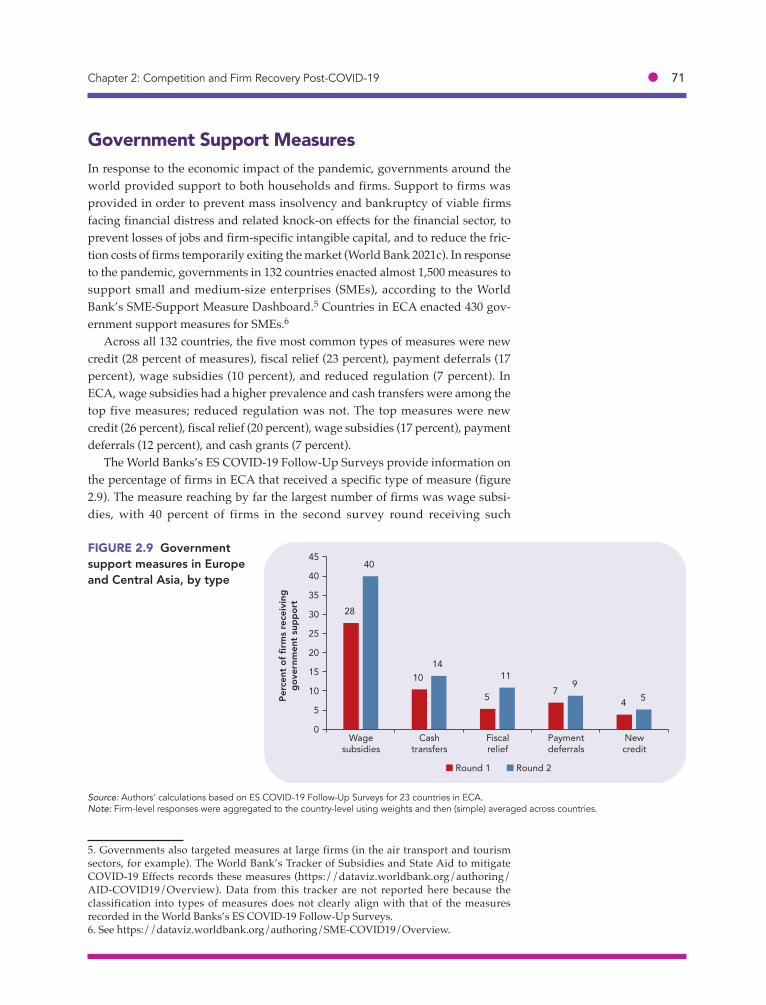
Chapter 2: Competition and Firm Recovery Post-COVID-19 ● 71
Government Support MeasuresIn response to the economic impact of the pandemic, governments around the world provided support to both households and firms. Support to firms was provided in order to prevent mass insolvency and bankruptcy of viable firms facing financial distress and related knock-on effects for the financial sector, to prevent losses of jobs and firm-specific intangible capital, and to reduce the fric-tion costs of firms temporarily exiting the market (World Bank 2021c). In response to the pandemic, governments in 132 countries enacted almost 1,500 measures to support small and medium-size enterprises (SMEs), according to the World Bank’s SME-Support Measure Dashboard.5 Countries in ECA enacted 430 gov-ernment support measures for SMEs.6
Across all 132 countries, the five most common types of measures were new credit (28 percent of measures), fiscal relief (23 percent), payment deferrals (17 percent), wage subsidies (10 percent), and reduced regulation (7 percent). In ECA, wage subsidies had a higher prevalence and cash transfers were among the top five measures; reduced regulation was not. The top measures were new credit (26 percent), fiscal relief (20 percent), wage subsidies (17 percent), payment deferrals (12 percent), and cash grants (7 percent).
The World Banks’s ES COVID-19 Follow-Up Surveys provide information on the percentage of firms in ECA that received a specific type of measure (figure 2.9). The measure reaching by far the largest number of firms was wage subsi-dies, with 40 percent of firms in the second survey round receiving such
5. Governments also targeted measures at large firms (in the air transport and tourism sectors, for example). The World Bank’s Tracker of Subsidies and State Aid to mitigate COVID-19 Effects records these measures (https://dataviz.worldbank.org/authoring/AID-COVID19/Overview). Data from this tracker are not reported here because the classification into types of measures does not clearly align with that of the measures recorded in the World Banks’s ES COVID-19 Follow-Up Surveys.6. See https://dataviz.worldbank.org/authoring/SME-COVID19/Overview.
Source: Authors’ calculations based on ES COVID-19 Follow-Up Surveys for 23 countries in ECA. Note: Firm-level responses were aggregated to the country-level using weights and then (simple) averaged across countries.
FIGURE 2.9 Government support measures in Europe and Central Asia, by type
28
10
5 74
40
1411
95
0
5
10
15
20
25
30
35
40
45
Wagesubsidies
Cashtransfers
Fiscalrelief
Paymentdeferrals
Newcredit
Perc
ent o
f firm
s re
ceiv
ing
gove
rnm
ent s
uppo
rt
Round 1 Round 2

72 ● World Bank ECA Economic Update Fall 2021
subsidies. The second-most wide-reaching measure were cash transfers, fol-lowed by fiscal relief and payment deferrals. Although new credit was the most commonly used measure, according to the World Bank’s SME-Support Measure Dashboard, it reached only 5 percent of firms.
In ECA, 37 percent of firms in the first ES COVID-19 Follow-Up Survey round and 50 percent in the second round reported receiving government support (ta-ble 2.8). These figures are higher than in other regions. Using data for 60 coun-tries, Cirera and others (2021) find that only about 25 percent of surveyed firms received any type of government support during the first stage of the COVID-19 crisis (through August 2020). By January 2021, 33 percent of firms globally had received some type of public support (World Bank 2021c).
The reach of government support measures varied widely across countries in ECA (see table 2.8). The lowest percentage of firms receiving government sup-port was 5 percent (in Moldova); the highest percentage was 86 percent (in Ser-bia). On average, firms received 1.6 different support measures, ranging from 1.0 in Moldova to 2.8 in Poland.
Preliminary evidence suggests that government support measures helped firms weather the crisis and decreased SME failure rates (Albagli, Fernández, and Huneeus 2021; Cespedes and others 2021; Cirera and others 2021; Gourinchas and others 2021). This evidence of positive effects is encouraging, but it is also important to assess the nature and distribution of government support. At the start of the COVID-19 crisis, the large economic shocks required quick action, making it difficult to target government support. It is thus useful to examine the distribution of support measures to assess whether they may hamper competi-tion and slow the recovery process.
Which Firms Received Government Support?
A cursory analysis does not show big differences in the way government support was allocated across firms (figure 2.10). The percentage of firms receiving any support measure does not vary much by firm size, sector, age, or gender of the top manager.
However, a more in-depth analysis that simultaneously controls for different firm characteristics reveals interesting patterns. The regressions in table 2.9 esti-mate the probability of receiving different types of government assistance as a function of firms’ labor productivity, size, age, gender of the top manager, pre-crisis innovation, and location of the main market, while controlling for the sector of operation. Positive coefficients indicate a greater likelihood of receiving gov-ernment assistance.
Four main findings emerge from this analysis. First, more productive firms were less likely to receive any type of government support. Firms in the 10th percentile of the pre-crisis labor productivity distribution were 6 percentage points more likely to receive government support than firms in the 90th percentile.
Second, larger firms were more likely than smaller firms to receive payment deferrals and fiscal relief. This result is in line with that of Cirera and others

Chapter 2: Competition and Firm Recovery Post-COVID-19 ● 73
TABL
E 2.
8 Ty
pes
of g
over
nmen
t sup
port
rece
ived
in E
urop
e an
d Ce
ntra
l Asi
a (p
erce
nt o
f firm
s, e
xcep
t whe
re o
ther
wis
e in
dica
ted)
Type
of g
over
nmen
t sup
port
rece
ived
Ave
rage
num
ber o
f ty
pes
of g
over
nmen
t su
ppor
t rec
eive
d am
ong
firm
s th
at re
ceiv
ed
gove
rnm
ent s
uppo
rt
Rece
ived
go
vern
men
t su
ppor
t C
ash
tran
sfer
Paym
ent
defe
rral
sN
ew c
redi
tFi
scal
relie
fW
age
subs
idie
s
Reg
ion
or
cou
ntry
Roun
d 1
Roun
d 2
Roun
d 1
Roun
d 2
Roun
d 1
Roun
d 2
Roun
d 1
Roun
d 2
Roun
d 1
Roun
d 2
Roun
d 1
Roun
d 2
Roun
d 1
Roun
d 2
ECA
3750
1014
79
45
511
2840
1.5
1.6
Cen
tral
Asi
a
Kaz
akhs
tan
101
12
80
1.3
Uzb
ekis
tana
385
213
141
1.2
Cen
tral
Eur
ope
and
B
altic
cou
ntrie
s72
235
2620
5420
3347
24
Bul
gar
ia16
3014
291
30
10
410
221.
61.
9
Cro
atia
6163
912
78
45
1818
5459
1.5
1.6
Cze
ch R
epub
lic62
5842
307
73
24
420
391.
21.
4
Est
onia
4346
00
1111
11
54
4144
1.4
1.4
Hun
gar
y22
261
20
31
11
121
231.
11.
3
Latv
ia4
250
30
10
31
91
181.
21.
4
Lith
uani
a64
7043
418
128
70
352
602.
02.
0
Pola
nd63
6739
4918
2612
1824
3332
412.
22.
8
Rom
ania
4448
27
1113
710
711
3839
1.5
1.7
Slov
ak R
epub
lic51
5910
214
65
63
444
541.
31.
5
Slov
enia
6870
25
74
35
98
6664
1.3
1.4
(con
tinue
d ne
xt p
age)

74 ● World Bank ECA Economic Update Fall 2021
Type
of g
over
nmen
t sup
port
rece
ived
Ave
rage
num
ber o
f ty
pes
of g
over
nmen
t su
ppor
t rec
eive
d am
ong
firm
s th
at re
ceiv
ed
gove
rnm
ent s
uppo
rt
Rece
ived
go
vern
men
t su
ppor
t C
ash
tran
sfer
Paym
ent
defe
rral
sN
ew c
redi
tFi
scal
relie
fW
age
subs
idie
s
Reg
ion
or
cou
ntry
Roun
d 1
Roun
d 2
Roun
d 1
Roun
d 2
Roun
d 1
Roun
d 2
Roun
d 1
Roun
d 2
Roun
d 1
Roun
d 2
Roun
d 1
Roun
d 2
Roun
d 1
Roun
d 2
East
ern
Euro
pe
Bel
arus
50
30
11
1.1
Mol
dov
a1
50
10
10
01
20
21.
01.
0
Russ
ian
Fed
erat
ion
92
52
72
2.0
Sout
h C
auca
sus
Arm
enia
6629
517
649
1.6
Aze
rbai
jan
6412
65
1347
1.4
Geo
rgia
3348
35
1720
12
825
1217
1.3
1.5
Turk
eya
4149
51
66
1419
911
2829
1.6
1.4
Wes
tern
Bal
kans
Alb
ania
445
98
340
1.5
Bos
nia
and
Her
zeg
ovin
a70
59
13
631.
2
Kos
ovoa
4710
60
143
1.3
Mon
tene
gro
571
82
1555
1.4
Nor
th M
aced
onia
404
912
039
1.6
Serb
ia86
826
1138
811.
9
Sour
ce: A
utho
rs’ c
alcu
latio
ns b
ased
on
ES C
OVI
D-1
9 Fo
llow
-Up
Surv
eys
and
Bus
ines
s Pu
lse
Surv
ey.
Not
e: E
CA
ave
rage
s ar
e ba
sed
on d
ata
from
ES
CO
VID
-19
Follo
w-U
p Su
rvey
s. F
irm-le
vel r
espo
nses
from
the
ES C
OVI
D-1
9 Fo
llow
-Up
Surv
eys
wer
e ag
greg
ated
to th
e co
untr
y-le
vel u
sing
wei
ghts
an
d th
en (s
impl
e) a
vera
ged
acro
ss c
ount
ries.
a. R
esul
ts a
re fr
om B
PS d
ata,
whi
ch a
re n
ot d
irect
ly c
ompa
rabl
e to
dat
a in
the
ES C
OVI
D-1
9 Fo
llow
-Up
Surv
eys,
as
the
BPS
sam
pled
a d
iffer
ent,
nonr
epre
sent
ativ
e sa
mpl
e of
firm
s.
TABL
E 2.
8 (c
ontin
ued)
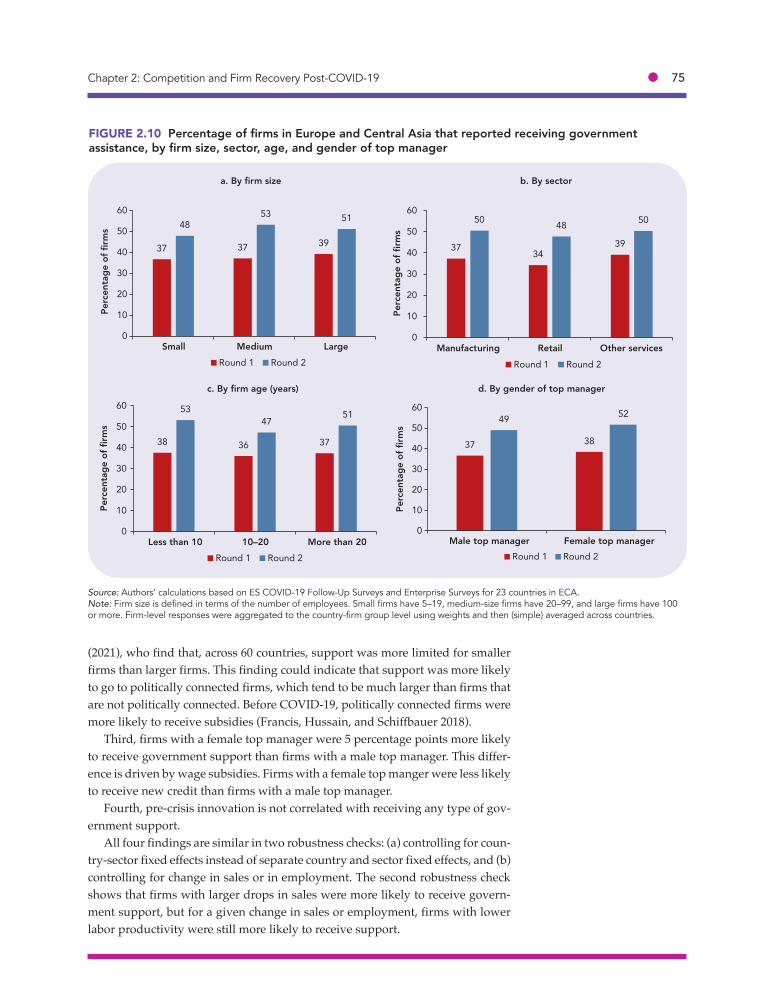
Chapter 2: Competition and Firm Recovery Post-COVID-19 ● 75
Source: Authors’ calculations based on ES COVID-19 Follow-Up Surveys and Enterprise Surveys for 23 countries in ECA.Note: Firm size is defined in terms of the number of employees. Small firms have 5–19, medium-size firms have 20–99, and large firms have 100 or more. Firm-level responses were aggregated to the country-firm group level using weights and then (simple) averaged across countries.
FIGURE 2.10 Percentage of firms in Europe and Central Asia that reported receiving governmentassistance, by firm size, sector, age, and gender of top manager
37 37 39
4853 51
0
10
20
30
40
50
60
Small Medium Large
Perc
enta
ge o
f firm
s
Round 1 Round 2
3734
39
50 48 50
0
10
20
30
40
50
60
Manufacturing Retail Other services
Perc
enta
ge o
f firm
s
Round 1 Round 2
a. By firm size b. By sector
c. By firm age (years) d. By gender of top manager
38 36 37
5347
51
0
10
20
30
40
50
60
Less than 10 10–20 More than 20
Perc
enta
ge o
f firm
s
Round 1 Round 2
37 38
49 52
0
10
20
30
40
50
60
Male top manager Female top manager
Perc
enta
ge o
f firm
s
Round 1 Round 2
(2021), who find that, across 60 countries, support was more limited for smaller firms than larger firms. This finding could indicate that support was more likely to go to politically connected firms, which tend to be much larger than firms that are not politically connected. Before COVID-19, politically connected firms were more likely to receive subsidies (Francis, Hussain, and Schiffbauer 2018).
Third, firms with a female top manager were 5 percentage points more likely to receive government support than firms with a male top manager. This differ-ence is driven by wage subsidies. Firms with a female top manger were less likely to receive new credit than firms with a male top manager.
Fourth, pre-crisis innovation is not correlated with receiving any type of gov-ernment support.
All four findings are similar in two robustness checks: (a) controlling for coun-try-sector fixed effects instead of separate country and sector fixed effects, and (b) controlling for change in sales or in employment. The second robustness check shows that firms with larger drops in sales were more likely to receive govern-ment support, but for a given change in sales or employment, firms with lower labor productivity were still more likely to receive support.

76 ● World Bank ECA Economic Update Fall 2021
TABLE 2.9 Correlation between probability of receiving government assistance and firm characteristics in Europe and Central Asia
Any typeCash
transfersPayment deferrals New credit Fiscal relief
Wage subsidies
Log(labor productivity) –1.944** –1.266** –0.353 0.357 –0.469 –2.263***
(0.856) (0.564) (0.400) (0.444) (0.401) (0.806)
Log(number of employees) 1.301 –0.530 1.390*** –0.134 1.596** 2.024
(1.400) (0.413) (0.452) (0.368) (0.658) (1.263)
Log(firm age) –0.461 –0.806 –1.225 0.121 –1.288* –1.017
(1.686) (0.968) (0.990) (0.588) (0.767) (2.020)
Top manager female dummy 4.824** 2.091 0.127 –1.271* 1.583 5.615**
(2.442) (1.915) (1.544) (0.687) (2.018) (2.514)
Innovated during 2017–19 0.493 0.276 –0.653 1.174 0.338 0.795
(1.889) (0.781) (1.276) (0.943) (1.295) (1.629)
National market dummy –0.903 –1.360* 0.046 2.216*** 0.732 –1.304
(1.866) (0.787) (0.844) (0.619) (1.601) (2.063)
International market dummy 1.149 0.211 0.167 1.909 1.527 –4.352*
(2.614) (1.708) (2.062) (1.418) (3.027) (2.346)
Constant 65.032*** 27.795*** 10.000*** –0.365 9.812* 61.088***
(13.402) (6.395) (3.633) (5.605) (5.933) (13.012)
R2 0.213 0.170 0.055 0.052 0.132 0.223
Number of observations 8,207 8,176 8,171 8,166 8,164 8,191
Source: Authors’ calculations based on most recent ES COVID-19 Follow-Up Surveys and Enterprise Surveys for 23 countries in ECA.Note: Regressions include sector and country fixed effects. Standard errors are clustered at the country level. *** p < 0.01, ** p < 0.05, * p < 0.1.
Taken together, these findings suggest that the broad support governments provided disproportionately went to less productive firms, irrespective of their pre-crisis innovativeness. Previous work has documented that firms that did not experience large declines in sales during the crisis benefitted from government support measures while firms that experienced large declines in sales did not (Cirera and others 2021). Not supporting firms with the largest declines in sales may be consistent with creative destruction, where less productive firms get pushed out of the market during a crisis while more productive and innovative firms recover and eventually thrive again. The results in table 2.9 are not consis-tent with creative destruction: Governments were more likely to support less productive firms, and support measures were given to firms regardless of their pre-crisis level of innovation. Less productive firms that stay in the market with the help of government support can stifle innovation and productivity growth in the recovery phase and beyond. The provision of more support to large firms can also increase industry concentration and market power. The following section discusses how government policy can counteract these trends and rebolster com-petition during the recovery.
Chapter 2: Competition and Firm Recovery Post-COVID-19 ● 77
Policy ImplicationsGovernment policy measures aimed at supporting firms through the economic fall-out of the pandemic have in many cases provided immediate relief to protect firms and workers from the worst effects of the crisis. In times of extraordinary circumstances—such as the COVID-19 pandemic—general policy measures and even some flexibility in allowing exemptions to competition law and policies may be appropriate (Akcigit and others 2021; Pop and Amador, 2020). Such ex-ceptions may include easing restrictions regarding state aid to business that would otherwise go bankrupt. Although such measures weaken competition un-der normal circumstances, they can be appropriate if temporary to avoid a larger economic fall-out. They should be designed to minimize the disruptive effects they can have on competition.7 Competition authorities can also potentially help mitigate anticompetitive effects of any such measures by providing guidance and closely monitoring the market. As countries emerge from the pandemic, how-ever, it will be important to balance protection with the necessary reallocation among firms and sectors that is usual in the aftermath of major shocks (Blanchard, Philippon, and Pisani-Ferry 2020).
Government policy measures aimed at supporting firms through the eco-nomic fall-out of the pandemic have also reignited concerns about propping up so-called “zombie firms”—firms that are unprofitable but remain in operation only because of cheap credit and debt forbearance (ECB 2021). Zombie firms may reduce economy-wide productivity by crowding out resources for new, more productive firms. In the wake of the global financial crisis, low interest rates and weak insolvency frameworks contributed to a significant increase in the share of zombie firms in a number of European countries (Acharya and others 2020). Even before the outbreak of COVID-19, that share was larger than it was before the global financial crisis; government support measures enacted in response to the pandemic may have further increased the share.
As economies enter the economic recovery phase, it will be important for policy makers in all countries to phase out policy support measures and focus on fostering a competitive business environment that is key to a strong recovery, resilience to future crises, and sustainable long-term economic growth. The find-ings presented in this chapter support the policy priorities outlined in World Bank (2021c) and include the following:
• Better targeting government policy support measures. Many govern-ments implemented broad policy support schemes to promptly address the immediate economic fall-out from the COVID-19 crisis. A cursory analysis of government support measures in the region suggests that there were no large differences in the type of firms that received assis-tance based on firm characteristics. A more careful analysis, however, suggests that more support appears to have gone to less productive firms. As conditions improve and economies enter the recovery phase, broad, indiscriminate policy support measures should be phased out as soon as
7. Pop and Amador (2020) provide an overview of the “Dos and Don’ts for State Aid Design.”

78 ● World Bank ECA Economic Update Fall 2021
appropriate. Although some policy support may continue to be neces-sary, it will be important to target remaining support better to viable, productive firms, in order to avoid propping up zombie firms and ensure that limited fiscal resources are deployed efficiently, to firms that will contribute to long-term economic growth. The World Bank is working across the region to improve the targeting of government support, and on-going projects in Turkey, Georgia, Romania, and the Kyrgyz Republic are good examples.
• Ensuring that policy support measures do not lock in market structures with lower competitive pressures. All support measures should be de-signed in a way that minimizes the risks of distorting market incentives or crowding out market players. Transparency and accountability of gov-ernment support schemes can mitigate the risks of providing preferential access to support schemes to certain types of firms, including state-owned enterprises (SOEs) or large firms, and creating an unlevel playing field. Large firms in the region were more likely than smaller firms to receive aid in the form of payment deferrals and fiscal relief. Although there may be good reasons for this, transparency and accountability are key. Gov-ernments should also take this opportunity to review the economic ratio-nale of SOEs and consider whether government support to them is the best use of limited resources, especially if these enterprises had structural viability issues even before the crisis. The authorities should also actively monitor all forms of government interventions and propose adjustments to policies that safeguard contestability and competition. Indeed, coun-tries should not only ensure that they avoid locking in market structures with lower competitive pressures, they should also enhance their compe-tition policy in support of the post-pandemic economic recovery phase. Toward this end, the World Bank has been providing technical assistance on assessing the effect of state aid on market outcomes (Romania), strength-ening competition policy design (Moldova and Uzbekistan), and reducing the role of state induced distortions to competition (Kazakhstan).
• Undertaking policy reforms to enable improved firm exit by strength-ening insolvency and resolution frameworks. Strengthening insolvency and resolution frameworks, including legal frameworks for corporate and debt restructuring, and out-of-court conciliatory measures are crucial to ensuring that uncompetitive firms are restructured or exit. As a result of the COVID-19 crisis, many firms will need to restructure their debt; others will have to be promptly resolved to prevent an increase in the number of zombie firms, which can lower economywide productivity by crowding out resources for more productive or new firms. The World Bank is engaged with authorities on reforms in this area in some countries in the region, including in Bulgaria, Estonia, and Poland.
• Undertaking policy reforms to enable improved firm entry and growth. Countries can improve the competitiveness of their business environ-ment by lowering regulatory costs to business, accelerating digitizing
Chapter 2: Competition and Firm Recovery Post-COVID-19 ● 79
government-to-business services, and strengthening institutions to en-hance policy certainty. More broadly, countries need to realign policy and regulatory environments to facilitate the reallocation of resources toward long-run economic transformation, job creation, and inclusion, which is an important focus of World Bank operations across the region. Ongoing operations in North Macedonia, Moldova, Romania, Serbia, and Turkey are examples of projects intended to help firm entry, exit, innovation, and competition.
• Ensuring that the financial sector has the capacity to provide liquidity as needed and remains healthy. A strong financial sector is a vital part of a competitive business environment. It may provide funding for new firms to enter and productive firms to invest in innovation and adapta-tion to change. Regulatory and supervisory incentives should be consid-ered, where relevant, to foster early action on non-performing loans (NPLs) and promote effective corporate debt restructuring. The World Bank has multiple engagements across the region on financial sector health. A good example is its joint work with the International Finance Corporation (IFC) in Kazakhstan, where a diagnostic report on NPLs and stakeholder engagements aim to identify impediments to and opportuni-ties for the development of the distressed asset market, including market-based options to address the long-standing issue of high NPLs.
Conclusion The COVID-19 pandemic had a profound and heterogenous impact on firms in ECA. On average, firms surveyed in the first survey round, conducted between May and November 2020, reported a drop in monthly sales of 24 percent and a 10 percent decrease in full-time employees compared with one year earlier. By round 2 of the survey, conducted between November 2020 and May 2021, one in four firms reported anticipating falling into arrears on outstanding liabilities in the next six months. Smaller and younger firms were hit harder by the COVID-19 crisis than other firms.
A competitive business environment in which resources are allocated to the most efficient, most innovative firms is key for sustainable, long-term economic growth. Before COVID-19, firms’ labor productivity was higher in countries with more competitive environments. During the COVID-19 crisis, economic activity appears to have been reallocated toward more productive firms, especially in countries with more competitive markets. More productive firms were also more likely to adapt to the crisis by increasing online activity and remote work. Whether the reallocation of economic activity toward more productive firms is long-lasting will depend on whether more productive firms grow and less pro-ductive firms ultimately exit.
Many governments implemented broad policy support schemes to promptly address the initial economic fall-out from the COVID-19 crisis and provide im-mediate relief to protect firms and workers from the worst effects. This support may not have gone to the most viable or innovative firms.
80 ● World Bank ECA Economic Update Fall 2021
As economies enter the economic recovery phase, it will be important for policy makers in all countries to phase out policy support measures as soon as appropriate and focus on fostering a competitive business environment. Such an environment is key to a strong recovery; resilience to future crises; and sustain-able, long-term economic growth.

Chapter 2: Competition and Firm Recovery Post-COVID-19 ● 81
Annex 2.1 Data and MethodologyWorld Bank Enterprise Surveys provide nationally representative insights into the private sector landscape in ECA. Data for formal (registered) firms with 5 or more employees from the latest round of surveys were collected primarily in 2019 in the region (table A2.1.1). More information on Enterprise Surveys is available at https://www.enterprisesurveys.org/en/methodology.
TABLE A2.1.1 Completion dates of survey fieldwork for World Bank Enterprise Surveys and Business Pulse Surveys
Country ES Baseline ES COVID-19 round 1 ES COVID-19 round 2
Albania May 2019 June 2020 —
Armenia December 2020 April 2021 —
Azerbaijan December 2019 May 2021 —
Belarus April 2019 August 2020 —
Bosnia and Herzegovina September 2019 March 2021 —
Bulgaria March 2020 September 2020 December 2020
Croatia November 2019 September 2020 January 2021
Czech Republic March 2020 October 2020 February 2021
Estonia January 2020 November 2020 February 2021
Georgia January 2020 June 2020 November 2020
Hungary March 2020 September 2020 February 2021
Kazakhstan October 2019 March 2021 —
Kyrgyz Republic December 2019 — —
Latvia January 2020 November 2020 February 2021
Lithuania January 2020 October 2020 February 2021
Moldova November 2019 May 2020 November 2020
Montenegro July 2019 February 2021 —
North Macedonia October 2019 November 2020 —
Poland December 2019 August 2020 December 2020
Romania June 2020 September 2020 December 2020
Russian Federation July 2019 June 2020 —
Serbia October 2019 February 2021 —
Slovak Republic March 2020 October 2020 February 2021
Slovenia November 2019 August 2020 December 2020
Tajikistan August 2019 — —
Ukraine December 2019 — —
ES Baseline BPS COVID-19 round 1 BPS COVID-19 round 2
Kosovo December 2019 July 2020 —
Uzbekistan August 2019 September 2020 —
Turkey December 2019 July 2020 March 2021
Note: — Not available.
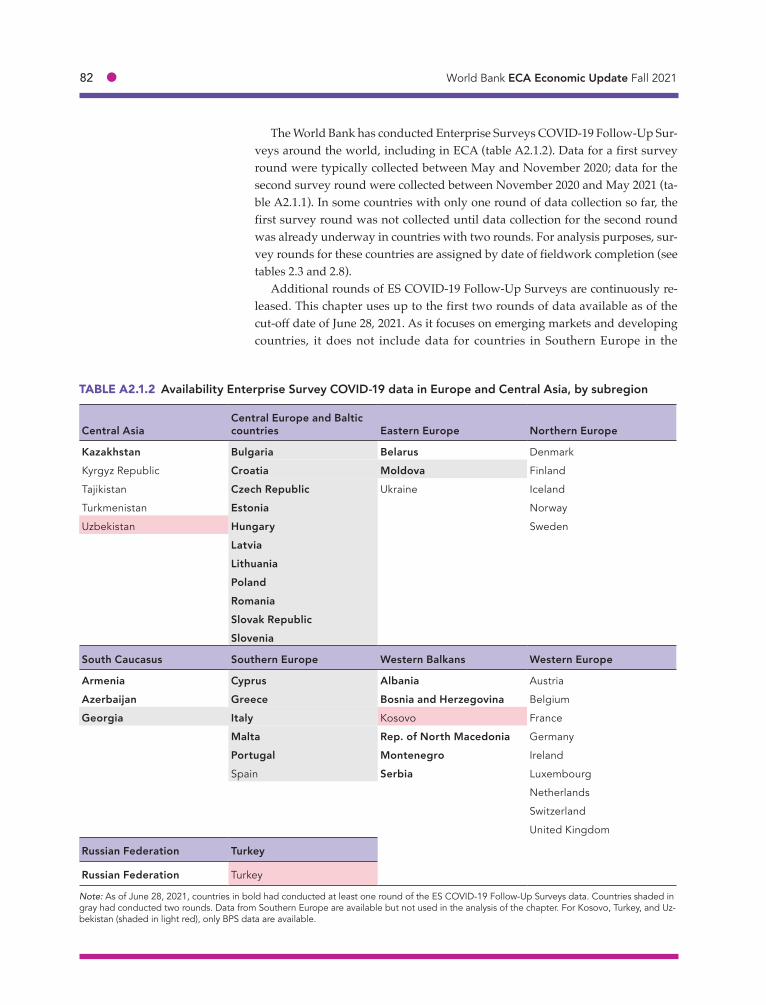
82 ● World Bank ECA Economic Update Fall 2021
The World Bank has conducted Enterprise Surveys COVID-19 Follow-Up Sur-veys around the world, including in ECA (table A2.1.2). Data for a first survey round were typically collected between May and November 2020; data for the second survey round were collected between November 2020 and May 2021 (ta-ble A2.1.1). In some countries with only one round of data collection so far, the first survey round was not collected until data collection for the second round was already underway in countries with two rounds. For analysis purposes, sur-vey rounds for these countries are assigned by date of fieldwork completion (see tables 2.3 and 2.8).
Additional rounds of ES COVID-19 Follow-Up Surveys are continuously re-leased. This chapter uses up to the first two rounds of data available as of the cut-off date of June 28, 2021. As it focuses on emerging markets and developing countries, it does not include data for countries in Southern Europe in the
TABLE A2.1.2 Availability Enterprise Survey COVID-19 data in Europe and Central Asia, by subregion
Central AsiaCentral Europe and Baltic countries Eastern Europe Northern Europe
Kazakhstan Bulgaria Belarus Denmark
Kyrgyz Republic Croatia Moldova Finland
Tajikistan Czech Republic Ukraine Iceland
Turkmenistan Estonia Norway
Uzbekistan Hungary Sweden
LatviaLithuaniaPolandRomaniaSlovak RepublicSlovenia
South Caucasus Southern Europe Western Balkans Western Europe
Armenia Cyprus Albania Austria
Azerbaijan Greece Bosnia and Herzegovina Belgium
Georgia Italy Kosovo France
Malta Rep. of North Macedonia Germany
Portugal Montenegro Ireland
Spain Serbia Luxembourg
Netherlands
Switzerland
United Kingdom
Russian Federation Turkey
Russian Federation Turkey
Note: As of June 28, 2021, countries in bold had conducted at least one round of the ES COVID-19 Follow-Up Surveys data. Countries shaded in gray had conducted two rounds. Data from Southern Europe are available but not used in the analysis of the chapter. For Kosovo, Turkey, and Uz-bekistan (shaded in light red), only BPS data are available.

Chapter 2: Competition and Firm Recovery Post-COVID-19 ● 83
analysis. The sampling frame for the ES COVID-19 Follow-Up Surveys includes all firms that replied to the latest pre-COVID-19 Enterprise Surveys, making it possible to link performance during the COVID-19 pandemic back to firm char-acteristics collected through the Enterprise Surveys. More information on ES COVID-19 Follow-Up Surveys is available at https://www.enterprisesurveys.org/en/covid-19.
In addition to the ES COVID-19 Follow-Up Surveys, the World Bank also con-ducts Business Pulse Surveys (BPS), using a similar but not identical question-naire as the ES COVID-19 Follow-Up Surveys. BPS do not use the Enterprise Surveys sampling frame and as a result cannot be linked with the pre-COVID Enterprise Surveys. In ECA, BPS data as of the cut-off date of June 28, 2021, were available for six countries: Bulgaria, Poland, and Romania (also covered by ES COVID-19 Follow-Up Surveys) and Kosovo, Turkey, and Uzbekistan. For the three countries for which no ES COVID-19 Follow-Up Surveys data are available, BPS data are reported instead in tables 2.3 and 2.8. To make the data more com-parable with ES COVID-19 Follow-Up Surveys, only firms with five or more employees are included in any calculations. More information on Business Pulse Surveys is available at https://www.worldbank.org/en/data/interactive/2021/01/19/covid-19-business-pulse-survey-dashboard.

84 ● World Bank ECA Economic Update Fall 2021
ReferencesAcemoglu, D., and J. A. Robinson. 2012. Why Nations Fail: The Origins of Power, Prosper-
ity and Poverty. New York: Crown.
Acharya, V., M. Crosignani, T. Eisert, and C. Eufinger. 2020. “Zombie Credit and (Dis)infla-tion: Evidence from Europe.” NBER Working Paper 27158, National Bureau of Eco-nomic Research, Cambridge, MA.
Aghion, P., and P. Howitt. 1992. “A Model of Growth through Creative Destruction.” Econometrica 60(2): 323–51.
Akcigit, U., W. Chen, F. J. Diez, R. A. Duval, P. Engler, J. Fan, C. Maggi, M. M. Tavares, D. A. Schwarz, I. Shibata, and C. Villegas-Sánchez. 2021. “Rising Corporate Market Power Emerging Policy Issues.” IMF Staff Discussion Note 2021/001, International Monetary Fund, Washington, DC.
Albagli, E., A. Fernández, and F. Huneeus. 2021. “Firms Margins of Adjustment and Public Policies During COVID-19: A Research Agenda.” Presentation at the workshop “COV-ID-19: Economic Implications and Policy Lessons,” Central Bank of Chile, Santiago, January 13.
Aleksynska, M., and F. Eberlein. 2016. “Coverage of Employment Protection Legisla-tion.” IZA J Labor Policy 5(17). https://doi.org/10.1186/s40173-016-0073-x.
Andrews, D., C. Criscuolo, and P. Gal. 2015. Frontier Firms, Technology Diffusion and Public Policy: Micro Evidence from OECD Countries. Paris: OECD Publishing.
Anginer, D., A. Demirgüç-Kunt, and D. S. Mare. 2020. “Bank Capital and Risk in Europe and Central Asia Ten Years after the Crisis.” Policy Research Working Paper 9138, World Bank, Washington, DC.
Apedo-Amah, M. C., B. Avdiu, X. Cirera, M. Cruz, E. Davies, A. Grover, L. Iacovone, U. Kilin, D. Medvedev, F. O. Maduko, S. Poupakis, J. Torres, and T. T. Tran. 2020. “Unmask-ing the Impact of COVID-19 on Businesses: Firm Level Evidence from across the World.” Policy Research Working Paper 9434, World Bank, Washington, DC. https://openknowledge.worldbank.org/handle/10986/34626.
Arnold, J., G. Nicoletti, and S. Scarpetta. 2011. “Regulation, Resource Reallocation and Productivity Growth.” EIB Papers 16(1): 90–115 (European Investment Bank, Luxem-bourg).
Autor, D., D. Dorn, L. F. Katz, C. Patterson, and J. Van Reenen. 2020. “The Fall of the Labor Share and the Rise of Superstar Firms.” Quarterly Journal of Economics 135(2): 645–709. https://doi.org/10.1093/qje/qjaa004.
Ayyagari, M., A. Demirgüç-Kunt, and V. Maksimovic. 2019. “The Rise of Star Firms: Intan-gible Capital and Competition.” Policy Research Working Paper 8832, World Bank, Washington, DC.
———. 2020. “Rise in Corporate Inequality: Role of Competition.” Unpublished paper, World Bank, Washington, DC.
Barrero, J. M., N. Bloom, and S. J. Davis. 2020. “COVID-19 Is Also a Reallocation Shock.” Working Paper 2020-59, Becker-Friedman Institute for Economics, University of Chi-cago.
Bessen, J. 2017. Information Technology and Industry Concentration. Boston University Law and Economics Paper 17-41.
Blanchard, O., T. Philippon, and J. Pisani-Ferry. 2020. A New Policy Toolkit Is Needed as Countries Exit COVID-19 Lockdowns. PIIE Policy Brief 20-8, Peterson Institute for Inter-national Economies, Washington, DC.
Bloom, N., P. Bunn, P. Mizen, P. Smietanka, and G. Thwaites. 2020. “The Impact of Cov-id-19 on Productivity.” National Bureau of Economic Research Working Paper 28233, Cambridge, MA.

Chapter 2: Competition and Firm Recovery Post-COVID-19 ● 85
Bosio, E., S. Djankov, F. Jolevski, and R. Ramalho. 2020. “Survival of Firms during Eco-nomic Crisis.” Policy Research Working Paper WPS 9239, World Bank, Washington, DC. http://documents.worldbank.org/curated/en/140091589221773664/Survival-of-Firms-during-Economic-Crisis.
Brucal, A., A. Grover, and S. R. Ortega. 2021. “Damaged by the Disaster: The Impact of COVID-19 on Firms in South Asia.” Policy Research Working Paper 9604, World Bank, Washington, DC. https://openknowledge.worldbank.org/handle/10986/35357.
Caballero, R. J. 2008. “Creative Destruction.” The New Palgrave Dictionary of Economics, 2nd ed., ed. Steven N. Durlauf and Lawrence E. Blume. New York: Palgrave Macmillan.
Caballero, R. J., and M. L. Hammour. 1994. “The Cleansing Effect of Recessions.” Ameri-can Economic Review 84(5): 1350–68.
———. 2005. “The Cost of Recessions Revisited: A Reverse-Liquidationist View.” Review of Economic Studies 72(251): 313–41.
Céspedes, L. F., R. Chang, and A. Velasco. 2021. “Credit, Employment, and the COVID Crisis.” LSE Public Policy Review 1(4): 3. https://doi.org/10.31389/lseppr.28.
Cirera, X., M. Cruz, E. Davies, A. Grover, L. Iacovone, J. E. L. Cordova, D. Medvedev, F. O. Maduko, G. Nayyar, S. R. Ortega, and J. Torres. 2021. “Policies to Support Businesses through the COVID-19 Shock: A Firm Level Perspective.” World Bank Research Ob-server 36 (1): 41–66. https://doi.org/10.1093/wbro/lkab001.
Crouzet, N., and J. Eberly. 2019. “Understanding Weak Capital Investment: The Role of Market Concentration and Intangibles.” Proceedings of the 2018 Jackson Hole Sym-posium, 87–148.
Cunningham, C., F. Ederer, and S. Ma. 2021. “Killer Acquisitions.” Journal of Political Economy 129(3): 649–702.
Dauda, S. 2020. The Effects of Competition on Jobs and Economic Transformation. EFI Insight-Trade, Investment and Competitiveness, World Bank, Washington, DC.
Davis, S. J., and J. Haltiwanger. 1999. “Gross Job Flows.” Handbook of Labor Economics3: 2711–805.
De Loecker, J., J. Eeckhout, and G. Unger. 2020. “The Rise of Market Power and the Mac-roeconomic Implications.” Quarterly Journal of Economics 135: 561–644.
Demirgüç-Kunt, A., M. Lokshin, and I. Torre. 2021. “The Sooner, the Better: The Economic Impact of Non-pharmaceutical Interventions during the Early Stage of the COVID-19 Pandemic.” Economics of Transition and Institutional Change 29: 551–73. https://doi.org/10.1111/ecot.12284.
De Nicola, F., A. Mattoo, J. D. Timmis, and T. T. Tran. 2021. Productivity in the Time of COVID-19: Evidence from East Asia and Pacific. Research & Policy Brief 46, World Bank , Wash ington, DC. h t tp : / /documents .wor ldbank .org/curated/en/577501619186435038/Productivity-in-the-Time-of-COVID-19-Evidence-from-East-Asia-and-Pacific.
Díez, F., D. Leigh, and S. Tambunlertchai. 2018. “Global Market Power and its Macroeco-nomic Implications.” IMF Working Paper 18/137, International Monetary Fund, Wash-ington, DC.
ECB (European Central Bank). 2021. Financial Stability Review. May. Frankfurt am Main.
Economist. 2021. “The Land that Ambition Forgot,” Briefing Corporate Europe, June 5–11.
Francis, D., S. Hussain, and M. Schiffbauer. 2018. “Do Politically Connected Firms Inno-vate, Contributing to Long-Term Economic Growth?” Policy Research Working Paper 8502, World Bank, Washington, DC. https://openknowledge.worldbank.org/han-dle/10986/29975.
Freund, C., and M. Pierola. 2015. “Export Superstars.” Review of Economics and Statistics97(5): 1023–32.
86 ● World Bank ECA Economic Update Fall 2021
Gaubert, C., and O. Itskhoki. 2020. “Granular Comparative Advantage.” Journal of Politi-cal Economy 129(3). https://www.journals.uchicago.edu/doi/abs/10.1086/712444.
Gourinchas, P., S. Kalemli-Ozcan, V. Penciakova, and N. Sander. 2020. “COVID-19 and SME Failures.” NBER Working Paper 27877, National Bureau of Economic Research, Cambridge, MA. https://doi.org/10.3386/w27877.
Gutiérrez, G., and T. Philippon. 2018. “How EU Markets Became More Competitive Than US Markets: A Study of Institutional Drift.” NBER Working Paper 24700, National Bu-reau of Economic Research, Cambridge, MA.
Hall, R. 2018. “New Evidence on the Markup of Prices over Marginal Costs and the Role of Mega-Firms.” NBER Working Paper 24574, National Bureau of Economic Research, Cambridge, MA.
Hallward-Driemeier, M., G. Nayyar, W. Fengler, A. Aridi, and I. Gill. 2020. Europe 4.0: Ad-dressing the Digital Dilemma. Washington, DC: World Bank.
IMF (International Monetary Fund). 2019. “The Rise of Corporate Market Power and Its Macroeconomic Effects.” World Economic Outlook, April. Washington, DC.
Iootty, M., G. Pop, and J. Pena. 2020. “Corporate Market Power in Romania: Assessing Recent Trends, Drivers, and Implications for Competition.” Policy Research Working Paper 9487, World Bank, Washington, DC.
Kamepalli, S. K., R. G. Rajan, and L. Zingales. 2021. “Kill Zone.” NBER Working Paper w27146, National Bureau of Economic Research, Cambridge, MA. https://ssrn.com/abstract=3603776.
Karalashvili, N., and D. Viganola. 2021. “The Evolving Effect of COVID-19 on the Private Sector.” World Bank, Washington, DC. https://openknowledge.worldbank.org/han-dle/10986/35869.
Keller, W., and S. R. Yeaple. 2020. “Multinationals, Markets, and Markups.” https://sites.google.com/site/sryeaple/.
Motta, M., A. M. Oviedo, and M. Santini. 2010. “An Open Door for Firms: The Impact of Business Entry Reforms.” Viewpoint: Public Policy of the Private Sector, Note 323. World Bank, Washington, DC.
Muzi, S., F. Jolevski, K. Ueda, and D. Viganola. 2021. “Productivity and Firm Exit during the COVID-19 Crisis: Cross-Country Evidence.” Policy Research Working Paper WPS 9671, World Bank, Washington, DC. http://documents.worldbank.org/curated/en/267581621869749674/Productivity-and-Firm-Exit-during-the-COVID-19-Crisis-Cross-Country-Evidence.
Pop, G., and A. Amador. 2020. “To Aid and How to Aid: Policy Options to Preserve Mar-kets.” European State Aid Law Quarterly 19(2): 127–36.
Schumpeter, J. 1934. “Depressions.” In Economics of the Recovery Program, ed. Douglass V Brown, Edward Chamberlin, and Seymour Edwin Harris. New York: McGraw-Hill.
———. 1942. Capitalism, Socialism, and Democracy. New York: Harper & Bros.
Sondermann, D. 2018. “Towards More Resilient Economies: The Role of Well-Functioning Economic Structures.” Journal of Policy Modeling 40(1): 97–117.
Torres, J., and T. T. Tran. 2021. “Global Job Reallocation during the COVID-19 Pandemic.” Unpublished paper, World Bank, Washington, DC.
Van Reenen, J. 2018. “Increasing Differences between Firms: Market Power and the Mac-ro-Economy.” CEP Discussion Paper dp1576, Centre for Economic Performance, Lon-don School of Economics.

Chapter 2: Competition and Firm Recovery Post-COVID-19 ● 87
Vitale, C., R. Bitetti, I. Wanner, E. Danitz, and C. Moiso. 2020. “The 2018 Edition of the OECD PMR indicators and Database: Methodological Improvements and Policy In-sights.” OECD Economics Department Working Paper 1604, OECD Publishing, Par-is. https://doi.org/10.1787/2cfb622f-en.
World Bank. 2012. Global Financial Development Report 2013: Rethinking the Role of the State in Finance. Washington, DC.
———. 2020a. Global Economic Prospects. June. Washington, DC.
———. 2020b. Worldwide Bureaucracy Indicators Version 1.1. Washington, DC. https://databank.worldbank.org/source/worldwide-bureaucracy-indicators-(wwbi).
———. 2021a. “Firm-Level Productivity Estimates.” Methodological Note, Washington, DC.
——— 2021b. Global Economic Prospects. June. Washington, DC.
———. 2021c. Supporting Firms in Restructuring and Recovery. EFI Insight: Finance, Competitiveness and Innovation, Washington, DC.


PART
Selected Country Pages
II


Selected Country Pages ● 91
42 MPO Oct 21
o t oll
In 2020, the pandemic hit Albania’s econo-my hard. GDP fell by 4 percent, and the government incurred additional public debt to mitigate the economic losses through increased spending. Activity has rebounded in 2021 and GDP is projected to increase by 7.2 percent, as restrictions are lifted and construction activity resumes, including the reconstruc-tion following the 2019 earthquake. However, economic prospects remain uncertain as daily cases have started in-creasing again. Further, by August 2021, the vaccination rate stood at around 20 percent only. If reinstated, new contain-ment measures would delay the recovery of activity and employment, especially in services and manufacturing. The government successfully met its fi-nancing needs by issuing Eurobonds in 2020 and plans to repeat this in 2021. To allow public debt to increase further in 2021, the government temporarily sus-pended the fiscal rule of a declining debt-to-GDP.1 Still, the country’s bu ers re-main low in case of a new pandemic wave. n the absence of fiscal consolida-tion, refinancing ris s could arise if exter-nal financial mar et demand reverses and interest rates increase. The structural conditions for sustained growth are still weak. Although growth averaged a healthy 3.3 percent in 2015-2019, stagnant productivity, a firm landscape
dominated by Small and Medium Enter-prises that employ low-skilled, low-wage labor, limited access to finance, burden-some logistics, and poor market integra-tion discourage private investment. In addition, low public revenue mobilization at only 26.3 percent of GDP hinders much-needed investment in public infrastruc-ture and human capital.
t lo t The Albanian economy has shown encour-aging signs of recovery in 2021. Higher consumer confidence, external demand, and policy stimulus supported growth.
onstruction led growth in the first uarter of 2021 and is expected to remain
strong, thanks to reconstruction and new infrastructure pro ects. trong external demand and favorable hydrologic condi-tions have boosted extractives and energy production and tourism exports. Meanwhile, in ationary pressure is build-ing up. Food and oil prices pushed aver-age in ation to 1. percent in 2, from 0. percent in 1. hile core in ation re-mains stable at 1.4, upward pressure could intensify with the expansion of de-mand and monetary and fiscal stimulus. The labor market has not recovered yet.
abor force participation in 2 2021 con-tinues to be below 2 201 . There is still a deficit of about thousand obs relative to 2 201 . nemployment started to de-cline slightly in 2, especially for wor ers under 30. Formal real wages rose by 2.9 percent, partially because of an increase in
ALBANIA
FIGURE 1 Albania / Headline inflation and core inflation FIGURE 2 Albania / Actual and projected poverty rates and real GDP per capita
Sources: INSTAT and World Bank. Source: World Bank. Notes: see Table 2.
The economic recovery in 2021 is strong-er than anticipated, as travel, construc-tion, and extractives bounced back follow-ing robust international demand. Private investment, consumption, and public spending have led growth. Macroeconom-ic policies have supported the recovery, although higher public spending has lifted the debt-to-GDP ratio for the second year. Employment and labor force participation have yet to recover, but rising incomes should lead to a modest fall in poverty. Uncertainty remains high as daily Covid-19 cases are increasing again.
Table 1 2020Population, million 2.8GDP, current US$ billion 1 4.9GDP per capita, current US$ 5321 .4
Upper middle-income poverty rate ($5.5)a 33.8
Gini indexa 33.2
School enro llment, primary (% gross)b 1 04.8
Life expectancy at birth, yearsb 78.6Total GHG Emissions (mtCO2e) 9.8
(b) M ost recent WDI value (201 9).
Source: WDI, M acro Poverty Outlook, and off icial data.(a) M ost recent value (201 7), 201 1 PPPs.
Poverty rate (%) Real GDP per capita (LCU constant)
0
100000
200000
300000
400000
500000
600000
0
5
10
15
20
25
30
35
40
45
2005 2007 2009 2011 2013 2015 2017 2019 2021 2023
Upper middle-income pov. rate
Real GDP pc
-1.5
-1.0
-0.5
0.0
0.5
1.0
1.5
2.0
2.5
3.0
Jan-
16
May
-16
Sep-
16
Jan-
17
May
-17
Sep-
17
Jan-
18
May
-18
Sep-
18
Jan-
19
May
-19
Sep-
19
Jan-
20
May
-20
Sep-
20
Jan-
21
May
-21
Inflation (CPI) Core inflation
Percent
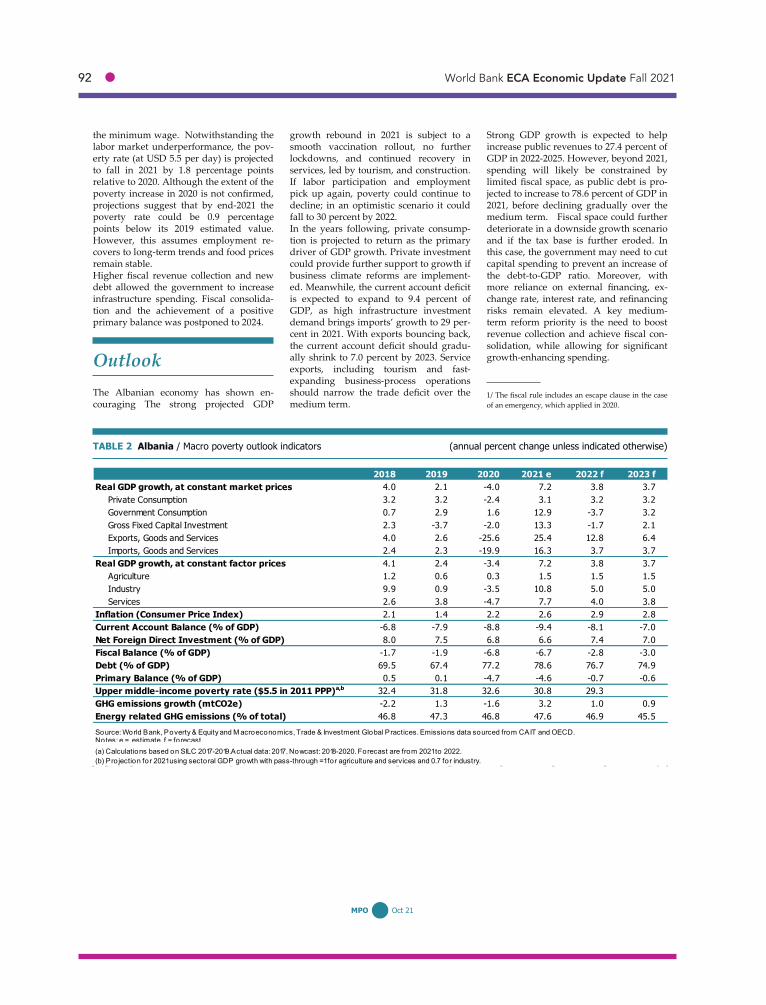
92 ● World Bank ECA Economic Update Fall 2021
43 MPO Oct 21
the minimum wage. Notwithstanding the labor market underperformance, the pov-erty rate (at USD 5.5 per day) is projected to fall in 2021 by 1.8 percentage points relative to 2020. Although the extent of the poverty increase in 2020 is not confirmed, projections suggest that by end-2021 the poverty rate could be 0.9 percentage points below its 2019 estimated value. However, this assumes employment re-covers to long-term trends and food prices remain stable. Higher fiscal revenue collection and new debt allowed the government to increase infrastructure spending. Fiscal consolida-tion and the achievement of a positive primary balance was postponed to 2024.
Outlook The Albanian economy has shown en-couraging The strong projected GDP
growth rebound in 2021 is subject to a smooth vaccination rollout, no further lockdowns, and continued recovery in services, led by tourism, and construction. If labor participation and employment pick up again, poverty could continue to decline; in an optimistic scenario it could fall to 30 percent by 2022. In the years following, private consump-tion is projected to return as the primary driver of GDP growth. Private investment could provide further support to growth if business climate reforms are implement-ed. Meanwhile, the current account deficit is expected to expand to 9.4 percent of GDP, as high infrastructure investment demand brings imports’ growth to 29 per-cent in 2021. With exports bouncing back, the current account deficit should gradu-ally shrink to 7.0 percent by 2023. Service exports, including tourism and fast-expanding business-process operations should narrow the trade deficit over the medium term.
Strong GDP growth is expected to help increase public revenues to 27.4 percent of GDP in 2022-2025. However, beyond 2021, spending will likely be constrained by limited fiscal space, as public debt is pro-jected to increase to 78.6 percent of GDP in 2021, before declining gradually over the medium term. Fiscal space could further deteriorate in a downside growth scenario and if the tax base is further eroded. In this case, the government may need to cut capital spending to prevent an increase of the debt-to-GDP ratio. Moreover, with more reliance on external financing, ex-change rate, interest rate, and refinancing risks remain elevated. A key medium-term reform priority is the need to boost revenue collection and achieve fiscal con-solidation, while allowing for significant growth-enhancing spending.
TABLE 2 Albania / Macro poverty outlook indicators (annual percent change unless indicated otherwise)
2018 2019 2020 2021 e 2022 f 2023 fReal GDP growth, at constant market prices 4.0 2.1 -4.0 7.2 3.8 3.7
Private Consumption 3.2 3.2 -2.4 3.1 3.2 3.2Government Consumption 0.7 2.9 1.6 12.9 -3.7 3.2Gross Fixed Capital Investment 2.3 -3.7 -2.0 13.3 -1.7 2.1Exports, Goods and Services 4.0 2.6 -25.6 25.4 12.8 6.4Imports, Goods and Services 2.4 2.3 -19.9 16.3 3.7 3.7
Real GDP growth, at constant factor prices 4.1 2.4 -3.4 7.2 3.8 3.7Agriculture 1.2 0.6 0.3 1.5 1.5 1.5Industry 9.9 0.9 -3.5 10.8 5.0 5.0Services 2.6 3.8 -4.7 7.7 4.0 3.8
Inflation (Consumer Price Index) 2.1 1.4 2.2 2.6 2.9 2.8Current Account Balance (% of GDP) -6.8 -7.9 -8.8 -9.4 -8.1 -7.0Net Foreign Direct Investment (% of GDP) 8.0 7.5 6.8 6.6 7.4 7.0Fiscal Balance (% of GDP) -1.7 -1.9 -6.8 -6.7 -2.8 -3.0Debt (% of GDP) 69.5 67.4 77.2 78.6 76.7 74.9Primary Balance (% of GDP) 0.5 0.1 -4.7 -4.6 -0.7 -0.6Upper middle-income poverty rate ($5.5 in 2011 PPP)a,b 32.4 31.8 32.6 30.8 29.3GHG emissions growth (mtCO2e) -2.2 1.3 -1.6 3.2 1.0 0.9Energy related GHG emissions (% of total) 46.8 47.3 46.8 47.6 46.9 45.5Source: World Bank, Poverty & Equity and M acroeconomics, Trade & Investment Global Practices. Emissions data sourced from CAIT and OECD.Notes: e = estimate, f = forecast.NA(a) Calculations based on SILC 2017-2019.Actual data: 2017. Nowcast: 2018-2020. Forecast are from 2021 to 2022.(b) Pro jection for 2021 using sectoral GDP growth with pass-through =1 for agriculture and services and 0.7 for industry.
1/ The fiscal rule includes an escape clause in the case of an emergency, which applied in 2020.

Selected Country Pages ● 93
44 MPO Oct 21
Armenia’s economy expanded rapidly between 2017 and 2019, with an annual GDP growth rate averaging 6.8 percent.
n effective fiscal rule, an active inflation-targeting regime, and sound financial-sector oversight helped establish a track record of macroeconomic stability. The business environment gradually im-proved, with gains in market liberaliza-tion and pro-competition reform follow-ing the political realignment of 2018. However, in 2020 the twin shocks of the pandemic and the military confrontation with Azerbaijan derailed the economy. GDP fell by 7.4 percent, one of the sharpest contractions in the region, and poverty rates rose sharply, especially in urban areas. Emergency spending packages and lim-ited tax breaks provided as part of the fiscal response to the pandemic, coupled with declining revenues, pushed public debt to 67 percent of GDP in 2020. Howev-er, the debt composition remains favora-ble. The current-account deficit narrowed in 2020, while increased borrowing kept reserves adequate. The banking sector is well capitali ed, albeit with low profitabil-ity, though the impact of the 2020 shocks may yet unfold. The 2020 conflict was followed by a peri-od of heightened political uncertainty, but snap elections held in June 2021 have helped stabilize the situation. A tense
geopolitical context, combined with un-addressed structural issues, continues to prevent the country from reaching its full potential.
The economy expanded by 4.9 percent, year-on-year y y in the first half 1 of 2021, faster than anticipated, reflecting also the base effect of a contraction in 1 2020. ervices led the recovery, benefiting from limited pandemic-related restrictions in 2021, while agricultural and industrial growth were more modest. Rebounding private consumption supported by greater mobility, recovering employment rates, and increased investment drove growth on the demand side. The unemployment rate fell by 2.7 percentage points y/y in the first quarter of 2021, albeit from a histori-cally high base of around 20 percent. Inflation has picked up to . percent y y in August, its highest level since 2013 and well above the 5.5 percent upper bound of the Central Bank of Armenia’s (CBA) in-flation target range. igh international food and energy prices and the pass-through effect of a more volatile exchange rate intensified inflationary pressures. In response, the CBA increased the policy rate by 300 basis points since end-2020 to 7.25 percent in mid-September 2021. Fiscal revenues exceeded budgeted levels by 13 percent in H1 2021, as growth ex-ceeded expectation, while expenditures were executed almost as planned. The budget deficit narrowed to 1.1 percent of
ARMENIA
FIGURE 1 Armenia / GDP growth, fiscal and current account balances
FIGURE 2 Armenia / Actual and projected poverty rates and real GDP per capita
Sources: Statistical Committee of the Republic of Armenia, Central Bank of Armenia and World Bank staff projections.
Source: World Bank. Notes: see Table 2.
Due to the twin shocks of the pandemic and the conflict with Azerbaijan, Arme-nia’s economy contracted sharply in 2020, which inflicted a significant welfare loss. The economic recovery in 2021 has been faster than anticipated, and the econ-omy is likely to return to pre-COVID output levels by mid-2022. The slow pace of vaccinations, rising COVID-19 cases, and geopolitical fragility present im-portant risks to the outlook.
Table 1 2020Population, million 2.9GDP, current US$ billion 1 2.6GDP per capita, current US$ 4344.8
International poverty rate ($1.9)a 1 .1
Lower middle-income poverty rate ($3.2)a 9.8
Upper middle-income poverty rate ($5.5)a 44.0
Gini indexa 29.9
School enro llment, primary (% gross)b 91 .8
Life expectancy at birth, yearsb 75.1Total GHG Emissions (mtCO2e) 9.1
(b) M ost recent WDI value (201 9).
Source: WDI, M acro Poverty Outlook, and off icial data.(a) M ost recent value (201 9), 201 1 PPPs.
Poverty rate (%) Real GDP per capita (LCU constant)
0
500000
1000000
1500000
2000000
2500000
0
10
20
30
40
50
60
70
80
2004 2006 2008 2010 2012 2014 2016 2018 2020 2022International poverty rate Lower middle-income pov. rateUpper middle-income pov. rate Real GDP pc
-12
-8
-4
0
4
8
2016 2017 2018 2019 2020 2021f 2022f 2023fReal GDP growth, % changeCAB, % of GDPFiscal balance, % of GDP
Percent

94 ● World Bank ECA Economic Update Fall 2021
45 MPO Oct 21
projected annual GDP in H1 2021, below the 2.6 percent deficit anticipated in the original budget. The current-account balance continued to improve in H1 2021, y/y. Exports of goods recovered faster than imports in nominal terms (up 23 and 8 percent, respectively), as rising global copper prices added to the slow growth of export volumes. Rising tourist arrivals and the recovery of re-mittances improved the services and in-come balances, while FDI inflows expand-ed from a low base in 2020. An improving current-account balance and the issuance of a US$750 million Eurobond in February 2021 boosted international reserves to seven months of import coverage. Political uncertainty increased pressure on the Ar-menian dram in early 2021, but the ex-change rate has stabilized since July. After declining from March to July of 2021, daily COVID-19 infections have be-gun rising again, though as of mid- Sep-tember reported infections remained be-low last two peak levels. The pace of vac-cinations has been slow, hindered by vac-cine hesitancy, and only 6.6 percent of the adult population was fully vaccinated by September 26th.
Following a faster-than-expected recovery in H1, the projected GDP growth rate for 2021 has been revised to 6.1 percent, up from 3.4 percent in April 2021. In the ab-sence of renewed lockdowns or serious domestic or regional instability, the econo-my is expected to return to pre-COVID output levels by mid-2022. Private consumption will continue to drive the recovery as rising employment rates, wage levels, and remittance inflows bolster household incomes. Private in-vestment growth is expected to acceler-ate, while fiscal consolidation may slow the growth of public investment. The government’s medium-term expenditure framework anticipates a narrowing of the deficit from 5.1 percent of GDP in 2020 to around 2 percent in 2023, contributing to a decline in the public debt-to-GDP ratio from 67.4 percent at end-2020 to 63.4 per-cent in 2023. While output is projected to rebound rap-idly, the more gradual recovery of the labor market will attenuate the impact of
renewed growth on poverty and inequali-ty. Increased generosity of support measures and improved program target-ing could help minimize the long-term impact of the economic shocks of 2020 on economic opportunity, household vulner-ability, and gender parity. The average inflation rate is forecast to remain above the CBA’s target band in 2021, but it should converge with the 4 percent target in the medium term as monetary policy anchors inflationary ex-pectations. Elevated inflation rates will adversely affect distributional equity and household welfare. The current-account deficit is projected to narrow in 2021 and then widen over the medium term as imports fully recover. FDI inflows are expected to increase but will remain low. Risks to the outlook are balanced. The key downside risks are limited progress in COVID-19 vaccinations, rising COVID-19 cases, geopolitical tensions, and a delayed recovery among major trading partners. On the upside, greater political certainty may enable renewed progress on the im-plementation of structural reforms while accelerating public investment.
TABLE 2 Armenia / Macro poverty outlook indicators (annual percent change unless indicated otherwise)
2018 2019 2020 2021 e 2022 f 2023 fReal GDP growth, at constant market prices 5.2 7.6 -7.4 6.1 4.8 5.4
Private Consumption 4.9 11.5 -13.8 6.0 5.9 6.4Government Consumption -3.0 12.9 15.2 4.1 -3.9 2.7Gross Fixed Capital Investment 4.8 4.4 -8.6 6.2 8.1 8.2Exports, Goods and Services 5.0 16.0 -32.4 6.5 10.2 12.5Imports, Goods and Services 13.3 11.6 -31.7 5.6 9.5 12.8
Real GDP growth, at constant factor prices 4.9 7.7 -7.1 6.1 4.8 5.4Agriculture -6.9 -5.8 -4.1 6.4 4.0 3.9Industry 3.7 10.5 -3.0 3.5 4.1 5.1Services 9.0 9.7 -9.8 7.4 5.3 5.9
Inflation (Consumer Price Index) 2.5 1.4 1.2 6.3 4.2 4.0Current Account Balance (% of GDP) -7.0 -7.4 -3.8 -3.0 -4.1 -5.3Net Foreign Direct Investment (% of GDP) 2.1 1.7 0.6 1.7 2.3 2.6Fiscal Balance (% of GDP) -1.6 -0.8 -5.1 -5.0 -3.0 -2.3Debt (% of GDP) 55.7 53.7 67.4 66.9 65.8 63.4Primary Balance (% of GDP) 0.7 1.6 -2.4 -2.5 -1.1 -0.3International poverty rate ($1.9 in 2011 PPP)a,b,c 1.4 1.1 1.3 1.2 1.0 0.6Lower middle-income poverty rate ($3.2 in 2011 PPP)a,b,c 9.4 9.8 12.5 10.7 9.2 7.9Upper middle-income poverty rate ($5.5 in 2011 PPP)a,b,c 42.5 44.0 50.2 46.4 42.8 39.5GHG emissions growth (mtCO2e) 0.8 5.1 -7.6 5.3 4.5 4.8Energy related GHG emissions (% of total) 59.7 61.1 60.2 60.9 61.3 62.0Source: World Bank, Poverty & Equity and M acroeconomics, Trade & Investment Global Practices. Emissions data sourced from CAIT and OECD.Notes: e = estimate, f = forecast.NA(a) Calculations based on ECAPOV harmonization, using 2019-ILCS.Actual data: 2019. Nowcast: 2020. Forecast are from 2021 to 2023.(b) Projection using neutral distribution (2019) with pass-through = 0.87 based on GDP per capita in constant LCU. (c) The poverty rates for 2019 are not strictly comparable with 2018 due to revisions on the ILCS starting in 2019.

Selected Country Pages ● 95
46 MPO Oct 21
Azerbaijan is an upper-middle-income country in the South Caucasus. Its over-reliance on hydrocarbon products as a major source of export and fiscal reve-nues remains its major vulnerability, especially given the declining oil produc-tion, the perpetual volatility of commodi-ties markets, and the global transition away from fossil fuels. Azerbaijan was hit hard by the COVID-19 pandemic, but substantial reserve buffers and low public debt levels have helped the country weather the ensuing economic crisis. Nevertheless, the pandemic has adversely impacted employment, wages, and poverty rates. Over the medium and longer term, under-lying structural weaknesses including an undiversified asset mix, heavy state eco-nomic footprint, institutional rigidities, an uneven private sector playing field, stag-nating human capital indicators, and weak financial markets threaten Azerbai-jan’s continued growth. In 2021, the gov-ernment presented its 2030 national devel-opment vision which aspires to address the country’s structural challenges. Regional geopolitical tensions eased fol-lowing the signing of a ceasefire agree-ment between Azerbaijan and Armenia in November 2020. Although the security situation remains fragile, reconstruction efforts are underway, and the authorities approved a program to rebuild damaged
infrastructure and restart socioeconomic development in the conflict-a icted areas.
The COVID-19 pandemic continues to affect Azerbaijan. In the spring, the gov-ernment’s mitigation efforts shifted from strict mobility restrictions to vaccinations, and by mid-September about 63 percent of the adult population had received at least one vaccine dose. The authorities also be-gan requiring COVID-19 passports to enter public spaces starting on September 1st. Economic conditions improved after the lockdown was lifted in May and OPEC+ started gradually relaxing its oil-production quotas, and the overall eco-nomic growth rate reached 3.6 percent, year on year (y/y), in the first eight months of 2021. The nonoil/gas sector led the recovery, expanding by 5.7 percent over the period. On the demand side, public and private investment remained weak, contracting by 10.1 percent y/y during January-August 2021, while the release of pent-up consumer demand coupled with counter-cyclical fiscal spending supported con-sumption growth. Net exports also in-creased significantly, as high global ener-gy prices, recovering oil production, and expanding gas production more than offset a rise in imports. Rebounding domestic demand, rising global commodity prices, and increased administrative prices boosted consumer price inflation to 4.8 percent y/y in the first
AZERBAIJAN
FIGURE 1 Azerbaijan / Nonoil GDP growth and oil price FIGURE 2 Azerbaijan / Official poverty rate and unemployment
Sources: State Statistical Committee of Azerbaijan and World Bank staff estimates. Source: State Statistical Committee of Azerbaijan. Note: The World Bank has not reviewed the official poverty rates for 2013–20.
After contracting in 2020, Azerbaijan’s economy has rebounded strongly in 2021, with recovery in the nonoil/gas sectors combined with rising hydrocar-bon production and prices. While the pandemic’s evolution remains uncer-tain, solid progress on vaccinations and significant financial buffers are ex-pected to help the economy reach pre-pandemic levels by end-2021, and sup-port households to recover from the crisis. Structural weaknesses need to be addressed to sustain future growth.
Table 1 2020Population, million 1 0.1GDP, current US$ billion 42.6GDP per capita, current US$ 421 7.8
School enro llment, primary (% gross)a 97.9
Life expectancy at birth, yearsa 73.0Total GHG Emissions (mtCO2e) 73.2
Source: WDI, M acro Poverty Outlook, and off icial data.(a) M ost recent WDI value (201 9).
0
50
100
150
200
250
300
350
400
0
2
4
6
8
10
2010 2011 2012 2013 2014 2015 2016 2017 2018 2019 2020
Official poverty rate (LHS)Number of unemployed persons (ILO methodology) (RHS)
TPercent of population Thousand persons
-6
-4
-2
0
2
4
6
8
10
12
0
20
40
60
80
100
120
2012 2013 2014 2015 2016 2017 2018 2019 2020 2021 2022 2023
Crude oil price, avg (LHS)Non-oil GDP growth (RHS)
US$/bbl Percent
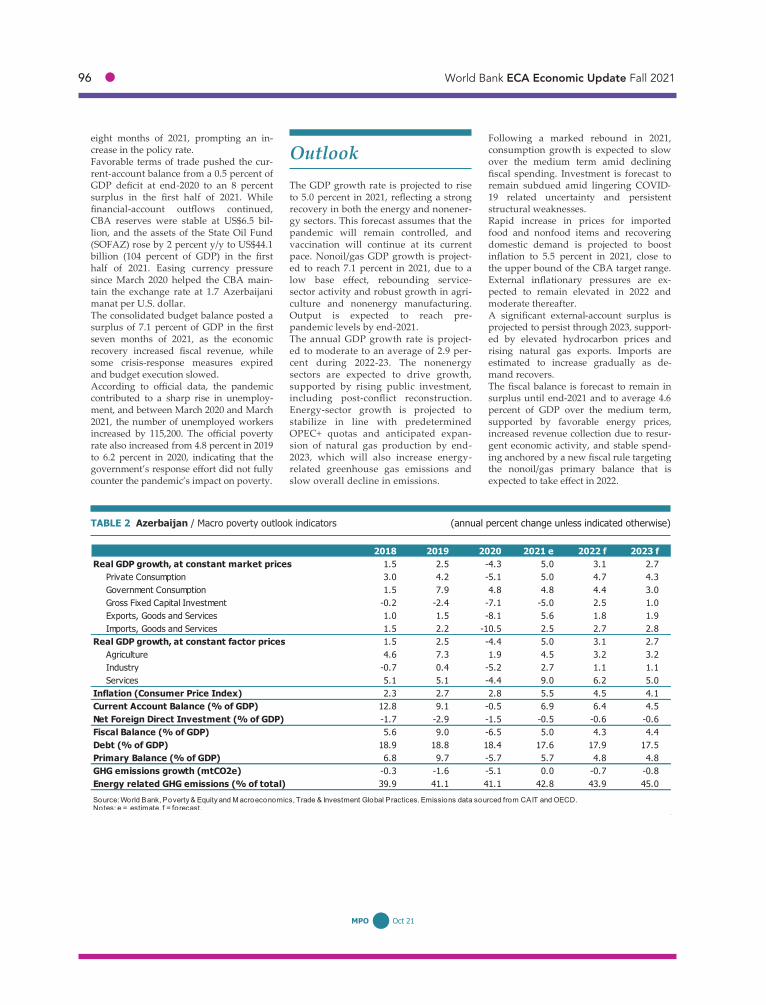
96 ● World Bank ECA Economic Update Fall 2021
47 MPO Oct 21
eight months of 2021, prompting an in-crease in the policy rate. Favorable terms of trade pushed the cur-rent-account balance from a 0.5 percent of GDP deficit at end-2020 to an 8 percent surplus in the first half of 2021. While financial-account outflows continued, CBA reserves were stable at US$6.5 bil-lion, and the assets of the State Oil Fund (SOFAZ) rose by 2 percent y/y to US$44.1 billion (104 percent of GDP) in the first half of 2021. Easing currency pressure since March 2020 helped the CBA main-tain the exchange rate at 1.7 Azerbaijani manat per U.S. dollar. The consolidated budget balance posted a surplus of 7.1 percent of GDP in the first seven months of 2021, as the economic recovery increased fiscal revenue, while some crisis-response measures expired and budget execution slowed. According to official data, the pandemic contributed to a sharp rise in unemploy-ment, and between March 2020 and March 2021, the number of unemployed workers increased by 115,200. The official poverty rate also increased from 4.8 percent in 2019 to 6.2 percent in 2020, indicating that the government’s response effort did not fully counter the pandemic’s impact on poverty.
The GDP growth rate is projected to rise to 5.0 percent in 2021, reflecting a strong recovery in both the energy and nonener-gy sectors. This forecast assumes that the pandemic will remain controlled, and vaccination will continue at its current pace. Nonoil/gas GDP growth is project-ed to reach 7.1 percent in 2021, due to a low base effect, rebounding service-sector activity and robust growth in agri-culture and nonenergy manufacturing. Output is expected to reach pre-pandemic levels by end-2021. The annual GDP growth rate is project-ed to moderate to an average of 2.9 per-cent during 2022-23. The nonenergy sectors are expected to drive growth, supported by rising public investment, including post-conflict reconstruction. Energy-sector growth is projected to stabilize in line with predetermined OPEC+ quotas and anticipated expan-sion of natural gas production by end-2023, which will also increase energy-related greenhouse gas emissions and slow overall decline in emissions.
Following a marked rebound in 2021, consumption growth is expected to slow over the medium term amid declining fiscal spending. Investment is forecast to remain subdued amid lingering COVID-19 related uncertainty and persistent structural weaknesses. Rapid increase in prices for imported food and nonfood items and recovering domestic demand is projected to boost inflation to 5.5 percent in 2021, close to the upper bound of the CBA target range. External inflationary pressures are ex-pected to remain elevated in 2022 and moderate thereafter. A significant external-account surplus is projected to persist through 2023, support-ed by elevated hydrocarbon prices and rising natural gas exports. Imports are estimated to increase gradually as de-mand recovers. The fiscal balance is forecast to remain in surplus until end-2021 and to average 4.6 percent of GDP over the medium term, supported by favorable energy prices, increased revenue collection due to resur-gent economic activity, and stable spend-ing anchored by a new fiscal rule targeting the nonoil/gas primary balance that is expected to take effect in 2022.
TABLE 2 Azerbaijan / Macro poverty outlook indicators (annual percent change unless indicated otherwise)
2018 2019 2020 2021 e 2022 f 2023 fReal GDP growth, at constant market prices 1.5 2.5 -4.3 5.0 3.1 2.7
Private Consumption 3.0 4.2 -5.1 5.0 4.7 4.3Government Consumption 1.5 7.9 4.8 4.8 4.4 3.0Gross Fixed Capital Investment -0.2 -2.4 -7.1 -5.0 2.5 1.0Exports, Goods and Services 1.0 1.5 -8.1 5.6 1.8 1.9Imports, Goods and Services 1.5 2.2 -10.5 2.5 2.7 2.8
Real GDP growth, at constant factor prices 1.5 2.5 -4.4 5.0 3.1 2.7Agriculture 4.6 7.3 1.9 4.5 3.2 3.2Industry -0.7 0.4 -5.2 2.7 1.1 1.1Services 5.1 5.1 -4.4 9.0 6.2 5.0
Inflation (Consumer Price Index) 2.3 2.7 2.8 5.5 4.5 4.1Current Account Balance (% of GDP) 12.8 9.1 -0.5 6.9 6.4 4.5Net Foreign Direct Investment (% of GDP) -1.7 -2.9 -1.5 -0.5 -0.6 -0.6Fiscal Balance (% of GDP) 5.6 9.0 -6.5 5.0 4.3 4.4Debt (% of GDP) 18.9 18.8 18.4 17.6 17.9 17.5Primary Balance (% of GDP) 6.8 9.7 -5.7 5.7 4.8 4.8GHG emissions growth (mtCO2e) -0.3 -1.6 -5.1 0.0 -0.7 -0.8Energy related GHG emissions (% of total) 39.9 41.1 41.1 42.8 43.9 45.0Source: World Bank, Poverty & Equity and M acroeconomics, Trade & Investment Global Practices. Emissions data sourced from CAIT and OECD.Notes: e = estimate, f = forecast.NA
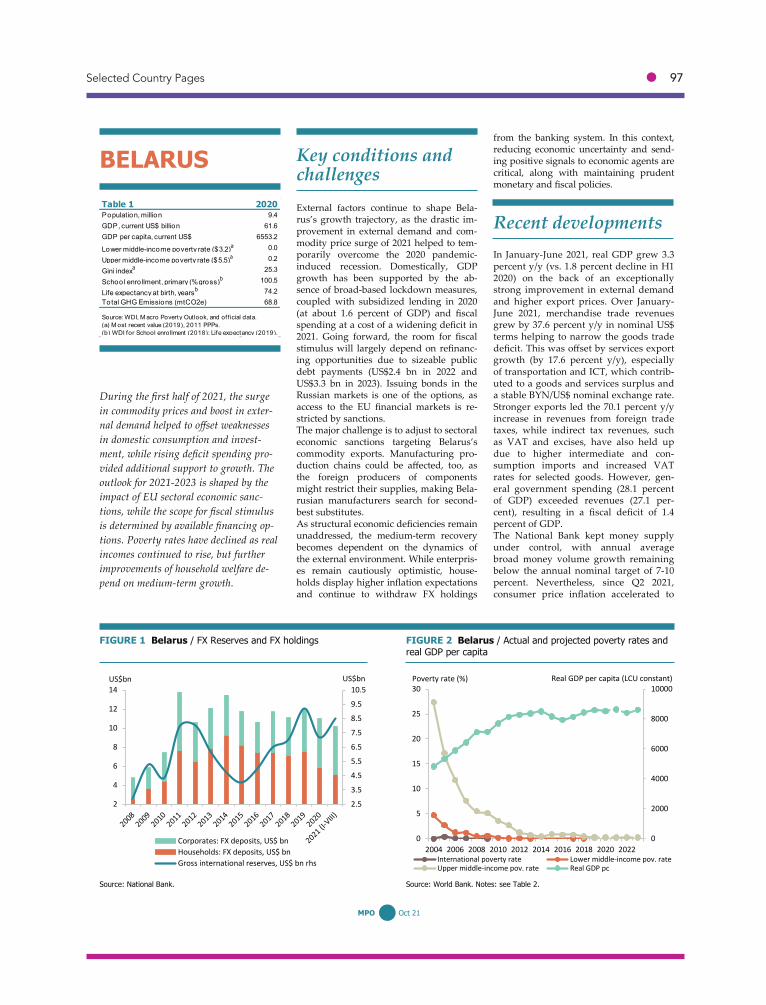
Selected Country Pages ● 97
48 MPO Oct 21
o t oll
External factors continue to shape Bela-rus’s growth trajectory, as the drastic im-provement in external demand and com-modity price surge of 2021 helped to tem-porarily overcome the 2020 pandemic-induced recession. Domestically, GDP growth has been supported by the ab-sence of broad-based lockdown measures, coupled with subsidized lending in 2020 (at about 1. percent of GDP) and fiscal spending at a cost of a widening deficit in 2021. Going forward, the room for fiscal stimulus will largely depend on refinanc-ing opportunities due to sizeable public debt payments (US$2.4 bn in 2022 and US$3.3 bn in 2023). Issuing bonds in the Russian markets is one of the options, as access to the U financial markets is re-stricted by sanctions. The major challenge is to adjust to sectoral economic sanctions targeting Belarus’s commodity exports. Manufacturing pro-duction chains could be affected, too, as the foreign producers of components might restrict their supplies, making Bela-rusian manufacturers search for second-best substitutes. As structural economic deficiencies remain unaddressed, the medium-term recovery becomes dependent on the dynamics of the external environment. While enterpris-es remain cautiously optimistic, house-holds display higher inflation expectations and continue to withdraw FX holdings
from the banking system. In this context, reducing economic uncertainty and send-ing positive signals to economic agents are critical, along with maintaining prudent monetary and fiscal policies.
t lo t In January-June 2021, real GDP grew 3.3 percent y/y (vs. 1.8 percent decline in H1 2020) on the back of an exceptionally strong improvement in external demand and higher export prices. Over January-June 2021, merchandise trade revenues grew by 37.6 percent y/y in nominal US$ terms helping to narrow the goods trade deficit. his was offset by services export growth (by 17.6 percent y/y), especially of transportation and ICT, which contrib-uted to a goods and services surplus and a stable BYN/US$ nominal exchange rate. Stronger exports led the 70.1 percent y/y increase in revenues from foreign trade taxes, while indirect tax revenues, such as VAT and excises, have also held up due to higher intermediate and con-sumption imports and increased VAT rates for selected goods. However, gen-eral government spending (28.1 percent of GDP) exceeded revenues (27.1 per-cent), resulting in a fiscal deficit of 1.4 percent of GDP. The National Bank kept money supply under control, with annual average broad money volume growth remaining below the annual nominal target of 7-10 percent. Nevertheless, since Q2 2021, consumer price inflation accelerated to
BELARUS
FIGURE 1 Belarus / FX Reserves and FX holdings FIGURE 2 Belarus / Actual and projected poverty rates and real GDP per capita
Source: National Bank. Source: World Bank. Notes: see Table 2.
During the first half of 2021, the surge in commodity prices and boost in exter-nal demand helped to offset weaknesses in domestic consumption and invest-ment, while rising deficit spending pro-vided additional support to growth. The outlook for 2021-2023 is shaped by the impact of EU sectoral economic sanc-tions, while the scope for fiscal stimulus is determined by available financing op-tions. Poverty rates have declined as real incomes continued to rise, but further improvements of household welfare de-pend on medium-term growth.
Table 1 2020Population, million 9.4GDP, current US$ billion 61 .6GDP per capita, current US$ 6553.2
Lower middle-income poverty rate ($3.2)a 0.0
Upper middle-income poverty rate ($5.5)a 0.2
Gini indexa 25.3
School enro llment, primary (% gross)b 1 00.5
Life expectancy at birth, yearsb 74.2Total GHG Emissions (mtCO2e) 68.8
(b) WDI for School enrollment (201 8); Life expectancy (201 9).
Source: WDI, M acro Poverty Outlook, and off icial data.(a) M ost recent value (201 9), 201 1 PPPs.
Poverty rate (%) Real GDP per capita (LCU constant)
0
2000
4000
6000
8000
10000
0
5
10
15
20
25
30
2004 2006 2008 2010 2012 2014 2016 2018 2020 2022International poverty rate Lower middle-income pov. rateUpper middle-income pov. rate Real GDP pc
2.5
3.5
4.5
5.5
6.5
7.5
8.5
9.5
10.5
2
4
6
8
10
12
14
Corporates: FX deposits, US$ bnHouseholds: FX deposits, US$ bnGross international reserves, US$ bn rhs
US$bn US$bn

98 ● World Bank ECA Economic Update Fall 2021
49 MPO Oct 21
9.9 percent y/y in June 2021, double the annual target, due to an increase in ad-ministratively regulated prices, imposi-tion of VAT for selected medicines, and imported inflation. An outflow of household foreign curren-cy deposits, which started in July 2020, continued during the first half of 2021. By July 1, 2021, the total volume of deposits shrank by 10 percent y/y, driven mainly by the reduction of household deposits (27 percent y/y), being partially offset by increased foreign currency holding by corporates (18 percent y/y). External pub-lic debt repayment pressures have been alleviated by refinancing from Russia and spending of reserves, which decreased by US$528.5 million over January-March 2021. Gross foreign reserves have since partially recovered by US$469.3 million in April-June and then boosted by the IMF
SDR allocation in August, reaching US$8.5 bn, which is equivalent to 2.5 months of goods and services imports.
Outlook While the surge in commodity prices and boost in external demand helped to offset weaknesses in domestic consumption and investment, the pace of recovery remains weak. A solid 32.7 percent increase in goods and services exports y/y in January-June 2021 follows the 14 percent decline during the same period of 2020. Measured against the first half of 2019, export vol-umes were just 10 percent higher. Under these circumstances, once the base effects due to the recession in 2020 have passed and sectoral sanctions will gradually take
a toll, year on year growth is likely to stall in the second half of 2021, leaving full-year real GDP growth to reach 1.2 percent y/y. As sectoral sanctions introduced by the EU are expected to hit commodity export revenues harder in 2022, real GDP is pro-jected to decline by 2.8 percent y/y. While the impact on the current account would be cushioned by reduced imports, the restrictions introduced on access to the EU financial markets could negatively affect the financial account. Also, sanctions are likely to increase transaction costs not only for exporters, but also for companies operating in the domestic market. Continued household welfare growth will depend on the extent to which economic growth can be maintained in a challenging external environment with constrained fiscal space.
TABLE 2 Belarus / Macro poverty outlook indicators (annual percent change unless indicated otherwise)
2018 2019 2020 2021 e 2022 f 2023 fReal GDP growth, at constant market prices 3.1 1.4 -0.9 1.2 -2.8 2.3
Private Consumption 7.9 5.1 -1.4 -1.0 -1.8 2.1Government Consumption -0.4 0.4 -1.1 -0.4 -0.8 1.1Gross Fixed Capital Investment 4.4 6.2 -6.8 -2.8 -9.8 1.6Exports, Goods and Services 3.8 1.0 -3.2 3.6 -3.7 4.2Imports, Goods and Services 7.3 5.2 -7.9 7.4 -5.3 3.6
Real GDP growth, at constant factor prices 3.2 1.5 -0.9 1.2 -2.8 2.3Agriculture -3.4 3.0 4.9 -4.8 2.3 1.2Industry 5.2 1.4 -0.7 5.7 -4.2 3.4Services 2.9 1.3 -2.0 -1.1 -2.5 1.6
Inflation (Consumer Price Index) 4.9 4.7 7.4 10.5 7.1 5.7Current Account Balance (% of GDP) 0.0 -1.8 -0.4 -0.9 -3.0 -2.6Net Foreign Direct Investment (% of GDP) 2.4 2.0 1.0 1.0 1.0 1.0Fiscal Balance (% of GDP) 4.0 2.5 -1.7 -2.9 -1.9 -1.4Debt (% of GDP) 42.5 37.5 41.1 45.8 48.8 49.9Primary Balance (% of GDP) 5.9 4.3 0.0 -0.9 0.3 0.6Upper middle-income poverty rate ($5.5 in 2011 PPP)a,b 0.4 0.2 0.2 0.2 0.2 0.2Source: World Bank, Poverty & Equity and M acroeconomics, Trade & Investment Global Practices.Notes: e = estimate, f = forecast.NA(a) Calculations based on ECAPOV harmonization, using 2019-HHS.Actual data: 2019. Nowcast: 2020. Forecast are from 2021 to 2023.(b) Pro jection using neutral distribution (2019) with pass-through = 0.7 based on GDP per capita in constant LCU.

Selected Country Pages ● 99
50 MPO Oct 21
o t oll
BiH has signed the Stabilization and Asso-ciation Agreement with the EU and is a potential EU candidate country. Macroe-conomic stability was maintained over the last decade facilitated by the currency board peg to the euro, which, together with the EU membership prospects, re-mains a critical economic anchor. Despite real income growing roughly over 3 percent per annum since 2015, per capita GDP continues to hover around one-third of the EU27 average. This income gap is significantly larger compared to other peers in the Western Balkans. With contin-ued low investment rates and an economy driven by private consumption, achieving a more pronounced convergence toward the EU27 average will be challenging. While a full recovery to the 2019 real in-come level is expected in 2021, BiH is un-likely to catch up with the pre-pandemic growth trajectory, unless political bottle-necks are resolved (Graph 1). Fiscal surpluses ranged between 2 and 3 percent of GDP over the past six years prior to the pandemic, which in turn helped rein in the current account deficits averaging below 4 percent since 2015. The external shortfall was largely financed by net FDI inflows, mainly into the foreign-owned banking sector, which remained stable during the pandemic. Steady, albeit low, economic growth has not translated into more and better jobs,
with a large share of the workforce active in the informal sector. Hence, poverty rates do not seem to have improved, according to the latest o cial data from 2015. Implementation of much needed structural reforms is sluggish due to political dead-lock, pressures from frequent elections, corruption that pervades all levels of socie-ty, and a complex governing structure characterized by fragmentation of respon-sibilities between the two entities and Can-tons. The pandemic has further highlight-ed shortages in institutional effectiveness resulting in the slow release of fiscal sup-port to households and businesses, which has weighed on economic activity.
t lo t Real GDP contracted 3.2 percent in 2020, much less than previous o cial estimates of 4.3 percent suggested as manufactur-ing, wholesale and retail trade declined less than initially estimated. Moreover, driven by a surge in exports and robust private consumption, real GDP growth turned positive in the first quarter of 2021 (year-on-year) at an estimated rate of 1.5 percent. An acceleration in manufac-turing translated into a surge in exports to neighboring CEFTA countries, whereas the increase in private consumption re-sulted from pent-up demand as well as higher lending to households, and the impact of delivery apps connecting con-sumers to goods. Stronger household and government consumption have driven inflation to 0. percent during the period
BOSNIA AND HERZEGOVINA
FIGURE 1 Bosnia and Herzegovina / Real income, in bill KM
FIGURE 2 Bosnia and Herzegovina / Labor market indica-tors, 2020-2021
Sources: BiH Agency for Statistics (BHAS), World Bank staff estimates. Sources: LFS 2020 - 2021 report, World Bank staff calculations.
Real GDP is expected to expand 4 percent in 2021 after contracting 3.2 percent last year, while headline inflation is set to remain below 1 percent. After the rebound following the COVID-19 crisis, growth should stabilize around 3 percent over the medium-term. Addressing the political deadlock would allow the implementation of delayed structural reforms that are also part of EU accession priorities. The latter would help address persistent high unem-ployment, which worsened during the pandemic, and is key to reducing poverty.
Table 1 2020Population, million 3.3GDP, current US$ billion 1 9.6GDP per capita, current US$ 5939.4
Life expectancy at birth, yearsa 77.4Total GHG Emissions (mtCO2e) 23.9
Source: WDI, M acro Poverty Outlook, and off icial data.(a) M ost recent WDI value (201 9).
30
32
34
36
38
2018 2019 2020e 2021f 2022f 2023f
Real GDP
pre-COVID trajectory (projection basedon average real GDP growth 2015-2019)
projected post-COVID trajectory
47.1
39.3
16.7
47.4
38.4
19.0
0
10
20
30
40
50
60
Activity rate Emp. rate Unemp. rate
Q1 2020 Q2 2020 Q3 2020Q4 2020 Q1 2021
Percentage %
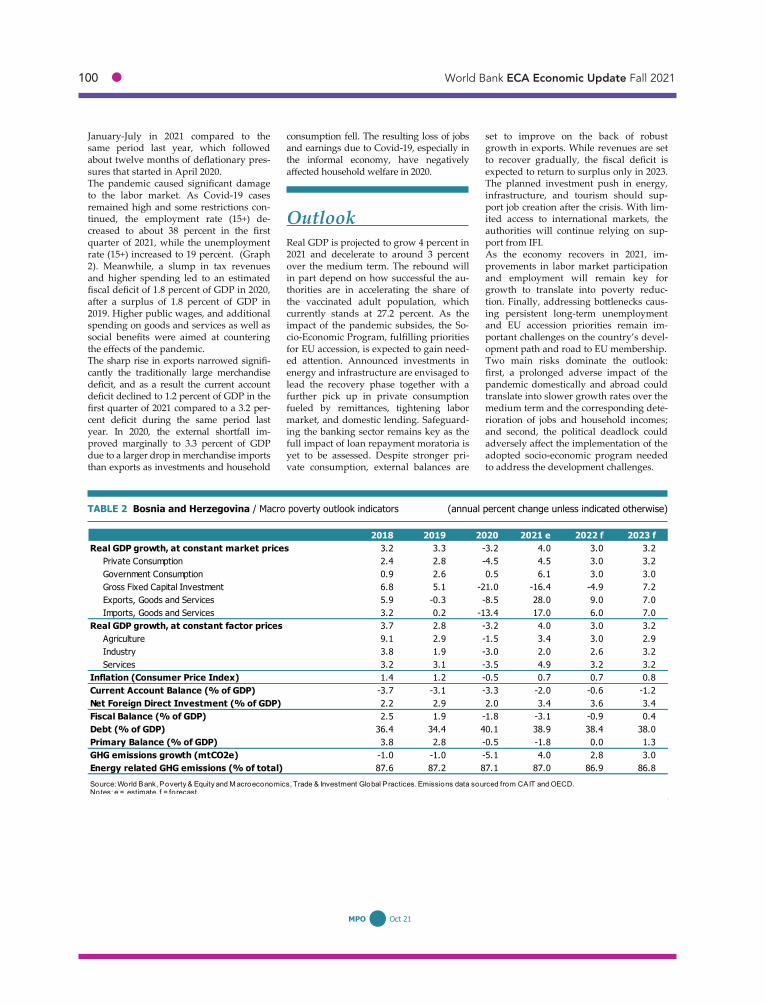
100 ● World Bank ECA Economic Update Fall 2021
51 MPO Oct 21
January-July in 2021 compared to the same period last year, which followed about twelve months of deflationary pres-sures that started in April 2020. The pandemic caused significant damage to the labor market. As Covid-19 cases remained high and some restrictions con-tinued, the employment rate (15+) de-creased to about 38 percent in the first quarter of 2021, while the unemployment rate (15+) increased to 19 percent. (Graph 2). Meanwhile, a slump in tax revenues and higher spending led to an estimated fiscal deficit of 1.8 percent of GDP in 2020, after a surplus of 1.8 percent of GDP in 2019. Higher public wages, and additional spending on goods and services as well as social benefits were aimed at countering the effects of the pandemic. The sharp rise in exports narrowed signifi-cantly the traditionally large merchandise deficit, and as a result the current account deficit declined to 1.2 percent of GDP in the first quarter of 2021 compared to a 3.2 per-cent deficit during the same period last year. In 2020, the external shortfall im-proved marginally to 3.3 percent of GDP due to a larger drop in merchandise imports than exports as investments and household
consumption fell. The resulting loss of jobs and earnings due to Covid-19, especially in the informal economy, have negatively affected household welfare in 2020.
Outlook
Real GDP is projected to grow 4 percent in 2021 and decelerate to around 3 percent over the medium term. The rebound will in part depend on how successful the au-thorities are in accelerating the share of the vaccinated adult population, which currently stands at 27.2 percent. As the impact of the pandemic subsides, the So-cio-Economic Program, fulfilling priorities for EU accession, is expected to gain need-ed attention. Announced investments in energy and infrastructure are envisaged to lead the recovery phase together with a further pick up in private consumption fueled by remittances, tightening labor market, and domestic lending. Safeguard-ing the banking sector remains key as the full impact of loan repayment moratoria is yet to be assessed. Despite stronger pri-vate consumption, external balances are
set to improve on the back of robust growth in exports. While revenues are set to recover gradually, the fiscal deficit is expected to return to surplus only in 2023. The planned investment push in energy, infrastructure, and tourism should sup-port job creation after the crisis. With lim-ited access to international markets, the authorities will continue relying on sup-port from IFI. As the economy recovers in 2021, im-provements in labor market participation and employment will remain key for growth to translate into poverty reduc-tion. Finally, addressing bottlenecks caus-ing persistent long-term unemployment and EU accession priorities remain im-portant challenges on the country’s devel-opment path and road to EU membership. Two main risks dominate the outlook: first, a prolonged adverse impact of the pandemic domestically and abroad could translate into slower growth rates over the medium term and the corresponding dete-rioration of jobs and household incomes; and second, the political deadlock could adversely affect the implementation of the adopted socio-economic program needed to address the development challenges.
TABLE 2 Bosnia and Herzegovina / Macro poverty outlook indicators (annual percent change unless indicated otherwise)
2018 2019 2020 2021 e 2022 f 2023 fReal GDP growth, at constant market prices 3.2 3.3 -3.2 4.0 3.0 3.2
Private Consumption 2.4 2.8 -4.5 4.5 3.0 3.2Government Consumption 0.9 2.6 0.5 6.1 3.0 3.0Gross Fixed Capital Investment 6.8 5.1 -21.0 -16.4 -4.9 7.2Exports, Goods and Services 5.9 -0.3 -8.5 28.0 9.0 7.0Imports, Goods and Services 3.2 0.2 -13.4 17.0 6.0 7.0
Real GDP growth, at constant factor prices 3.7 2.8 -3.2 4.0 3.0 3.2Agriculture 9.1 2.9 -1.5 3.4 3.0 2.9Industry 3.8 1.9 -3.0 2.0 2.6 3.2Services 3.2 3.1 -3.5 4.9 3.2 3.2
Inflation (Consumer Price Index) 1.4 1.2 -0.5 0.7 0.7 0.8Current Account Balance (% of GDP) -3.7 -3.1 -3.3 -2.0 -0.6 -1.2Net Foreign Direct Investment (% of GDP) 2.2 2.9 2.0 3.4 3.6 3.4Fiscal Balance (% of GDP) 2.5 1.9 -1.8 -3.1 -0.9 0.4Debt (% of GDP) 36.4 34.4 40.1 38.9 38.4 38.0Primary Balance (% of GDP) 3.8 2.8 -0.5 -1.8 0.0 1.3GHG emissions growth (mtCO2e) -1.0 -1.0 -5.1 4.0 2.8 3.0Energy related GHG emissions (% of total) 87.6 87.2 87.1 87.0 86.9 86.8Source: World Bank, Poverty & Equity and M acroeconomics, Trade & Investment Global Practices. Emissions data sourced from CAIT and OECD.Notes: e = estimate, f = forecast.NA

Selected Country Pages ● 101
52 MPO Oct 21
o t oll
Bulgaria remains the poorest and the most unequal country in the EU. Yet, as a result of the relatively milder impact of the pan-demic on its economy in 2020, real in-comes continued to converge to the EU average, reaching 55 percent of the aver-age GDP per capita in PPP terms. Never-theless, poverty kept edging up, reaching 23.8 percent in 2019 using the at-risk-of-poverty concept, with the trend expected to persist in 2020 due to the impact of COVID-19. This, together with Bulgaria historically registering the highest rates of inequality in the EU (40 percent) point to limited redistribution and ineffective so-cial policies. Amidst rapid aging and pop-ulation decline, convergence to the EU core can speed up only if the productivity gap shrinks markedly, while governance and institutional weaknesses are ad-dressed decisively. Since late 2020, howev-er, the country has been in a political crisis and has been unable to form a regular government despite two rounds of early elections. Although the caretaker govern-ment has taken steps to combat corruption and address some long-standing govern-ance issues, deeper structural reforms will require a regular government with a par-liamentary majority. The pandemic has aggravated weaknesses in a number of public domains - with the most pronounced being in health care and education - and resulted in a moderate
deterioration in the fiscal stance. Going forward, the authorities would need to engage in fiscal consolidation, including the challenging withdrawal of support measures, as soon as the recovery gains momentum. The planned conversion of some temporary social measures, such as pension supplements, into permanent sup-port indicates the di culty in unwinding anti-crisis measures. Over the longer run, the country’s key development challenges remain its weak productivity, wide ine-qualities of income and opportunities, state capture by private interests, and a costly transition out of carbon dependency.
t lo t Following a contraction of 4.2 percent in 2020, economic recovery gained momen-tum in Q2/2021 with GDP growth going into positive territory at 9.6% yoy. The key growth drivers included a 20.3 percent rise in exports and a notable increase in domestic demand and investment growth. As imports have been recovering at a fast-er pace than export, the CA balance moved in the red in H1 and is likely to stay there in the medium run, shrinking to -3.4 percent of GDP in 2023. In ation edged up to 3.0 percent yoy in July, due primarily to the fuel price spike. Yet, household incomes have been grow-ing faster in H1 by 7.7 percent yoy, due mostly to a significant increase in pension income. This suggests a real increase of incomes this year, which will become more pronounced going forward, because
BULGARIA
FIGURE 1 Bulgaria / Contribution to GDP growth, percentage points
FIGURE 2 Bulgaria / Actual and projected poverty rates (left-hand scale), and GDP per capita in constant LCU (right-hand scale)
Sources: World Bank, Bulgarian National Statistical Institute. Source: World Bank. Notes: see Table 2.
Bulgaria has embarked on a stronger-than-expected recovery, with growth projected at 3.7 percent in 2021. Yet, despite robust budget revenues, fiscal consolidation is likely to be postponed to 2022 due to con-tinuation of support measures. Going forward, an ongoing political crisis sug-gests reform slack and slim chances of tapping EU Resilience and Recovery Fa-cility before 2022. Also, slow inoculation rates imply that pandemic-related risks will remain high. In line with labor mar-ket improvements, poverty is expected to fall in 2021-2022.
Table 1 2020Population, million 6.9GDP, current US$ billion 67.9GDP per capita, current US$ 9840.6
International poverty rate ($1.9)a 0.9
Lower middle-income poverty rate ($3.2)a 2.2
Upper middle-income poverty rate ($5.5)a 6.9
Gini indexa 41 .3
School enro llment, primary (% gross)b 87.4
Life expectancy at birth, yearsb 74.9Total GHG Emissions (mtCO2e) 1 3.0
(b) WDI for School enrollment (201 8); Life expectancy (201 9).
Source: WDI, M acro Poverty Outlook, and off icial data.(a) M ost recent value (201 8), 201 1 PPPs.
Poverty rate (%) Real GDP per capita (LCU constant)
0
5000
10000
15000
20000
0
5
10
15
20
25
30
2006 2008 2010 2012 2014 2016 2018 2020 2022
International poverty rate Lower middle-income pov. rateUpper middle-income pov. rate Real GDP pc
-30
-20
-10
0
10
20
30
2000 2003 2006 2009 2012 2015 2018 2021
Gov. cons. Exports GFCFInventories Private cons. ImportsStatistical disc. GDP
Percent, percentage points

102 ● World Bank ECA Economic Update Fall 2021
53 MPO Oct 21
of base effects. The labor market showed first signs of improvement only in Q2/2021 when unemployment declined to 5.6 percent. The banking sector remains stable with non-performing loans at 6.7 percent as of end-June 2021 against 8.1 percent a year ago. The fiscal stance loosened notably in 2020 due to the economic downturn and the government’s support measures. The defi-cit reached 3 percent of GDP in 2020 and is projected to widen further in 2021. Poverty is anticipated to decline from 6.8 percent in 2020 to 6.2 percent in 2021 using the upper middle income US$5.50 PPP poverty line. The decline is largely attributable to improvement in house-hold finances stemming from a rebound in the labor market, as evidenced by fewer reports of work stoppages, re-duced hours and income, as well as con-tinued government support in the form of wage subsidies and pension supple-ments. Despite improvements, poorer households continue to report higher levels of economic distress as the longev-
ity of the crisis strains already limited economic resources.
Outlook
Economic growth is expected to rebound to 3.7 percent in 2021 but recovery to pre-crisis levels is likely to happen in 2022. In the short term, the biggest risk to the out-look is the slow pace of COVID vaccina-tion the slowest in the EU to date. With some 20 percent of the adult population vaccinated with at least one dose (and 18 percent fully vaccinated) as of mid-Aug compared with 75% with at least one dose in the EU, Bulgaria faces high risk of an-other peak of infections in early autumn, which may end up in new restrictions depending on the capacity of hospitals to handle the new wave. Potential restrictions would also weigh heavily on an already stretched budget and may lead to further overshooting of the deficit above 4 percent of GDP. Even if
budget revenues in 2021 are expected to exceed the plan due to improved economic growth forecasts for the year, some tempo-rary anti-crisis policies are likely to be con-verted in permanent spending measures, putting off fiscal consolidation. Current government plans foresee that absorption of the Recovery and Resilience Facility (RRF) envelope for Bulgaria will start in 2021, boosting budget revenue by 1.3 per-cent of GDP. Yet, as the national RRF plan has not yet been approved, this scenario seems increasingly unlikely. Another key risk in the short term is polit-ical instability. The country is heading towards another round of early elections in the autumn following snap elections in April and July 2021, which failed to pro-duce a ruling majority. Poverty is projected to decline further in 2022 to 5.9% as Bulgaria continues its eco-nomic recovery. However, this could be tempered by the slow pace of vaccination, restrained consumer spending in anticipa-tion of worsening finances and the un-winding of government support.
TABLE 2 Bulgaria / Macro poverty outlook indicators (annual percent change unless indicated otherwise)
2018 2019 2020 2021 e 2022 f 2023 fReal GDP growth, at constant market prices 3.1 3.7 -4.2 3.7 3.8 3.6
Private Consumption 4.4 5.5 0.2 4.7 3.4 3.2Government Consumption 5.4 2.0 7.5 16.7 2.3 1.5Gross Fixed Capital Investment 5.4 4.5 -5.1 4.3 6.3 5.5Exports, Goods and Services 1.7 3.9 -11.3 16.8 6.4 5.8Imports, Goods and Services 5.7 5.2 -6.6 20.5 6.0 5.1
Real GDP growth, at constant factor prices 3.5 3.3 -4.3 3.7 3.8 3.6Agriculture -2.0 4.1 -5.3 3.4 1.0 0.5Industry -1.1 -0.5 -4.6 4.5 4.0 3.9Services 5.8 4.6 -4.1 3.4 3.9 3.7
Inflation (Consumer Price Index) 2.8 3.1 1.7 3.2 3.3 3.4Current Account Balance (% of GDP) 0.9 1.8 -0.7 -3.9 -3.7 -3.4Net Foreign Direct Investment (% of GDP) -1.3 -1.9 -3.2 -1.7 -1.8 -1.9Fiscal Balance (% of GDP) 0.1 -1.0 -3.0 -3.5 -2.9 -2.2Debt (% of GDP) 22.3 20.2 25.0 28.2 29.6 30.0Primary Balance (% of GDP) 0.8 -0.4 -2.5 -3.2 -2.6 -1.8International poverty rate ($1.9 in 2011 PPP)a,b 0.9 0.8 0.9 0.8 0.7 0.7Lower middle-income poverty rate ($3.2 in 2011 PPP)a,b 2.2 2.0 2.1 2.0 1.9 1.8Upper middle-income poverty rate ($5.5 in 2011 PPP)a,b 6.9 6.3 6.8 6.2 5.9 5.4Source: World Bank, Poverty & Equity and M acroeconomics, Trade & Investment Global Practices.Notes: e = estimate, f = forecast.NA(a) Calculations based on ECAPOV harmonization, using 2018-EU-SILC.Actual data: 2018. Nowcast: 2019-2020. Forecast are from 2021 to 2023.(b) Pro jection using neutral distribution (2018) with pass-through = 0.87 based on GDP per capita in constant LCU.

Selected Country Pages ● 103
54 MPO Oct 21
o t oll
Croatia has been hit hard by the COVID-19 pandemic in 2020 and has also suffered from two earthquakes. However, stronger than expected recovery is under way, re-flecting robust foreign demand for domes-tic goods and services, particularly hospi-tality services, dynamic private invest-ment and increased consumption support-ed by a strong labor market. The country is likely to return to its pre-crisis level of output in 2022. Nevertheless, at 64.1 per-cent of the EU27 GDP per capita in 2020 (in PPP), Croatia remains one of the least developed countries in the EU. Raising Croatia’s economic growth over the medi-um term will crucially depend on the gov-ernment’s willingness and capacity to undertake structural reforms to boost productivity including the business envi-ronment, public administration, education system and judiciary. Against this back-drop, the EU structural and investment funds as well as the new facilities repre-sent a unique opportunity for the country to accelerate income convergence with the rest of the EU. In July this year, European Commission (EC) endorsed Croatia's Re-covery and Resilience Plan (NRRP) worth around 12 percent of 2019 GDP. Disburse-ment of EU grants from this facility is linked to the implementation of important reforms aimed at addressing the country’s long-standing structural issues.
In addition, the economic outlook in the short run continues to depend on the course of the pandemic. While by the summer months the number of new cases had been strongly reduced partly due to social distancing restrictions, the reopen-ing of the economy, inflow of foreign tour-ists and a still rather low share of fully vaccinated population could result in a surge in new infections by the yearend. This in turn could require further fiscal support, putting additional strain on pub-lic finances which are already stretched, if some social distancing measures were to be introduced.
t lo t Croatia's economy continued to recover in the first half of 2021, which together with a deep recession last year resulted in strong real annual GDP growth (7.5%) in this period. All components of aggregate demand positively contributed to recov-ery, reflecting less stringent social distanc-ing restrictions, higher external demand, and improved labor market conditions. On the supply side, the services sector significantly strengthened albeit from a relatively low level, while manufacturing and construction, which already by the end of 2020 reached pre-crisis levels, con-tinued to expand. In line with improving economic condi-tions, employment increased compared to the first half of 2020, while the administra-tive unemployment rate declined to 7.5 percent in June 2021. At the same time,
CROATIA
FIGURE 1 Croatia / Contributions to annual GDP growth FIGURE 2 Croatia / Actual and projected poverty rates and real GDP per capita
Sources: CROSTAT, World Bank. Source: World Bank. Notes: see Table 2.
In the first half of 2021, Croatia's econo-my continued to recover from the deepest recession in the country’s history. Abun-dant EU funds and an improved global outlook are expected to provide a strong boost to growth over the medium term, with output expanding by 7.6 percent in 2021. However, risks related to the pan-demic remain and public debt is projected to remain elevated. The poverty rate is estimated to fall to 2.2 percent in 2021 and continue its downward trend.
Table 1 2020Population, million 4.0GDP, current US$ billion 56.2GDP per capita, current US$ 1 4050.0
International poverty rate ($1.9)a 0.5
Lower middle-income poverty rate ($3.2)a 0.8
Upper middle-income poverty rate ($5.5)a 2.4
Gini indexa 29.8
School enro llment, primary (% gross)b 94.6
Life expectancy at birth, yearsb 78.4Total GHG Emissions (mtCO2e) 1 6.5
(b) WDI for School enrollment (201 8); Life expectancy (201 9).
Source: WDI, M acro Poverty Outlook, and off icial data.(a) M ost recent value (201 8), 201 1 PPPs.
-10-8-6-4-202468
10
2014 2015 2016 2017 2018 2019 2020e 2021f 2022f 2023f
Final consumption Gross fixed capital formationChange in inventories Net exportsGDP growth
Percent, percentage points Poverty rate (%) Real GDP per capita (LCU constant)
0
20000
40000
60000
80000
100000
120000
0
1
2
3
4
5
6
7
8
2009 2011 2013 2015 2017 2019 2021 2023
International poverty rate Lower middle-income pov. rateUpper middle-income pov. rate Real GDP pc
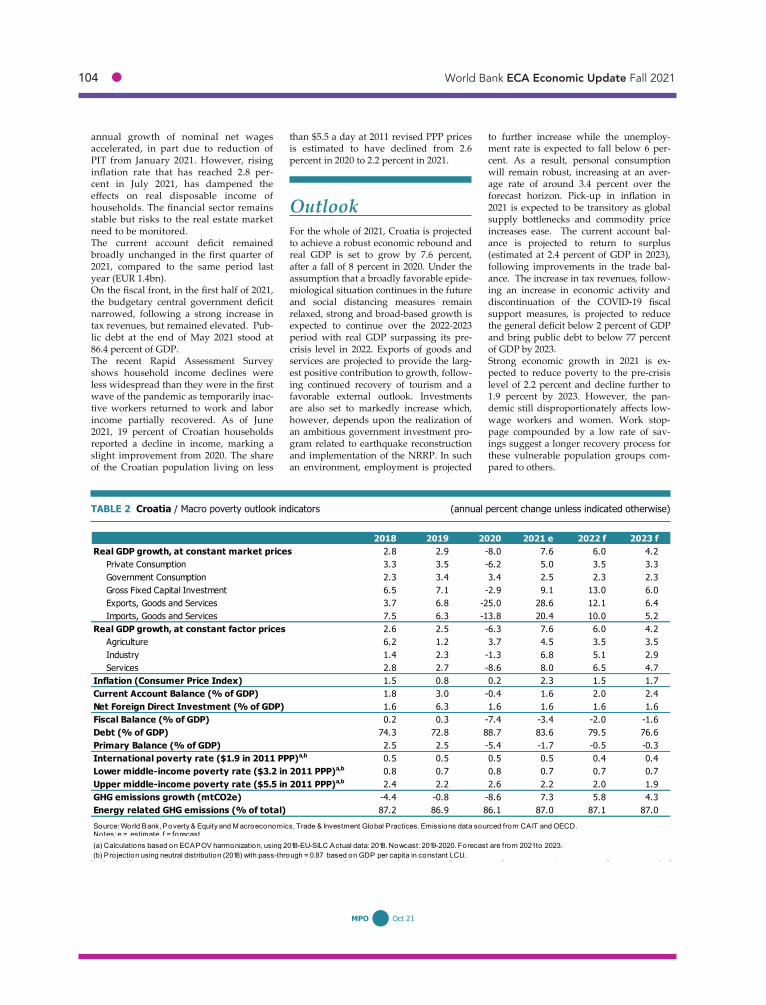
104 ● World Bank ECA Economic Update Fall 2021
55 MPO Oct 21
annual growth of nominal net wages accelerated, in part due to reduction of PIT from January 2021. However, rising inflation rate that has reached 2.8 per-cent in July 2021, has dampened the effects on real disposable income of households. The financial sector remains stable but risks to the real estate market need to be monitored. The current account deficit remained broadly unchanged in the first quarter of 2021, compared to the same period last year (EUR 1.4bn). On the fiscal front, in the first half of 2021, the budgetary central government deficit narrowed, following a strong increase in tax revenues, but remained elevated. Pub-lic debt at the end of May 2021 stood at 86.4 percent of GDP. The recent Rapid Assessment Survey shows household income declines were less widespread than they were in the first wave of the pandemic as temporarily inac-tive workers returned to work and labor income partially recovered. As of June 2021, 19 percent of Croatian households reported a decline in income, marking a slight improvement from 2020. The share of the Croatian population living on less
than $5.5 a day at 2011 revised PPP prices is estimated to have declined from 2.6 percent in 2020 to 2.2 percent in 2021.
Outlook
For the whole of 2021, Croatia is projected to achieve a robust economic rebound and real GDP is set to grow by 7.6 percent, after a fall of 8 percent in 2020. Under the assumption that a broadly favorable epide-miological situation continues in the future and social distancing measures remain relaxed, strong and broad-based growth is expected to continue over the 2022-2023 period with real GDP surpassing its pre-crisis level in 2022. Exports of goods and services are projected to provide the larg-est positive contribution to growth, follow-ing continued recovery of tourism and a favorable external outlook. Investments are also set to markedly increase which, however, depends upon the realization of an ambitious government investment pro-gram related to earthquake reconstruction and implementation of the NRRP. In such an environment, employment is projected
to further increase while the unemploy-ment rate is expected to fall below 6 per-cent. As a result, personal consumption will remain robust, increasing at an aver-age rate of around 3.4 percent over the forecast horizon. Pick-up in inflation in 2021 is expected to be transitory as global supply bottlenecks and commodity price increases ease. The current account bal-ance is projected to return to surplus (estimated at 2.4 percent of GDP in 2023), following improvements in the trade bal-ance. The increase in tax revenues, follow-ing an increase in economic activity and discontinuation of the COVID-19 fiscal support measures, is projected to reduce the general deficit below 2 percent of GDP and bring public debt to below 77 percent of GDP by 2023. Strong economic growth in 2021 is ex-pected to reduce poverty to the pre-crisis level of 2.2 percent and decline further to 1.9 percent by 2023. However, the pan-demic still disproportionately affects low-wage workers and women. Work stop-page compounded by a low rate of sav-ings suggest a longer recovery process for these vulnerable population groups com-pared to others.
TABLE 2 Croatia / Macro poverty outlook indicators (annual percent change unless indicated otherwise)
2018 2019 2020 2021 e 2022 f 2023 fReal GDP growth, at constant market prices 2.8 2.9 -8.0 7.6 6.0 4.2
Private Consumption 3.3 3.5 -6.2 5.0 3.5 3.3Government Consumption 2.3 3.4 3.4 2.5 2.3 2.3Gross Fixed Capital Investment 6.5 7.1 -2.9 9.1 13.0 6.0Exports, Goods and Services 3.7 6.8 -25.0 28.6 12.1 6.4Imports, Goods and Services 7.5 6.3 -13.8 20.4 10.0 5.2
Real GDP growth, at constant factor prices 2.6 2.5 -6.3 7.6 6.0 4.2Agriculture 6.2 1.2 3.7 4.5 3.5 3.5Industry 1.4 2.3 -1.3 6.8 5.1 2.9Services 2.8 2.7 -8.6 8.0 6.5 4.7
Inflation (Consumer Price Index) 1.5 0.8 0.2 2.3 1.5 1.7Current Account Balance (% of GDP) 1.8 3.0 -0.4 1.6 2.0 2.4Net Foreign Direct Investment (% of GDP) 1.6 6.3 1.6 1.6 1.6 1.6Fiscal Balance (% of GDP) 0.2 0.3 -7.4 -3.4 -2.0 -1.6Debt (% of GDP) 74.3 72.8 88.7 83.6 79.5 76.6Primary Balance (% of GDP) 2.5 2.5 -5.4 -1.7 -0.5 -0.3International poverty rate ($1.9 in 2011 PPP)a,b 0.5 0.5 0.5 0.5 0.4 0.4Lower middle-income poverty rate ($3.2 in 2011 PPP)a,b 0.8 0.7 0.8 0.7 0.7 0.7Upper middle-income poverty rate ($5.5 in 2011 PPP)a,b 2.4 2.2 2.6 2.2 2.0 1.9GHG emissions growth (mtCO2e) -4.4 -0.8 -8.6 7.3 5.8 4.3Energy related GHG emissions (% of total) 87.2 86.9 86.1 87.0 87.1 87.0Source: World Bank, Poverty & Equity and M acroeconomics, Trade & Investment Global Practices. Emissions data sourced from CAIT and OECD.Notes: e = estimate, f = forecast.NA(a) Calculations based on ECAPOV harmonization, using 2018-EU-SILC.Actual data: 2018. Nowcast: 2019-2020. Forecast are from 2021 to 2023.(b) Pro jection using neutral distribution (2018) with pass-through = 0.87 based on GDP per capita in constant LCU.
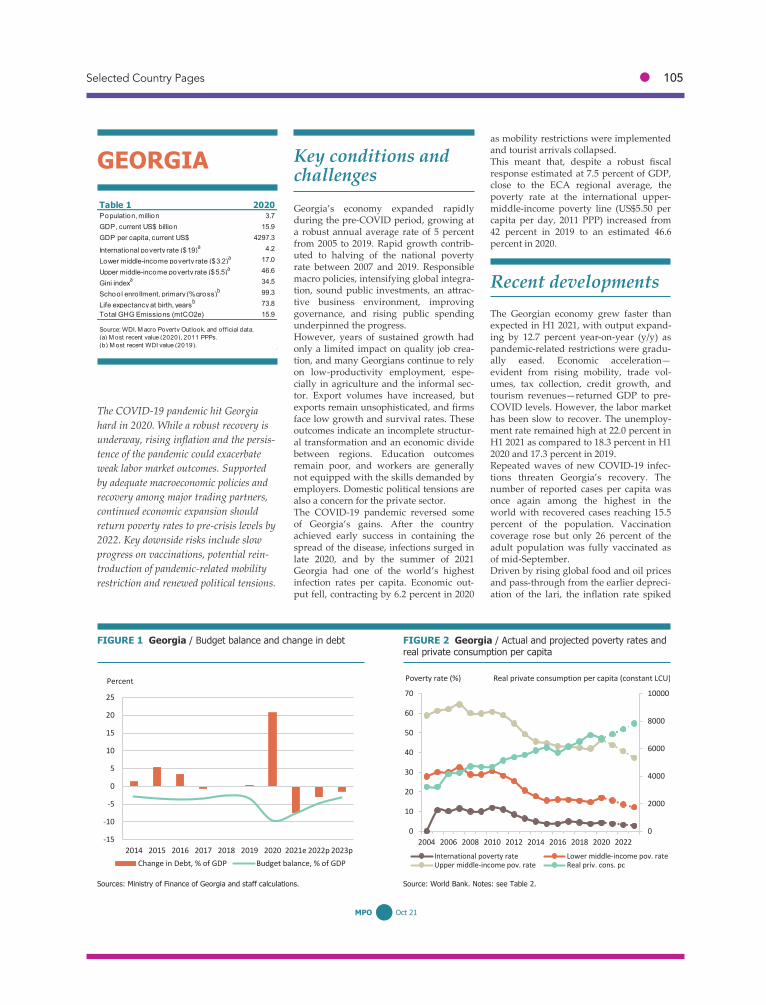
Selected Country Pages ● 105
56 MPO Oct 21
Georgia’s economy expanded rapidly during the pre-COVID period, growing at a robust annual average rate of 5 percent from 2005 to 2019. Rapid growth contrib-uted to halving of the national poverty rate between 2007 and 2019. Responsible macro policies, intensifying global integra-tion, sound public investments, an attrac-tive business environment, improving governance, and rising public spending underpinned the progress. However, years of sustained growth had only a limited impact on quality job crea-tion, and many Georgians continue to rely on low-productivity employment, espe-cially in agriculture and the informal sec-tor. Export volumes have increased, but exports remain unsophisticated, and firms face low growth and survival rates. These outcomes indicate an incomplete structur-al transformation and an economic divide between regions. Education outcomes remain poor, and workers are generally not equipped with the skills demanded by employers. Domestic political tensions are also a concern for the private sector. The COVID-19 pandemic reversed some of Georgia’s gains. After the country achieved early success in containing the spread of the disease, infections surged in late 2020, and by the summer of 2021 Georgia had one of the world’s highest infection rates per capita. Economic out-put fell, contracting by 6.2 percent in 2020
as mobility restrictions were implemented and tourist arrivals collapsed. This meant that, despite a robust fiscal response estimated at 7.5 percent of GDP, close to the ECA regional average, the poverty rate at the international upper-middle-income poverty line (US$5.50 per capita per day, 2011 PPP) increased from 42 percent in 2019 to an estimated 46.6 percent in 2020.
The Georgian economy grew faster than expected in H1 2021, with output expand-ing by 12.7 percent year-on-year (y/y) as pandemic-related restrictions were gradu-ally eased. Economic acceleration—evident from rising mobility, trade vol-umes, tax collection, credit growth, and tourism revenues—returned GDP to pre-COVID levels. However, the labor market has been slow to recover. The unemploy-ment rate remained high at 22.0 percent in H1 2021 as compared to 18.3 percent in H1 2020 and 17.3 percent in 2019. Repeated waves of new COVID-19 infec-tions threaten Georgia’s recovery. The number of reported cases per capita was once again among the highest in the world with recovered cases reaching 15.5 percent of the population. Vaccination coverage rose but only 26 percent of the adult population was fully vaccinated as of mid-September. Driven by rising global food and oil prices and pass-through from the earlier depreci-ation of the lari, the inflation rate spiked
GEORGIA
FIGURE 1 Georgia / Budget balance and change in debt FIGURE 2 Georgia / Actual and projected poverty rates and real private consumption per capita
Sources: Ministry of Finance of Georgia and staff calculations. Source: World Bank. Notes: see Table 2.
-
-
-
-
-
Table 1 2020Population, million 3.7GDP, current US$ billion 1 5.9GDP per capita, current US$ 4297.3
International poverty rate ($1.9)a 4.2
Lower middle-income poverty rate ($3.2)a 1 7.0
Upper middle-income poverty rate ($5.5)a 46.6
Gini indexa 34.5
School enro llment, primary (% gross)b 99.3
Life expectancy at birth, yearsb 73.8Total GHG Emissions (mtCO2e) 1 5.9
(b) M ost recent WDI value (201 9).
Source: WDI, M acro Poverty Outlook, and off icial data.(a) M ost recent value (2020), 201 1 PPPs.
-15
-10
-5
0
5
10
15
20
25
2014 2015 2016 2017 2018 2019 2020 2021e 2022p 2023pChange in Debt, % of GDP Budget balance, % of GDP
Percent
0
2000
4000
6000
8000
10000
0
10
20
30
40
50
60
70
2004 2006 2008 2010 2012 2014 2016 2018 2020 2022International poverty rate Lower middle-income pov. rateUpper middle-income pov. rate Real priv. cons. pc
Poverty rate (%) Real private consumption per capita (constant LCU)

106 ● World Bank ECA Economic Update Fall 2021
57 MPO Oct 21
to 12.8 percent y/y in August, its highest level in over ten years. In response, the central bank increased its policy rate by a cumulative 200 basis points since March 2021 to 10 percent. The current account deficit remained high at 11 percent of GDP in Q1 2021, as weak services exports, particularly from tour-ism, were only partially offset by strong remittances and an improved goods trade balance. FDI and portfolio investment covered 23 percent of the current account deficit, while public borrowing covered the rest and enabled accumulation of in-ternational reserves. The latter remained adequate at US$4.1 billion as of end-August 2021, covering over four months of goods and services imports. The banking sector remained profitable, and the share of nonperforming loans (more than 90 days overdue) was low at 2.4 percent. The fiscal deficit widened by 27 percent y/y in the first seven months of 2021, as rising public expenditures—including additional COVID-19 response measures—offset a 15 percent y/y increase in revenues. By end-July, the fiscal deficit had reached about 4
percent of annual GDP out of planned 7.6 percent, while public debt fell to 53 percent of GDP from 62 percent as of end-2020.
Georgia’s GDP growth rate for 2021 is now projected at 8 percent, up from 6 per-cent in April. In the baseline scenario, ut-put surpasses its 2019 level in 2021. This estimate assumes that some COVID-19-related restrictions will remain in effect for the rest of the year. Over the medium term, GDP growth is expected to return to its potential rate of about 5.0-5.5 percent as the fiscal stimulus winds down, monetary policy normalizes, and tourism recovers. The baseline projec-tion assumes no major new COVID-19-related restrictions in a context of rising vaccination rates. As growth recovers, and real wages and transfers increase, the pov-erty rate is expected to decline and reach pre-crisis levels by 2022. The fiscal deficit is expected to remain elevated at around 7.6 percent of GDP in
2021 before gradually declining as reve-nues recover and emergency spending subsides. The deficit is projected to nar-row to about 3 percent of GDP by 2023 in line with the fiscal rule. Inflation is forecast to remain above the central bank’s 3 percent target in 2021 and 2022 but should converge with the target over the medium term by end-2023 as transitory pressures subside, and monetary policy actions anchor infla-tionary expectations. As service exports recover and rebound-ing economic activity causes imports to rise, the current-account deficit is ex-pected to narrow to 10 percent of GDP in 2021 and continue shrinking over the me-dium term. Recovering FDI and sustained support from international financial insti-tutions are expected to cover Georgia’s external financing needs and help main-tain a comfortable reserve cushion. Delayed vaccinations, new mobility re-strictions, and prolonged political tensions are the key downside risks to Georgia’s outlook. These risks could slow the recov-ery and inhibit progress on poverty reduc-tion and job creation.
TABLE 2 Georgia / Macro poverty outlook indicators (annual percent change unless indicated otherwise)
2018 2019 2020 2021 e 2022 f 2023 fReal GDP growth, at constant market prices 4.8 5.0 -6.2 8.0 5.5 5.0
Private Consumption 5.8 7.2 -4.0 4.5 5.0 5.2Government Consumption 1.6 5.7 11.8 2.3 -2.4 -1.3Gross Fixed Capital Investment 1.9 -0.1 -6.2 0.5 8.7 4.4Exports, Goods and Services 10.1 9.8 -31.1 38.5 10.0 9.7Imports, Goods and Services 10.3 6.6 -19.2 18.0 7.3 7.1
Real GDP growth, at constant factor prices 5.2 5.1 -5.9 7.6 5.6 5.0Agriculture 13.8 -0.6 3.6 4.0 2.0 2.6Industry 0.2 2.7 -2.8 12.0 6.0 4.0Services 5.8 6.4 -7.7 6.8 5.9 5.6
Inflation (Consumer Price Index) 2.6 5.0 5.3 9.0 6.0 3.8Current Account Balance (% of GDP) -6.8 -5.5 -12.5 -10.2 -8.8 -8.7Net Foreign Direct Investment (% of GDP) 5.3 5.9 4.3 3.3 6.0 5.5Fiscal Balance (% of GDP) -2.6 -3.4 -9.7 -7.6 -4.8 -3.3Debt (% of GDP) 41.4 41.8 62.5 55.0 52.0 50.6Primary Balance (% of GDP) -1.4 -2.2 -8.2 -5.6 -3.3 -1.8International poverty rate ($1.9 in 2011 PPP)a,b 4.5 3.8 4.2 3.8 3.2 2.7Lower middle-income poverty rate ($3.2 in 2011 PPP)a,b 15.5 14.9 17.0 15.5 13.7 12.2Upper middle-income poverty rate ($5.5 in 2011 PPP)a,b 42.5 42.0 46.6 43.8 40.7 37.4GHG emissions growth (mtCO2e) -1.7 -2.5 -3.4 7.4 3.3 2.6Energy related GHG emissions (% of total) 52.4 50.8 50.6 51.7 52.5 52.8Source: World Bank, Poverty & Equity and M acroeconomics, Trade & Investment Global Practices. Emissions data sourced from CAIT and OECD.Notes: e = estimate, f = forecast.NA(a) Calculations based on ECAPOV harmonization, using 2020-.Actual data: 2020. Nowcast: 2021. Forecast are from 2021 to 2023.(b) Projection using neutral distribution (2020) with pass-through = 0.87 based on private consumption per capita in constant LCU.

Selected Country Pages ● 107
58 MPO Oct 21
Since independence in 1991, Kazakhstan has experienced rapid growth, fueled by reforms and FDI into extractive indus-tries, which reduced poverty and trans-formed the country into an upper middle-income economy. Real GDP per capita increased by more than 80 percent, as the country currently accounts for nearly two-thirds of Central Asia s GDP with a quar-ter of the population. However, weak productivity growth is slowing down GDP growth and gains in living standards. Over-dependence on hydrocarbons and limited diversification pose significant development challenges. Containing the pandemic, including by accelerating vaccination, is the key short-term priority. The second priority is im-proving competitiveness and a racting investment in the non-extractive sectors. The third priority is launching a transition to a low-carbon economy, supported by energy pricing, regulatory reforms, and public investments that facilitate the miti-gation and adaption to climate change.
The economy is bouncing back from its pandemic-driven decline in 2020. GDP expanded by a 0.4 percent q-o-q (seasonally adjusted) in 2021 Q2, following
a 1.3 percent growth in Q1. Real GDP in Q2 of 2021 was still 0.8 percent below the pre-crisis level. Consumer demand supported by re-duced COVID-19 restrictions and contin-ued fiscal and credit support to house-holds and enterprises have been the key drivers of GDP dynamics. Solid growth in retail trade by 7.6 percent suggests a strong rebound in household consump-tion in January–June. But investment has remained weak and contracted by 1.8 percent in 1H2021, mainly due to weak
DI inflow. Reopening the economy in-creases activity in service sectors while growth in housing and infrastructure projects is supporting construction and manufacturing. A si able outflow of profits from DI-linked projects and a pickup in imports led to a 2.2 percent of GD deficit of the current account in 1H2021. The National Bank of Kazakhstan (NBK) reserves in August reached $36.8 billion due to the $1.6 billion new SDR allocation. The tenge depreciated slightly through April but subsequently recovered some of its losses as oil prices rose. The fiscal policy remained supportive in 1H2021. In April, the government adopt-ed a supplementary budget with an ad-ditional US$3.0 billion (1.7 percent of GDP) support package for COVID-19 measures and economic recovery. The authorities included an additional trans-fer from the Oil Fund in the package and financed the deficit by increased borrow-ing. As a result of higher spending, the deficit increased to 3.5 percent of GD in 1H2021 compared with 2.8 percent in
KAZAKHSTAN
FIGURE 1 Kazakhstan / Movement in real GDP FIGURE 2 Kazakhstan / Poverty rates and real GDP per capita
Sources: Statistical Office of Kazakhstan and World Bank staff estimates. Source: World Bank staff estimates.
- - - -
- -
-
Table 1 2020Population, million 1 8.8GDP, current US$ billion 1 71 .2GDP per capita, current US$ 91 06.4
Upper middle-income poverty rate ($5.5)a 4.6
Gini indexa 27.8
School enro llment, primary (% gross)b 1 04.4
Life expectancy at birth, yearsb 73.2Total GHG Emissions (mtCO2e) 272.1
(b) M ost recent WDI value (201 9).
Source: WDI, M acro Poverty Outlook, and off icial data.(a) M ost recent value (201 8), 201 1 PPPs.
680
700
720
740
760
780
800
820
840
0
2
4
6
8
10
12
14
16
2016 2017 2018 2019 2020 2021f 2022f 2023f
$5.5/day, 2011 PPP Real GDP per capita (RHS)
Poverty rate, percent Thousand tenge
88
90
92
94
96
98
100
102
Q1 Q2 Q3 Q4 Q1 Q2 Q3 Q4 Q1 Q2
2019 2020 2021
Real GDP, s.a.
Q4 2019 Real GDP
Index,2019Q4=100
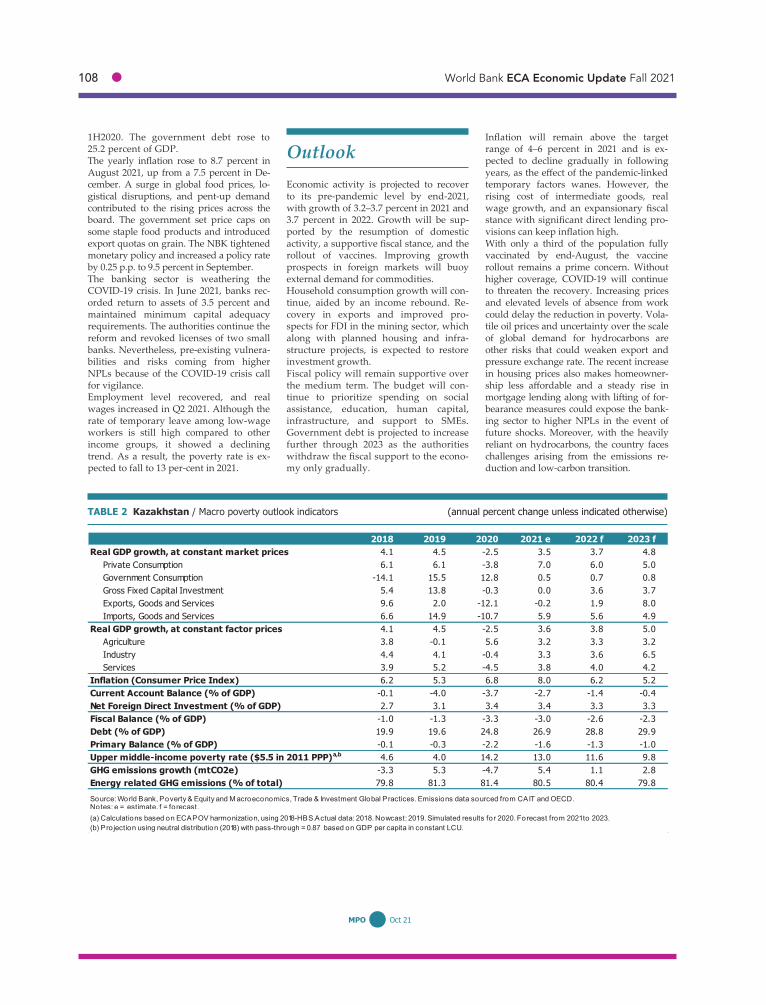
108 ● World Bank ECA Economic Update Fall 2021
59 MPO Oct 21
1H2020. The government debt rose to 25.2 percent of GDP. The yearly inflation rose to 8.7 percent in August 2021, up from a 7.5 percent in De-cember. A surge in global food prices, lo-gistical disruptions, and pent-up demand contributed to the rising prices across the board. The government set price caps on some staple food products and introduced export quotas on grain. The NBK tightened monetary policy and increased a policy rate by 0.25 p.p. to 9.5 percent in September. The banking sector is weathering the COVID-19 crisis. In June 2021, banks rec-orded return to assets of 3.5 percent and maintained minimum capital adequacy requirements. The authorities continue the reform and revoked licenses of two small banks. Nevertheless, pre-existing vulnera-bilities and risks coming from higher NPLs because of the COVID-19 crisis call for vigilance. Employment level recovered, and real wages increased in Q2 2021. Although the rate of temporary leave among low-wage workers is still high compared to other income groups, it showed a declining trend. As a result, the poverty rate is ex-pected to fall to 13 per-cent in 2021.
Economic activity is projected to recover to its pre-pandemic level by end-2021, with growth of 3.2–3.7 percent in 2021 and 3.7 percent in 2022. Growth will be sup-ported by the resumption of domestic activity, a supportive fiscal stance, and the rollout of vaccines. Improving growth prospects in foreign markets will buoy external demand for commodities. Household consumption growth will con-tinue, aided by an income rebound. Re-covery in exports and improved pro-spects for FDI in the mining sector, which along with planned housing and infra-structure projects, is expected to restore investment growth. Fiscal policy will remain supportive over the medium term. The budget will con-tinue to prioritize spending on social assistance, education, human capital, infrastructure, and support to SMEs. Government debt is projected to increase further through 2023 as the authorities withdraw the fiscal support to the econo-my only gradually.
Inflation will remain above the target range of 4–6 percent in 2021 and is ex-pected to decline gradually in following years, as the effect of the pandemic-linked temporary factors wanes. However, the rising cost of intermediate goods, real wage growth, and an expansionary fiscal stance with significant direct lending pro-visions can keep inflation high. With only a third of the population fully vaccinated by end-August, the vaccine rollout remains a prime concern. Without higher coverage, COVID-19 will continue to threaten the recovery. Increasing prices and elevated levels of absence from work could delay the reduction in poverty. Vola-tile oil prices and uncertainty over the scale of global demand for hydrocarbons are other risks that could weaken export and pressure exchange rate. The recent increase in housing prices also makes homeowner-ship less affordable and a steady rise in mortgage lending along with lifting of for-bearance measures could expose the bank-ing sector to higher NPLs in the event of future shocks. Moreover, with the heavily reliant on hydrocarbons, the country faces challenges arising from the emissions re-duction and low-carbon transition.
TABLE 2 Kazakhstan / Macro poverty outlook indicators (annual percent change unless indicated otherwise)
2018 2019 2020 2021 e 2022 f 2023 fReal GDP growth, at constant market prices 4.1 4.5 -2.5 3.5 3.7 4.8
Private Consumption 6.1 6.1 -3.8 7.0 6.0 5.0Government Consumption -14.1 15.5 12.8 0.5 0.7 0.8Gross Fixed Capital Investment 5.4 13.8 -0.3 0.0 3.6 3.7Exports, Goods and Services 9.6 2.0 -12.1 -0.2 1.9 8.0Imports, Goods and Services 6.6 14.9 -10.7 5.9 5.6 4.9
Real GDP growth, at constant factor prices 4.1 4.5 -2.5 3.6 3.8 5.0Agriculture 3.8 -0.1 5.6 3.2 3.3 3.2Industry 4.4 4.1 -0.4 3.3 3.6 6.5Services 3.9 5.2 -4.5 3.8 4.0 4.2
Inflation (Consumer Price Index) 6.2 5.3 6.8 8.0 6.2 5.2Current Account Balance (% of GDP) -0.1 -4.0 -3.7 -2.7 -1.4 -0.4Net Foreign Direct Investment (% of GDP) 2.7 3.1 3.4 3.4 3.3 3.3Fiscal Balance (% of GDP) -1.0 -1.3 -3.3 -3.0 -2.6 -2.3Debt (% of GDP) 19.9 19.6 24.8 26.9 28.8 29.9Primary Balance (% of GDP) -0.1 -0.3 -2.2 -1.6 -1.3 -1.0Upper middle-income poverty rate ($5.5 in 2011 PPP)a,b 4.6 4.0 14.2 13.0 11.6 9.8GHG emissions growth (mtCO2e) -3.3 5.3 -4.7 5.4 1.1 2.8Energy related GHG emissions (% of total) 79.8 81.3 81.4 80.5 80.4 79.8Source: World Bank, Poverty & Equity and M acroeconomics, Trade & Investment Global Practices. Emissions data sourced from CAIT and OECD.Notes: e = estimate, f = forecast.NA(a) Calculations based on ECAPOV harmonization, using 2018-HBS.Actual data: 201 8. Nowcast: 201 9. Simulated results for 2020. Forecast from 2021 to 2023.(b) Projection using neutral distribution (2018) with pass-through = 0.87 based on GDP per capita in constant LCU.

Selected Country Pages ● 109
60 MPO Oct 21
o t oll
Kosovo grew at an average of 4.6 percent between 2014 and 2019. The economy contracted by 5.3 percent in 2020, but high informality likely conceals the full eco-nomic and social impact of the pandemic. Formal employment weathered the im-pact of the pandemic, but low labor force participation, especially for women, con-tinues to be among Kosovo’s key con-straints. Poverty is expected to decrease in 2021 (about 2 percentage points) to 21 percent, reverting back to its 2019 level.1 Growth returned to positive territory during the fourth quarter of 2020 and gained momentum during the first half of 2021. Kosovo faced a new wave of infections in late August 2021. However, vaccinations picked up in April 2021, exceeding 1.2 million doses administered by September 2021. Kosovo’s growth model is largely con-sumption-based, with a significant reli-ance on diaspora financing. The trade deficit remains high, although merchan-dise exports started to pick up during the pandemic. Private investment added to growth in recent years, but was mostly concentrated in trade and construction industries, with limited productivity spill-overs. Poor education and health out-comes limit the contribution of human capital to inclusive growth. Given the rise of new virus variants and vaccination trends, both in Kosovo and
globally, the pandemic risks remain ele-vated. Accelerated vaccination is the key priority in the near term. In the medium term, there is a pressing need to focus policies on tackling constraints to higher productivity growth and investing in hu-man capital.
t lo t Growth gained momentum during the first quarter of 2021, reaching 5. percent. Economic activity is estimated to expand by 7.1 percent in 2021, with exports and private consumption expected to provide the highest contribution to growth. Services exports exceeded 2019 levels by June 2021, and by year-end are estimated to exceed 2019 levels by 9.5 percent. The rebound in diaspora visits continues to fuel Kosovo’s service exports and infor-mal remi ances. erchandise exports have also been on the rise. Limited con-tainment and fiscal support measures, and strong credit growth have bolstered pri-vate consumption. Although the information on the overall labor market is not complete due to a large share of informal jobs, there are significant gains in formal employment. The average number of active pension contributors increased by 13.6 percent during the second quarter of the year; representing about 40 thousand new formal jobs compared to the same period of both 2020 and 2019. During the sec-ond quarter of 2021, the number of regis-tered jobseekers also dropped by more
KOSOVO
FIGURE 1 Kosovo / Index of merchandise exports in USD, 2019Q4=100
FIGURE 2 Kosovo / Actual and projected poverty rates and real GDP per capita
Sources: Kosovo agency of statistics and World Bank staff calculations. Source: World Bank. Notes: see Table 2.
Kosovo’s economy is recovering rapidly, but risks to the outlook remain high as the country continues to grapple with the pandemic. Economic activity in 2021 is expected to expand by 7.1 per-cent against a rebound in diaspora vis-its, fiscal support measures, and higher consumer lending. Growth is projected to remain above 4 percent over the me-dium term. Maintaining the accelerated rate of vaccinations is a priority in the near term. In the medium term, Kosovo needs to transition to a more productiv-ity-oriented growth model.
Table 1 2020Population, million 1 .8GDP, current US$ billion 7.7GDP per capita, current US$ 4277.8
Upper middle-income poverty rate ($5.5)a 24.4
Gini indexa 29.0
Life expectancy at birth, years 72.5
(b) M ost recent WDI value (201 9).
Source: WDI, M acro Poverty Outlook, and off icial data.(a) M ost recent value (201 7), 201 1 PPPs.
40
60
80
100
120
140
160
180
2016Q1 2017Q1 2018Q1 2019Q1 2020Q1 2021Q1
Pre-covid 5 year Exports Merchandise trendActual Exports Merchandise
Percent Poverty rate (%) Real GDP per capita (LCU constant)
0
500
1000
1500
2000
2500
3000
3500
4000
4500
0
10
20
30
40
50
60
70
2005 2007 2009 2011 2013 2015 2017 2019 2021 2023
Upper middle-income pov. rate Real GDP pc
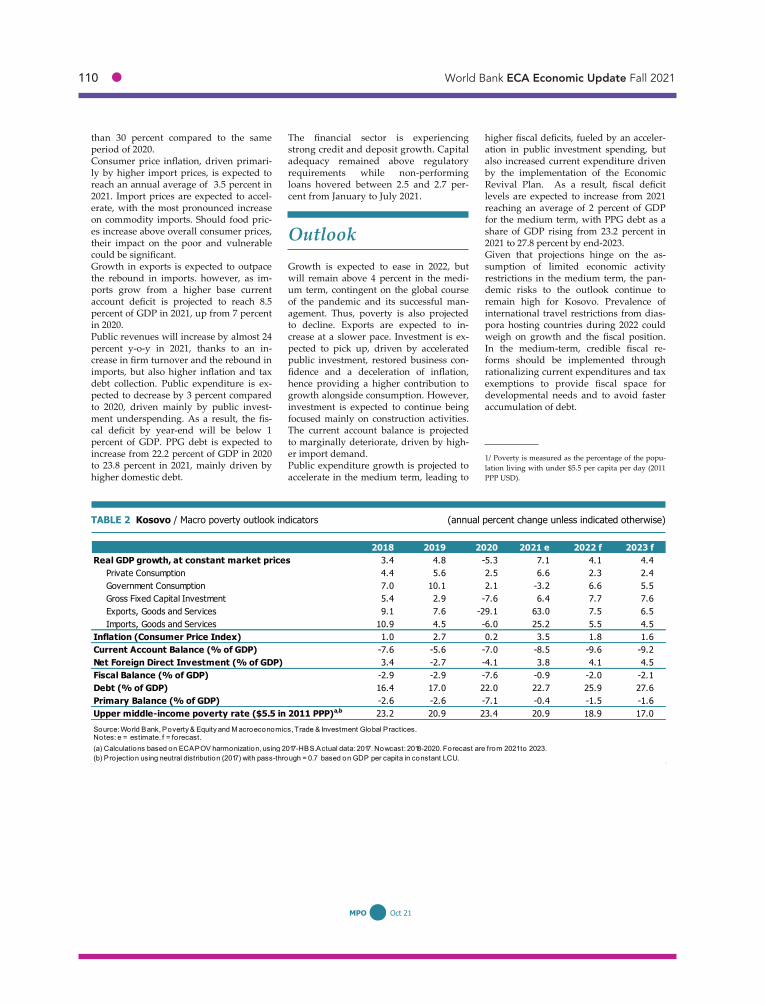
110 ● World Bank ECA Economic Update Fall 2021
61 MPO Oct 21
than 30 percent compared to the same period of 2020. Consumer price inflation, driven primari-ly by higher import prices, is expected to reach an annual average of 3.5 percent in 2021. Import prices are expected to accel-erate, with the most pronounced increase on commodity imports. Should food pric-es increase above overall consumer prices, their impact on the poor and vulnerable could be significant. Growth in exports is expected to outpace the rebound in imports. however, as im-ports grow from a higher base current account deficit is projected to reach 8.5 percent of GDP in 2021, up from 7 percent in 2020. Public revenues will increase by almost 24 percent y-o-y in 2021, thanks to an in-crease in firm turnover and the rebound in imports, but also higher inflation and tax debt collection. Public expenditure is ex-pected to decrease by 3 percent compared to 2020, driven mainly by public invest-ment underspending. As a result, the fis-cal deficit by year-end will be below 1 percent of GDP. PPG debt is expected to increase from 22.2 percent of GDP in 2020 to 23.8 percent in 2021, mainly driven by higher domestic debt.
The financial sector is experiencing strong credit and deposit growth. Capital adequacy remained above regulatory requirements while non-performing loans hovered between 2.5 and 2.7 per-cent from January to July 2021.
Outlook Growth is expected to ease in 2022, but will remain above 4 percent in the medi-um term, contingent on the global course of the pandemic and its successful man-agement. Thus, poverty is also projected to decline. Exports are expected to in-crease at a slower pace. Investment is ex-pected to pick up, driven by accelerated public investment, restored business con-fidence and a deceleration of inflation, hence providing a higher contribution to growth alongside consumption. However, investment is expected to continue being focused mainly on construction activities. The current account balance is projected to marginally deteriorate, driven by high-er import demand. Public expenditure growth is projected to accelerate in the medium term, leading to
higher fiscal deficits, fueled by an acceler-ation in public investment spending, but also increased current expenditure driven by the implementation of the Economic Revival Plan. As a result, fiscal deficit levels are expected to increase from 2021 reaching an average of 2 percent of GDP for the medium term, with PPG debt as a share of GDP rising from 23.2 percent in 2021 to 27.8 percent by end-2023. Given that projections hinge on the as-sumption of limited economic activity restrictions in the medium term, the pan-demic risks to the outlook continue to remain high for Kosovo. Prevalence of international travel restrictions from dias-pora hosting countries during 2022 could weigh on growth and the fiscal position. In the medium-term, credible fiscal re-forms should be implemented through rationalizing current expenditures and tax exemptions to provide fiscal space for developmental needs and to avoid faster accumulation of debt.
TABLE 2 Kosovo / Macro poverty outlook indicators (annual percent change unless indicated otherwise)
2018 2019 2020 2021 e 2022 f 2023 fReal GDP growth, at constant market prices 3.4 4.8 -5.3 7.1 4.1 4.4
Private Consumption 4.4 5.6 2.5 6.6 2.3 2.4Government Consumption 7.0 10.1 2.1 -3.2 6.6 5.5Gross Fixed Capital Investment 5.4 2.9 -7.6 6.4 7.7 7.6Exports, Goods and Services 9.1 7.6 -29.1 63.0 7.5 6.5Imports, Goods and Services 10.9 4.5 -6.0 25.2 5.5 4.5
Inflation (Consumer Price Index) 1.0 2.7 0.2 3.5 1.8 1.6Current Account Balance (% of GDP) -7.6 -5.6 -7.0 -8.5 -9.6 -9.2Net Foreign Direct Investment (% of GDP) 3.4 -2.7 -4.1 3.8 4.1 4.5Fiscal Balance (% of GDP) -2.9 -2.9 -7.6 -0.9 -2.0 -2.1Debt (% of GDP) 16.4 17.0 22.0 22.7 25.9 27.6Primary Balance (% of GDP) -2.6 -2.6 -7.1 -0.4 -1.5 -1.6Upper middle-income poverty rate ($5.5 in 2011 PPP)a,b 23.2 20.9 23.4 20.9 18.9 17.0Source: World Bank, Poverty & Equity and M acroeconomics, Trade & Investment Global Practices.Notes: e = estimate, f = forecast.NA(a) Calculations based on ECAPOV harmonization, using 2017-HBS.Actual data: 2017. Nowcast: 2018-2020. Forecast are from 2021 to 2023.(b) Pro jection using neutral distribution (2017) with pass-through = 0.7 based on GDP per capita in constant LCU.
1/ Poverty is measured as the percentage of the popu-lation living with under $5.5 per capita per day (2011 PPP USD).

Selected Country Pages ● 111
62 MPO Oct 21
Table 1 2020Population, million 6.6GDP, current US$ billion 7.7GDP per capita, current US$ 1 1 66.7
International poverty rate ($1.9)a 0.6
Lower middle-income poverty rate ($3.2)a 9.7
Upper middle-income poverty rate ($5.5)a 52.6
Gini indexa 29.7
School enro llment, primary (% gross)b 1 06.0
Life expectancy at birth, yearsb 71 .6Total GHG Emissions (mtCO2e) 1 5.4
(b) M ost recent WDI value (201 9).
Source: WDI, M acro Poverty Outlook, and off icial data.(a) M ost recent value (201 9), 201 1 PPPs.
The economy remains heavily depend-ent on gold production (about 10 percent of GDP and 40 percent of exports), re-mittances (2 percent of GDP), and for-eign aid. Economic and structural re-forms lost momentum, and businesses are facing significant uncertainty be-cause of the continuing COVID-19 pan-demic and political uncertainty triggered by the protests after the parliamentary elections in October 2020. The ongoing revision of legislation after the adoption of the new Constitution in April 2021 and afresh parliamentary elections in November 2021 are adding uncertainty. Security threats arising from potential border conflicts and a regional tension due to developments in Afghanistan are also causing concerns. Strong and sustainable economic growth requires institutional strengthening and policies to develop the private sector, spur international trade, and encourage fiscally sustainable energy production. Con-straints to private investment and growth include the large infrastructure gap, weak rule of law and governance, poor business environment, and onerous regulations. The energy sector’s financial weakness-es—stemming from the below-cost recov-ery tariffs- and failure to meet WTO and Eurasian Economic Union standards and technical regulations further limit the growth potential.
Real GDP contracted by 0.7 percent in Jan-uary–August 2021, year-on-year, following a significant decline by 8.6 percent in 2020, as a result of a fall in gold production (-29 percent) while the non-gold economy is recovering (3.6 percent). The non-gold economy has been supported by increased remittance inflows and trade revival. Twelve-month inflation rose to 14 percent in July, up from 9.7 percent in December 2020, driven by larger increases in prices for imported food and fuel, as well as a rising demand for goods and services owing to higher remittances. The trade deficit is esti-mated to have significantly widened to 41 percent of GDP in January–June 2021 from 18 percent a year ago. This reflects a decline in exports (9 percent in US dollars) mainly due to a fall in gold exports and strong growth in imports (41 percent in US dol-lars). Gross official reserves remained ade-
uate at 6.2 months of imports at end-June. In response to rising inflation, the central bank increased its policy rate three times by a cumulative increase of 2 0 basis points to 7. percent since the start of the year. Credit to the economy growth was strong (12.2 percent). The foreign ex-change market has stabilized after central bank interventions in the first uarter. The budget surplus amounted to 1.4 per-cent of GDP in January–July 2021, owing to higher revenues and lower expenditures as a share of GDP. Revenues increased to 37.7 percent of GDP from 32.3 percent a year ago, thanks to tax and non-tax revenues.
KYRGYZ REPUBLIC
FIGURE 1 Kyrgyz Republic / GDP growth and poverty rate FIGURE 2 Kyrgyz Republic / Headline, food and fuel inflation
Sources: Kyrgyz authorities and World Bank staff estimates. Source: Kyrgyz authorities.
Real GDP contracted by 0.7 percent in January–August 2021 due to a fall in gold production. 2021 GDP should ex-pand by 2.3 percent, driven continued growth of the non-gold economy in the remainder of the year. Inflation has in-creased sharply and should remain elevat-ed in 2021–22. Strong revenue perfor-mance led to fiscal surplus in January–July 2021, but the budget should fall back into a deficit by year-end.
-30
-20
-10
0
10
20
30
40
50
60
Jan-
17Ap
r-17
Jul-1
7Oc
t-17
Jan-
18Ap
r-18
Jul-1
8Oc
t-18
Jan-
19Ap
r-19
Jul-1
9Oc
t-19
Jan-
20Ap
r-20
Jul-2
0Oc
t-20
Jan-
21Ap
r-21
Jul-2
1
Headline Food Fuel
Percent
-10
-5
0
5
10
15
0
5
10
15
20
25
2009 2011 2013 2015 2017 2019 2021proj
2023proj
GDP growth (rhs) $3.2/day 2011 PPP (lhs)
PercentPoverty rate, percent
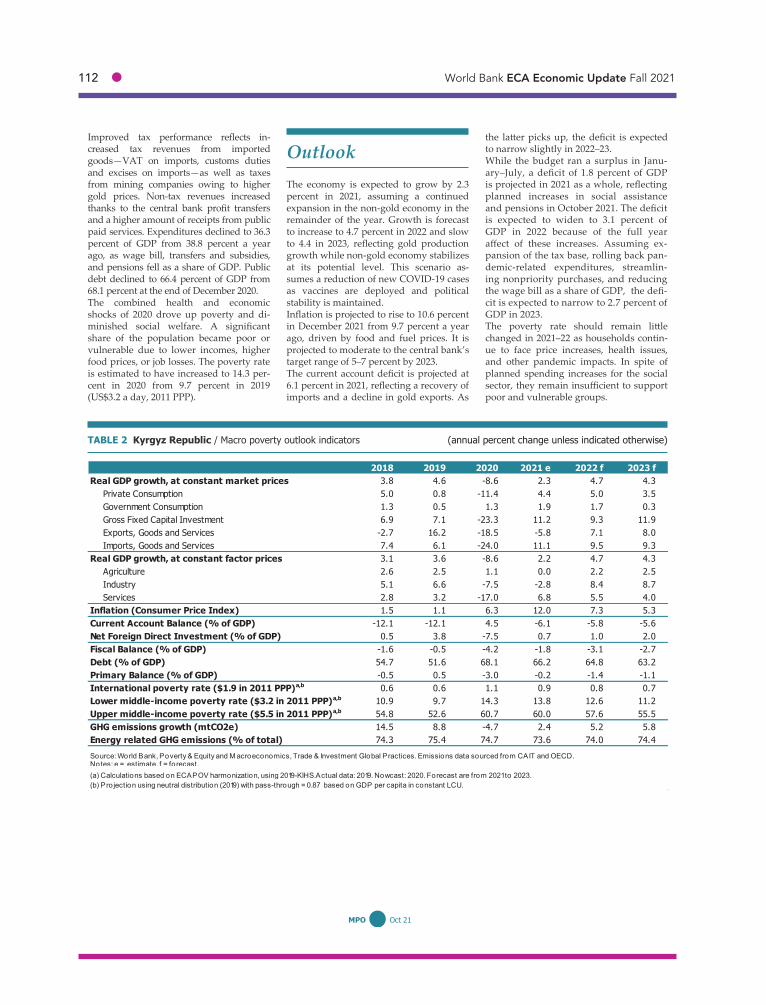
112 ● World Bank ECA Economic Update Fall 2021
63 MPO Oct 21
Improved tax performance reflects in-creased tax revenues from imported goods—VAT on imports, customs duties and excises on imports—as well as taxes from mining companies owing to higher gold prices. Non-tax revenues increased thanks to the central bank profit transfers and a higher amount of receipts from public paid services. Expenditures declined to 36.3 percent of GDP from 38.8 percent a year ago, as wage bill, transfers and subsidies, and pensions fell as a share of GDP. Public debt declined to 66.4 percent of GDP from 68.1 percent at the end of December 2020. The combined health and economic shocks of 2020 drove up poverty and di-minished social welfare. A significant share of the population became poor or vulnerable due to lower incomes, higher food prices, or job losses. The poverty rate is estimated to have increased to 14.3 per-cent in 2020 from 9.7 percent in 2019 (US$3.2 a day, 2011 PPP).
The economy is expected to grow by 2.3 percent in 2021, assuming a continued expansion in the non-gold economy in the remainder of the year. Growth is forecast to increase to 4.7 percent in 2022 and slow to 4.4 in 2023, reflecting gold production growth while non-gold economy stabilizes at its potential level. This scenario as-sumes a reduction of new COVID-19 cases as vaccines are deployed and political stability is maintained. Inflation is projected to rise to 10.6 percent in December 2021 from 9.7 percent a year ago, driven by food and fuel prices. It is projected to moderate to the central bank’s target range of 5–7 percent by 2023. The current account deficit is projected at 6.1 percent in 2021, reflecting a recovery of imports and a decline in gold exports. As
the latter picks up, the deficit is expected to narrow slightly in 2022–23. While the budget ran a surplus in Janu-ary–July, a deficit of 1.8 percent of GDP is projected in 2021 as a whole, reflecting planned increases in social assistance and pensions in October 2021. The deficit is expected to widen to 3.1 percent of GDP in 2022 because of the full year affect of these increases. Assuming ex-pansion of the tax base, rolling back pan-demic-related expenditures, streamlin-ing nonpriority purchases, and reducing the wage bill as a share of GDP, the defi-cit is expected to narrow to 2.7 percent of GDP in 2023. The poverty rate should remain little changed in 2021–22 as households contin-ue to face price increases, health issues, and other pandemic impacts. In spite of planned spending increases for the social sector, they remain insufficient to support poor and vulnerable groups.
TABLE 2 Kyrgyz Republic / Macro poverty outlook indicators (annual percent change unless indicated otherwise)
2018 2019 2020 2021 e 2022 f 2023 fReal GDP growth, at constant market prices 3.8 4.6 -8.6 2.3 4.7 4.3
Private Consumption 5.0 0.8 -11.4 4.4 5.0 3.5Government Consumption 1.3 0.5 1.3 1.9 1.7 0.3Gross Fixed Capital Investment 6.9 7.1 -23.3 11.2 9.3 11.9Exports, Goods and Services -2.7 16.2 -18.5 -5.8 7.1 8.0Imports, Goods and Services 7.4 6.1 -24.0 11.1 9.5 9.3
Real GDP growth, at constant factor prices 3.1 3.6 -8.6 2.2 4.7 4.3Agriculture 2.6 2.5 1.1 0.0 2.2 2.5Industry 5.1 6.6 -7.5 -2.8 8.4 8.7Services 2.8 3.2 -17.0 6.8 5.5 4.0
Inflation (Consumer Price Index) 1.5 1.1 6.3 12.0 7.3 5.3Current Account Balance (% of GDP) -12.1 -12.1 4.5 -6.1 -5.8 -5.6Net Foreign Direct Investment (% of GDP) 0.5 3.8 -7.5 0.7 1.0 2.0Fiscal Balance (% of GDP) -1.6 -0.5 -4.2 -1.8 -3.1 -2.7Debt (% of GDP) 54.7 51.6 68.1 66.2 64.8 63.2Primary Balance (% of GDP) -0.5 0.5 -3.0 -0.2 -1.4 -1.1International poverty rate ($1.9 in 2011 PPP)a,b 0.6 0.6 1.1 0.9 0.8 0.7Lower middle-income poverty rate ($3.2 in 2011 PPP)a,b 10.9 9.7 14.3 13.8 12.6 11.2Upper middle-income poverty rate ($5.5 in 2011 PPP)a,b 54.8 52.6 60.7 60.0 57.6 55.5GHG emissions growth (mtCO2e) 14.5 8.8 -4.7 2.4 5.2 5.8Energy related GHG emissions (% of total) 74.3 75.4 74.7 73.6 74.0 74.4Source: World Bank, Poverty & Equity and M acroeconomics, Trade & Investment Global Practices. Emissions data sourced from CAIT and OECD.Notes: e = estimate, f = forecast.NA(a) Calculations based on ECAPOV harmonization, using 2019-KIHS.Actual data: 2019. Nowcast: 2020. Forecast are from 2021 to 2023.(b) Projection using neutral distribution (2019) with pass-through = 0.87 based on GDP per capita in constant LCU.

Selected Country Pages ● 113
64 MPO Oct 21
o t oll
Despite a solid economic performance in the past two decades, Moldova has fallen short of its aspiration to achieve faster convergence towards EU income levels. The economic model continues to be reli-ant on remittances-induced consumption, with an associated low productivity growth resulted from the persistence of deep structural and governance weak-nesses, a significant state enterprises foot-print, low competition, uneven playing field, and taxes distortions. he bank fraud of 2014 uncovered deep weaknesses in the financial sector. In addition, the economy is highly vulnerable to external shocks. hile extreme weather events and the propagation of economic and financial crisis from the main trading partners have been a traditional risk for a small open economy like oldova, the ID-19 pandemic has recently raised concerns also about the health system. Persistent inequality of opportunity con-tinues to limit the ability of low-income households to access public services, re-ducing their resilience to shocks and ce-menting low intergenerational mobili-ty. The contraction in 2020 resulted in an increase in poverty from 25.2% in 2019 to 26.8% in 2020 (based on the national pov-erty line), marking the second consecutive year in which poverty increased. Though poverty rates increased more in urban than in rural areas, rural areas remain
much poorer with a poverty rate of 35.3% in 2020 (vs 14% in urban areas). Against this background, the newly elected government is expected to implement an ambitious structural reforms program to improve competitiveness (justice reforms and strengthening the rule of law corrup-tion together with actions towards rent seeking schemes, the regulatory environ-ment, and the state footprint), while sus-taining economic recovery with a stronger fiscal impulse. triking the balance between cyclical and structural problems and ensur-ing fiscal sustainability will be an essential aspect be considered when designing short- and medium-term policy response.
t lo t
he economic activity is expected to bounce back by 6.8 percent in 2021. A strong increase in wages, remittances and social transfers contributed to a robust increase in private consumption. Invest-ments registered a 20 percentage increase on the back of favorable monetary condi-tions. trong domestic demand and re-stocking after the lockdown led to signifi-cant drag on growth from net exports. ll sectors of the economy signaled positive developments after a sharp contraction last year. However, agricultural sector was still is with a negative territory in the first half of the year due to heavy rains. Higher prices on food products due to bad harvest, and increase in global energy pric-es, along with a strong domestic demand has increase inflationary pressure, forcing
MOLDOVA
FIGURE 1 Moldova / Projected macroeconomic indicators FIGURE 2 Moldova / Actual and projected poverty rates and real GDP per capita
Source: Author's calculations based on national statistics. Source: World Bank. Notes: see Table 2.
Moldova is recovering swiftly, growth is expected to be above potential in the medium term. Short- and medium-term forecast is under the assumptions of the containment of the COVID-19 pandem-ic, implementation of a broad-based re-forms program, and sustained fiscal sup-port. In case of a resumption of the pan-demic, the authorities should first and foremost focus on the health sector to manage the pandemic while striking a balance between long term reforms and mitigation measures.
Table 1 2020Population, million 2.7GDP, current US$ billion 1 1 .9GDP per capita, current US$ 4407.4
International poverty rate ($1.9)a 0.0
Lower middle-income poverty rate ($3.2)a 0.9
Upper middle-income poverty rate ($5.5)a 1 2.8
Gini indexa 25.7
School enro llment, primary (% gross)b 89.5
Life expectancy at birth, yearsb 71 .9Total GHG Emissions (mtCO2e) 1 2.8
(b) M ost recent WDI value (201 9).
Source: WDI, M acro Poverty Outlook, and off icial data.(a) M ost recent value (201 8), 201 1 PPPs.
-11
-9
-7
-5
-3
-1
1
3
5
2014 2015 2016 2017 2018 2019 2020 2021 2022 2023Real GDP, % changeCurrent account balance, % GDPFiscal deficit
Percent of GDP
Current account balance, % GDP
2021 2022 20230
10000
20000
30000
40000
50000
60000
0
10
20
30
40
50
60
70
80
2004 2006 2008 2010 2012 2014 2016 2018 2020 2022
International poverty rate Lower middle-income pov. rateUpper middle-income pov. rate Real GDP pc
Poverty rate (%) Real GDP per capita (constant LCU)
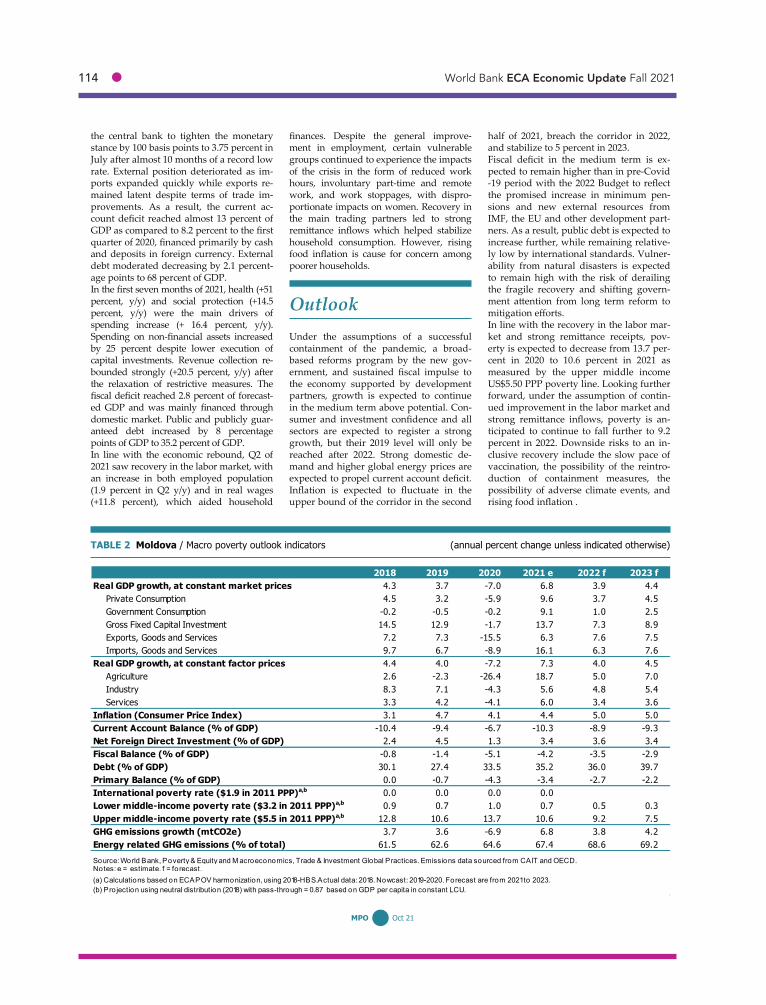
114 ● World Bank ECA Economic Update Fall 2021
65 MPO Oct 21
the central bank to tighten the monetary stance by 100 basis points to 3.75 percent in July after almost 10 months of a record low rate. External position deteriorated as im-ports expanded quickly while exports re-mained latent despite terms of trade im-provements. As a result, the current ac-count deficit reached almost 13 percent of GDP as compared to 8.2 percent to the first quarter of 2020, financed primarily by cash and deposits in foreign currency. External debt moderated decreasing by 2.1 percent-age points to 68 percent of GDP. In the first seven months of 2021, health (+51 percent, y/y) and social protection (+14.5 percent, y/y) were the main drivers of spending increase (+ 16.4 percent, y/y). Spending on non-financial assets increased by 25 percent despite lower execution of capital investments. Revenue collection re-bounded strongly (+20.5 percent, y/y) after the relaxation of restrictive measures. The fiscal deficit reached 2.8 percent of forecast-ed GDP and was mainly financed through domestic market. Public and publicly guar-anteed debt increased by 8 percentage points of GDP to 35.2 percent of GDP. In line with the economic rebound, Q2 of 2021 saw recovery in the labor market, with an increase in both employed population (1.9 percent in Q2 y/y) and in real wages (+11.8 percent), which aided household
finances. Despite the general improve-ment in employment, certain vulnerable groups continued to experience the impacts of the crisis in the form of reduced work hours, involuntary part-time and remote work, and work stoppages, with dispro-portionate impacts on women. Recovery in the main trading partners led to strong remittance inflows which helped stabilize household consumption. However, rising food inflation is cause for concern among poorer households.
Outlook Under the assumptions of a successful containment of the pandemic, a broad-based reforms program by the new gov-ernment, and sustained fiscal impulse to the economy supported by development partners, growth is expected to continue in the medium term above potential. Con-sumer and investment confidence and all sectors are expected to register a strong growth, but their 2019 level will only be reached after 2022. Strong domestic de-mand and higher global energy prices are expected to propel current account deficit. Inflation is expected to fluctuate in the upper bound of the corridor in the second
half of 2021, breach the corridor in 2022, and stabilize to 5 percent in 2023. Fiscal deficit in the medium term is ex-pected to remain higher than in pre-Covid-19 period with the 2022 Budget to reflect the promised increase in minimum pen-sions and new external resources from IMF, the EU and other development part-ners. As a result, public debt is expected to increase further, while remaining relative-ly low by international standards. Vulner-ability from natural disasters is expected to remain high with the risk of derailing the fragile recovery and shifting govern-ment attention from long term reform to mitigation efforts. In line with the recovery in the labor mar-ket and strong remittance receipts, pov-erty is expected to decrease from 13.7 per-cent in 2020 to 10.6 percent in 2021 as measured by the upper middle income US$5.50 PPP poverty line. Looking further forward, under the assumption of contin-ued improvement in the labor market and strong remittance inflows, poverty is an-ticipated to continue to fall further to 9.2 percent in 2022. Downside risks to an in-clusive recovery include the slow pace of vaccination, the possibility of the reintro-duction of containment measures, the possibility of adverse climate events, and rising food inflation .
TABLE 2 Moldova / Macro poverty outlook indicators (annual percent change unless indicated otherwise)
2018 2019 2020 2021 e 2022 f 2023 fReal GDP growth, at constant market prices 4.3 3.7 -7.0 6.8 3.9 4.4
Private Consumption 4.5 3.2 -5.9 9.6 3.7 4.5Government Consumption -0.2 -0.5 -0.2 9.1 1.0 2.5Gross Fixed Capital Investment 14.5 12.9 -1.7 13.7 7.3 8.9Exports, Goods and Services 7.2 7.3 -15.5 6.3 7.6 7.5Imports, Goods and Services 9.7 6.7 -8.9 16.1 6.3 7.6
Real GDP growth, at constant factor prices 4.4 4.0 -7.2 7.3 4.0 4.5Agriculture 2.6 -2.3 -26.4 18.7 5.0 7.0Industry 8.3 7.1 -4.3 5.6 4.8 5.4Services 3.3 4.2 -4.1 6.0 3.4 3.6
Inflation (Consumer Price Index) 3.1 4.7 4.1 4.4 5.0 5.0Current Account Balance (% of GDP) -10.4 -9.4 -6.7 -10.3 -8.9 -9.3Net Foreign Direct Investment (% of GDP) 2.4 4.5 1.3 3.4 3.6 3.4Fiscal Balance (% of GDP) -0.8 -1.4 -5.1 -4.2 -3.5 -2.9Debt (% of GDP) 30.1 27.4 33.5 35.2 36.0 39.7Primary Balance (% of GDP) 0.0 -0.7 -4.3 -3.4 -2.7 -2.2International poverty rate ($1.9 in 2011 PPP)a,b 0.0 0.0 0.0 0.0Lower middle-income poverty rate ($3.2 in 2011 PPP)a,b 0.9 0.7 1.0 0.7 0.5 0.3Upper middle-income poverty rate ($5.5 in 2011 PPP)a,b 12.8 10.6 13.7 10.6 9.2 7.5GHG emissions growth (mtCO2e) 3.7 3.6 -6.9 6.8 3.8 4.2Energy related GHG emissions (% of total) 61.5 62.6 64.6 67.4 68.6 69.2Source: World Bank, Poverty & Equity and M acroeconomics, Trade & Investment Global Practices. Emissions data sourced from CAIT and OECD.Notes: e = estimate, f = forecast.NA(a) Calculations based on ECAPOV harmonization, using 2018-HBS.Actual data: 2018. Nowcast: 2019-2020. Forecast are from 2021 to 2023.(b) Pro jection using neutral distribution (2018) with pass-through = 0.87 based on GDP per capita in constant LCU.
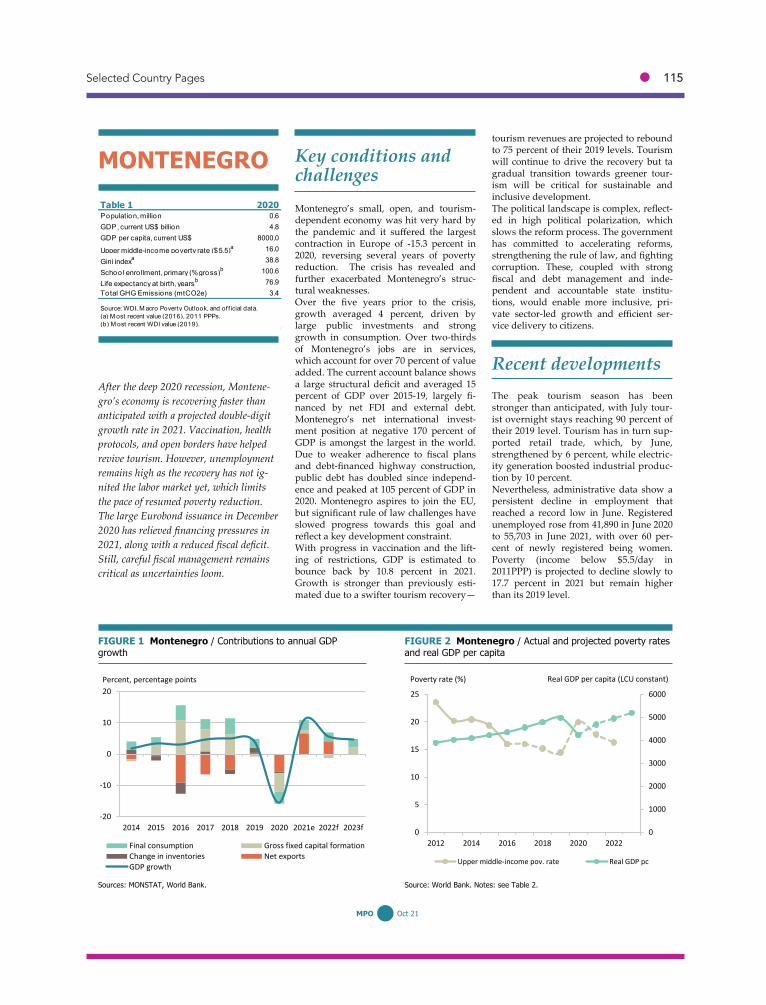
Selected Country Pages ● 115
66 MPO Oct 21
o t oll
Montenegro’s small, open, and tourism-dependent economy was hit very hard by the pandemic and it suffered the largest contraction in Europe of -15.3 percent in 2020, reversing several years of poverty reduction. The crisis has revealed and further exacerbated Montenegro’s struc-tural weaknesses.
ver the five years prior to the crisis, growth averaged 4 percent, driven by large public investments and strong growth in consumption. Over two-thirds of Montenegro’s jobs are in services, which account for over 70 percent of value added. The current account balance shows a large structural deficit and averaged 15 percent of GDP over 2015-19, largely fi-nanced by net FDI and external debt. Montenegro’s net international invest-ment position at negative 170 percent of GDP is amongst the largest in the world. Due to weaker adherence to fiscal plans and debt-financed highway construction, public debt has doubled since independ-ence and peaked at 105 percent of GDP in 2020. Montenegro aspires to join the EU, but significant rule of law challenges have slowed progress towards this goal and reflect a key development constraint. With progress in vaccination and the lift-ing of restrictions, GDP is estimated to bounce back by 10.8 percent in 2021. Growth is stronger than previously esti-mated due to a swifter tourism recovery—
tourism revenues are projected to rebound to 75 percent of their 2019 levels. Tourism will continue to drive the recovery but ta gradual transition towards greener tour-ism will be critical for sustainable and inclusive development. The political landscape is complex, reflect-ed in high political polarization, which slows the reform process. The government has committed to accelerating reforms, strengthening the rule of law, and fighting corruption. These, coupled with strong fiscal and debt management and inde-pendent and accountable state institu-tions, would enable more inclusive, pri-vate sector-led growth and e cient ser-vice delivery to citizens.
t lo t The peak tourism season has been stronger than anticipated, with July tour-ist overnight stays reaching 90 percent of their 2019 level. Tourism has in turn sup-ported retail trade, which, by June, strengthened by 6 percent, while electric-ity generation boosted industrial produc-tion by 10 percent. Nevertheless, administrative data show a persistent decline in employment that reached a record low in June. Registered unemployed rose from 41,890 in June 2020 to 55,703 in June 2021, with over 60 per-cent of newly registered being women. Poverty (income below $5.5/day in 2011PPP) is projected to decline slowly to 17.7 percent in 2021 but remain higher than its 2019 level.
MONTENEGRO
FIGURE 1 Montenegro / Contributions to annual GDP growth
FIGURE 2 Montenegro / Actual and projected poverty rates and real GDP per capita
Sources: MONSTAT, World Bank. Source: World Bank. Notes: see Table 2.
After the deep 2020 recession, Montene-gro’s economy is recovering faster than anticipated with a projected double-digit growth rate in 2021. Vaccination, health protocols, and open borders have helped revive tourism. However, unemployment remains high as the recovery has not ig-nited the labor market yet, which limits the pace of resumed poverty reduction. The large Eurobond issuance in December 2020 has relieved financing pressures in 2021, along with a reduced fiscal deficit. Still, careful fiscal management remains critical as uncertainties loom.
Table 1 2020Population, million 0.6GDP, current US$ billion 4.8GDP per capita, current US$ 8000.0
Upper middle-income poverty rate ($5.5)a 1 6.0
Gini indexa 38.8
School enro llment, primary (% gross)b 1 00.6
Life expectancy at birth, yearsb 76.9Total GHG Emissions (mtCO2e) 3.4
(b) M ost recent WDI value (201 9).
Source: WDI, M acro Poverty Outlook, and off icial data.(a) M ost recent value (201 6), 201 1 PPPs.
Poverty rate (%) Real GDP per capita (LCU constant)
0
1000
2000
3000
4000
5000
6000
0
5
10
15
20
25
2012 2014 2016 2018 2020 2022
Upper middle-income pov. rate Real GDP pc
-20
-10
0
10
20
2014 2015 2016 2017 2018 2019 2020 2021e 2022f 2023f
Final consumption Gross fixed capital formationChange in inventories Net exportsGDP growth
Percent, percentage points

116 ● World Bank ECA Economic Update Fall 2021
67 MPO Oct 21
Stronger demand and higher oil prices have pushed up inflation, which by Au-gust averaged 1.7 percent y-o-y. The financial sector has remained resili-ent thus far, with both outstanding loans and deposits reaching record highs in July. The June average capital adequacy ratio was at 19.2 percent, while non-performing loans increased to 6.3 percent of total loans from 5.6 percent in June last year. However, the full impact of the pandemic will be clearer once the loan moratoria expire. By June, growth of exports outpaced that of imports, as tourism strengthened, while investment stalled. Net income accounts further reduced the current account deficit, which was largely fi-nanced by reserves and net FDI, alt-hough the latter declined. In July, inter-national reserves covered 7.7 months of merchandise imports. Higher revenues and fiscal discipline have helped reduce the fiscal deficit which is projected to decline from 11 per-cent in 2020 to 4 percent in 2021. By July, central government revenues increased by 11 percent, supported by robust VAT collection, while expenditures declined
by 4.5 percent, driven by under-execution of capital spending and lower spending on goods and services. After the Euro-bond repayment in March, public debt is expected to decline to 90 percent of GDP in 2021.
Outlook Assuming a full recovery in tourism in 2022 and 2023, growth is projected to remain strong at 5.6 and 4.8 percent, re-spectively. Investments are expected to level off in 2022 as the highway construc-tion is finalized by end-2021. The govern-ment has announced stronger public cap-ital spending starting in 2022, which would further boost medium-term growth. However, public investment management challenges should be ad-dressed in order to ensure stronger eco-nomic effects. The projections do not as-sume that the remaining sections of the highway will start by 2023, as fiscal space is limited. The fiscal balance is expected to turn into surplus in 2023, on account of contained expenditures and stronger
revenues due to the economic recovery. Running a sustained primary fiscal sur-plus in the medium term will be critical for debt reduction. Public debt is ex-pected to decline to 77 percent of GDP in 2022 and further to 70 percent in 2023, as about €500 million of debt is due for re-payment in 2022-2023. Given the expected full recovery of tour-ism, the poverty outlook depends on how fast job creation will pick up, especially for low-skill workers. The poverty rate is projected to continue its decline in 2022. The outlook is surrounded with multiple risks. A new wave of infections in Europe could slow down Montenegro’s economic recovery. Moreover, inflationary pres-sures in the US and the EU may accelerate monetary tightening which could trans-late into more expensive external financ-ing. Domestic risks stem from vaccination hesitancy, whilst possible new restriction measures could delay the recovery. Politi-cal polarization remains high. In contrast, acceleration of structural reforms and a firm commitment to careful fiscal and debt management would reduce invest-ment uncertainty and improve the growth outlook.
TABLE 2 Montenegro / Macro poverty outlook indicators (annual percent change unless indicated otherwise)
2018 2019 2020 2021 e 2022 f 2023 fReal GDP growth, at constant market prices 5.1 4.1 -15.3 10.8 5.6 4.8
Private Consumption 4.6 3.1 -4.6 3.5 3.2 2.9Government Consumption 6.3 1.0 0.8 -0.9 -0.6 0.5Gross Fixed Capital Investment 14.7 -1.7 -12.0 2.2 -2.9 5.5Exports, Goods and Services 6.9 5.4 -47.5 66.8 14.5 6.8Imports, Goods and Services 9.2 2.4 -19.8 16.3 2.9 3.8
Real GDP growth, at constant factor prices 6.0 4.2 -14.4 10.8 5.6 4.8Agriculture 3.3 -2.2 1.1 0.5 1.0 1.0Industry 15.3 5.6 -12.0 8.0 3.0 5.0Services 3.5 4.5 -16.9 13.3 7.1 5.2
Inflation (Consumer Price Index) 2.6 0.4 -0.3 1.9 1.6 1.2Current Account Balance (% of GDP) -17.0 -14.3 -26.1 -15.2 -11.2 -9.5Net Foreign Direct Investment (% of GDP) 6.9 6.2 11.2 7.8 7.4 7.4Fiscal Balance (% of GDP) -4.6 -3.0 -11.0 -4.0 -0.9 1.1Debt (% of GDP) 70.1 76.5 105.3 87.7 77.0 69.9Primary Balance (% of GDP) -2.4 -0.8 -8.3 -1.6 1.4 3.2Upper middle-income poverty rate ($5.5 in 2011 PPP)a,b 15.2 14.5 20.0 17.7 16.3GHG emissions growth (mtCO2e) 7.5 2.9 -12.8 8.6 0.7 0.7Energy related GHG emissions (% of total) 68.8 70.6 70.1 75.8 77.5 78.7Source: World Bank, Poverty & Equity and M acroeconomics, Trade & Investment Global Practices. Emissions data sourced from CAIT and OECD.Notes: e = estimate, f = forecast.NA(a) Calculations based on ECAPOV harmonization, using 2012-SILC-C, 2015-SILC-C, and 2016-SILC-C.Actual data: 2016. Nowcast: 2017-2020. Forecast are from 2021 to 2023.(b) Pro jection using point-to-point elasticity (2012-2015) with pass-through = 0.7 based on GDP per capita in constant LCU and simulations of Covid-19 impacts, with lower passthrough in 2021 reflecting the lag in labor market improvements.

Selected Country Pages ● 117
68 MPO Oct 21
o t oll
After a decade of a relative macroeconom-ic stability, accompanied by rising trade integration, especially in GVCs, an im-proved business environment and inflows of foreign direct investment, North Mace-donia was hit hard by the D-19 pan-demic. utput contracted by 4.5 percent in 2020, and the excess death rate remains one of the highest in Europe. Poverty rate declined steadily from 35.8 percent in 2009 to a projected 16.9 percent in 2019, (based on the upper middle in-come class poverty line of 5.5 day in 2011 PPP . However, the D-19 crisis reversed recent progress in poverty re-duction; it is estimated that poverty in-creased between 1 and 4 percentage points in 2020. Support measures intro-duced by the government (including sub-sidies and social security contributions to private firms and cash benefits and vouchers for vulnerable people) helped alleviate the impact of the pandemic on poverty. The economy resumed growth in 2021 helped by robust external demand and unlocked private consumption. Yet, while outlook for the near term remains positive, continued containment measures, a slow vaccine rollout, and unresolved structural bottlenecks pose challenges. Weak human capital develop-ment, and a low labor participation rate, have led to underutilized labor resources amidst demographic decline. Further,
state involvement in the market through direct ownership, tax exemptions, and subsidies remains high. While this helps protect employment in the near term, it also derails fiscal sustainability. ounter-cyclical fiscal policies put in place to miti-gate the impact of D-1 , will need to be gradually withdrawn to address these sustainability concerns. mproving public investment management to help imple-ment the government’s Growth Accelera-tion Plan that eyes energy, environment, and transport investments, will be critical to avoid further fiscal sustainability con-cerns. Finally, further delays in the EU accession negotiations may lead to delays in efforts to improve governance, as well as anti-corruption reforms that are critical to unlocking the country’s long-term growth potential.
t lo t After declining in the first quarter by 1. percent, domestic output surged double-digit in Q2. As a result, growth in the first half of the year turned positive at 5.2 per-cent. Private consumption picked up, in-vestment surged, while government con-sumption after dropping early in the year, resumed growth in Q2. Exports and im-ports increased as well, with the latter growing faster thereby worsening the trade balance. n the production side, growth was observed in nearly all sectors, given the low base effect, with the fastest recov-ery occurring in trade, transport and tour-ism, manufacturing, and T. onstruction
NORTH MACEDONIA
FIGURE 1 North Macedonia / Contributions to annual GDP growth
FIGURE 2 North Macedonia / Actual and projected poverty rates and real GDP per capita
Sources: North Macedonia State Statistics Office and World Bank staff calcula-tions.
Source: World Bank. Note: see Table 2.
A robust recovery is underway despite a prolonged adverse pandemic impact. Con-tinued government support measures helped mitigate the impact on households and firms but are further increasing pub-lic debt—now above 62 percent of GDP. As the recovery takes hold, carefully bal-ancing the withdrawal of fiscal support to restore public finance sustainability with structural and institutional reforms is key. The central bank will also need to find the right balance between supporting domestic demand and responding to ris-ing inflationary pressures.
Table 1 2020Population, million 2.1GDP, current US$ billion 1 2.3GDP per capita, current US$ 5857.1
Upper middle-income poverty rate ($5.5)a 1 7.9
Gini indexa 33.0
School enro llment, primary (% gross)b 98.2
Life expectancy at birth, yearsb 75.8Total GHG Emissions (mtCO2e) 9.6
(b) WDI for School enrollment (201 8); Life expectancy (201 9).
Source: WDI, M acro Poverty Outlook, and off icial data.(a) M ost recent value (201 8), 201 1 PPPs.
0
50000
100000
150000
200000
250000
0
5
10
15
20
25
30
35
40
2009 2011 2013 2015 2017 2019 2021 2023
Upper middle-income pov. Rate Real GDP pc
Poverty rate (%) Real GDP per capita (millions constant LCU)
-6
-4
-2
0
2
4
6
8
10
2013 2014 2015 2016 2017 2018 2019 2020f 2021f 2022f 2023f
Final consumption Gross fixed capital formationChange in inventories Net exportsResidual item GDP growth
Percent, percentage points

118 ● World Bank ECA Economic Update Fall 2021
69 MPO Oct 21
surprisingly declined in Q2. The activity rate slowly picked up from its low in summer 2020, driven by an increase in male participation. The unemployment rate decreased to 15.9 percent by 0.2 pp since Q4 2020, while the employment rate increased by 0.5 pp, with women contrib-uting to the rise as they moved from un-employment to service sector jobs. In June 2021 the government tightened labor re-strictions by adopting changes to trade and labor laws that increase the hourly pay for Sundays and holiday work and reduce the number of working Sundays in the trade sector. In addition to these regulatory changes, wage pressures continued to rise, with the largest increases being in sectors that were most affected by the pandemic-related restrictions, such as transportation, food and accommodation, and other ser-vices, and which observed a resumed labor flight abroad. The inflation rate reached 3.6 percent in August 2021—the highest growth rate since July 2013. The increase was primari-ly driven by energy and food prices. Cu-mulatively, inflation grew by 2.7 percent by August 2021 broadly within the central bank targets. Credit growth remains solid, providing support to both households and firms. The non-performing loans ratio, currently at 3.4 percent, might see an up-ward correction, as loan moratoriums are
being phased out. However, the capital adequacy ratio remained high at 16.8 per-cent, as is the banking sector liquidity ratio that stood at 23 percent in Q1, with minimal adjustments since the start of the pandemic. Fiscal deficit almost halved in the first half of the year but is set to rise by yearend. Revenue growth was robust on the back of VAT collections. Expenditures have increased at a slower pace given more targeted COVID-support, and de-spite an uplift in capital spending. Public and publicly guaranteed debt increased to 64.4 percent of GDP in H1 given the new Eurobond issuance amid a retained sover-eign issuer default rating of BB- with a stable outlook.
Outlook Economic growth is expected to rebound to 4.6 percent in 2021 returning to the pre-pandemic output level by year-end. The baseline scenario is built on the assump-tions that the pace of immunization con-tinues, there are no further lockdowns in 2021, consumer and investor confidence remain high, and external demand contin-ues to be supportive. Growth is expected to continue in 2022 as the economy gradu-ally starts to stabilize. Poverty is projected
to resume its decline modestly as expected economic growth rebounds in 2021. Fiscal deficit is expected to very gradual-ly decline, following the latest plans of the government to ramp up capital spending. Over the medium term, public and publicly guaranteed debt will remain on the rising path reaching 65 percent of GDP by 2023. As the recovery takes hold, the authorities will need to boost tax compliance, restructure and reprioritize spending, address long-term bottlenecks and enhance efficiency of the manage-ment of public finances. To boost poten-tial growth, the country needs to redirect its attention to structural and institution-al reforms, that can unlock growth by addressing legacies in state-owned com-panies and network infrastructure, in-vesting in the human capital of the popu-lation, strengthening the accountability and independence of public institutions, as well as commitment to the rule of law, and promoting private sector innovation and competitiveness. Efforts to boost potential output through structural re-forms will need to take place in the con-text of region-wide efforts to accelerate the low-carbon transition and reduce greenhouse gas emissions.
TABLE 2 North Macedonia / Macro poverty outlook indicators (annual percent change unless indicated otherwise)
2018 2019 2020 2021 e 2022 f 2023 fReal GDP growth, at constant market prices 2.9 3.2 -4.5 4.6 3.7 3.4
Private Consumption 3.7 3.4 -5.1 5.0 3.8 2.6Government Consumption 1.5 -0.8 10.1 3.6 1.2 0.3Gross Fixed Capital Investment -8.9 9.5 -10.8 5.4 6.8 8.0Exports, Goods and Services 12.8 7.2 -10.9 8.0 7.2 7.3Imports, Goods and Services 10.2 8.3 -9.9 7.0 6.5 6.2
Real GDP growth, at constant factor prices 3.9 3.2 -3.7 4.6 3.7 3.4Agriculture 8.6 0.6 1.7 2.7 2.5 2.0Industry 0.2 4.6 -6.8 5.7 5.0 4.5Services 4.9 2.9 -3.2 4.4 3.4 3.1
Inflation (Consumer Price Index) 1.4 0.8 1.2 2.4 2.0 1.8Current Account Balance (% of GDP) -0.1 -3.3 -3.5 -3.6 -3.0 -2.0Net Foreign Direct Investment (% of GDP) 5.6 3.2 1.9 2.5 2.6 2.7Fiscal Balance (% of GDP) -1.1 -2.2 -8.3 -5.8 -4.9 -4.0Debt (% of GDP) 48.4 49.4 60.2 62.7 64.7 65.5Primary Balance (% of GDP) 0.1 -1.0 -7.0 -4.3 -3.5 -2.6Upper middle-income poverty rate ($5.5 in 2011 PPP)a,b 17.9 16.9 18.0 16.9 15.8GHG emissions growth (mtCO2e) -4.6 -0.5 -8.4 5.0 0.5 -0.2Energy related GHG emissions (% of total) 67.9 67.9 66.0 67.3 67.3 67.1Source: World Bank, Poverty & Equity and M acroeconomics, Trade & Investment Global Practices. Emissions data sourced from CAIT and OECD.Notes: e = estimate, f = forecast.NA(a) Calculations based on ECAPOV harmonization, using 2018-SILC-C. Actual data: 2018. Nowcast: 2019-2020. Forecast are from 2021.(b) Pro jections based on sectoral GDP growth at constant LCU.
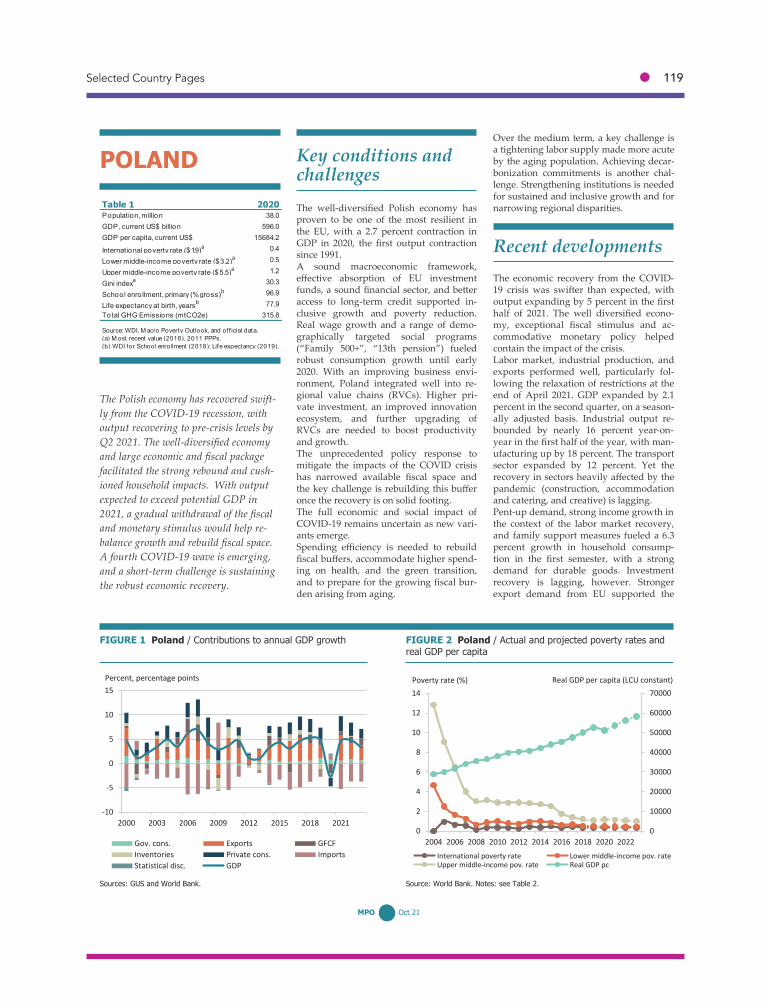
Selected Country Pages ● 119
70 MPO Oct 21
The well-diversified Polish economy has proven to be one of the most resilient in the E , with a 2.7 percent contraction in GDP in 2020, the first output contraction since 1991. A sound macroeconomic framework, e ective absorption of E investment funds, a sound financial sector, and better access to long-term credit supported in-clusive growth and poverty reduction.
eal wage growth and a range of demo-graphically targeted social programs “ amily ”, “ th pension” fueled
robust consumption growth until early 2020. ith an improving business envi-ronment, Poland integrated well into re-gional value chains s . igher pri-vate investment, an improved innovation ecosystem, and further upgrading of
s are needed to boost productivity and growth. The unprecedented policy response to mitigate the impacts of the ID crisis has narrowed available fiscal space and the key challenge is rebuilding this bu er once the recovery is on solid footing. The full economic and social impact of
ID-19 remains uncertain as new vari-ants emerge.
pending e ciency is needed to rebuild fiscal bu ers, accommodate higher spend-ing on health, and the green transition, and to prepare for the growing fiscal bur-den arising from aging.
ver the medium term, a key challenge is a tightening labor supply made more acute by the aging population. Achieving decar-bonization commitments is another chal-lenge. trengthening institutions is needed for sustained and inclusive growth and for narrowing regional disparities.
The economic recovery from the ID-19 crisis was swifter than expected, with output expanding by 5 percent in the first half of 2021. The well diversified econo-my, exceptional fiscal stimulus and ac-commodative monetary policy helped contain the impact of the crisis.
abor market, industrial production, and exports performed well, particularly fol-lowing the relaxation of restrictions at the end of April 2021. GDP expanded by 2.1 percent in the second quarter, on a season-ally ad usted basis. Industrial output re-bounded by nearly 16 percent year-on-year in the first half of the year, with man-ufacturing up by 18 percent. The transport sector expanded by 12 percent. et the recovery in sectors heavily a ected by the pandemic construction, accommodation and catering, and creative is lagging. Pent-up demand, strong income growth in the context of the labor market recovery, and family support measures fueled a 6.3 percent growth in household consump-tion in the first semester, with a strong demand for durable goods. Investment recovery is lagging, however. tronger export demand from E supported the
POLAND
FIGURE 1 Poland / Contributions to annual GDP growth FIGURE 2 Poland / Actual and projected poverty rates and real GDP per capita
Sources: GUS and World Bank. Source: World Bank. Notes: see Table 2.
The Polish economy has recovered swift-ly from the COVID-19 recession, with output recovering to pre-crisis levels by Q2 2021. The well-diversified economy and large economic and fiscal package facilitated the strong rebound and cush-ioned household impacts. With output expected to exceed potential GDP in 2021, a gradual withdrawal of the fiscal and monetary stimulus would help re-balance growth and rebuild fiscal space. A fourth COVID-19 wave is emerging, and a short-term challenge is sustaining the robust economic recovery.
Table 1 2020Population, million 38.0GDP, current US$ billion 596.0GDP per capita, current US$ 1 5684.2
International poverty rate ($1.9)a 0.4
Lower middle-income poverty rate ($3.2)a 0.5
Upper middle-income poverty rate ($5.5)a 1 .2
Gini indexa 30.3
School enro llment, primary (% gross)b 96.9
Life expectancy at birth, yearsb 77.9Total GHG Emissions (mtCO2e) 31 5.8
(b) WDI for School enrollment (201 8); Life expectancy (201 9).
Source: WDI, M acro Poverty Outlook, and off icial data.(a) M ost recent value (201 8), 201 1 PPPs.
Poverty rate (%) Real GDP per capita (LCU constant)
0
10000
20000
30000
40000
50000
60000
70000
0
2
4
6
8
10
12
14
2004 2006 2008 2010 2012 2014 2016 2018 2020 2022International poverty rate Lower middle-income pov. rateUpper middle-income pov. rate Real GDP pc
-10
-5
0
5
10
15
2000 2003 2006 2009 2012 2015 2018 2021
Gov. cons. Exports GFCFInventories Private cons. ImportsStatistical disc. GDP
Percent, percentage points

120 ● World Bank ECA Economic Update Fall 2021
71 MPO Oct 21
recovery in the industrial sector and ex-ports. Exports rose 16 percent in the first half of 2021, year-on-year. Imports also rebounded strongly, however, translating into a negative contribution to growth of net exports. Inflation has surged to 5.5 percent in Au-gust, a 20-year record, fueled by a spike in fuel prices, supply chain bottlenecks, pent-up demand and the large stimulus. High-er core inflation, strong domestic demand, and higher producer prices will put pres-sure on prices. Household income and employment im-pacts of the pandemic were mitigated through multiple support measures and demographically targeted transfers. These measures included wage subsidies and support to domestic enterprises in the form of non-returnable transfers, loans, tax reliefs and deferrals. The unemploy-ment rate was contained, and it retreated to 5.8 percent by July 2021, as the econo-my started to recover. Rapid assessments show that household income declines and work stoppages were more widespread and pronounced in the first pandemic wave but have moderated in subsequent waves. Work stoppages had a more pro-nounced impact on lower-wage workers and those with non-standard contracts, who were also less covered by protective
policies. National extreme poverty in-creased and there was a notable rise in income inequality, reflecting the unequal labor market impacts. The current account surplus narrowed to 1.9 percent of GDP in the first half of 2021, from 3.5 percent of GDP in 2020, as prima-ry income outflows increased. The fiscal stimulus and the recession caused the fiscal deficit to widen to 7 percent of GDP in 2020, from 0.7 percent in 2019. Financial sector capital adequacy ratios remain adequate.
Economic growth is expected to remain above potential in 2022, with output ex-panding by more than 4.5 percent and a widening of the output gap. A leveling of demand in the euro area will slow export growth, while improved confidence and investment execution, including through the National Recovery and Resilience Plan (NRRP), will support growth. Domestic demand will be supported by the pro-posed “Polish Deal”, a new socio-economic program for 2021-30. The pro-gram calls for new PIT relief that will
strengthen the progressivity of the PIT, increased spending on health care to 6 percent of GDP by 2023, as well as a large infrastructure and local public investment program, among others. The outlook in-corporates the uncertainty arising from the new COVID-19 strains. The crisis has put a financial strain on poor working households that are more vulnerable to reductions in hours worked and job loss. The share of the population at risk of poverty is expected to remain elevated through 2022. Strong import demand, higher import prices, and higher primary income out-flows are expected to reduce the current account surplus to below 2 percent of GDP in 2021. To fund its NRRP Poland requested €23.9 billion in grants and €12.1 billion of pref-erential loans under the “Next Generation EU”, which is yet to be approved. The NRRP would be implemented by 2023, with disbursements finalized by 2026. The fiscal deficit is expected to narrow in 2021 by close to 2 percentage points, due to lower central government deficit. A gradual consolidation is expected over the 2022-2023 period, as economic growth accelerates, and the fiscal stimu-lus is withdrawn.
TABLE 2 Poland / Macro poverty outlook indicators (annual percent change unless indicated otherwise)
2018 2019 2020 2021 e 2022 f 2023 fReal GDP growth, at constant market prices 5.4 4.7 -2.7 4.5 4.7 3.4
Private Consumption 4.5 3.9 -3.1 5.5 4.7 3.3Government Consumption 3.5 6.5 4.4 3.2 4.5 3.5Gross Fixed Capital Investment 9.4 6.1 -9.6 4.2 7.3 7.4Exports, Goods and Services 6.9 5.2 -0.2 9.4 5.7 5.5Imports, Goods and Services 7.4 3.0 -1.9 10.3 6.9 6.8
Real GDP growth, at constant factor prices 5.3 4.6 -2.8 4.5 4.8 3.3Agriculture -9.1 -0.8 -3.0 4.0 1.0 1.0Industry 7.0 2.1 -1.0 6.1 3.7 3.3Services 5.0 6.1 -3.7 3.7 5.4 3.4
Inflation (Consumer Price Index) 1.6 2.3 3.4 4.2 3.6 3.1Current Account Balance (% of GDP) -1.3 0.5 3.5 2.1 1.6 0.9Net Foreign Direct Investment (% of GDP) -2.6 -1.6 -1.4 -1.2 -1.0 -1.0Fiscal Balance (% of GDP) -0.2 -0.7 -7.0 -5.1 -3.2 -3.0Debt (% of GDP) 48.8 45.6 57.5 57.6 56.5 56.1Primary Balance (% of GDP) 1.2 0.7 -5.7 -4.0 -2.0 -1.8International poverty rate ($1.9 in 2011 PPP)a,b 0.4 0.3 0.4 0.3 0.3 0.3Lower middle-income poverty rate ($3.2 in 2011 PPP)a,b 0.5 0.5 0.5 0.5 0.4 0.4Upper middle-income poverty rate ($5.5 in 2011 PPP)a,b 1.2 1.1 1.2 1.2 1.1 1.0GHG emissions growth (mtCO2e) -0.1 -3.5 -8.3 3.0 0.5 -0.4Energy related GHG emissions (% of total) 87.5 87.2 86.9 87.4 87.6 87.6Source: World Bank, Poverty & Equity and M acroeconomics, Trade & Investment Global Practices. Emissions data sourced from CAIT and OECD.Notes: e = estimate, f = forecast.NA(a) Calculations based on ECAPOV harmonization, using 2007-EU-SILC and 2018-EU-SILC.Actual data: 2018. Nowcast: 2019-2020. Forecast are from 2021 to 2023.(b) Projection using point-to-point elasticity (2007-2018) with pass-through = 1 based on GDP per capita in constant LCU.

Selected Country Pages ● 121
72 MPO Oct 21
o t oll
Romania had a short-lived stint as a high-income country in 2020 ( B Atlas classifica-tion) following post-GFC growth averaging 5 percent per year. The pandemic-triggered crisis, however, pulled the country back into the upper-middle-income group. In the medium to long term, Romania needs to address its structural constraints, including persistent twin deficits, high ine ualities, and weak growth fundamentals stemming from low productivity, labor uality issues, mainly due to shortcomings in the uality and inclusiveness of education and skills shortages, and labor uantity issues. Growth potential is further hindered by the shallow financial sector, limiting the availa-bility of long-term finance. The Government provided one of the low-est fiscal stimuli in the EU to mitigate the impact of COVID-19, reflecting the limited fiscal space. In the first COVID wave, poor and vulnerable households were less sup-ported by the fiscal response measures, which extended more directly to those in formal employment. Subse uent govern-ment programs for daily wage and sea-sonal workers extended protection to typi-cally more vulnerable segments. As a re-sult of these measures together with a robust economic rebound, the share of Romanian population living on less than $5.5 a day at 2011 revised PPP prices is estimated to have declined from 11.6 per-cent in 2020 to 11 percent in 2021.
The key challenge in the short term is to contain the COVID-19 crisis and limit its health, economic and social impacts. Ro-mania is lagging in vaccination, with about 28 percent of the population having received at least one dose as of early Sep-tember, which may jeopardize recovery. Increased inflationary pressures will trig-ger a more hawkish stance from the Na-tional Bank of Romania. Once recovery is firmly established, fiscal consolidation will be critical to avoid sharp increases in debt levels. Given Romania’s limited fiscal space, maximal absorption of the EU Mul-tiannual Financial Framework and Next Generation EU (NGEU) funds will be cru-cial for a sustainable recovery.
t lo t The Romanian economy grew by 6.5 per-cent in H1, 2021 on the back of better-than-expected Q2 performance at 13.0 percent yoy. Private consumption recovered strong-ly in H1, 2021 (up 5.2 percent yoy) led by robust demand for durable and household goods. Increased business and consumer confidence also supported higher invest-ment (up 11.9 percent yoy). However, high-er prices of raw materials could temper investment growth over the short to medi-um term. The trade deficit marginally de-creased as both exports (up 16.8 percent yoy), and imports (up 20 percent yoy) re-covered, benefiting from the gradual reo-pening of the EU economies and the low base effect. On the supply side, growth was led by industry (up 10.4 percent yoy), as
ROMANIA
FIGURE 1 Romania / Real GDP growth and contributions to real GDP growth
FIGURE 2 Romania / Actual and projected poverty rates and real GDP per capita
Source: World Bank Source: World Bank. Notes: see table 2.
Amidst relaxed containment measures and increased business and consumer confidence, economic recovery gathered momentum with real GDP growing by 6.5 percent in H1, 2021. The economy is projected to expand by 7.3 percent this year, amongst the highest in the EU, with output returning to pre-pandemic levels. However, the fiscal deficit will remain elevated in 2021, at around 7.4 percent of GDP. Poverty is expected to have de-clined to 11 percent in 2021.
Table 1 2020Population, million 1 9.2GDP, current US$ billion 249.0GDP per capita, current US$ 1 2968.8
International poverty rate ($1.9)a 2.6
Lower middle-income poverty rate ($3.2)a 5.3
Upper middle-income poverty rate ($5.5)a 1 1.0
Gini indexa 35.9
School enro llment, primary (% gross)b 87.3
Life expectancy at birth, yearsb 75.5Total GHG Emissions (mtCO2e) 75.5
(b) WDI for School enrollment (201 8); Life expectancy (201 9).
Source: WDI, M acro Poverty Outlook, and off icial data.(a) M ost recent value (201 8), 201 1 PPPs.
-30
-20
-10
0
10
20
30
2006 2008 2010 2012 2014 2016 2018 2020 2022
Gov. cons. GFCF Private cons.Imports Exports GDP
Percent, percentage points Poverty rate (%) Real GDP per capita (LCU constant)
0
2000
4000
6000
8000
10000
12000
0
5
10
15
20
25
30
35
40
2006 2008 2010 2012 2014 2016 2018 2020 2022
International poverty rate Lower middle-income pov. rateUpper middle-income pov. rate Real GDP pc
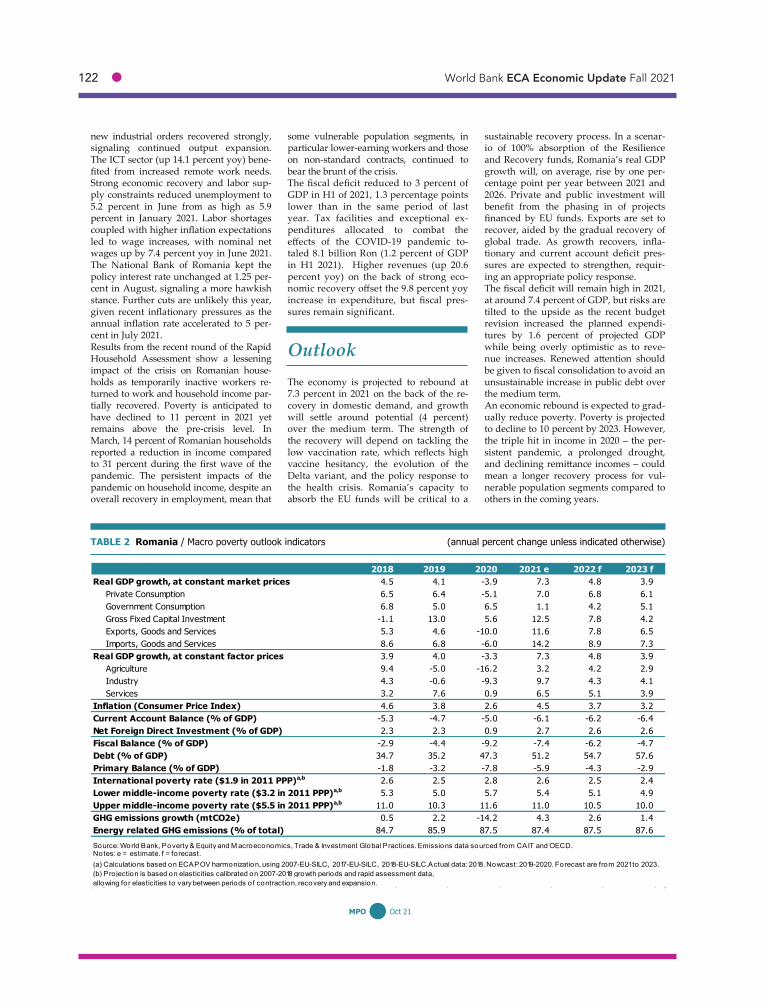
122 ● World Bank ECA Economic Update Fall 2021
73 MPO Oct 21
new industrial orders recovered strongly, signaling continued output expansion. The ICT sector (up 14.1 percent yoy) bene-fited from increased remote work needs. Strong economic recovery and labor sup-ply constraints reduced unemployment to 5.2 percent in June from as high as 5.9 percent in January 2021. Labor shortages coupled with higher inflation expectations led to wage increases, with nominal net wages up by 7.4 percent yoy in June 2021. The National Bank of Romania kept the policy interest rate unchanged at 1.25 per-cent in August, signaling a more hawkish stance. Further cuts are unlikely this year, given recent inflationary pressures as the annual inflation rate accelerated to 5 per-cent in July 2021. Results from the recent round of the Rapid Household Assessment show a lessening impact of the crisis on Romanian house-holds as temporarily inactive workers re-turned to work and household income par-tially recovered. Poverty is anticipated to have declined to 11 percent in 2021 yet remains above the pre-crisis level. In March, 14 percent of Romanian households reported a reduction in income compared to 31 percent during the first wave of the pandemic. The persistent impacts of the pandemic on household income, despite an overall recovery in employment, mean that
some vulnerable population segments, in particular lower-earning workers and those on non-standard contracts, continued to bear the brunt of the crisis. The fiscal deficit reduced to 3 percent of GDP in H1 of 2021, 1.3 percentage points lower than in the same period of last year. Tax facilities and exceptional ex-penditures allocated to combat the effects of the COVID-19 pandemic to-taled 8.1 billion Ron (1.2 percent of GDP in H1 2021). Higher revenues (up 20.6 percent yoy) on the back of strong eco-nomic recovery offset the 9.8 percent yoy increase in expenditure, but fiscal pres-sures remain significant.
Outlook The economy is projected to rebound at 7.3 percent in 2021 on the back of the re-covery in domestic demand, and growth will settle around potential (4 percent) over the medium term. The strength of the recovery will depend on tackling the low vaccination rate, which reflects high vaccine hesitancy, the evolution of the Delta variant, and the policy response to the health crisis. Romania’s capacity to absorb the EU funds will be critical to a
sustainable recovery process. In a scenar-io of 100% absorption of the Resilience and Recovery funds, Romania’s real GDP growth will, on average, rise by one per-centage point per year between 2021 and 2026. Private and public investment will benefit from the phasing in of projects financed by EU funds. Exports are set to recover, aided by the gradual recovery of global trade. As growth recovers, infla-tionary and current account deficit pres-sures are expected to strengthen, requir-ing an appropriate policy response. The fiscal deficit will remain high in 2021, at around 7.4 percent of GDP, but risks are tilted to the upside as the recent budget revision increased the planned expendi-tures by 1.6 percent of projected GDP while being overly optimistic as to reve-nue increases. Renewed attention should be given to fiscal consolidation to avoid an unsustainable increase in public debt over the medium term. An economic rebound is expected to grad-ually reduce poverty. Poverty is projected to decline to 10 percent by 2023. However, the triple hit in income in 2020 the per-sistent pandemic, a prolonged drought, and declining remittance incomes could mean a longer recovery process for vul-nerable population segments compared to others in the coming years.
TABLE 2 Romania / Macro poverty outlook indicators (annual percent change unless indicated otherwise)
2018 2019 2020 2021 e 2022 f 2023 fReal GDP growth, at constant market prices 4.5 4.1 -3.9 7.3 4.8 3.9
Private Consumption 6.5 6.4 -5.1 7.0 6.8 6.1Government Consumption 6.8 5.0 6.5 1.1 4.2 5.1Gross Fixed Capital Investment -1.1 13.0 5.6 12.5 7.8 4.2Exports, Goods and Services 5.3 4.6 -10.0 11.6 7.8 6.5Imports, Goods and Services 8.6 6.8 -6.0 14.2 8.9 7.3
Real GDP growth, at constant factor prices 3.9 4.0 -3.3 7.3 4.8 3.9Agriculture 9.4 -5.0 -16.2 3.2 4.2 2.9Industry 4.3 -0.6 -9.3 9.7 4.3 4.1Services 3.2 7.6 0.9 6.5 5.1 3.9
Inflation (Consumer Price Index) 4.6 3.8 2.6 4.5 3.7 3.2Current Account Balance (% of GDP) -5.3 -4.7 -5.0 -6.1 -6.2 -6.4Net Foreign Direct Investment (% of GDP) 2.3 2.3 0.9 2.7 2.6 2.6Fiscal Balance (% of GDP) -2.9 -4.4 -9.2 -7.4 -6.2 -4.7Debt (% of GDP) 34.7 35.2 47.3 51.2 54.7 57.6Primary Balance (% of GDP) -1.8 -3.2 -7.8 -5.9 -4.3 -2.9International poverty rate ($1.9 in 2011 PPP)a,b 2.6 2.5 2.8 2.6 2.5 2.4Lower middle-income poverty rate ($3.2 in 2011 PPP)a,b 5.3 5.0 5.7 5.4 5.1 4.9Upper middle-income poverty rate ($5.5 in 2011 PPP)a,b 11.0 10.3 11.6 11.0 10.5 10.0GHG emissions growth (mtCO2e) 0.5 2.2 -14.2 4.3 2.6 1.4Energy related GHG emissions (% of total) 84.7 85.9 87.5 87.4 87.5 87.6Source: World Bank, Poverty & Equity and M acroeconomics, Trade & Investment Global Practices. Emissions data sourced from CAIT and OECD.Notes: e = estimate, f = forecast.NA(a) Calculations based on ECAPOV harmonization, using 2007-EU-SILC, 2017-EU-SILC, 2018-EU-SILC.Actual data: 2018. Nowcast: 2019-2020. Forecast are from 2021 to 2023.(b) Pro jection is based on elasticities calibrated on 2007-2018 growth periods and rapid assessment data, allowing for elasticities to vary between periods of contraction, recovery and expansion.

Selected Country Pages ● 123
74 MPO Oct 21
Table 1 2020Population, million 144.1GDP, current US$ billion 1486.9GNI per capita, US$ (Atlas method) 10690.0
International poverty rate ($1.9)a 0.0
Lower middle-income poverty rate ($3.2)a 0.4
Upper middle-income poverty rate ($5.5)a 3.7
Gini indexb 37.5
School enro llment, primary (% gross)b 104.7
Life expectancy at birth, yearsc 73.1
(b) M ost recent WDI value (2018).(c) M ost recent WDI value (2019).
Sources: WDI, M PO, Rosstat.(a) M ost recent value (2018), 2011 PPPs.
o t oll
ignificant macro-fiscal stabili ation
e orts undertaken by the government before the ID-1 pandemic have un-derpinned ussia’s ability to e ectively respond to pandemic’s adverse social and economic impacts. After providing sub-stantial countercyclical fiscal stimulus and accommodative monetary policy to sup-port the recovery, the authorities are now moving to phase out the stimulus and normali e ussia’s policy frameworks.
owever, the negative e ects of the pan-demic on growth potential including those stemming from learning losses, on-going restrictions on certain service activi-ties, and diminished migrant inflowswill require continued policy attention.
ussia’s potential growth rate has been trending downward since the global fi-nancial crisis. aster growth will hinge on the success of e orts to promote econom-ic diversification, reduce the state’s eco-nomic footprint, level the playing field for the private sector, and improve economic governance especially as it pertains to state-owned enterprises. oreover, the carbon intensity of domestic economic activity is about twice the world average, and ussia continues to rely heavily on earnings from fossil-fuel exports. In 2021,
ussia announced its interest in stepping up international cooperation on climate change, and in une 2021 a new regula-tion on greenhouse gases was approved.
owever, a low-carbon transition will pose significant challenges for the us-sian economy unless the government takes preemptive steps to facilitate people centered low-carbon growth.
t lo t
ussia’s GDP grew strongly, by 10. per-cent year-on-year, in the second quarter of 2021, with GDP topping its pre-pandemic level. elatively high commod-ity prices and external demand combined with a robust recovery in domestic de-mand as labor markets strengthened, credit growth was robust, and elements of social support were continued, built growth momentum this year.
ussia’s third wave of ID-1 infec-tions peaked in mid- uly, but the inci-dence of new cases remains elevated, and the number of new deaths related to
ID-1 is close to its peak. accination rates are rising, but the share of the popu-lation that is fully vaccinated remains be-low both the world average and the levels of comparator countries.
rude oil extraction continues to be con-strained by the P production agree-ment and is not expected to return to pre-pandemic levels before ay 2022. Govern-ment support programs have buoyed the construction industry, retail trade was supported by the economic recovery and new credit. igh-frequency indicators for the third quarter show growth moderat-ing as the output gap narrows. he us-sian banking sector has successfully
RUSSIAN FEDERATION
FIGURE 1 Russian Federation / Consumer price index and inflation expectations
FIGURE 2 Russian Federation / Actual and projected poverty rates and real private consumption per capita
Sources: Rosstat and Bank of Russia. Note: In April – July 2020, due to the self-isolation measures introduced by the government in connection with the spread of Covid-19 infection regular surveys of the population in the format of personal interviews were suspended.
Source: World Bank. Notes: see Table 2.
Russia’s economic recovery is set to ex-ceed expectations this year. Rising com-modity prices and buoyant external and domestic demand has boosted the project-ed GDP growth rate to 4.3 percent. How-ever, persistent structural constraints are expected to slow growth in 2022 and 2023. Ably navigating the global low-carbon transition will be key to Russia’s outlook in future years and will call for important public policy choices and eco-nomic diversification.
0
2
4
6
8
10
12
14
Jan-19 Jun-19 Nov-19 Apr-20 Sep-20 Feb-21 Jul-21
CPI Infation expectations CPI target
Percent, y/y
0
50000
100000
150000
200000
250000
300000
350000
400000
0
5
10
15
20
25
2004 2006 2008 2010 2012 2014 2016 2018 2020 2022International poverty rate Lower middle-income pov. rateUpper middle-income pov. rate Real priv. cons. pc
Poverty rate (%) Real private consumption per capita (constant LCU)

124 ● World Bank ECA Economic Update Fall 2021
75 MPO Oct 21
weathered the COVID-19 crisis. The bank-ing sector’s key credit-risk and perfor-mance indicators have remained largely stable since the beginning of the pandem-ic, with an overall capital-adequacy ratio of 12.4 percent (as of August 1, 2021). In the first half of 2021, the general gov-ernment registered a surplus of 2.4 per-cent of GDP compared to a deficit of 1.8 percent deficit in the first half of 2020. With the removal of emergency support measures primary expenditures dropped by 3.8 percentage points of GDP while economic rebound and higher commodi-ties prices boosted receipts from oil/gas-sector taxes and VAT. Rebounding domestic demand in a con-text of persistent supply bottlenecks and elevated global commodity prices pushed the annual inflation rate to a five-year high of 6.7 percent in August, and infla-tionary expectations are also elevated. These developments prompted the central bank to increase interest rate by a cumula-tive 250 basis points to 6.75 percent by September 2021. The labor market has been steadily im-proving since August 2020, and the unem-ployment rate fell to 4.5 percent in July 2021, close to its pre-pandemic level. The
official poverty rate reached 14.4 percent in the first quarter of 2021, as the impact of the pandemic endured while emergency safety-net measures were phased out. This rate is not strictly comparable to the previ-ous series because of changes in methodol-ogy adopted by ROSSTAT in December 2020. In the second quarter, it fell to 13.1 percent, driven by improvements in the labor market and new support for low-income households with children.
Outlook The GDP growth rate is expected to reach 4.3 in 2021 before declining to 2.8 percent in 2022. With the output gap closing in 2021, growth is expected to moderate toward its trend level and reach 1.8 per-cent in 2023. A continued global econom-ic recovery, relatively high oil prices, and an improved COVID situation are ex-pected to help consolidate the incipient recovery of domestic demand. A gradual easing of OPEC+ restrictions by end-September 2022 will boost the oil sector’s output, while less-stringent COVID measures will benefit several services
subsectors. Meanwhile, improved busi-ness confidence and high profits for re-source-oriented companies will acceler-ate investment growth. Moderate pres-sure on bank capitalization is expected in the medium term, as the share of restruc-tured loans is high at 13 percent of all loans. However, following the withdraw-al of forbearance in July, asset-quality problems have now largely materialized and are adequately covered by reserves. Rising interest rates, recent changes to the subsidized mortgage-lending pro-gram, and new macro-prudential measures are expected to help slow the rapid growth of retail lending (22 per-cent, year-on-year), which has been driv-en by mortgages and unsecured loans. The poverty rate at the upper-middle-income poverty line of US$5.5 per day is expected to decline in 2021 as the econo-my rebounds, but it is projected to remain above pre-pandemic levels until 2022. Downside risks have intensified. With low vaccination rates, the evolution of the pandemic remains the primary source of immediate risk. New sanctions and an abrupt tightening of global fi-nancing conditions could also worsen Russia’s outlook.
TABLE 2 Russian Federation / Macro poverty outlook indicators (annual percent change unless indicated otherwise)
2018 2019 2020 2021 e 2022 f 2023 fReal GDP growth, at constant market prices 2.8 2.0 -3.0 4.3 2.8 1.8
Private Consumption 4.3 3.2 -8.6 7.8 2.5 2.0Government Consumption 1.3 2.4 4.0 -0.9 -1.0 1.0Gross Fixed Capital Investment 0.6 1.5 -4.3 4.2 3.6 3.2Exports, Goods and Services 5.0 1.4 -4.3 5.3 4.9 3.0Imports, Goods and Services 2.7 3.4 -12.0 15.9 4.2 3.7
Real GDP growth, at constant factor prices 2.8 2.0 -2.7 4.3 2.8 1.8Agriculture 1.7 3.5 0.2 1.1 1.8 1.8Industry 2.9 1.5 -3.2 4.2 3.6 2.2Services 2.8 2.2 -2.6 4.6 2.5 1.7
Inflation (Consumer Price Index) 2.9 4.5 3.4 6.2 4.8 4.0Current Account Balance (% of GDP) 7.0 3.9 2.4 5.5 4.6 2.7Net Foreign Direct Investment (% of GDP) -1.4 0.6 -0.2 -1.1 -0.7 -0.5Fiscal Balance (% of GDP)a 2.9 1.9 -4.0 -0.2 1.5 1.1Debt (% of GDP) 14.6 14.7 20.4 21.1 21.2 21.4Primary Balance (% of GDP)a 3.8 2.7 -3.2 0.6 2.4 2.0International poverty rate ($1.9 in 2011 PPP)b,c 0.0 0.0 0.1 0.0 0.0 0.0Lower middle-income poverty rate ($3.2 in 2011 PPP)b,c 0.4 0.3 0.4 0.3 0.3 0.3Upper middle-income poverty rate ($5.5 in 2011 PPP)b,c 3.7 3.2 4.3 3.3 3.0 2.8GHG emissions growth (mtCO2e) 5.4 2.4 -6.5 2.7 3.1 1.3Energy related GHG emissions (% of total) 95.2 91.6 92.7 91.8 90.4 89.7Source: World Bank, Poverty & Equity and M acroeconomics, Trade & Investment Global Practices. Emissions data sourced from CAIT and OECD.Notes: e = estimate, f = forecast.NA(a) Fiscal and Primary Balance refer to general government balances.(b) Calculations based on ECAPOV harmonization, using 2018-HBS.Actual data: 2018. Nowcast: 2019-2020. Forecast are from 2021 to 2023.(c) Pro jection using neutral distribution (2018) with pass-through = 0.87 based on private consumption per capita in constant LCU.

Selected Country Pages ● 125
76 MPO Oct 21
o t oll
The focus of the Government of Serbia in 2020 was on supporting the economy to recover from the impact of the COVID-19 pandemic. The Serbian government ap-proved a robust fiscal stimulus program amounting to nearly 13 percent of GDP at the outset of the pandemic. The pro-gram comprised direct budgetary measures (ta deferrals and higher spend-ing) and guarantees, corresponding to 8 percent of GDP and . percent of GDP respectively. Thanks to the timely deploy-ment of the program, the economy experi-enced only a mild recession (of -1 percent) in 2020. The impact of the program, how-ever, came at considerable fiscal cost. The fiscal deficit reached .1 percent of GDP in 2020 and public debt increased to .2 percent of GDP. The rate of economic growth averaged 1.9 percent annually in the decade prior to the pandemic and had started to in-crease just before the onset of COVID-19, with growth averaging . percent in 2018-19. Consumption was the main driver of growth while investment re-mained low, hovering around 19 percent of GDP during 2010-19. Over the medium term the Serbian econo-my is expected to return to the pre-pandemic growth levels. owever, erbia still faces challenges that limit its potential growth both in the short and medium to long terms. ost importantly, erbia
needs to further remove bo lenecks for private sector investment. These include a deteriorating governance environment, lack of infrastructure and an unreformed education sector, which creates skills mis-matches in the labor market. ith limited space for future stimulus packages, struc-tural reforms are needed to bring the economy back to sustained growth, boost jobs and incomes and strengthen resili-ence to shocks.
t lo t The Serbian economy started to show signs of recovery in the first half of 2021. After three consecutive uarters of decline (Q2- 2020 , the economy grew 1. per-cent y y in 1. Growth accelerated in 2 and is estimated at 13. percent, well above e pectations. As a result, projected growth for 2021 has been revised upwards from to percent. The fast increase in exports underpinned the recovery in 2021: the contribution to growth of net e ports was .2 percentage points in Q1. Exports increased across the board, with raw materials having the most significant impact while consumption and investment contributed negatively to growth (-1. and -2.1 percentage points respectively in 1. During the second quarter, however, the drivers of growth changed with consumption having the main impact on GDP growth. The wage subsidy and cash transfers to citi ens in 2020 helped to avert a spike in poverty. Due to the support package,
SERBIA
FIGURE 1 Serbia / Real GDP growth and contributions to real GDP growth
FIGURE 2 Serbia / Actual and projected poverty rates and real GDP per capita
Source: World Bank staff calculations Source: World Bank. Notes: see Table 2.
The Serbian economy is recovering well from the impact of COVID-19 pandemic that led to a mild recession of -1 percent in 2020 and poverty incidence remains close to its 2019 value at 17.1 percent. Growth will rebound in 2021 to an esti-mated 6 percent, and to stabilize around 4 percent over the medium term, but this is critically dependent on the recovery of the world economy, the ability to contain COVID-19 and the pace and depth of key structural reforms.
Table 1 2020Population, million 6.9GDP, current US$ billion 53.0GDP per capita, current US$ 7681 .2
Upper middle-income poverty rate ($5.5)a 1 9.8
Gini indexa 37.2
School enro llment, primary (% gross)b 99.6
Life expectancy at birth, yearsb 75.7
(b) M ost recent WDI value (201 9).
Source: WDI, M acro Poverty Outlook, and off icial data.(a) M ost recent value (201 7), 201 1 PPPs.
Poverty rate (%) Real GDP per capita (LCU constant)
0
100000
200000
300000
400000
500000
600000
700000
0
5
10
15
20
25
30
2012 2014 2016 2018 2020 2022
Upper middle-income pov. rate Real GDP pc
-20
-15
-10
-5
0
5
10
15
20
25
2000 2003 2006 2009 2012 2015 2018 2021
Gov. cons. Exports GFCFInventories Private cons. ImportsStatistical disc. GDP
Percent, percentage points
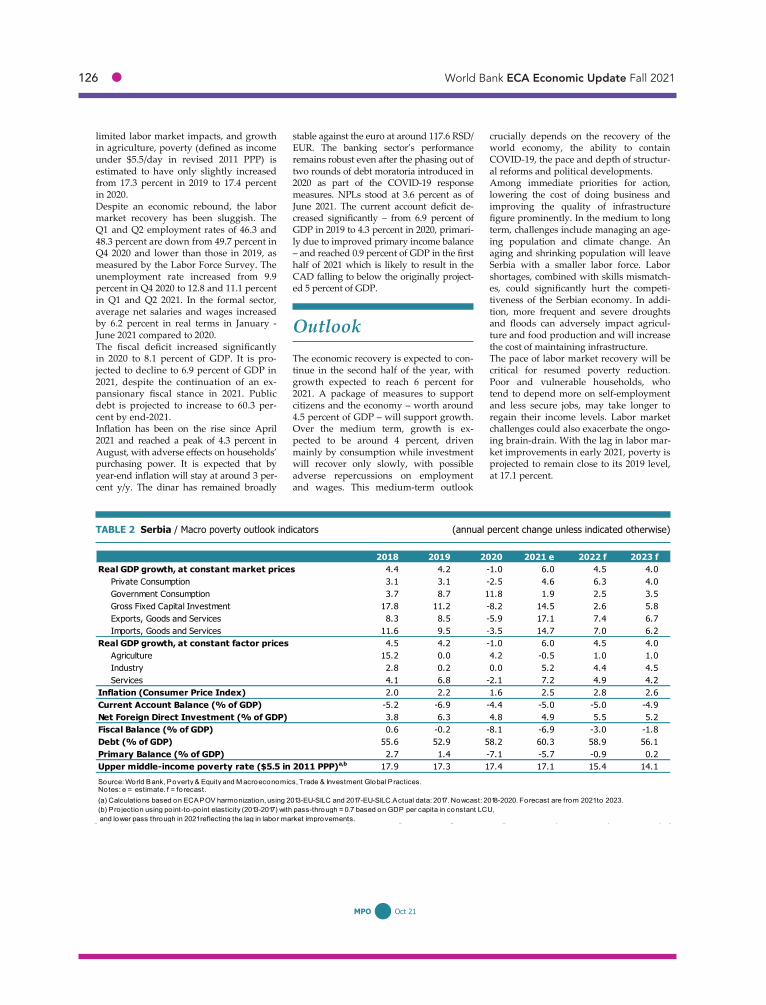
126 ● World Bank ECA Economic Update Fall 2021
77 MPO Oct 21
limited labor market impacts, and growth in agriculture, poverty (defined as income under $5.5/day in revised 2011 PPP) is estimated to have only slightly increased from 17.3 percent in 2019 to 17.4 percent in 2020. Despite an economic rebound, the labor market recovery has been sluggish. The Q1 and Q2 employment rates of 46.3 and 48.3 percent are down from 49.7 percent in Q4 2020 and lower than those in 2019, as measured by the Labor Force Survey. The unemployment rate increased from 9.9 percent in Q4 2020 to 12.8 and 11.1 percent in Q1 and Q2 2021. In the formal sector, average net salaries and wages increased by 6.2 percent in real terms in January - June 2021 compared to 2020. The fiscal deficit increased significantly in 2020 to 8.1 percent of GDP. It is pro-jected to decline to 6.9 percent of GDP in 2021, despite the continuation of an ex-pansionary fiscal stance in 2021. Public debt is projected to increase to 60.3 per-cent by end-2021. Inflation has been on the rise since April 2021 and reached a peak of 4.3 percent in August, with adverse effects on households’ purchasing power. It is expected that by year-end inflation will stay at around 3 per-cent y/y. The dinar has remained broadly
stable against the euro at around 117.6 RSD/EUR. The banking sector’s performance remains robust even after the phasing out of two rounds of debt moratoria introduced in 2020 as part of the COVID-19 response measures. NPLs stood at 3.6 percent as of June 2021. The current account deficit de-creased significantly from 6.9 percent of GDP in 2019 to 4.3 percent in 2020, primari-ly due to improved primary income balance and reached 0.9 percent of GDP in the first
half of 2021 which is likely to result in the CAD falling to below the originally project-ed 5 percent of GDP.
Outlook The economic recovery is expected to con-tinue in the second half of the year, with growth expected to reach 6 percent for 2021. A package of measures to support citizens and the economy worth around 4.5 percent of GDP will support growth. Over the medium term, growth is ex-pected to be around 4 percent, driven mainly by consumption while investment will recover only slowly, with possible adverse repercussions on employment and wages. This medium-term outlook
crucially depends on the recovery of the world economy, the ability to contain COVID-19, the pace and depth of structur-al reforms and political developments. Among immediate priorities for action, lowering the cost of doing business and improving the quality of infrastructure figure prominently. In the medium to long term, challenges include managing an age-ing population and climate change. An aging and shrinking population will leave Serbia with a smaller labor force. Labor shortages, combined with skills mismatch-es, could significantly hurt the competi-tiveness of the Serbian economy. In addi-tion, more frequent and severe droughts and floods can adversely impact agricul-ture and food production and will increase the cost of maintaining infrastructure. The pace of labor market recovery will be critical for resumed poverty reduction. Poor and vulnerable households, who tend to depend more on self-employment and less secure jobs, may take longer to regain their income levels. Labor market challenges could also exacerbate the ongo-ing brain-drain. With the lag in labor mar-ket improvements in early 2021, poverty is projected to remain close to its 2019 level, at 17.1 percent.
TABLE 2 Serbia / Macro poverty outlook indicators (annual percent change unless indicated otherwise)
2018 2019 2020 2021 e 2022 f 2023 fReal GDP growth, at constant market prices 4.4 4.2 -1.0 6.0 4.5 4.0
Private Consumption 3.1 3.1 -2.5 4.6 6.3 4.0Government Consumption 3.7 8.7 11.8 1.9 2.5 3.5Gross Fixed Capital Investment 17.8 11.2 -8.2 14.5 2.6 5.8Exports, Goods and Services 8.3 8.5 -5.9 17.1 7.4 6.7Imports, Goods and Services 11.6 9.5 -3.5 14.7 7.0 6.2
Real GDP growth, at constant factor prices 4.5 4.2 -1.0 6.0 4.5 4.0Agriculture 15.2 0.0 4.2 -0.5 1.0 1.0Industry 2.8 0.2 0.0 5.2 4.4 4.5Services 4.1 6.8 -2.1 7.2 4.9 4.2
Inflation (Consumer Price Index) 2.0 2.2 1.6 2.5 2.8 2.6Current Account Balance (% of GDP) -5.2 -6.9 -4.4 -5.0 -5.0 -4.9Net Foreign Direct Investment (% of GDP) 3.8 6.3 4.8 4.9 5.5 5.2Fiscal Balance (% of GDP) 0.6 -0.2 -8.1 -6.9 -3.0 -1.8Debt (% of GDP) 55.6 52.9 58.2 60.3 58.9 56.1Primary Balance (% of GDP) 2.7 1.4 -7.1 -5.7 -0.9 0.2Upper middle-income poverty rate ($5.5 in 2011 PPP)a,b 17.9 17.3 17.4 17.1 15.4 14.1Source: World Bank, Poverty & Equity and M acroeconomics, Trade & Investment Global Practices.Notes: e = estimate, f = forecast.NA(a) Calculations based on ECAPOV harmonization, using 2013-EU-SILC and 2017-EU-SILC.Actual data: 2017. Nowcast: 2018-2020. Forecast are from 2021 to 2023.(b) Pro jection using point-to-point elasticity (2013-2017) with pass-through = 0.7 based on GDP per capita in constant LCU, and lower pass through in 2021 reflecting the lag in labor market improvements.
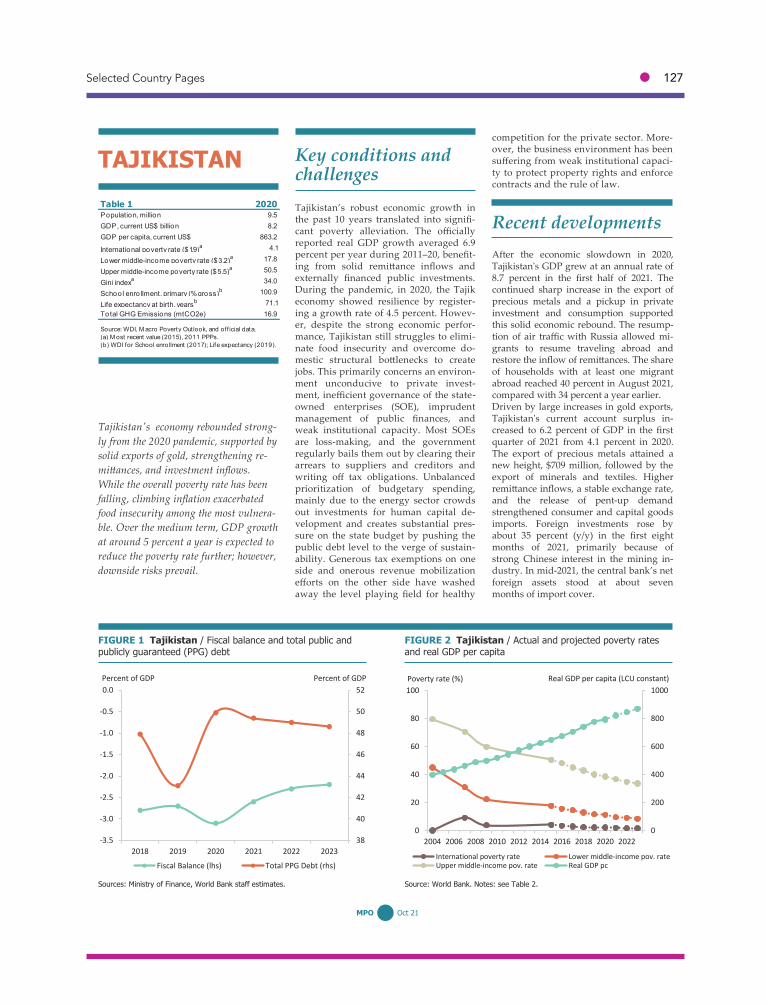
Selected Country Pages ● 127
78 MPO Oct 21
Tajikistan’s robust economic growth in the past 10 years translated into signifi-cant poverty alleviation. The officially reported real GDP growth averaged 6.9 percent per year during 2011–20 benefit-ing from solid remittance inflows and externally financed public investments. During the pandemic, in 2020, the Tajik economy showed resilience by register-ing a growth rate of 4.5 percent. owev-er, despite the strong economic perfor-mance, Tajikistan still struggles to elimi-nate food insecurity and overcome do-mestic structural bottlenecks to create jobs. This primarily concerns an environ-ment unconducive to private invest-ment, inefficient governance of the state-owned enterprises (SOE), imprudent management of public finances, and weak institutional capacity. Most SOEs are loss-making, and the government regularly bails them out by clearing their arrears to suppliers and creditors and writing off tax obligations. nbalanced prioritization of budgetary spending, mainly due to the energy sector crowds out investments for human capital de-velopment and creates substantial pres-sure on the state budget by pushing the public debt level to the verge of sustain-ability. Generous tax exemptions on one side and onerous revenue mobilization efforts on the other side have washed away the level playing field for healthy
competition for the private sector. ore-over, the business environment has been suffering from weak institutional capaci-ty to protect property rights and enforce contracts and the rule of law.
After the economic slowdown in 2020, Tajikistan's GDP grew at an annual rate of 8.7 percent in the first half of 2021. The continued sharp increase in the export of precious metals and a pickup in private investment and consumption supported this solid economic rebound. The resump-tion of air traffic with Russia allowed mi-grants to resume traveling abroad and restore the inflow of remittances. The share of households with at least one migrant abroad reached 40 percent in August 2021, compared with 34 percent a year earlier. Driven by large increases in gold exports, Tajikistan's current account surplus in-creased to 6.2 percent of GDP in the first quarter of 2021 from 4.1 percent in 2020. The export of precious metals attained a new height, $709 million, followed by the export of minerals and textiles. Higher remittance inflows, a stable exchange rate, and the release of pent-up demand strengthened consumer and capital goods imports. Foreign investments rose by about 35 percent (y/y) in the first eight months of 2021, primarily because of strong Chinese interest in the mining in-dustry. In mid-2021, the central bank’s net foreign assets stood at about seven months of import cover.
TAJIKISTAN
FIGURE 1 Tajikistan / Fiscal balance and total public and publicly guaranteed (PPG) debt
FIGURE 2 Tajikistan / Actual and projected poverty rates and real GDP per capita
Sources: Ministry of Finance, World Bank staff estimates. Source: World Bank. Notes: see Table 2.
Table 1 2020Population, million 9.5GDP, current US$ billion 8.2GDP per capita, current US$ 863.2
International poverty rate ($1.9)a 4.1
Lower middle-income poverty rate ($3.2)a 1 7.8
Upper middle-income poverty rate ($5.5)a 50.5
Gini indexa 34.0
School enro llment, primary (% gross)b 1 00.9
Life expectancy at birth, yearsb 71 .1Total GHG Emissions (mtCO2e) 1 6.9
(b) WDI for School enrollment (201 7); Life expectancy (201 9).
Source: WDI, M acro Poverty Outlook, and off icial data.(a) M ost recent value (201 5), 201 1 PPPs.
Poverty rate (%) Real GDP per capita (LCU constant)
0
200
400
600
800
1000
0
20
40
60
80
100
2004 2006 2008 2010 2012 2014 2016 2018 2020 2022
International poverty rate Lower middle-income pov. rateUpper middle-income pov. rate Real GDP pc
38
40
42
44
46
48
50
52
-3.5
-3.0
-2.5
-2.0
-1.5
-1.0
-0.5
0.0
2018 2019 2020 2021 2022 2023
Fiscal Balance (lhs) Total PPG Debt (rhs)
Percent of GDP Percent of GDP
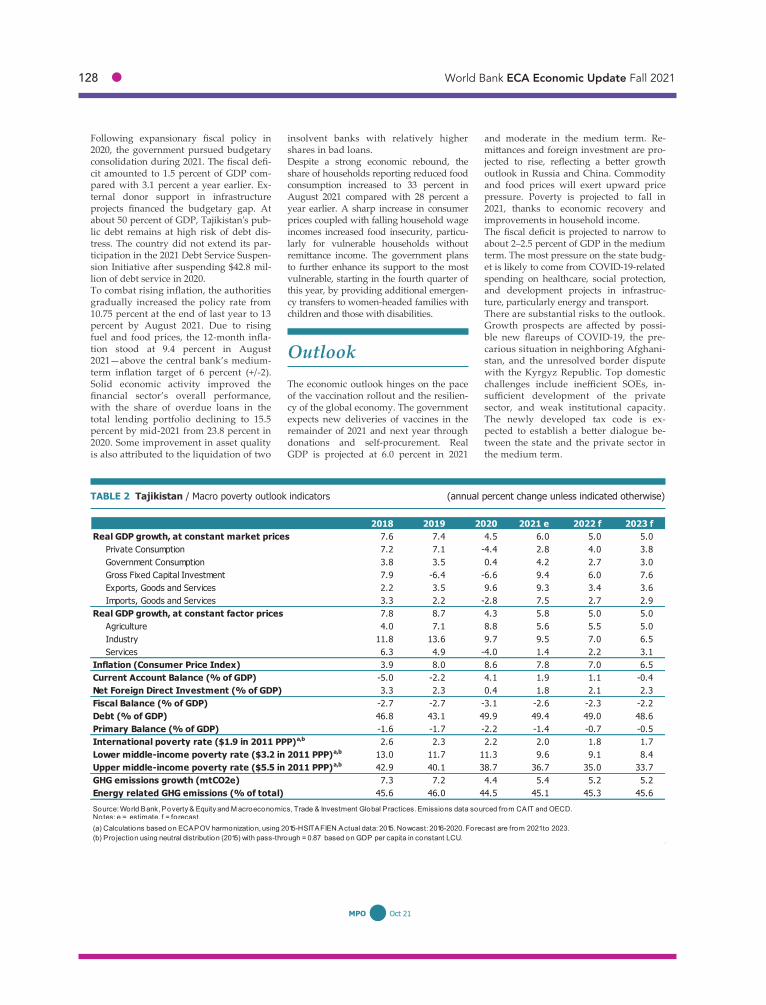
128 ● World Bank ECA Economic Update Fall 2021
79 MPO Oct 21
Following expansionary fiscal policy in 2020, the government pursued budgetary consolidation during 2021. The fiscal defi-cit amounted to 1.5 percent of GDP com-pared with 3.1 percent a year earlier. Ex-ternal donor support in infrastructure projects financed the budgetary gap. At about 50 percent of GDP, Tajikistan's pub-lic debt remains at high risk of debt dis-tress. The country did not extend its par-ticipation in the 2021 Debt Service Suspen-sion Initiative after suspending $42.8 mil-lion of debt service in 2020. To combat rising inflation, the authorities gradually increased the policy rate from 10.75 percent at the end of last year to 13 percent by August 2021. Due to rising fuel and food prices, the 12-month infla-tion stood at 9.4 percent in August 2021—above the central bank’s medium-term inflation target of 6 percent (+/-2). Solid economic activity improved the financial sector’s overall performance, with the share of overdue loans in the total lending portfolio declining to 15.5 percent by mid-2021 from 23.8 percent in 2020. Some improvement in asset quality is also attributed to the liquidation of two
insolvent banks with relatively higher shares in bad loans. Despite a strong economic rebound, the share of households reporting reduced food consumption increased to 33 percent in August 2021 compared with 28 percent a year earlier. A sharp increase in consumer prices coupled with falling household wage incomes increased food insecurity, particu-larly for vulnerable households without remittance income. The government plans to further enhance its support to the most vulnerable, starting in the fourth quarter of this year, by providing additional emergen-cy transfers to women-headed families with children and those with disabilities.
The economic outlook hinges on the pace of the vaccination rollout and the resilien-cy of the global economy. The government expects new deliveries of vaccines in the remainder of 2021 and next year through donations and self-procurement. Real GDP is projected at 6.0 percent in 2021
and moderate in the medium term. Re-mittances and foreign investment are pro-jected to rise, reflecting a better growth outlook in Russia and China. Commodity and food prices will exert upward price pressure. Poverty is projected to fall in 2021, thanks to economic recovery and improvements in household income. The fiscal deficit is projected to narrow to about 2–2.5 percent of GDP in the medium term. The most pressure on the state budg-et is likely to come from COVID-19-related spending on healthcare, social protection, and development projects in infrastruc-ture, particularly energy and transport. There are substantial risks to the outlook. Growth prospects are affected by possi-ble new flareups of COVID-19, the pre-carious situation in neighboring Afghani-stan, and the unresolved border dispute with the Kyrgyz Republic. Top domestic challenges include inefficient SOEs, in-sufficient development of the private sector, and weak institutional capacity. The newly developed tax code is ex-pected to establish a better dialogue be-tween the state and the private sector in the medium term.
TABLE 2 Tajikistan / Macro poverty outlook indicators (annual percent change unless indicated otherwise)
2018 2019 2020 2021 e 2022 f 2023 fReal GDP growth, at constant market prices 7.6 7.4 4.5 6.0 5.0 5.0
Private Consumption 7.2 7.1 -4.4 2.8 4.0 3.8Government Consumption 3.8 3.5 0.4 4.2 2.7 3.0Gross Fixed Capital Investment 7.9 -6.4 -6.6 9.4 6.0 7.6Exports, Goods and Services 2.2 3.5 9.6 9.3 3.4 3.6Imports, Goods and Services 3.3 2.2 -2.8 7.5 2.7 2.9
Real GDP growth, at constant factor prices 7.8 8.7 4.3 5.8 5.0 5.0Agriculture 4.0 7.1 8.8 5.6 5.5 5.0Industry 11.8 13.6 9.7 9.5 7.0 6.5Services 6.3 4.9 -4.0 1.4 2.2 3.1
Inflation (Consumer Price Index) 3.9 8.0 8.6 7.8 7.0 6.5Current Account Balance (% of GDP) -5.0 -2.2 4.1 1.9 1.1 -0.4Net Foreign Direct Investment (% of GDP) 3.3 2.3 0.4 1.8 2.1 2.3Fiscal Balance (% of GDP) -2.7 -2.7 -3.1 -2.6 -2.3 -2.2Debt (% of GDP) 46.8 43.1 49.9 49.4 49.0 48.6Primary Balance (% of GDP) -1.6 -1.7 -2.2 -1.4 -0.7 -0.5International poverty rate ($1.9 in 2011 PPP)a,b 2.6 2.3 2.2 2.0 1.8 1.7Lower middle-income poverty rate ($3.2 in 2011 PPP)a,b 13.0 11.7 11.3 9.6 9.1 8.4Upper middle-income poverty rate ($5.5 in 2011 PPP)a,b 42.9 40.1 38.7 36.7 35.0 33.7GHG emissions growth (mtCO2e) 7.3 7.2 4.4 5.4 5.2 5.2Energy related GHG emissions (% of total) 45.6 46.0 44.5 45.1 45.3 45.6Source: World Bank, Poverty & Equity and M acroeconomics, Trade & Investment Global Practices. Emissions data sourced from CAIT and OECD.Notes: e = estimate, f = forecast.NA(a) Calculations based on ECAPOV harmonization, using 2015-HSITAFIEN.Actual data: 2015. Nowcast: 2016-2020. Forecast are from 2021 to 2023.(b) Projection using neutral distribution (2015) with pass-through = 0.87 based on GDP per capita in constant LCU.

Selected Country Pages ● 129
80 MPO Oct 21
Turkey enjoyed high growth rates be-tween 2002-17, which propelled the coun-try to the higher reaches of upper-middle-income status. But productivity growth has slowed, as reform momentum waned over the last decade, and efforts have turned to supporting growth with credit booms and demand stimulus, exacerbat-ing internal and external vulnerabilities. High private sector debt, persistent cur-rent account deficits, high inflation, and high unemployment, have been exacerbat-ed by macro-financial instability since August 2018. Turkey entered the pandem-ic with lower buffers than its peers. The government’s economic policy re-sponse to COVID-19 was swift but fo-cused on loose monetary policy and rapid credit expansion. Turkey’s economy was one of the few in the G20 and OECD to experience positive growth in 2020. A favorable base effect, an easing of re-strictions permitted by accelerated vac-cinations, and supportive external de-mand led to double digit GDP growth in 2021H1, returning the economy and em-ployment to pre-crisis levels. ut inflation has risen to nearly 20 percent, while ex-ternal financing needs have remained elevated and met largely through short-term portfolio flows. Going forward, efforts to rebuild policy credibility and macro stability coupled with reforms fo-cused on labor, product, and financial
markets and on strengthening the way institutions work are needed to attract foreign investment and revive productivi-ty growth. Moreover, the high energy and carbon intensity of the economy makes it vulnerable to global and regional decar-bonization policies.
Turkey’s economy grew by 21.7 percent in 2021Q2 – the second highest among G-20 countries. Good progress in expanding vaccination coverage allowed pandemic-related restrictions to be relaxed in May, supporting a recovery in domestic de-mand. Private investment and consump-tion of durables, and increasingly services, have been major contributors to growth, despite the persistently high cost of bor-rowing and easing of fiscal support. x-ports were buoyed by a strong recovery in external demand, currency depreciation, and an opportunity for Turkey to gain market share in the EU as Asian exporters grappled with rising logistic costs and global supply chain constraints.
et, inflation continued to rise with the weakening of the Lira, rising international commodity prices and demand-side pres-sures. In ugust, consumer price inflation reached 19.3 percent and food prices soared by 29 percent whilst producer price inflation rose 45.5 percent. Despite this, the Central Bank reduced the policy rate to 18 percent, resulting in negative real interest rates, and raising policy uncertainty among investors already conscious of frequent
TURKEY
FIGURE 1 Turkey / Real GDP growth and contributions to real GDP growth
FIGURE 2 Turkey / Actual and projected poverty rates and real GDP per capita
Sources: Turkstat and World Bank staff calculations. Source: World Bank. Notes: see Table 2.
’ -
-
-
-
Table 1 2020Population, million 83.4GDP, current US$ billion 720.0GDP per capita, current US$ 8633.1
Upper middle-income poverty rate ($5.5)a 1 0.2
Gini indexa 41 .9
School enro llment, primary (% gross)b 94.9
Life expectancy at birth, yearsb 77.7Total GHG Emissions (mtCO2e) 489.1
(b) WDI for School enrollment (201 8); Life expectancy (201 9).
Source: WDI, M acro Poverty Outlook, and off icial data.(a) M ost recent value (201 9), 201 1 PPPs.
Poverty rate (%) Real GDP per capita (LCU constant)
0
5000
10000
15000
20000
25000
30000
0
5
10
15
20
25
30
2004 2006 2008 2010 2012 2014 2016 2018 2020 2022Upper middle-income pov. rate Real GDP pc
-12%
-7%
-2%
3%
8%
13%
18%
2009 2011 2013 2015 2017 2019 2021 2023Private consumption Government spendingInvestment ExportsImports StocksGrowth
Percent, percentage points
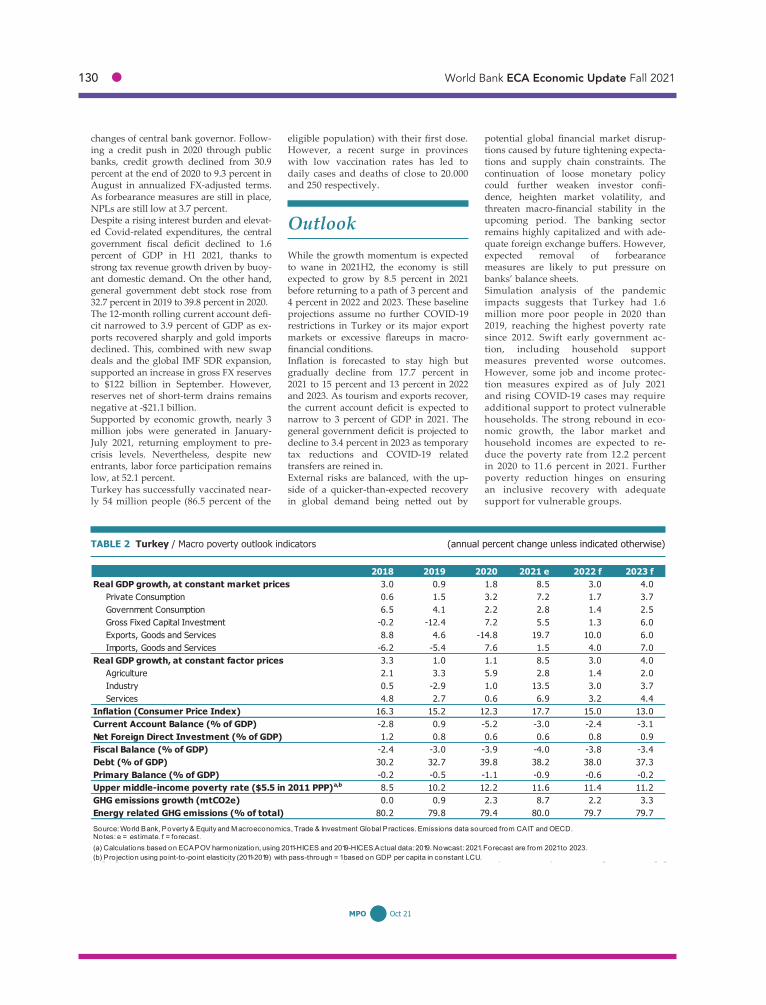
130 ● World Bank ECA Economic Update Fall 2021
81 MPO Oct 21
changes of central bank governor. Follow-ing a credit push in 2020 through public banks, credit growth declined from 30.9 percent at the end of 2020 to 9.3 percent in August in annualized FX-adjusted terms. As forbearance measures are still in place, NPLs are still low at 3.7 percent. Despite a rising interest burden and elevat-ed Covid-related expenditures, the central government fiscal deficit declined to 1.6 percent of GDP in H1 2021, thanks to strong tax revenue growth driven by buoy-ant domestic demand. On the other hand, general government debt stock rose from 32.7 percent in 2019 to 39.8 percent in 2020. The 12-month rolling current account defi-cit narrowed to 3.9 percent of GDP as ex-ports recovered sharply and gold imports declined. This, combined with new swap deals and the global IMF SDR expansion, supported an increase in gross FX reserves to $122 billion in September. However, reserves net of short-term drains remains negative at -$21.1 billion. Supported by economic growth, nearly 3 million jobs were generated in January- July 2021, returning employment to pre-crisis levels. Nevertheless, despite new entrants, labor force participation remains low, at 52.1 percent. Turkey has successfully vaccinated near-ly 54 million people (86.5 percent of the
eligible population) with their first dose. However, a recent surge in provinces with low vaccination rates has led to daily cases and deaths of close to 20.000 and 250 respectively.
While the growth momentum is expected to wane in 2021H2, the economy is still expected to grow by 8.5 percent in 2021 before returning to a path of 3 percent and 4 percent in 2022 and 2023. These baseline projections assume no further COVID-19 restrictions in Turkey or its major export markets or excessive flareups in macro-financial conditions. Inflation is forecasted to stay high but gradually decline from 17.7 percent in 2021 to 15 percent and 13 percent in 2022 and 2023. As tourism and exports recover, the current account deficit is expected to narrow to 3 percent of GDP in 2021. The general government deficit is projected to decline to 3.4 percent in 2023 as temporary tax reductions and COVID-19 related transfers are reined in. External risks are balanced, with the up-side of a quicker-than-expected recovery in global demand being netted out by
potential global financial market disrup-tions caused by future tightening expecta-tions and supply chain constraints. The continuation of loose monetary policy could further weaken investor confi-dence, heighten market volatility, and threaten macro-financial stability in the upcoming period. The banking sector remains highly capitalized and with ade-quate foreign exchange buffers. However, expected removal of forbearance measures are likely to put pressure on banks’ balance sheets. Simulation analysis of the pandemic impacts suggests that Turkey had 1.6 million more poor people in 2020 than 2019, reaching the highest poverty rate since 2012. Swift early government ac-tion, including household support measures prevented worse outcomes. However, some job and income protec-tion measures expired as of July 2021 and rising COVID-19 cases may require additional support to protect vulnerable households. The strong rebound in eco-nomic growth, the labor market and household incomes are expected to re-duce the poverty rate from 12.2 percent in 2020 to 11.6 percent in 2021. Further poverty reduction hinges on ensuring an inclusive recovery with adequate support for vulnerable groups.
TABLE 2 Turkey / Macro poverty outlook indicators (annual percent change unless indicated otherwise)
2018 2019 2020 2021 e 2022 f 2023 fReal GDP growth, at constant market prices 3.0 0.9 1.8 8.5 3.0 4.0
Private Consumption 0.6 1.5 3.2 7.2 1.7 3.7Government Consumption 6.5 4.1 2.2 2.8 1.4 2.5Gross Fixed Capital Investment -0.2 -12.4 7.2 5.5 1.3 6.0Exports, Goods and Services 8.8 4.6 -14.8 19.7 10.0 6.0Imports, Goods and Services -6.2 -5.4 7.6 1.5 4.0 7.0
Real GDP growth, at constant factor prices 3.3 1.0 1.1 8.5 3.0 4.0Agriculture 2.1 3.3 5.9 2.8 1.4 2.0Industry 0.5 -2.9 1.0 13.5 3.0 3.7Services 4.8 2.7 0.6 6.9 3.2 4.4
Inflation (Consumer Price Index) 16.3 15.2 12.3 17.7 15.0 13.0Current Account Balance (% of GDP) -2.8 0.9 -5.2 -3.0 -2.4 -3.1Net Foreign Direct Investment (% of GDP) 1.2 0.8 0.6 0.6 0.8 0.9Fiscal Balance (% of GDP) -2.4 -3.0 -3.9 -4.0 -3.8 -3.4Debt (% of GDP) 30.2 32.7 39.8 38.2 38.0 37.3Primary Balance (% of GDP) -0.2 -0.5 -1.1 -0.9 -0.6 -0.2Upper middle-income poverty rate ($5.5 in 2011 PPP)a,b 8.5 10.2 12.2 11.6 11.4 11.2GHG emissions growth (mtCO2e) 0.0 0.9 2.3 8.7 2.2 3.3Energy related GHG emissions (% of total) 80.2 79.8 79.4 80.0 79.7 79.7Source: World Bank, Poverty & Equity and M acroeconomics, Trade & Investment Global Practices. Emissions data sourced from CAIT and OECD.Notes: e = estimate, f = forecast.NA(a) Calculations based on ECAPOV harmonization, using 2011-HICES and 2019-HICES.Actual data: 2019. Nowcast: 2021. Forecast are from 2021 to 2023.(b) Projection using point-to-point elasticity (2011-2019) with pass-through = 1 based on GDP per capita in constant LCU.
Selected Country Pages ● 131
82 MPO Oct 21
o t oll
Benefiting from reforms implemented following the 2014-16 crisis, Ukraine’s economy has shown greater resilience to the COVID-19 outbreak than initially an-ticipated. COVID-response measures adopted by the Government have also been somewhat effective in cushioning the poor from the shock, while Ukraine’s fi-nancial sector has entered the COVID-19 crisis stronger and more resilient than any previous crisis. However, COVID-19 has exacerbated ex-isting socio-economic challenges and par-tially set back some gains made since 2014/15. The growth recovery also re-mains weak, underpinned by low invest-ment-to-GDP ratios, an export structure heavily dependent on commodities and significant institutional challenges that have dragged on economy-wide produc-tivity and investment. The poverty rate, based on the national poverty line, mar-ginally increased in 2020 following four years of steady decline. The labor market recovery that started in 2017 was upend-ed, with employment declining by over 660,000 in 2020 and the unemployment rate hitting 9.9 percent higher than dur-ing the 2014/15 crisis. A broad-based recovery requires complet-ing key reforms to stimulate private sector-led growth and inclusive job creation, by addressing structural bottlenecks to invest-ment while safeguarding macroeconomic
sustainability. The implementation of re-forms in land markets, banking, de-monopolization and concession projects should improve the environment for pri-vate investment, but major challenges re-main with respect to weak rule of law and institutions. The direct participation of the state in the economy (via some 3,500 SOEs many of which are poorly managed) is ex-cessive and restricts the role of market forc-es, and SOE reforms need to be accelerated. udicial reform is in the early stages and
timely implementation of recent laws adopted will be critical. Finally, rebalancing fiscal spending towards investment, and tax reforms to ease competition distortions that undermine investment, can also support capital deepening and accelerate growth .
t lo t Following a 4 percent contraction in 2020, the recovery during the first half of 2021 has been hampered by supply-side con-straints and a second wave of infections. Base effects and a partial recovery in the industrial and services sector lifted GDP growth to 5.4 percent y/y in Q2 2021 (vs -2.2 percent in Q1) however, on a sequen-tial basis, the economy contracted by 0.8 percent (sa qoq) in Q2. The labor market also deteriorated in Q1, with unemploy-ment rising to 10.9 percent. High frequen-cy retail and industrial production indica-tors, however, point to strengthening do-mestic demand a record harvest is also anticipated in the H2 2021. After steadily accelerating over the past
UKRAINE
FIGURE 1 Ukraine / Consumer and producer price indices FIGURE 2 Ukraine / Actual and projected poverty rates and real GDP per capita
Source: State Statistics Service of Ukraine. Source: World Bank. Notes: see Table 2.
A slow recovery from the COVID-19 shock is underway, supported by high commodity prices and rising government spending. Above-target inflation and ris-ing fiscal spending pressures require con-tinued prudent monetary and fiscal poli-cy. The outlook hinges upon global eco-nomic and financing conditions, and im-plementation of critical reforms to reduce the state’s economic footprint and ease investment bottlenecks. COVID-related poverty impacts were relatively muted thanks to pensions and wage growth; the poverty rate is expected to decrease to 1.6 percent in 2023.
Table 1 2020Population, million 44.0GDP, current US$ billion 1 40.9GDP per capita, current US$ 3202.3
International poverty rate ($1.9)a 0.0
Lower middle-income poverty rate ($3.2)a 0.2
Upper middle-income poverty rate ($5.5)a 2.5
Gini indexa 26.6
School enro llment, primary (% gross)b 99.0
Life expectancy at birth, yearsb 71 .8Total GHG Emissions (mtCO2e) 232.0
(b) WDI for School enrollment (201 4); Life expectancy (201 9).
Source: WDI, M acro Poverty Outlook, and off icial data.(a) M ost recent value (201 9), 201 1 PPPs.
Poverty rate (%) Real GDP per capita (LCU constant)
0
5000
10000
15000
20000
25000
30000
-5
0
5
10
15
20
25
30
2004 2006 2008 2010 2012 2014 2016 2018 2020 2022
International poverty rate Lower middle-income pov. rateUpper middle-income pov. rate Real GDP pc
-20
-10
0
10
20
30
40
50
0
2
4
6
8
10
12
14
16Headline InflationCore InflationIndustrial Producer Price Index (rhs)
Percent yoy Percent yoy

132 ● World Bank ECA Economic Update Fall 2021
83 MPO Oct 21
year, headline inflation remained flat at 10.2 percent y/y in August, double the inflation target of 5 percent. Base effects, food inflation, and gas price adjustments have been major drivers while expansion-ary wage policies, notably a 27 percent increase in minimum wages, have also played a role. However, inflation momen-tum has begun to ease owing to weaken-ing base effects, a strengthening currency and a proactive tightening of policy rates (by 250bp since April to 8.5 percent) by the central bank which also terminated anti-crisis monetary tools in September. Helped by strong external demand, favora-ble terms of trade and rising wages, fiscal revenues have performed better than antic-ipated, with consolidated revenues in H12021 rising by almost 16 percent y/y. However, expenditures grew faster, by 17.4 percent y/y, driven by rising goods and services and public wage expenditures, while capital expenditures fell 8.2 percent. On a general government basis, the deficit was twice (1.4 percent of GDP) the size of the consolidated deficit (0.6 percent) in Q1 and has been financed by costly short-term domestic and Eurobond issuances. The current account surplus reached a
record $5.2bn in 2020 and has since re-mained positive (although narrowing) due to strong services net exports and higher global commodity prices. Already ample at nearly $29 bn (4 months of im-ports), reserves have been further supple-mented by the $2.7bn IMF SDR allocation in August. Ukraine has successfully re-tained access to market financing despite volatility in global markets.
Outlook Activity should continue recovering in H2 2021, helped by better harvests, strength-ening consumer demand, and a supportive external environment. Growth is projected at 3.8 percent in 2021 underpinned by pos-itive base effects in agriculture, and rela-tive to last year’s economic contraction. The forecast takes into account the possi-bility of further temporary lockdowns and additional tightening by the central bank to anchor inflation expectations. Inflation is expected to moderate to the tar-get rate in H2 2022 supported by monetary tightening and as base effects and supply
shocks fade. The 2021 budget deficit (including arrears to the private sector and recapitalization requirements) is esti-mated at 5 percent of GDP. Together with 9.1 percent of GDP debt amortization this will increase total fiscal financing needs to 14.1 percent of GDP (vs 15.2 percent of GDP in 2020) that are expected to be met through domestic and international bor-rowing. Coupled with rising public wage expenditures (expected to reach over 11 percent of GDP in 2021), medium term spending pressures are increasing and continued prudent fiscal policy is needed to safeguard fiscal sustainability. Down-side risks stem from an uncertain global economic and financing environment amidst an ongoing pandemic and flagging of domestic reform efforts. The poverty rate based on the US$5.5 a day threshold is expected to decrease to 2 percent in 2022 and 1.6 percent by 2023, though the outlook is uncertain given rising COVID-19 cases both domestic and abroad and the slow vaccination pace. Accelerating critical reforms will be key to support the recovery and create more and better jobs.
TABLE 2 Ukraine / Macro poverty outlook indicators (annual percent change unless indicated otherwise)
2018 2019 2020 2021 e 2022 f 2023 fReal GDP growth, at constant market prices 3.3 3.2 -4.0 3.8 3.5 3.7
Private Consumption 8.9 11.9 1.6 4.6 4.5 3.5Government Consumption 0.1 -5.0 -3.0 1.5 0.0 0.0Gross Fixed Capital Investment 14.3 15.0 -24.4 10.4 8.4 7.5Exports, Goods and Services -1.6 6.7 -5.6 3.4 2.0 4.4Imports, Goods and Services 3.2 6.3 -9.6 7.5 5.7 4.8
Real GDP growth, at constant factor prices 3.3 3.4 -4.0 3.9 3.4 3.7Agriculture 7.8 1.3 -11.5 5.0 4.5 5.0Industry 2.0 -2.0 -4.0 2.0 3.0 4.5Services 3.0 5.7 -2.7 4.3 3.4 3.2
Inflation (Consumer Price Index) 9.8 4.1 4.8 9.5 6.0 5.0Current Account Balance (% of GDP) -3.2 -0.9 4.1 1.5 -0.2 -0.7Net Foreign Direct Investment (% of GDP) 1.9 2.1 2.1 2.2 2.2 4.9Fiscal Balance (% of GDP) -2.0 -2.0 -6.0 -5.0 -3.5 -2.5Debt (% of GDP) 60.6 50.4 60.6 59.3 58.1 56.8Primary Balance (% of GDP) 1.4 1.1 -2.4 -0.9 0.2 1.4Lower middle-income poverty rate ($3.2 in 2011 PPP)a,b 0.4 0.2 0.3 0.2 0.2 0.2Upper middle-income poverty rate ($5.5 in 2011 PPP)a,b 3.4 2.5 3.0 2.5 2.0 1.6GHG emissions growth (mtCO2e) 4.2 -2.8 -9.0 2.9 2.7 3.1Energy related GHG emissions (% of total) 69.9 70.0 69.5 70.1 70.7 71.0Source: World Bank, Poverty & Equity and M acroeconomics, Trade & Investment Global Practices. Emissions data sourced from CAIT and OECD.Notes: e = estimate, f = forecast.NA(a) Calculations based on ECAPOV harmonization, using 2019-HLCS.Actual data: 2019. Nowcast: 2020. Forecast are from 2021 to 2023.(b) Pro jection using neutral distribution (2019) with pass-through = 0.87 based on GDP per capita in constant LCU.

Selected Country Pages ● 133
84 MPO Oct 21
Reforms are beginning to address struc-tural constraints such as absent factor markets and the state’s economic domi-nance. These reforms will create more room for competition and business growth and help create more jobs and incomes that help accelerate Uzbekistan’s market transition. Job and income displacement from COVID-19 has amplified the importance of inclu-sion. About 9 percent of citizens live below the World Bank’s lower-middle-income poverty line ($3.2 a day, PPP 2011 adjust-ed); many more live close to this line. The national poverty level (based on minimum food intake) increased to 11.5 percent in 2020 from 11 percent in 2019. Expanded social assistance has provided some relief to Uzbekistan’s affected households, as has the swift recovery in employment follow-ing the economy’s reopening. Uzbekistan’s rebounding economy will support a return to poverty reduction in 2021. Over the medium-term, in addition to growth, faster poverty reduction will require stronger safety nets, labor market condi-tions, and health and education services.
GDP growth increased to 6.2 percent in H1 2021 after slowing to 1.7 percent in
2020. Strong industrial and services growth tempered weaker agricultural production. Robust increases in household incomes and domestic investment, and the continuation of anti-crisis spending and tax relief measures, also contributed to this year’s strong growth. A decision to reduce gold export volumes led to a wider current account deficit of 10 percent of GDP in H1 2021 (from 7.3 per-cent in H1 2020). Exports of other goods, however, such as copper, textiles, fertiliz-ers, food, and machinery, recovered from weaker trading partner demand in 2020. Total exports increased by 12.3 percent year-on-year. Imports grew by 14.3 per-cent in H1 2021 due to higher private con-sumption and a rebound in demand for capital goods. This led to a wider trade balance deficit of 18.8 percent of GDP in H1 2021 from 16.2 percent in H1 2020. Sustained inflows of personal remittances (8.7 percent of GDP in H1 2021) helped offset the negative trade balance. The fiscal deficit was within budget at 5.4 percent of GDP in H1 2021. Lower policy-based lending and higher tax revenues from a rebounding economy offset higher budget spending on social support, health, and public infrastructure. Though the deficit was financed through an in-crease in public debt, robust nominal GDP growth contributed to a slightly lower ratio of public debt to GDP of 38.5 percent of GDP in 1H 2021, compared with 38.9 percent at end-2020. The Government remains on track with its 2021 debt ceiling of 5.5 billion. Official reserves reached $34.1 billion in July 2021, an increase of
1.8 billion compared with July 2020.
UZBEKISTAN
FIGURE 1 Uzbekistan / GDP growth, inflation, unemployment FIGURE 2 Uzbekistan / Poverty, GDP per capita, and small business development
Source: Uzbekistan official statistics. Source: Uzbekistan official statistics. Due to the lack of data access, the Bank cannot validate the official figures. Note: The national poverty line is based on a minimum food consumption norm of 2,100 calories per person per day that exclude non-food items.
Table 1 2020Population, million 34.2GDP, current US$ billion 59.9GDP per capita, current US$ 1 751 .5
School enro llment, primary (% gross)a 1 02.2
Life expectancy at birth, yearsa 71 .7Total GHG Emissions (mtCO2e) 237.4
Source: WDI, M acro Poverty Outlook, and off icial data.(a) M ost recent WDI value (201 9).
4.45.4 5.7
1.7
13.9
17.5
14.512.9
9.0 9.3 9.010.5
0
5
10
15
20
GDP growth CPI inflation Unemployment rate
Percent
63.4 60.454.2 53.91,917
1,5971,784 1,751
1,430
1,131 1,232 1,221
11.9 11.4 11.0 11.5
0
10
20
30
40
50
60
70
0
500
1,000
1,500
2,000
2,500
2017 2018 2019 2020Small business, % of GDPGDP per capita, US$, lhsTotal incomes of population per capita, US$, lhsNational poverty rate, % of population, rhs
PercentGDP per capita, US$

134 ● World Bank ECA Economic Update Fall 2021
85 MPO Oct 21
Inflation has continued to trend lower, reaching 11 percent in June 2021 (compared with 14.7 percent in June 2020), but remained in double digits due to high food prices. Given an uncertain inflation-ary outlook, the central bank has left its reference interest rate unchanged since September 2020 at 14 percent. Credit growth in June 2021 slowed to 24 percent from 34 percent in June 2020, and 52 per-cent in 2019. This reflected weaker de-mand from higher real lending rates and a reduction in government-subsidized lend-ing. The banking sector’s capital adequacy ratio fell to 17.4 percent in June 2021 from 18.5 percent in January 2021 and 20.8 per-cent in June 2020. This was partly due to a rise in nonperforming loans due to COVID-19, which increased to 4.6 percent in June 2021 from 2.2 percent in June 2020. Nevertheless, Uzbekistan’s financial sys-tem remains sufficiently capitalized to ab-sorb potential credit shocks. From August 1, 2021, to further reduce financial sector risks and dollarization, commercial banks will face increased reserve requirements
on foreign currency bank deposits in banks from 14 to 18 percent. Alongside a recovering economy, the unem-ployment rate declined to 10.2 percent in H1 2021 from 13.2 percent in H1 2020 and 10.5 percent at end-2020. The unemployment rate has not yet returned to pre-pandemic levels (of about 9 percent) and remains dis-proportionately high for women and youth.
Growth is projected to accelerate to 6.2 percent in 2021. However, this forecast remains subject to uncertainties about the continued impact of further COVID-19 waves on global and domestic economic conditions. A recovery of investment, trade, and remittances will support the economic growth and reduce unemploy-ment and poverty in 2021. Growth is pro-jected to remain strong at 5.6 percent in 2022 as the pace of vaccinations accelerates and global disruptions ease further. The
current account deficit is projected to be 5.9 percent of GDP in 2021 as capital imports for investment projects recover and as gold exports fall from record levels in 2020. For-eign direct investment is expected to re-main subdued in 2021 and partially recover in 2022. The continued expansion of social assistance and public investments to im-prove rural infrastructure, and vaccination costs, will continue to elevate public spend-ing in 2021. This will be partially offset by higher tax, mining, and privatization reve-nues, leading to a projected overall fiscal deficit of 5.5 percent of GDP in 2021. In-creased public debt will finance this deficit, and public debt is projected to reach 40.6 percent of GDP by end-2021. COVID-19 uncertainties and a forthcoming VAT rates reduction in 2023, are likely to contribute to a higher medium-term fiscal deficit. A ro-bust economic recovery, the gradual with-drawal of anti-crisis measures, and tax ad-ministration reforms to widen the tax base are projected to help consolidate public finances and stabilize debt at about 42 per-cent of GDP by end-2023.
TABLE 2 Uzbekistan / Macro poverty outlook indicators (annual percent change unless indicated otherwise)
2018 2019 2020 2021 e 2022 f 2023 fReal GDP growth, at constant market prices 5.4 5.7 1.7 6.2 5.6 5.8
Private Consumption 3.8 5.3 -1.2 4.1 5.3 5.5Government Consumption 3.8 5.7 2.0 9.5 5.7 3.7Gross Fixed Capital Investment 18.0 7.6 2.8 8.3 8.4 8.8Exports, Goods and Services 10.7 16.2 -20.0 10.4 17.4 15.5Imports, Goods and Services 26.8 19.5 -21.0 11.6 20.7 17.9
Real GDP growth, at constant factor prices 5.4 5.7 1.7 6.2 5.6 5.8Agriculture 0.3 3.1 3.0 1.9 2.9 3.1Industry 11.5 8.9 2.5 6.8 4.7 5.0Services 5.2 5.2 0.4 8.6 7.8 7.9
Inflation (Consumer Price Index) 17.5 14.5 12.9 10.9 10.5 8.5Current Account Balance (% of GDP) -7.1 -5.6 -5.0 -5.9 -5.3 -5.1Fiscal Balance (% of GDP) -2.1 -3.8 -4.3 -5.5 -4.4 -3.7Debt (% of GDP) 20.3 29.3 36.4 40.6 42.5 42.2Primary Balance (% of GDP) -1.7 -3.3 -3.8 -5.1 -4.0 -3.4GHG emissions growth (mtCO2e) 0.3 1.9 0.4 3.4 3.1 3.2Energy related GHG emissions (% of total) 46.6 46.4 45.8 46.7 47.6 48.6Source: World Bank, Poverty & Equity and M acroeconomics, Trade & Investment Global Practices. Emissions data sourced from CAIT and OECD.Notes: e = estimate, f = forecast.NA

This work is available under the Creative Commons Attribution 3.0 IGO license (CC BY 3.0 IGO) http://creativecommons.org/licenses/by/3.0/igo.
WORLD BANK ECA ECONOMIC UPDATE Fall 2021
Competition and Firm Recovery Post-COVID-19Although global economic activity is recovering and output in Europe and Central Asia (ECA) is expected to grow in 2021, containing COVID-19 remains a challenge in the region. Enterprise Surveys data for the emerging and developing countries in the region show that COVID-19 had a profound and heterogeneous impact on �rms. Smaller and younger businesses were hit harder and smaller, younger, and female-run businesses had greater di�culty recovering. But the crisis also played a cleansing role and economic activity in ECA appears to have been reallocated toward more productive �rms during the crisis, particularly in countries with more competitive markets. Firms with high pre-crisis labor productivity experienced signi�cantly smaller drops in sales and employment than �rms with low pre-crisis labor productivity and were also more likely to adapt to the crisis by increasing online activity and remote work.
Many governments in ECA implemented broad policy support schemes to address the initial economic fallout from the crisis. Overall, this government support was more likely to go to less productive and larger �rms, regardless of the level of their pre-crisis innovation. As economies enter the economic recovery phase, it will be important for policy makers in all countries to phase out broad policy support measures as soon as appropriate and focus on fostering a competitive business environment, which is key to a strong recovery, resilience to future crises, and sustainable, long-term economic growth.
ISBN (electronic): 978-1-4648-1802-8
© 2021 International Bank for Reconstruction and Development / The World BankSome rights reserved
1818 H Street NW, Washington, DC 20433Telephone: 202-473-1000Internet: www.worldbank.org


