89
Competition and New Entry An Analysis of Canada’s Communications Services Market Prepared for: TELUS Prepared by: Nordicity February 2011
Competition and New Entry An Analysis of Canada’s Communications Services Market
Prepared for:
TELUS
Prepared by:
Nordicity
February 2011
Competition and New Entry in Canada’s Communications Services Market 2 of 89
Table of contents
Executive Summary and Conclusions 4
1. Introduction 18
1.1 Background: Canada’s wireless sector and spectrum auctions 18
1.2 Methodology 20
2. Competition in Canada’s Communications Services Industry 23
2.1 Availability of competing facilities-based services 23
2.2 Revenue and growth 25
2.3 Service fees 28
2.4 Revenue share by distribution technology 33
2.5 Conclusions 35
3. Competition in Canada’s Wireless Sector 37
3.1 Market structure 37
3.2 Competition for new subscribers 40
3.3 Regional competition 46
3.4 Conclusions 50
4. Comparison of International Wireless Sectors 51
4.1 ARPM 53
4.2 ARPkm2 54
4.3 Fees 55
4.4 Market structure 58
4.5 Conclusions 63
5. Communications Incumbents and 2008 New Entrants 65
5.1 Integrated cable-based communications services incumbents 65
5.2 Regional wireless incumbents 75
5.3 2008 pure-play new entrants 79
5.4 Conclusions 84
6. Conclusions 86

Competition and New Entry in Canada’s Communications Services Market 3 of 89
Competition and New Entry in Canada’s Communications Services Market 4 of 89
Executive Summary and Conclusions
Canada‟s communications services market is increasingly driven by the competition between
integrated communications services providers for subscribers across four communications
services sectors – wireless, subscription TV, Internet and home phone. While Canadian homes
were once served by multiple carriers (i.e. one for home phone and another for subscription
television), they are increasingly receiving multiple bundled services from one provider. In fact,
between 2006 and 2009, the number of Canadian communications subscribers receiving two or
more services from their local phone company increased from 15% to 34%.1 Cable companies
have enjoyed even greater success in bundling subscribers – more than 50% of Shaw‟s cable
subscribers now also receive Shaw‟s home phone service;2 and 72% of Videotron‟s subscribers
receive two or more Videotron services.3
Canada‟s wireless sector is a segment of Canada‟s broader communications services market and
needs to be examined as such. While examining Canada‟s wireless sector overall, and compared
with other developed international wireless markets, is instructive and relevant, an analysis of
Canada‟s wireless sector and its competitors must ultimately return to the reality of the
integrated communications service competition that exists in Canada. Such analysis reveals an
industry with substantial wireless competition as well a number of competitors poised to exploit
their financial and service strength to take advantage of opportunities in Canada‟s wireless
market.
Communications services competition
Communications services competition is no longer contained within specific sector silos. Two
competitors don‟t battle for home phone subscribers, Internet providers and TV providers,
respectively. Rather, they pit collective bundle against bundle to capture full communications
services subscribers to the greatest extent possible. This integrated communications services
competition, however, is greatly impacted by the level of competition within each particular
sector.
Across almost all competitive indices, wireless is the most competitive communications service
sector in Canada. The average Canadian has more choice in wireless services than for any other
communications service, which has resulted in declining wireless rates over the past four years.
As Figure 1 below illustrates, wireless voice ARPU (average revenue per user) last increased in
1 Source: CRTC, Communications Monitoring Report, 2010.
2 Source: TD Newcrest, January 2011.
3 Source:
http://www.quebecor.com/Gallery/Quebecor%20Presentation%20to%20CIBC%20Conference%20Septemb
er%202010.pdf (pp.13) .
Competition and New Entry in Canada’s Communications Services Market 5 of 89
2007 and declined by nearly 10% in 2009. Blended (voice and data) wireless ARPU last posted a
year-over-year increase in 2008. Industry-wide wireless voice ARPU has also not increased at a
rate greater than the Consumer Price Index (CPI) since 2007.
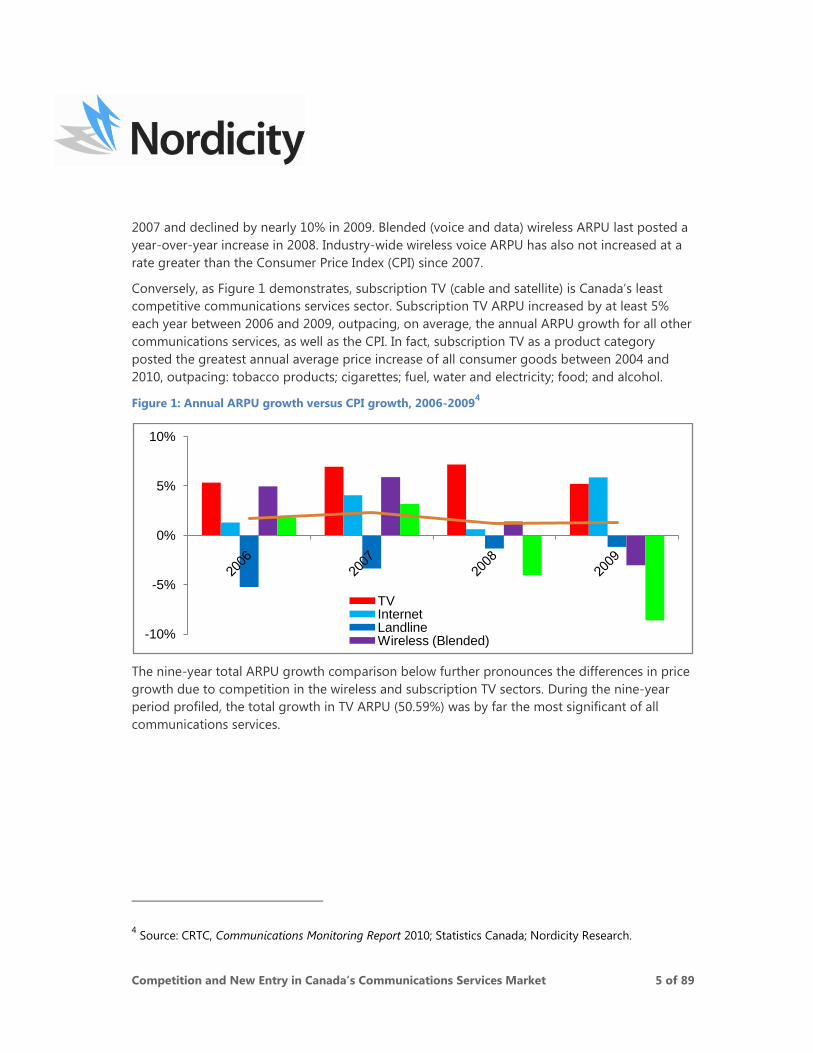
Conversely, as Figure 1 demonstrates, subscription TV (cable and satellite) is Canada‟s least
competitive communications services sector. Subscription TV ARPU increased by at least 5%
each year between 2006 and 2009, outpacing, on average, the annual ARPU growth for all other
communications services, as well as the CPI. In fact, subscription TV as a product category
posted the greatest annual average price increase of all consumer goods between 2004 and
2010, outpacing: tobacco products; cigarettes; fuel, water and electricity; food; and alcohol.
Figure 1: Annual ARPU growth versus CPI growth, 2006-20094
The nine-year total ARPU growth comparison below further pronounces the differences in price
growth due to competition in the wireless and subscription TV sectors. During the nine-year
period profiled, the total growth in TV ARPU (50.59%) was by far the most significant of all
communications services.
4 Source: CRTC, Communications Monitoring Report 2010; Statistics Canada; Nordicity Research.
-10%
-5%
0%
5%
10%
TVInternet Landline Wireless (Blended)
Competition and New Entry in Canada’s Communications Services Market 6 of 89
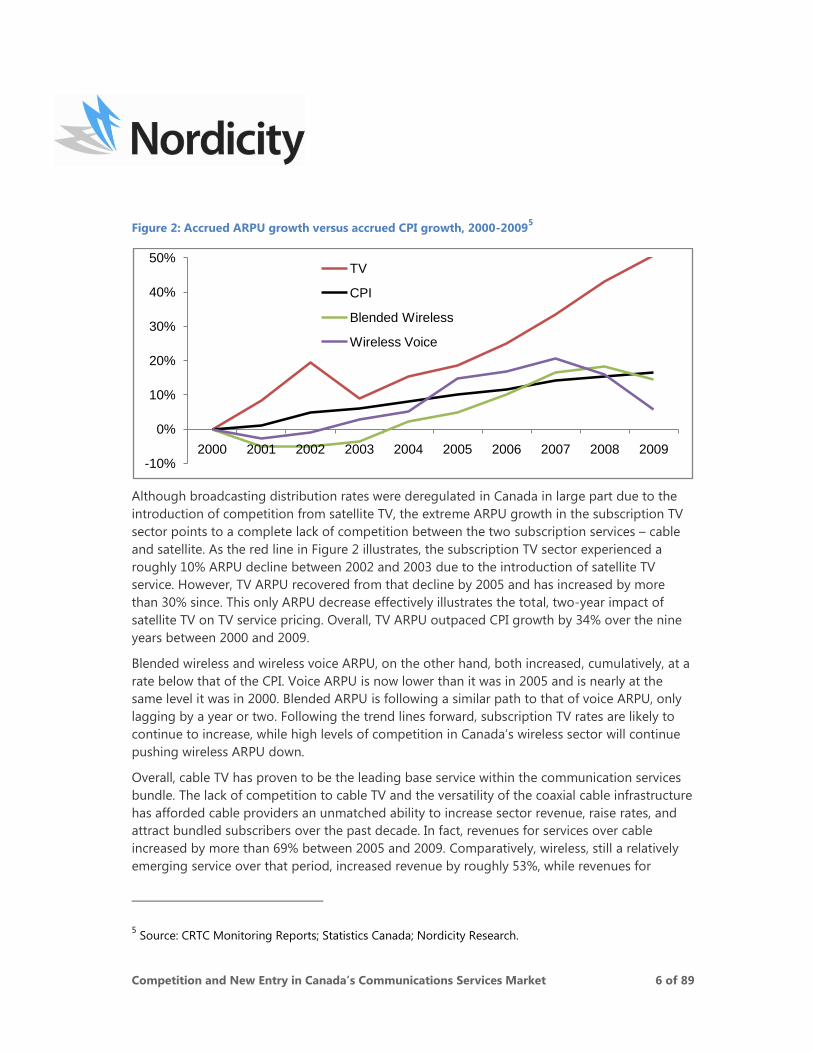
Figure 2: Accrued ARPU growth versus accrued CPI growth, 2000-20095
Although broadcasting distribution rates were deregulated in Canada in large part due to the
introduction of competition from satellite TV, the extreme ARPU growth in the subscription TV
sector points to a complete lack of competition between the two subscription services – cable
and satellite. As the red line in Figure 2 illustrates, the subscription TV sector experienced a
roughly 10% ARPU decline between 2002 and 2003 due to the introduction of satellite TV
service. However, TV ARPU recovered from that decline by 2005 and has increased by more
than 30% since. This only ARPU decrease effectively illustrates the total, two-year impact of
satellite TV on TV service pricing. Overall, TV ARPU outpaced CPI growth by 34% over the nine
years between 2000 and 2009.
Blended wireless and wireless voice ARPU, on the other hand, both increased, cumulatively, at a
rate below that of the CPI. Voice ARPU is now lower than it was in 2005 and is nearly at the
same level it was in 2000. Blended ARPU is following a similar path to that of voice ARPU, only
lagging by a year or two. Following the trend lines forward, subscription TV rates are likely to
continue to increase, while high levels of competition in Canada‟s wireless sector will continue
pushing wireless ARPU down.
Overall, cable TV has proven to be the leading base service within the communication services
bundle. The lack of competition to cable TV and the versatility of the coaxial cable infrastructure
has afforded cable providers an unmatched ability to increase sector revenue, raise rates, and
attract bundled subscribers over the past decade. In fact, revenues for services over cable
increased by more than 69% between 2005 and 2009. Comparatively, wireless, still a relatively
emerging service over that period, increased revenue by roughly 53%, while revenues for
5 Source: CRTC Monitoring Reports; Statistics Canada; Nordicity Research.
-10%
0%
10%
20%
30%
40%
50%
2000 2001 2002 2003 2004 2005 2006 2007 2008 2009
TV
CPI
Blended Wireless
Wireless Voice
Competition and New Entry in Canada’s Communications Services Market 7 of 89
services delivered over the telecommunications service provider infrastructure (twisted copper
pair network) declined by 5.19%.
Conclusion: Canada’s wireless sector is as competitive, if not more competitive than
any other Canadian communications services sector, particularly so relative to
the subscription TV sector.
Wireless competition
The number of Canadian wireless subscribers has increased by more than seven million during
the past five years, and competition for those subscribers has been fierce. Historically, wireless
competition has been dominated by the five wireless providers that have offered service for
more than a decade – TELUS, Bell, Rogers, SaskTel, and MTS. During the past two years,
however, an additional four wireless carriers – Wind Mobile, Videotron, Public Mobile and
Mobilicity – have launched and it is anticipated that two more – EastLink and Shaw – will launch
service within the next year. Whether examined in terms of the five historical wireless
competitors, or with regards to current and future competition from the 2008 AWS entrants,
Canada‟s wireless sector has significant competition at the national and regional levels.
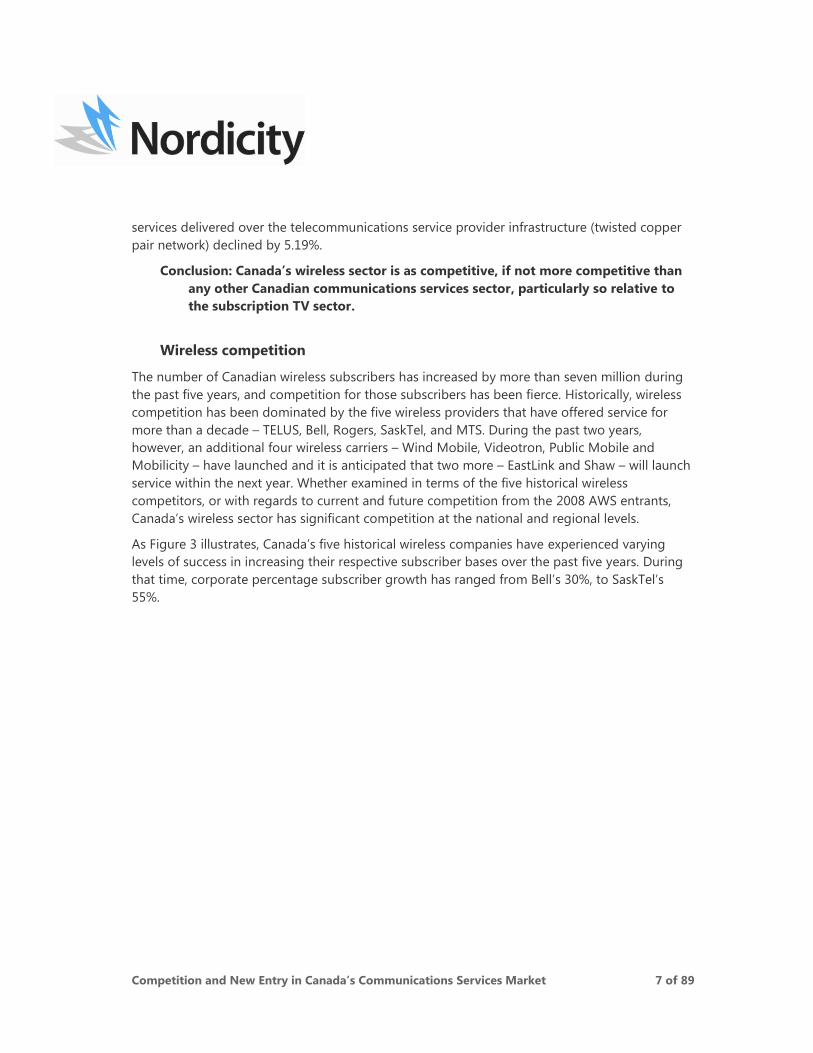
As Figure 3 illustrates, Canada‟s five historical wireless companies have experienced varying
levels of success in increasing their respective subscriber bases over the past five years. During
that time, corporate percentage subscriber growth has ranged from Bell‟s 30%, to SaskTel‟s
55%.
Competition and New Entry in Canada’s Communications Services Market 8 of 89
Figure 3: Wireless accrued subscriber growth (%) by provider, 2005-20106
The increase in wireless competition is similarly pronounced over the past decade. TELUS‟
emergence as a third national carrier over the past 10 years has decreased the gap between the
percentage of subscribers held by the leading and third-largest providers from nearly 15% to
8.9%. As well, a snapshot of the percentage of net subscriber additions captured by the three
national wireless carriers over the past three years shows a very competitive market share
disbursement of 33.2% for TELUS, 29.4% for Rogers and 22.4% for Bell. Regional wireless
competition has similarly increased during the last half decade.
6 Source: Annual Reports. SaskTel 2010 figure is estimated.
0%
10%
20%
30%
40%
50%
60%
2005 2006 2007 2008 2009 2010
Bell Rogers Telus SaskTel MTS
Competition and New Entry in Canada’s Communications Services Market 9 of 89
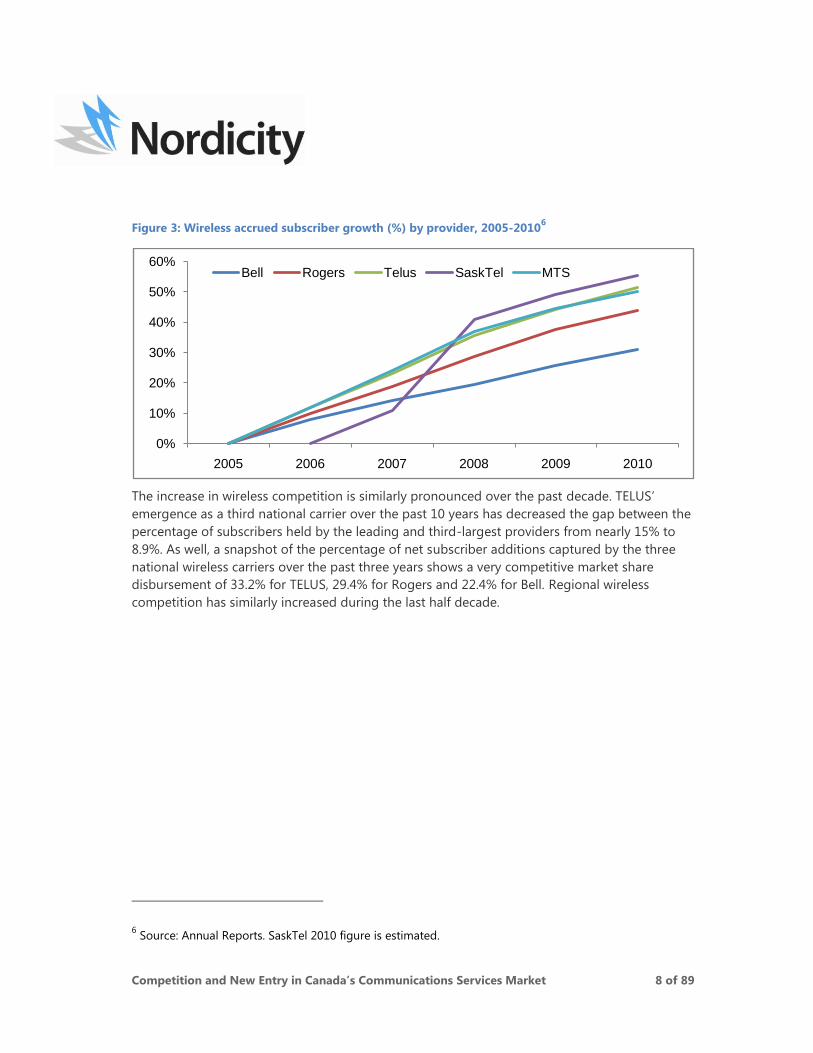
Figure 4: Gap between subscriber shares (%) of leading and third-largest wireless carriers, 2004-
20097
Specifically, the gaps in percentage subscriber share between the leading and third-largest
carrier decreased by 18% in BC/Alberta, 18% in Quebec and 27% in the Maritime provinces
between 2004 and 2009 (Figure 4 above). In Ontario, which was already the most competitive
market, that gap increased by 2%, yet remained a competitive 27%. However, competition has
remained relatively stagnant in three provinces – Saskatchewan, Manitoba and Newfoundland –
where the gap between the first and third carriers has only decreased between 8% and 10%
over the past five years.
The entry of new wireless carriers through the 2008 AWS auction has already added to sector
competition. An average of 6.6 companies per province now hold spectrum and an average of
4.2 companies per province have launched service. These 2008 entrants (companies that first
acquired wireless spectrum in 2008) are already realizing major subscriber gains. As Figure 5
illustrates, the 2008 entrants captured an estimated 23.2% of net subscriber additions for the
full year 2010. In fact, forward-looking projections predict that 2010 will be the last year that
any of the national wireless captures more net subscriber additions than the 2008 entrants
combined.
7 Source: CRTC Monitoring Reports.
10%
20%
30%
40%
50%
60%
70%
80%
90%
2004 2005 2006 2007 2008 2009
BC/AB SK MN ON QC Maritimes NF
Competition and New Entry in Canada’s Communications Services Market 10 of 89
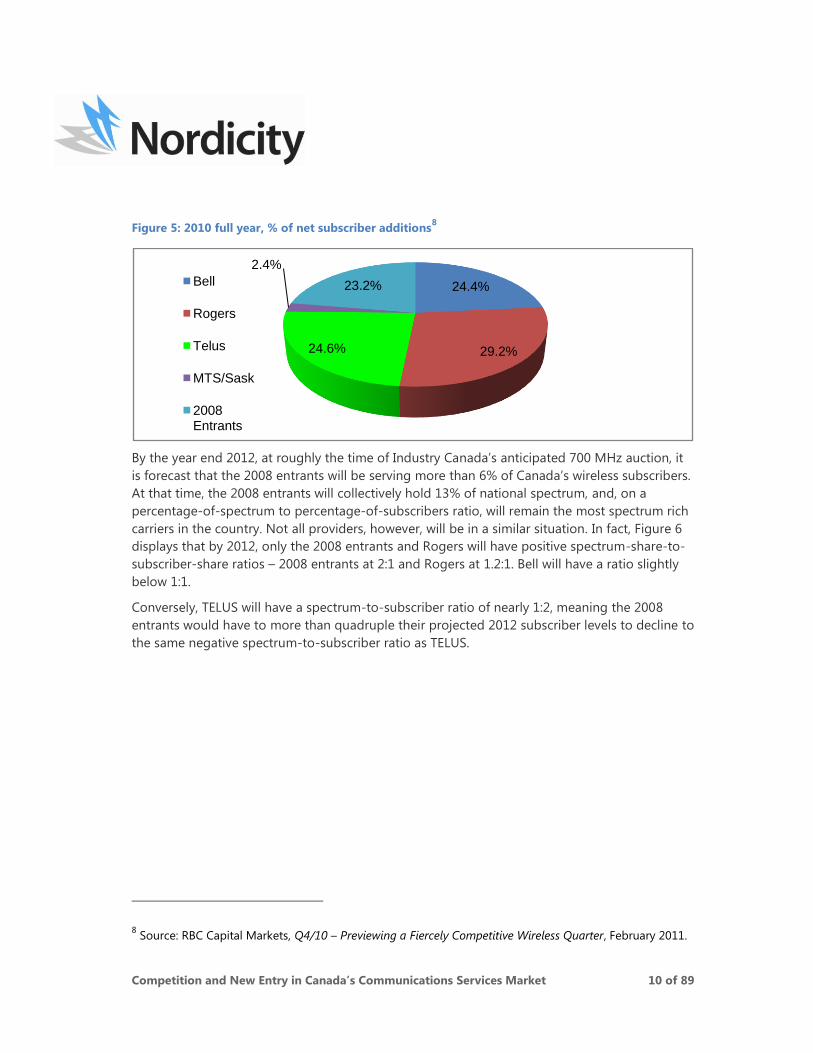
Figure 5: 2010 full year, % of net subscriber additions8
By the year end 2012, at roughly the time of Industry Canada‟s anticipated 700 MHz auction, it
is forecast that the 2008 entrants will be serving more than 6% of Canada‟s wireless subscribers.
At that time, the 2008 entrants will collectively hold 13% of national spectrum, and, on a
percentage-of-spectrum to percentage-of-subscribers ratio, will remain the most spectrum rich
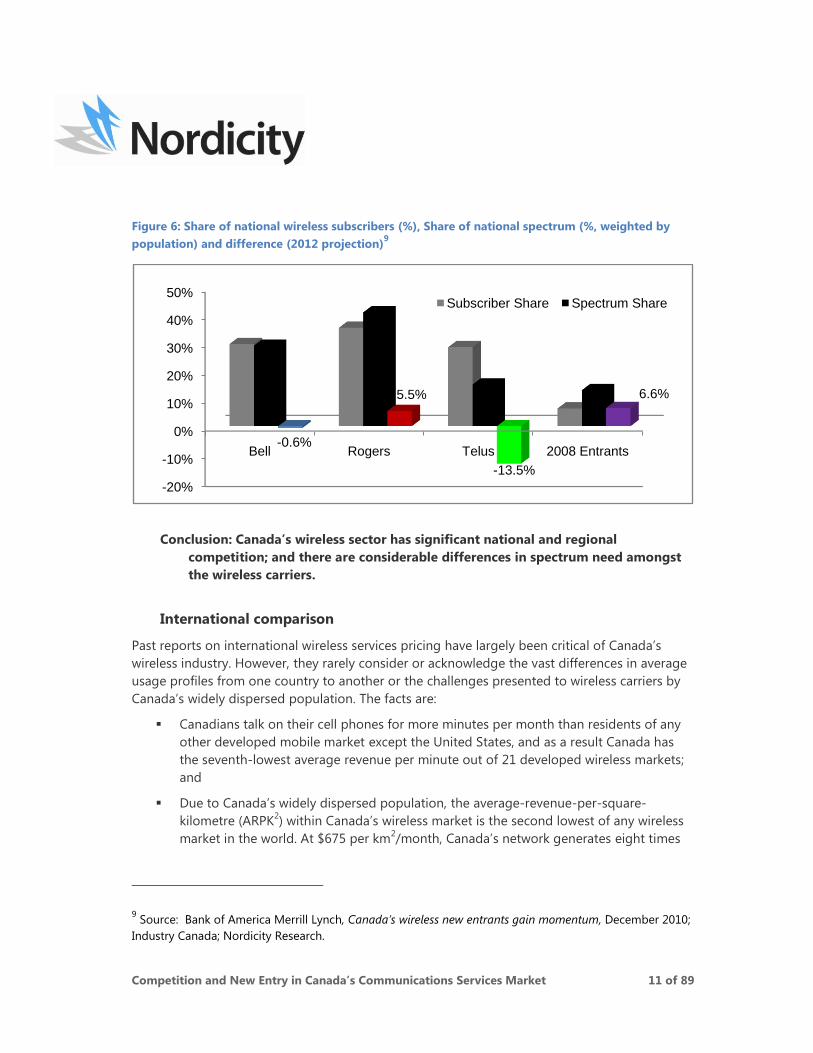
carriers in the country. Not all providers, however, will be in a similar situation. In fact, Figure 6
displays that by 2012, only the 2008 entrants and Rogers will have positive spectrum-share-to-
subscriber-share ratios – 2008 entrants at 2:1 and Rogers at 1.2:1. Bell will have a ratio slightly
below 1:1.
Conversely, TELUS will have a spectrum-to-subscriber ratio of nearly 1:2, meaning the 2008
entrants would have to more than quadruple their projected 2012 subscriber levels to decline to
the same negative spectrum-to-subscriber ratio as TELUS.
8 Source: RBC Capital Markets, Q4/10 – Previewing a Fiercely Competitive Wireless Quarter, February 2011.
24.4%
29.2%24.6%
2.4%
23.2%Bell
Rogers
Telus
MTS/Sask
2008 Entrants
Competition and New Entry in Canada’s Communications Services Market 11 of 89
Figure 6: Share of national wireless subscribers (%), Share of national spectrum (%, weighted by
population) and difference (2012 projection)9
Conclusion: Canada’s wireless sector has significant national and regional
competition; and there are considerable differences in spectrum need amongst
the wireless carriers.
International comparison
Past reports on international wireless services pricing have largely been critical of Canada‟s
wireless industry. However, they rarely consider or acknowledge the vast differences in average
usage profiles from one country to another or the challenges presented to wireless carriers by
Canada‟s widely dispersed population. The facts are:
Canadians talk on their cell phones for more minutes per month than residents of any
other developed mobile market except the United States, and as a result Canada has
the seventh-lowest average revenue per minute out of 21 developed wireless markets;
and
Due to Canada‟s widely dispersed population, the average-revenue-per-square-
kilometre (ARPK2) within Canada‟s wireless market is the second lowest of any wireless
market in the world. At $675 per km2/month, Canada‟s network generates eight times
9 Source: Bank of America Merrill Lynch, Canada’s wireless new entrants gain momentum, December 2010;
Industry Canada; Nordicity Research.
-20%
-10%
0%
10%
20%
30%
40%
50%
Bell Rogers Telus 2008 Entrants-0.6%
5.5%
-13.5%
6.6%
Subscriber Share Spectrum Share
Competition and New Entry in Canada’s Communications Services Market 12 of 89
less than the global average and 25 times less than that of the Netherlands – the
leading country.
Even without the above considerations, Canada‟s wireless market compares favorably with other
jurisdictions. For example, based on the methodology used by UK consultancy Teligen, Strategy
Analytics Ltd. for comparing international wireless prices, Canada ranks as the 13th
lowest out of
19 developed markets for a calling profile of 100 monthly calls – roughly 188 minutes of use –
and eighth-lowest out of 19 markets for a calling profile of 300 monthly calls – roughly 589
minutes of use.
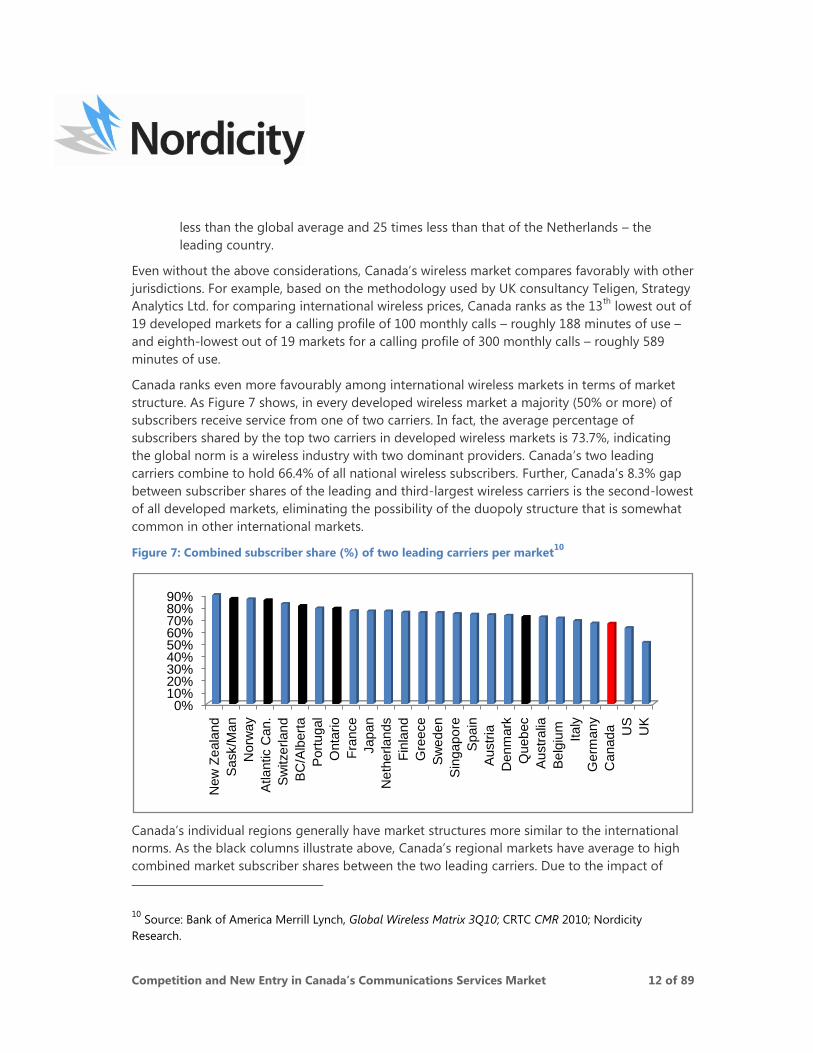
Canada ranks even more favourably among international wireless markets in terms of market
structure. As Figure 7 shows, in every developed wireless market a majority (50% or more) of
subscribers receive service from one of two carriers. In fact, the average percentage of
subscribers shared by the top two carriers in developed wireless markets is 73.7%, indicating
the global norm is a wireless industry with two dominant providers. Canada‟s two leading
carriers combine to hold 66.4% of all national wireless subscribers. Further, Canada‟s 8.3% gap
between subscriber shares of the leading and third-largest wireless carriers is the second-lowest
of all developed markets, eliminating the possibility of the duopoly structure that is somewhat
common in other international markets.
Figure 7: Combined subscriber share (%) of two leading carriers per market10
Canada‟s individual regions generally have market structures more similar to the international
norms. As the black columns illustrate above, Canada‟s regional markets have average to high
combined market subscriber shares between the two leading carriers. Due to the impact of
10
Source: Bank of America Merrill Lynch, Global Wireless Matrix 3Q10; CRTC CMR 2010; Nordicity
Research.
0%10%20%30%40%50%60%70%80%90%
New
Zeala
nd
Sask/M
an
Norw
ay
Atlantic C
an.
Sw
itzerlan
d
BC
/Alb
ert
a
Port
ugal
Onta
rio
Fra
nce
Japan
Neth
erlands
Fin
land
Gre
ece
Sw
eden
Sin
gapo
re
Spain
Austr
ia
Denm
ark
Quebec
Austr
alia
Belg
ium
Italy
Germ
any
Canada
US
UK
Competition and New Entry in Canada’s Communications Services Market 13 of 89
other regional communications services and consumer preferences for bundling, market
structures are naturally somewhat less competitive on a regional basis. However, even the
leading two carriers in Canada‟s least competitive regions – Saskatchewan and Manitoba, and
Atlantic Canada – have lower combined market shares than some entire countries.
Canada‟s natural market structure of three strong competitors is further confirmed by the fact
that most global wireless markets struggle to support more than four significant national
competitors profitably. Based on international trends, it is highly unlikely Canada‟s market will
be able to support the five to six competitors per province that will be operational in 2012.
Recognizing this fact, many of Canada‟s 2008 entrants have already openly speculated about
likely consolidation of spectrum assets and subscribers. Such consolidation would bring
Canada‟s wireless market structure even more in line with international norms.
Conclusion: Although Canadian cell phone usage patterns and the potential
economic return from Canada’s wireless network differ greatly with most
international jurisdictions, Canada’s wireless fees and market structure are
comparable to other developed wireless sectors around the world.
Communications services incumbents and 2008 new entrants
Six companies entered – or are poised to enter – Canada‟s wireless sector using spectrum
acquired during the 2008 AWS auction – Videotron, Wind Mobile, Mobilicity, Public Mobile,
EastLink and Shaw. Two additional companies that have each been offering wireless service for
more than two decades – SaskTel and MTS – also acquired „set-aside‟ AWS spectrum in 2008.
Each of these eight companies possess varying degrees of advantage or motivations to
compete openly in Canada‟s wireless sector.
The majority of Canada‟s more than $48 billion communications services revenue is captured by
nine incumbent integrated communications companies. 11
With the exception of TELUS, Rogers
and Bell‟s national wireless services, the leading communications companies largely provide
services in specific regions, or contestable markets. These leading integrated communications
incumbents enjoy relatively similar success in capturing revenue share within their contestable
markets (Figure 8).
11
EastLink data on contestable market share not relevantly calculable due to the nature of its presence in
markets across the country.
Competition and New Entry in Canada’s Communications Services Market 14 of 89
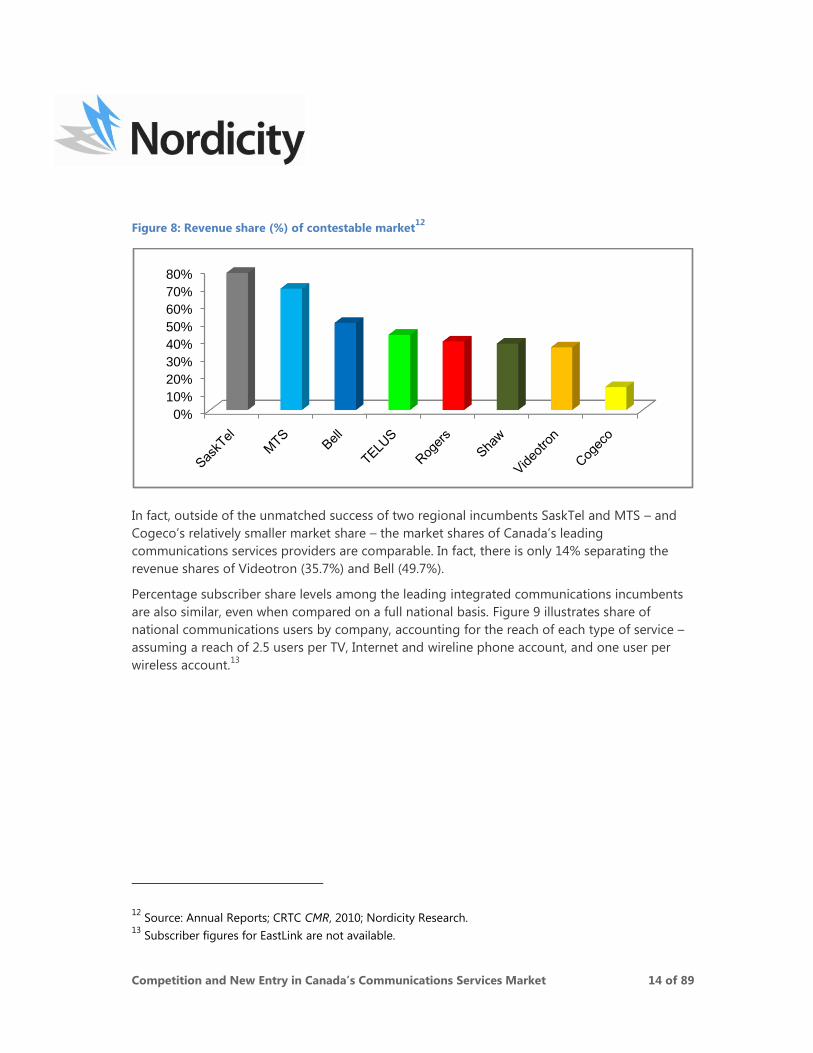
Figure 8: Revenue share (%) of contestable market12
In fact, outside of the unmatched success of two regional incumbents SaskTel and MTS – and
Cogeco‟s relatively smaller market share – the market shares of Canada‟s leading
communications services providers are comparable. In fact, there is only 14% separating the
revenue shares of Videotron (35.7%) and Bell (49.7%).
Percentage subscriber share levels among the leading integrated communications incumbents
are also similar, even when compared on a full national basis. Figure 9 illustrates share of
national communications users by company, accounting for the reach of each type of service –
assuming a reach of 2.5 users per TV, Internet and wireline phone account, and one user per
wireless account.13
12
Source: Annual Reports; CRTC CMR, 2010; Nordicity Research. 13
Subscriber figures for EastLink are not available.
0%
10%
20%
30%
40%
50%
60%
70%
80%
Competition and New Entry in Canada’s Communications Services Market 15 of 89
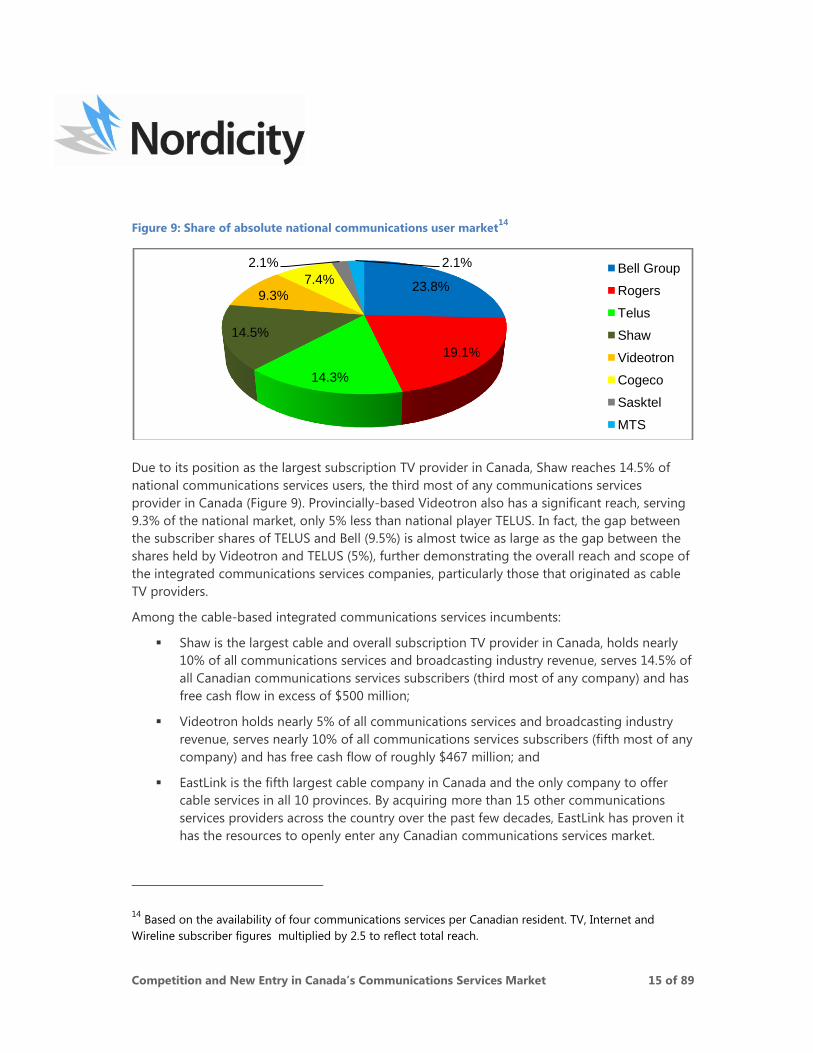
Figure 9: Share of absolute national communications user market14
Due to its position as the largest subscription TV provider in Canada, Shaw reaches 14.5% of
national communications services users, the third most of any communications services
provider in Canada (Figure 9). Provincially-based Videotron also has a significant reach, serving
9.3% of the national market, only 5% less than national player TELUS. In fact, the gap between
the subscriber shares of TELUS and Bell (9.5%) is almost twice as large as the gap between the
shares held by Videotron and TELUS (5%), further demonstrating the overall reach and scope of
the integrated communications services companies, particularly those that originated as cable
TV providers.
Among the cable-based integrated communications services incumbents:
Shaw is the largest cable and overall subscription TV provider in Canada, holds nearly
10% of all communications services and broadcasting industry revenue, serves 14.5% of
all Canadian communications services subscribers (third most of any company) and has
free cash flow in excess of $500 million;
Videotron holds nearly 5% of all communications services and broadcasting industry
revenue, serves nearly 10% of all communications services subscribers (fifth most of any
company) and has free cash flow of roughly $467 million; and
EastLink is the fifth largest cable company in Canada and the only company to offer
cable services in all 10 provinces. By acquiring more than 15 other communications
services providers across the country over the past few decades, EastLink has proven it
has the resources to openly enter any Canadian communications services market.
14
Based on the availability of four communications services per Canadian resident. TV, Internet and
Wireline subscriber figures multiplied by 2.5 to reflect total reach.
23.8%
19.1%
14.3%
14.5%
9.3%
7.4%
2.1% 2.1% Bell Group
Rogers
Telus
Shaw
Videotron
Cogeco
Sasktel
MTS
Competition and New Entry in Canada’s Communications Services Market 16 of 89
Canada‟s regional wireless incumbents – SaskTel and MTS – posses similar size and scope to the
cable-based incumbents, particularly within their own region. As mentioned earlier in this
section, Saskatchewan and Manitoba are two of the three least competitive wireless markets in
Canada. SaskTel and MTS have been able to successfully leverage their more than 100-year
serving histories to build provincial wireless subscriber shares of 76% and 55%, respectively,
over the past 20 years. Advantaged by the 2008 AWS auction framework as „new entrants,‟
neither carrier increased competitiveness in the national market by acquiring spectrum outside
of its incumbent territory. Rather the companies invested a combined $105 million to secure
additional spectrum covering their respective provinces.
Finally, three companies effectively entered Canada‟s facilities-based communications market
through spectrum acquired in the 2008 AWS auction – Wind Mobile, 15
Mobility and Public
Mobile. Since launching within the past two years, these three new entrants have captured
nearly 400,000 wireless subscribers. Combined, the new entrants offer services in the major
metropolitan areas in BC, Alberta, Ontario and Quebec, taking advantage of the country‟s
highest population densities to acquire early subscribers. In terms of future growth, the three
new entrants hold spectrum covering all of Canada‟s major cities.
Each of the three 2008 new entrants appears well-backed financially, receiving some level of
financing from at least one foreign firm, including multiple private equity funds indicated in the
Figure 10. Specifically, Public Mobile and Mobilicity are backed by private equity firms that
follow mandates based on clear return and exit strategies, including entering markets with
favourable conditions for investment and exiting via sale, merger or IPO.
Globalive‟s Wind Mobile is part owned by Orascom of Egypt, which holds roughly 99% of
Wind‟s debt, 65.4 % of the outstanding equity of Globalive and has 33.2% of the voting rights.
Orascom is an international wireless giant, with operations in the Middle East, Africa and Asia,
and 103 million subscribers worldwide. Confident in its deep pockets, Wind has led the
speculation about consolidation among the new entrants. In August 2010, Orascom chairman
Naguib Sawiris noted: “They [the other new entrants] will be dead on arrival. Wind should be
the consolidator of all the smaller players here,”16
– further demonstrating the financial ability of
the new entrants to openly compete in Canada‟s communication services industry.
15
Wind Mobile is not technically a new entrant in Canada‟s communications services industry as its
owner, Globalive, is a competitive telecommunications carrier and long-distance provider. However, the
scope of Globalive‟s existing services and the nature of Wind‟s ownership structure are more comparable
to those of the other new entrants than the integrated cable-based incumbents or the regional wireless
incumbents. 16
Source: http://www.theglobeandmail.com/report-on-business/canada-is-a-telecom-backwater-says-
bold-backer-of-wind-mobile/article1690690/page2/
Competition and New Entry in Canada’s Communications Services Market 17 of 89
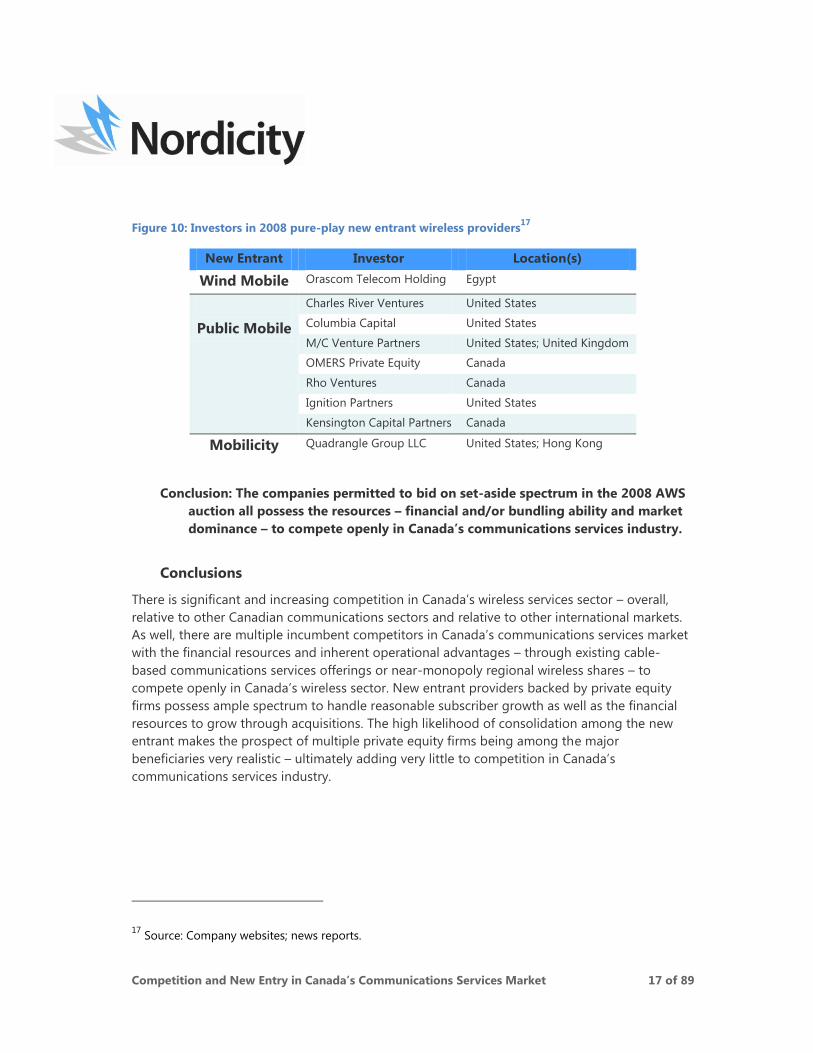
Figure 10: Investors in 2008 pure-play new entrant wireless providers17
New Entrant Investor Location(s)
Wind Mobile Orascom Telecom Holding Egypt
Public Mobile
Charles River Ventures United States
Columbia Capital United States
M/C Venture Partners United States; United Kingdom
OMERS Private Equity Canada
Rho Ventures Canada
Ignition Partners United States
Kensington Capital Partners Canada
Mobilicity Quadrangle Group LLC United States; Hong Kong
Conclusion: The companies permitted to bid on set-aside spectrum in the 2008 AWS
auction all possess the resources – financial and/or bundling ability and market
dominance – to compete openly in Canada’s communications services industry.
Conclusions
There is significant and increasing competition in Canada‟s wireless services sector – overall,
relative to other Canadian communications sectors and relative to other international markets.
As well, there are multiple incumbent competitors in Canada‟s communications services market
with the financial resources and inherent operational advantages – through existing cable-
based communications services offerings or near-monopoly regional wireless shares – to
compete openly in Canada‟s wireless sector. New entrant providers backed by private equity
firms possess ample spectrum to handle reasonable subscriber growth as well as the financial
resources to grow through acquisitions. The high likelihood of consolidation among the new
entrant makes the prospect of multiple private equity firms being among the major
beneficiaries very realistic – ultimately adding very little to competition in Canada‟s
communications services industry.
17
Source: Company websites; news reports.
Competition and New Entry in Canada’s Communications Services Market 18 of 89
1. Introduction
1.1 Background: Canada’s wireless sector and spectrum auctions
Competition in Canada‟s wireless services sector is subject to more scrutiny than that in any
other segment of Canada‟s communications services industry. Reports on international wireless
services pricing, like those released annually by the OECD, are often critical of Canada‟s wireless
industry and provide annual ammunition for consumer groups and other agencies seeking to
influence industry regulators.
International price comparisons of wireless consumer prices, however, are tenuous. The
methodologies used in these studies to arrive at „average‟ price levels don‟t account for the
difference in usage profiles from one country to another. Relatively speaking, Canadian
consumers tend to have very high minutes per month usage levels, and therefore appear to pay
higher than average prices in these comparisons. International comparisons additionally do not
account for the geographic challenges in a country like Canada. The fact is, a network the size
of Canada‟s national wireless infrastructure deployed in the contiguous United States18
would
reach more than twice the potential number of wireless services users based on average
population density: nearly 73 million versus 34 million covered in Canada. In light of these
circumstances Industry Canada itself has noted that in the communications services industry,
“international comparisons should be treated with caution.”19
In 2007, in response to the need for new spectrum to meet burgeoning demand for broadband
services, Industry Canada announced the timing and framework in its 2008 Advanced Wireless
Services (AWS) spectrum auction to help stimulate new entry into the wireless market.
Specifically:
“A set-aside was used in the 2008 AWS auction where only new entrants, defined as
participants holding less than 10% of the national wireless market, were permitted to bid
on three (3) of the available eight (8) blocks of spectrum.”20
Industry Canada provided the following rationale for implementing the framework:
“In reaching a decision on the auction policy framework, consideration was given to the
comments received, the spectrum involved in the auction, the current state of the
Canadian wireless market and the broader telecommunications market in which
18
The United States excluding Alaska, Hawaii and all offshore US territories. 19
Source: Industry Canada, Improving Canada’s Digital Advantage: Strategies for Sustainable Prosperity,
Consultation Paper on a Digital Economy Strategy for Canada, 2010, page 16. 20
Source: Industry Canada, Consultation on a Policy and Technical Framework for the 700 MHz Band and
Aspects Related to Commercial Mobile Spectrum, November 2010, page 41.
Competition and New Entry in Canada’s Communications Services Market 19 of 89
wireless is an increasingly important segment. The Department considered levels of
competition and industry structure, barriers to entry, and the applicable legislation
including the Radiocommunication Act, the Telecommunications Act and the
Competition Act as they apply to the largely deregulated wireless market.”21
However, prior to 2007, the Competition Bureau had examined the level of competition in
Canada‟s wireless sector and, like the CRTC, determined that levels of competition were
adequate. Specifically, when reviewing the acquisition of Microcell by Rogers in 2005, the
Competition Bureau noted:
“there would continue to be vigorous and effective competition remaining following
the merger….This finding is consistent with several decisions involving forbearance from
regulation in the mobile wireless market in Canada by the CRTC where it determined
that these markets are competitive. For example, in Telecom Decision CRTC 98-4, it
found that:
"the wireless services market has grown considerably during the past ten years,
that it is dynamic and competitive (and becoming more competitive as new
competing services such as PCS and ESMR are being rolled out), that there is
significant rivalry among competitors as demonstrated by the media
advertising blitzes and price rivalry, and that consumers are aware of alternate
wireless service providers."
“The Bureau found that the competitive history of Bell, TELUS and Rogers in the mobile
telecommunications market also supported this conclusion.”22
Since that review, wireless competition in Canada has increased. Canada‟s three largest wireless
carriers continue to aggressively battle for new subscribers, on both a national and regional
basis. The dominant regional wireless carriers, MTS and SaskTel, have increased their subscriber
levels by roughly 50% each since 2005.23
Four new wireless service providers have launched
using spectrum acquired in the 2008 AWS auction (Wind Mobile, Videotron, Mobilicity and
Public Mobile) and two more new entrants (Shaw and EastLink) are expected to launch wireless
service within their cable footprints soon.
21
Source: Industry Canada, Policy Framework for the Auction for Spectrum Licences for Advanced Wireless
Services and other Spectrum in the 2 GHz Range, November 2007, page 1. 22
Source: Competition Bureau Canada, Acquisition of Microcell Telecommunications Inc. by Rogers Wireless
Communications Inc.: Technical Backgrounder, April 2005. 23
Source: CWTA, Industry Facts and Figures.
Competition and New Entry in Canada’s Communications Services Market 20 of 89
With another spectrum auction on the horizon, Industry Canada is again examining: the current
and anticipated state of competition in the national wireless industry; and whether specific
measures are needed in the upcoming auction to increase competition.
As Industry Canada again reviews the necessity of measures to benefit a subset of wireless
providers through an auction, it must consider two variables:
1. The level of competition within Canada‟s communications services industry and the
place of the wireless sector within that industry; and
2. The current state (size, scope and holdings) of those communications services providers
that could benefit from any such measures.
1.2 Methodology
Wireless communications services represent one segment of Canada‟s broader communications
market, which includes landline telephony, Internet and subscription television.
There are compelling reasons for considering the wider communications market in licensing
and regulatory oversight:
Every major, facilities-based communications services provider in Canada offers three or
more of the four main communications services.
The distribution technologies used and the services offered by each provider have a
major impact on that provider‟s ability to compete across multiple segments –
particularly their ability to maintain, attract and bundle subscribers.
As such, any review of the level of competition in Canada‟s wireless sector must account for the
sector‟s place within the broader communications services market and compare levels of
wireless competition relative to those in the other services‟ sectors.
Naturally, in its [February 28th
] call for comments Industry Canada itself recognizes the linkages
that exist among the various communications services sectors and thus seeks:
“comments on the current state of competition and its anticipated evolution, including the
impact on consumers in the Canadian wireless services market:
in general;
in terms of its contributions and interaction to the broader Canadian
Competition and New Entry in Canada’s Communications Services Market 21 of 89
telecommunications service market;
in comparison with the wireless markets of other jurisdictions.”
“In light of the current conditions in the Canadian wireless service market(s), is there a need for
specific measures in the 700 MHz and/or 2500 MHz auction to increase or sustain
competition?” And:
“If the Department determines that there is a need for measures to promote competition …
[and] If the Department were to implement a set-aside in the 700 MHz auction:
Who should be entitled to bid in the set-aside block(s)?”
This study analyzes completion within Canada‟s wireless sector in the context of Industry
Canada‟s above consultation questions. Nordicity first determined the level of competition in
Canada‟s wireless sector by examining the sector in the following three ways:
1. Wireless competition relative to the rest of Canada‟s communications services sectors,
analyzed along multiple indices, including:
a. The availability of competing facilities-based services;
b. Sector revenue and growth;
c. Service fees and growth; and
d. Communications services market share by distribution technology.
2. Competition in Canada‟s wireless sector, examined based on:
a. Market structure;
b. Competition for new subscribers; and
c. Regional competition.
3. Competition in Canada‟s wireless industry relative to that in other international
jurisdictions, accounting for variances in international usage trends and based on:
a. Average revenue per user, per minute;
b. Average revenue per square kilometer of network coverage;
c. Subscriber fees; and
d. Market structures.
Finally, to provide information on which specific corporations should be entitled to take
advantage of specific measures designed to increase or sustain competition, if Industry Canada
implemented such measures in the 700 MHz auction, Nordicity examined the size, scope and
Competition and New Entry in Canada’s Communications Services Market 22 of 89
ability to compete on an level playing field of the 2008 „new entrants.‟24
These competitors were
grouped into the following three natural categories:
1. Integrated cable-based communications services incumbents, including:
a. Shaw Communications;
b. Videotron; and
c. EastLink.
2. Regional wireless incumbents, including:
a. SaskTel; and
b. MTS.
3. 2008 Pure-play new entrants, including:
a. Wind Mobile;25
b. Mobilicity; and
c. Public Mobile.
24
New entrants based on the definition used by Industry Canada for the 2008 AWS auction: “participants
holding less than 10% of the national wireless market” [by revenue]. 25
Wind Mobile is not technically a new entrant in Canada‟s communications services industry as its
owner, Globalive, is a competitive telecommunications carrier and long-distance provider. However, the
scope of Globalive‟s existing services and the nature of Wind‟s ownership structure are more comparable
to those of the other new entrants than the integrated cable-based incumbents or the regional wireless
incumbents.
Competition and New Entry in Canada’s Communications Services Market 23 of 89
2. Competition in Canada’s Communications Services Industry
This section demonstrates that: Canada’s wireless sector is as competitive, if not more
competitive than all other Canadian communications services sectors, particularly so
relative to the subscription TV sector. Wireless competition relative to the rest of Canada‟s
communications services sectors is therefore analyzed along multiple indices, including:
The availability of competing facilities-based services;
Sector revenue and growth;
Service fees and growth; and
Communications services market share by distribution technology.
When measuring competition levels in the communications services industry it is most accurate
and relevant to focus on the competition between actual facilities-based providers given the
differences in cost structures between facilities-based and non facilities-based service providers.
As such, this section‟s review of competition indicators across all of Canada‟s communications
services sectors (subscription TV, landline telephony, Internet and wireless) focuses on those
Canadian operators that provide services using their own facilities.
2.1 Availability of competing facilities-based services
One of the most apparent and straightforward indicators of competition per communications
services sector is the actual availability of multiple facilities-based provider services for each
communications service for any given customer.
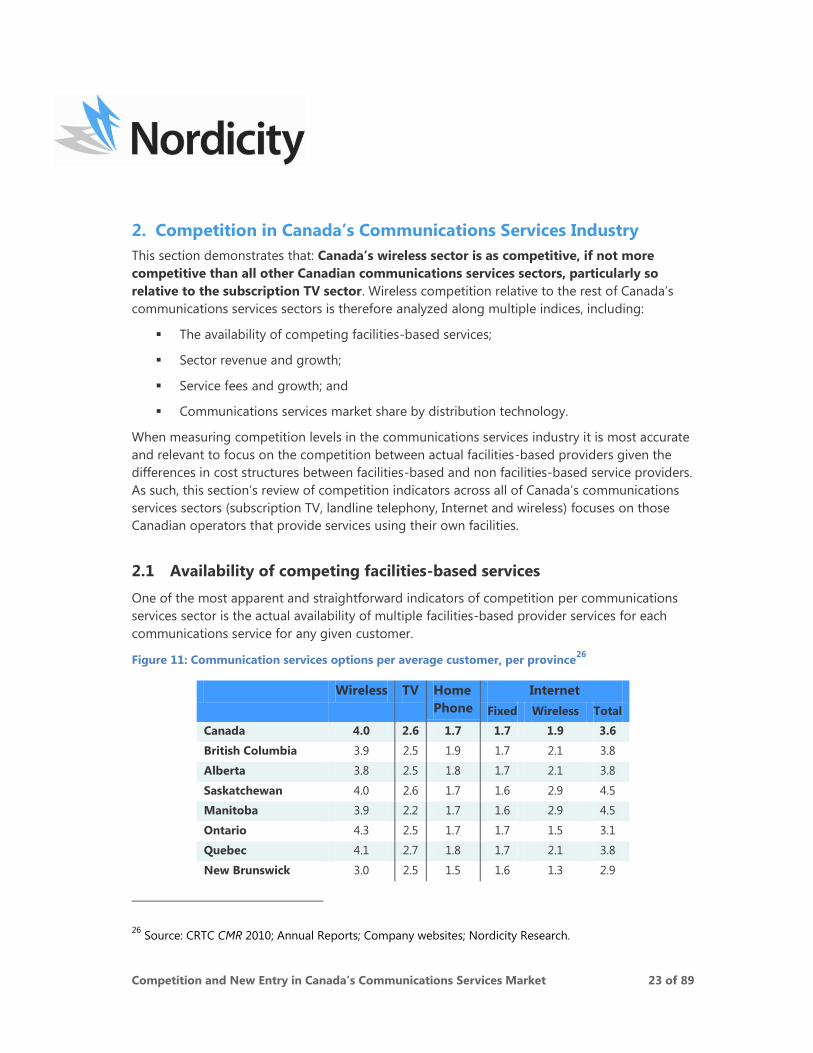
Figure 11: Communication services options per average customer, per province26
Wireless TV Home
Phone
Internet
Fixed Wireless Total
Canada 4.0 2.6 1.7 1.7 1.9 3.6
British Columbia 3.9 2.5 1.9 1.7 2.1 3.8
Alberta 3.8 2.5 1.8 1.7 2.1 3.8
Saskatchewan 4.0 2.6 1.7 1.6 2.9 4.5
Manitoba 3.9 2.2 1.7 1.6 2.9 4.5
Ontario 4.3 2.5 1.7 1.7 1.5 3.1
Quebec 4.1 2.7 1.8 1.7 2.1 3.8
New Brunswick 3.0 2.5 1.5 1.6 1.3 2.9
26
Source: CRTC CMR 2010; Annual Reports; Company websites; Nordicity Research.
Competition and New Entry in Canada’s Communications Services Market 24 of 89
Wireless TV Home
Phone
Internet
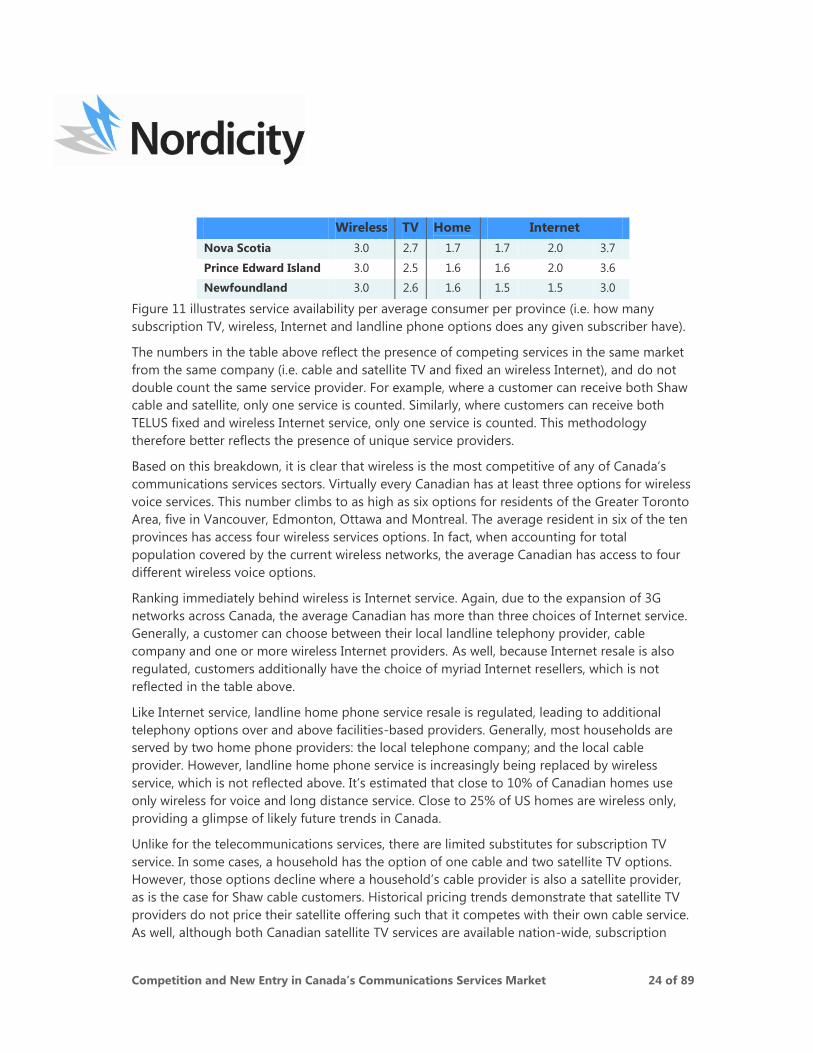
Nova Scotia 3.0 2.7 1.7 1.7 2.0 3.7
Prince Edward Island 3.0 2.5 1.6 1.6 2.0 3.6
Newfoundland 3.0 2.6 1.6 1.5 1.5 3.0
Figure 11 illustrates service availability per average consumer per province (i.e. how many
subscription TV, wireless, Internet and landline phone options does any given subscriber have).
The numbers in the table above reflect the presence of competing services in the same market
from the same company (i.e. cable and satellite TV and fixed an wireless Internet), and do not
double count the same service provider. For example, where a customer can receive both Shaw
cable and satellite, only one service is counted. Similarly, where customers can receive both
TELUS fixed and wireless Internet service, only one service is counted. This methodology
therefore better reflects the presence of unique service providers.
Based on this breakdown, it is clear that wireless is the most competitive of any of Canada‟s
communications services sectors. Virtually every Canadian has at least three options for wireless
voice services. This number climbs to as high as six options for residents of the Greater Toronto
Area, five in Vancouver, Edmonton, Ottawa and Montreal. The average resident in six of the ten
provinces has access four wireless services options. In fact, when accounting for total
population covered by the current wireless networks, the average Canadian has access to four
different wireless voice options.
Ranking immediately behind wireless is Internet service. Again, due to the expansion of 3G
networks across Canada, the average Canadian has more than three choices of Internet service.
Generally, a customer can choose between their local landline telephony provider, cable
company and one or more wireless Internet providers. As well, because Internet resale is also
regulated, customers additionally have the choice of myriad Internet resellers, which is not
reflected in the table above.
Like Internet service, landline home phone service resale is regulated, leading to additional
telephony options over and above facilities-based providers. Generally, most households are
served by two home phone providers: the local telephone company; and the local cable
provider. However, landline home phone service is increasingly being replaced by wireless
service, which is not reflected above. It‟s estimated that close to 10% of Canadian homes use
only wireless for voice and long distance service. Close to 25% of US homes are wireless only,
providing a glimpse of likely future trends in Canada.
Unlike for the telecommunications services, there are limited substitutes for subscription TV
service. In some cases, a household has the option of one cable and two satellite TV options.
However, those options decline where a household‟s cable provider is also a satellite provider,
as is the case for Shaw cable customers. Historical pricing trends demonstrate that satellite TV
providers do not price their satellite offering such that it competes with their own cable service.
As well, although both Canadian satellite TV services are available nation-wide, subscription
Competition and New Entry in Canada’s Communications Services Market 25 of 89
figures indicate customers are much less likely to subscribe to satellite TV from a provider that
has no other services in their region. For instance, 70% of Shaw‟s satellite customers are in
British Columbia and Alberta, and 84% of Bell‟s satellite customer are east of Alberta.27
Beyond the availability of satellite TV, most Canadians currently have the choice of only one
cable TV service due to the limited overlap of wired TV service (cable and IPTV) networks.
It is clear from the table above that when it comes to competition in terms of services
availability, not all communications services are created equal. The wireless services sector has
by far the greatest competition on a per-consumer basis, and carriers‟ ability to price services is
largely impacted by this fact. The mixed competition in the subscription TV sector has had a far
more limited impact on the ability of broadcast distributors to raise prices.
2.2 Revenue and growth
Sector revenue and the ability to grow industry revenue provide indications of competition in
the various communications industry market sectors and a basis for comparison amongst those
sectors. However, because the four major communications services industries are at varying
levels of maturity (i.e. the wireless sector continues to add subscribers at a much higher rate
than the other sectors), revenue and the ability to grow revenue is best compared on a per user
basis.
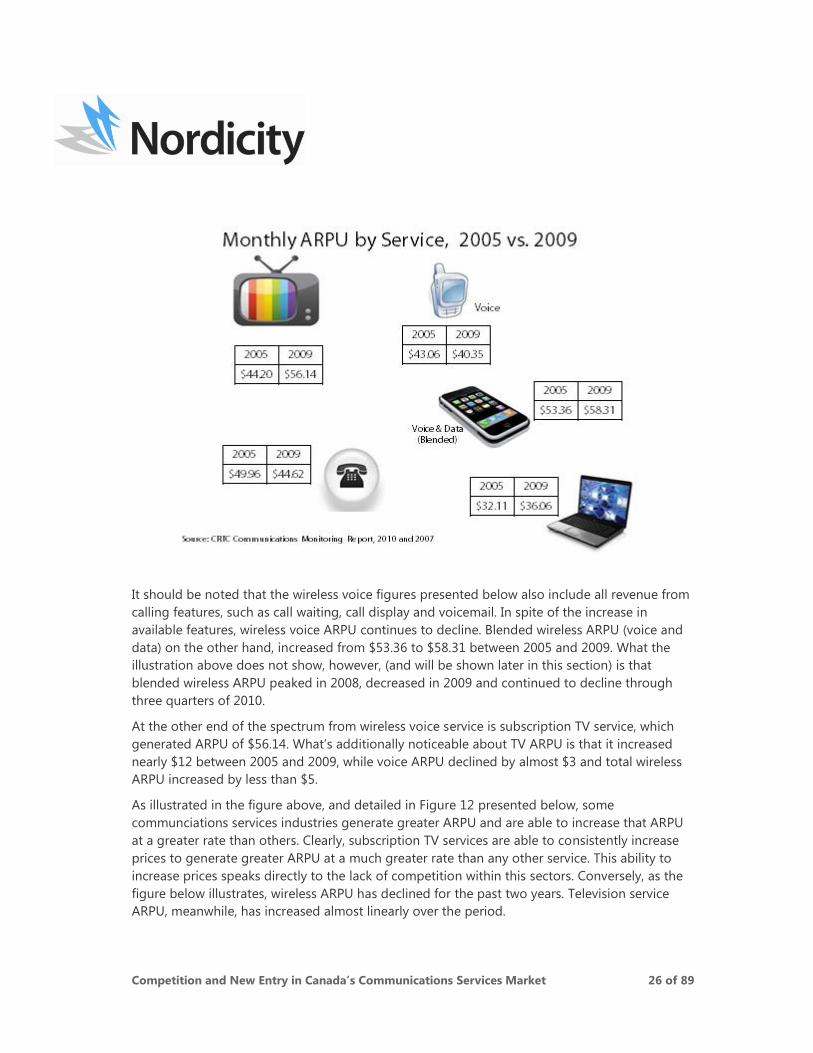
In terms of total monthly average revenue per user (ARPU), wireless voice services currently
generate less revenue per user ($40.35) than all other Canadian communications services with
the exception of Internet access ($36.06).
27
Source: TELUS Market Intelligence.
Competition and New Entry in Canada’s Communications Services Market 26 of 89
It should be noted that the wireless voice figures presented below also include all revenue from
calling features, such as call waiting, call display and voicemail. In spite of the increase in
available features, wireless voice ARPU continues to decline. Blended wireless ARPU (voice and
data) on the other hand, increased from $53.36 to $58.31 between 2005 and 2009. What the
illustration above does not show, however, (and will be shown later in this section) is that
blended wireless ARPU peaked in 2008, decreased in 2009 and continued to decline through
three quarters of 2010.
At the other end of the spectrum from wireless voice service is subscription TV service, which
generated ARPU of $56.14. What‟s additionally noticeable about TV ARPU is that it increased
nearly $12 between 2005 and 2009, while voice ARPU declined by almost $3 and total wireless
ARPU increased by less than $5.
As illustrated in the figure above, and detailed in Figure 12 presented below, some
communciations services industries generate greater ARPU and are able to increase that ARPU
at a greater rate than others. Clearly, subscription TV services are able to consistently increase
prices to generate greater ARPU at a much greater rate than any other service. This ability to
increase prices speaks directly to the lack of competition within this sectors. Conversely, as the
figure below illustrates, wireless ARPU has declined for the past two years. Television service
ARPU, meanwhile, has increased almost linearly over the period.
Competition and New Entry in Canada’s Communications Services Market 27 of 89
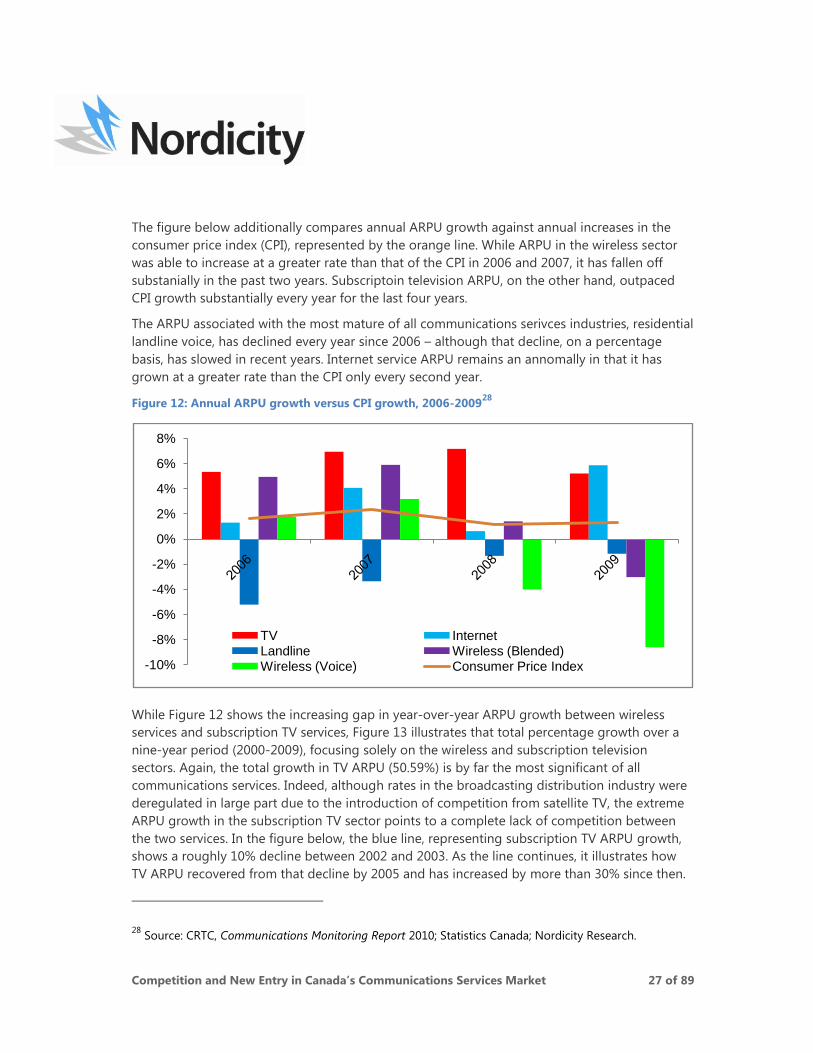
The figure below additionally compares annual ARPU growth against annual increases in the
consumer price index (CPI), represented by the orange line. While ARPU in the wireless sector
was able to increase at a greater rate than that of the CPI in 2006 and 2007, it has fallen off
substanially in the past two years. Subscriptoin television ARPU, on the other hand, outpaced
CPI growth substantially every year for the last four years.
The ARPU associated with the most mature of all communications serivces industries, residential
landline voice, has declined every year since 2006 – although that decline, on a percentage
basis, has slowed in recent years. Internet service ARPU remains an annomally in that it has
grown at a greater rate than the CPI only every second year.
Figure 12: Annual ARPU growth versus CPI growth, 2006-200928
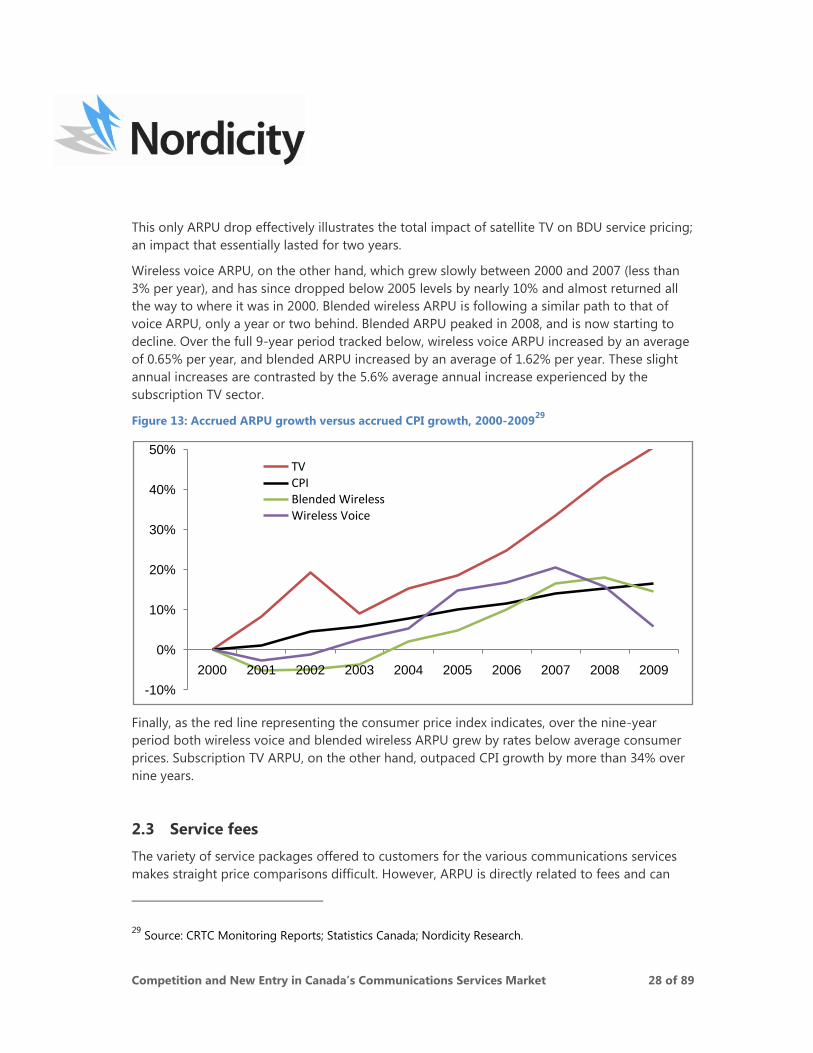
While Figure 12 shows the increasing gap in year-over-year ARPU growth between wireless
services and subscription TV services, Figure 13 illustrates that total percentage growth over a
nine-year period (2000-2009), focusing solely on the wireless and subscription television
sectors. Again, the total growth in TV ARPU (50.59%) is by far the most significant of all
communications services. Indeed, although rates in the broadcasting distribution industry were
deregulated in large part due to the introduction of competition from satellite TV, the extreme
ARPU growth in the subscription TV sector points to a complete lack of competition between
the two services. In the figure below, the blue line, representing subscription TV ARPU growth,
shows a roughly 10% decline between 2002 and 2003. As the line continues, it illustrates how
TV ARPU recovered from that decline by 2005 and has increased by more than 30% since then.
28
Source: CRTC, Communications Monitoring Report 2010; Statistics Canada; Nordicity Research.
-10%
-8%
-6%
-4%
-2%
0%
2%
4%
6%
8%
TV Internet Landline Wireless (Blended)Wireless (Voice) Consumer Price Index
Competition and New Entry in Canada’s Communications Services Market 28 of 89
This only ARPU drop effectively illustrates the total impact of satellite TV on BDU service pricing;
an impact that essentially lasted for two years.
Wireless voice ARPU, on the other hand, which grew slowly between 2000 and 2007 (less than
3% per year), and has since dropped below 2005 levels by nearly 10% and almost returned all
the way to where it was in 2000. Blended wireless ARPU is following a similar path to that of
voice ARPU, only a year or two behind. Blended ARPU peaked in 2008, and is now starting to
decline. Over the full 9-year period tracked below, wireless voice ARPU increased by an average
of 0.65% per year, and blended ARPU increased by an average of 1.62% per year. These slight
annual increases are contrasted by the 5.6% average annual increase experienced by the
subscription TV sector.
Figure 13: Accrued ARPU growth versus accrued CPI growth, 2000-200929
Finally, as the red line representing the consumer price index indicates, over the nine-year
period both wireless voice and blended wireless ARPU grew by rates below average consumer
prices. Subscription TV ARPU, on the other hand, outpaced CPI growth by more than 34% over
nine years.
2.3 Service fees
The variety of service packages offered to customers for the various communications services
makes straight price comparisons difficult. However, ARPU is directly related to fees and can
29
Source: CRTC Monitoring Reports; Statistics Canada; Nordicity Research.
-10%
0%
10%
20%
30%
40%
50%
2000 2001 2002 2003 2004 2005 2006 2007 2008 2009
TVCPIBlended WirelessWireless Voice
Competition and New Entry in Canada’s Communications Services Market 29 of 89
again be used to provide an indication of a sector‟s (or service provider‟s) ability to increase
prices.
A nine-year look at Canadian wireless voice and blended wireless ARPU has already been
presented in this section. However, it is useful to examine ARPU trends on a quarterly basis as
well. Quarterly figures more accurately reflect the ongoing fluctuation in wireless carriers‟
subscriber additions and revenue growth. Quarterly figures also provide a more accurate
indication of when a service sector has matured enough that future ARPU growth is unlikely.
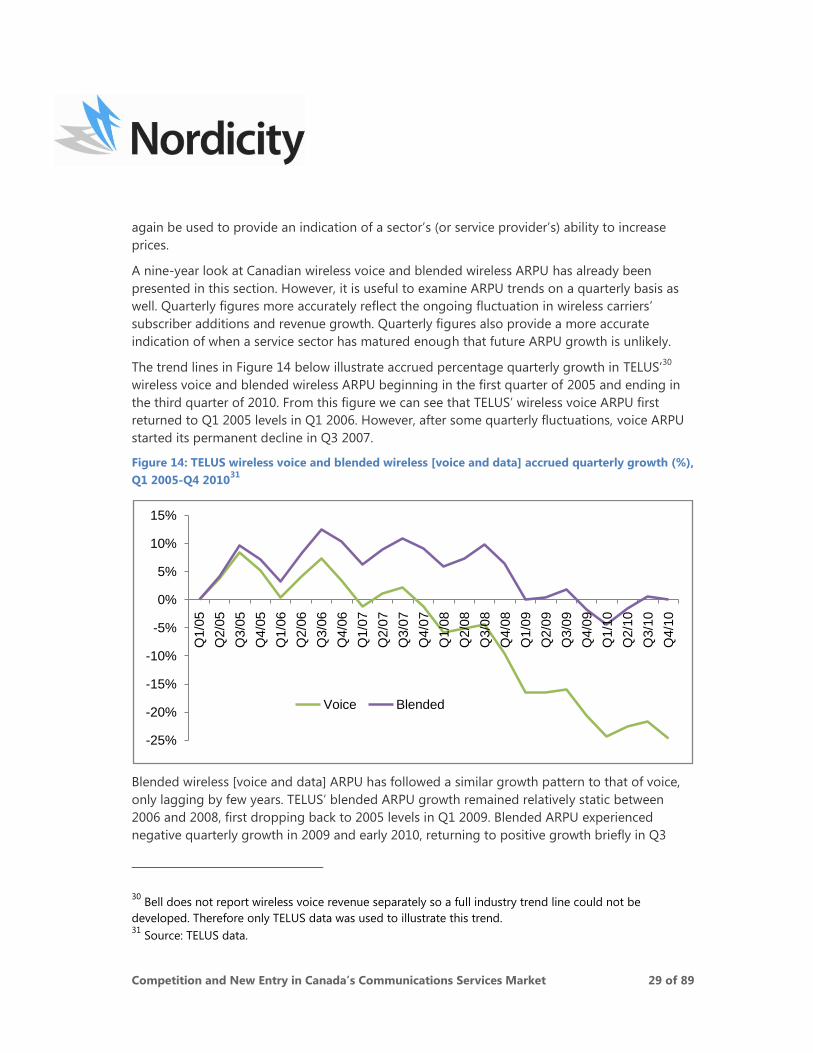
The trend lines in Figure 14 below illustrate accrued percentage quarterly growth in TELUS‟30
wireless voice and blended wireless ARPU beginning in the first quarter of 2005 and ending in
the third quarter of 2010. From this figure we can see that TELUS‟ wireless voice ARPU first
returned to Q1 2005 levels in Q1 2006. However, after some quarterly fluctuations, voice ARPU
started its permanent decline in Q3 2007.
Figure 14: TELUS wireless voice and blended wireless [voice and data] accrued quarterly growth (%),
Q1 2005-Q4 201031
Blended wireless [voice and data] ARPU has followed a similar growth pattern to that of voice,
only lagging by few years. TELUS‟ blended ARPU growth remained relatively static between
2006 and 2008, first dropping back to 2005 levels in Q1 2009. Blended ARPU experienced
negative quarterly growth in 2009 and early 2010, returning to positive growth briefly in Q3
30
Bell does not report wireless voice revenue separately so a full industry trend line could not be
developed. Therefore only TELUS data was used to illustrate this trend. 31
Source: TELUS data.
-25%
-20%
-15%
-10%
-5%
0%
5%
10%
15%
Q1/0
5
Q2/0
5
Q3/0
5
Q4/0
5
Q1/0
6
Q2/0
6
Q3/0
6
Q4/0
6
Q1/0
7
Q2/0
7
Q3/0
7
Q4/0
7
Q1/0
8
Q2/0
8
Q3/0
8
Q4/0
8
Q1/0
9
Q2/0
9
Q3/0
9
Q4/0
9
Q1/1
0
Q2/1
0
Q3/1
0
Q4/1
0
Voice Blended
Competition and New Entry in Canada’s Communications Services Market 30 of 89
2010. Based on the wireless voice trend line, it should be expected that blended ARPU will
begin a permanent decline within the next 12 months.
The increase in consumer preferences for the anytime information and entertainment services
available using smart phones such as the iPhone and BlackBerry has greatly impacted data
usage. Similarly, the availability of wireless Internet service using data „dongles‟ has also
increased overall data consumption. However, even wireless data revenue is increasing
significantly due to the overall increase in data use, the increase in data ARPU no longer
consistently offsets the continuing declines in voice ARPU, as illustrated below. Due to the
competition in the sector, carriers will have to continue to reduce voice and data prices,
resulting in static, or declining wireless services ARPU.
In terms of real prices, wireless services rates, particularly for basic services such as talk and text,
continue to drop rapidly. All three national service providers have discount brands (two in the
case of Rogers and Bell) that offer unlimited talk and text plans, ranging from $25-$40. Most
discount brands have dropped the near-$10 System Access Fee, meaning the advertised prices
are actually what customers pay.
In addition, some of Canada‟s new entrant providers, particularly the pure-play wireless
providers, are also offering unlimited talk and text plans in the $25-$40 range as a competitive
tactic to establish an early market share. It remains to be seen how sustainable this level of
pricing will be. International trends suggest not all new players would be able become
profitable, particularly if they are offering substantial service discounts. However, the
discounting by new entrants has already further advanced the already increasingly competitive
unlimited wireless voice and text segment.
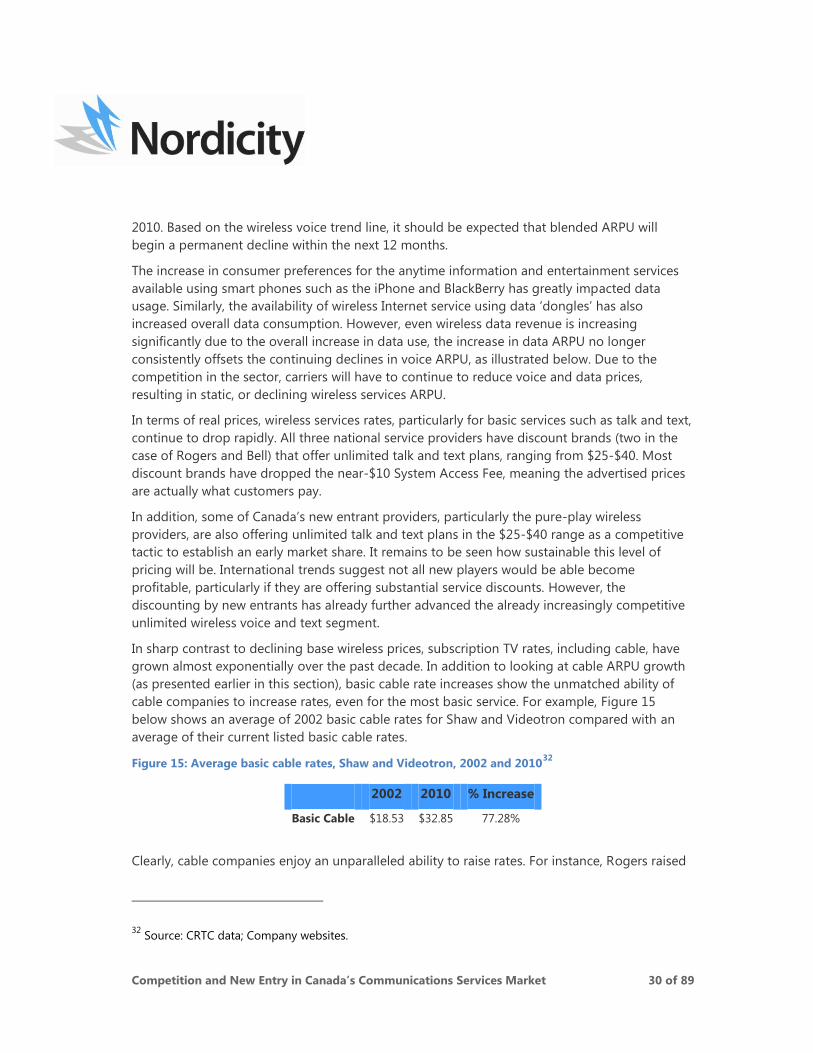
In sharp contrast to declining base wireless prices, subscription TV rates, including cable, have
grown almost exponentially over the past decade. In addition to looking at cable ARPU growth
(as presented earlier in this section), basic cable rate increases show the unmatched ability of
cable companies to increase rates, even for the most basic service. For example, Figure 15
below shows an average of 2002 basic cable rates for Shaw and Videotron compared with an
average of their current listed basic cable rates.
Figure 15: Average basic cable rates, Shaw and Videotron, 2002 and 201032
2002 2010 % Increase
Basic Cable $18.53 $32.85 77.28%
Clearly, cable companies enjoy an unparalleled ability to raise rates. For instance, Rogers raised
32
Source: CRTC data; Company websites.
Competition and New Entry in Canada’s Communications Services Market 31 of 89
basic cable rates by 5.2% in March 2009, and by an additional 5% in July 2010.33
Due to the lack
of competition in the sector, cable companies can continue to overtly raise rates with no loss of
customers. In addition, total wired TV subscriber numbers increased by nearly 18% between
2005 and 2009.
Overall, annual cable ARPU grew on average by 5.38% between 2005 and 2009.34
Beyond
merely demonstrating the presence of much less competition in the cable sector versus the
wireless or other telecommunications sectors, this ability to increase prices by 5% or more over
a one-year period is evidence of monopoly power. The hypothetical monopolist SSNIP (small
but significant non-transitory increase in price) test typically cites a 5% increase in price over a
one-year period. The cable sector, as well as the satellite TV sector (8.25% CAGR from 2005-
2009), consistently raise prices above this level. This ability to raise prices at such a high rate not
only confirms that there is little competition between cable and satellite, but also that there is
virtually no competition within either sector.
As explained in Section 2.1, competition in the subscription TV sector is impacted by a number
of factors, including the ownership of cable and satellite services by Shaw – and to a lesser
extent Bell with its IPTV service. Shaw has no incentive to price its satellite service to compete
with cable because it would largely be cannibalizing its own subscriber base. Therefore, it makes
sense to charge higher prices for satellite service and focus on capturing subscribers in rural
areas where there is no cable option, effectively limiting customer options. The result of this
pricing philosophy is evidenced by the fact that roughly 66% of Shaw‟s satellite customers are
from rural areas. Overall, however, more than 50% of Canadian satellite subscribers are in rural
markets, indicating that satellite service is generally not ubiquitously competitive across all
markets.35
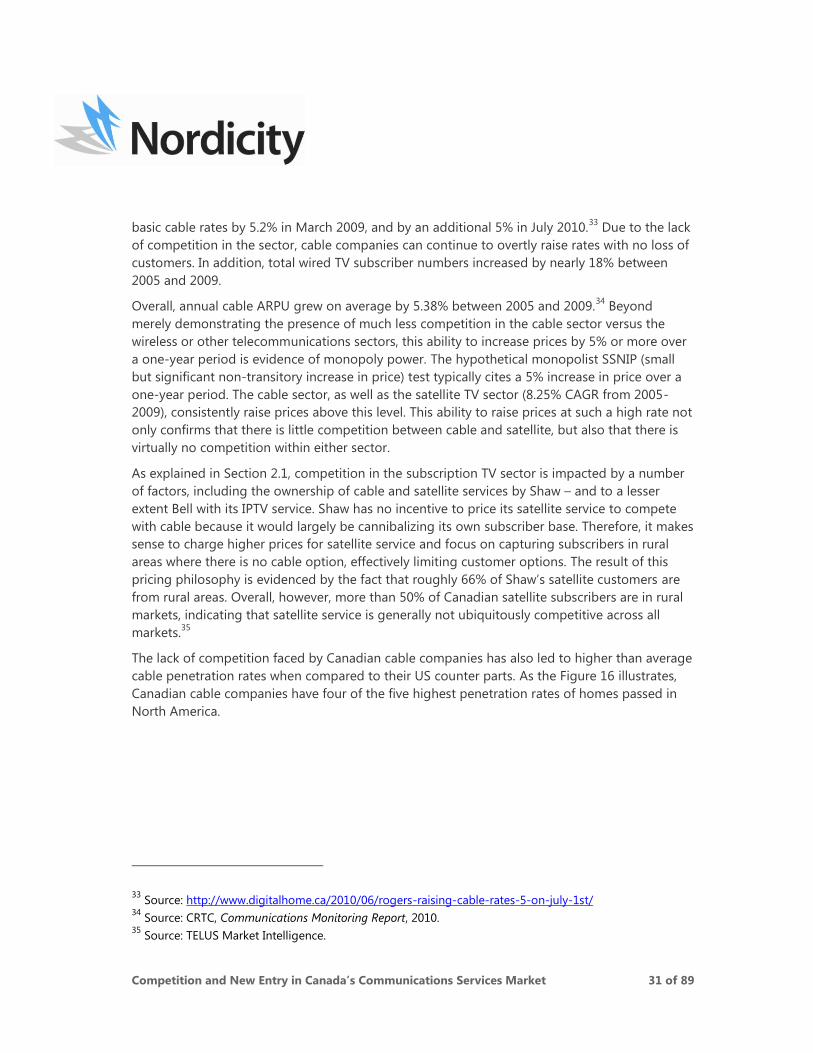
The lack of competition faced by Canadian cable companies has also led to higher than average
cable penetration rates when compared to their US counter parts. As the Figure 16 illustrates,
Canadian cable companies have four of the five highest penetration rates of homes passed in
North America.
33
Source: http://www.digitalhome.ca/2010/06/rogers-raising-cable-rates-5-on-july-1st/ 34
Source: CRTC, Communications Monitoring Report, 2010. 35
Source: TELUS Market Intelligence.
Competition and New Entry in Canada’s Communications Services Market 32 of 89
Figure 16: Percentage basic cable service penetration of homes passed36
In fact, the average penetration of homes passed for Canada‟s for major cable companies is
62%, a full 15% greater than the average for the five leading US cable companies listed in the
figure above.
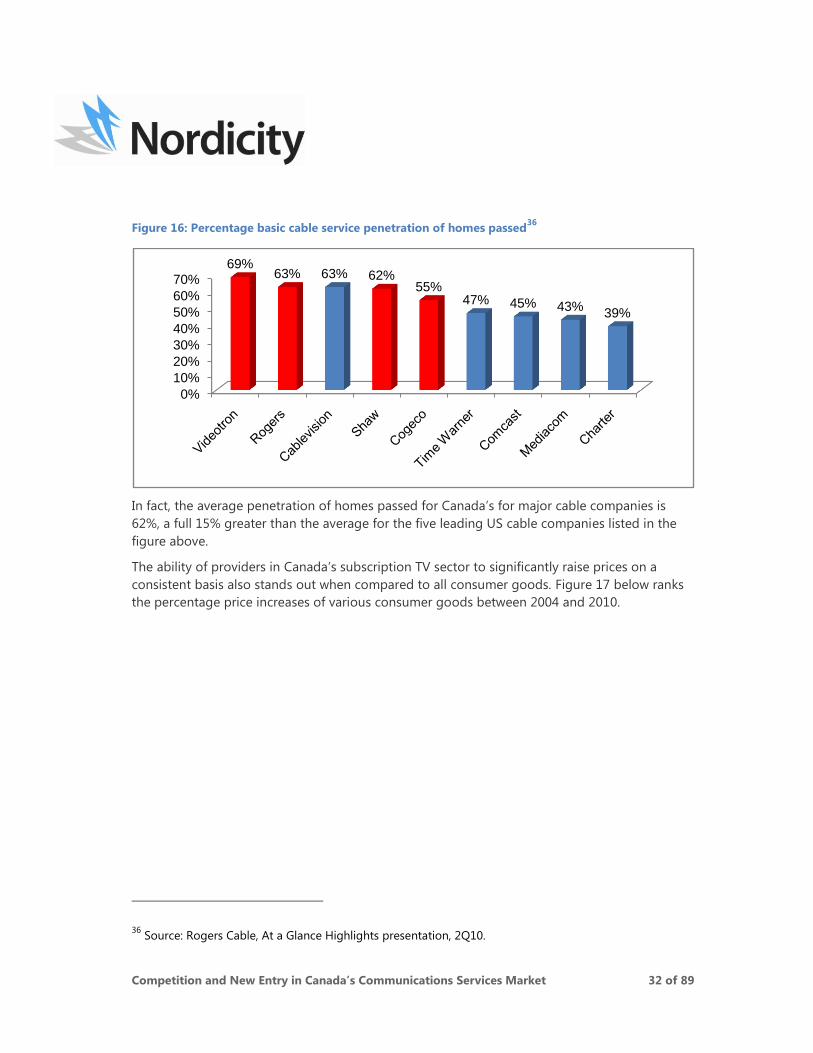
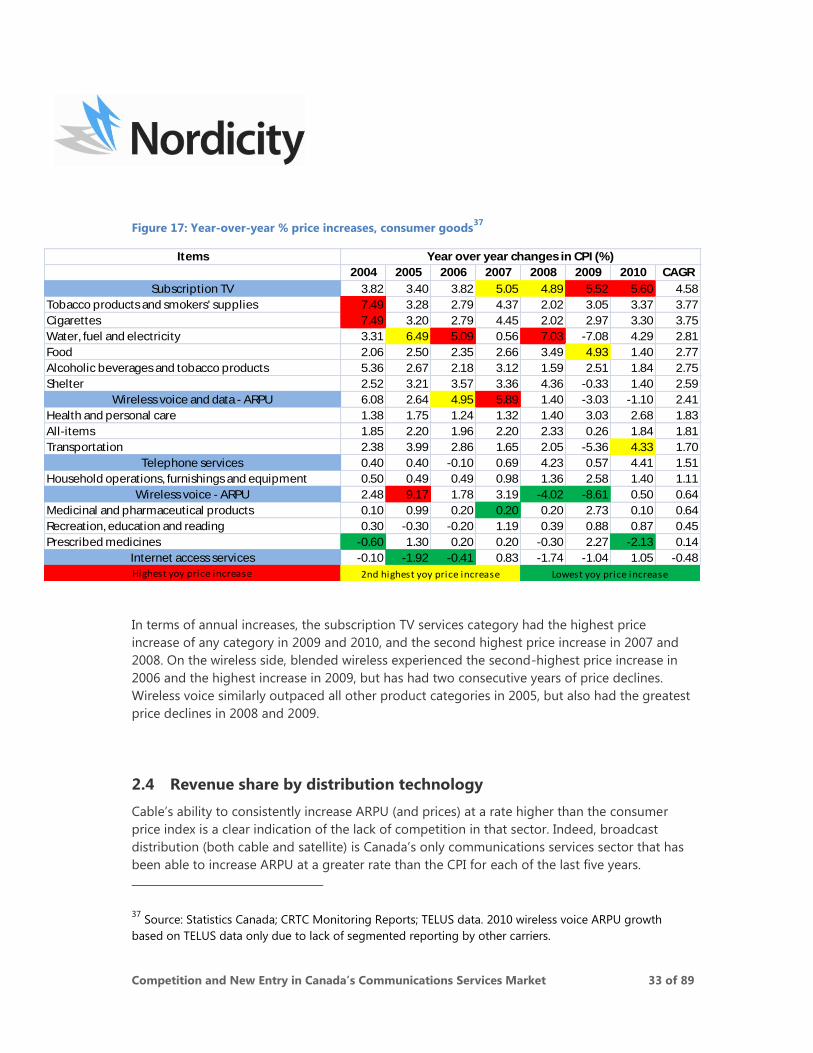
The ability of providers in Canada‟s subscription TV sector to significantly raise prices on a
consistent basis also stands out when compared to all consumer goods. Figure 17 below ranks
the percentage price increases of various consumer goods between 2004 and 2010.
36
Source: Rogers Cable, At a Glance Highlights presentation, 2Q10.
0%
10%
20%
30%
40%
50%
60%
70%
69%63% 63% 62%
55%47% 45% 43%
39%
Competition and New Entry in Canada’s Communications Services Market 33 of 89
Figure 17: Year-over-year % price increases, consumer goods37
In terms of annual increases, the subscription TV services category had the highest price
increase of any category in 2009 and 2010, and the second highest price increase in 2007 and
2008. On the wireless side, blended wireless experienced the second-highest price increase in
2006 and the highest increase in 2009, but has had two consecutive years of price declines.
Wireless voice similarly outpaced all other product categories in 2005, but also had the greatest
price declines in 2008 and 2009.
2.4 Revenue share by distribution technology
Cable‟s ability to consistently increase ARPU (and prices) at a rate higher than the consumer
price index is a clear indication of the lack of competition in that sector. Indeed, broadcast
distribution (both cable and satellite) is Canada‟s only communications services sector that has
been able to increase ARPU at a greater rate than the CPI for each of the last five years.
37
Source: Statistics Canada; CRTC Monitoring Reports; TELUS data. 2010 wireless voice ARPU growth
based on TELUS data only due to lack of segmented reporting by other carriers.
Items
2004 2005 2006 2007 2008 2009 2010 CAGR
Subscription TV 3.82 3.40 3.82 5.05 4.89 5.52 5.60 4.58
Tobacco products and smokers' supplies 7.49 3.28 2.79 4.37 2.02 3.05 3.37 3.77
Cigarettes 7.49 3.20 2.79 4.45 2.02 2.97 3.30 3.75
Water, fuel and electricity 3.31 6.49 5.09 0.56 7.03 -7.08 4.29 2.81
Food 2.06 2.50 2.35 2.66 3.49 4.93 1.40 2.77
Alcoholic beverages and tobacco products 5.36 2.67 2.18 3.12 1.59 2.51 1.84 2.75
Shelter 2.52 3.21 3.57 3.36 4.36 -0.33 1.40 2.59
Wireless voice and data - ARPU 6.08 2.64 4.95 5.89 1.40 -3.03 -1.10 2.41
Health and personal care 1.38 1.75 1.24 1.32 1.40 3.03 2.68 1.83
All-items 1.85 2.20 1.96 2.20 2.33 0.26 1.84 1.81
Transportation 2.38 3.99 2.86 1.65 2.05 -5.36 4.33 1.70
Telephone services 0.40 0.40 -0.10 0.69 4.23 0.57 4.41 1.51
Household operations, furnishings and equipment 0.50 0.49 0.49 0.98 1.36 2.58 1.40 1.11
Wireless voice - ARPU 2.48 9.17 1.78 3.19 -4.02 -8.61 0.50 0.64
Medicinal and pharmaceutical products 0.10 0.99 0.20 0.20 0.20 2.73 0.10 0.64
Recreation, education and reading 0.30 -0.30 -0.20 1.19 0.39 0.88 0.87 0.45
Prescribed medicines -0.60 1.30 0.20 0.20 -0.30 2.27 -2.13 0.14
Internet access services -0.10 -1.92 -0.41 0.83 -1.74 -1.04 1.05 -0.48
Highest yoy price increase
Year over year changes in CPI (%)
2nd highest yoy price increase Lowest yoy price increase
Competition and New Entry in Canada’s Communications Services Market 34 of 89
Competition in the wireless sector, on the other hand, has reached the point where providers
can no longer increase ARPU at all, let alone more quickly than the CPI.
The lack of competition for cable, however, impacts more than just the subscription television
sector. Since the introduction of Internet service in the late 1990‟s and cable telephony service
around 2005, Canadian communications services providers have been competing for shares of
the total communications services market, not just individual segments. Of the two primary
wired communications services platforms – cable and telecommunications service provider
(TSP) infrastructures – coaxial cable plant has emerged as the more advantageous base
infrastructure from a service perspective.
As of 2009, cable BDUs received 66.5% of their revenues from telecommunications services
(Internet and landline phone). Conversely, ILEC‟s (incumbent local exchange carriers) received
only 5.8% of their revenues from broadcasting services.38
The emergence of cable as the
preferred base wired infrastructure is further illustrated in Figure 18.
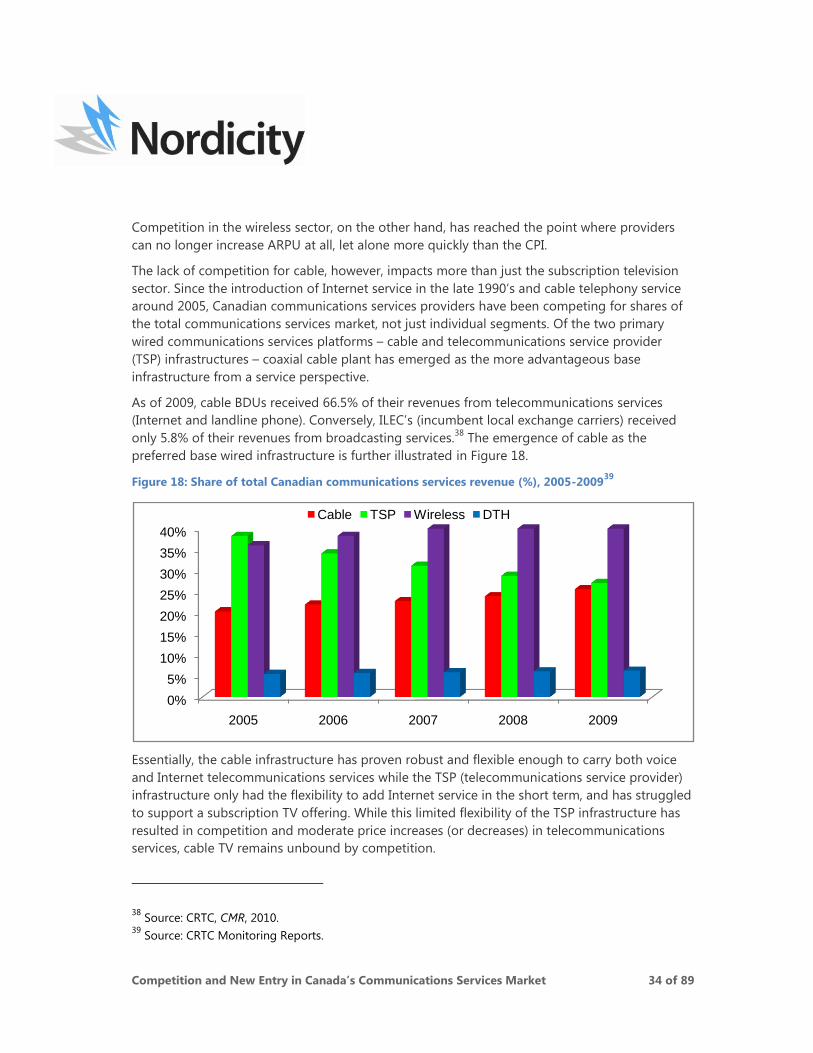
Figure 18: Share of total Canadian communications services revenue (%), 2005-200939
Essentially, the cable infrastructure has proven robust and flexible enough to carry both voice
and Internet telecommunications services while the TSP (telecommunications service provider)
infrastructure only had the flexibility to add Internet service in the short term, and has struggled
to support a subscription TV offering. While this limited flexibility of the TSP infrastructure has
resulted in competition and moderate price increases (or decreases) in telecommunications
services, cable TV remains unbound by competition.
38
Source: CRTC, CMR, 2010. 39
Source: CRTC Monitoring Reports.
0%
5%
10%
15%
20%
25%
30%
35%
40%
2005 2006 2007 2008 2009
Cable TSP Wireless DTH
Competition and New Entry in Canada’s Communications Services Market 35 of 89
Clearly, wireless is now the leading telecommunications infrastructure in terms of revenue, due
to a number of factors, including: portability; anytime availability; ability to replicate some voice
and data services; and role as a personal service, not a household service. However, the
emergence of wireless has not impacted the growth of cable. As illustrated in the graph above,
cable as a distribution technology increased its share of the national communications services
revenue by 5.3% between 2005 and 2007, compared to 5.15% for wireless and -11.2% for the
telecommunications infrastructure.
In terms of total revenue, cable grew by more than 69% between 2005 and 2009, while wireless
revenues increased by roughly 53% and TSP revenues declined by 5.19%. If the trend illustrated
above were to continue – cable‟s market share in all likelihood has already passed that of the
telecommunications infrastructure – the communications services market would be primarily
controlled40
by cable and wireless providers, or those providers that offer both services. Indeed,
those companies that offer wired TV have an inherent advantage when it comes to capturing
and maintaining wireless subscribers. In its 2010 outlook, MTS Allstream noted that it
experiences 0.3% wireless churn41
from customers in a 4-service bundle. This churn rate is more
than 80% lower than the industry average.42
The difficulty to date of the existing TSP twisted copper pair network or wireless services to
substitute in any way for subscription TV service provided a natural market safeguard for cable
companies. Even though the large cable companies (particularly Videotron and Shaw) easily had
the financial resources to enter the wireless market, they elected not to do so until the
government provided significantly favourable conditions. Conversely, communications service
providers that originated with a telecommunications services infrastructure are currently
building new fibre networks to add a subscription TV offering, and bearing the full cost to do
so.
2.5 Conclusions
Canada’s wireless sector is as competitive, if not more competitive than any other
Canadian communications services sector. This fact is made evident by a number competitive
indicators, including:
The average Canadian has more choice in facilities-based wireless services than for any
other communications service;
40
The only offset to this trend is the very expensive rollout of FTTH by TSPs. 41
Source: Source: http://www.mts.ca/file_source/mts.ca/Static_Files/Financial-
Reports/2010/Outlook/EN/MTS%20Allstream%202011%20Financial%20Outlook.pdf (pp.42) 42
Source: CRTC, CMR, 2010
Competition and New Entry in Canada’s Communications Services Market 36 of 89
Wireless voice ARPU has not experienced a year-over-year percentage increase greater
than that of the consumer price index since 2007, and voice ARPU has increasingly
declined since 2008. In addition, wireless voice ARPU declined by 2.03% on an average
annual basis between 2005 and 2009, well below the average CPI increase of 1.63%;
Blended wireless ARPU last experienced a year-over-year percentage increase greater
than that of the consumer price index in 2008, meaning the growth in data ARPU is no
longer covering the loss in voice ARPU;
Wireless voice ARPU experienced the greatest year-over-year percentage decline in
2009 of any communications service, followed next by blended wireless ARPU;
Wireless voice ARPU increased by an average of 0.65% per year from 2000 to 2009; and
Blended ARPU increased by an average of 1.62% per year from 2000 to 2009;
Competition in Canada‟s wireless sector relative to other communications services
sectors is most pronounced when compared to the lack of competition in the
subscription TV sector. Virtually every competition indicator cited above for the
wireless sector can be reversed to highlight the extreme lack of competition in the
subscription TV sector. Namely, cable and satellite services ARPU have increased at a far
greater rate than that of any other communications services sector;
Conversely to wireless ARPU, TV growth has greatly outpaced that of the CPI, increasing
in a way that suggests a de facto monopoly. As mentioned earlier in this section, the
hypothetical monopolist SSNIP (small but significant non-transitory increase in price)
test typically cites a 5% increase in price over a one-year period. The cable and satellite
TV sectors both pass this monopoly test, posting ARPU growth above 5% per year over
the past nine years and consistently implementing single price increase above 5%.
Cable continues to increase its share of national landline communications services
revenue, and in all likelihood has now passed the traditional telecommunications
services network as the leading landline platform. This growth continues in spite of the
fact that three of the four largest cable companies in the country (Shaw, Videotron and
Cogeco) had no wireless offering in their bundle until recent months. Conversely, the
operators of the four largest telecommunications infrastructures in the country (TELUS,
Bell, MTS and SaskTel) have offered wireless services for more than two decades, yet
continue to lose overall landline market share to cable, demonstrating cable TV
unmatched strength as the anchor of a service bundle.
Competition and New Entry in Canada’s Communications Services Market 37 of 89
3. Competition in Canada’s Wireless Sector
This section demonstrates: the significant national and regional competition in Canada’s
wireless sector, as well as the considerable differences in spectrum need amongst existing
wireless carriers. Competition in Canada‟s wireless sector is analyzed on the basis of:
Market structure;
Competition for new subscribers; and
Regional competition.
Prior to 2009, there were essentially five competitors in Canada‟s wireless sector: Rogers; Bell;
TELUS; SaskTel; and MTS. Over the past two years, four more carriers have entered the wireless
market, realizing major subscriber gains in the most recent fiscal quarters. However, the impact
of the new entrants on the wireless market is limited to the relatively small window of the past
year. Therefore, this section examines competition in Canada‟s wireless sector first in terms of
the five competitors that were in the market before the 2008 auction, and subsequently with
regards to competition from the new entrant players.
As noted in Section 2, this report focuses solely on facilities-based competitors. Therefore, this
section does not additionally examine the numerous mobile virtual network operator brand
choices enabled by the presence of Canada‟s facilities-based wireless providers.
3.1 Market structure
Presently, there are nine facilities-based wireless services providers in Canada. Two more
providers (Shaw and EastLink) are expected to enter the market in 2011. Prior to 2009, however,
there were five competitors in Canada‟s wireless market, with three offering national service and
SaskTel and MTS limited primarily to their incumbent telephone territories of Saskatchewan and
Manitoba.
Over the past five years, the number of Canadian wireless subscribers has increased by more
than seven million, and competition for those subscribers has been fierce. The majority of new
subscribers, particularly prior to 2010, were generally captured by the five wireless providers
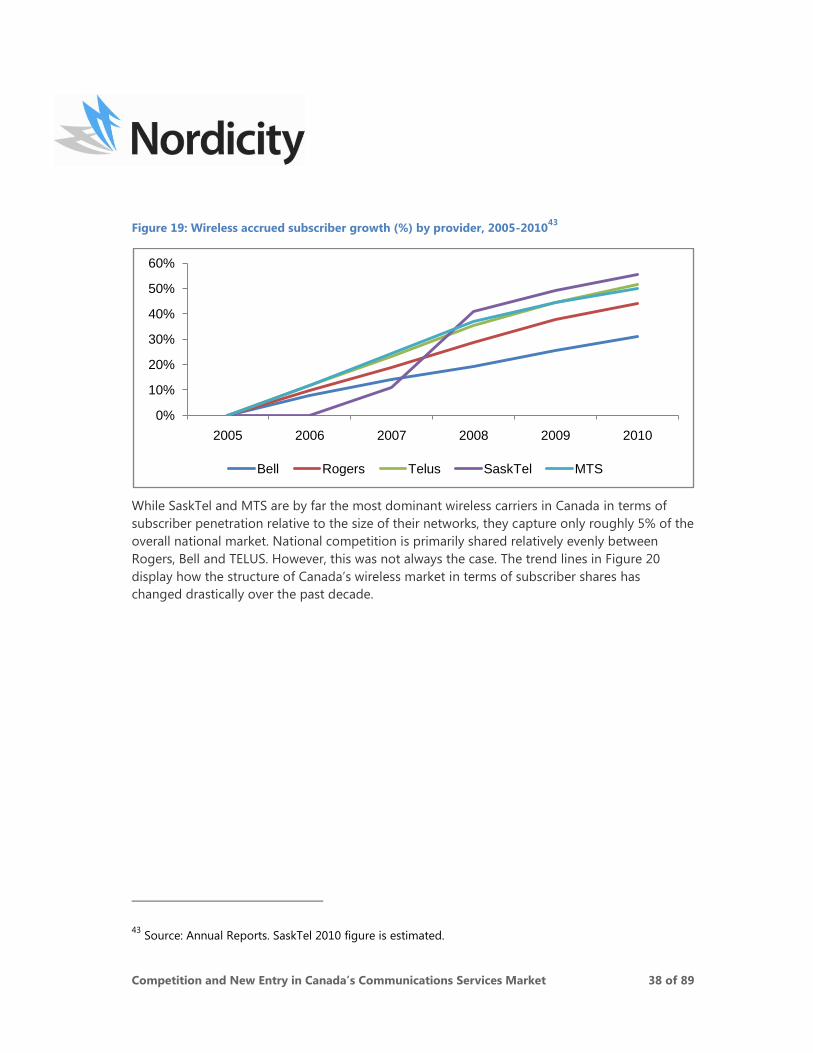
that have offered service for more than a decade. As Figure 19 illustrates, while all competitors
added substantially to their respective subscriber bases, they enjoyed varying levels of success
on a percentage increase basis. Of the five competitors, SaskTel enjoyed the largest percentage
growth in its subscriber base, followed by TELUS and MTS. Rogers gained the most subscribers
overall of any wireless carrier, but only outpaced Bell in terms of a percentage increase.
Competition and New Entry in Canada’s Communications Services Market 38 of 89
Figure 19: Wireless accrued subscriber growth (%) by provider, 2005-201043
While SaskTel and MTS are by far the most dominant wireless carriers in Canada in terms of
subscriber penetration relative to the size of their networks, they capture only roughly 5% of the
overall national market. National competition is primarily shared relatively evenly between
Rogers, Bell and TELUS. However, this was not always the case. The trend lines in Figure 20
display how the structure of Canada‟s wireless market in terms of subscriber shares has
changed drastically over the past decade.
43
Source: Annual Reports. SaskTel 2010 figure is estimated.
0%
10%
20%
30%
40%
50%
60%
2005 2006 2007 2008 2009 2010
Bell Rogers Telus SaskTel MTS
Competition and New Entry in Canada’s Communications Services Market 39 of 89
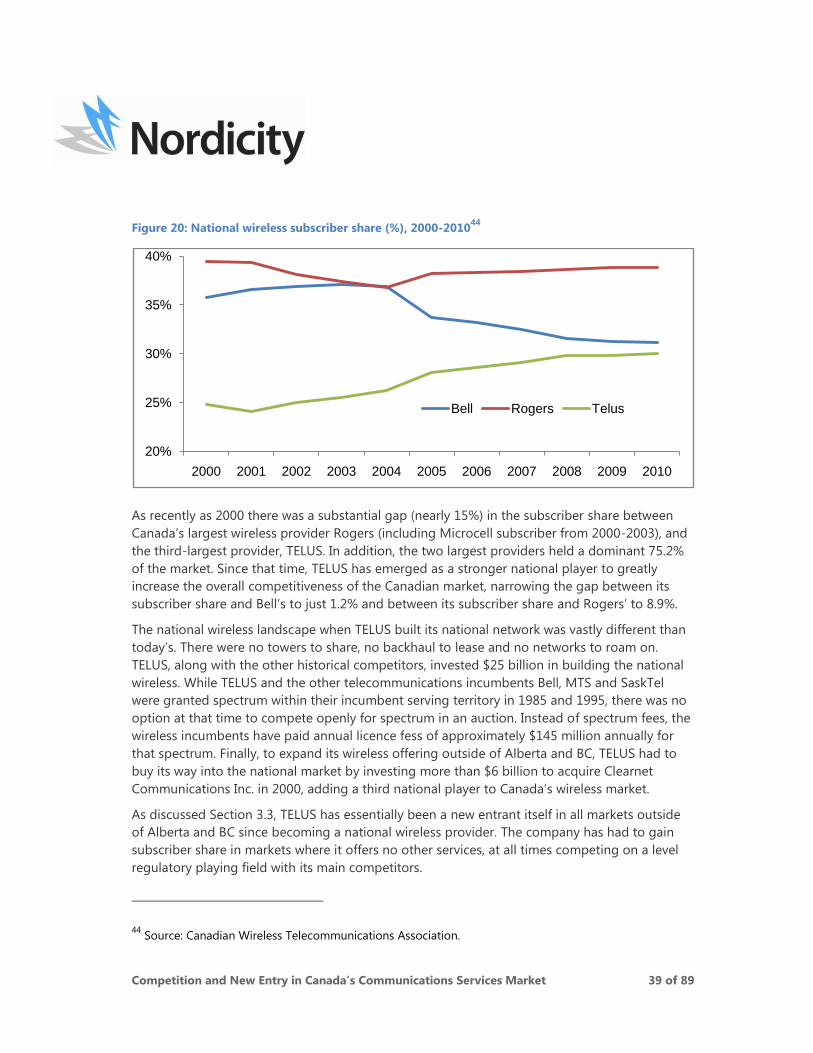
Figure 20: National wireless subscriber share (%), 2000-201044
As recently as 2000 there was a substantial gap (nearly 15%) in the subscriber share between
Canada‟s largest wireless provider Rogers (including Microcell subscriber from 2000-2003), and
the third-largest provider, TELUS. In addition, the two largest providers held a dominant 75.2%
of the market. Since that time, TELUS has emerged as a stronger national player to greatly
increase the overall competitiveness of the Canadian market, narrowing the gap between its
subscriber share and Bell‟s to just 1.2% and between its subscriber share and Rogers‟ to 8.9%.
The national wireless landscape when TELUS built its national network was vastly different than
today‟s. There were no towers to share, no backhaul to lease and no networks to roam on.
TELUS, along with the other historical competitors, invested $25 billion in building the national
wireless. While TELUS and the other telecommunications incumbents Bell, MTS and SaskTel
were granted spectrum within their incumbent serving territory in 1985 and 1995, there was no
option at that time to compete openly for spectrum in an auction. Instead of spectrum fees, the
wireless incumbents have paid annual licence fess of approximately $145 million annually for
that spectrum. Finally, to expand its wireless offering outside of Alberta and BC, TELUS had to
buy its way into the national market by investing more than $6 billion to acquire Clearnet
Communications Inc. in 2000, adding a third national player to Canada‟s wireless market.
As discussed Section 3.3, TELUS has essentially been a new entrant itself in all markets outside
of Alberta and BC since becoming a national wireless provider. The company has had to gain
subscriber share in markets where it offers no other services, at all times competing on a level
regulatory playing field with its main competitors.
44
Source: Canadian Wireless Telecommunications Association.
20%
25%
30%
35%
40%
2000 2001 2002 2003 2004 2005 2006 2007 2008 2009 2010
Bell Rogers Telus
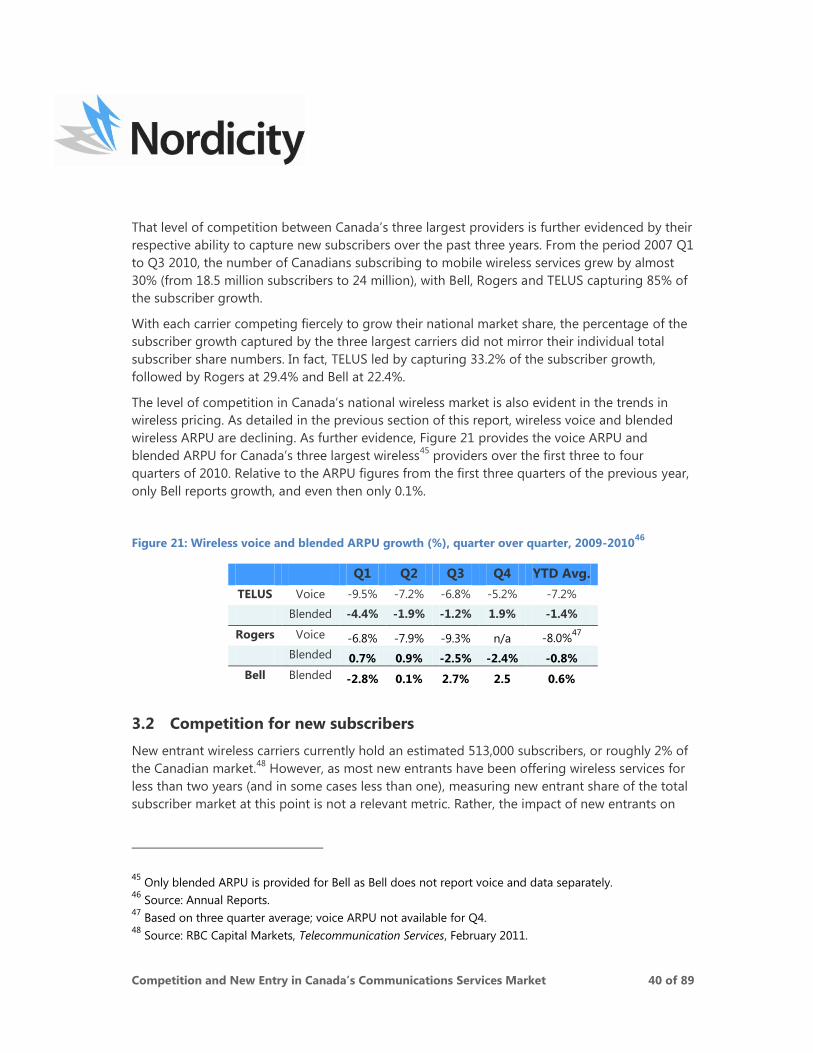
Competition and New Entry in Canada’s Communications Services Market 40 of 89
That level of competition between Canada‟s three largest providers is further evidenced by their
respective ability to capture new subscribers over the past three years. From the period 2007 Q1
to Q3 2010, the number of Canadians subscribing to mobile wireless services grew by almost
30% (from 18.5 million subscribers to 24 million), with Bell, Rogers and TELUS capturing 85% of
the subscriber growth.
With each carrier competing fiercely to grow their national market share, the percentage of the
subscriber growth captured by the three largest carriers did not mirror their individual total
subscriber share numbers. In fact, TELUS led by capturing 33.2% of the subscriber growth,
followed by Rogers at 29.4% and Bell at 22.4%.
The level of competition in Canada‟s national wireless market is also evident in the trends in
wireless pricing. As detailed in the previous section of this report, wireless voice and blended
wireless ARPU are declining. As further evidence, Figure 21 provides the voice ARPU and
blended ARPU for Canada‟s three largest wireless45
providers over the first three to four
quarters of 2010. Relative to the ARPU figures from the first three quarters of the previous year,
only Bell reports growth, and even then only 0.1%.
Figure 21: Wireless voice and blended ARPU growth (%), quarter over quarter, 2009-201046
Q1 Q2 Q3 Q4 YTD Avg.
TELUS Voice -9.5% -7.2% -6.8% -5.2% -7.2%
Blended -4.4% -1.9% -1.2% 1.9% -1.4%
Rogers Voice -6.8% -7.9% -9.3% n/a -8.0%47
Blended 0.7% 0.9% -2.5% -2.4% -0.8%
Bell Blended -2.8% 0.1% 2.7% 2.5 0.6%
3.2 Competition for new subscribers
New entrant wireless carriers currently hold an estimated 513,000 subscribers, or roughly 2% of
the Canadian market.48
However, as most new entrants have been offering wireless services for
less than two years (and in some cases less than one), measuring new entrant share of the total
subscriber market at this point is not a relevant metric. Rather, the impact of new entrants on
45
Only blended ARPU is provided for Bell as Bell does not report voice and data separately. 46
Source: Annual Reports. 47
Based on three quarter average; voice ARPU not available for Q4. 48
Source: RBC Capital Markets, Telecommunication Services, February 2011.

Competition and New Entry in Canada’s Communications Services Market 41 of 89
the competition in Canada‟s wireless market is more appropriately measured in terms of its
impact over the last year.
Figure 22 illustrates the estimated percentage of Q4 2010 net wireless subscriber additions
captured by each Canadian facilities based carrier. The greatest number of new subscribers was
captured by Bell, followed by Rogers, then TELUS. However, Wind Mobile captured 13.6% of all
new subscribers, only 5.2% less than TELUS, and 8% less than the average of the three national
carriers. The recently launched Mobilicity is expected to add 60,000 new subscribers in the final
quarter of 2010, or 9.6% of all net adds. Mobilicity is followed by Videotron at 6.4%, and Public
Mobile at 4.0% share of all new subscribers.
Figure 22: Share of national net subscriber additions (%), Q4 201049
In terms of full-year results for 2010, the dispersion of net subscriber additions is less even than
on the quarterly basis, which is largely due to the fact that Mobilicity and Public Mobile were
not offering service for all of 2010. The three national wireless providers captured 78.2% of the
net subscriber additions, roughly 7% less than their three year average from 2007 to 2010.
Furthermore, the percentage of net additions captured by the national wireless providers is
projected to decline by roughly 15% in the coming years.
49
Source: RBC Capital Markets.
23.7%
22.4%
18.8%
1.4%
6.4%
13.6%
9.6% 4.0%
Bell Rogers Telus MTS/Sask Videotron Wind Mobilicity Public Mobile
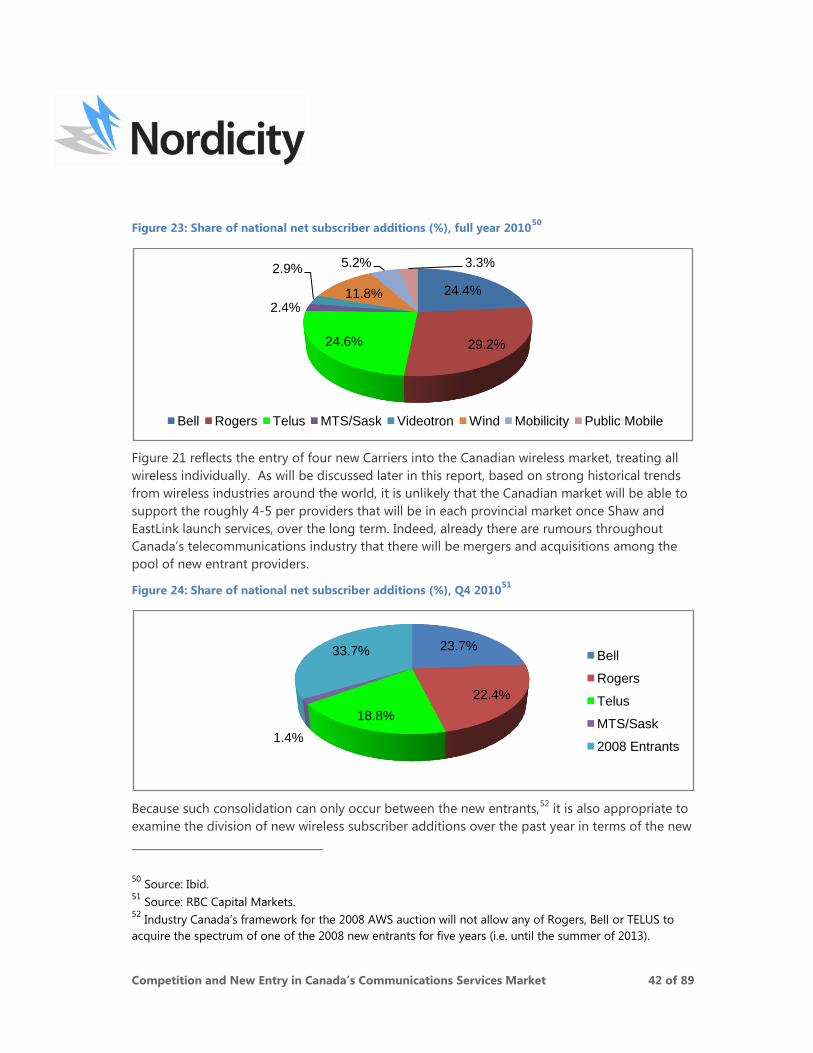
Competition and New Entry in Canada’s Communications Services Market 42 of 89
Figure 23: Share of national net subscriber additions (%), full year 201050
Figure 21 reflects the entry of four new Carriers into the Canadian wireless market, treating all
wireless individually. As will be discussed later in this report, based on strong historical trends
from wireless industries around the world, it is unlikely that the Canadian market will be able to
support the roughly 4-5 per providers that will be in each provincial market once Shaw and
EastLink launch services, over the long term. Indeed, already there are rumours throughout
Canada‟s telecommunications industry that there will be mergers and acquisitions among the
pool of new entrant providers.
Figure 24: Share of national net subscriber additions (%), Q4 201051
Because such consolidation can only occur between the new entrants,52
it is also appropriate to
examine the division of new wireless subscriber additions over the past year in terms of the new
50
Source: Ibid. 51
Source: RBC Capital Markets. 52
Industry Canada‟s framework for the 2008 AWS auction will not allow any of Rogers, Bell or TELUS to
acquire the spectrum of one of the 2008 new entrants for five years (i.e. until the summer of 2013).
24.4%
29.2%24.6%
2.4%
2.9%
11.8%
5.2% 3.3%
Bell Rogers Telus MTS/Sask Videotron Wind Mobilicity Public Mobile
23.7%
22.4%
18.8%
1.4%
33.7% Bell
Rogers
Telus
MTS/Sask
2008 Entrants
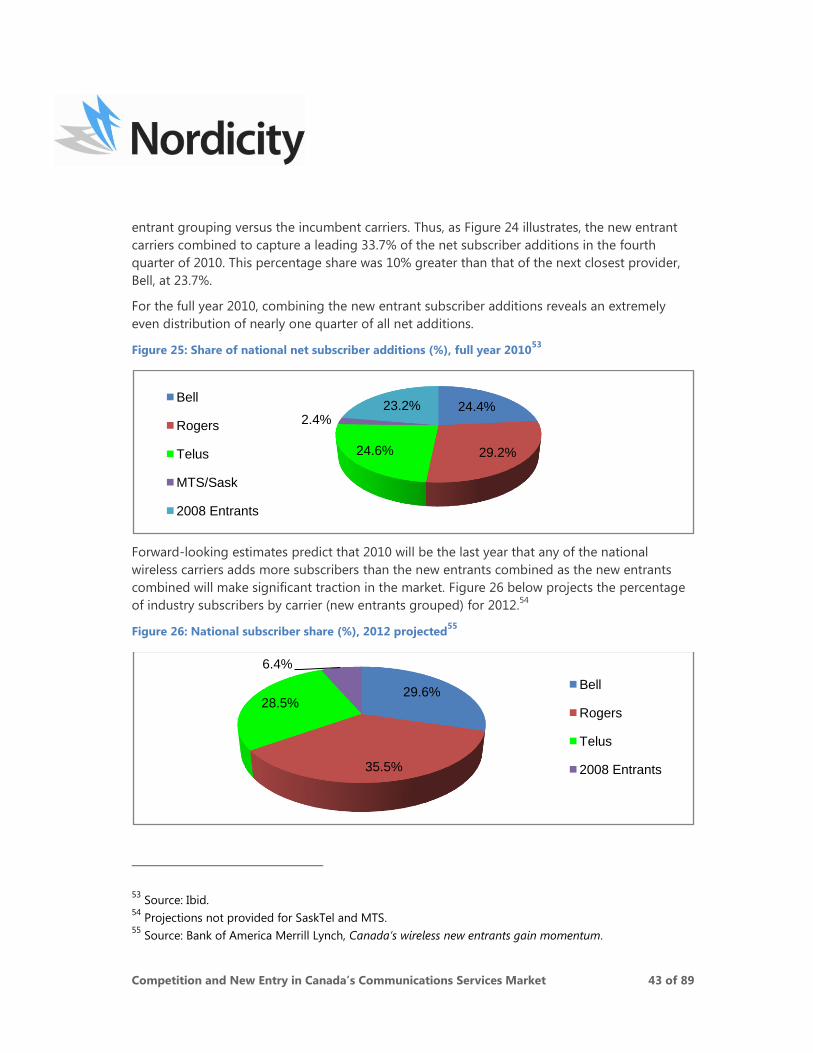
Competition and New Entry in Canada’s Communications Services Market 43 of 89
entrant grouping versus the incumbent carriers. Thus, as Figure 24 illustrates, the new entrant
carriers combined to capture a leading 33.7% of the net subscriber additions in the fourth
quarter of 2010. This percentage share was 10% greater than that of the next closest provider,
Bell, at 23.7%.
For the full year 2010, combining the new entrant subscriber additions reveals an extremely
even distribution of nearly one quarter of all net additions.
Figure 25: Share of national net subscriber additions (%), full year 201053
Forward-looking estimates predict that 2010 will be the last year that any of the national
wireless carriers adds more subscribers than the new entrants combined as the new entrants
combined will make significant traction in the market. Figure 26 below projects the percentage
of industry subscribers by carrier (new entrants grouped) for 2012.54
Figure 26: National subscriber share (%), 2012 projected55
53
Source: Ibid. 54
Projections not provided for SaskTel and MTS. 55
Source: Bank of America Merrill Lynch, Canada’s wireless new entrants gain momentum.
24.4%
29.2%24.6%
2.4%23.2%
Bell
Rogers
Telus
MTS/Sask
2008 Entrants
29.6%
35.5%
28.5%
6.4%
Bell
Rogers
Telus
2008 Entrants
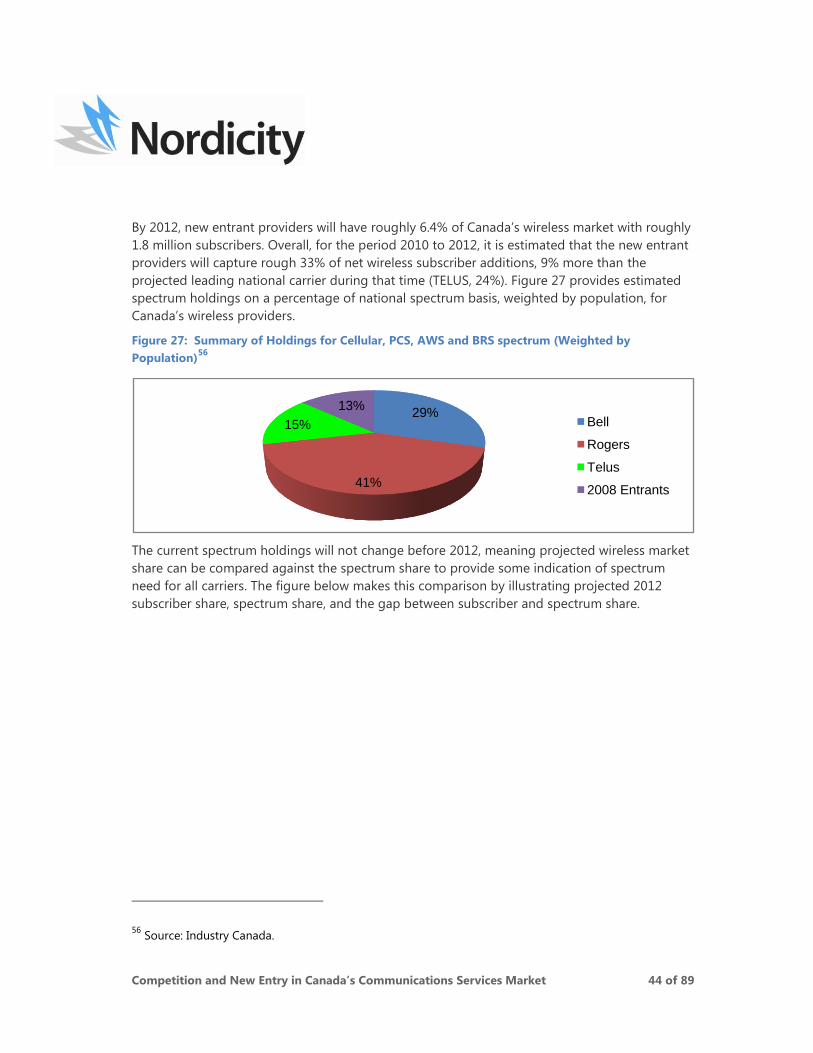
Competition and New Entry in Canada’s Communications Services Market 44 of 89
By 2012, new entrant providers will have roughly 6.4% of Canada‟s wireless market with roughly
1.8 million subscribers. Overall, for the period 2010 to 2012, it is estimated that the new entrant
providers will capture rough 33% of net wireless subscriber additions, 9% more than the
projected leading national carrier during that time (TELUS, 24%). Figure 27 provides estimated
spectrum holdings on a percentage of national spectrum basis, weighted by population, for
Canada‟s wireless providers.
Figure 27: Summary of Holdings for Cellular, PCS, AWS and BRS spectrum (Weighted by
Population)56
The current spectrum holdings will not change before 2012, meaning projected wireless market
share can be compared against the spectrum share to provide some indication of spectrum
need for all carriers. The figure below makes this comparison by illustrating projected 2012
subscriber share, spectrum share, and the gap between subscriber and spectrum share.
56
Source: Industry Canada.
29%
41%
15%
13%
Bell
Rogers
Telus
2008 Entrants
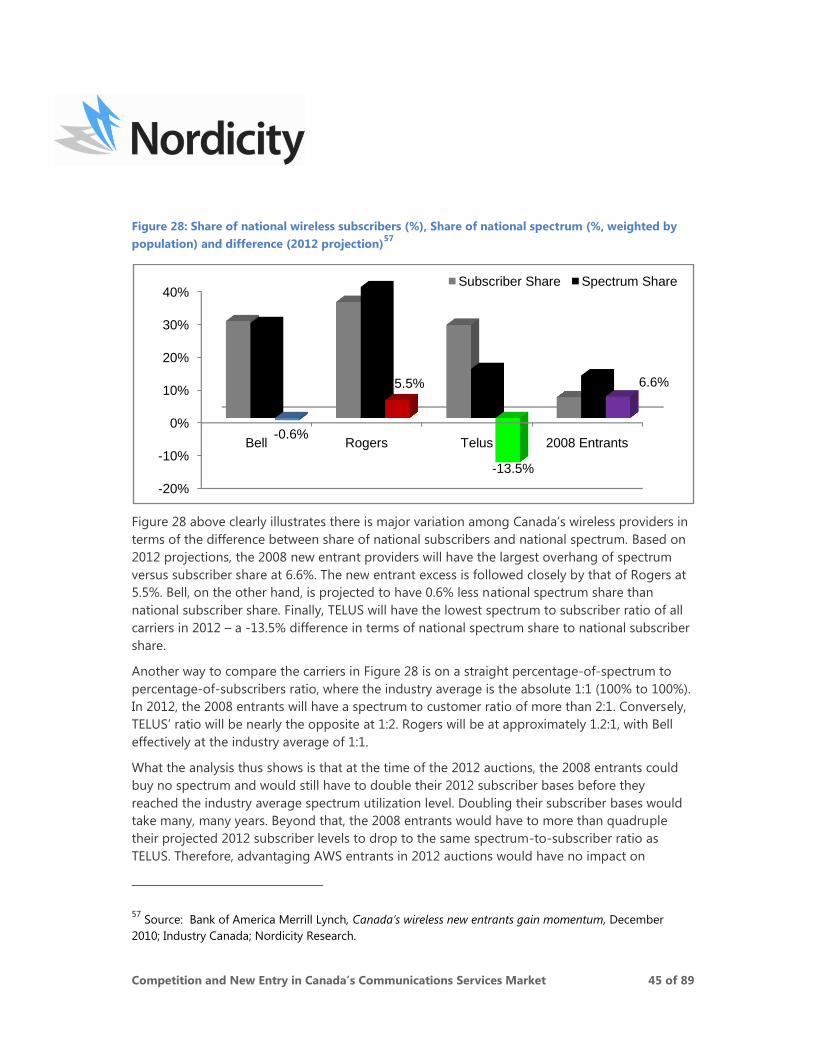
Competition and New Entry in Canada’s Communications Services Market 45 of 89
Figure 28: Share of national wireless subscribers (%), Share of national spectrum (%, weighted by
population) and difference (2012 projection)57
Figure 28 above clearly illustrates there is major variation among Canada‟s wireless providers in
terms of the difference between share of national subscribers and national spectrum. Based on
2012 projections, the 2008 new entrant providers will have the largest overhang of spectrum
versus subscriber share at 6.6%. The new entrant excess is followed closely by that of Rogers at
5.5%. Bell, on the other hand, is projected to have 0.6% less national spectrum share than
national subscriber share. Finally, TELUS will have the lowest spectrum to subscriber ratio of all
carriers in 2012 – a -13.5% difference in terms of national spectrum share to national subscriber
share.
Another way to compare the carriers in Figure 28 is on a straight percentage-of-spectrum to
percentage-of-subscribers ratio, where the industry average is the absolute 1:1 (100% to 100%).
In 2012, the 2008 entrants will have a spectrum to customer ratio of more than 2:1. Conversely,
TELUS‟ ratio will be nearly the opposite at 1:2. Rogers will be at approximately 1.2:1, with Bell
effectively at the industry average of 1:1.
What the analysis thus shows is that at the time of the 2012 auctions, the 2008 entrants could
buy no spectrum and would still have to double their 2012 subscriber bases before they
reached the industry average spectrum utilization level. Doubling their subscriber bases would
take many, many years. Beyond that, the 2008 entrants would have to more than quadruple
their projected 2012 subscriber levels to drop to the same spectrum-to-subscriber ratio as
TELUS. Therefore, advantaging AWS entrants in 2012 auctions would have no impact on
57
Source: Bank of America Merrill Lynch, Canada’s wireless new entrants gain momentum, December
2010; Industry Canada; Nordicity Research.
-20%
-10%
0%
10%
20%
30%
40%
Bell Rogers Telus 2008 Entrants-0.6%
5.5%
-13.5%
6.6%
Subscriber Share Spectrum Share
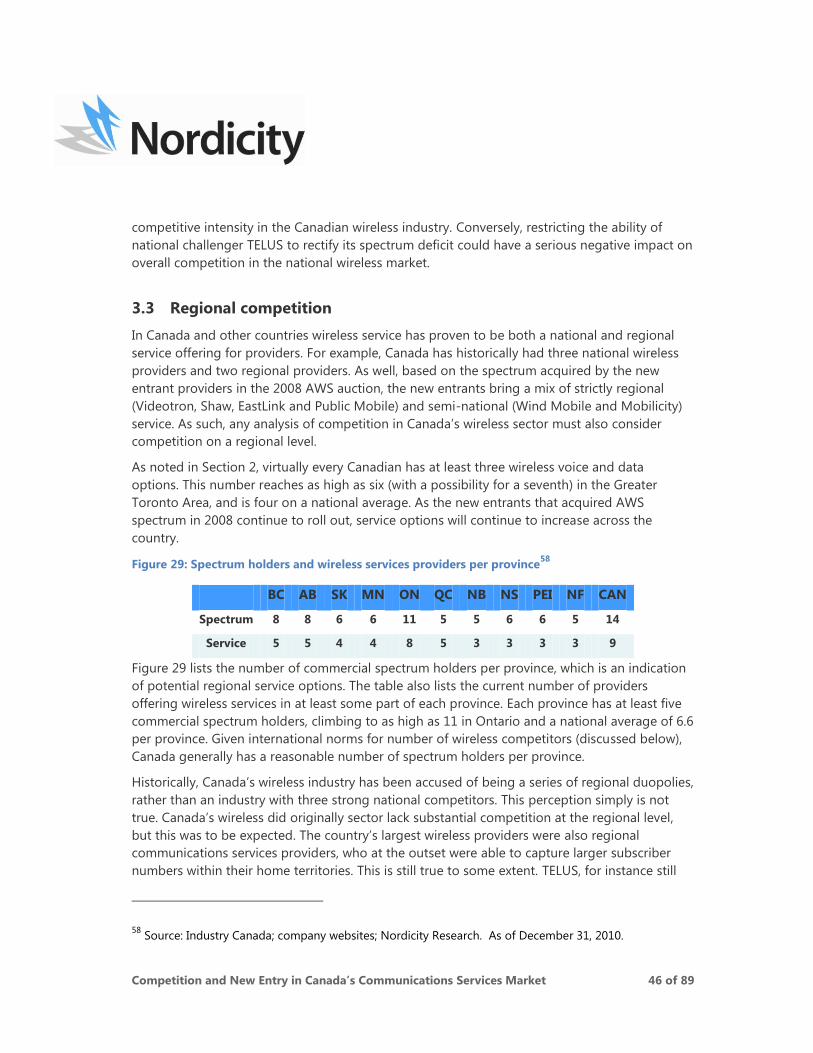
Competition and New Entry in Canada’s Communications Services Market 46 of 89
competitive intensity in the Canadian wireless industry. Conversely, restricting the ability of
national challenger TELUS to rectify its spectrum deficit could have a serious negative impact on
overall competition in the national wireless market.
3.3 Regional competition
In Canada and other countries wireless service has proven to be both a national and regional
service offering for providers. For example, Canada has historically had three national wireless
providers and two regional providers. As well, based on the spectrum acquired by the new
entrant providers in the 2008 AWS auction, the new entrants bring a mix of strictly regional
(Videotron, Shaw, EastLink and Public Mobile) and semi-national (Wind Mobile and Mobilicity)
service. As such, any analysis of competition in Canada‟s wireless sector must also consider
competition on a regional level.
As noted in Section 2, virtually every Canadian has at least three wireless voice and data
options. This number reaches as high as six (with a possibility for a seventh) in the Greater
Toronto Area, and is four on a national average. As the new entrants that acquired AWS
spectrum in 2008 continue to roll out, service options will continue to increase across the
country.
Figure 29: Spectrum holders and wireless services providers per province58
BC AB SK MN ON QC NB NS PEI NF CAN
Spectrum 8 8 6 6 11 5 5 6 6 5 14
Service 5 5 4 4 8 5 3 3 3 3 9
Figure 29 lists the number of commercial spectrum holders per province, which is an indication
of potential regional service options. The table also lists the current number of providers
offering wireless services in at least some part of each province. Each province has at least five
commercial spectrum holders, climbing to as high as 11 in Ontario and a national average of 6.6
per province. Given international norms for number of wireless competitors (discussed below),
Canada generally has a reasonable number of spectrum holders per province.
Historically, Canada‟s wireless industry has been accused of being a series of regional duopolies,
rather than an industry with three strong national competitors. This perception simply is not
true. Canada‟s wireless did originally sector lack substantial competition at the regional level,
but this was to be expected. The country‟s largest wireless providers were also regional
communications services providers, who at the outset were able to capture larger subscriber
numbers within their home territories. This is still true to some extent. TELUS, for instance still
58
Source: Industry Canada; company websites; Nordicity Research. As of December 31, 2010.
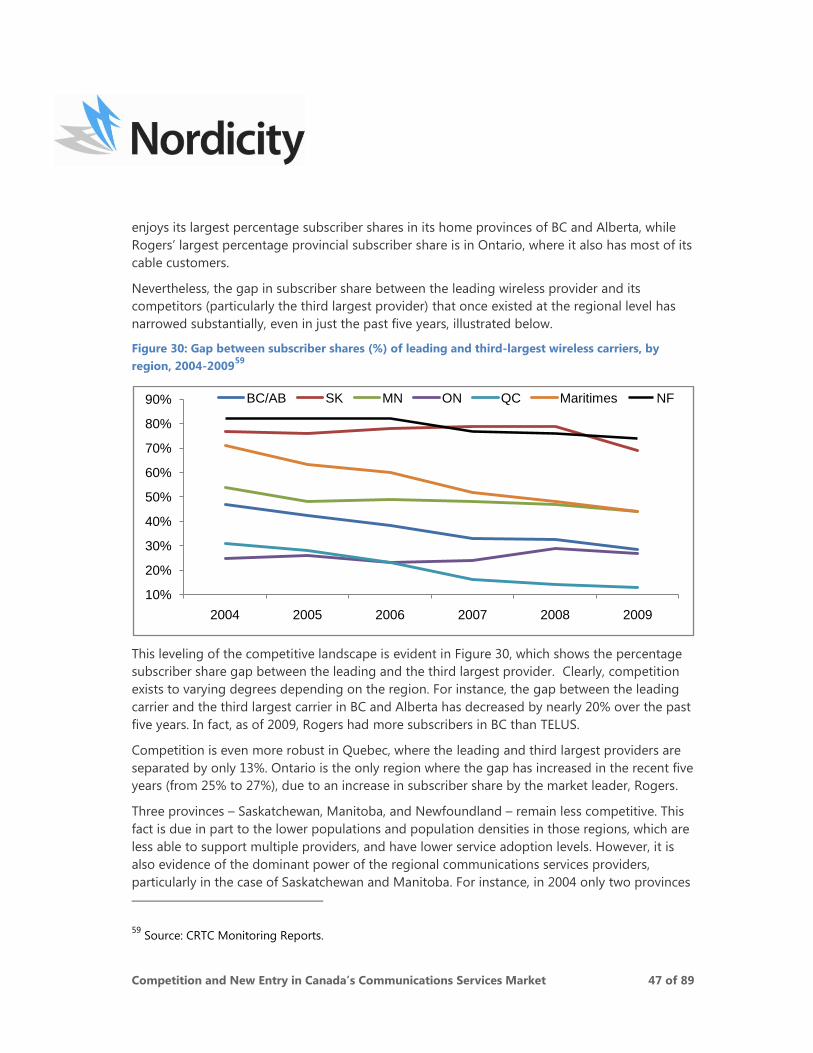
Competition and New Entry in Canada’s Communications Services Market 47 of 89
enjoys its largest percentage subscriber shares in its home provinces of BC and Alberta, while
Rogers‟ largest percentage provincial subscriber share is in Ontario, where it also has most of its
cable customers.
Nevertheless, the gap in subscriber share between the leading wireless provider and its
competitors (particularly the third largest provider) that once existed at the regional level has
narrowed substantially, even in just the past five years, illustrated below.
Figure 30: Gap between subscriber shares (%) of leading and third-largest wireless carriers, by
region, 2004-200959
This leveling of the competitive landscape is evident in Figure 30, which shows the percentage
subscriber share gap between the leading and the third largest provider. Clearly, competition
exists to varying degrees depending on the region. For instance, the gap between the leading
carrier and the third largest carrier in BC and Alberta has decreased by nearly 20% over the past
five years. In fact, as of 2009, Rogers had more subscribers in BC than TELUS.
Competition is even more robust in Quebec, where the leading and third largest providers are
separated by only 13%. Ontario is the only region where the gap has increased in the recent five
years (from 25% to 27%), due to an increase in subscriber share by the market leader, Rogers.
Three provinces – Saskatchewan, Manitoba, and Newfoundland – remain less competitive. This
fact is due in part to the lower populations and population densities in those regions, which are
less able to support multiple providers, and have lower service adoption levels. However, it is
also evidence of the dominant power of the regional communications services providers,
particularly in the case of Saskatchewan and Manitoba. For instance, in 2004 only two provinces
59
Source: CRTC Monitoring Reports.
10%
20%
30%
40%
50%
60%
70%
80%
90%
2004 2005 2006 2007 2008 2009
BC/AB SK MN ON QC Maritimes NF
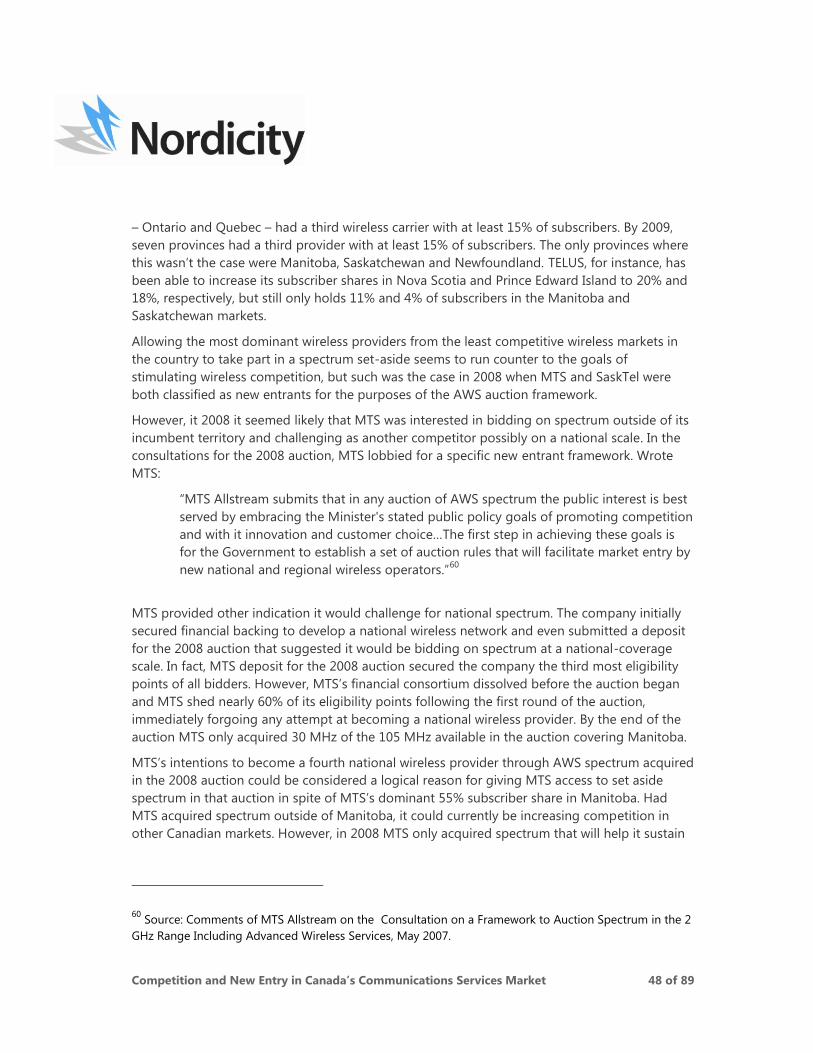
Competition and New Entry in Canada’s Communications Services Market 48 of 89
– Ontario and Quebec – had a third wireless carrier with at least 15% of subscribers. By 2009,
seven provinces had a third provider with at least 15% of subscribers. The only provinces where
this wasn‟t the case were Manitoba, Saskatchewan and Newfoundland. TELUS, for instance, has
been able to increase its subscriber shares in Nova Scotia and Prince Edward Island to 20% and
18%, respectively, but still only holds 11% and 4% of subscribers in the Manitoba and
Saskatchewan markets.
Allowing the most dominant wireless providers from the least competitive wireless markets in
the country to take part in a spectrum set-aside seems to run counter to the goals of
stimulating wireless competition, but such was the case in 2008 when MTS and SaskTel were
both classified as new entrants for the purposes of the AWS auction framework.
However, it 2008 it seemed likely that MTS was interested in bidding on spectrum outside of its
incumbent territory and challenging as another competitor possibly on a national scale. In the
consultations for the 2008 auction, MTS lobbied for a specific new entrant framework. Wrote
MTS:
“MTS Allstream submits that in any auction of AWS spectrum the public interest is best
served by embracing the Minister's stated public policy goals of promoting competition
and with it innovation and customer choice…The first step in achieving these goals is
for the Government to establish a set of auction rules that will facilitate market entry by
new national and regional wireless operators.”60
MTS provided other indication it would challenge for national spectrum. The company initially
secured financial backing to develop a national wireless network and even submitted a deposit
for the 2008 auction that suggested it would be bidding on spectrum at a national-coverage
scale. In fact, MTS deposit for the 2008 auction secured the company the third most eligibility
points of all bidders. However, MTS‟s financial consortium dissolved before the auction began
and MTS shed nearly 60% of its eligibility points following the first round of the auction,
immediately forgoing any attempt at becoming a national wireless provider. By the end of the
auction MTS only acquired 30 MHz of the 105 MHz available in the auction covering Manitoba.
MTS‟s intentions to become a fourth national wireless provider through AWS spectrum acquired
in the 2008 auction could be considered a logical reason for giving MTS access to set aside
spectrum in that auction in spite of MTS‟s dominant 55% subscriber share in Manitoba. Had
MTS acquired spectrum outside of Manitoba, it could currently be increasing competition in
other Canadian markets. However, in 2008 MTS only acquired spectrum that will help it sustain
60
Source: Comments of MTS Allstream on the Consultation on a Framework to Auction Spectrum in the 2
GHz Range Including Advanced Wireless Services, May 2007.
Competition and New Entry in Canada’s Communications Services Market 49 of 89
or increase its dominant position in Manitoba‟s wireless market and did nothing to increase
wireless competition.
TELUS, however, provides one of the best examples of a wireless entrant competing to become
a national carrier. Since becoming a national wireless carrier, TELUS has essentially been a new
entrant in eight of Canada‟s 10 provinces. Over the past five years, TELUS has increased its
subscriber share in these out-of-territory provinces by an average of seven percent, including
highs of 11% in New Brunswick, Nova Scotia and Newfoundland. Figure 31 illustrates this five-
year increase.
Figure 31: TELUS’ subscriber share (%) in out of territory markets, 2004 and 200961
Even without the addition of new entrant subscribers, Canada‟s wireless industry has significant,
and increasing, regional competition, particularly in BC, Alberta, Ontario and Quebec. The
growth of subscriber shares in out-of-territory regions, such as those of Rogers in BC and TELUS
in the Atlantic provinces provides clear evidence that as the wireless market matures,
competition will continue to increase at the regional level. What‟s more, TELUS achieved it
subscriber growth in the provinces profiled above almost entirely without any low band – sub 1
GHz – spectrum,62
demonstrating that major subscriber additions are more than possible
without low-band spectrum.
61
Source: CRTC Monitoring Reports. 62
Outside of BC and Alberta, TELUS only has 850 MHz spectrum in Quebec, covering roughly 75% of
Quebec‟s population.
0%
5%
10%
15%
20%
25%
30%
SK MN ON QC NB PEI NS NF
2004 2009
Competition and New Entry in Canada’s Communications Services Market 50 of 89
3.4 Conclusions
Canada’s wireless sector has significant national and regional competition, and there are
considerable differences in spectrum need amongst the wireless carriers. A number of
indices illustrate the high level of competition in the sector, including:
Rather than equitably sharing the growth in the national wireless market, Canada‟s five
historical wireless providers have competed vigorously for new subscriber additions
over the past five years, with corporate percentage subscriber growth ranging from
55% to 30% over that time;
TELUS‟ emergence as a third national carrier over the past decade has continually
increased competition in the national wireless sector, decreasing the gap between the
percentage of subscribers held by the leading and third largest provider from nearly
15% to 8.9%. As well, a snapshot of the percentage of net subscriber additions captured
by the three national carriers over the past three years shows a very competitive market
share disbursement of 33.2% for TELUS, 29.4% for Rogers and 22.4% for Bell;
Individually, the 2008 wireless entrants providers were estimated to have each captured
13.6% (Wind), 9.6% (Mobilicity), 6.4% (Videotron) and 4% (Public Mobile) of net
subscriber additions in the fourth quarter of 2010;
Collectively, the new entrants captured 33.7% of the net additions in Q4 2010, and
23.2% of the net additions overall for the full year 2010;
It is estimated that by 2012, new entrant providers will have roughly 6.4% of national
wireless subscribers;
With 13% of all national spectrum, new entrant providers will still have the largest
spectrum/subscriber ratio in 2012. Conversely, with an estimated 28.5% of national
subscribers and only 15% of national spectrum, TELUS will continue to have the worst
spectrum/subscriber ratio through 2012;
With an average of 6.6 spectrum holders per province, and a minimum of five per
province, spectrum is currently shared between a significant number of providers on
provincial level;
On a regional basis, the gap in subscriber share between the leading wireless provider
and its competitors (particularly the third largest provider) has narrowed substantially,
even in just the past five years. For instance, the gap in BC and Alberta has decreased
by nearly 20% over the past five years. Competition is even more robust in Quebec,
where the leading and third largest providers are separated by only 13%.
In 2004 only two provinces – Ontario and Quebec – had a third wireless carrier with at
least 15% of subscribers. By 2009, seven provinces had a third provider with at least
Competition and New Entry in Canada’s Communications Services Market 51 of 89
15% of subscribers. The only provinces where this wasn‟t the case are Manitoba,
Saskatchewan and Newfoundland.
Acting as a de facto new entrant in its out-of-territory markets (all provinces other than
BC, Alberta and part of Quebec), TELUS increased its average provincial subscriber
share from 10% to 17% between 2004 and 2009, without any sub-1 GHz spectrum in all
provinces other than Quebec. Outside of Saskatchewan and Manitoba (the two most
difficult provincial markets in which to increase subscriber share), TELUS increased its
average provincial subscriber shares from 11% to 20% between 2004 and 2009.
4. Comparison of International Wireless Sectors
This section demonstrates that: competition in Canada’s wireless industry compares
favourably to that in other international jurisdictions. The analysis accounts for variances in
international usage trends, and compares Canada to other jurisdictions based on:
a. Average revenue per user, per minute;
b. Average revenue per square kilometre of network coverage;
c. Subscriber fees; and
d. Market structures.
Past reports on international wireless services pricing have largely been critical of Canada‟s
wireless industry. Perhaps chief among those reports is the OECD‟s annual review of
international telecommunications services prices. These international price comparisons,
however, can be tenuous. The methodologies used in these studies and the results highlighted
by consumers and the media rarely account for the difference in usage profiles from one
country to another. For instance, Canadian consumers tend to have very high minutes-per-
month usage levels, and therefore appear to pay higher than average prices in these
comparisons. In fact, of the 21 developed wireless markets in the world,63
only the United States
has a higher average minutes-per-month usage rate than Canada.
63
As defined by Bank of America Merrill Lynch.
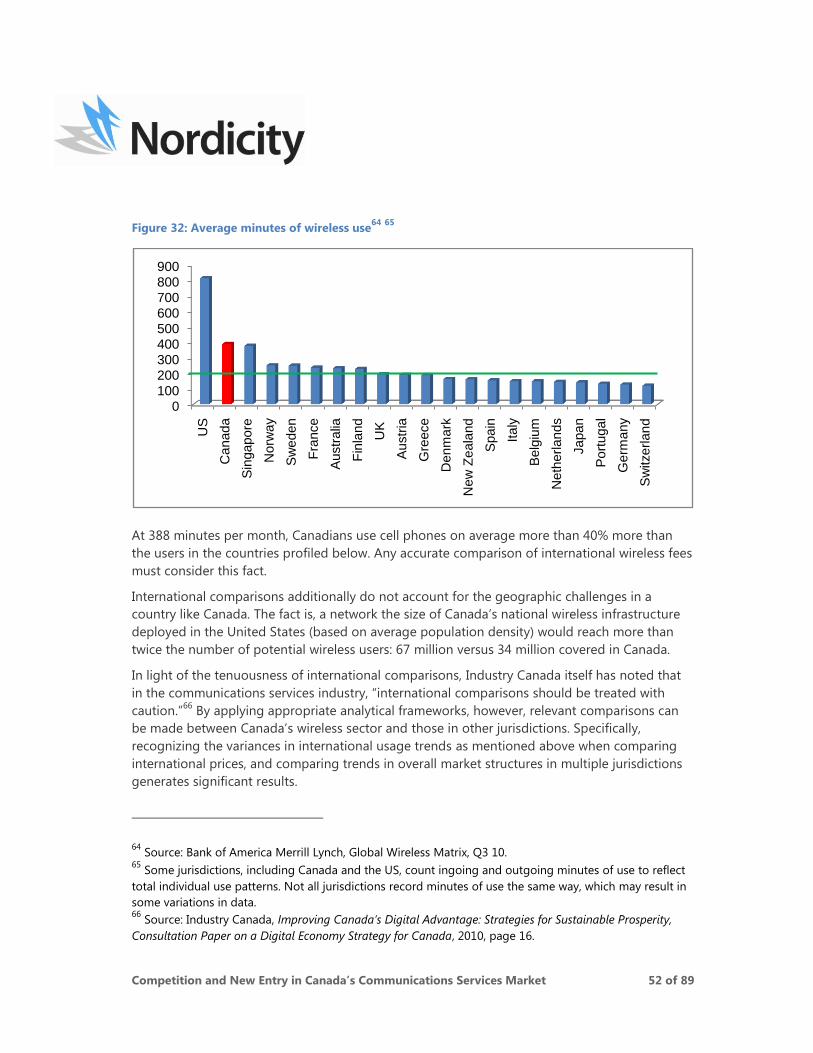
Competition and New Entry in Canada’s Communications Services Market 52 of 89
Figure 32: Average minutes of wireless use64
65
At 388 minutes per month, Canadians use cell phones on average more than 40% more than
the users in the countries profiled below. Any accurate comparison of international wireless fees
must consider this fact.
International comparisons additionally do not account for the geographic challenges in a
country like Canada. The fact is, a network the size of Canada‟s national wireless infrastructure
deployed in the United States (based on average population density) would reach more than
twice the number of potential wireless users: 67 million versus 34 million covered in Canada.
In light of the tenuousness of international comparisons, Industry Canada itself has noted that
in the communications services industry, “international comparisons should be treated with
caution.”66
By applying appropriate analytical frameworks, however, relevant comparisons can
be made between Canada‟s wireless sector and those in other jurisdictions. Specifically,
recognizing the variances in international usage trends as mentioned above when comparing
international prices, and comparing trends in overall market structures in multiple jurisdictions
generates significant results.
64
Source: Bank of America Merrill Lynch, Global Wireless Matrix, Q3 10. 65
Some jurisdictions, including Canada and the US, count ingoing and outgoing minutes of use to reflect
total individual use patterns. Not all jurisdictions record minutes of use the same way, which may result in
some variations in data. 66
Source: Industry Canada, Improving Canada’s Digital Advantage: Strategies for Sustainable Prosperity,
Consultation Paper on a Digital Economy Strategy for Canada, 2010, page 16.
0100
200300
400500
600
700800
900
US
Canada
Sin
gapore
Norw
ay
Sw
eden
Fra
nce
Austr
alia
Fin
land
UK
Austr
ia
Gre
ece
Denm
ark
New
Zeala
nd
Spain
Italy
Belg
ium
Neth
erl
ands
Japan
Port
ugal
Germ
any
Sw
itzerlan
d
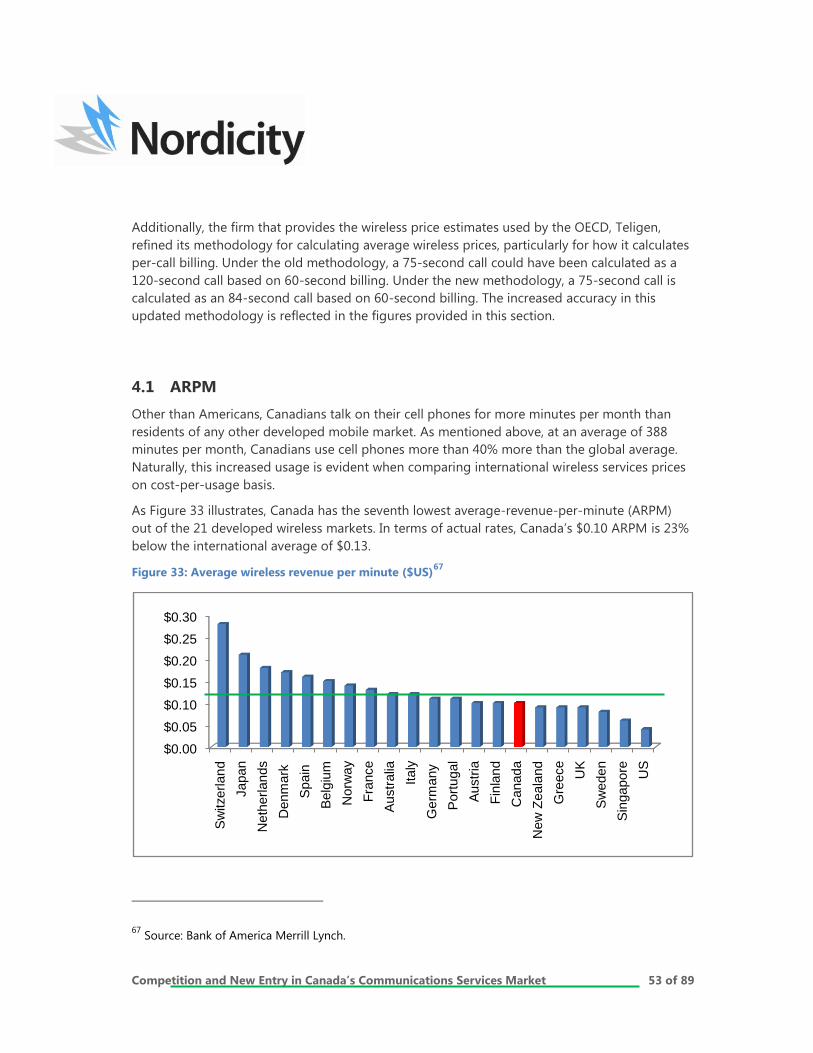
Competition and New Entry in Canada’s Communications Services Market 53 of 89
Additionally, the firm that provides the wireless price estimates used by the OECD, Teligen,
refined its methodology for calculating average wireless prices, particularly for how it calculates
per-call billing. Under the old methodology, a 75-second call could have been calculated as a
120-second call based on 60-second billing. Under the new methodology, a 75-second call is
calculated as an 84-second call based on 60-second billing. The increased accuracy in this
updated methodology is reflected in the figures provided in this section.
4.1 ARPM
Other than Americans, Canadians talk on their cell phones for more minutes per month than
residents of any other developed mobile market. As mentioned above, at an average of 388
minutes per month, Canadians use cell phones more than 40% more than the global average.
Naturally, this increased usage is evident when comparing international wireless services prices
on cost-per-usage basis.
As Figure 33 illustrates, Canada has the seventh lowest average-revenue-per-minute (ARPM)
out of the 21 developed wireless markets. In terms of actual rates, Canada‟s $0.10 ARPM is 23%
below the international average of $0.13.
Figure 33: Average wireless revenue per minute ($US)67
67
Source: Bank of America Merrill Lynch.
$0.00
$0.05
$0.10
$0.15
$0.20
$0.25
$0.30
Sw
itzerlan
d
Japan
Neth
erlands
Denm
ark
Spain
Belg
ium
Norw
ay
Fra
nce
Austr
alia
Italy
Germ
any
Port
ugal
Austr
ia
Fin
land
Canada
New
Zeala
nd
Gre
ece
UK
Sw
eden
Sin
gapore
US
Competition and New Entry in Canada’s Communications Services Market 54 of 89
4.2 ARPkm2
The Canadian wireless carriers willing to expand their networks outside of the major
metropolitan markets face the challenges presented by Canada‟s widely dispersed population.
The revenue-generating potential of the Canadian market on a per-area basis – that is, the
potential return per squared kilometre of deployed wireless network – is among the least
attractive in the world.
Consider that even though only 20% of Canada‟s geographic area needs to be covered to
provide wireless service to more than 99% of Canadians, the population density within the
wireless network – 16.9 people/km2 – would still rank as the 200
th lowest in the world, ahead of
only 38 other countries. In terms of wireless subscribers, there are currently roughly 12 wireless
subscribers per square kilometre of network in Canada. The wireless markets with which Canada
is most often compared – the US and the UK – currently have 30 and 331 subscribers per square
kilometre, respectively.
Population density has a major impact on the ability to generate revenue from a given segment
of a wireless network. Figure 34 illustrates this impact by displaying average monthly revenue
per square kilometre of wireless network.68
The figure clearly conveys the vast differences between international wireless markets. At an
average of $674.70 in total wireless revenue and $509.40 in voice revenue, Canada only ranks
ahead of Australia in revenue per square kilometre. The US market generates nearly 3 times as
much revenue per square kilometre than Canada, and the UK market nearly 14 times more.
68
Canada, Australia, New Zealand and the US were adjusted to account for the geographic coverage of
the wireless networks: Canada – 20% of geographic area; New Zealand – 40%; Australia 25%; Contiguous
United States.
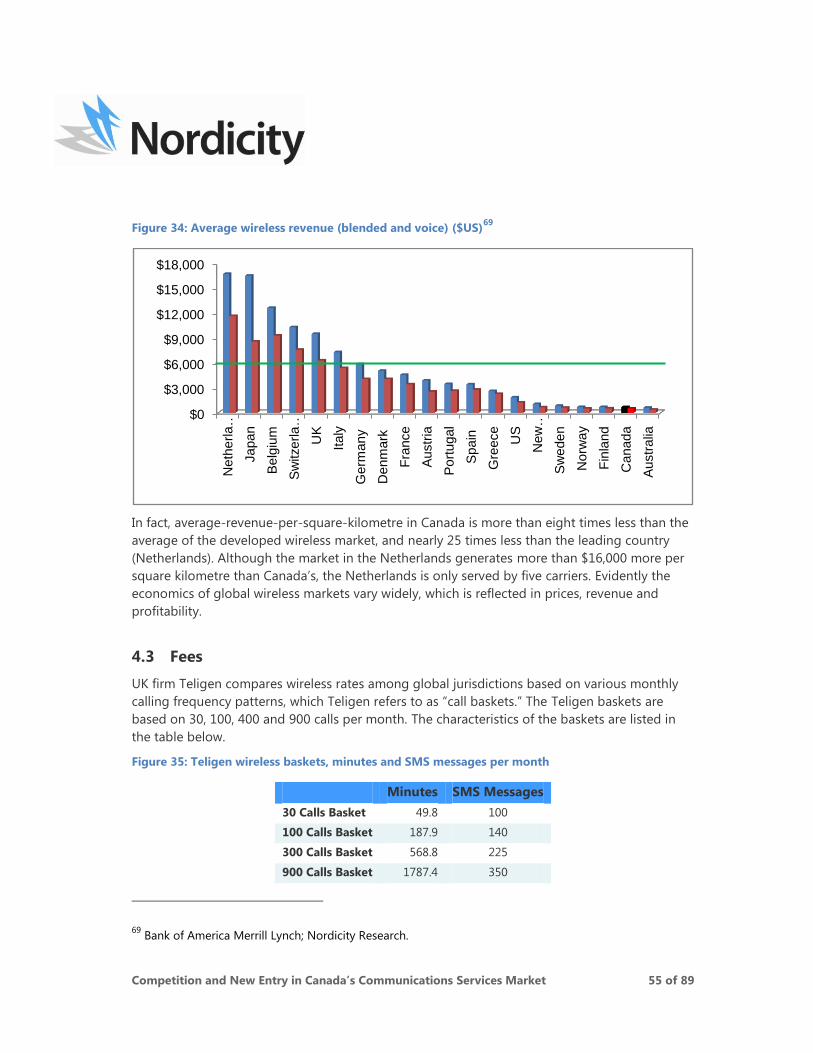
Competition and New Entry in Canada’s Communications Services Market 55 of 89
Figure 34: Average wireless revenue (blended and voice) ($US)69
In fact, average-revenue-per-square-kilometre in Canada is more than eight times less than the
average of the developed wireless market, and nearly 25 times less than the leading country
(Netherlands). Although the market in the Netherlands generates more than $16,000 more per
square kilometre than Canada‟s, the Netherlands is only served by five carriers. Evidently the
economics of global wireless markets vary widely, which is reflected in prices, revenue and
profitability.
4.3 Fees
UK firm Teligen compares wireless rates among global jurisdictions based on various monthly
calling frequency patterns, which Teligen refers to as “call baskets.” The Teligen baskets are
based on 30, 100, 400 and 900 calls per month. The characteristics of the baskets are listed in
the table below.
Figure 35: Teligen wireless baskets, minutes and SMS messages per month
Minutes SMS Messages
30 Calls Basket 49.8 100
100 Calls Basket 187.9 140
300 Calls Basket 568.8 225
900 Calls Basket 1787.4 350
69
Bank of America Merrill Lynch; Nordicity Research.
$0
$3,000
$6,000
$9,000
$12,000
$15,000
$18,000
Neth
erla
…
Japan
Belg
ium
Sw
itzerla
…
UK
Italy
Ge
rma
ny
Denm
ark
Fra
nce
Austr
ia
Port
ugal
Spain
Gre
ece
US
New
…
Sw
eden
Norw
ay
Fin
land
Canada
Austr
alia
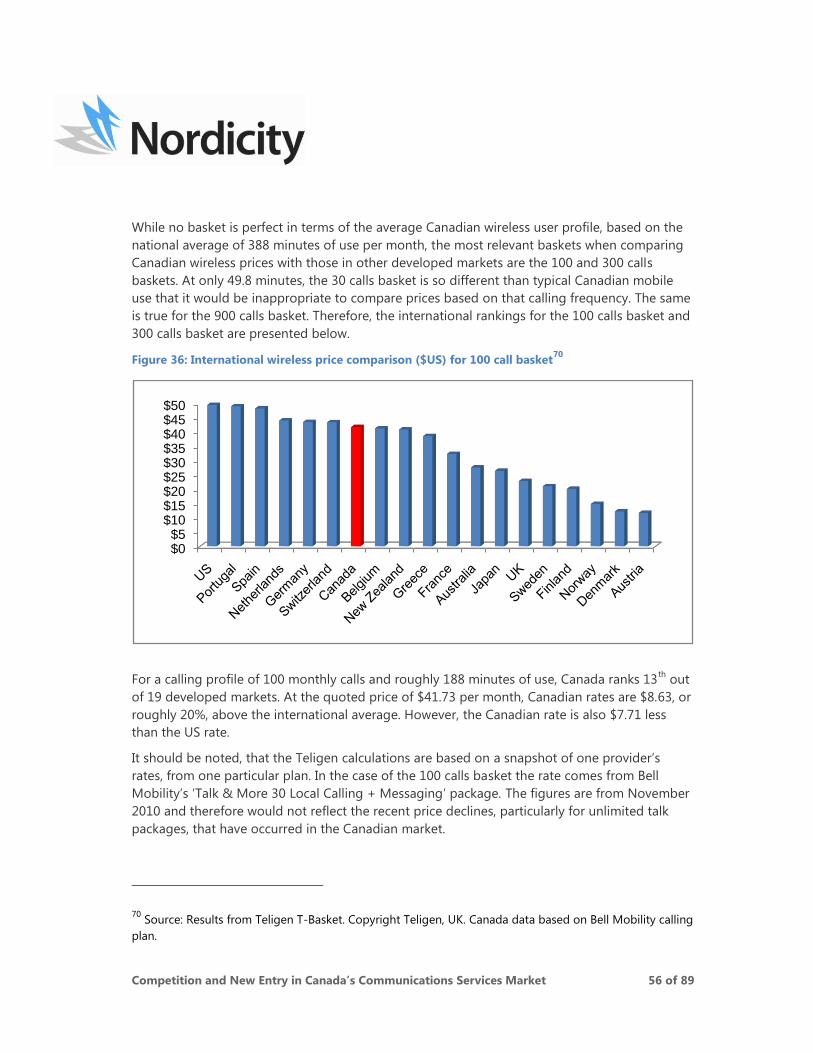
Competition and New Entry in Canada’s Communications Services Market 56 of 89
While no basket is perfect in terms of the average Canadian wireless user profile, based on the
national average of 388 minutes of use per month, the most relevant baskets when comparing
Canadian wireless prices with those in other developed markets are the 100 and 300 calls
baskets. At only 49.8 minutes, the 30 calls basket is so different than typical Canadian mobile
use that it would be inappropriate to compare prices based on that calling frequency. The same
is true for the 900 calls basket. Therefore, the international rankings for the 100 calls basket and
300 calls basket are presented below.
Figure 36: International wireless price comparison ($US) for 100 call basket70
For a calling profile of 100 monthly calls and roughly 188 minutes of use, Canada ranks 13th
out
of 19 developed markets. At the quoted price of $41.73 per month, Canadian rates are $8.63, or
roughly 20%, above the international average. However, the Canadian rate is also $7.71 less
than the US rate.
It should be noted, that the Teligen calculations are based on a snapshot of one provider‟s
rates, from one particular plan. In the case of the 100 calls basket the rate comes from Bell
Mobility‟s „Talk & More 30 Local Calling + Messaging‟ package. The figures are from November
2010 and therefore would not reflect the recent price declines, particularly for unlimited talk
packages, that have occurred in the Canadian market.
70
Source: Results from Teligen T-Basket. Copyright Teligen, UK. Canada data based on Bell Mobility calling
plan.
$0$5
$10$15$20$25$30$35$40$45$50
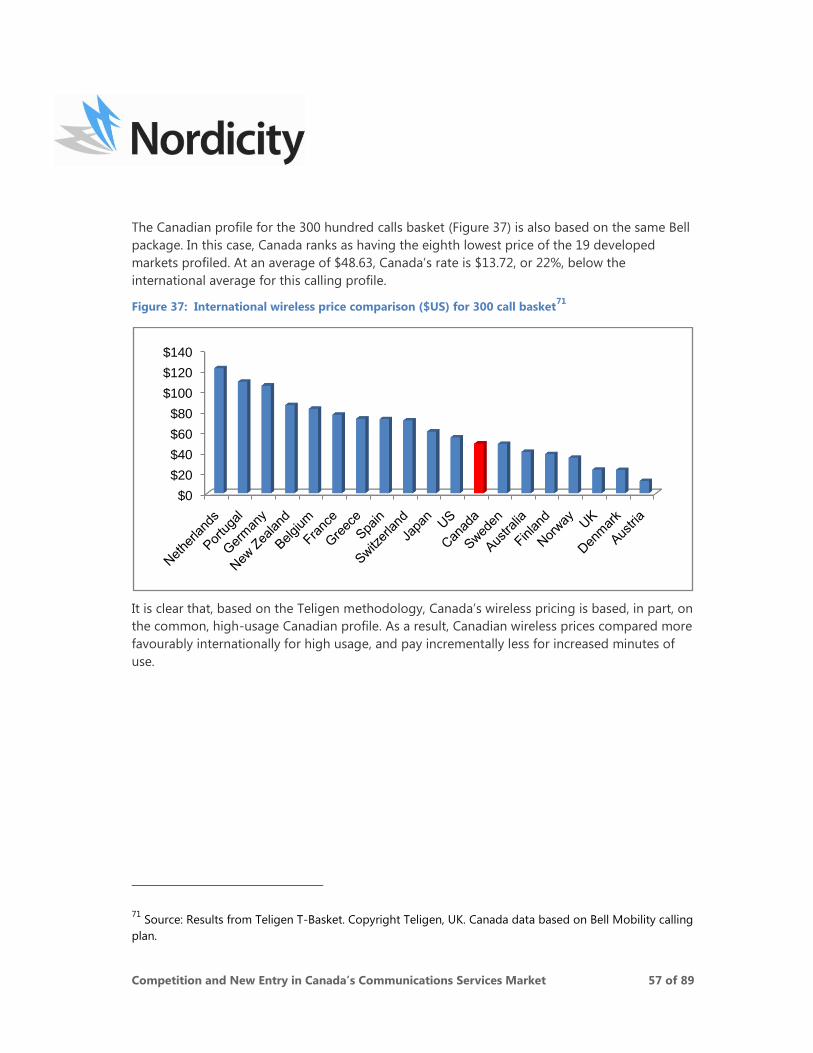
Competition and New Entry in Canada’s Communications Services Market 57 of 89
The Canadian profile for the 300 hundred calls basket (Figure 37) is also based on the same Bell
package. In this case, Canada ranks as having the eighth lowest price of the 19 developed
markets profiled. At an average of $48.63, Canada‟s rate is $13.72, or 22%, below the
international average for this calling profile.
Figure 37: International wireless price comparison ($US) for 300 call basket71
It is clear that, based on the Teligen methodology, Canada‟s wireless pricing is based, in part, on
the common, high-usage Canadian profile. As a result, Canadian wireless prices compared more
favourably internationally for high usage, and pay incrementally less for increased minutes of
use.
71
Source: Results from Teligen T-Basket. Copyright Teligen, UK. Canada data based on Bell Mobility calling
plan.
$0
$20
$40
$60
$80
$100
$120
$140
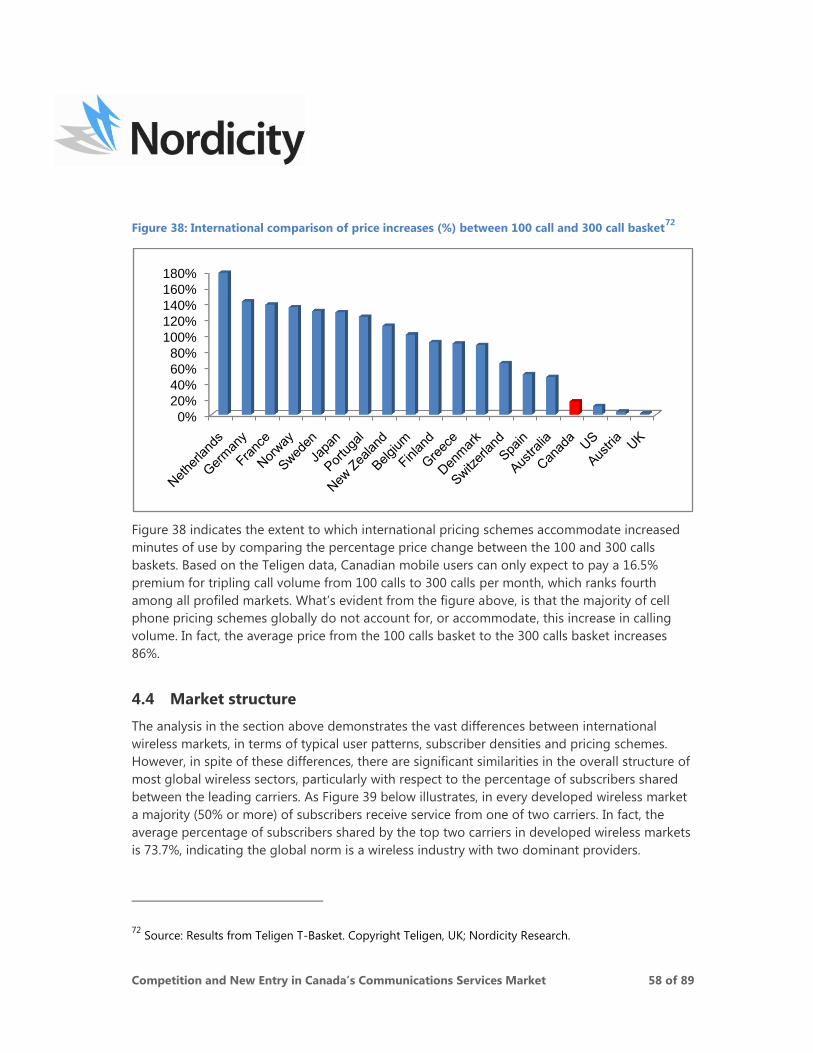
Competition and New Entry in Canada’s Communications Services Market 58 of 89
Figure 38: International comparison of price increases (%) between 100 call and 300 call basket72
Figure 38 indicates the extent to which international pricing schemes accommodate increased
minutes of use by comparing the percentage price change between the 100 and 300 calls
baskets. Based on the Teligen data, Canadian mobile users can only expect to pay a 16.5%
premium for tripling call volume from 100 calls to 300 calls per month, which ranks fourth
among all profiled markets. What‟s evident from the figure above, is that the majority of cell
phone pricing schemes globally do not account for, or accommodate, this increase in calling
volume. In fact, the average price from the 100 calls basket to the 300 calls basket increases
86%.
4.4 Market structure
The analysis in the section above demonstrates the vast differences between international
wireless markets, in terms of typical user patterns, subscriber densities and pricing schemes.
However, in spite of these differences, there are significant similarities in the overall structure of
most global wireless sectors, particularly with respect to the percentage of subscribers shared
between the leading carriers. As Figure 39 below illustrates, in every developed wireless market
a majority (50% or more) of subscribers receive service from one of two carriers. In fact, the
average percentage of subscribers shared by the top two carriers in developed wireless markets
is 73.7%, indicating the global norm is a wireless industry with two dominant providers.
72
Source: Results from Teligen T-Basket. Copyright Teligen, UK; Nordicity Research.
0%
20%
40%
60%
80%
100%
120%
140%
160%
180%
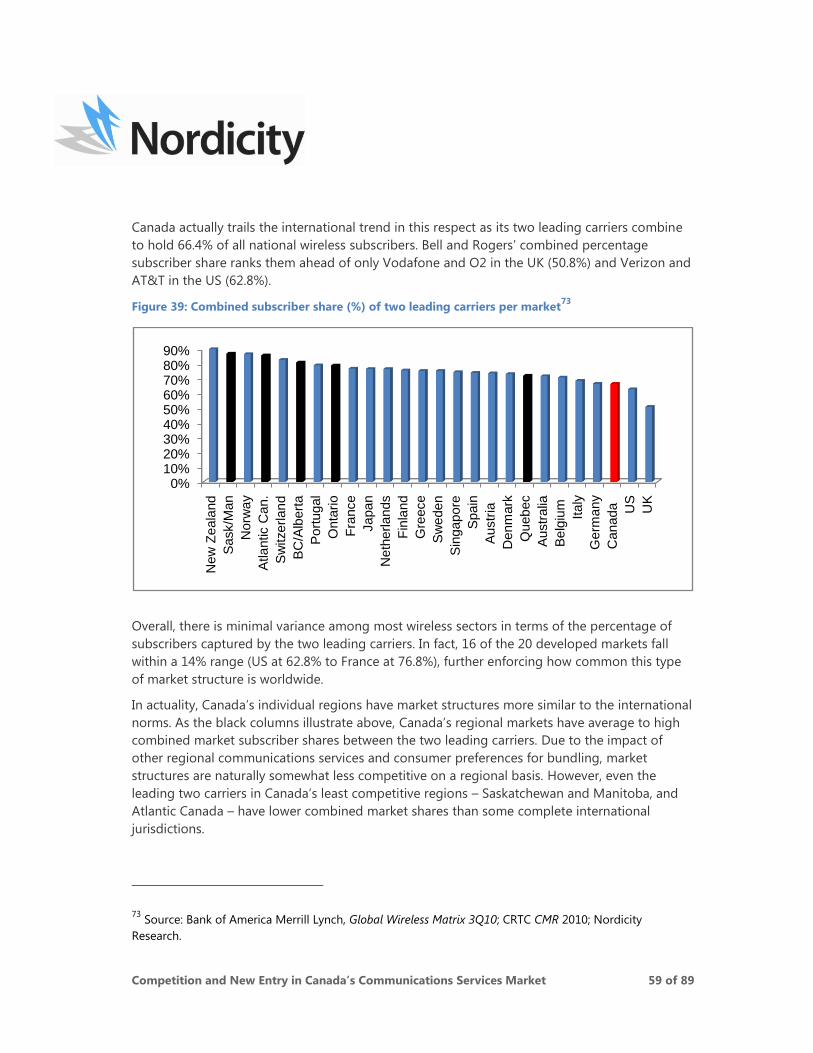
Competition and New Entry in Canada’s Communications Services Market 59 of 89
Canada actually trails the international trend in this respect as its two leading carriers combine
to hold 66.4% of all national wireless subscribers. Bell and Rogers‟ combined percentage
subscriber share ranks them ahead of only Vodafone and O2 in the UK (50.8%) and Verizon and
AT&T in the US (62.8%).
Figure 39: Combined subscriber share (%) of two leading carriers per market73
Overall, there is minimal variance among most wireless sectors in terms of the percentage of
subscribers captured by the two leading carriers. In fact, 16 of the 20 developed markets fall
within a 14% range (US at 62.8% to France at 76.8%), further enforcing how common this type
of market structure is worldwide.
In actuality, Canada‟s individual regions have market structures more similar to the international
norms. As the black columns illustrate above, Canada‟s regional markets have average to high
combined market subscriber shares between the two leading carriers. Due to the impact of
other regional communications services and consumer preferences for bundling, market
structures are naturally somewhat less competitive on a regional basis. However, even the
leading two carriers in Canada‟s least competitive regions – Saskatchewan and Manitoba, and
Atlantic Canada – have lower combined market shares than some complete international
jurisdictions.
73
Source: Bank of America Merrill Lynch, Global Wireless Matrix 3Q10; CRTC CMR 2010; Nordicity
Research.
0%10%20%30%40%50%60%70%80%90%
New
Zeala
nd
Sask/M
an
Norw
ay
Atlantic C
an.
Sw
itzerlan
d
BC
/Alb
ert
a
Port
ugal
Onta
rio
Fra
nce
Japan
Neth
erlands
Fin
land
Gre
ece
Sw
eden
Sin
gapore
Spain
Austr
ia
Denm
ark
Quebec
Austr
alia
Belg
ium
Italy
Germ
any
Canada
US
UK
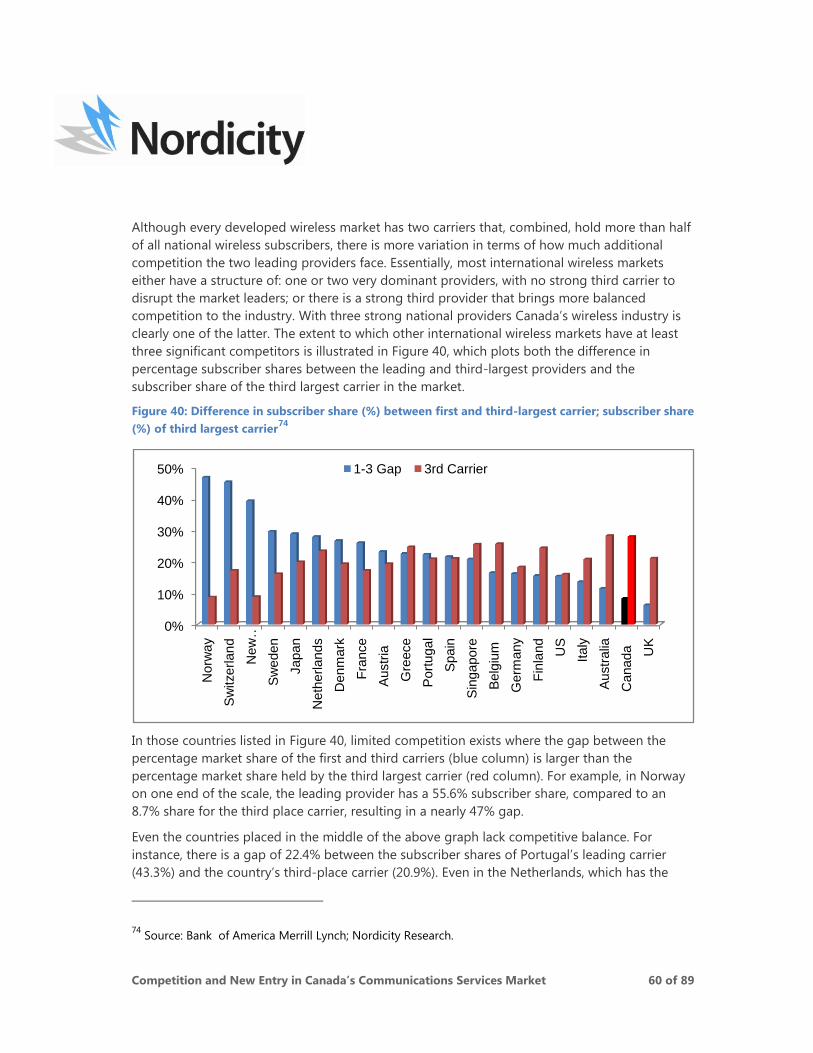
Competition and New Entry in Canada’s Communications Services Market 60 of 89
Although every developed wireless market has two carriers that, combined, hold more than half
of all national wireless subscribers, there is more variation in terms of how much additional
competition the two leading providers face. Essentially, most international wireless markets
either have a structure of: one or two very dominant providers, with no strong third carrier to
disrupt the market leaders; or there is a strong third provider that brings more balanced
competition to the industry. With three strong national providers Canada‟s wireless industry is
clearly one of the latter. The extent to which other international wireless markets have at least
three significant competitors is illustrated in Figure 40, which plots both the difference in
percentage subscriber shares between the leading and third-largest providers and the
subscriber share of the third largest carrier in the market.
Figure 40: Difference in subscriber share (%) between first and third-largest carrier; subscriber share
(%) of third largest carrier74
In those countries listed in Figure 40, limited competition exists where the gap between the
percentage market share of the first and third carriers (blue column) is larger than the
percentage market share held by the third largest carrier (red column). For example, in Norway
on one end of the scale, the leading provider has a 55.6% subscriber share, compared to an
8.7% share for the third place carrier, resulting in a nearly 47% gap.
Even the countries placed in the middle of the above graph lack competitive balance. For
instance, there is a gap of 22.4% between the subscriber shares of Portugal‟s leading carrier
(43.3%) and the country‟s third-place carrier (20.9%). Even in the Netherlands, which has the
74
Source: Bank of America Merrill Lynch; Nordicity Research.
0%
10%
20%
30%
40%
50%
Norw
ay
Sw
itzerlan
d
New
…
Sw
eden
Japan
Neth
erlands
Denm
ark
Fra
nce
Austr
ia
Gre
ece
Port
uga
l
Spain
Sin
gapore
Belg
ium
Germ
any
Fin
land
US
Italy
Austr
alia
Canada
UK
1-3 Gap 3rd Carrier
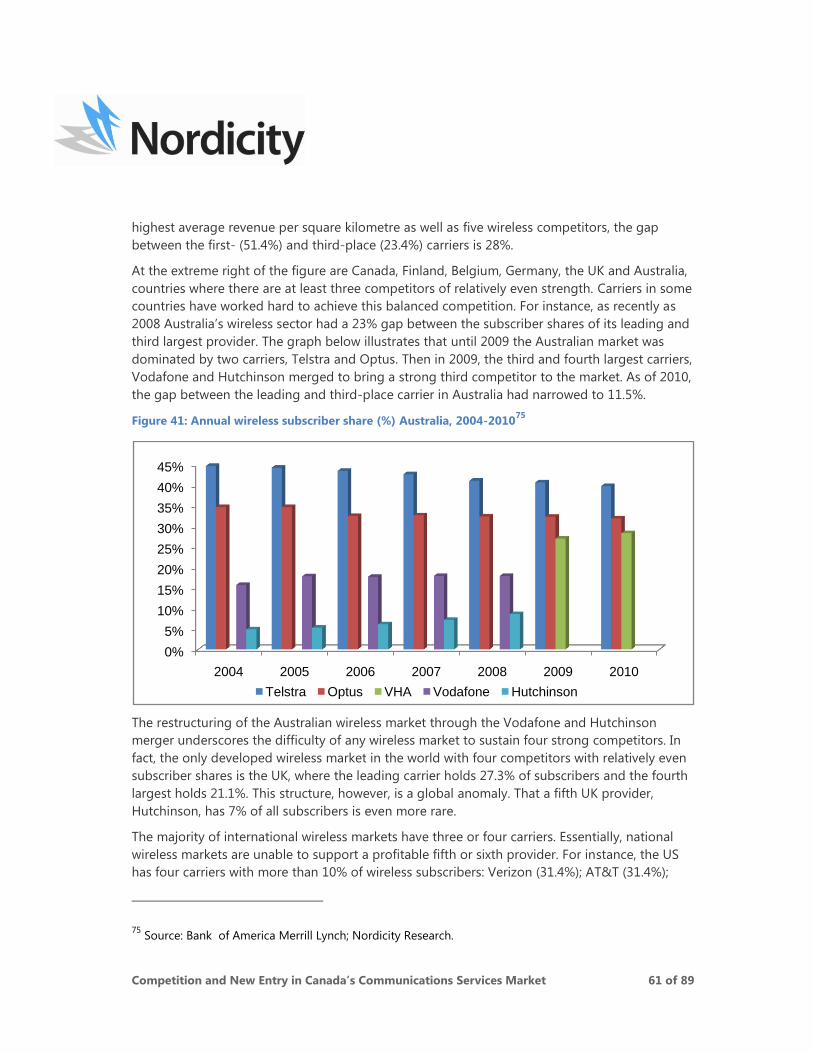
Competition and New Entry in Canada’s Communications Services Market 61 of 89
highest average revenue per square kilometre as well as five wireless competitors, the gap
between the first- (51.4%) and third-place (23.4%) carriers is 28%.
At the extreme right of the figure are Canada, Finland, Belgium, Germany, the UK and Australia,
countries where there are at least three competitors of relatively even strength. Carriers in some
countries have worked hard to achieve this balanced competition. For instance, as recently as
2008 Australia‟s wireless sector had a 23% gap between the subscriber shares of its leading and
third largest provider. The graph below illustrates that until 2009 the Australian market was
dominated by two carriers, Telstra and Optus. Then in 2009, the third and fourth largest carriers,
Vodafone and Hutchinson merged to bring a strong third competitor to the market. As of 2010,
the gap between the leading and third-place carrier in Australia had narrowed to 11.5%.
Figure 41: Annual wireless subscriber share (%) Australia, 2004-201075
The restructuring of the Australian wireless market through the Vodafone and Hutchinson
merger underscores the difficulty of any wireless market to sustain four strong competitors. In
fact, the only developed wireless market in the world with four competitors with relatively even
subscriber shares is the UK, where the leading carrier holds 27.3% of subscribers and the fourth
largest holds 21.1%. This structure, however, is a global anomaly. That a fifth UK provider,
Hutchinson, has 7% of all subscribers is even more rare.
The majority of international wireless markets have three or four carriers. Essentially, national
wireless markets are unable to support a profitable fifth or sixth provider. For instance, the US
has four carriers with more than 10% of wireless subscribers: Verizon (31.4%); AT&T (31.4%);
75
Source: Bank of America Merrill Lynch; Nordicity Research.
0%
5%
10%
15%
20%
25%
30%
35%
40%
45%
2004 2005 2006 2007 2008 2009 2010
Telstra Optus VHA Vodafone Hutchinson
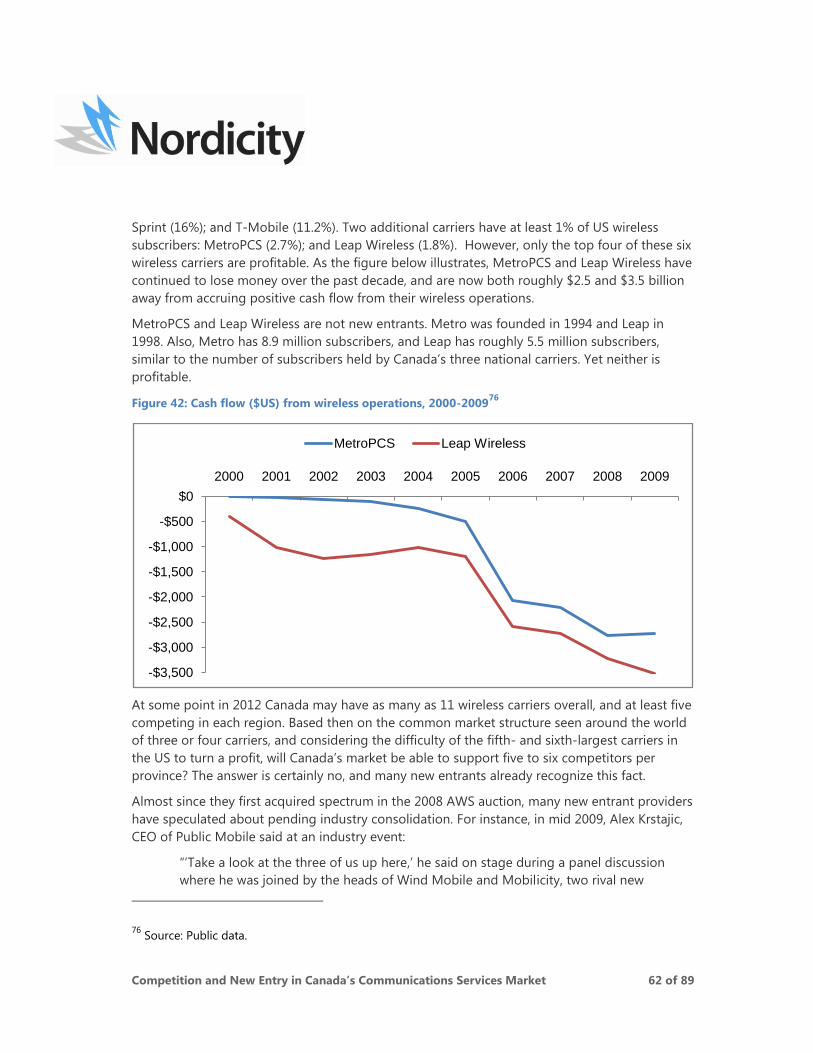
Competition and New Entry in Canada’s Communications Services Market 62 of 89
Sprint (16%); and T-Mobile (11.2%). Two additional carriers have at least 1% of US wireless
subscribers: MetroPCS (2.7%); and Leap Wireless (1.8%). However, only the top four of these six
wireless carriers are profitable. As the figure below illustrates, MetroPCS and Leap Wireless have
continued to lose money over the past decade, and are now both roughly $2.5 and $3.5 billion
away from accruing positive cash flow from their wireless operations.
MetroPCS and Leap Wireless are not new entrants. Metro was founded in 1994 and Leap in
1998. Also, Metro has 8.9 million subscribers, and Leap has roughly 5.5 million subscribers,
similar to the number of subscribers held by Canada‟s three national carriers. Yet neither is
profitable.
Figure 42: Cash flow ($US) from wireless operations, 2000-200976
At some point in 2012 Canada may have as many as 11 wireless carriers overall, and at least five
competing in each region. Based then on the common market structure seen around the world
of three or four carriers, and considering the difficulty of the fifth- and sixth-largest carriers in
the US to turn a profit, will Canada‟s market be able to support five to six competitors per
province? The answer is certainly no, and many new entrants already recognize this fact.
Almost since they first acquired spectrum in the 2008 AWS auction, many new entrant providers
have speculated about pending industry consolidation. For instance, in mid 2009, Alex Krstajic,
CEO of Public Mobile said at an industry event:
“‟Take a look at the three of us up here,‟ he said on stage during a panel discussion
where he was joined by the heads of Wind Mobile and Mobilicity, two rival new
76
Source: Public data.
-$3,500
-$3,000
-$2,500
-$2,000
-$1,500
-$1,000
-$500
$0
2000 2001 2002 2003 2004 2005 2006 2007 2008 2009
MetroPCS Leap Wireless
Competition and New Entry in Canada’s Communications Services Market 63 of 89
entrants. „Two will not be here next year, or will be here but have different business
cards.‟”77
More recently, Krstajic has renewed his view on what is the optimal market structure for
Canada‟s wireless sector. In December 2010, he said:
“I don‟t think there is any question in my mind that it would be good for all parties
concerned that the new entrants consolidate.”78
Wind Mobile has been bolder in that it has predicted who will lead the consolidation efforts.
Naguib Sawiris, chairman of Orascom, the Egyptian wireless giant providing financial backing
for Wind in Canada, noted in August 2010:
“They [the other new entrants] will be dead on arrival. Wind should be the consolidator
of all the smaller players here. We are going to be open to that. We are not interested
in smaller players that are only coming with cash, or the licenses they paid cash for. We
want them to succeed and have some subscribers. Because we can‟t do the job alone.”79
Similarly, TD reported in January 2011 that Shaw indicated that new entrant acquisitions and
partnerships will become attractive growth options as time passes.
It is clear that consolidation within Canada‟s wireless sector is highly likely. Looking at the
struggles of the US‟s fifth- and six-largest wireless carriers to turn a profit, as well as the market
structures of most international jurisdictions, it‟s natural to assume a sector with a more
streamlined number of competitors.
4.5 Conclusions
Canada’s wireless fees and market structure compare favourably with other developed
wireless sectors around the world. In fact, when accounting for the common usage
characteristics in Canada – Canadians use wireless phones for more minutes per month than
users in all other jurisdictions except the US – Canada‟s wireless sector compares very
favourably. Consider:
Canada has the seventh lowest average revenue per minute out of the 21 developed
wireless markets profiled. In terms of actual rates, Canada‟s $0.10 ARPM is 23% below
the international average of $0.13;
77
Source:
http://www.financialpost.com/news/Public+Mobile+fights+hold/4010412/story.html#ixzz1DgN3265t 78
Source: Ibid. 79
Source: http://www.theglobeandmail.com/report-on-business/canada-is-a-telecom-backwater-says-
bold-backer-of-wind-mobile/article1690690/page2/
Competition and New Entry in Canada’s Communications Services Market 64 of 89
At an average of $674.70 in total wireless revenue and $509.40 in voice revenue,
Canada only ranks ahead of Australia in revenue per square kilometre within the
wireless network. The US market generates nearly 2.3 times as much revenue per
square kilometre than Canada, and the UK market nearly 14 times more.Average
revenue per square kilometre in Canada is more than eight times less than the average
of the developed wireless market, and nearly 25 times less than the Netherlands – the
leading country;
Based on the Teligen methodology for comparing international wireless prices:
o For a calling profile of 100 monthly calls and roughly 188 minutes of use,
Canada ranks 13th out of 19 developed markets;
o For a calling profile of 300 monthly calls and roughly 589 minutes of use,
Canada ranks as having the eighth-lowest price of the 19 developed markets
profiled;
o Canadian mobile users can expect to pay only a 16.5% premium for tripling call
volume from 100 calls to 300 calls per month, which ranks fourth among all
profiled markets.
Canada‟s wireless market is structured very similarly to that of other international
markets, particularly in terms of combined subscriber share between the two leading
carriers. At 66.4% subscriber share between Bell and Rogers, Canada‟s market structure
falls within the international trend that sees the two leading carriers in 16 of 20
developed markets combine for between 63% and 77% subscriber share;
At 8.3%, the gap in subscriber shares between Canada‟s leading and third-largest
wireless carrier is the second lowest of all developed markets, eliminating any
possibility of the duopoly structures that are common in other international wireless
sectors;
Markets such as the US, which has ten times more wireless subscribers and more than
double the density of subscribers as Canada, struggle to support more than four
wireless carriers, further confirming the natural structure of Canada‟s wireless market. In
fact, in Australia, a market very similar in terms of population and geography to
Canada‟s, the third- and fourth-largest carriers merged in 2009 to create a market
structure almost identical to Canada‟s.
Competition and New Entry in Canada’s Communications Services Market 65 of 89
5. Communications Incumbents and 2008 New Entrants
This section demonstrates that: The companies permitted to bid on set-aside spectrum in
the 2008 AWS auction all possess the resources to compete openly in Canada’s
communications services industry. To do so, this section examines the size, scope and ability
to compete on a level playing field of those companies that took advantage of the 2008 AWS
auction framework to acquire set-aside spectrum.80
These competitors are examined in the
following three natural groupings:
1. Integrated communications services providers, including:
a. Shaw Communications;
b. Videotron; and
c. EastLink.
2. Regional wireless incumbents, including:
a. SaskTel; and
b. MTS.
3. 2008 pure-play new entrants, including:
a. Wind Mobile;
b. Mobilicity; and
c. Public Mobile.
5.1 Integrated cable-based communications services incumbents
The majority of Canada‟s communications services industry has historically been controlled by a
relatively small number of players, and this trend continues today. In fact, due to the ability of
communications services providers to leverage their existing networks in offering new services,
communications companies have relationships with more customers than ever before. The
combination of distribution and content assets by a number of communications services
providers has resulted in additional vertical integration.
Overall, virtually no major communications services provider in Canada offers fewer than three
communications services. The ability to bundle multiple services has resulted in better customer
attraction and retention rates, increasing a company‟s ability to compete. Therefore,
determining a company‟s ability to compete openly in Canada‟s wireless sector should not be
based solely on that company‟s wireless assets. Rather, all communications services need to be
80
New entrants based on the definition used by Industry Canada for the 2008 AWS auction: “participants
holding less than 10% of the national wireless market.”
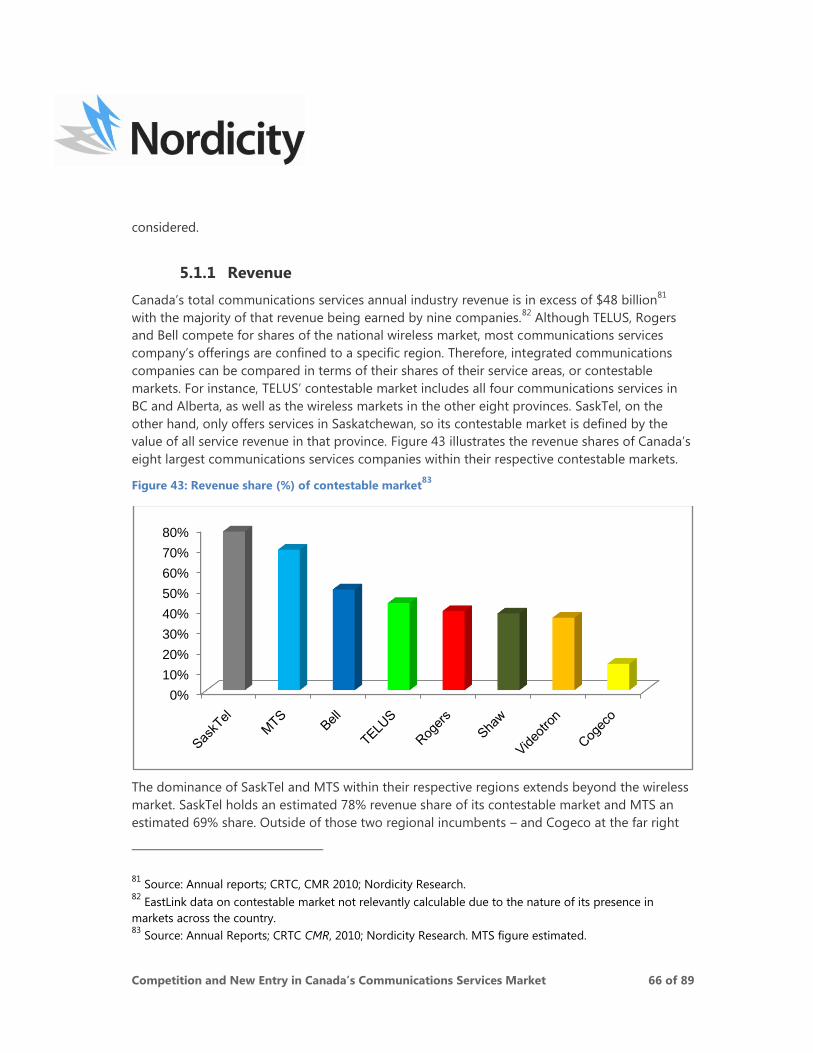
Competition and New Entry in Canada’s Communications Services Market 66 of 89
considered.
5.1.1 Revenue
Canada‟s total communications services annual industry revenue is in excess of $48 billion81
with the majority of that revenue being earned by nine companies.82
Although TELUS, Rogers
and Bell compete for shares of the national wireless market, most communications services
company‟s offerings are confined to a specific region. Therefore, integrated communications
companies can be compared in terms of their shares of their service areas, or contestable
markets. For instance, TELUS‟ contestable market includes all four communications services in
BC and Alberta, as well as the wireless markets in the other eight provinces. SaskTel, on the
other hand, only offers services in Saskatchewan, so its contestable market is defined by the
value of all service revenue in that province. Figure 43 illustrates the revenue shares of Canada‟s
eight largest communications services companies within their respective contestable markets.
Figure 43: Revenue share (%) of contestable market83
The dominance of SaskTel and MTS within their respective regions extends beyond the wireless
market. SaskTel holds an estimated 78% revenue share of its contestable market and MTS an
estimated 69% share. Outside of those two regional incumbents – and Cogeco at the far right
81
Source: Annual reports; CRTC, CMR 2010; Nordicity Research. 82
EastLink data on contestable market not relevantly calculable due to the nature of its presence in
markets across the country. 83
Source: Annual Reports; CRTC CMR, 2010; Nordicity Research. MTS figure estimated.
0%
10%
20%
30%
40%
50%
60%
70%
80%
Competition and New Entry in Canada’s Communications Services Market 67 of 89
end – the market shares of Canada‟s leading communications services providers are relatively
similar. In fact, there is only 14% separating the revenue shares of Videotron (35.7%) and Bell
(49.7%). Other than highlighting the lack of communications services competition in
Saskatchewan and Manitoba, the graph above shows the very relatively even strength of
Canada‟s integrated communications services providers.
Many Canadian communications services companies have integrated vertically by adding
content assets that add to their annual revenues and increase opportunities to reach
consumers. Specifically, in addition to their market shares above, it should be noted that:
Rogers‟ broadcasting assets capture approximately $490 million, or 9% of the broadcasting
industry; Videotron‟s parent company Quebecor also captured 6% ($328 million) of
broadcasting revenue; and Shaw‟s newly-acquired Canwest broadcasting earned $930 million,
or 17% of all broadcasting revenue. The Shaw family also holds voting control in Corus
Entertainment, which earns roughly 9% of all broadcasting revenue. Finally, Bell‟s acquisition of
CTVglobemedia is currently pending, but if approved would add approximately 29% of all
Canadian broadcasting revenue ($1.6 billion) to Bell‟s assets.
5.1.2 Subscribers
Communications services market share can also be examined in terms of subscribers reached.
Most communications services providers cite figures in terms of „total customer connections,‟
referring to their number of unique wireless, TV, Internet and home phone subscriptions. But
there is another way to view subscriber reach. Essentially, TV, home phone and Internet are
household services, meaning each subscription reaches all members of a subscribing house.
Wireless services, on the other hand, are personal services with only one user per subscription.
Figure 44 below accounts for the reach of each type of service – assuming a reach of 2.5 users
per TV, Internet and wireline phone account, and only one per wireless account – to
demonstrate share of total communications services users per company.84
84
Subscriber figures for EastLink are not available.
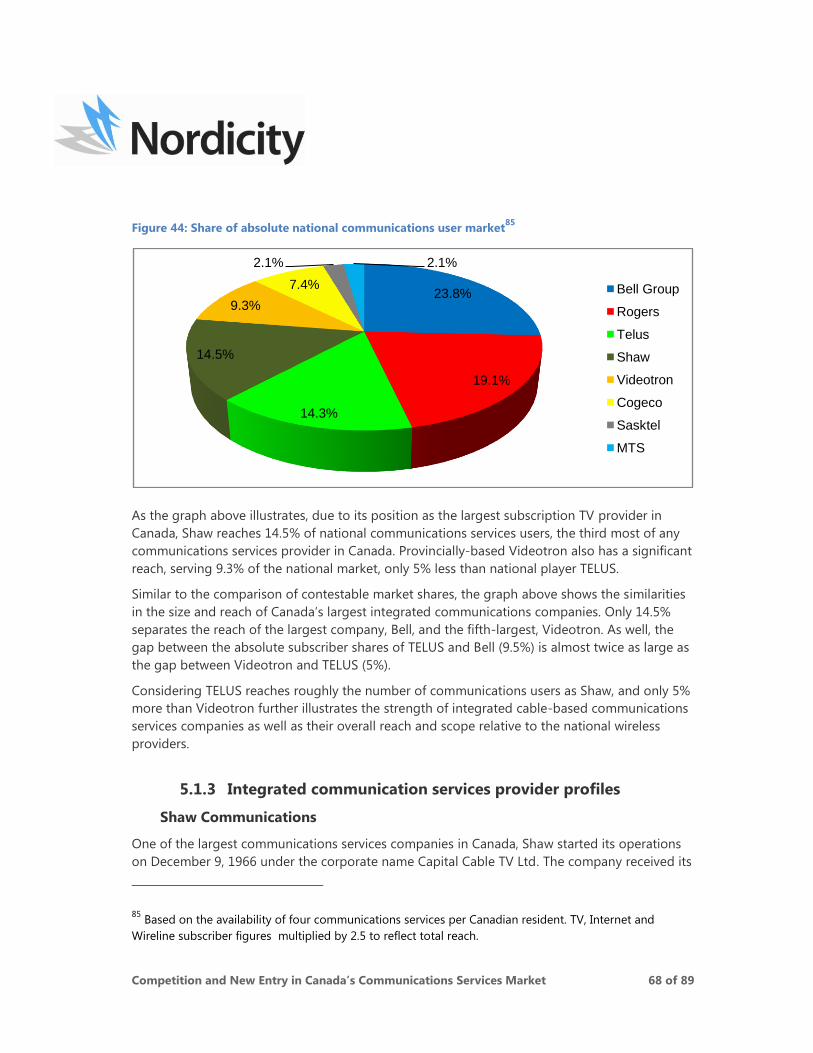
Competition and New Entry in Canada’s Communications Services Market 68 of 89
Figure 44: Share of absolute national communications user market85
As the graph above illustrates, due to its position as the largest subscription TV provider in
Canada, Shaw reaches 14.5% of national communications services users, the third most of any
communications services provider in Canada. Provincially-based Videotron also has a significant
reach, serving 9.3% of the national market, only 5% less than national player TELUS.
Similar to the comparison of contestable market shares, the graph above shows the similarities
in the size and reach of Canada‟s largest integrated communications companies. Only 14.5%
separates the reach of the largest company, Bell, and the fifth-largest, Videotron. As well, the
gap between the absolute subscriber shares of TELUS and Bell (9.5%) is almost twice as large as
the gap between Videotron and TELUS (5%).
Considering TELUS reaches roughly the number of communications users as Shaw, and only 5%
more than Videotron further illustrates the strength of integrated cable-based communications
services companies as well as their overall reach and scope relative to the national wireless
providers.
5.1.3 Integrated communication services provider profiles
Shaw Communications
One of the largest communications services companies in Canada, Shaw started its operations
on December 9, 1966 under the corporate name Capital Cable TV Ltd. The company received its
85
Based on the availability of four communications services per Canadian resident. TV, Internet and
Wireline subscriber figures multiplied by 2.5 to reflect total reach.
23.8%
19.1%
14.3%
14.5%
9.3%
7.4%
2.1% 2.1%
Bell Group
Rogers
Telus
Shaw
Videotron
Cogeco
Sasktel
MTS
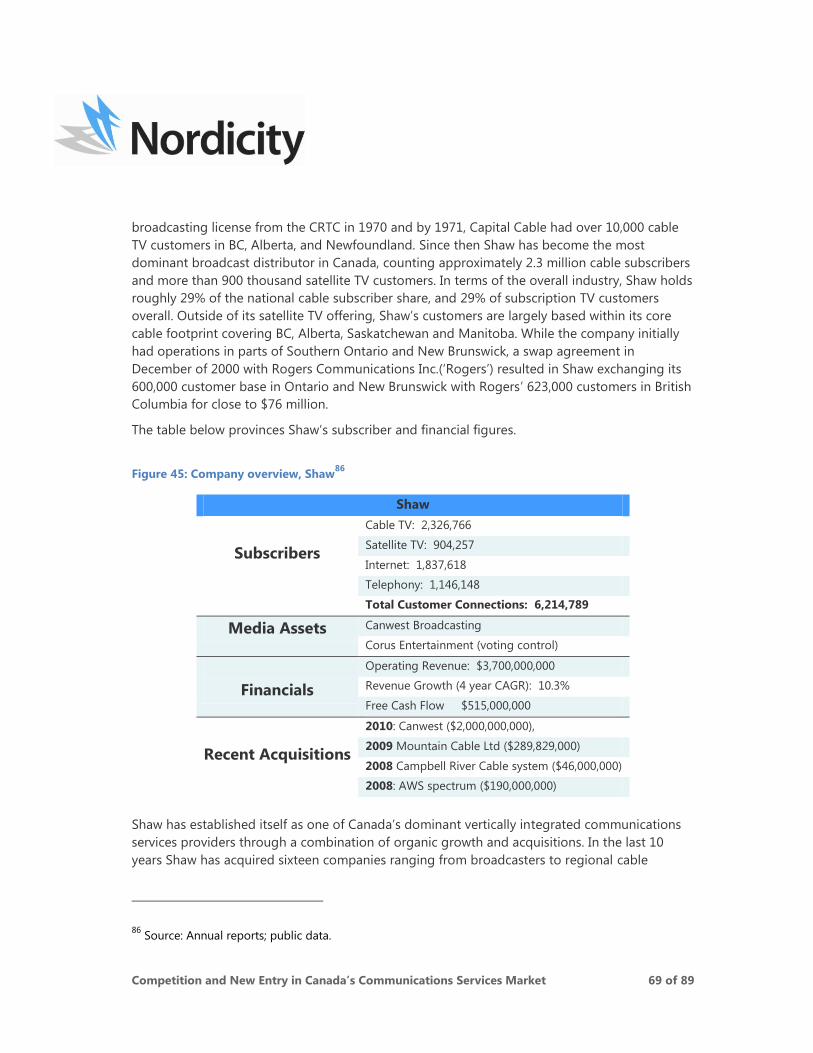
Competition and New Entry in Canada’s Communications Services Market 69 of 89
broadcasting license from the CRTC in 1970 and by 1971, Capital Cable had over 10,000 cable
TV customers in BC, Alberta, and Newfoundland. Since then Shaw has become the most
dominant broadcast distributor in Canada, counting approximately 2.3 million cable subscribers
and more than 900 thousand satellite TV customers. In terms of the overall industry, Shaw holds
roughly 29% of the national cable subscriber share, and 29% of subscription TV customers
overall. Outside of its satellite TV offering, Shaw‟s customers are largely based within its core
cable footprint covering BC, Alberta, Saskatchewan and Manitoba. While the company initially
had operations in parts of Southern Ontario and New Brunswick, a swap agreement in
December of 2000 with Rogers Communications Inc.(„Rogers‟) resulted in Shaw exchanging its
600,000 customer base in Ontario and New Brunswick with Rogers‟ 623,000 customers in British
Columbia for close to $76 million.
The table below provinces Shaw‟s subscriber and financial figures.
Figure 45: Company overview, Shaw86
Shaw
Subscribers
Cable TV: 2,326,766
Satellite TV: 904,257
Internet: 1,837,618
Telephony: 1,146,148
Total Customer Connections: 6,214,789
Media Assets Canwest Broadcasting
Corus Entertainment (voting control)
Financials
Operating Revenue: $3,700,000,000
Revenue Growth (4 year CAGR): 10.3%
Free Cash Flow $515,000,000
Recent Acquisitions
2010: Canwest ($2,000,000,000),
2009 Mountain Cable Ltd ($289,829,000)
2008 Campbell River Cable system ($46,000,000)
2008: AWS spectrum ($190,000,000)
Shaw has established itself as one of Canada‟s dominant vertically integrated communications
services providers through a combination of organic growth and acquisitions. In the last 10
years Shaw has acquired sixteen companies ranging from broadcasters to regional cable
86
Source: Annual reports; public data.
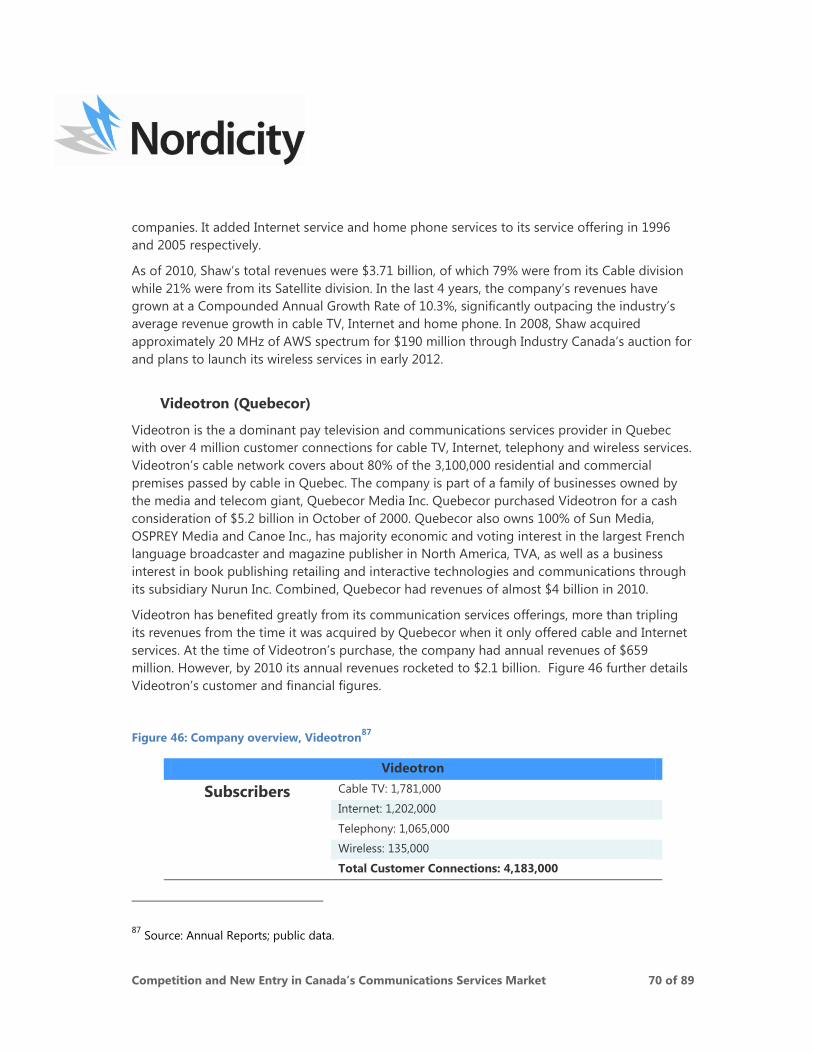
Competition and New Entry in Canada’s Communications Services Market 70 of 89
companies. It added Internet service and home phone services to its service offering in 1996
and 2005 respectively.
As of 2010, Shaw‟s total revenues were $3.71 billion, of which 79% were from its Cable division
while 21% were from its Satellite division. In the last 4 years, the company‟s revenues have
grown at a Compounded Annual Growth Rate of 10.3%, significantly outpacing the industry‟s
average revenue growth in cable TV, Internet and home phone. In 2008, Shaw acquired
approximately 20 MHz of AWS spectrum for $190 million through Industry Canada‟s auction for
and plans to launch its wireless services in early 2012.
Videotron (Quebecor)
Videotron is the a dominant pay television and communications services provider in Quebec
with over 4 million customer connections for cable TV, Internet, telephony and wireless services.
Videotron‟s cable network covers about 80% of the 3,100,000 residential and commercial
premises passed by cable in Quebec. The company is part of a family of businesses owned by
the media and telecom giant, Quebecor Media Inc. Quebecor purchased Videotron for a cash
consideration of $5.2 billion in October of 2000. Quebecor also owns 100% of Sun Media,
OSPREY Media and Canoe Inc., has majority economic and voting interest in the largest French
language broadcaster and magazine publisher in North America, TVA, as well as a business
interest in book publishing retailing and interactive technologies and communications through
its subsidiary Nurun Inc. Combined, Quebecor had revenues of almost $4 billion in 2010.
Videotron has benefited greatly from its communication services offerings, more than tripling
its revenues from the time it was acquired by Quebecor when it only offered cable and Internet
services. At the time of Videotron‟s purchase, the company had annual revenues of $659
million. However, by 2010 its annual revenues rocketed to $2.1 billion. Figure 46 further details
Videotron‟s customer and financial figures.
Figure 46: Company overview, Videotron87
Videotron
Subscribers Cable TV: 1,781,000
Internet: 1,202,000
Telephony: 1,065,000
Wireless: 135,000
Total Customer Connections: 4,183,000
87
Source: Annual Reports; public data.
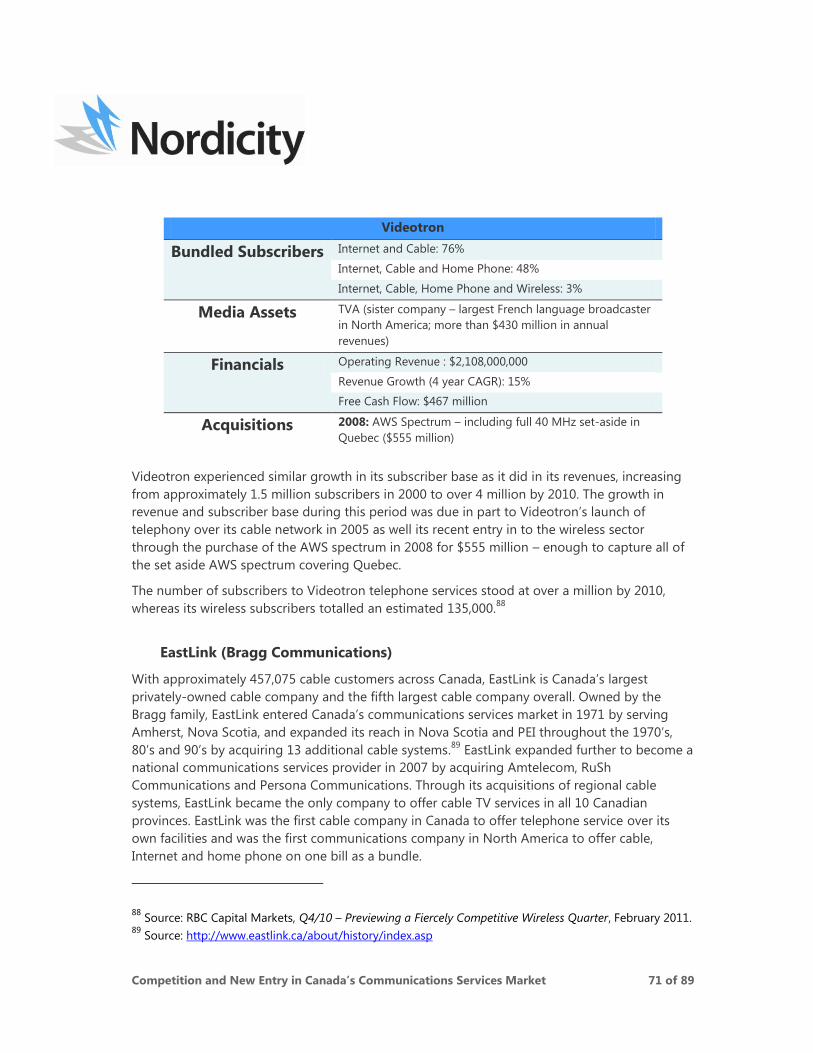
Competition and New Entry in Canada’s Communications Services Market 71 of 89
Videotron
Bundled Subscribers Internet and Cable: 76%
Internet, Cable and Home Phone: 48%
Internet, Cable, Home Phone and Wireless: 3%
Media Assets TVA (sister company – largest French language broadcaster
in North America; more than $430 million in annual
revenues)
Financials Operating Revenue : $2,108,000,000
Revenue Growth (4 year CAGR): 15%
Free Cash Flow: $467 million
Acquisitions 2008: AWS Spectrum – including full 40 MHz set-aside in
Quebec ($555 million)
Videotron experienced similar growth in its subscriber base as it did in its revenues, increasing
from approximately 1.5 million subscribers in 2000 to over 4 million by 2010. The growth in
revenue and subscriber base during this period was due in part to Videotron‟s launch of
telephony over its cable network in 2005 as well its recent entry in to the wireless sector
through the purchase of the AWS spectrum in 2008 for $555 million – enough to capture all of
the set aside AWS spectrum covering Quebec.
The number of subscribers to Videotron telephone services stood at over a million by 2010,
whereas its wireless subscribers totalled an estimated 135,000.88
EastLink (Bragg Communications)
With approximately 457,075 cable customers across Canada, EastLink is Canada‟s largest
privately-owned cable company and the fifth largest cable company overall. Owned by the
Bragg family, EastLink entered Canada‟s communications services market in 1971 by serving
Amherst, Nova Scotia, and expanded its reach in Nova Scotia and PEI throughout the 1970‟s,
80‟s and 90‟s by acquiring 13 additional cable systems.89
EastLink expanded further to become a
national communications services provider in 2007 by acquiring Amtelecom, RuSh
Communications and Persona Communications. Through its acquisitions of regional cable
systems, EastLink became the only company to offer cable TV services in all 10 Canadian
provinces. EastLink was the first cable company in Canada to offer telephone service over its
own facilities and was the first communications company in North America to offer cable,
Internet and home phone on one bill as a bundle.
88
Source: RBC Capital Markets, Q4/10 – Previewing a Fiercely Competitive Wireless Quarter, February 2011. 89
Source: http://www.eastlink.ca/about/history/index.asp
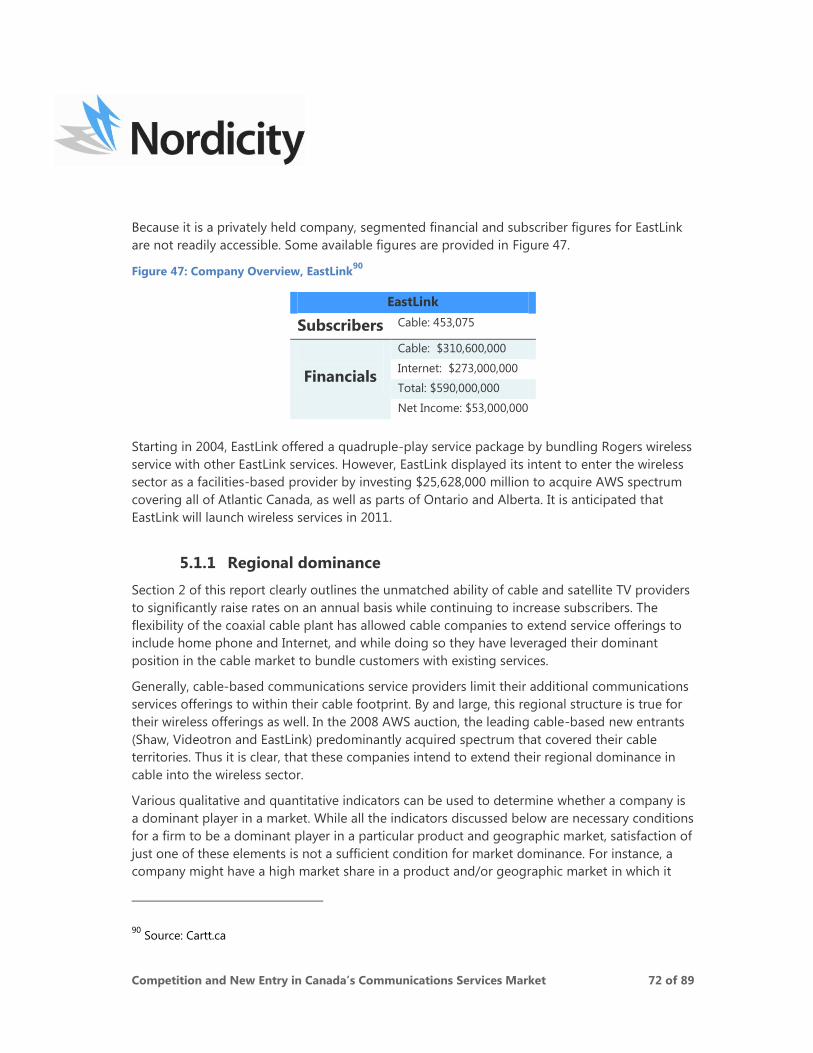
Competition and New Entry in Canada’s Communications Services Market 72 of 89
Because it is a privately held company, segmented financial and subscriber figures for EastLink
are not readily accessible. Some available figures are provided in Figure 47.
Figure 47: Company Overview, EastLink90
EastLink
Subscribers Cable: 453,075
Financials
Cable: $310,600,000
Internet: $273,000,000
Total: $590,000,000
Net Income: $53,000,000
Starting in 2004, EastLink offered a quadruple-play service package by bundling Rogers wireless
service with other EastLink services. However, EastLink displayed its intent to enter the wireless
sector as a facilities-based provider by investing $25,628,000 million to acquire AWS spectrum
covering all of Atlantic Canada, as well as parts of Ontario and Alberta. It is anticipated that
EastLink will launch wireless services in 2011.
5.1.1 Regional dominance
Section 2 of this report clearly outlines the unmatched ability of cable and satellite TV providers
to significantly raise rates on an annual basis while continuing to increase subscribers. The
flexibility of the coaxial cable plant has allowed cable companies to extend service offerings to
include home phone and Internet, and while doing so they have leveraged their dominant
position in the cable market to bundle customers with existing services.
Generally, cable-based communications service providers limit their additional communications
services offerings to within their cable footprint. By and large, this regional structure is true for
their wireless offerings as well. In the 2008 AWS auction, the leading cable-based new entrants
(Shaw, Videotron and EastLink) predominantly acquired spectrum that covered their cable
territories. Thus it is clear, that these companies intend to extend their regional dominance in
cable into the wireless sector.
Various qualitative and quantitative indicators can be used to determine whether a company is
a dominant player in a market. While all the indicators discussed below are necessary conditions
for a firm to be a dominant player in a particular product and geographic market, satisfaction of
just one of these elements is not a sufficient condition for market dominance. For instance, a
company might have a high market share in a product and/or geographic market in which it
90
Source: Cartt.ca
Competition and New Entry in Canada’s Communications Services Market 73 of 89
competes, but may face a highly elastic demand curve. Meaning that any attempts to increase
profitability through price increases will result in a significant loss of subscriber base, either
because consumers find other substitutes or because there are other companies offering the
same product. It is important to take into account various metrics when determining whether a
company holds a dominant position in a market. These metrics are discussed below, illustrating
how both Shaw and Videotron91
hold a dominant position in their respective geographic
markets.
Shaw and Videotron have high market share:
As of November 2010, the total number of homes covered by Shaw‟s cable network was around
3.8 million. Of these more than 60% or 2,326,766 homes subscribed to Shaw‟s cable TV services.
Since Shaw reports its penetration rate on a blended basis taking in to account the homes
passed in Manitoba and Saskatchewan, it is likely that its penetration numbers in these two
provinces are lower due to the presence of competing IPTV services from the incumbent
telephone companies, SaskTel and MTS. Furthermore, not all Canadian households subscribe to
cable TV services. As the CRTC‟s 2010 monitoring report noted, there were in total 11.3 million
subscribers to BDU services in Canada in 2009, of which 25% subscribed to Satellite TV services.
Thus, it is safe to assume that Shaw „s market share of BC and Alberta‟s cable TV market is well
in excess of 60%.
Similarly, Videotron is a dominant communications service provider in Quebec with over 4
million subscribers for cable TV, Internet, telephony and wireless services combined. Its cable
network covers about 80% of Quebec‟s 3,100,000 residential and commercial premises passed
by cable, including 2,603,000 of homes passed in Quebec. At the end of the third quarter of
2010, Videotron had achieved a 69.2% penetration rate for its cable TV, resulting in 1,802,000
subscribers to its cable TV services. Similarly, its penetration rate for home phone and Internet
was 42.2% and 47.4% respectively.
Shaw and Videotron have significant control over prices:
Control over prices is a necessary characterization for market dominance as it shows consumers‟
ability and/or willingness to switch to a substitute. If a company is able to pass on price
increases to its customers without eroding its customer base, it is likely that its customers lack
the countervailing power to introduce price discipline. Shaw and Videotron have been able to
successfully pass-through price increases to their subscribers without adversely affecting their
respective subscriber bases.
91
Because it is a private company, very little subscriber and financial information is available for EastLink,
particularly pricing and bundling information needed to illustrate the company‟s dominance within its
cable footprint. Therefore, this section focuses on Shaw and Videotron alone.
Competition and New Entry in Canada’s Communications Services Market 74 of 89
Shaw has consistently raised its prices for cable TV services in BC and Alberta. Shaw, like other
incumbent BDUs across Canada offers competitive pricing in two of the 3 product markets
where it faces competition, namely, Internet and home phone, while it continues to operate as a
monopoly in the cable TV market. Shaw and other cable TV service providers‟ bundling strategy
has contributed to 5.38% CAGR in ARPU over the last 4 years for cable TV, while the CAGR in
ARPU for residential home phone and Internet has been -1.96% and 2.95% respectively.
Videotron, by its own admission, has also been able to pass down price increases to its
customers without losing its subscriber base. In 2010, its combined revenues for all cable
television services increased by $20.5 million (or 9.6%) and Videotron acknowledged that the
increase in revenues was in part due to passing the Local Programming Improvement Fund fees
to its customers as well as increased demand for HDTV, Pay TV orders and Video on Demand.
Shaw and Videotron’s ability to offer bundled services is unmatched in their
respective geographic markets:
Companies use bundling strategies not only to increase their overall revenues but also as an
exclusionary mechanism that prevents non-integrated firms from chipping away at their market
share. Both Shaw and Videotron have successfully executed their bundling strategies to both
attract customers away from their non-integrated competitors as well as to increase retention.
Bundling strategies of this sort have been used by cable companies across Canada for revenue
enhancing and customer retention reasons. MTS for instance, after adding mobile wireless
services to its bundle has been able to achieve a significantly lower churn rate than its peers in
the mobile wireless sector (0.3% versus 1.6%).
Videotron introduced telephony in Q1 of 2005 and since then has almost doubled its Net Total
ARPU in a span of just five years from around $45 in 2005 to more than $90 by 2010. By
offering bundled service discounts to its customers , the company has been able to increase its
retention ratio as well as improve its overall revenues. As an example, if a customer purchases
only cable TV services from Videotron, the monthly subscription cost is $21.29, but adding
home phone to the bundle results in total savings of 14.9% (or $3) over standalone cable
pricing. Similarly, adding phone and Internet results in a savings of $6 compared to standalone
services ($23.25 and $28.95 standalone). Thus, a customer looking to switch its home phone
and Internet services to a competing service provider will be looking for an average savings of
11.5% on a competitors phone and Internet bundle. As of 2010, 76% of Videotron‟s customers
were subscribing to both cable TV and Internet and almost half were subscribing to cable,
Internet and home phone, indicating how successful the company was at inducing its customers
to take advantage of bundled services. This success is in part due to the fact that Videotron was
able to use its dominance in cable TV as leverage.
Over 6.3 million customers across Canada subscribe to Shaw‟s services. Of these, most (78%)
subscribe to both cable and Internet services and more than half (53.4%) subscribe to all three
services. While the company has made some inroads in Ontario with the acquisition of Hamilton
Competition and New Entry in Canada’s Communications Services Market 75 of 89
Mountain Cable and some Northern Ontario cable franchises, for the most part its cable
operations are concentrated in Western Canada.
Shaw‟s cable footprint in British Columbia and Alberta covers over 92% of all homes and for
almost all customers. Furthermore, a customer in either of these provinces, looking to switch to
bundled services for all three communications services (TV, Internet and home phone) has Shaw
as its only option. Subscription to standalone cable TV services from Shaw and home phone
and Internet services from TELUS would mean that a customer will forego the bundled
discounts that are available from Shaw. As noted in the Videotron example above, bundled
discounts tend to be large enough that it undermines the cost savings resulting from a
competing Internet and home phone service provider and thus act as a deterrent for customers
wanting to switch to competing services. Due to the absence of competing bundled services
options, Shaw‟s subscribers lack the countervailing power necessary to introduce price
discipline to Shaw‟s cable TV pricing. Thus, Shaw is able to charge supra-competitive prices for
its cable TV services and recoup the lost profits incurred in the home phone and Internet
market, where it faces competition.
Consumers increasingly prefer to purchase their cable TV, home phone and Internet services
from a single service provider. Bundled discounts offered on multiple services as well as the
ease of a single bill makes bundled services a valuable proposition. This is evidenced by the fact
that since 2006 the number of customers that have signed up for Shaw‟s cable TV and Internet
services has gone up by more than 12 fold, from 4.34% in 2005 to 53.44% in 2010. Furthermore,
the number has gone up by more than 12 fold for subscribers that get all three of their services
from Shaw increasing from 1.61% in 2005 to 20% in 2010.
5.2 Regional wireless incumbents
Section 3.3 outlines the state of regional competition in Canada‟s wireless sector, and in doing
so reveals that, based on multiple measurement parameters, the wireless sectors in
Saskatchewan, Manitoba and Newfoundland are noticeably less competitive than those in other
sectors. For instance, in 2004 only two provinces – Ontario and Quebec – had a third wireless
carrier with at least 15% of subscribers. By 2009, seven provinces had a third provider with at
least 15% of subscribers. The only provinces where this wasn‟t the case were Manitoba,
Saskatchewan and Newfoundland.
The trend lines in Figure 48 illustrate the gap in percentage subscriber share between the
leading wireless carrier and the third-largest provider, by province or region. As the red and
black lines indicate, this gap is currently largest in Newfoundland (74%) and Saskatchewan
(69%). In both cases, the gap between the leading and third-largest wireless carrier has declined
by less than 8% over five years.
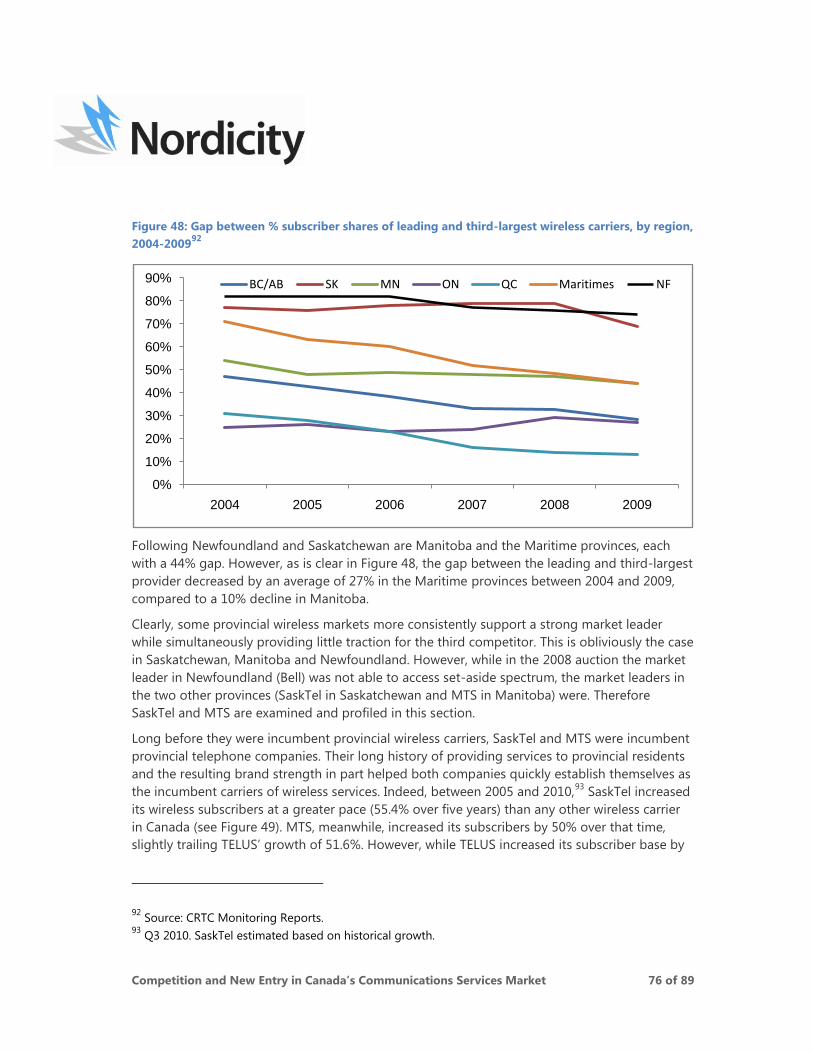
Competition and New Entry in Canada’s Communications Services Market 76 of 89
Figure 48: Gap between % subscriber shares of leading and third-largest wireless carriers, by region,
2004-200992
Following Newfoundland and Saskatchewan are Manitoba and the Maritime provinces, each
with a 44% gap. However, as is clear in Figure 48, the gap between the leading and third-largest
provider decreased by an average of 27% in the Maritime provinces between 2004 and 2009,
compared to a 10% decline in Manitoba.
Clearly, some provincial wireless markets more consistently support a strong market leader
while simultaneously providing little traction for the third competitor. This is obliviously the case
in Saskatchewan, Manitoba and Newfoundland. However, while in the 2008 auction the market
leader in Newfoundland (Bell) was not able to access set-aside spectrum, the market leaders in
the two other provinces (SaskTel in Saskatchewan and MTS in Manitoba) were. Therefore
SaskTel and MTS are examined and profiled in this section.
Long before they were incumbent provincial wireless carriers, SaskTel and MTS were incumbent
provincial telephone companies. Their long history of providing services to provincial residents
and the resulting brand strength in part helped both companies quickly establish themselves as
the incumbent carriers of wireless services. Indeed, between 2005 and 2010,93
SaskTel increased
its wireless subscribers at a greater pace (55.4% over five years) than any other wireless carrier
in Canada (see Figure 49). MTS, meanwhile, increased its subscribers by 50% over that time,
slightly trailing TELUS‟ growth of 51.6%. However, while TELUS increased its subscriber base by
92
Source: CRTC Monitoring Reports. 93
Q3 2010. SaskTel estimated based on historical growth.
0%
10%
20%
30%
40%
50%
60%
70%
80%
90%
2004 2005 2006 2007 2008 2009
BC/AB SK MN ON QC Maritimes NF
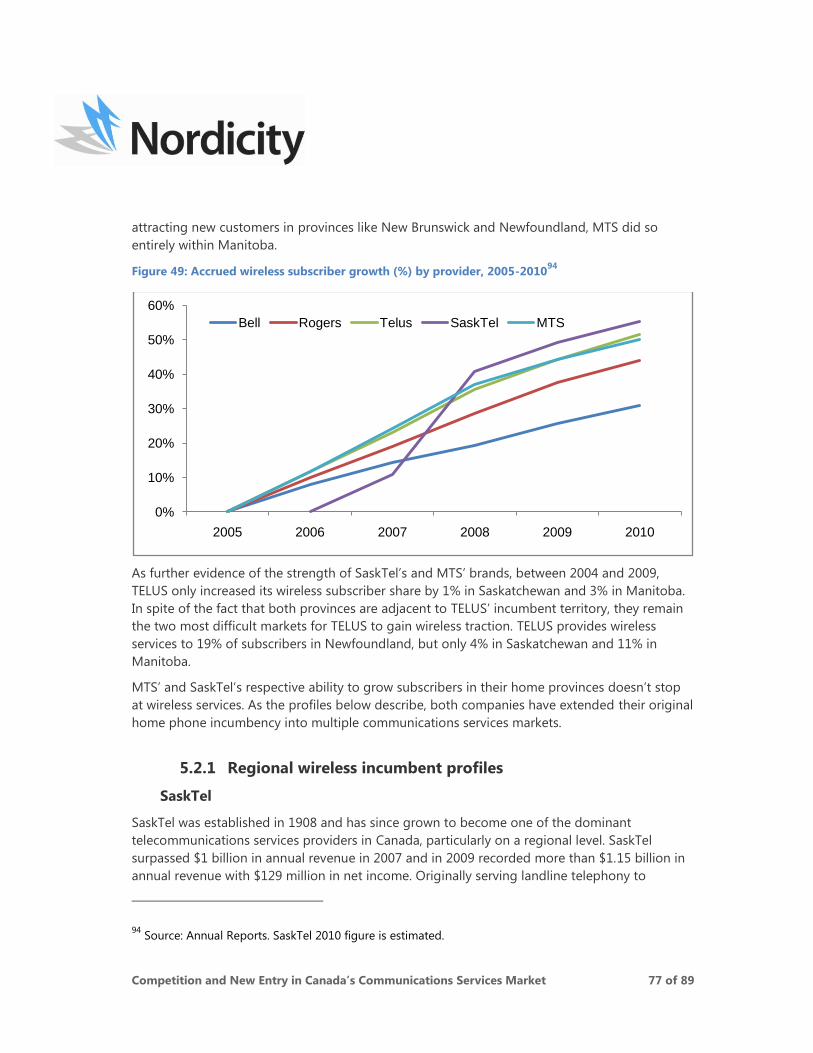
Competition and New Entry in Canada’s Communications Services Market 77 of 89
attracting new customers in provinces like New Brunswick and Newfoundland, MTS did so
entirely within Manitoba.
Figure 49: Accrued wireless subscriber growth (%) by provider, 2005-201094
As further evidence of the strength of SaskTel‟s and MTS‟ brands, between 2004 and 2009,
TELUS only increased its wireless subscriber share by 1% in Saskatchewan and 3% in Manitoba.
In spite of the fact that both provinces are adjacent to TELUS‟ incumbent territory, they remain
the two most difficult markets for TELUS to gain wireless traction. TELUS provides wireless
services to 19% of subscribers in Newfoundland, but only 4% in Saskatchewan and 11% in
Manitoba.
MTS‟ and SaskTel‟s respective ability to grow subscribers in their home provinces doesn‟t stop
at wireless services. As the profiles below describe, both companies have extended their original
home phone incumbency into multiple communications services markets.
5.2.1 Regional wireless incumbent profiles
SaskTel
SaskTel was established in 1908 and has since grown to become one of the dominant
telecommunications services providers in Canada, particularly on a regional level. SaskTel
surpassed $1 billion in annual revenue in 2007 and in 2009 recorded more than $1.15 billion in
annual revenue with $129 million in net income. Originally serving landline telephony to
94
Source: Annual Reports. SaskTel 2010 figure is estimated.
0%
10%
20%
30%
40%
50%
60%
2005 2006 2007 2008 2009 2010
Bell Rogers Telus SaskTel MTS
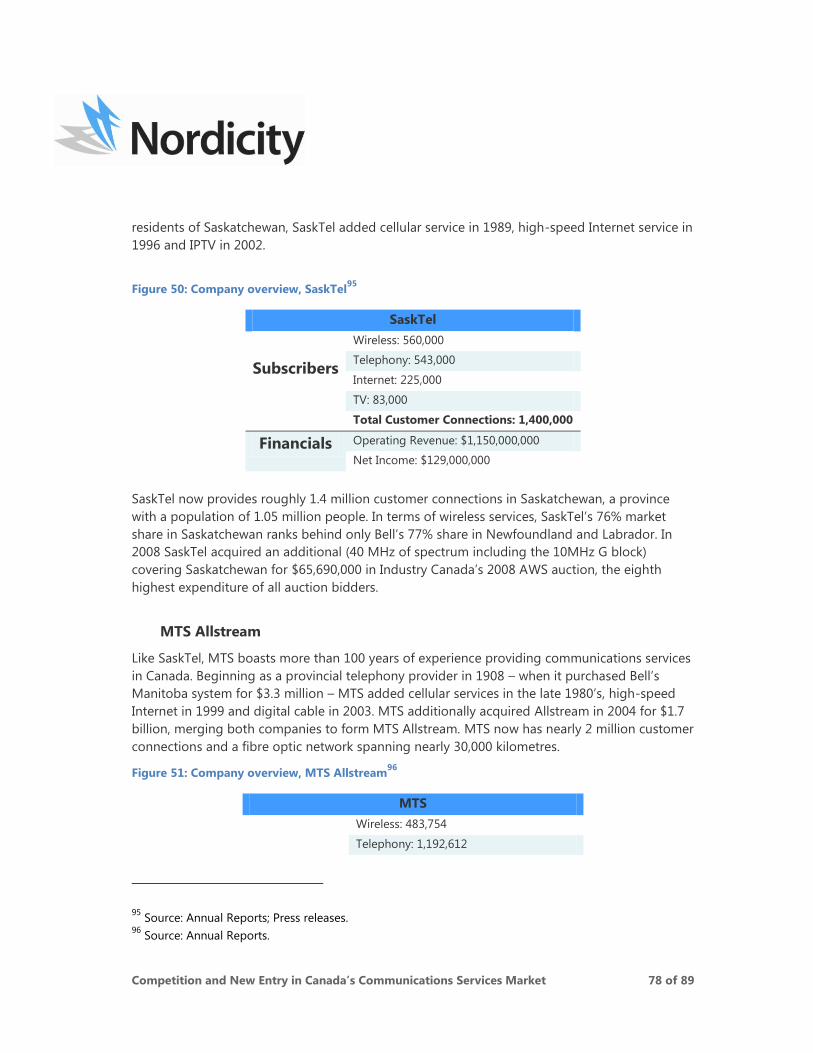
Competition and New Entry in Canada’s Communications Services Market 78 of 89
residents of Saskatchewan, SaskTel added cellular service in 1989, high-speed Internet service in
1996 and IPTV in 2002.
Figure 50: Company overview, SaskTel95
SaskTel
Subscribers
Wireless: 560,000
Telephony: 543,000
Internet: 225,000
TV: 83,000
Total Customer Connections: 1,400,000
Financials Operating Revenue: $1,150,000,000
Net Income: $129,000,000
SaskTel now provides roughly 1.4 million customer connections in Saskatchewan, a province
with a population of 1.05 million people. In terms of wireless services, SaskTel‟s 76% market
share in Saskatchewan ranks behind only Bell‟s 77% share in Newfoundland and Labrador. In
2008 SaskTel acquired an additional (40 MHz of spectrum including the 10MHz G block)
covering Saskatchewan for $65,690,000 in Industry Canada‟s 2008 AWS auction, the eighth
highest expenditure of all auction bidders.
MTS Allstream
Like SaskTel, MTS boasts more than 100 years of experience providing communications services
in Canada. Beginning as a provincial telephony provider in 1908 – when it purchased Bell‟s
Manitoba system for $3.3 million – MTS added cellular services in the late 1980‟s, high-speed
Internet in 1999 and digital cable in 2003. MTS additionally acquired Allstream in 2004 for $1.7
billion, merging both companies to form MTS Allstream. MTS now has nearly 2 million customer
connections and a fibre optic network spanning nearly 30,000 kilometres.
Figure 51: Company overview, MTS Allstream96
MTS
Wireless: 483,754
Telephony: 1,192,612
95
Source: Annual Reports; Press releases. 96
Source: Annual Reports.
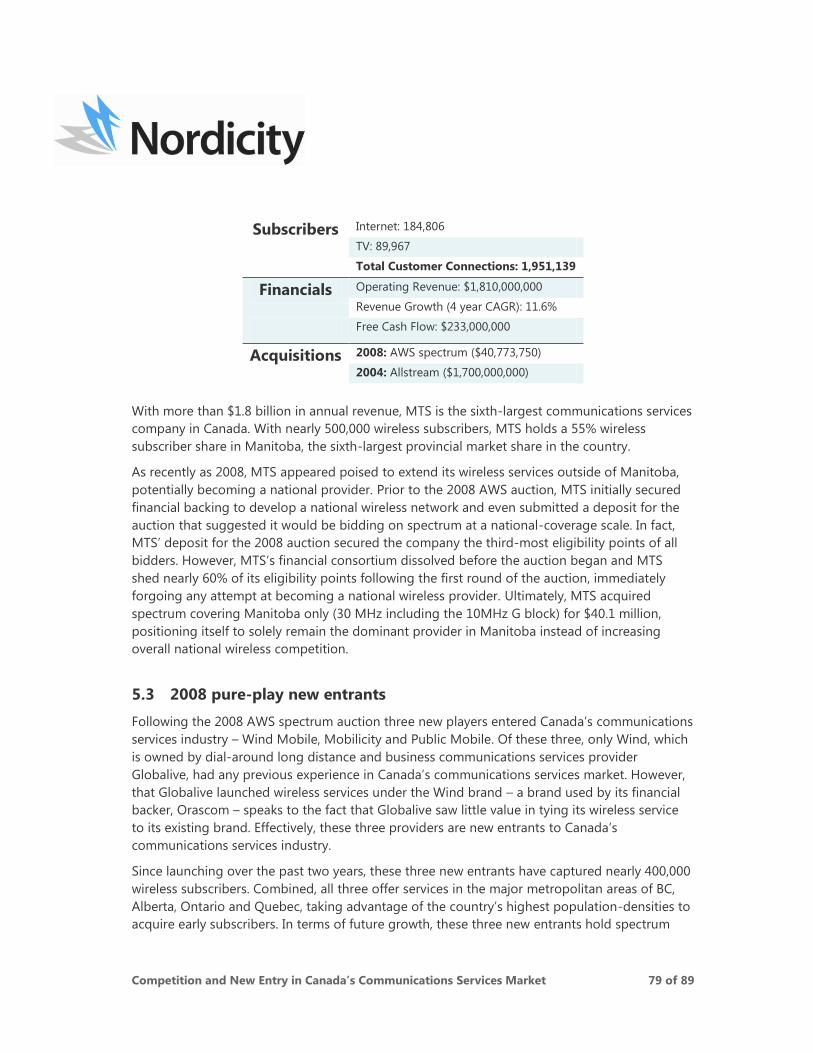
Competition and New Entry in Canada’s Communications Services Market 79 of 89
Subscribers Internet: 184,806
TV: 89,967
Total Customer Connections: 1,951,139
Financials Operating Revenue: $1,810,000,000
Revenue Growth (4 year CAGR): 11.6%
Free Cash Flow: $233,000,000
Acquisitions 2008: AWS spectrum ($40,773,750)
2004: Allstream ($1,700,000,000)
With more than $1.8 billion in annual revenue, MTS is the sixth-largest communications services
company in Canada. With nearly 500,000 wireless subscribers, MTS holds a 55% wireless
subscriber share in Manitoba, the sixth-largest provincial market share in the country.
As recently as 2008, MTS appeared poised to extend its wireless services outside of Manitoba,
potentially becoming a national provider. Prior to the 2008 AWS auction, MTS initially secured
financial backing to develop a national wireless network and even submitted a deposit for the
auction that suggested it would be bidding on spectrum at a national-coverage scale. In fact,
MTS‟ deposit for the 2008 auction secured the company the third-most eligibility points of all
bidders. However, MTS‟s financial consortium dissolved before the auction began and MTS
shed nearly 60% of its eligibility points following the first round of the auction, immediately
forgoing any attempt at becoming a national wireless provider. Ultimately, MTS acquired
spectrum covering Manitoba only (30 MHz including the 10MHz G block) for $40.1 million,
positioning itself to solely remain the dominant provider in Manitoba instead of increasing
overall national wireless competition.
5.3 2008 pure-play new entrants
Following the 2008 AWS spectrum auction three new players entered Canada‟s communications
services industry – Wind Mobile, Mobilicity and Public Mobile. Of these three, only Wind, which
is owned by dial-around long distance and business communications services provider
Globalive, had any previous experience in Canada‟s communications services market. However,
that Globalive launched wireless services under the Wind brand – a brand used by its financial
backer, Orascom – speaks to the fact that Globalive saw little value in tying its wireless service
to its existing brand. Effectively, these three providers are new entrants to Canada‟s
communications services industry.
Since launching over the past two years, these three new entrants have captured nearly 400,000
wireless subscribers. Combined, all three offer services in the major metropolitan areas of BC,
Alberta, Ontario and Quebec, taking advantage of the country‟s highest population-densities to
acquire early subscribers. In terms of future growth, these three new entrants hold spectrum
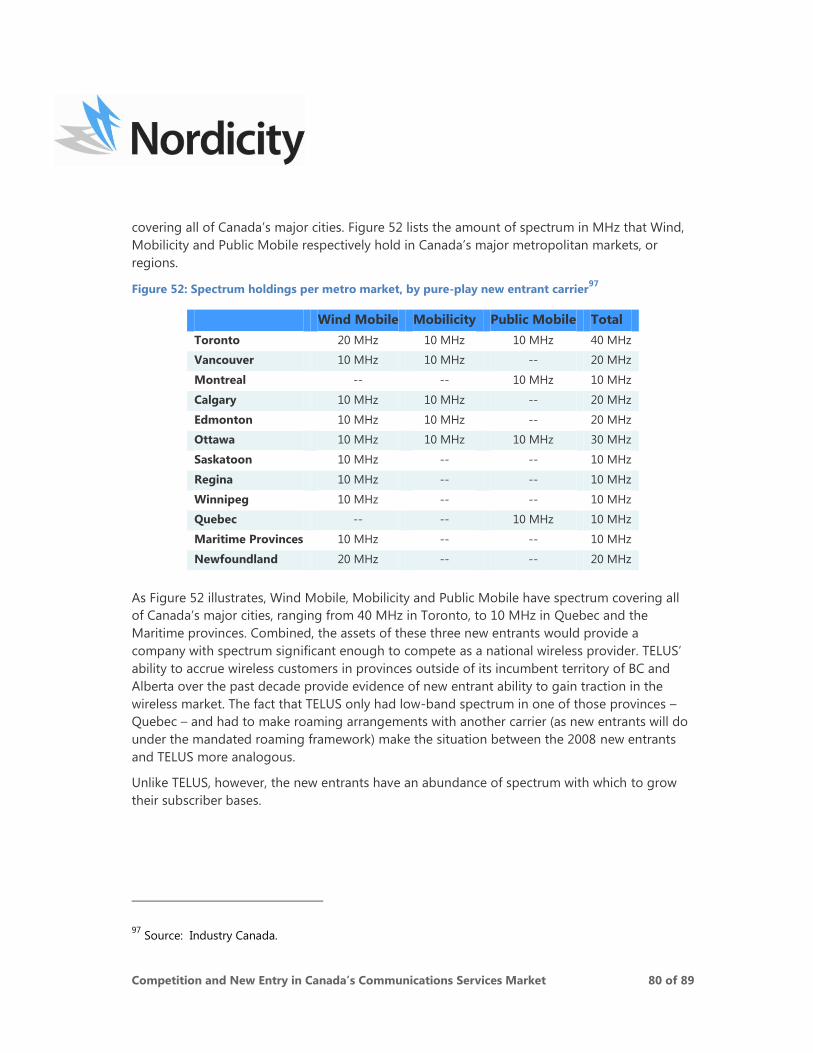
Competition and New Entry in Canada’s Communications Services Market 80 of 89
covering all of Canada‟s major cities. Figure 52 lists the amount of spectrum in MHz that Wind,
Mobilicity and Public Mobile respectively hold in Canada‟s major metropolitan markets, or
regions.
Figure 52: Spectrum holdings per metro market, by pure-play new entrant carrier97
Wind Mobile Mobilicity Public Mobile Total
Toronto 20 MHz 10 MHz 10 MHz 40 MHz
Vancouver 10 MHz 10 MHz -- 20 MHz
Montreal -- -- 10 MHz 10 MHz
Calgary 10 MHz 10 MHz -- 20 MHz
Edmonton 10 MHz 10 MHz -- 20 MHz
Ottawa 10 MHz 10 MHz 10 MHz 30 MHz
Saskatoon 10 MHz -- -- 10 MHz
Regina 10 MHz -- -- 10 MHz
Winnipeg 10 MHz -- -- 10 MHz
Quebec -- -- 10 MHz 10 MHz
Maritime Provinces 10 MHz -- -- 10 MHz
Newfoundland 20 MHz -- -- 20 MHz
As Figure 52 illustrates, Wind Mobile, Mobilicity and Public Mobile have spectrum covering all
of Canada‟s major cities, ranging from 40 MHz in Toronto, to 10 MHz in Quebec and the
Maritime provinces. Combined, the assets of these three new entrants would provide a
company with spectrum significant enough to compete as a national wireless provider. TELUS‟
ability to accrue wireless customers in provinces outside of its incumbent territory of BC and
Alberta over the past decade provide evidence of new entrant ability to gain traction in the
wireless market. The fact that TELUS only had low-band spectrum in one of those provinces –
Quebec – and had to make roaming arrangements with another carrier (as new entrants will do
under the mandated roaming framework) make the situation between the 2008 new entrants
and TELUS more analogous.
Unlike TELUS, however, the new entrants have an abundance of spectrum with which to grow
their subscriber bases.
97
Source: Industry Canada.
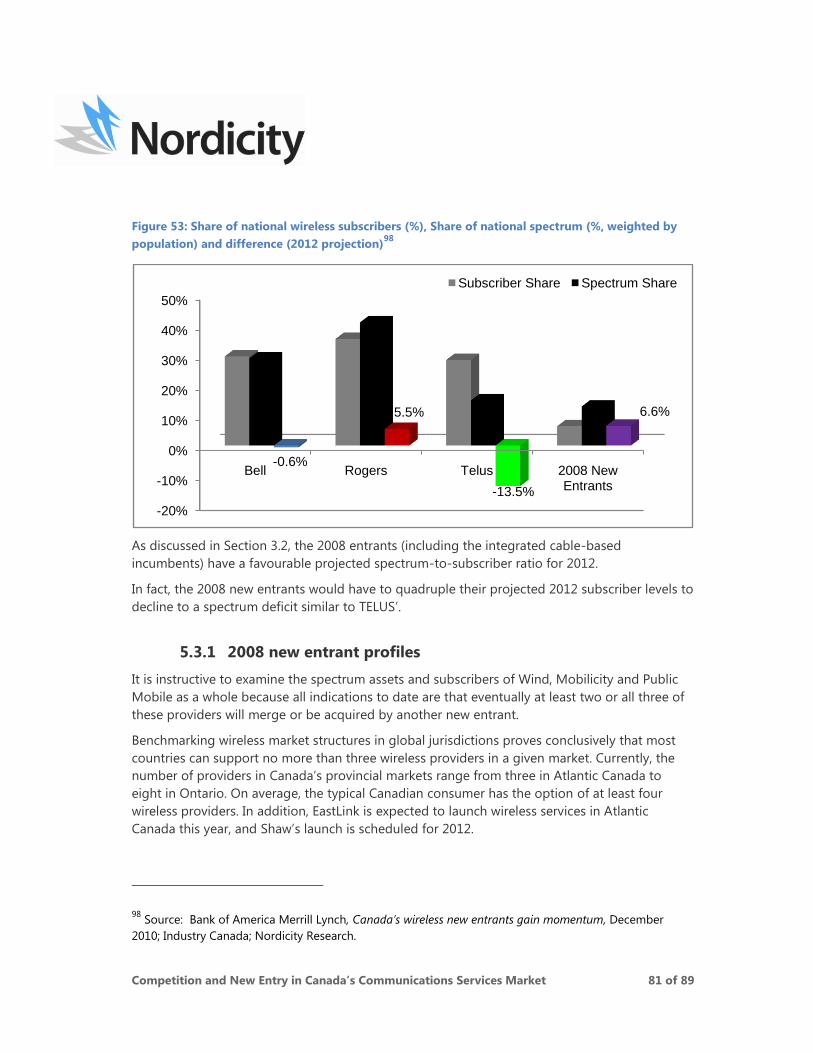
Competition and New Entry in Canada’s Communications Services Market 81 of 89
Figure 53: Share of national wireless subscribers (%), Share of national spectrum (%, weighted by
population) and difference (2012 projection)98
As discussed in Section 3.2, the 2008 entrants (including the integrated cable-based
incumbents) have a favourable projected spectrum-to-subscriber ratio for 2012.
In fact, the 2008 new entrants would have to quadruple their projected 2012 subscriber levels to
decline to a spectrum deficit similar to TELUS‟.
5.3.1 2008 new entrant profiles
It is instructive to examine the spectrum assets and subscribers of Wind, Mobilicity and Public
Mobile as a whole because all indications to date are that eventually at least two or all three of
these providers will merge or be acquired by another new entrant.
Benchmarking wireless market structures in global jurisdictions proves conclusively that most
countries can support no more than three wireless providers in a given market. Currently, the
number of providers in Canada‟s provincial markets range from three in Atlantic Canada to
eight in Ontario. On average, the typical Canadian consumer has the option of at least four
wireless providers. In addition, EastLink is expected to launch wireless services in Atlantic
Canada this year, and Shaw‟s launch is scheduled for 2012.
98
Source: Bank of America Merrill Lynch, Canada’s wireless new entrants gain momentum, December
2010; Industry Canada; Nordicity Research.
-20%
-10%
0%
10%
20%
30%
40%
50%
Bell Rogers Telus 2008 New Entrants
-0.6%
5.5%
-13.5%
6.6%
Subscriber Share Spectrum Share
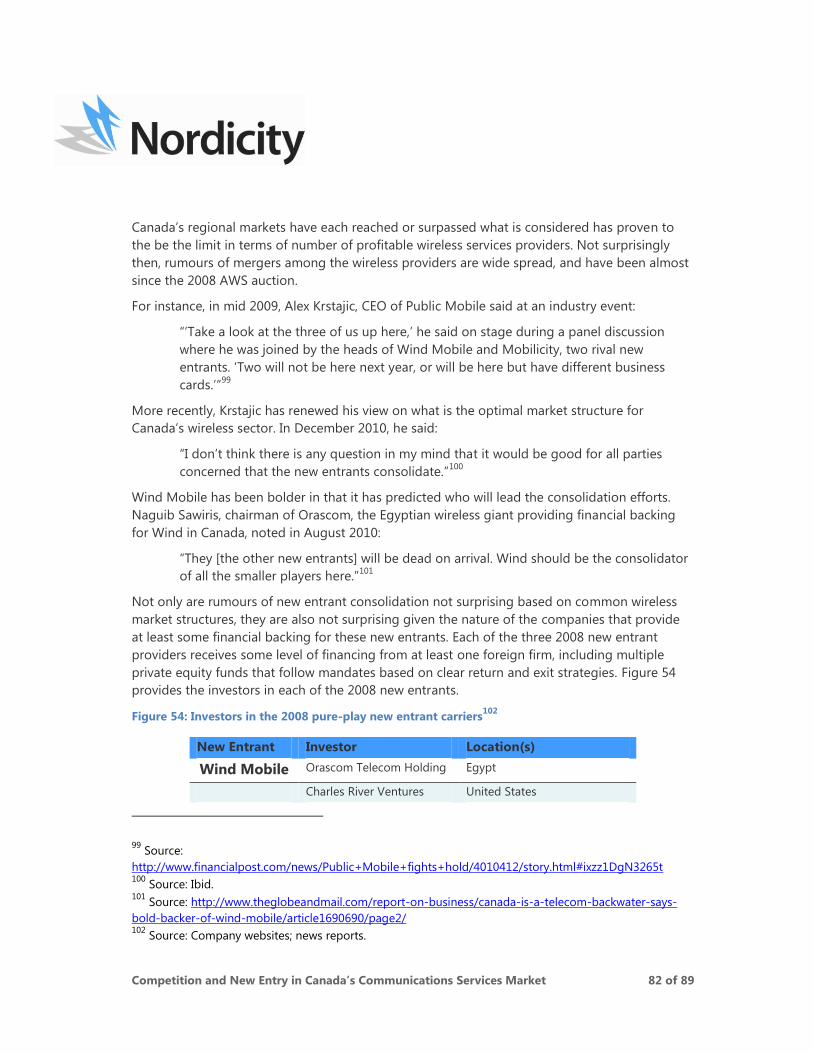
Competition and New Entry in Canada’s Communications Services Market 82 of 89
Canada‟s regional markets have each reached or surpassed what is considered has proven to
the be the limit in terms of number of profitable wireless services providers. Not surprisingly
then, rumours of mergers among the wireless providers are wide spread, and have been almost
since the 2008 AWS auction.
For instance, in mid 2009, Alex Krstajic, CEO of Public Mobile said at an industry event:
“‟Take a look at the three of us up here,‟ he said on stage during a panel discussion
where he was joined by the heads of Wind Mobile and Mobilicity, two rival new
entrants. „Two will not be here next year, or will be here but have different business
cards.‟”99
More recently, Krstajic has renewed his view on what is the optimal market structure for
Canada‟s wireless sector. In December 2010, he said:
“I don‟t think there is any question in my mind that it would be good for all parties
concerned that the new entrants consolidate.”100
Wind Mobile has been bolder in that it has predicted who will lead the consolidation efforts.
Naguib Sawiris, chairman of Orascom, the Egyptian wireless giant providing financial backing
for Wind in Canada, noted in August 2010:
“They [the other new entrants] will be dead on arrival. Wind should be the consolidator
of all the smaller players here.”101
Not only are rumours of new entrant consolidation not surprising based on common wireless
market structures, they are also not surprising given the nature of the companies that provide
at least some financial backing for these new entrants. Each of the three 2008 new entrant
providers receives some level of financing from at least one foreign firm, including multiple
private equity funds that follow mandates based on clear return and exit strategies. Figure 54
provides the investors in each of the 2008 new entrants.
Figure 54: Investors in the 2008 pure-play new entrant carriers102
New Entrant Investor Location(s)
Wind Mobile Orascom Telecom Holding Egypt
Charles River Ventures United States
99
Source:
http://www.financialpost.com/news/Public+Mobile+fights+hold/4010412/story.html#ixzz1DgN3265t 100
Source: Ibid. 101
Source: http://www.theglobeandmail.com/report-on-business/canada-is-a-telecom-backwater-says-
bold-backer-of-wind-mobile/article1690690/page2/ 102
Source: Company websites; news reports.
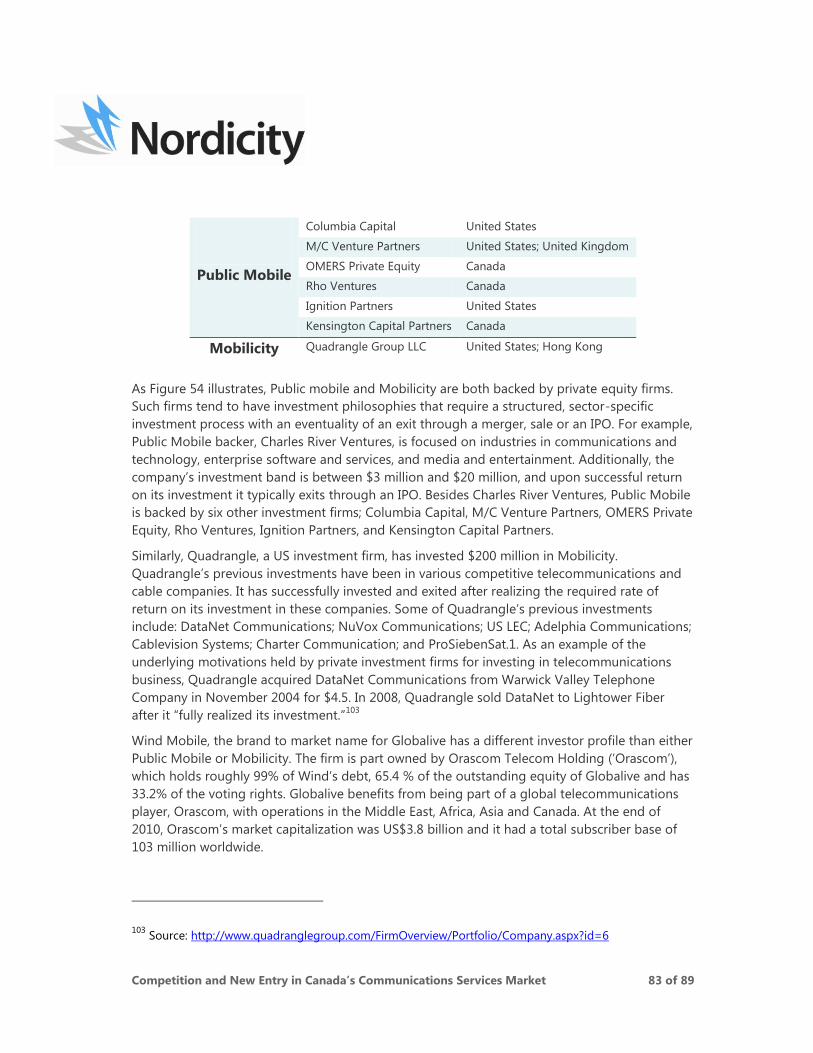
Competition and New Entry in Canada’s Communications Services Market 83 of 89
Public Mobile
Columbia Capital United States
M/C Venture Partners United States; United Kingdom
OMERS Private Equity Canada
Rho Ventures Canada
Ignition Partners United States
Kensington Capital Partners Canada
Mobilicity Quadrangle Group LLC United States; Hong Kong
As Figure 54 illustrates, Public mobile and Mobilicity are both backed by private equity firms.
Such firms tend to have investment philosophies that require a structured, sector-specific
investment process with an eventuality of an exit through a merger, sale or an IPO. For example,
Public Mobile backer, Charles River Ventures, is focused on industries in communications and
technology, enterprise software and services, and media and entertainment. Additionally, the
company‟s investment band is between $3 million and $20 million, and upon successful return
on its investment it typically exits through an IPO. Besides Charles River Ventures, Public Mobile
is backed by six other investment firms; Columbia Capital, M/C Venture Partners, OMERS Private
Equity, Rho Ventures, Ignition Partners, and Kensington Capital Partners.
Similarly, Quadrangle, a US investment firm, has invested $200 million in Mobilicity.
Quadrangle‟s previous investments have been in various competitive telecommunications and
cable companies. It has successfully invested and exited after realizing the required rate of
return on its investment in these companies. Some of Quadrangle‟s previous investments
include: DataNet Communications; NuVox Communications; US LEC; Adelphia Communications;
Cablevision Systems; Charter Communication; and ProSiebenSat.1. As an example of the
underlying motivations held by private investment firms for investing in telecommunications
business, Quadrangle acquired DataNet Communications from Warwick Valley Telephone
Company in November 2004 for $4.5. In 2008, Quadrangle sold DataNet to Lightower Fiber
after it “fully realized its investment.”103
Wind Mobile, the brand to market name for Globalive has a different investor profile than either
Public Mobile or Mobilicity. The firm is part owned by Orascom Telecom Holding („Orascom‟),
which holds roughly 99% of Wind‟s debt, 65.4 % of the outstanding equity of Globalive and has
33.2% of the voting rights. Globalive benefits from being part of a global telecommunications
player, Orascom, with operations in the Middle East, Africa, Asia and Canada. At the end of
2010, Orascom‟s market capitalization was US$3.8 billion and it had a total subscriber base of
103 million worldwide.
103
Source: http://www.quadranglegroup.com/FirmOverview/Portfolio/Company.aspx?id=6
Competition and New Entry in Canada’s Communications Services Market 84 of 89
5.4 Conclusions
The companies permitted to bid on set-aside spectrum in the 2008 AWS auction all
possess the resources – including financial backing, bundling ability, regional
communications market dominance, and spectrum – to compete openly in Canada’s
communications services industry.
Currently, six companies that acquired set-aside spectrum in the 2008 AWS auction under the
Industry Canada definition of „new entrants‟ are offering wireless services. It is anticipated that
two more, EastLink and Shaw, will launch wireless offerings in 2011 and 2012, respectively.
Examining these eight companies leads to multiple observations and conclusions with respect
to their ability to compete openly in Canada‟s wireless sector, including:
Five of the eight companies (Shaw, SaskTel, MTS, Videotron, and EastLink) are
incumbent communications services providers offering at least three communications
services and holding substantial significant regional market shares across multiple
service categories;
Shaw is the largest cable and overall subscription TV provider in Canada, holds nearly
10% of all communications services and broadcasting industry revenue and 37.8% of all
communications services revenue in its constable market, serves 14.5% of all Canadian
communications services subscribers (third most of any company) and has free cash
flow in excess of $500 million;
Videotron holds nearly 5% of all communications services and broadcasting industry
revenue and 35.7% of all communications services revenue in its constable market,
serves nearly 10% of all communications services subscribers (fifth most of any
company) and has free cash flow of roughly $467 million;
EastLink is the fifth-largest cable company in Canada and the only company to offer
cable services in all 10 provinces. By acquiring more than 15 other communications
services providers across the country over the past few decades, EastLink has proven it
has the resources to openly enter any Canadian communications services market;
Through their ability to raise prices, capture market share and bundle customers, Shaw
and Videotron have proven they are the dominant communications services companies
within their cable territories;
SaskTel and MTS, both incumbent provincial telecom providers, have each been
operational for more than 100 years, have offered wireless service for more than two
decades, and currently reach roughly 55% and 45% of their total provincial
communications services users;
With provincial wireless subscriber market shares of 76% and 55%, respectively, SaskTel
and MTS are the leading wireless services providers in what are two of the three least
Competition and New Entry in Canada’s Communications Services Market 85 of 89
competitive markets in Canada. Advantaged by the 2008 AWS auction framework as
„new entrants,‟ neither carrier increased competitiveness in the national market by
acquiring spectrum outside of its incumbent territory. Rather the companies spent a
combined $105 million to secure additional spectrum covering their respective
provinces;
Each of the three companies that entered Canada‟s communications market through
spectrum acquired in the 2008 AWS auction – Wind Mobile, Mobilicity and Public
Mobile – is financially backed to varying degrees by at least one foreign company,
including multiple private equity funds. Many of these private equity firms follow
mandates to enter markets under favourable conditions with the eventuality of exiting
through a merger, sale or IPO.
The three 2008 new entrants have been open about likely consolidation amongst
themselves, making the prospect of multiple foreign based private equity firms being
among the chief beneficiaries of the 2008 AWS new entrant framework.
Competition and New Entry in Canada’s Communications Services Market 86 of 89
6. Conclusions
A review of Canada‟s communications services market and its competitors results in the
following conclusions and supporting arguments:
6.1 Canada’s wireless sector is as competitive, if not more competitive
than any other Canadian communications services sector, particularly
so when compared to the subscription TV sector:
The average Canadian has more choice in facilities-based wireless services than for any
other communications service, while most Canadians are limited to one cable and one
satellite provider;
Wireless voice ARPU has not experienced a year-over-year percentage increase greater
than that of the consumer price index since 2007, and voice ARPU has increasingly
declined since 2008. In addition, wireless voice ARPU declined by 2.03% on an average
annual basis between 2005 and 2009, well below the average CPI increase of 1.63%.
Conversely, TV ARPU growth has greatly outpaced that of all other communications
services as well as the CPI, increasing in a way that suggests de facto monopoly power;
Cable continues to increase its share of national landline communications services
revenue, and in all likelihood has now passed the traditional telecommunications
services network as the leading landline platform. This growth continues in spite of the
fact that three of the four largest cable companies in the country (Shaw, Videotron and
Cogeco) had no wireless offering in their bundle until recent months. Conversely, the
operators of the four largest telecommunications infrastructures in the country (TELUS,
Bell, MTS and SaskTel) have offered wireless services for more than two decades, yet
continue to lose overall landline market share to cable, demonstrating cable TV
unmatched strength as the anchor of a service bundle.
6.2 Canada’s wireless sector has significant national and regional
competition, and there are considerable differences in spectrum need
amongst the wireless carriers:
Rather than equitably sharing the growth in the national wireless market, Canada‟s five
historical wireless providers have competed vigorously for new subscriber additions
over the past five years, with corporate percentage subscriber growth ranging from
55% to 30% over that time. A snapshot of the percentage of net subscriber additions
captured by the three national carriers over the past three years shows a very
competitive market share disbursement of 33.2% for TELUS, 29.4% for Rogers and
22.4% for Bell;
Competition and New Entry in Canada’s Communications Services Market 87 of 89
Collectively, the 2008 entrants captured 33.7% of the net additions in Q4 2010, and
23.2% of the net additions overall for the full year 2010;
With an average of 6.6 spectrum holders per province, and a minimum of five per
province, spectrum is currently shared between a significant number of providers on
provincial level. In 2004 only two provinces – Ontario and Quebec – had a third wireless
carrier with at least 15% of subscribers. By 2009, seven provinces had a third provider
with at least 15% of subscribers. The only provinces where this wasn‟t the case are
Manitoba, Saskatchewan and Newfoundland.
It is estimated that by 2012, 2008 entrant providers will have roughly 6.4% of national
wireless subscribers and 13% of all national spectrum, providing the collective 2008
entrant providers the largest spectrum/subscriber ratio of all carriers. Conversely, with
an estimated 28.5% of national subscribers and only 15% of national spectrum, TELUS
will continue to have the worst spectrum/subscriber ratio through 2012.
6.3 Canada’s wireless fees and market structure compare favourably with
other developed wireless sectors around the world, in spite of the
difficult operating conditions presented by the Canada’s dispersed
population:
Canada has the seventh lowest average revenue per minute out of 21 developed
international wireless market. At an average of $674.70 in total wireless revenue per
square kilometre per month, Canada only ranks ahead of Australia in terms of the least
profitable networks. The US market generates nearly 2.7 times as much revenue per
square kilometre than Canada, and the UK market nearly 14 times more. Average
revenue per square kilometre in Canada is more than eight times less than the average
of the developed wireless market, and nearly 25 times less than the Netherlands – the
leading country;
Based on the Teligen methodology for comparing international wireless prices:
o For a calling profile of 100 monthly calls and roughly 188 minutes of use,
Canada ranks 13th out of 19 developed markets;
o For a calling profile of 300 monthly calls and roughly 589 minutes of use,
Canada ranks as having the eighth-lowest price of the 19 developed wireless
markets;
o Canadian mobile users can expect to pay only a 16.5% premium for tripling call
volume from 100 calls to 300 calls per month, which ranks fourth among all
developed wireless markets.
Competition and New Entry in Canada’s Communications Services Market 88 of 89
Canada‟s wireless market is structured very similarly to that of other international
markets, particularly in terms of combined subscriber share between the two leading
carriers. At 66.4% subscriber share between Bell and Rogers, Canada‟s market structure
falls within the international trend that sees the two leading carriers in 16 of 20
developed markets combine for between 63% and 77% subscriber share. At 8.3%, the
gap in subscriber shares between Canada‟s leading and third-largest wireless carrier is
the second lowest of all developed markets, eliminating any possibility of the duopoly
structures that are common in other international wireless sectors;
Markets such as the US, which has ten times more wireless subscribers and more than
double the density of subscribers as Canada, struggle to support more than four
wireless carriers, further confirming the natural structure of Canada‟s wireless market. In
fact, in Australia, a market very similar in terms of population and geography to
Canada‟s, the third- and fourth-largest carriers merged in 2009 to create a market
structure almost identical to Canada‟s.
6.4 The companies permitted to bid on set-aside spectrum in the 2008
AWS auction all possess the resources – including financial backing,
bundling ability, regional communications market dominance, and
spectrum – to compete openly in Canada’s communications services
industry:
Five of the eight companies (Shaw, SaskTel, MTS, Videotron, and EastLink) are
integrated incumbent communications services providers offering at least three
communications services and holding substantial significant regional market shares
across multiple service categories, three of which are dominant cable-based
incumbents and two are regional wireless incumbents;
Among the cable-based integrated communications services incumbents:
o Shaw is the largest cable and overall subscription TV provider in Canada, holds
nearly 10% of all communications services and broadcasting industry revenue,
serves 14.5% of all Canadian communications services subscribers (third most
of any company) and has free cash flow in excess of $500 million;
o Videotron holds nearly 5% of all communications services and broadcasting
industry revenue, serves nearly 10% of all communications services subscribers
(fifth most of any company) and has free cash flow of roughly $467 million; and
o EastLink is the fifth largest cable company in Canada and the only company to
offer cable services in all 10 provinces. By acquiring more than 15 other
communications services providers across the country over the past few
Competition and New Entry in Canada’s Communications Services Market 89 of 89
decades, EastLink has proven it has the resources to openly enter any Canadian
communications services market.
Among the regional wireless incumbents:
o SaskTel and MTS have each been operational for more than 100 years, have
offered wireless service for more than two decades, and currently reach roughly
55% and 45% of their total provincial communications services users;
o With provincial wireless subscriber market shares of 76% and 55%, respectively,
SaskTel and MTS are the leading wireless services providers in what are two of
the three least competitive markets in Canada. Advantaged by the 2008 AWS
auction framework as „new entrants,‟ neither carrier increased competitiveness
in the national market by acquiring spectrum outside of its incumbent territory.
Rather the companies spent a combined $105 million to secure additional
spectrum covering their respective provinces;
The three other companies that have effectively entered Canada‟s communications
market through spectrum acquired in the 2008 AWS auction – Wind Mobile, Mobilicity
and Public Mobile – are financially backed to varying degrees by at least one foreign
entity, including multiple private equity funds that follow mandates to enter markets
under favourable conditions with the eventuality of exiting through a merger, sale or
IPO;
Although the three pure-play new entrants have the spectrum and the financial
resources to attempt to compete in Canada‟s wireless market for years, they have
speculated openly about the option of benefiting from the 2008 auction set-aside by
selling their spectrum and network assets.


