Competition and substitution in energy: old scenarios and emerging technologies Mohammad Salim Zahangir PhD student Supervisor: Prof. Cinzia Mortarino Department of Statistical Sciences, University of Padova March 15, 2017
Transcript
Competition and substitution inenergy: old scenarios and emerging
technologies
Mohammad Salim ZahangirPhD student
Supervisor: Prof. Cinzia MortarinoDepartment of Statistical Sciences, University of Padova
March 15, 2017
Overview
PhD in Statistical Sciences
1st year: courses for theoretical deepening of important
mathematical and statistical topics
Original project (started in October 2016)
3 Dataset (Belgium, China, Finland, France, Germany, India, Japan,Spain, Sweden, Switzerland, UK, USA)
Univariate diffusion models (unnecessary)
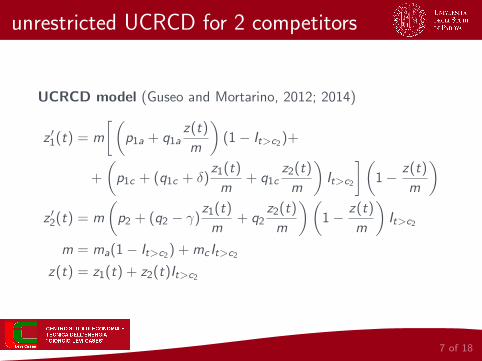
3 UCRCD and CRCD models: 2 competitors
Dynamic market potential (to be done in the next months)
3 Incorporate intervention functions
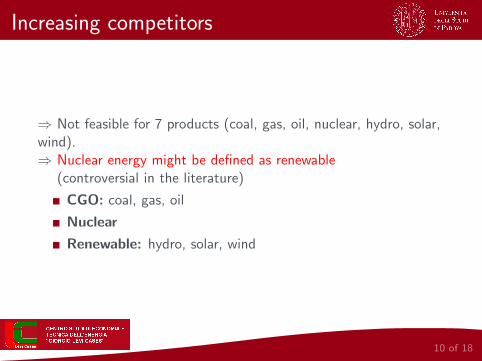
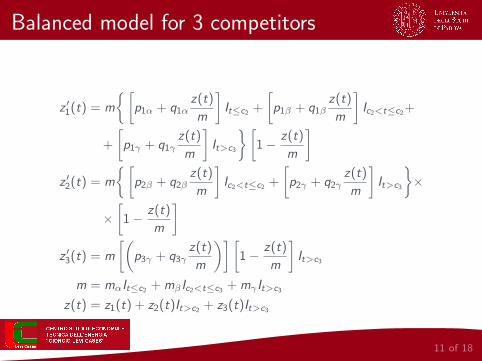
3 Extend the competition models: 3 competitors
2 of 18
Question
Competition among energy sources?
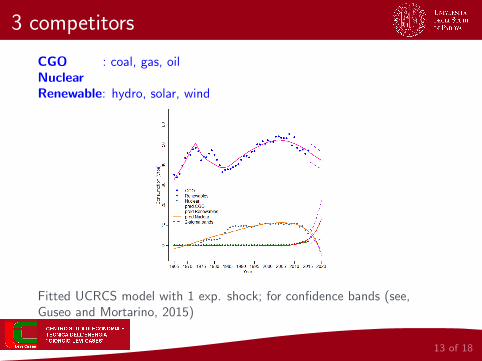
Still, most of electricity produced with depleting energysources (e.g., coal, gas, oil, nuclear).
Beside the problem of fuel depletion, climate change andpollution produced by fossil fuels.
Renewable sources of energy appear a viable option to dealwith all these problem⇒ solar technology has already made significant progress in ashort amount of time (The Economist, June 6, 2015).
Renewable energy sources is gaining market share against othersources.
3 of 18
Models for competition
Two versions
Balanced model
A model where the word-of-mouth (w.o.m) affects only at thecategory level instead of brand level, i.e. the w.o.m effect does notseparate the adoptions of each brand from those of competitors.
Unbalanced model
A model where the w.o.m affects at the brand level, i.e. separatingthe within-brand from the cross-brand w.o.m effects.
4 of 18
2 types of competitions
Synchronic competition
It means there are simultaneous market entries for the competingbrands (products).
Diachronic competition
It means there are sequential market entries of the competingbrands (products). Diachronic competition creates the ’regimechange’ problem for the previously entered pioneers.
5 of 18
Sources of energy
Usually, feasible competition models deal with 2 products due toparameters’ complexity
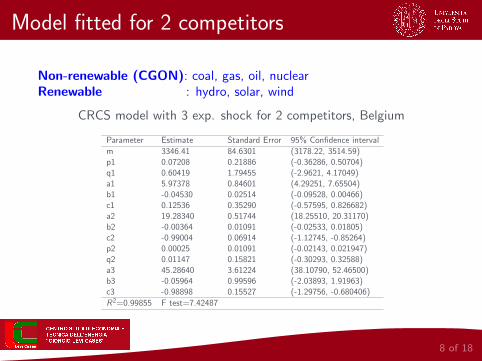
Renewable
Renewable sources of energy are those that are replenished by theenvironment over relatively short periods of time. Solar, wind,water, biomass, etc.
Non-renewable
Non-renewable energy comes from sources that will run out or willnot be replenished in our lifetimes. Coal, gas, oil and nuclear.
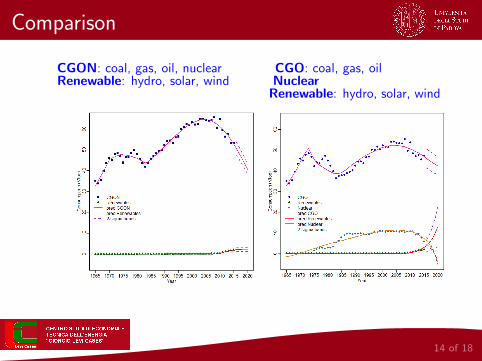
For almost all 12 countries analyzed our extended models for3 competitors give narrower confidence bands than theexisting models for 2 competitors.
Narrower confidence bands correspond to a reducedforecasting uncertainty⇒ the new model allows more precise forecasting.
15 of 18
Future plans
Complete comparisons between 2-product models and3-product models.
Improve model accuracy with a more flexible market potentialdefinition (in the analyzed models a fixed market potentialwas assumed).
Evaluate feasibility of 4-product models
16 of 18
References
1 Guseo, R. and Mortarino, C. (2012). Sequential market entries andcompetition modeling in multi-innovation diffusions. EuropeanJournal of Operation Research 216:658-667.
2 Guseo, R. and Mortarino, C. (2014). Within-brand and cross-brandword-of-mouth for sequential multi-innovation diffusions. IMAJournal of Management Mathematics 25:287-311.
3 Guseo, R. and Mortarino, C. (2015). Modeling competition betweentwo pharmaceutical drugs using innovation diffusion model. TheAnnals of Applied Statistics 9(4):2073-2089.
4 Savin, S. and Terwiesch, C. (2005). Optimal product launch timesin a duopoly: balancing life-cycle reveneues with product cost.Operation Research 53:26-47.