COMPETITIVE CONDITIONS IN BANKING INDUSTRY: AN EMPIRICAL ANALYSIS OF THE CONSOLIDATION, COMPETITION AND CONCENTRATION IN THE INDONESIA BANKING INDUSTRY BETWEEN 2001 AND 2009 Tri Mulyaningsih 1 Anne Daly 2 Few large banks dominate the Indonesia banking industri. Furthermore, in the past ten years, there were a series of mergers and acquisitions in the banking market. The facts cause implications on competition. In this paper, we examine these issues exploiting an unconsolidated annual financial report of all commercial banks between 2001 and 2009. The Panzar-Rose method is employed to examine the banks behavior in competition. Estimates indicate that banks in all three subsamples, large; medium-sized and small are working in a monopolistically competitive market. The analysis of market concentration supports the conventional view that concentration impairs competition. The study shows that the most competitive market was the medium-sized banks because it was least concentrated. In contrast, the large market was more concentrated thus it was less competitive. The consolidation policies driven by the Central Bank reduced market concentration because mergers and acquisitions were mostly conducted by the medium- sized and small banks. Further the improvement of market share distribution and the increasing capacity of the merging banks enhanced competition in the Indonesia banking industry. Keywords: Banking, market competition, market structure JEL Classification: D43, G21 1 Doctoral Student, Faculty of Business and Government, University of Canberra Corresponding author: [email protected]2 Professor in Economics, Faculty of Business and Government, University of Canberra Corresponding author: [email protected]Abstract
Transcript
141Competitive Conditions in Banking Industry: An empirical Analysis of the Consolidation, Competition andConcentration in the Indonesia Banking Industry between 2001 and 2009
COMPETITIVE CONDITIONS IN BANKING INDUSTRY:AN EMPIRICAL ANALYSIS OF THE CONSOLIDATION,
COMPETITION AND CONCENTRATION INTHE INDONESIA BANKING INDUSTRY BETWEEN 2001 AND 2009
Tri Mulyaningsih 1
Anne Daly 2
Few large banks dominate the Indonesia banking industri. Furthermore, in the past ten years, there
were a series of mergers and acquisitions in the banking market. The facts cause implications on competition.
In this paper, we examine these issues exploiting an unconsolidated annual financial report of all commercial
banks between 2001 and 2009. The Panzar-Rose method is employed to examine the banks behavior in
competition. Estimates indicate that banks in all three subsamples, large; medium-sized and small are
working in a monopolistically competitive market. The analysis of market concentration supports the
conventional view that concentration impairs competition. The study shows that the most competitive
market was the medium-sized banks because it was least concentrated. In contrast, the large market was
more concentrated thus it was less competitive. The consolidation policies driven by the Central Bank
reduced market concentration because mergers and acquisitions were mostly conducted by the medium-
sized and small banks. Further the improvement of market share distribution and the increasing capacity
of the merging banks enhanced competition in the Indonesia banking industry.
1 Doctoral Student, Faculty of Business and Government, University of Canberra Corresponding author: [email protected] Professor in Economics, Faculty of Business and Government, University of Canberra Corresponding author: [email protected]
Abstract
142 Bulletin of Monetary Economics and Banking, October 2011
I. INTRODUCTION
The Indonesia banking industry experienced a structural change in 1990 where the number
of banks increased significantly. The change in market structure was promoted by the
deregulation policy in the banking sector in 1980s. Through the second deregulation in October
1988 the government removed barriers to entry to the banking sector. The minimum capital
requirement was lowered and it was easier for banks to obtain licenses to undertake foreign
exchange operations (McLeod, 1999). In addition, if the license was obtained, all branches
were automatically eligible to provide foreign exchange services.
After a series of deregulation policies during 1980s, the authorities decided to reduce
the speed of the banking expansion. During 1995 and 1996, the Central Bank introduced
some policies related to the prudential aspect of banks. McLeod (1999, p. 281-285) explained
that during those periods the Central Bank re-regulated the industry by re-imposing controls of
Table 1.The Microeconomic Policies in Indonesia Banking 1983 - 1997
Y e a r Policy Details
Removing the control on the interest rates of time deposits of State Owned Banksand the lending of all banks.
1. Opening the banking industry to the new private banks and the new joint venturebanks by lowering minimum capital requirement.
2. Removing business restrictions such as easing requirement of the existing banksto expand their branch easily; limit on interbank borrowing and permitting banksto introduce savings deposits product of their own design.
1. Opening the market by permitting foreign investors to purchase shares indomestic banks listed on the stock exchange
2. Partial privatizing by permitting State Owned Banks to list on capital market
1. Re-imposing the controls of bank lending;2. Extending the control to bank involvement with commercial paper issues;3. Extending the supervisory to non-bank finance company; increased the required
reserve ratio;4. Tightening of licensing of new bank branches;5. Imposing the fines on banks which expand more rapidly than permitted;6. Increasing the required reserve ratio and tightening prudential regulation
Source: McLeod (1999, p. 293-295) and Chua, BH (2003)
143Competitive Conditions in Banking Industry: An empirical Analysis of the Consolidation, Competition andConcentration in the Indonesia Banking Industry between 2001 and 2009
bank lending (in 1995); extending the control to bank involvement with commercial paper
issues (in August 1995); extending supervision to non-bank finance companies (December
1995); increasing the required reserve ratio (February 1996); tightening of licensing of new
bank branches (June 1996); increasing the required reserve ratio and tightening prudential
regulation (in April 1997). Further, the 1997 economic crisis had heightened the importance of
re-structuring the industry as well as increasing prudential concern.
The consolidation was started on December 1997. The 1997 economic crisis generated
distress in the banking industry. In order to improve the performance of the state owned banks,
the Central Bank decided to merge four State Owned Banks. The authorities also closed the
operation of twenty three banks in 1997. The liquidation policies contributed to the reduction
on the number of banks. The consolidation process was continued by the introduction of the
Indonesia Banking Architecture (API) on January 2004. The policy essentially encourages banks
to reach their economies of scale as well as fosters the creation of a healthy banking system.
Table 2.The Microeconomic Policies in Indonesia Banking 1997 - 2010
Y e a r Policy Details
1. Banks liquidation (23 banks).
2. Banks recapitalization
3. Merger of 4 State Owned Banks became Bank Mandiri
Privatization of the bailout banks under the Indonesia Banking Restructuring Agency
(IBRA)
The introduction of the Indonesia Banking Architecture (API)
A series of mergers and consolidation conducted in banking to comply with Single
Source: Chua, BH (2003) and Central Bank of Indonesia (2010)
The banking architecture provides direction of the Indonesia banking system development
in the next ten years. The policy aims to create a strong, healthy and efficient banking structure.
In order to achieve its objectives, the Central Bank developed six pillars which are creating a
healthy domestic banking industry; inventing an effective system for regulating the banking
sector based on international standards; increasing the monitoring function of central banks
based on international standards; creating a strong banking industry with highly competitive
144 Bulletin of Monetary Economics and Banking, October 2011
banks and fostering good corporate governance; realizing the proper infrastructure to support
the creation of a healthy banking system; and lastly increasing consumers» empowerment and
protection (Bank of Indonesia, 2010).
We suspect that at least two policies under the Indonesian Banking Architecture will
directly affect the market structure and competition in the banking industry. First is the minimum
capital requirement as regulated under the Central Bank Regulation number 10/15/PBI/2005.
The second policy is the single presence policy as explained in the Central Bank Regulation
number 8/16/PBI/2006.
Under Indonesian Banking Architecture, banks must increase their capital which is aligned
with their business scale (Bank of Indonesia, 2010). Bigger capital will enable banks to maintain
their business and risk develop the infrastructure such as information technology and increase
the scale of support of the expansion of credit capacity. Capital consists of in-paid capital and
disclosed reserves. According to the regulation, all existing banks, including the banks established
by regional governments, should attain minimum capital of Rp100 billion by 31 of December
2010 otherwise the Central Bank will impose several restrictions to the banks. In order to
increase capital, banks are allowed to receive additional capital injections from existing owners,
Figure 1.The Vision of Indonesian Banking Architecture Policy in 2014
Capital(Trillion)
Micro Bank Bank with Limited Business
Bank with Certain Focus
Corporate Retail Others
NationalBank
50
0.1
10
International
Local
Source: The Central Bank of Indonesia, (2010), Indonesian Banking Architecture, www.bi.go.id
145Competitive Conditions in Banking Industry: An empirical Analysis of the Consolidation, Competition andConcentration in the Indonesia Banking Industry between 2001 and 2009
merge with other banks, be acquired by bigger banks, or sell their shares on the capital market
(Bank of Indonesia, 2010). In the next ten or fifteen years, the Central Bank plans to reduce the
number of banks to 60, which consisting of 2-3 international banks, 3-5 national banks, and
30-50 specialized banks (Bank of Indonesia, 2010).
The single presence policy was introduced to re-arrange the structure of bank ownership
(the regulation of Bank of Indonesia, Number 8/16/PBI/2006). Single ownership refers to the
condition where one party is just eligible to be a main shareholder in one bank. The regulation
applies to shareholders who owned more than 25 per cent and those with ownership less than
25 percent but can control the banks. According to the rule, there should be an adjustment of
ownership structure by transferring the ownership (some or all) to one bank. Therefore they
only become a main shareholder in one bank. In addition, banks under the same ownership are
encouraged to merge. At last, they can set up a Bank Holding Company.
The study aims to assess the impact of consolidation policies in the banking industry on
market condition. The consolidation policy was started from the 1997 economic crisis and was
further enhanced by the introduction of the Indonesia Banking Architecture on January 2004.
Referring to Table 3, a large number of mergers and acquisitions took place in the Indonesia
banking industry between 1997 and 2010. One merger occurred in large bank market conducted
by the Bank Niaga and Bank Lippo in order to comply with the single presence policy. In addition,
there were 7 mergers in medium-sized banks and 7 mergers conducted by small banks.
A series of mergers and acquisitions reduces the number of banks. This raises some
important issues such as, whether a smaller number of banks reduced or increased the degree
of concentration in the banking industry; whether a smaller number of banks created a more
concentrated market or improved the market share distribution. Further we are also interested
in understanding the competition in the banking industry during the implementation of
consolidation policy, and whether consolidation generates a significant change in the
competition. Lastly, this paper would like to examine the link between the degree of market
concentration and the nature of competition during the consolidation process in the Indonesia
banking industry.
146 Bulletin of Monetary Economics and Banking, October 2011
Table 3.The list of mergers and acquisition between 2000 and 2010
Bank Category Merging Bank
PT Bank Niaga
PT Bank Lihalo
Bank Dai-Ichi Kanggo
Bank IBJ Indonesia
Bank Bali
Bank Artha Media
Bank Universal
Bank Prima Express
Bank Patriot
PT Bank Sumitomo Mitsuo
Indonesia
Sakura Swadarma Bank
UFJ Indonesia Bank
Tokai Lippo Bank
UFJ Indonesia
PT Bank of Tokyo
Mitsubishi
Bank Hagakita
Bank Haga
Bank Rabobank Duta
Bank Buana
Bank UOB Indonesia
Bank Pikko
Bank CIC
Bank Danpac
Bank Artha Graha
Bank Inter-pacific Tbk.
Commonwealth Indonesia
Artha Niaga Kencana
Bank Multicor
Bank Windu Kentjana
Bank Harmoni
International
Bank Index Selindo
Bank Haga
Bank Hagakita
Bank OCBC
Bank NISP
Large Banks
Medium-Sized
Banks
Small Banks
Source: Banks» Annual Financial Report Published by the Central Bank of Indonesia
No Year Nama of New Bank
1
1
2
3
4
5
6
7
1
2
3
4
5
6
7
2008
2000
2001
2001
2001
2006
2008
2010
2001
2001
2004
2005
2007
2007
2008
2008
2009
PT Bank CIMB Niaga Tbk
PT Bank Mizuho Indonesia
PT Bank Permata Tbk
PT Bank Sumitomo Mitsuo Indonesia
UFJ Indonesia Bank
PT Bank of Tokyo Mitsubishi UFJ Ltd.
PT Bank Rabobank International
Indonesia Bank
PT Bank UOB Buana Tbk
PT Bank Mutiara Tbk
PT Bank Artha Graha International
Tbk
PT Bank Commonwealth
PT Bank Windu Kentjana
International Tbk.
PT Bank Index Selindo
Rabobank Duta Bank
PT Bank OCBC-NISP Tbk
147Competitive Conditions in Banking Industry: An empirical Analysis of the Consolidation, Competition andConcentration in the Indonesia Banking Industry between 2001 and 2009
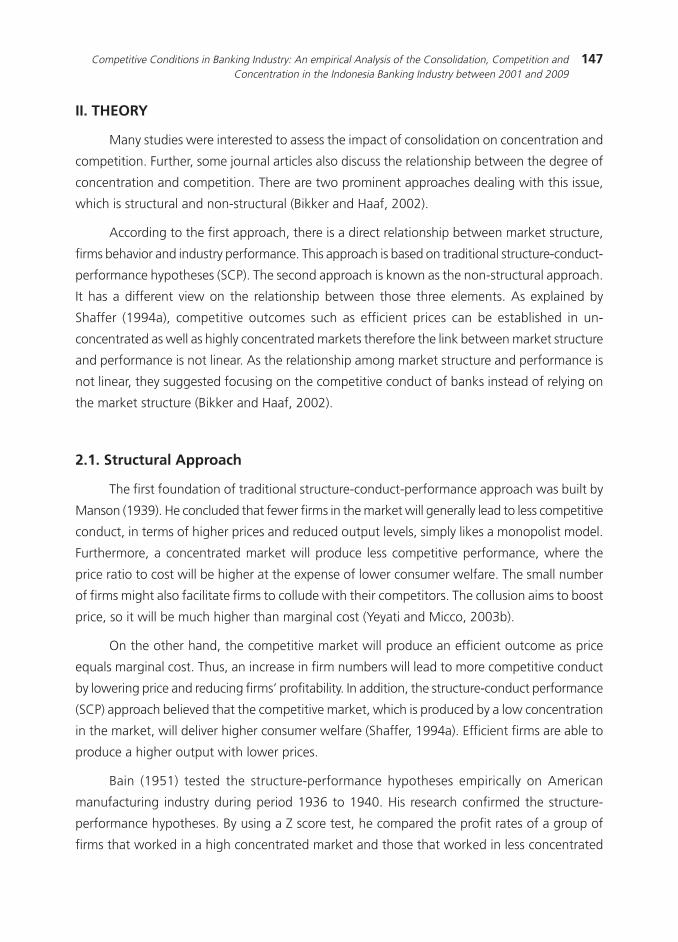
II. THEORY
Many studies were interested to assess the impact of consolidation on concentration and
competition. Further, some journal articles also discuss the relationship between the degree of
concentration and competition. There are two prominent approaches dealing with this issue,
which is structural and non-structural (Bikker and Haaf, 2002).
According to the first approach, there is a direct relationship between market structure,
firms behavior and industry performance. This approach is based on traditional structure-conduct-
performance hypotheses (SCP). The second approach is known as the non-structural approach.
It has a different view on the relationship between those three elements. As explained by
Shaffer (1994a), competitive outcomes such as efficient prices can be established in un-
concentrated as well as highly concentrated markets therefore the link between market structure
and performance is not linear. As the relationship among market structure and performance is
not linear, they suggested focusing on the competitive conduct of banks instead of relying on
the market structure (Bikker and Haaf, 2002).
2.1. Structural Approach
The first foundation of traditional structure-conduct-performance approach was built by
Manson (1939). He concluded that fewer firms in the market will generally lead to less competitive
conduct, in terms of higher prices and reduced output levels, simply likes a monopolist model.
Furthermore, a concentrated market will produce less competitive performance, where the
price ratio to cost will be higher at the expense of lower consumer welfare. The small number
of firms might also facilitate firms to collude with their competitors. The collusion aims to boost
price, so it will be much higher than marginal cost (Yeyati and Micco, 2003b).
On the other hand, the competitive market will produce an efficient outcome as price
equals marginal cost. Thus, an increase in firm numbers will lead to more competitive conduct
by lowering price and reducing firms» profitability. In addition, the structure-conduct performance
(SCP) approach believed that the competitive market, which is produced by a low concentration
in the market, will deliver higher consumer welfare (Shaffer, 1994a). Efficient firms are able to
produce a higher output with lower prices.
Bain (1951) tested the structure-performance hypotheses empirically on American
manufacturing industry during period 1936 to 1940. His research confirmed the structure-
performance hypotheses. By using a Z score test, he compared the profit rates of a group of
firms that worked in a high concentrated market and those that worked in less concentrated
148 Bulletin of Monetary Economics and Banking, October 2011
market. He found that the profits rates of firms in industries of high seller concentration should
on average be larger than those firms in industries of lower concentration.
Calem and Carlino (1991) found a correlation between market concentration and
performance in banking. Bain employed profit to assess market performance, Calem and Carlino
tried to use price to reflect market performance. Their conclusion supported traditional structure-
performance hypotheses that the concentrated market might contribute to collusive behavior
(Calem and Carlino, 1991). Further, the research claimed that the concentrated market is inefficient
because prices are higher than marginal cost. It is also not equitable because concentrated
market produces higher profits at the expense of consumers (Berger and Hannan, 1989).
The structural approach has become the foundation of antitrust policy in many countries.
The US Department of Justice has long adhered to this view by maintaining an explicit policy of
challenging mergers between rival firms that result in concentration levels above certain threshold
(Shaffer, 1994b). The Indonesia Legislation number 5, 1999 employs the structural approach to
determine the unlawful conduct of firms based on its impact to competition. The Law applies
to all industries. Further, according to the Government Regulation number 28/ 1999 on article
8 (2), we can find that the merged banks could not have the asset (after merger) of more than
20 percent of total assets in the banking industry. Thus, 20 percent is perceived as the threshold
where the merger would bring a negative effect into competition.
2.2. Non Structural Approach
The first argument against the traditional structure performance hypotheses came from
Demzets (1973) and Pelzman (1977). According to them, the source of concentration is efficiency
instead of market power. Their finding is labeled as Efficiency-Structure hypotheses. They
explained that the difference in firm-specific efficiencies within markets can create unequal
market shares and high level of concentration. The difference in efficiency might be derived
from superior management and production technology (Neuberger, 1997).
Manson implicitly assumes that the concentrated market facilitates firms to boost price.
Therefore market, where the price is higher than the marginal cost, perceives as less efficient.
Shaffer (1994b) argued that lower price is not a good indication to measure the market efficiency.
He defended his idea with the explanation that any extra efficiency among leading firms in a
competitive market would tend to show up as lower, not higher, prices.
SCP assumes that there is a single-way relationship between structure, conduct and
performance. Hence, market structure affects the firms» behavior further the behavior influences
149Competitive Conditions in Banking Industry: An empirical Analysis of the Consolidation, Competition andConcentration in the Indonesia Banking Industry between 2001 and 2009
the market performance. The causal relationship becomes unclear because firms» decision to
enter the market might be affected by the expectations of the degree of competition in the
market stage (Vesalla, 1995, p. 18). The non-structural approach argued that both the market
structure and firms» conduct are endogenous, since there is a feedback effects from conduct
back to market structure (Vesalla, 1995, p.18). In addition, market performance may also
influence the firms» decision to enter the market.
The non-structural approach claimed that the firms» profit is a poor measure of market
power. Vesalla (1995) argued that market power and profits are not necessarily positively
correlated (p. 19). The monopolists tend to be less efficient and it will affect the firms» profitability.
Hence inefficient behavior will reduce the profit rather than increase the firms» profit.
After that some researchers tried to use the Lerner Index to measure the market
performance. Shaffer evaluated the usage of the Learner Index as a measurement of market
performance. Shaffer (1994b) proved that the Learner index is a poor proxy of social welfare
because the linkage between the index and total welfare is not monotonic. The decreasing
number of firms reduces consumers surplus, but it increases producer surplus. Thus, mergers
may increase total surplus if the cost efficiency derived from mergers is higher than the reduction
of consumer surplus. Further, Shaffer (1994b) suggested measuring the cost structure as an
impact of consolidation policy, whether the cost structure becomes more efficient or not.
The non-structural approach argues that the link between concentration and competition
is not linear because it depends on various factors. The contestable market developed by Baumol
et al (1982) was referred by some researchers to explain competitive pricing in a concentrated
market. The main characteristic of contestable markets is free entry and exit. In such markets
an entering firm can attract customers by charging a low price and can recover any cost of
entry while abandoning the market if older firms retaliate by under-pricing in turn. As entry and
exit are free, the market might produce competitive pricing because less efficient firms can be
excluded from the market and replaced by the more efficient entrant.
Next, the non-structural approach focused on the information derived from competitive
behavior of firms. They believed that in learning about the market, we need to concentrate on
firms conduct instead of market concentration. In assessing competition, Panzar and Rose
(1987) developed a method based on the firm cost structure3. The method tries to distinguish
the competition level in markets by finding the relation of firms» revenue to factor price changes.
3 Panzer, J.C., Rose, J.N., (1987) developed a measurement to assess the competition in the market by observing the banksbehaviour. The H-statistic reflects the elasticity of changes on input price to banks revenue.
150 Bulletin of Monetary Economics and Banking, October 2011
They derived a generally applicable testable implication of monopoly profit maximizing behavior.
Their model is focusing on the sum of factor elasticity of the reduced form of the revenue
equation. The factor elasticity capture the effect of a proportional shift in average, total, and
marginal cost curve even when cost data themselves are unavailable.
They concluded that in monopoly markets, the value of elasticity is negative because an
increase in input prices will increase marginal costs, reduce equilibrium output and subsequently
reduce revenues; hence elasticity will be zero or negative (Bikker and Haaf, 2002). In perfect
competition, the value of elasticity is unity, because the average cost will shift proportionally
with the changes in factor price.
Many studies employed the Panzar-Rose (PR) method to measure the impact of
consolidation policies on competition in the banking industry. In the early 1980s, the deregulation
of deposit interest rates in some developed countries had heightened competition and led to a
wave of mergers and acquisitions. Shaffer (1982), Molyneux et al (1994), Bikker and Haaf
(2002) and Bandt and Davis (2000) examined the impact of the banking consolidations in the
United States and European countries on competition.
The consolidation in the US banking market was mostly driven by markets as «merger
was perceived as one way to improve their diversification, efficiency or possibly market power»
(Shaffer, 1994, p. 3). By using samples from banks in some states in the United States between
1979 and 1980, Shaffer (1982) proved that the banking market was competitive. The study
found that in most of the market, the significance test of the elasticity rejected the existence of
market power.
In addition to that, the European banks also faced structural changes after the
implementation of the European Single Market, included the financial services market. Under
the policy, there was limitless access to enter markets of the other member countries (Molyneux
et al, 1994). Molyneux et al (1994) tried to assess the impact of consolidation on competition
in the early stage of implementation of the Single Market policy. They focused on assessing the
banks behavior between the period 1986 and 1989. They had quite similar findings to Shaffer
(1982). The competitive environment in the banking industry was well sustained. Monopolistic
competition was established in countries such as Germany, United Kingdom, France and Spain.
However, the banking market in Italy was performed under monopoly or conjectural variation
short run oligopoly.
More recent data was employed by Bandt and Davis (2000). Quite similar findings appeared
with Molynuex et al (1994). Bandt and Davis (2000) aimed to measure the level of competition
across different groups of banks, which are large, medium and small during the period of 1992
151Competitive Conditions in Banking Industry: An empirical Analysis of the Consolidation, Competition andConcentration in the Indonesia Banking Industry between 2001 and 2009
to 1996. According to them, the large banks in German and France were working under
monopolistic competition, while the smaller banks were acting as a monopoly. Regarding Italy,
both small and large categories were working under monopoly market.
Extending the coverage of countries, Bikker and Haaf (2002) tried to investigate the
competitive behavior in 23 developed countries all over the world during 1989 to 1998. The
banking market in 23 countries was indicated to be working under monopolistic competition.
The findings supported De Band and Davis (2000) where competition among larger banks was
stronger than other groups.
Quite a fewer studies have been conducted in emerging countries. Gelos and Roldos
(2002), Claessens and Laeven (2004) and Yeyati and Micco (2007) assessed the competitive
behavior of banks in some emerging countries. It is important to conduct the study for emerging
markets as we might find quite different conditions compared to mature markets. The Latin
American countries also experienced consolidation with a substantial number of mergers and
acquisitions. The consolidation was firstly initiated by government through the Central Bank.
Further, it was also driven by market forces. Gelos and Roldos (2002) explained that the three
largest private banks in Brazil initiated the consolidation to sustain their competitiveness. In
addition, the five largest private banks in Argentina gained substantial market share from the
combination of organic growth and acquisitions.
Consolidation did increase concentration in emerging market of Latin American countries.
However, the concentrated market did not lead to a less competitive situation. This conclusion
was generated from three different studies of Gelos and Roldon (2002), Claessens and Laeven
(2004) and Yeyati and Micco (2007). The Contestable market principle might be helpful to
explain this situation. The removal of the restriction of entry to the market effectively preserved
the competitive environment (Classens and Laeven 2004).
On the other side, the consolidation which was mostly driven by government, as happened
in most Asian countries, showed different outcomes. Instead of increasing the concentration,
the wave of mergers and acquisitions in Asian countries reduced concentration (Gelos and
Roldos, 2002). In relation to competition, the less concentrated market in the Asian banking
market was perceived as competitive.
This illustration of findings under the non-structural approach clearly supports the notion
that the relationship among market concentration, firms conduct and market performance
may not linear. The consolidation itself, which was taken from broad varieties of policies, might
create concentrated or less concentrated markets. Further, competition in concentrated market
might be sustained by lessening the entry barrier into the market (Classens and Laeven 2004).
152 Bulletin of Monetary Economics and Banking, October 2011
(1)
(2)
2.3. Panzar and Rose Approach
As illustrated in the above section, we could not rely on market structure information to
determine the competition level in the banking market. It might be misleading to depend on
the information about market structure as some studies proved a non-linear relation between
market structure and competition. Moreover, Bikker and Haaf (2002) proved that concentration
indices such as the Concentration Ratio (CR) and the Herfindahl-Hirschman Index (HHI) appear
to be inversely correlated with the number of firm. The countries with smaller number of banks
tend to have a higher concentration level.
In order to measure competition in the market, this study will employ a method used
by Panzar and Rosse (1987). The method is based on properties of reduced form revenue
equations at the firm level, and the data of revenues and factor prices (Panzar and Rose,
1987). Therefore the method will directly assess the competitive behavior of banks to define
the market structure.
The Panzar-Rose method will calculate the sum of elasticity of the reduced form revenues
with respect to factor prices. This sum of elasticity is given the symbol H (Vesalla, 1995). The
value of elasticity will provide information about banks conduct, and furthermore it will
determine the structure of the market. The assumption underlying this method is that market
power of banks is measured by the extent to which changes in factor prices (unit costs) are
reflected in revenue earned (Vesalla, 1995). If the industry is competitive the elasticity will be
high, otherwise the elasticity will be low or even negative in the case of monopoly and
collusive oligopoly.
The properties of H allow us to distinguish empirically between common imperfect
competition theories of price formation as characterizations of the competitive behavior of
Indonesia»s banks, whether monopoly or perfect collusion, monopolistic competition or perfect
competition (Vesalla, 1995).
The Panzar-Rose empirical model assumes that banks have a log-linear marginal cost and
revenue function (Bikker and Haaf, 2002).
153Competitive Conditions in Banking Industry: An empirical Analysis of the Consolidation, Competition andConcentration in the Indonesia Banking Industry between 2001 and 2009
Where OUT is output, n is the number of banks, FIP denotes factor input prices, and EXirevenue
and EXicost
are other variables affect banks» revenue and cost functions, respectively. The empirical
application of Panzar and Rose approach assumes a log-linear marginal cost function, where
dropping subscripts referring to bank»i (Bikker and Haaf, 2002).
Further, the Rose Panzar model assumes a profit maximizing for individual banks. The
profit maximizing banks will produce at the level where marginal cost is equal to the marginal
revenue, yielding the equilibrium value for output:
In the empirical analysis, the following operationalization of the reduced-form revenue
equation is used (Bikker and Haaf, 2002, p.2196):
Where, TIR is the ratio of interest income to the total balance sheet; AFR is the price of funding
(funding rate); PPE is the price of personnel expenses (wage rate); PCE is price of capital
expenditure (capital price); OI is ratio of other income to the total balance sheet; and BSF is
bank-specific exogenous factors, such as the risk component, differences in the deposit mix
and size (banks» real assets) (Yeyati and Micco, 2007, p.1637).
Under this condition, H shows the sum of the elasticity of the reduced-form revenue
function with respect to factor prices.
The level of competition determines the value of H, whether monopoly or perfect collusion,
monopolistic competition or perfect competition. Below is a formula to calculate H, where H is
the sum of elasticity, which consists of the elasticity of revenue with regard to funding cost
changes ( β ), elasticity of revenue with regard to changes on human resource expenditure ( γ )
and elasticity of revenue with regard to capital price changes ( δ ).
(3)
(4)
(5)
154 Bulletin of Monetary Economics and Banking, October 2011
Panzar and Rose proved that under monopoly, an increase in input prices will increase
marginal costs, reduce equilibrium output and subsequently reduce revenues; hence H will be
zero or negative (Bikker and Haaf, 2002). In other words, markets where monopoly power
exists will yield a negative relation between those two variables as gross revenue responds in
the opposite direction to a change in a unit cost (Vesala, 1995). The same outcome is also
found in monopolistic competition without the threat of entry, i.e. with the fixed number of
banks. The market consists of some banks; however there are barrier to enter the market,
therefore the number of bank is unchanged. Vesalla (1995) proved that in such market H is
zero or negative, where similar with Panzar-Rose findings on monopoly market.
In analyzing monopolistic competition, the Panzar-Rose approach is based on the
comparative statics properties of the monopolistic competition Chamberlinian equilibrium model
(Bikker and Haaf, 2002). In the limit case of the monopolistic competition model, where banks»
products are regarded as perfect substitutes of one another; the Chamberlinian model produces
the perfectly competitive solution, as demand elasticity approaches infinity (Bikker & Haff: 2002:
pp. 2195). In a perfectly competitive market, increasing input prices will increase average cost
Figure 2.H in perfect competition
P1AC
P1
P0
y* y
AC1 (W1)
AC0 (W0)
(6)H = β + γ + δ
155Competitive Conditions in Banking Industry: An empirical Analysis of the Consolidation, Competition andConcentration in the Indonesia Banking Industry between 2001 and 2009
P MC
AC
B
MR
Pc
P
y y c y D
proportionally. Exit of some banks increases the demand faced by each of the remaining banks,
leading to increases in prices and revenues equivalent to the rise in costs (Bikker and Haaf,
2002). Finally, the value of H in perfectly competitive markets is equal to one.
In the case where monopolistic competition model recognizes product differentiation
the value of H is positive but less than one. As shown in figure 3, monopolistic competition is
an intermediate case between monopoly and perfect competition. Monopolistic competition
produces «excess capacity» where yi* is produced at average cost (point A) higher than minimum
average cost (point B). In addition, price pi* exceeds marginal cost (MC), compared to competitive
Banks in Chamberlinian equilibrium are not free from market power but they cannot
receive supernormal profits, since banks price at average cost (Vesalla, 1995). Therefore, the
value of H in this condition is positive but less than one. It means that the changes to input
prices positively affect revenue but are less than one.
This model is more consistent with the observation that banks tend to differentiate
themselves by various product quality and advertising, although the core services provided by
them are fairly homogenous (Vesalla, 1995, p. 50). The product differentiation is important in
156 Bulletin of Monetary Economics and Banking, October 2011
order to create less elastic demand (Tirole, 1988). As product is less differentiated, less market
power is exercised and the value of H will be higher. High switching cost is also the source of
market power. The account holders of the banks bear high switching cost to move from one
bank to others. If customers plan to switch the supplier then they must create a new account
number. It implies a lot of paperwork. In addition, the customer must inform about the changes
to their business relation (Canoy et.al, 2001).
At last, in an oligopoly market, the value of H may also be positive, where there are
strategic interactions among fixed number of banks (Bikker and Haaf, 2002). However, in the
case of perfect collusion in an oligopoly, the Rose and Panzar method produces a negative
value for H, similar to the monopoly model.
Table 4.Summary of the Discriminatory Power of H
Competitive environment
Monopoly equilibrium: each bank operates independently as under monopoly profit
maximization conditions (H is decreasing function of the perceived demand elasticity) or
perfect cartel.
Monopolistic competition with free entry equilibrium (H is an increasing function of the
perceived demand elasticity).
Perfect competition. Free entry equilibrium with full efficient capacity utilization.
Value of H
H < 0
0 < H < 1
H = 1
Source: Bikker and Haaf (2002, p. 2195)
There are five assumptions need to apply the Panzar-Rose method. First, banks are treated
as single product firms that act as financial intermediaries. Therefore banks produce interest
revenues by employing intermediate funds, labor and capital as inputs (De Bandt and Davis,
2000). Second, we have to assume that higher input prices are not associated with higher
quality services that generate higher revenues. Gelos and Roldos (2001) explained that if the
correlation exists, there might be bias in interpreting H. The third assumption is that the market
is in equilibrium in the long run. The fourth and fifth assumptions are considering banks as
profit maximization institutions and they have normally shaped revenue and cost functions
(Gelos and Roldos, 2002, p. 13-14).
157Competitive Conditions in Banking Industry: An empirical Analysis of the Consolidation, Competition andConcentration in the Indonesia Banking Industry between 2001 and 2009
III. METHODOLOGY
3.1. Empirical Model
In assessing the competition in the Indonesia banking market between 2001 and 2009,
we will run a regression model to estimate the following reduced form revenue equation. In
following equation, the four explanatory variables outside the bracket represent bank specific
factors.
Table five provides detail information about the variable specification. It explains the
definition and proxy used to measure each variable.
The study will employ a pooled regression, more specifically the Fixed Effect Model. There
are some reasons underlying the application of the pooled regression model. First, since the
application of a cross-section regression implicitly assumes that all banks have access to the
same factor markets therefore they only differ in terms of the scale of operation (De Bandt and
Davis, 2000, p. 1050) the cross-sectional regression is unable to capture the time-series dimension
inside the model. Vesalla (1995) concluded that it is difficult to infer whether the changes on
competition over time are statistically significant if we rely on the estimation of H using the
(7)
Table 5.Variable Spesification
Ratio of annual interest income to total assets
Ratio of annual interest expenses to total deposit
Ratio of annual wage and salary expenses to total assets
Ratio of other expenses to fixed assets
Ratio of others income (operational and non-operational incomes) to total assets
Equity divided by total assets
Loans divided by total assets
Ratio of interbank deposits to total deposit
Ratio of demand deposits from customers to total deposit and short term
158 Bulletin of Monetary Economics and Banking, October 2011
cross-section regression for each year. Some studies such as Vesalla (1995) and Yeyati and
Micco (2003) suggested consolidating the individual cross sections into a single pool data set.
Polled estimation will produce more reliable estimates of H as it examines the behavior of
banks over time.
The second consideration is that the study will also explore the relation between
concentration and competition across time. Therefore we emphasize the dynamic dimension,
which cannot be incorporated in the cross-section method (Yeyati and Micco, 2003a).
The third benefit of the implementation of pooled regression method relies on the ability
to capture the non-time-varying determinants of banks» revenues. The application of the Fixed
Effect Model allows the inclusion of bank fixed effects that can be used to control the
heterogeneity between banks that are not captured in the model. The Fixed Effect Model will
treat the heterogeneity of the non-time-varying determinants of revenues by entering the cross-
section dummies (for each bank). Therefore the model will introduce the different intercepts
capturing the banks-specific variables that are not explicitly addressed in the regression
specification (De Bandt and Davis, 2000).
In order to capture the impact of the consolidation policy on the banks» behavior, this
study tested the changes on the input prices coefficients. Referring to Gelos and Roldos (2002)
the test can be implemented by dividing the observation period into two sub-periods and
interacting the input price variables (ln(AFR), ln(PPE) and ln(PCE)) with a dummy variable that
takes the value of one in the second sub-period» (p. 15). The interaction variables will show
whether the consolidation policies significantly changed the banks» behavior; if the interaction
variables generate significant values, they indicate a structural break in the statistical relationship
between revenues and input prices (Gelos and Roldos, 2002, p. 15). In addition, the value of
interaction variables will determine the direction of changes on competition. If they are positive,
we can conclude that the consolidations increase competition or otherwise. Further if the H-
statistics is positive between 0 and 1 and the cumulative value of the interaction variables is
positive, it implies a stronger competition (Vesala, 1995, p. 56)4.
The first period is from 2001 to 2003 and the second period starts from 2004. This study
chooses 2004 as a year marking of structural break because starting from 2004; the Central
Bank of Indonesia formally enforced the consolidation process by introducing the Indonesia
Banking Architecture policy.
4 It refers to Bikker and Haaf (2002, p. 2203). They explained that the result of Vesala (1995) implies that the interpretation of H-statistics between 0 and 1 is a continuous measure of the level of competition. Further Bikker and Haaf (2002) described thehigher value of H can be used as an indication of the stronger level of competition (p. 2203).
159Competitive Conditions in Banking Industry: An empirical Analysis of the Consolidation, Competition andConcentration in the Indonesia Banking Industry between 2001 and 2009
One of the assumptions under the Panzar and Rose method is that the market is in
equilibrium (Claessens and Laeven, 2003). We need to check that the assumption is fulfilled by
running the test on market equilibrium. Referring to some studies, the market equilibrium test
must be able to validate that the Panzar-Rose statistics can deliver reliable results (De Bandt and
Davis, 2000).
In order to have an equilibrium test, some studies suggest testing whether the input
prices are related to the industry return. Here, we will modify the reduced form revenue equation
by replacing the dependent variable with the ratio of net income to total assets as an endogenous
variable (De Bandt and Davis, 2000).
The equilibrium is defined as a condition where the value of equilibrium E-statistics is
zero. The E-statistic is defined as the summation of β, γ, dan δ. Further, we can employ a F-test
to verify the statistical significance of the test whether the E = 0 (Claessens and Laeven, 2003).
3.2. Data
Data were obtained from the Central Bank of Indonesia. It consists of the unconsolidated
annual balance sheets and income statements of the commercial banks. The sample contains
128 banks for each year approximately; however the exact number in the sample for each year
varies. The yearly variation on the number of banks is caused by mergers, acquisitions, bank
liquidations and banks entry during the observation period. In the case of mergers and
acquisitions, the database only keeps the data of the new institution which is usually the bigger
bank.
Table 6 provides detail information about the number of bank for each category. According
to the database, the Central Bank divides commercial banks into six categories. Currently
Indonesia has 4 State Owned Banks, 68 local private banks which are comprised of banks
which engaged with foreign exchange services and those which are not. Even though the
Central Bank has grouped the 68 banks into local banks, actually some of them were bought
by overseas investors during the privatization policy in the late 1990s. There are 20 joint ventures
banks, where the owners are foreign and local investors. There are 11 foreign banks which are
usually branch offices of foreign banks. Finally, we have 25 regional banks that usually operate
(8)
160 Bulletin of Monetary Economics and Banking, October 2011
in their province. The shareholders of the regional banks are the government of the province
and the municipalities.
Compared to other developing countries in South East Asia, the number of banks in
Indonesia is large. However, the market is concentrated as a few large banks dominate it. The
banks» balance sheet shows that on average 3 from 113 banks control more than forty percent
of the industry between 2001 and 2009. Descriptive statistics information about the distribution
of»the assets and capital support the notion of the highly concentrated market. Table 7 illustrates
the distribution of the assets and equity from all banks in 2009. In terms of assets, a quarter of
market is dominated by single bank which is Bank Mandiri with assets 370 trillion rupiah and
Table 6.Sample Size
4
39
29
20
11
25
128
State Owned Banks
Private Banks - Foreign Exchange
Private Banks - Not engage in foreign exchange
Joint Venture Banks
Foreign Banks
Regional Banks
Total
Type of Banks (based on the Central Bank Categorization)Type of Banks (based on the Central Bank Categorization)Type of Banks (based on the Central Bank Categorization)Type of Banks (based on the Central Bank Categorization)Type of Banks (based on the Central Bank Categorization) Number of BanksNumber of BanksNumber of BanksNumber of BanksNumber of Banks
Source: The Indonesian Banking Statistics, 2009, the Central Bank of Indonesia
Table 7.The Descriptive Statistics of Asset and Equity All Banks in 2009 (in Million Rupiah)
161Competitive Conditions in Banking Industry: An empirical Analysis of the Consolidation, Competition andConcentration in the Indonesia Banking Industry between 2001 and 2009
equity more than 35 trillion rupiah. The asset of Bank Mandiri is 15 times larger than the
average and the equity is 17 times larger than the average.
Since the market is positively skewed, the median is a preferred measure of central
tendency. Table 7 shows that all statistics to assess the normality distribution of data are violated.
The values of skewness are positive both for assets and equity, implying the positively skewed
distribution. The JB values are positive and significantly different from one, indicating that the
data rejects the normality assumption. Referring to the data, half of the bank (56 banks) had
equity less than 550 billion rupiah. In addition, more than 66 percent (85 banks) had equity less
than 1,371 billion rupiah. On the other hand, a very small portion of banks - less than 1 percent
or only 7 banks - has equity more than 10 billion.
The above figures will be used to calculate break point to divide the sample based on the
size. The sample division into large, medium and small banks is important to capture the real
behavior of banks in competing with other banks in their categories. Large banks are assumed
to work at the national or even international level, while small banks focus on local or specific
industries and often do not have customers outside their defined market.
5 The categorization is based on the data of Indonesia banking in 2009.
Table 8.Three Categories of Banks based on the Value of Equity
The value of equity in 2009 will be employed as a basis to break the sample into large,
medium, and small banks. Large banks are those with equity more than 10 trillion rupiah. The
medium-sized banks are working with the capital from 1 to 10 trillion rupiah. Finally, the small
banks are those with equity less than 1 trillion rupiah. In terms of the number of banks, the
small bank category dominates the market; however the market is controlled by the larger
group.
162 Bulletin of Monetary Economics and Banking, October 2011
IV. RESULT AND ANALYSIS
4.1. Competition in Banking Industry
The finding is robust using the two different measurements of revenue with respect to
the level of competition in the Indonesia banking industry. Some studies employed the ratio of
interest income to total asset to measure the banks» revenue. Bikker and Haaf (2002) explained
that this proxy is more consistent with the assumption underlying the Panzar and Rose method,
where banks are assumed to be a single product firms that acts as financial intermediaries.
Therefore the main business of banks is financial intermediation.
On the other hand, De Bandt and Davis (2000) argued that as a response of tighter
competition, banks increase their interest to non-interest income activities √ including asset
management income, mutual funds and insurance (p. 1047). They proposed to employ both
measurements on the ratio of interest income to asset and the ratio of total revenue to asset as
a validation method to test if the model is robust.
Overall both specifications produce similar outcomes. However the interest income
specification provides some larger coefficients. We choose to employ the first proxy because
the Indonesian banking industry still relies heavily on interest-based-income. The data of the
annual financial report of all banks between 2001 and 2009 shows 88 percent of banks» income
was originated from interest income. Therefore the first proxy will capture the real portrait of
competition in the Indonesian banking industry. In addition, the study includes other income
which means income originated from non-interest activities as one of the explanatory variables
in order to capture the growing trend of non-interest based income in banks revenue.
One critical assumption under the Panzar-Rose method is whether the observations are
in long-run equilibrium. As described in the previous part, we have conducted an equilibrium
test by running a regression of the revenue reduced-form by replacing the dependent variable
by return on equity. We employ the method introduced by Claessens and Laeven (2003) in
deriving the Return on Asset (ROA). As ROA can take on a small (negative) value, they suggested
computing the dependent variable ROA» by using the formula of Ln (1+ROA) (p. 11). The
estimation showed that the joint coefficient of β, γ and δ is not significantly different from
zero (please refer to the appendix for the complete estimation result). Therefore, the Panzar-
Rose method is suitable to assess competition in the Indonesia banking market between 2001
and 2009.
The Panzar-Rose model has been applied to around 128 banks between 2001 and 2009.
The redundant test was employed to examine whether the introduction of an intercept for
different cross section units in order to account the heterogeneity across banks are significant.
163Competitive Conditions in Banking Industry: An empirical Analysis of the Consolidation, Competition andConcentration in the Indonesia Banking Industry between 2001 and 2009
The restricted F-test and x2 test of fixed effect are significant. They confirm that fixed effect
model is more reliable capturing the information about what contributes to the difference
across banks. Thus the model can capture the information of what contributes to the differences
across banks. Please refer to appendix C for detail statistical results on redundant fixed effects
tests.
Table 9 provides complete information about the estimation results of the reduced-form
revenue equation. The H-statistics for all banks is .69. The F test shows that the value is
significantly different from zero thus it rejects the monopoly hypotheses. It is also significantly
different from one, thus it also rejects the perfect competition hypotheses. We can conclude
Table 9.Empirical Results using Fixed Effect Model Interest Income as Dependent Variable,
a) the value of F test shows that H is not significantly different from 0 and 1 (level confidence 99%)The value in the bracket is the t-statistic;*** Significant at 99% confidence level; ** significant at 95% confidence level; * significant at 90% confidence level
164 Bulletin of Monetary Economics and Banking, October 2011
that the banking sector is working under monopolistic competition. The changes in factor price
will increase the revenue less than proportionally because the products are differentiated and a
switching cost is high. Further, competition has risen over time. This conclusion was based on
a comparison of our findings with the study conducted by Classens and Laeven (2003). According
to them, from 1994 to 2001, the H-statistic for Indonesia banking was .62.
The across groups analysis provides broader understanding of the market. The H-statistics
vary from .59 to .80 suggesting that the banking market across all groups was working under
monopolistic competition. The large banks groups was the least competitive market, with the
H-statistics .59. The medium banking group was the most competitive market. The H-statistic
for the medium bank group is quite high (.80), and it is comparable with the banking market in
developed countries and other emerging market such as Latin American bank (Yeyati and
Micco, 2007). It is quite surprising as in other countries including Europe; the banking market
of larger banks is more competitive than that of the smaller banks which usually service the
local market (Bikker and Haaf, 2002).
As expected, deposits or funds are the most important input. The coefficient for the
funding rate is the main contributor of the elasticity. This figure is consistent across different
groups. Human resources are the second main input in the banking industry. The sign of the
coefficients are also positive indicating that the increase in the wage rate is transmitted into the
revenue. The least important input is capital. The coefficients on the capital price are small, and
in some estimates, they are not significant.
Risk of loans is an important explanation of the pattern of revenue. Positive coefficients
for risk of loans imply that banks with a higher proportion of loans on their balance sheets
generate higher interest revenue per rupiah of asset. A similar conclusion is also applied to the
risk of capital variable. The coefficients are positive for large and medium banks. Thus in the
larger banks, it can be concluded that the higher portion of equity per asset earns higher
revenue. The deposit mix variables are not really significant in explaining the movement of
revenue, except the proportion of interbank deposits to total deposits in the large banks market.
The sign of the coefficient is negative which implies that the bigger the portion of interbank
deposit to total deposits, the less revenue that might be earned.
4.2. Market Structure and Competition
This section will describe the relationship between concentration and competition. The
study will employ two-frequently applied types of such indices as a proxy of market concentration.
The first index is called k-banks concentration ratio (CRk) which takes the market shares of the
165Competitive Conditions in Banking Industry: An empirical Analysis of the Consolidation, Competition andConcentration in the Indonesia Banking Industry between 2001 and 2009
k biggest banks in the market, and ignoring the remaining banks. The second index is Herfindahl-
Hirschman index (HHI), which takes market shares as weights, and stresses the importance of
larger banks by assigning them a greater weight than smaller banks (Bikker and Haaf, 2002)6.
These concentration measurements can be considered reliable for assessing market
concentration. As all proxies produces similar outcomes. The data shows that the banking
market in Indonesia has become less concentrated. This finding is surprising. Unlike the developed
countries where consolidation increased the market concentration7, policy changes reduce the
concentration in the Indonesia banking market.
Our findings are aligned with a study conducted by Gelos and Roldos (2002). They argued
that consolidation did not increase market concentration in Asian countries because the structural
changes were mostly driven by government. While in the developed countries and more mature
markets of developing countries in Latin America, mergers and acquisitions were driven by the
market.
In those markets, tight competition forced large banks to merge to enhance their
competitiveness. On the contrary, mergers and acquisitions in Indonesia banking were mostly
6 The following are formulas to calculate the concentration ratio (CR)and Herfindahl-Hirschmanindexes, where s is market share ofbanks.
7 Please refer to De Bandt and Davis (2000) and Bikker and Haaf (2002).
Figure 4.The Banking Concentration by Using Four Different Measurements
All Banks, 2001 - 2009
0.7
0.6
0.5
0.4
0.3
0.2
0.1
02001 2002 2003 2004 2005 2006 2007 2008 2009
CR3CR4CR5HHI
CRk = Σk sii = 1 HHI = Σm s
i2
i = 1
166 Bulletin of Monetary Economics and Banking, October 2011
conducted by medium-sized and smaller banks in order to comply with the Single Presence
Policy and Minimum Capital Requirement. These consolidations increased the scale of economies
of the merging banks. However it did not increase industry concentration because the mergers
were dominated by small and medium-sized banks. It implies that consolidation in the Indonesian
banking market does not create more concentrated markets but it improves the market share
distribution.
In the case of large banks, the Single Presence Policy has effectively reduced concentration
by the consolidation of PT Bank Niaga Tbk. and Bank Lippo in 2008. The market share of the
merged bank, PT. CIMB Niaga, increased about 3 percent. This merger significantly reduced the
market concentration because the new merge bank was not in the top three large banks.
Therefore as the share of merge bank increased, the market share distribution was changed
where the share of biggest three banks decreased from 74 percent in 2001 to 66 percent in
2009.
The mergers and acquisitions in the medium-sized and small banks market aimed to
improve the banks» performance after the 1997 economic crisis or to comply with the Single
Presence policy or Minimum Capital Requirement policy. There were seven mergers in the
medium-size banks category between 2001 and 2009. The number of banks in the small
group also reduced. The consolidation in small banks market was dominated by the
liquidations of banks with poor performance and consolidation to comply with the Minimum
Capital Requirement policy. Please refer to table 3 for a detail list of merger between 2001
and 2009.
Table 10.The Banking Concentration across Groups 2001 - 2009
All Banks Large Banks Medium-sized Banks Small Banks
Average 0.0.0.0.0.4141414141 0.0.0.0.0.0808080808 0.0.0.0.0.6969696969 0.0.0.0.0.2020202020 0.0.0.0.0.2626262626 0.0.0.0.0.0505050505 0.0.0.0.0.3131313131 0.0.0.0.0.0505050505
CR3CR3CR3CR3CR3 HHIHHIHHIHHIHHI CR3CR3CR3CR3CR3 HHIHHIHHIHHIHHI CR3CR3CR3CR3CR3 HHIHHIHHIHHIHHI CR3CR3CR3CR3CR3 HHIHHIHHIHHIHHIY e a r
167Competitive Conditions in Banking Industry: An empirical Analysis of the Consolidation, Competition andConcentration in the Indonesia Banking Industry between 2001 and 2009
Compared to large banks, the medium-sized and small banks have a much lower degree
of concentration. They have a better market share distribution, as the biggest three banks in
the group only controlled less than 35 percent of the market share. Analogous with the large
banks, the concentration level in medium-sized banks and small banks has also reduced. But if
we compare the value of the concentration changes, the changes of the concentration level in
medium-sized banks and small banks were relatively smaller, especially if we refer to Herfindahl-
Hirschman index. The information of the market concentration and competition in the medium-
sized banks and small banks helps in understanding this phenomenon. The medium-sized and
small banks markets were highly competitive and less concentrated, therefore the mergers and
acquisitions just slightly reduced the market concentration.
There is a consistency between market concentration and competition in the three different
groups. Larger banks have the lowest degree of competition because the market is more
concentrated (CR3average
=0.69; HHI average
=0.20). On the other hand, the market of medium-sized
banks is the most competitive because it is less concentrated (CR3average
=0.26; HHI average
=0.05).
Small banks also work in a quite competitive environment because each bank has a small share
of the total market (CR3average
=0.31; HHI average
=0.05).
Table 11. Empirical Results using Fixed Effect Method with Interaction Variables(All Banks between 2001 and 2009)
Rincian
H (Competition Level)
∆H (After 2004 Consolidation Policy)
Significance test on ∆H , F test¡
Test of change in H
Market Structure
N (Number of Observation)
0.68
0.027
3.5074240.0615*
Can not reject the increasing of H-statistics
Monopolistic Competition
892
Note: *** significant at 99% confidence level; ** significant at 95% confidence level; * Significant at 90% confidence level
The outcome of fixed effect model using the interaction variables for all banks implies
that the second wave of consolidation through the introduction of Indonesia Banking Architecture
increased the value of H-statistics. It increases about 0.027 from 0.68 in the first period to 0.70
in the second period. The significance test by using F test shows that the increase on the level
of competition is significant at 90 percent of confidence level. The result confirms that the
consolidation policies enhanced the competition in the Indonesia banking industry. Consolidation
168 Bulletin of Monetary Economics and Banking, October 2011
policies were effective to encourage medium-sized and small banks to merge in order to comply
with the Minimum Capital Requirement or Single Presence Policies. It significantly increased
the scale of economies of the merging banks and equipped them with bigger capacity to
compete with other banks. Further the mergers of smaller banks improved the distribution of
the market share. The improvement of the market share distribution reduced the market
concentration and enhanced the competition.
V. CONCLUSION
There are some interesting findings of this study. First, the data implies that the structure
of Indonesia banking market is vulnerable. Comparing to other East Asian countries, the number
of bank in Indonesia is larger. However, the market is concentrated in a few banks. Large banks
control a substantial share of the market. On the other hand, more than a half of banks are
small with the equity less than 1 trillion rupiah. In addition, the market concentration in the
large banks group is much higher than in smaller banks.
Secondly, banking market has become less concentrated during the implementation of
consolidation policy. This finding showed that the consolidation policy in Indonesia has similar
pattern with those implemented in other Asian countries. On the contrary, consolidation policy
in Latin American countries and other developed countries increased the market concentration.
As described by Gelos and Roldos (2002), the consolidation policy that was driven by market
will increase the concentration. On the other hand, the consolidation policy in Indonesia was
driven by the authority through the banks liquidation, mergers of the State Owned Bank and
the implementation of the Indonesia Banking Architecture. They have effectively encouraged
medium-sized and small banks to consolidate. This improved the distribution of market share
and reduced the market concentration.
Thirdly, during the implementation of consolidation policy the banking industry was
working under monopolistic competition. The H-statistic was .69. If we compare to the value
of H-statistic within 1994-2001 as calculated by Claessen and Laven (2003), the competition
has risen over time. The competition analysis by sub-groups shows that large banks were working
in the least competitive market while the medium-sized banks are working under the most
competitive market. The nature of competition in Indonesia banking was different with developed
countries where large banks were more competitive (Bikker and Haaf, 2002).
Next finding is discussing the impact of consolidation policy on competition. The estimation
shows that banking industry was more competitive in the second period of the implementation
169Competitive Conditions in Banking Industry: An empirical Analysis of the Consolidation, Competition andConcentration in the Indonesia Banking Industry between 2001 and 2009
of the consolidation policy. The increasing of the economies scale of the merging banks and
the improvement of market share distribution enhanced the competition.
Finally the study demonstrates that a concentrated market contributes to a less competitive
environment. It is possibly the reason why the large banks in Indonesia are working in a less
competitive market rather than the smaller banks. Large banks possess monopoly power to
enable them to behave as monopolist or oligopolies.
170 Bulletin of Monetary Economics and Banking, October 2011
REFERENCES
Bain, Joe E. (1951). Relation of Profit Rate to Industri Competition: American Manufacturing,
1936 √ 1940. The Quarterly Journal of Economics 65.hal. 293-324
Bain, Joe E. (1956). Barriers to New Competition. Cambridge. Mass: Harvard University Press.
Berger, Allen N., and Timothy H. Hannan. (1989). The Price-Concentration Relationship in
Banking. Review of Economics and Statistics 71.Hal.291-99.
Bikker, Jacob A., and Katharina Haaf. (2002). Competition, concentration, and their relationship:
An empirical analysis of the banking industri. Journal of Banking and Finance 26.hal. 2191-
2214.
Boumol, William, John C. Panzar, and Robert D. Willig.(1982). Contestable Markets and the
Theory of Industri Structure. San Diego: Harcourt Brace Jovanovich.
Buletin Bisnis. (2007). Daftar Akuisis dan Merger Bank di Indonesia. Retrieved from website:
Calem, Paul, and Gerald Carlino. (1991). The Concentration/ Conduct Relationship in Bank
Deposit Market. Review of Economics and Statistics 73.hal. 268-76.
Canoy, Marcel, Machiel van Dijk, and Jan Lemmen. (2001).
Competition and Stability in Banking.CPB Netherland Bureau for Economic Analysis.Netherland.
Bank Sentral Indonesia.(2010). Arsitektur Perbankan Indonesia.dikutip dari website:
www.bi.go.id.
Aturan Bank Sentral IndonesiaRepublik IndonesiaNomor 10/15/PBI/2008 TentangKebutuhan
Modal Minimum
Aturan Bank Sentral Indonesia Republik Indonesia Nomor 8/16/PBI/2006 TentangKebijakan
Single Presence.
Central Bank of Indonesia.(2009). Indonesia Banking Statistics 2009.
Chan, Donald, Christopher Schumacher, and David Tripe.(2007). Bank Competition in New
Zealand and Australia.Finsia_MCFS.The Melbourne Center for Financial Studies. Retrieved
from website: http://www.melbournecentre.com.au/
Chua, H.B. (2003). FDI in financial sector: the experience of ASEAN countries over the last
decade, in CGFS (2004), the Central Bank paper submitted by Working Group members.
Retrieved from website: www.bis.org/publ/cgfs22mas.pdf
171Competitive Conditions in Banking Industry: An empirical Analysis of the Consolidation, Competition andConcentration in the Indonesia Banking Industry between 2001 and 2009
Claessens, Stijn, Asli Demirhuc-Kunt, and Harry Huizinga.(1998). How Does Foreign Entry
Affect the Domestic Banking Market.Policy Research Working Paper.The World Bank.
Claessens, Stijn, and Luc, Laeven. (2004). What Drives Bank Competition? Some International
Evidence.World Bank Policy Research Paper.No.3113, August.
De Bandt, O., and Davis, E.P., (2000). Competition, contestability and market structure in
European banking sectors on the eve of EMU. Journal of Banking and Finance 24, 1045√
1066.
Demsetz, Harold. 1973. Industry Structure, Market Rivalry, and Public Policy. Journal of Law
and Economics 16 (April).hal. 1-10.
Gelos, Gaston., R and Jorge Roldos. (2002). Consolidation and Market Structure in Emerging
Market Banking Systems.IMF Working Paper WP/02/186.
Legislation number 5/ 1999 Regarding the Indonesian Competition Regulation
Legislation of Republic of Indonesia Number 7/1998 Regarding Banking Sector.
McLeod, Ross. (1999). Control and competition: Banking deregulation and re-regulation in
Indonesia. Journal of the Asia Pacific Economy, No 4(2), p. 258-297.
Molyneux, Phillip, John Thornton, and D. Michael Llyod-Williams.(1991). Competition and
Market Contestability in Japanese Commercial Banking.Mimeo. Washington, D,C.
International Monetary Fund.
Molyneux, Phillip, John Thornton, and D. Michael Llyod-Williams.(1994). Competition condition
in European Banking.Journal of Banking and Finance 18.hal.445-459.
Nathan, Ali, and Edwin H. Neave. (1989). Competition and Contestability in Canada»s Financial
System: Empirical Results. Canadian Journal of Economics 22 (June).Hal.576-94.
Nueberger, Doris. (1997). Structure, Conduct and Performance in Banking Markets.University
Rostock, Working Paper No. 12.
Panzer, John C., and James N. Ross. (1987). Testing for ≈Monopoly Equilibrium∆. The Journal
of Industrial Economics.hal.443-456.
Pelzman, Samuel. (1977). The Gains and Losses from Industrial Concentration. Journal of Law
and Economics 20.hal. 229-63.
Shaffer, Sherrill. (1982). A Nonstructural Test for Competition in Financial Markets. Proceedings
of a Conference on Bank Structure and Competition (Federal Reserve Banks of Chicago)
on May. hal.225-43.
Shaffer, Sherrill. (1994a). Bank Competition in Concentrated Market.Business Review.March/
April.
Shaffer, Sherrill. (1994b). Structure, Conduct, Performance, and Welfare.Review of Industrial
Organization 9.hal. 435-450.
172 Bulletin of Monetary Economics and Banking, October 2011
Tirole, J. (1987). The Theory of Industrial Organization.MIT Press, Cambridge, MA.
Vesala. (1995). Testing Competition in Banking: Behavioral Evidence from Finland. Bank of
Finland Studies Working Paper No. E1.
Yeyati, Eduardo, Levy and Micco, Alejandro. (2003a). Concentration and Foreign Penetration
in Latin American Banking Sectors: Impact on Competition and Risk. Inter-American
Development Bank.Retrieved from website: http://www.oecd.org/dataoecd.
Yeyati, Eduardo Levy and Micco Alejandro.(2003b). Banking Competition in Latin America.
Latin-American Competition Forum. Retrived from website: http://www.oecd.org/dataoecd.
Yeyati, Eduardo, Levy and Micco, Alejandro. (2007). Concentration and Foreign Penetration in
Latin American Banking Sectors: Impact on Competition and Risk. Journal of Banking and
Finance 31.hal. 1633-1647.
173Competitive Conditions in Banking Industry: An empirical Analysis of the Consolidation, Competition andConcentration in the Indonesia Banking Industry between 2001 and 2009
Appendix A.Alternative Specification, Empirical Results Polled Regression Model of Fixed Effect Method,
Total Revenue as Dependent Variable (All Banks between 2001 and 2009)
Funding rate
Wage rate
Capital price
Risk of loans
Risk of capital
Deposit Mix -
Demand Deposit
Deposit Mix -
Interbank Deposit
Other Income
Number of Observation
R2
H (Competition)H (Competition)H (Competition)H (Competition)H (Competition)
All Banks Large Banks Medium Banks Small Banks
a) the value of F test shows that H is not significantly different from 0 and 1 (level confidence 99%) The value in the bracket is the t-statistic.*** significant at 99% confidence level;** significant at 95% confidence level;* significant at 90% confidence level
0.43***
(35.05)
0.17***
(10.30)
0.067***
(5.32)
0.39***
(13.34)
0.037***
(3.10)
0.03***
(2.61)
-0.005***
(-2.52)
0.12***
(13.19)
892
0.87
0.660.660.660.660.66aaaaa
0.43***
(19.02)
0.065***
(2.13)
0.01
(0.58)
0.08
(0.66)
0.16***
(2.69)
0.04
(1.22)
-0.022***
(-2.66)
0.16***
(7.85)
63
0.94
0.510.510.510.510.51aaaaa
0.40***
(23.65)
0.21***
(8.91)
0.04***
(2.60)
0.41***
(10.50)
0.09***
(4.00)
0.001
(0.08)
-0.008***
(-2.55)
0.15***
(11.90)
309
0.93
0.650.650.650.650.65aaaaa
0.46***
(29.85)
0.14***
(6.93)
0.05***
(3.01)
0.41***
(10.21)
0.02
(1.52)
0.02
(1.63)
-0.003
(-1.26)
0.08***
(7.48)
520
0.86
0.660.660.660.660.66aaaaa
174 Bulletin of Monetary Economics and Banking, October 2011
Appendix B.The Equilibrium Test √ Return on Asset
as dependent variable
All Banks
H = 0 cannot be rejected (level confidence 99.9%)The value in the bracket is the t-statistic.
-0.067
(-1.55)
0.16
(2.63)
-0.074
(-1.52)
-0.70
(-6.16)
0.004
(0.095)
0.093
(2.06)
-0.028
(-3.26)
0.19
(5.61)
862
0.75
0.0240.0240.0240.0240.024aaaaa
0.0720.0720.0720.0720.072
0.7890.7890.7890.7890.789
Funding rate
Wage rate
Capital price
Risk of loans
Risk of capital
Deposit Mix √ Demand Deposit
Deposit Mix √ Interbank Deposit
Other Income
Number of observation
R2
H (competition)H (competition)H (competition)H (competition)H (competition)
Equilibrium testEquilibrium testEquilibrium testEquilibrium testEquilibrium test
F testF testF testF testF test
ρρρρρ (1,742) (1,742) (1,742) (1,742) (1,742)
175Competitive Conditions in Banking Industry: An empirical Analysis of the Consolidation, Competition andConcentration in the Indonesia Banking Industry between 2001 and 2009
Appendix D.Empirical Results of Polled Regression Model of Fixed Effect with Time Dummies
All Banks between 2001 and 2009
All Banks Large Banks Medium Banks Small Banks
a) the value of F test shows that H is not significantly different from 0 and 1 (level confidence 99%)The value in the bracket is the t-statistic.*** significant at 99% confidence level;** significant at 95% confidence level;* significant at 90% confidence level
0.43***
(24.73)
0.23***
(12.62)
0.028***
(2.1)
0.42***
(12.70)
0.016
(1.25)
0.0009
(0.069)
0.00045
(0.178)
-0.0004
(0.177)
892
0.90
0.690.690.690.690.69aaaaa
0.53***
(9.62)
0.033
(0.61)
-0.0025
(-0.063)
0.0008
(0.0061)
0.21***
(2.30)
0.03
(0.77)
-0.028***
(-2.75)
0.064
(1.66)
63
0.95
0.550.550.550.550.55aaaaa
0.41***
(17.87)
0.28***
(9.96)
0.06***
(3.34)
0.40***
(9.51)
0.19***
(6.73)
-0.046
(-1.94)
0.0005
(0.124)
-0.042***
(-2.82)
309
0.94
0.760.760.760.760.76aaaaa
0.48***
(17.61)
0.18***
(7.18)
0.015***
(0.76)
0.46***
(9.15)
-0.024
(-1.56)
0.011
(0.62)
0.002
(0.70)
-0.015
(0.70)
520
0.87
0.680.680.680.680.68aaaaa
Appendix C.Redundant Fixed Effects Tests
F-test
df (degree of freedom)
x2 statistics
df (degree of freedom)
Number of Observation
All Banks Large Banks Medium Banks Small Banks
H = 0 is (level confidence 99.9%)
13.73
(112;771)
978.28
(112)
892
9.42
(6;48)
49.04
(6)
63
20.27
(35;265)
NA
(NA)
309
9.42
(69;442)
470.23
(69)
520
Funding rate
Wage rate
Capital price
Risk of loans
Risk of capital
Deposit Mix √
Demand Deposit
Deposit Mix √
Interbank Deposit
Other Income
Number of observation
R2
H (competition)H (competition)H (competition)H (competition)H (competition)
176 Bulletin of Monetary Economics and Banking, October 2011