Competitive Reaction Pathway for Site-Selective Conjugation of Raman Dyes to Hotspots on Gold Nanorods for Greatly Enhanced SERS Performance Hao Huang , Jia-Hong Wang , Weihong Jin , Penghui Li , Ming Chen , Han-Han Xie , Xue-Feng Yu ,* Huaiyu Wang , Zhigao Dai , Xiangheng Xiao , and Paul K. Chu *
1. Introduction
Surface-enhanced Raman scattering (SERS), a viable alter-
native to fl uorescence in ultrasensitive optical biodetection
DOI: 10.1002/smll.201400860
Common methods to prepare SERS (surface-enhanced Raman scattering) probes rely on random conjugation of Raman dyes onto metal nanostructures, but most of the Raman dyes are not located at Raman-intense electromagnetic hotspots thus not contributing to SERS enhancement substantially. Herein, a competitive reaction between transverse gold overgrowth and dye conjugation is described to achieve site selective conjugation of Raman dyes to the hotspots (ends) on gold nanorods (GNRs). The preferential overgrowth on the nanorod side surface creates a barrier to prevent the Raman dyes from binding to the side surface except the ends of the GNRs, where the highest SERS enhancement factors are expected. The SERS enhancement observed from this special structure is dozens of times larger than that from conjugates synthesized by conventional methods. This simple and powerful strategy to prepare SERS probes can be extended to different anisotropic metal nanostructures with electromagnetic hotspots and has immense potential in in-depth SERS-based biological imaging and single-molecule detection.
Raman Scattering
H. Huang, J.-H. Wang, M. Chen, H.-H. Xie, X.-F. Yu, Z. G. Dai, X. H. Xiao Key Laboratory of Artifi cial Micro- and Nano-structures of Ministry of Education School of Physics and Technology Wuhan University Wuhan 430072 , China E-mail: [email protected]
H. Huang, W. Jin, P. Li, Prof. X.-F. Yu, H. Y. Wang, P. K. Chu Department of Physics and Materials Science City University of Hong Kong Tat Chee Avenue , Kowloon, HongKong , China E-mail: [email protected]
Prof. X.-F. Yu, H. Y. Wang Institute of Biomedicine and BiotechnologyShenzhen Institutes of Advanced Technology Chinese Academy of Sciences Shenzhen 518055 , China
and bioimaging due to merits such as large multiplexing
ability, high spatial resolution, high signal-to-noise ratio, and
non-photobleaching, [ 1–10 ] takes advantage of the dramatically
enhanced Raman scattering yield from molecules adsorbed
on a nanostructured metal surface [ 11 ] caused by the enhanced
electromagnetic (EM) fi eld around the noble metal nano-
structure. [ 12 ] Extensive research has been performed to pro-
duce various types of noble metal nanostructures with strong
EM fi eld to boost the Raman signals. [ 13–20 ] In particular, gold
nanorods (GNRs) with a strong longitudinal surface plasmon
resonance (LSPR) band in the near-infrared (NIR) region
are promising NIR SERS substrates in a number of bio-
sensing and bioimaging applications. [ 13,18,21–27 ]
Anisotropic metal nanostructures with protrusions, for
instance, those with a rod-like morphology, exhibit larger SERS
enhancement than spherical metal nanostructures. [ 13,20,28 ] The
big SERS enhancement observed from anisotropic nanostruc-
tures is attributed to the strong EM fi eld concentrated in very
small regions with high curvatures known as hotspots. [ 29,30 ]
The surface EM fi eld near the ends of GNRs is much stronger
than that on the sides and it is generally called the lightning
rod effect. [ 13,31 ] Consequently, site-selective adsorption of
target molecules onto hotspots can further enhance the SERS
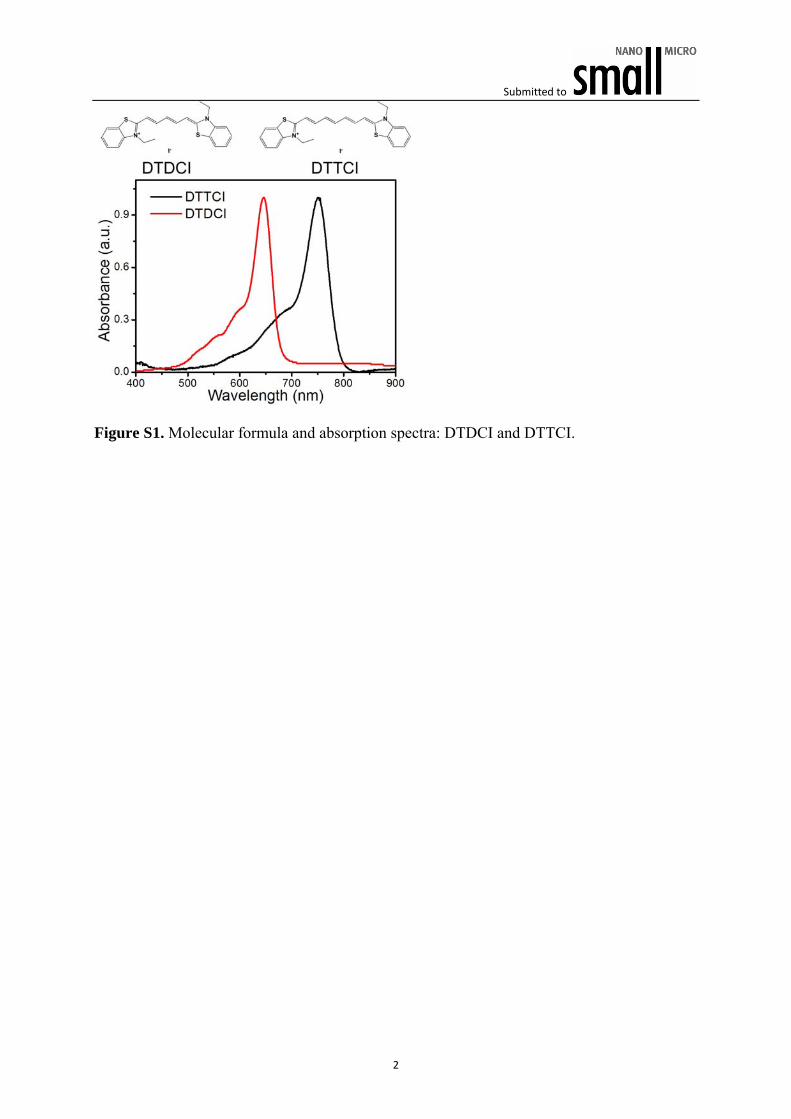
were employed to study the effi cacy in our study (refer
to Figure S1, Supporting Information, for their molecular
formula, absorption spectra). In a conventional conjuga-
tion reaction to prepare dye-GNR conjugates, [ 1,26,43–47 ] the
nanorod stock solutions react directly with the Raman dyes
(DTDCI or DTTCI) and the dyes are sequestered into the
CTAB bilayer along the nanorod surface forming a layer
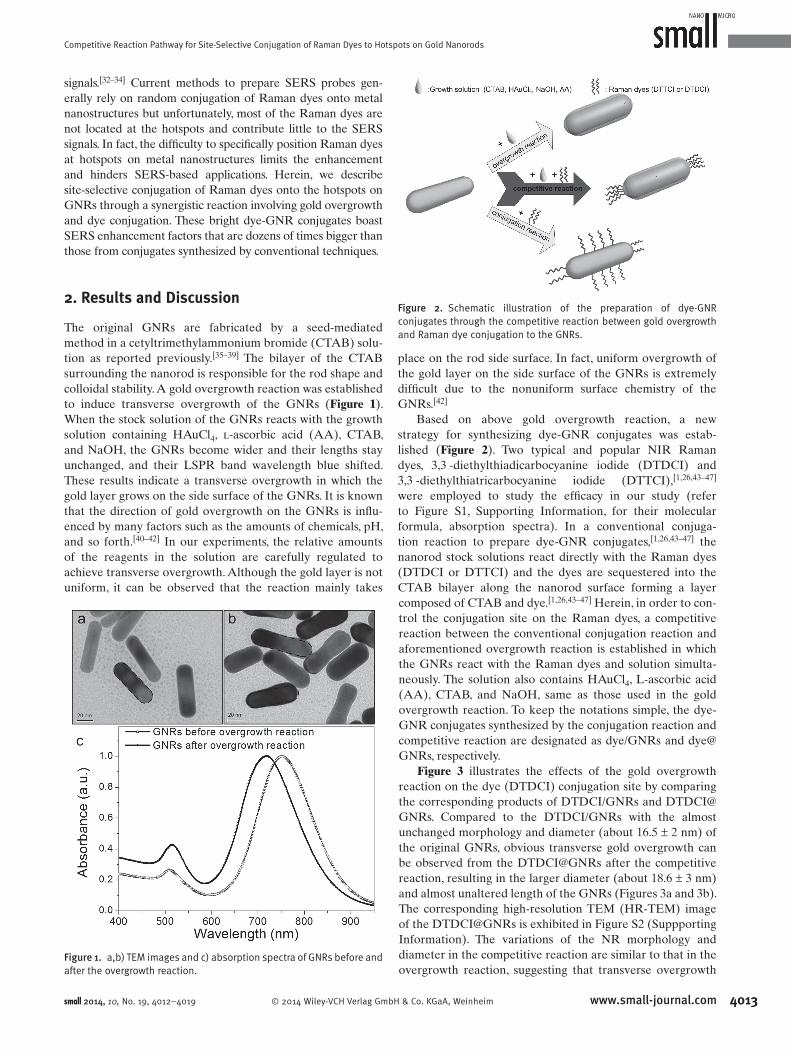
composed of CTAB and dye. [ 1,26,43–47 ] Herein, in order to con-
trol the conjugation site on the Raman dyes, a competitive
reaction between the conventional conjugation reaction and
aforementioned overgrowth reaction is established in which
the GNRs react with the Raman dyes and solution simulta-
neously. The solution also contains HAuCl 4 , L-ascorbic acid
(AA), CTAB, and NaOH, same as those used in the gold
overgrowth reaction. To keep the notations simple, the dye-
GNR conjugates synthesized by the conjugation reaction and
competitive reaction are designated as dye/GNRs and dye@
GNRs, respectively.
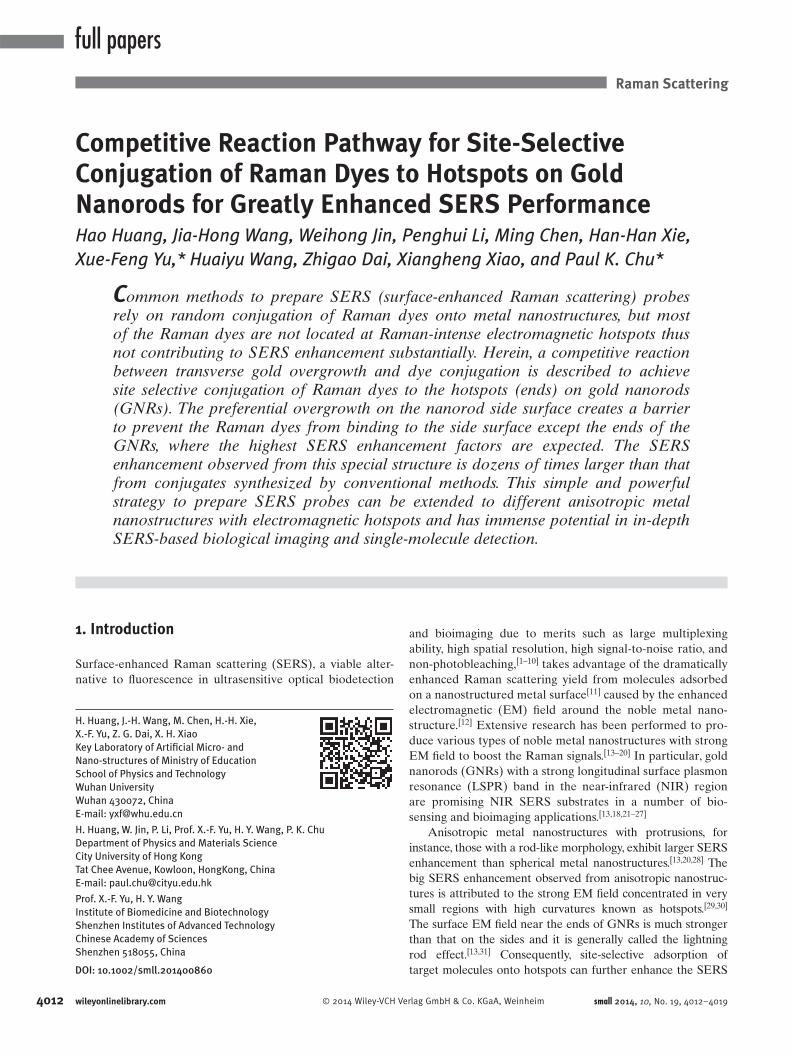
Figure 3 illustrates the effects of the gold overgrowth
reaction on the dye (DTDCI) conjugation site by comparing
the corresponding products of DTDCI/GNRs and DTDCI@
GNRs. Compared to the DTDCI/GNRs with the almost
unchanged morphology and diameter (about 16.5 ± 2 nm) of
the original GNRs, obvious transverse gold overgrowth can
be observed from the DTDCI@GNRs after the competitive
reaction, resulting in the larger diameter (about 18.6 ± 3 nm)
and almost unaltered length of the GNRs (Figures 3 a and 3 b).
The corresponding high-resolution TEM (HR-TEM) image
of the DTDCI@GNRs is exhibited in Figure S2 (Suppporting
Information). The variations of the NR morphology and
diameter in the competitive reaction are similar to that in the
overgrowth reaction, suggesting that transverse overgrowth
small 2014, 10, No. 19, 4012–4019
Figure 1. a,b) TEM images and c) absorption spectra of GNRs before and after the overgrowth reaction.
Figure 2. Schematic illustration of the preparation of dye-GNR conjugates through the competitive reaction between gold overgrowth and Raman dye conjugation to the GNRs.
competitive reaction is presented. It is well known that the
original GNRs are covered by at least a bilayer of CTAB [ 49 ]
and are pentatetrahedral twins with the {111} faces of gold
at the ends and {100} faces along the length of the rods. The
CTAB preferentially binds to the {100} faces along the length
of the rods compared to the end {111} Au faces due to the
small 2014, 10, No. 19, 4012–4019
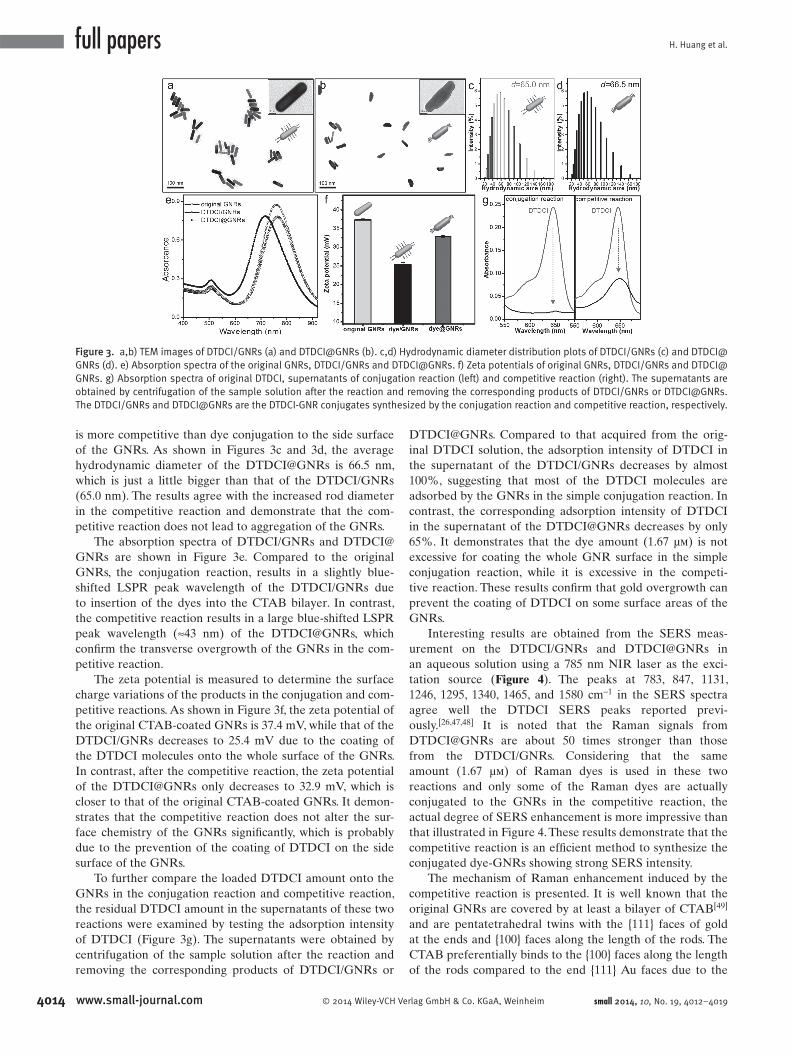
Figure 3. a,b) TEM images of DTDCI/GNRs (a) and DTDCI@GNRs (b). c,d) Hydrodynamic diameter distribution plots of DTDCI/GNRs (c) and DTDCI@GNRs (d). e) Absorption spectra of the original GNRs, DTDCI/GNRs and DTDCI@GNRs. f) Zeta potentials of original GNRs, DTDCI/GNRs and DTDCI@GNRs. g) Absorption spectra of original DTDCI, supernatants of conjugation reaction (left) and competitive reaction (right). The supernatants are obtained by centrifugation of the sample solution after the reaction and removing the corresponding products of DTDCI/GNRs or DTDCI@GNRs. The DTDCI/GNRs and DTDCI@GNRs are the DTDCI-GNR conjugates synthesized by the conjugation reaction and competitive reaction, respectively.
Competitive Reaction Pathway for Site-Selective Conjugation of Raman Dyes to Hotspots on Gold Nanorods
size of the CTAB head group. [ 33,49–51 ] In the conjugation reac-
tion, the hydrophobic molecules of DTDCI or DTTCI are
generally sequestered into the CTAB bilayer and bind to
the GNRs by the Au–S or Au–N interactions with high effi -
ciency. [ 26,43–47 ] Hence, most of them are generally conjugated
to the side surface of the GNRs in the simple conjugation
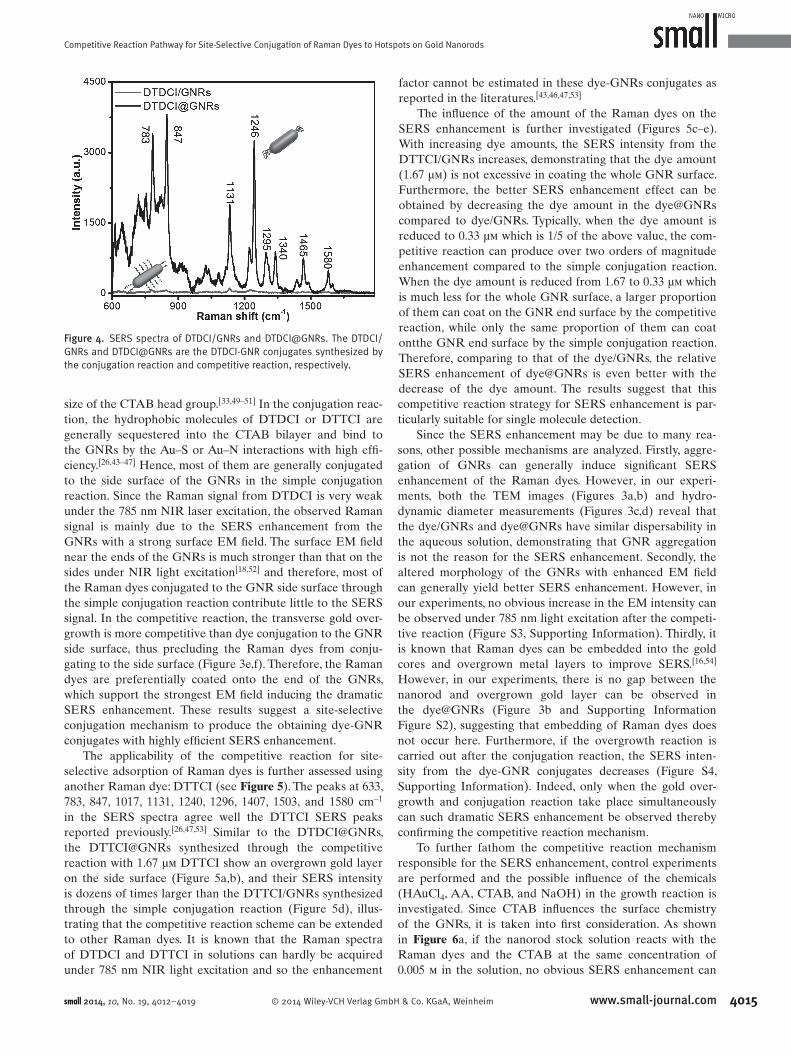
reaction. Since the Raman signal from DTDCI is very weak
under the 785 nm NIR laser excitation, the observed Raman
signal is mainly due to the SERS enhancement from the
GNRs with a strong surface EM fi eld. The surface EM fi eld
near the ends of the GNRs is much stronger than that on the
sides under NIR light excitation [ 18,52 ] and therefore, most of
the Raman dyes conjugated to the GNR side surface through
the simple conjugation reaction contribute little to the SERS
signal. In the competitive reaction, the transverse gold over-
growth is more competitive than dye conjugation to the GNR
side surface, thus precluding the Raman dyes from conju-
gating to the side surface (Figure 3 e,f). Therefore, the Raman
dyes are preferentially coated onto the end of the GNRs,
which support the strongest EM fi eld inducing the dramatic
SERS enhancement. These results suggest a site-selective
conjugation mechanism to produce the obtaining dye-GNR
conjugates with highly effi cient SERS enhancement.
The applicability of the competitive reaction for site-
selective adsorption of Raman dyes is further assessed using
another Raman dye: DTTCI (see Figure 5 ). The peaks at 633,
783, 847, 1017, 1131, 1240, 1296, 1407, 1503, and 1580 cm −1
in the SERS spectra agree well the DTTCI SERS peaks
reported previously. [ 26,47,53 ] Similar to the DTDCI@GNRs,
the DTTCI@GNRs synthesized through the competitive
reaction with 1.67 µ m DTTCI show an overgrown gold layer
on the side surface (Figure 5 a,b), and their SERS intensity
is dozens of times larger than the DTTCI/GNRs synthesized
through the simple conjugation reaction (Figure 5 d), illus-
trating that the competitive reaction scheme can be extended
to other Raman dyes. It is known that the Raman spectra
of DTDCI and DTTCI in solutions can hardly be acquired
under 785 nm NIR light excitation and so the enhancement
factor cannot be estimated in these dye-GNRs conjugates as
reported in the literatures. [ 43,46,47,53 ]
The infl uence of the amount of the Raman dyes on the
SERS enhancement is further investigated (Figures 5 c–e).
With increasing dye amounts, the SERS intensity from the
DTTCI/GNRs increases, demonstrating that the dye amount
(1.67 µ m ) is not excessive in coating the whole GNR surface.
Furthermore, the better SERS enhancement effect can be
obtained by decreasing the dye amount in the dye@GNRs
compared to dye/GNRs. Typically, when the dye amount is
reduced to 0.33 µm which is 1/5 of the above value, the com-
petitive reaction can produce over two orders of magnitude
enhancement compared to the simple conjugation reaction.
When the dye amount is reduced from 1.67 to 0.33 µm which
is much less for the whole GNR surface, a larger proportion
of them can coat on the GNR end surface by the competitive
reaction, while only the same proportion of them can coat
ontthe GNR end surface by the simple conjugation reaction.
Therefore, comparing to that of the dye/GNRs, the relative
SERS enhancement of dye@GNRs is even better with the
decrease of the dye amount. The results suggest that this
competitive reaction strategy for SERS enhancement is par-
ticularly suitable for single molecule detection.
Since the SERS enhancement may be due to many rea-
sons, other possible mechanisms are analyzed. Firstly, aggre-
gation of GNRs can generally induce signifi cant SERS
enhancement of the Raman dyes. However, in our experi-
ments, both the TEM images (Figures 3 a,b) and hydro-
dynamic diameter measurements (Figures 3 c,d) reveal that
the dye/GNRs and dye@GNRs have similar dispersability in
the aqueous solution, demonstrating that GNR aggregation
is not the reason for the SERS enhancement. Secondly, the
altered morphology of the GNRs with enhanced EM fi eld
can generally yield better SERS enhancement. However, in
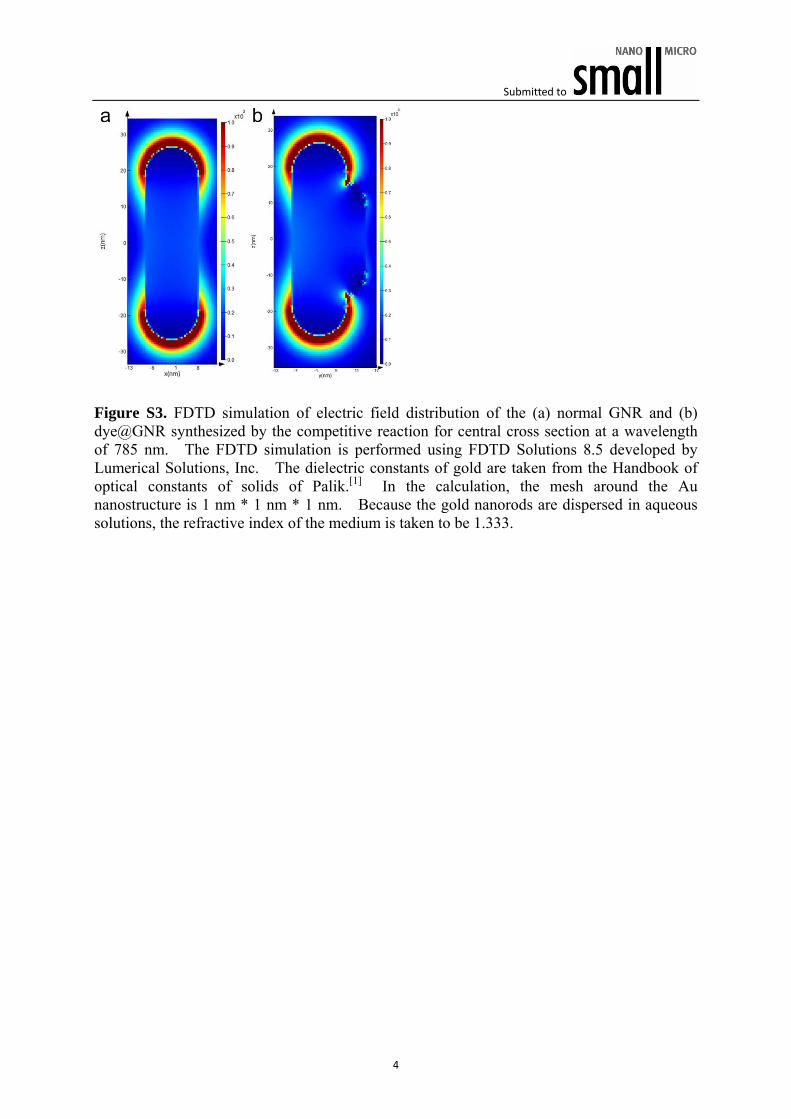
our experiments, no obvious increase in the EM intensity can
be observed under 785 nm light excitation after the competi-
tive reaction (Figure S3, Supporting Information). Thirdly, it
is known that Raman dyes can be embedded into the gold
cores and overgrown metal layers to improve SERS. [ 16,54 ]
However, in our experiments, there is no gap between the
nanorod and overgrown gold layer can be observed in
the dye@GNRs (Figure 3 b and Supporting Information
Figure S2), suggesting that embedding of Raman dyes does
not occur here. Furthermore, if the overgrowth reaction is
carried out after the conjugation reaction, the SERS inten-
sity from the dye-GNR conjugates decreases (Figure S4,
Supporting Information). Indeed, only when the gold over-
growth and conjugation reaction take place simultaneously
can such dramatic SERS enhancement be observed thereby
confi rming the competitive reaction mechanism.
To further fathom the competitive reaction mechanism
responsible for the SERS enhancement, control experiments
are performed and the possible infl uence of the chemicals
(HAuCl 4 , AA, CTAB, and NaOH) in the growth reaction is
investigated. Since CTAB infl uences the surface chemistry
of the GNRs, it is taken into fi rst consideration. As shown
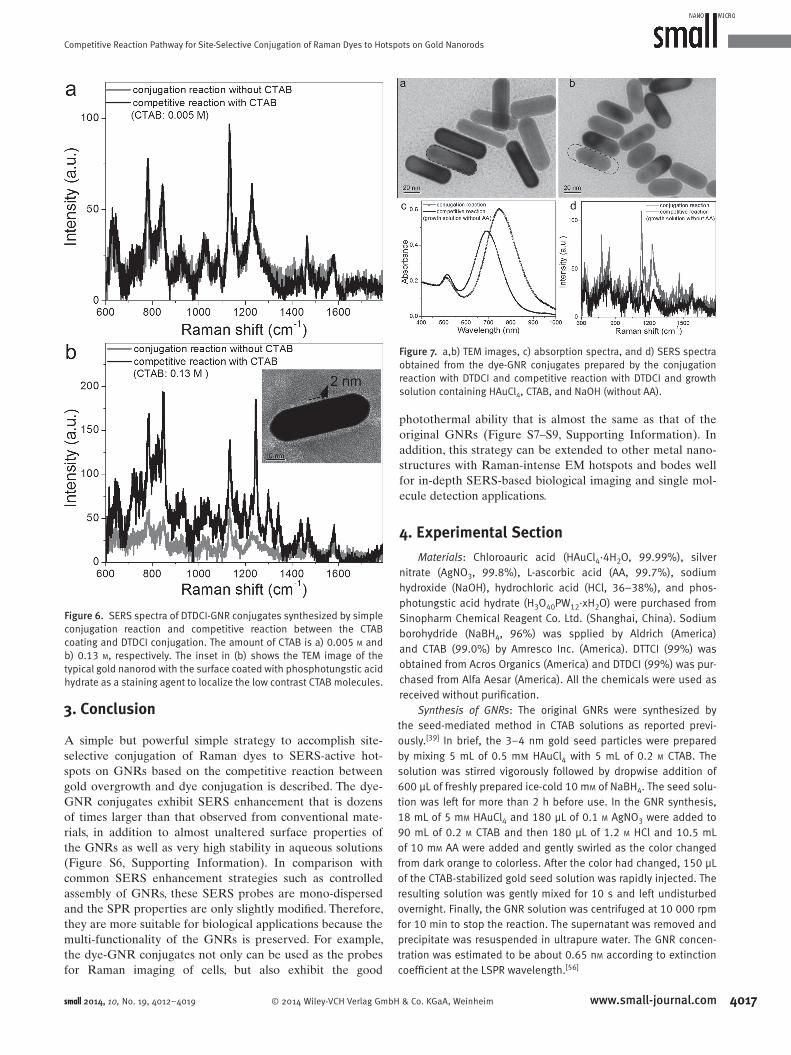
in Figure 6 a, if the nanorod stock solution reacts with the
Raman dyes and the CTAB at the same concentration of
0.005 m in the solution, no obvious SERS enhancement can
small 2014, 10, No. 19, 4012–4019
Figure 4. SERS spectra of DTDCI/GNRs and DTDCI@GNRs. The DTDCI/GNRs and DTDCI@GNRs are the DTDCI-GNR conjugates synthesized by the conjugation reaction and competitive reaction, respectively.
be observed. It demonstrates that the addition of CTAB is
not the reason for the SERS enhancement in the competi-
tive reaction and the results are similar for the other three
chemicals. However, CTAB can preferentially bind to the
side surface in lieu of the end surface on account of the
size of the CTAB head group [ 33,49,50 ] thus suggesting pos-
sible infl uence on the conjugation site of the Raman dyes.
Based on this consideration, another competitive reac-
tion between the dye conjugation and CTAB coating (with
greatly increased amount) to the GNRs is conducted. As
shown in the inset TEM image in Figure 6 b, after the GNR
stock solution reacts simultaneously with the Raman dyes
at a higher CTAB concentration of 0.13 m , a dense bilayer
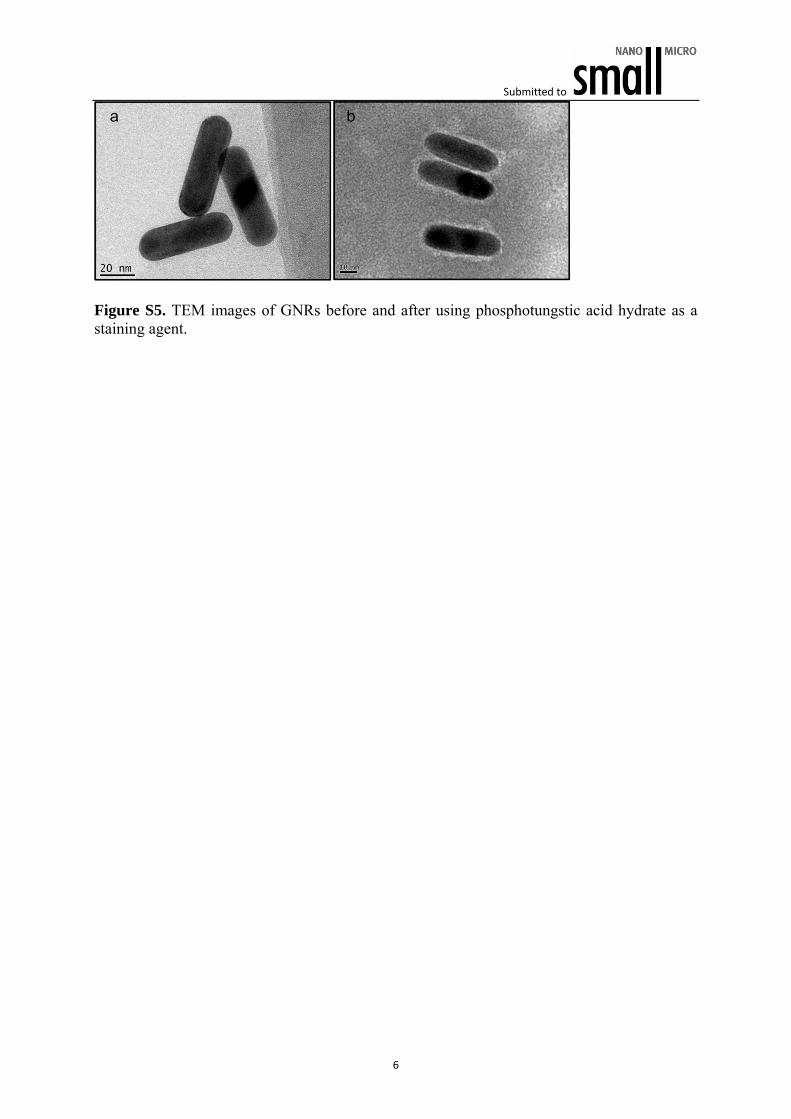
of CTAB can be observed from the nanorod side surface by
TEM using phosphotungstic acid hydrate as a staining agent,
whereas it is increasingly sparse at the ends of the GNRs (see
Supporting Information Figure S5 for the comparison of the
GNRs before and after staining). The CTAB coating is pre-
ferred over dye conjugation to the nanorod side surface, thus
precluding the Raman dyes from conjugating to the side sur-
face except the ends of the GNRs. As shown in Figure 6 b, the
dye-GNR conjugates synthesized by the competitive reaction
produce Raman signals that are several times more intense
than those from common conjugates. The results confi rm the
proposed competitive reaction pathway for the better SERS
enhancement and suggest that the pathway can be extended
to other systems simply by adopting different competitive
reactions against dye conjugation.
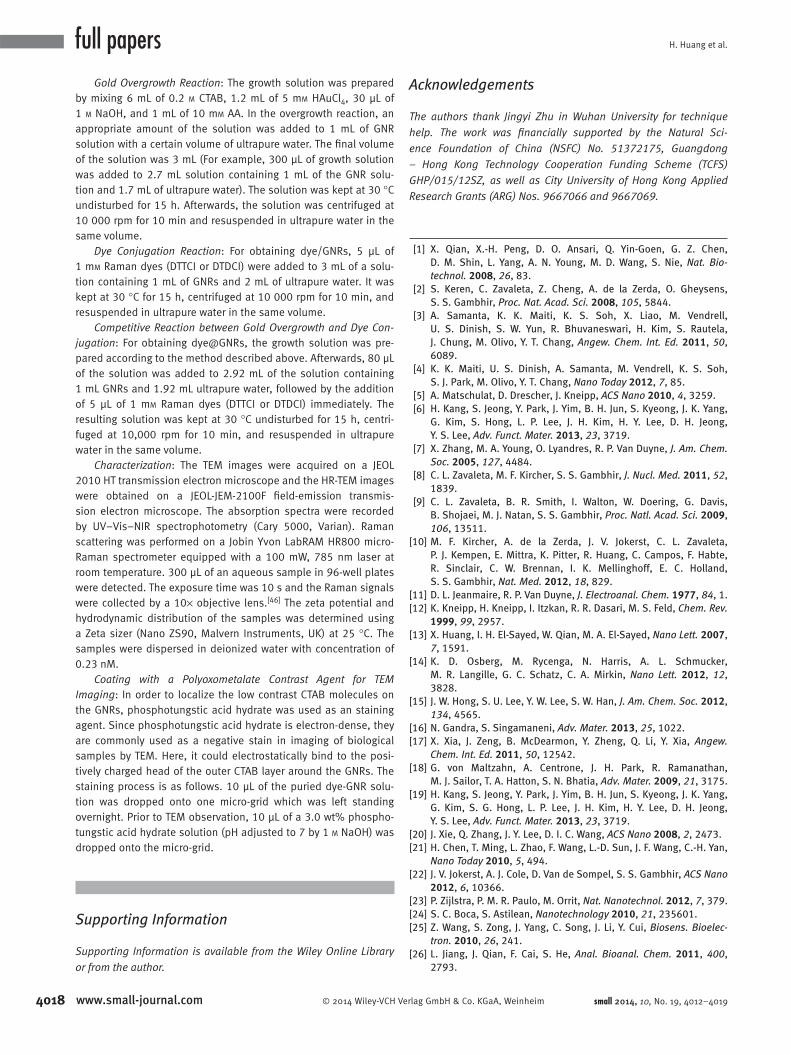
Furthermore, an opposite competitive reaction is estab-
lished to further illuminate the mechanism for the SERS
enhancement ( Figure 7 ). When the GNRs react with the
Raman dyes and solution containing HAuCl 4 , NaOH, and
CTAB with the same amount of the growth solution (just
without AA), an interesting phenomenon can be observed.
As shown in Figure 7 b, the nanorod length diminishes
obviously but the diameter does not change, implying that
an end etching reaction takes place. Such etching reaction
is due to the presence of CTAB and Au 3+ ions. Under cer-
tain reaction conditions, the redox reaction between Au 0
and Au 3+ ions occurs in the presence of CTAB micelles and
meanwhile, the CTAB micelles approach the nanoparticles
preferentially at the tips leading to spatially directed oxida-
tion. [ 55 ] It should be emphasized that the products result in
even lower SERS intensity compared with the conjugates by
commonly conjugation reaction (Figure 7 d). These results
provide an opposite competitive reaction between end
etching and dye conjugation, in which etching can prevent
the Raman molecules from conjugating to the end surface
except the nanorod side, where only small SERS enhance-
ment is expected.
small 2014, 10, No. 19, 4012–4019
Figure 5. a,b) TEM images of DTTCI/GNRs (a) and DTTCI@GNRs (b) synthesized with DTTCI of 1.67 µ M . c–e) SERS spectra of of DTTCI/GNRs and DTTCI@GNRs synthesized with DTTCI at concentrations of 0.33 µ M (c), 1.67 µ M (d), and 3.34 µ M (e). DTTCI/GNRs and DTTCI@GNRs are the DTTCI-GNR conjugates synthesized by the conjugation reaction and competitive reaction, respectively.
Competitive Reaction Pathway for Site-Selective Conjugation of Raman Dyes to Hotspots on Gold Nanorods
A simple but powerful simple strategy to accomplish site-
selective conjugation of Raman dyes to SERS-active hot-
spots on GNRs based on the competitive reaction between
gold overgrowth and dye conjugation is described. The dye-
GNR conjugates exhibit SERS enhancement that is dozens
of times larger than that observed from conventional mate-
rials, in addition to almost unaltered surface properties of
the GNRs as well as very high stability in aqueous solutions
(Figure S6, Supporting Information). In comparison with
common SERS enhancement strategies such as controlled
assembly of GNRs, these SERS probes are mono-dispersed
and the SPR properties are only slightly modifi ed. Therefore,
they are more suitable for biological applications because the
multi-functionality of the GNRs is preserved. For example,
the dye-GNR conjugates not only can be used as the probes
for Raman imaging of cells, but also exhibit the good
photothermal ability that is almost the same as that of the
original GNRs (Figure S7–S9, Supporting Information). In
addition, this strategy can be extended to other metal nano-
structures with Raman-intense EM hotspots and bodes well
for in-depth SERS-based biological imaging and single mol-
ecule detection applications.
4. Experimental Section
Materials : Chloroauric acid (HAuCl 4 ·4H 2 O, 99.99%), silver nitrate (AgNO 3 , 99.8%), L-ascorbic acid (AA, 99.7%), sodium hydroxide (NaOH), hydrochloric acid (HCl, 36–38%), and phos-photungstic acid hydrate (H 3 O 40 PW 12 ·xH 2 O) were purchased from Sinopharm Chemical Reagent Co. Ltd. (Shanghai, China). Sodium borohydride (NaBH 4 , 96%) was spplied by Aldrich (America) and CTAB (99.0%) by Amresco Inc. (America). DTTCI (99%) was obtained from Acros Organics (America) and DTDCI (99%) was pur-chased from Alfa Aesar (America). All the chemicals were used as received without purifi cation.
Synthesis of GNRs : The original GNRs were synthesized by the seed-mediated method in CTAB solutions as reported previ-ously. [ 39 ] In brief, the 3–4 nm gold seed particles were prepared by mixing 5 mL of 0.5 mm HAuCl 4 with 5 mL of 0.2 M CTAB. The solution was stirred vigorously followed by dropwise addition of 600 µL of freshly prepared ice-cold 10 m M of NaBH 4 . The seed solu-tion was left for more than 2 h before use. In the GNR synthesis, 18 mL of 5 m M HAuCl 4 and 180 µL of 0.1 M AgNO 3 were added to 90 mL of 0.2 M CTAB and then 180 µL of 1.2 M HCl and 10.5 mL of 10 m M AA were added and gently swirled as the color changed from dark orange to colorless. After the color had changed, 150 µL of the CTAB-stabilized gold seed solution was rapidly injected. The resulting solution was gently mixed for 10 s and left undisturbed overnight. Finally, the GNR solution was centrifuged at 10 000 rpm for 10 min to stop the reaction. The supernatant was removed and precipitate was resuspended in ultrapure water. The GNR concen-tration was estimated to be about 0.65 n M according to extinction coeffi cient at the LSPR wavelength. [ 56 ]
small 2014, 10, No. 19, 4012–4019
Figure 6. SERS spectra of DTDCI-GNR conjugates synthesized by simple conjugation reaction and competitive reaction between the CTAB coating and DTDCI conjugation. The amount of CTAB is a) 0.005 M and b) 0.13 M , respectively. The inset in (b) shows the TEM image of the typical gold nanorod with the surface coated with phosphotungstic acid hydrate as a staining agent to localize the low contrast CTAB molecules.
Figure 7. a,b) TEM images, c) absorption spectra, and d) SERS spectra obtained from the dye-GNR conjugates prepared by the conjugation reaction with DTDCI and competitive reaction with DTDCI and growth solution containing HAuCl 4 , CTAB, and NaOH (without AA).
Gold Overgrowth Reaction : The growth solution was prepared by mixing 6 mL of 0.2 M CTAB, 1.2 mL of 5 m M HAuCl 4 , 30 µL of 1 M NaOH, and 1 mL of 10 m M AA. In the overgrowth reaction, an appropriate amount of the solution was added to 1 mL of GNR solution with a certain volume of ultrapure water. The fi nal volume of the solution was 3 mL (For example, 300 µL of growth solution was added to 2.7 mL solution containing 1 mL of the GNR solu-tion and 1.7 mL of ultrapure water). The solution was kept at 30 °C undisturbed for 15 h. Afterwards, the solution was centrifuged at 10 000 rpm for 10 min and resuspended in ultrapure water in the same volume.
Dye Conjugation Reaction : For obtaining dye/GNRs, 5 µL of 1 m M Raman dyes (DTTCI or DTDCI) were added to 3 mL of a solu-tion containing 1 mL of GNRs and 2 mL of ultrapure water. It was kept at 30 °C for 15 h, centrifuged at 10 000 rpm for 10 min, and resuspended in ultrapure water in the same volume.
Competitive Reaction between Gold Overgrowth and Dye Con-jugation : For obtaining dye@GNRs, the growth solution was pre-pared according to the method described above. Afterwards, 80 µL of the solution was added to 2.92 mL of the solution containing 1 mL GNRs and 1.92 mL ultrapure water, followed by the addition of 5 µL of 1 m M Raman dyes (DTTCI or DTDCI) immediately. The resulting solution was kept at 30 °C undisturbed for 15 h, centri-fuged at 10,000 rpm for 10 min, and resuspended in ultrapure water in the same volume.
Characterization : The TEM images were acquired on a JEOL 2010 HT transmission electron microscope and the HR-TEM images were obtained on a JEOL-JEM-2100F fi eld-emission transmis-sion electron microscope. The absorption spectra were recorded by UV–Vis–NIR spectrophotometry (Cary 5000, Varian). Raman scattering was performed on a Jobin Yvon LabRAM HR800 micro-Raman spectrometer equipped with a 100 mW, 785 nm laser at room temperature. 300 µL of an aqueous sample in 96-well plates were detected. The exposure time was 10 s and the Raman signals were collected by a 10× objective lens. [ 46 ] The zeta potential and hydrodynamic distribution of the samples was determined using a Zeta sizer (Nano ZS90, Malvern Instruments, UK) at 25 °C. The samples were dispersed in deionized water with concentration of 0.23 nM.
Coating with a Polyoxometalate Contrast Agent for TEM Imaging : In order to localize the low contrast CTAB molecules on the GNRs, phosphotungstic acid hydrate was used as an staining agent. Since phosphotungstic acid hydrate is electron-dense, they are commonly used as a negative stain in imaging of biological samples by TEM. Here, it could electrostatically bind to the posi-tively charged head of the outer CTAB layer around the GNRs. The staining process is as follows. 10 µL of the puried dye-GNR solu-tion was dropped onto one micro-grid which was left standing overnight. Prior to TEM observation, 10 µL of a 3.0 wt% phospho-tungstic acid hydrate solution (pH adjusted to 7 by 1 M NaOH) was dropped onto the micro-grid.
Supporting Information
Supporting Information is available from the Wiley Online Library or from the author.
Acknowledgements
The authors thank Jingyi Zhu in Wuhan University for technique help. The work was fi nancially supported by the Natural Sci-ence Foundation of China (NSFC) No. 51372175, Guangdong – Hong Kong Technology Cooperation Funding Scheme (TCFS) GHP/015/12SZ, as well as City University of Hong Kong Applied Research Grants (ARG) Nos. 9667066 and 9667069.
[1] X. Qian , X.-H. Peng , D. O. Ansari , Q. Yin-Goen , G. Z. Chen , D. M. Shin , L. Yang , A. N. Young , M. D. Wang , S. Nie , Nat. Bio-technol. 2008 , 26 , 83 .
[2] S. Keren , C. Zavaleta , Z. Cheng , A. de la Zerda , O. Gheysens , S. S. Gambhir , Proc. Nat. Acad. Sci. 2008 , 105 , 5844 .
[3] A. Samanta , K. K. Maiti , K. S. Soh , X. Liao , M. Vendrell , U. S. Dinish , S. W. Yun , R. Bhuvaneswari , H. Kim , S. Rautela , J. Chung , M. Olivo , Y. T. Chang , Angew. Chem. Int. Ed. 2011 , 50 , 6089 .
[4] K. K. Maiti , U. S. Dinish , A. Samanta , M. Vendrell , K. S. Soh , S. J. Park , M. Olivo , Y. T. Chang , Nano Today 2012 , 7 , 85 .
[5] A. Matschulat , D. Drescher , J. Kneipp , ACS Nano 2010 , 4 , 3259 . [6] H. Kang , S. Jeong , Y. Park , J. Yim , B. H. Jun , S. Kyeong , J. K. Yang ,
G. Kim , S. Hong , L. P. Lee , J. H. Kim , H. Y. Lee , D. H. Jeong , Y. S. Lee , Adv. Funct. Mater. 2013 , 23 , 3719 .
[7] X. Zhang , M. A. Young , O. Lyandres , R. P. Van Duyne , J. Am. Chem. Soc. 2005 , 127 , 4484 .
[8] C. L. Zavaleta , M. F. Kircher , S. S. Gambhir , J. Nucl. Med. 2011 , 52 , 1839 .
[9] C. L. Zavaleta , B. R. Smith , I. Walton , W. Doering , G. Davis , B. Shojaei , M. J. Natan , S. S. Gambhir , Proc. Natl. Acad. Sci. 2009 , 106 , 13511 .
[10] M. F. Kircher , A. de la Zerda , J. V. Jokerst , C. L. Zavaleta , P. J. Kempen , E. Mittra , K. Pitter , R. Huang , C. Campos , F. Habte , R. Sinclair , C. W. Brennan , I. K. Mellinghoff , E. C. Holland , S. S. Gambhir , Nat. Med. 2012 , 18 , 829 .
[11] D. L. Jeanmaire , R. P. Van Duyne , J. Electroanal. Chem. 1977 , 84 , 1 . [12] K. Kneipp , H. Kneipp , I. Itzkan , R. R. Dasari , M. S. Feld , Chem. Rev.
1999 , 99 , 2957 . [13] X. Huang , I. H. El-Sayed , W. Qian , M. A. El-Sayed , Nano Lett. 2007 ,
7 , 1591 . [14] K. D. Osberg , M. Rycenga , N. Harris , A. L. Schmucker ,
M. R. Langille , G. C. Schatz , C. A. Mirkin , Nano Lett. 2012 , 12 , 3828 .
[15] J. W. Hong , S. U. Lee , Y. W. Lee , S. W. Han , J. Am. Chem. Soc. 2012 , 134 , 4565 .
[16] N. Gandra , S. Singamaneni , Adv. Mater. 2013 , 25 , 1022 . [17] X. Xia , J. Zeng , B. McDearmon , Y. Zheng , Q. Li , Y. Xia , Angew.
Chem. Int. Ed. 2011 , 50 , 12542 . [18] G. von Maltzahn , A. Centrone , J. H. Park , R. Ramanathan ,
M. J. Sailor , T. A. Hatton , S. N. Bhatia , Adv. Mater. 2009 , 21 , 3175 . [19] H. Kang , S. Jeong , Y. Park , J. Yim , B. H. Jun , S. Kyeong , J. K. Yang ,
G. Kim , S. G. Hong , L. P. Lee , J. H. Kim , H. Y. Lee , D. H. Jeong , Y. S. Lee , Adv. Funct. Mater. 2013 , 23 , 3719 .
[20] J. Xie , Q. Zhang , J. Y. Lee , D. I. C. Wang , ACS Nano 2008 , 2 , 2473 . [21] H. Chen , T. Ming , L. Zhao , F. Wang , L.-D. Sun , J. F. Wang , C.-H. Yan ,
Nano Today 2010 , 5 , 494 . [22] J. V. Jokerst , A. J. Cole , D. Van de Sompel , S. S. Gambhir , ACS Nano
2012 , 6 , 10366 . [23] P. Zijlstra , P. M. R. Paulo , M. Orrit , Nat. Nanotechnol. 2012 , 7 , 379 . [24] S. C. Boca , S. Astilean , Nanotechnology 2010 , 21 , 235601 . [25] Z. Wang , S. Zong , J. Yang , C. Song , J. Li , Y. Cui , Biosens. Bioelec-
tron. 2010 , 26 , 241 . [26] L. Jiang , J. Qian , F. Cai , S. He , Anal. Bioanal. Chem. 2011 , 400 ,
2793 .
Competitive Reaction Pathway for Site-Selective Conjugation of Raman Dyes to Hotspots on Gold Nanorods
[27] H. Park , S. Lee , L. Chen , E. K. Lee , S. Y. Shin , Y. H. Lee , S. W. Son , C. H. Oh , J. M. Song , S. H. Kangf , J. Choo , Phys. Chem. Chem. Phys. 2009 , 11 , 7444 .
[28] J. M. McLellan , Z. Y. Li , A. R. Siekkinen , Y. N. Xia , Nano Lett. 2007 , 7 , 1013 .
[29] Y. Fang , N.-H. Seong , D. D. Dlott , Science 2008 , 321 , 388 . [30] C. Chen , J. A. Hutchison , F. Clemente , R. Kox , H. Uji-I , J. Hofkens ,
L. Lagae , G. Maes , G. Borghs , P. Van , Angew. Chem. Int. Ed. 2009 , 48 , 9932 .
[31] E. Hao , G. C. Schatz , J. Chem. Phys. 2004 , 120 , 357 . [32] T. Chen , C. Du , L. H. Tan , Z. Shen , H. Chen , Nanoscale 2011 , 3 ,
1575 . [33] E. C. Le Ru , J. Grand , I. Sow , W. R. C. Somerville , P. G. Etchegoin ,
M. Treguer-Delapierre , G. Charron , N. Felidj , G. Levi , J. Aubard , Nano Lett. 2011 , 11 , 5013 .
[34] T. Chen , H. Wang , G. Chen , Y. Wang , Y. Feng , W. S. Teo , T. Wu , H. Chen , ACS Nano 2010 , 4 , 3087 .
[35] T. K. Sau , C. J. Murphy , Langmuir 2004 , 20 , 6414 . [36] W. H. Ni , X. S. Kou , Z. Yang , J. F. Wang , ACS Nano 2008 , 2 , 677 . [37] H. Wang , Z. Sun , Q. Lu , F. Zeng , D. Su , small 2012 , 8 , 1167 . [38] M. Li , X. F. Yu , S. Liang , X. N. Peng , Y. L. Wang , Q. Q. Wang , Adv.
Funct. Mater. 2011 , 21 , 1788 . [39] J. H. Wang , B. Wang , Q. Liu , Q. Li , H. Huang , L. Song , T. Y. Sun ,
H. Wang , X. F. Yu , C. Li , P. K. Chu , Biomaterials 2013 , 34 , 4274 . [40] L. Scarabelli , M. Grzelczak , L. M. Liz-Marzán , Chem. Mater. 2013 ,
25 , 4232 . [41] H. Huang , S. Chen , F. Liu , Q. Zhao , B. Liao , S. Yi , Y. Zeng , Anal.
Chem. 2013 , 85 , 2312 . [42] X. S. Kou , S. Z. Zhang , Z. Yang , C.-K. Tsung , G. D. Stucky , L. D. Sun ,
J. F. Wang , C. H. Yan , J. Am. Chem. Soc. 2007 , 129 , 6402 .
[43] A. McLintock , N. Hunt , A. W. Wark , Chem. Commun. 2011 , 47 , 3757 . [44] L. Zhong , X. Zhou , S. Bao , Y. Shi , Y. Wang , S. Hong ,
Y. Huang , X. Wang , Z. Xie , Q. Zhang , J. Mater. Chem. 2011 , 21 , 14448 .
[45] A. M. Alkilany , R. L. Frey , J. L. Ferry , C. J. Murphy , Langmuir 2008 , 24 , 10235 .
[46] J. Qian , L. Jiang , F. Cai , D. Wang , S. He , Biomaterials 2011 , 32 , 1601 .
[47] A. McLintock , H. J. Lee , A. W. Wark , Phys. Chem. Chem. Phys. 2013 , 15 , 18835 .
[48] K. Iwata , W. L. Weaver , T. L. Gustafson , J. Phys. Chem. 1992 , 96 , 10219 .
[49] B. Nikoobakht , M. A. El-Sayed , Langmuir 2001 , 17 , 6368 . [50] C. J. Johnsona , E. Dujardina , S. A. Davisa , C. J. Murphy , S. Mann ,
J. Mater. Chem. 2002 , 12 , 1765 . [51] B. Nikoobakht , J. Wang , M. A. El-Sayed , Chem. Phys. Lett. 2002 ,
366 , 17 . [52] C. L. Haynes , A. D. McFarland , R. P. Van Duyne , Anal. Chem. 2005 ,
Competitive Reaction Pathway for Site-Selective Conjugation of Raman Dyes to Hotspots on Gold Nanorods for Greatly Enhanced SERS Performance Hao Huang, Jia-Hong Wang, Weihong Jin, Penghui Li, Ming Chen, Han-Han Xie, Xue-Feng Yu,* Huaiyu Wang, Zhigao Dai, Xiangheng Xiao, and P aul K. Chu*
Submitted to
1
Supporting Information for Small, DOI: 10.1002/ smll.201400860R1 Competitive reaction pathway for site-selective conjugation of Raman dyes to hotspots on gold nanorods for greatly enhanced SERS performance Hao Huang, Jia-Hong Wang, Weihong Jin, Penghui, Li, Ming Chen, Han-Han Xie, Xue-Feng Yu,* Huaiyu Wang, Zhigao Dai, Xiangheng Xiao, Paul K. Chu* H. Huang, W. Jin, P. Li, Prof. X. F. Yu, H. Y. Wang, P. K. Chu Department of Physics and Materials Science, City University of Hong Kong, Tat Chee Avenue, Kowloon, Hong Kong, China E-mail: [email protected] H. Huang, J. H. Wang, M. Chen, H. H. Xie, X. F. Yu, Z. G. Dai, X. H. Xiao Key Laboratory of Artificial Micro- and Nano-Structures, of Ministry of Education, School of Physics and Technology, Wuhan University, Wuhan 430072, China Email: [email protected] Prof. X. Y. Yu, H. Y. Wang Institute of Biomedicine and Biotechnology, Shenzhen Institutes of Advanced Technology, Chinese Academy of Sciences, Shenzhen, 518055, China.
Submitted to
2
Figure S1. Molecular formula and absorption spectra: DTDCI and DTTCI.
Submitted to
3
Figure S2. HR-TEM image of one typical overgrown gold nanorod (dye@GNR) after the competitive reaction.
Submitted to
4
Figure S3. FDTD simulation of electric field distribution of the (a) normal GNR and (b) dye@GNR synthesized by the competitive reaction for central cross section at a wavelength of 785 nm. The FDTD simulation is performed using FDTD Solutions 8.5 developed by Lumerical Solutions, Inc. The dielectric constants of gold are taken from the Handbook of optical constants of solids of Palik.[1] In the calculation, the mesh around the Au nanostructure is 1 nm * 1 nm * 1 nm. Because the gold nanorods are dispersed in aqueous solutions, the refractive index of the medium is taken to be 1.333.
Submitted to
5
Figure S4. (a, b) TEM images and (c) SERS spectra of the dye-GNR conjugates synthesized by the conjugation reaction without and with the following overgrowth reaction.
Submitted to
6
Figure S5. TEM images of GNRs before and after using phosphotungstic acid hydrate as a staining agent.
Submitted to
7
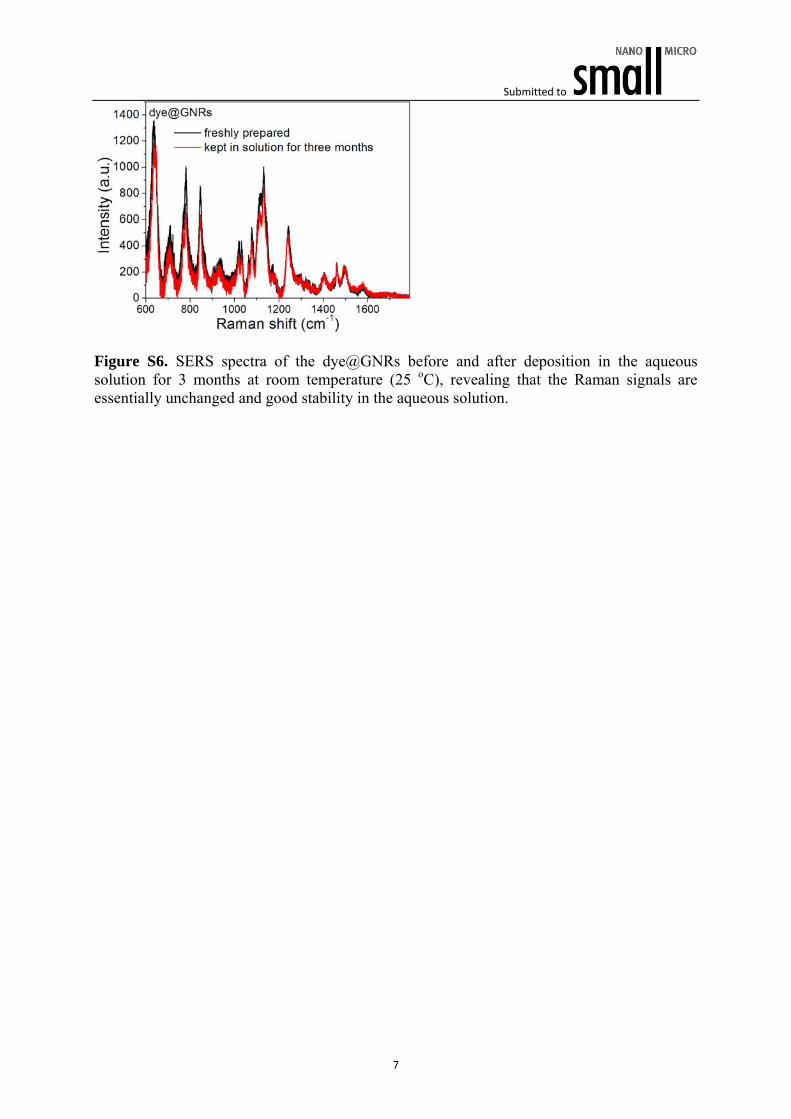
Figure S6. SERS spectra of the dye@GNRs before and after deposition in the aqueous solution for 3 months at room temperature (25 oC), revealing that the Raman signals are essentially unchanged and good stability in the aqueous solution.
Submitted to
8
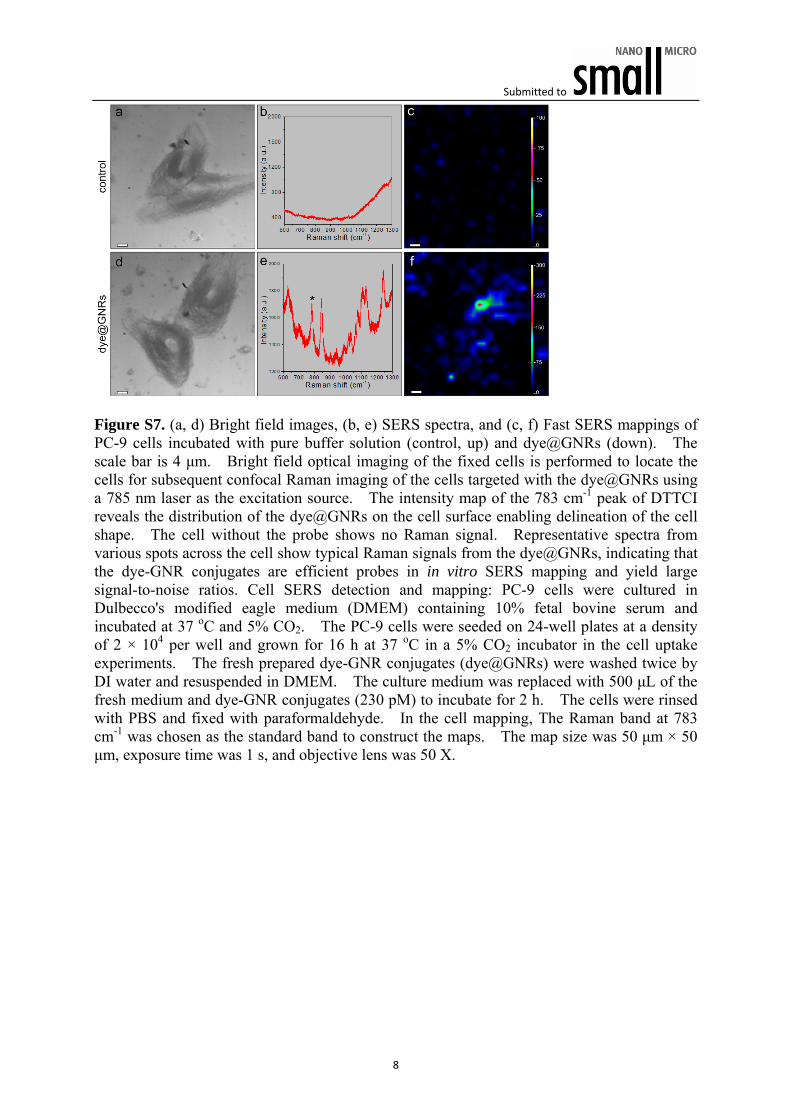
Figure S7. (a, d) Bright field images, (b, e) SERS spectra, and (c, f) Fast SERS mappings of PC-9 cells incubated with pure buffer solution (control, up) and dye@GNRs (down). The scale bar is 4 μm. Bright field optical imaging of the fixed cells is performed to locate the cells for subsequent confocal Raman imaging of the cells targeted with the dye@GNRs using a 785 nm laser as the excitation source. The intensity map of the 783 cm-1 peak of DTTCI reveals the distribution of the dye@GNRs on the cell surface enabling delineation of the cell shape. The cell without the probe shows no Raman signal. Representative spectra from various spots across the cell show typical Raman signals from the dye@GNRs, indicating that the dye-GNR conjugates are efficient probes in in vitro SERS mapping and yield large signal-to-noise ratios. Cell SERS detection and mapping: PC-9 cells were cultured in Dulbecco's modified eagle medium (DMEM) containing 10% fetal bovine serum and incubated at 37 oC and 5% CO2. The PC-9 cells were seeded on 24-well plates at a density of 2 × 10⁴ per well and grown for 16 h at 37 oC in a 5% CO2 incubator in the cell uptake experiments. The fresh prepared dye-GNR conjugates (dye@GNRs) were washed twice by DI water and resuspended in DMEM. The culture medium was replaced with 500 μL of the fresh medium and dye-GNR conjugates (230 pM) to incubate for 2 h. The cells were rinsed with PBS and fixed with paraformaldehyde. In the cell mapping, The Raman band at 783 cm-1 was chosen as the standard band to construct the maps. The map size was 50 μm × 50 μm, exposure time was 1 s, and objective lens was 50 X.
Submitted to
9
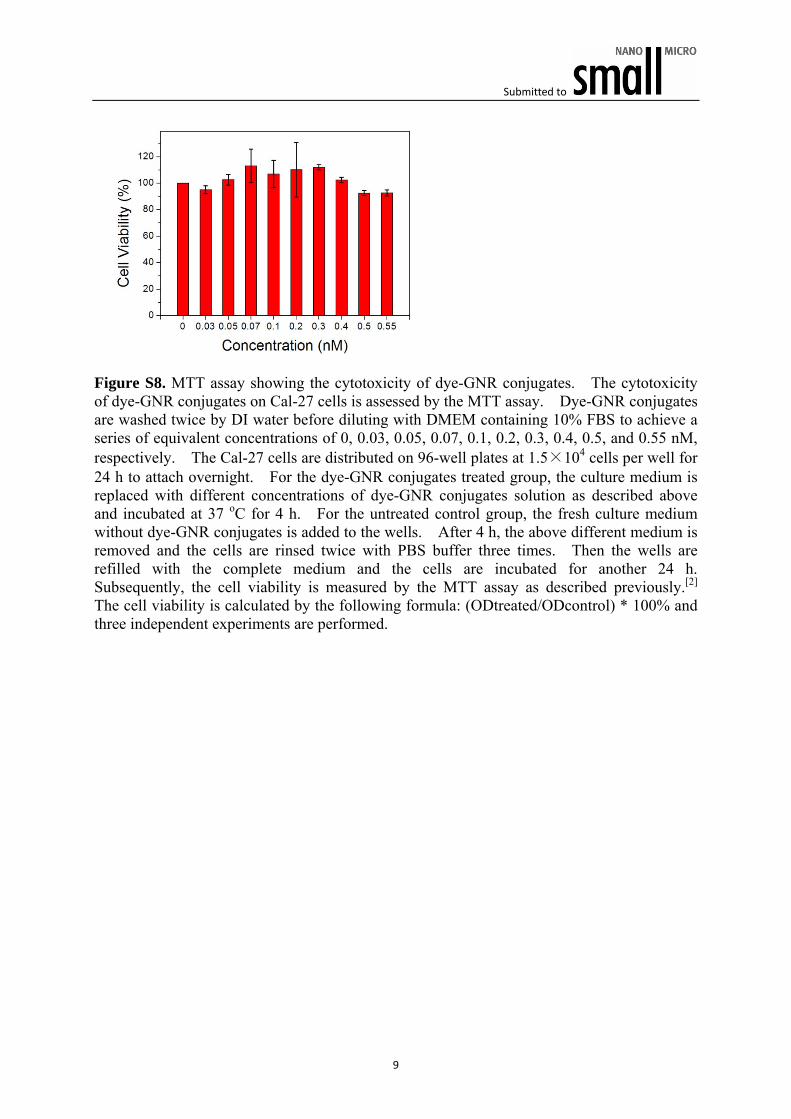
Figure S8. MTT assay showing the cytotoxicity of dye-GNR conjugates. The cytotoxicity of dye-GNR conjugates on Cal-27 cells is assessed by the MTT assay. Dye-GNR conjugates are washed twice by DI water before diluting with DMEM containing 10% FBS to achieve a series of equivalent concentrations of 0, 0.03, 0.05, 0.07, 0.1, 0.2, 0.3, 0.4, 0.5, and 0.55 nM, respectively. The Cal-27 cells are distributed on 96-well plates at 1.5×10⁴ cells per well for 24 h to attach overnight. For the dye-GNR conjugates treated group, the culture medium is replaced with different concentrations of dye-GNR conjugates solution as described above and incubated at 37 oC for 4 h. For the untreated control group, the fresh culture medium without dye-GNR conjugates is added to the wells. After 4 h, the above different medium is removed and the cells are rinsed twice with PBS buffer three times. Then the wells are refilled with the complete medium and the cells are incubated for another 24 h. Subsequently, the cell viability is measured by the MTT assay as described previously.[2] The cell viability is calculated by the following formula: (ODtreated/ODcontrol) * 100% and three independent experiments are performed.
Submitted to
10
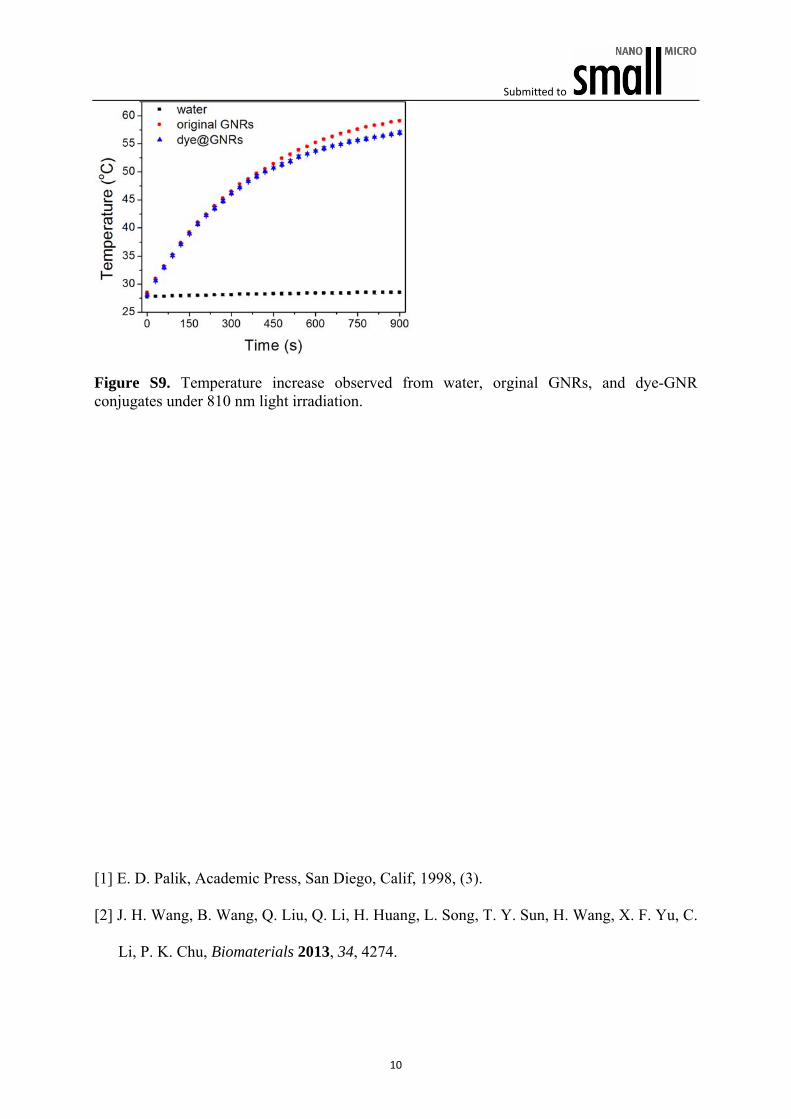
Figure S9. Temperature increase observed from water, orginal GNRs, and dye-GNR conjugates under 810 nm light irradiation. [1] E. D. Palik, Academic Press, San Diego, Calif, 1998, (3). [2] J. H. Wang, B. Wang, Q. Liu, Q. Li, H. Huang, L. Song, T. Y. Sun, H. Wang, X. F. Yu, C.