Competitiveness of the Turkish Fruitand Vegetable Processing Industryin the European Union Market
Abstract: The study investigates the competitive power of Turkey’s tomato, grape, and cit-rus fruit processing industry product exports (products with the highest shares in Turkey’stotal fruit and vegetable exports) in the EU market. The export similarity index reveals thatGreece, Spain, and Portugal are Turkey’s competitors. The revealed comparative advan-tage index and comparative export performance index show that Turkey’s competitive poweris higher than Spain and Portugal in processed grape exports, and is higher than Greeceand Portugal in citrus fruit exports. There is no indication of competitiveness for processedtomato exports. The econometric import demand model reveals that relative export pricesmatter in determining Turkey’s competitive power in the EU-processed tomato and grapemarkets.
Key words: cost competitiveness, export similarity, Turkey and European Union trade rela-tions, Turkish fruit and vegetable process.
Turkey has been in a Customs Union with the European Union since December31, 1995. In December 1997, the Luxemburg European Council confirmed Turkey’seligibility for accession into the European Union and that the accession decision
Sedef Akgüngör is an associate professor in the Faculty of Economics and Administra-tive Sciences, Department of Management, Isik University, Maslak, Istanbul; R. FundaBarbaros and Nese Kumral are an assistant professor and associate professor, respectively,in the Faculty of Economics and Administrative Sciences, Department of Economics at EgeUniversity, Bornova, Izmir. An earlier version of this paper was presented at the METUConference in Economics, 2000. The authors gratefully acknowledge the remarks by theparticipants in the session. They thank Serdar Sayan for being a reviewer for the researchproject funded by the Agricultural Economics Research Institute (AERI), out of which thispaper was drafted.
MAY–JUNE 2002 35
will be judged on the basis of the same criteria as the other applicant states. Theaccession procedure requires Turkey’s preparation and commitment to bring itselfcloser to the European Union in every aspect.
During the preparation for the accession process, one issue of particular impor-tance for the Turkish economy is free movement of goods and, particularly, prod-ucts of agricultural origin. The related chapter, as laid out in decision no. 1/95 ofthe EC–Turkey Association Council on implementing the final phase of the cus-toms union, excludes agricultural products from eliminating customs duties, quan-titative restrictions, and measures having equivalent effects. The association councilputs special provisions related to agricultural products and notes that an additionalperiod is required to put in place the conditions necessary to achieve free move-ment of agricultural products.
Restraining the Turkish agricultural products from free trade with the Euro-pean Union affects external trade of major agricultural products and products offirst-stage processing directly related to the products of Turkish origin (for a list,see Annex II to the Treaty establishing the Community [European Community1987]). One sector of particular importance for the Turkish economy is its fruitand vegetable processing industry, the majority of which includes first-stage pro-cessed agricultural products (Arikbay 1997).
The food manufacturing sector is of considerable importance, with a 19 per-cent share of Turkey’s total production of manufactured goods and an 11 percentshare of Turkey’s total exports. Within the food manufacturing sector, the fruit andvegetable processing industry is the second largest industry, covering almost one-half of Turkey’s total food industry exports (State Planning Organization 1998).
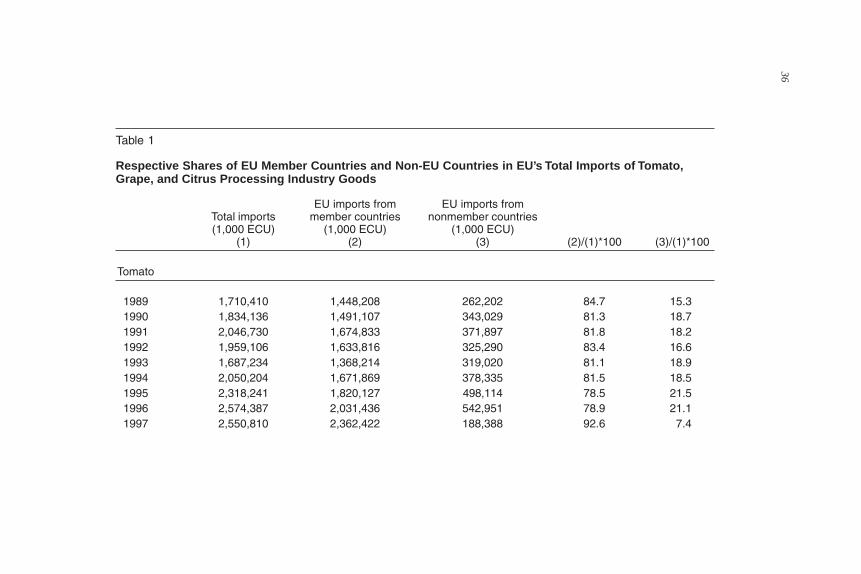
The European Union is the largest export market for the Turkish fruit and veg-etable processing industry goods. Due to health-related consumption patterns andtrend toward Mediterranean diet, the demand for fruit and vegetable processingindustry goods is expected to increase in the EU market (Arikbay 1997; EuropeanCommunity 1996). This positive trend in fresh and processed fruit and vegetableconsumption in the EU market puts Turkey in a favorable position due to its highproduction and export potential of first-stage processed fruit and vegetable prod-ucts. Alternatively, Turkey is in an unfavorable position compared to rival EU coun-tries that produce and export the same group of products because of restrictions andcustoms duties to the Turkish agricultural products in the EU market, thus nega-tively affecting the competitiveness of the Turkish fruit and vegetable processingindustry products in the EU market. Moreover, the figures in Table 1 reveal that themajority of the EU imports of goods with particularly high shares in Turkey’s totalfruit and vegetable processing industry exports (tomato, grape, and citrus fruit pro-cessing industry) are being supplied from the EU member countries, thus reflectinga movement of these goods between the member countries (Akgüngör et al. 2001).
Turkish fruit and vegetable processing industry exporters are therefore caughtbetween the appeal of the growing demand potential in the EU market and con-cerns related to competition by the EU member countries within the EU market.
36R
USSIA
N A
ND
EA
ST E
UR
OP
EA
N F
INA
NC
E A
ND
TR
AD
E
Table 1
Respective Shares of EU Member Countries and Non-EU Countries in EU’s Total Imports of Tomato,Grape, and Citrus Processing Industry Goods
EU imports from EU imports fromTotal imports member countries nonmember countries(1,000 ECU) (1,000 ECU) (1,000 ECU)
The fruit and vegetable processing and preserving sector includes all activitiesrelated to the processing of fruit and vegetables and their preservation. The mainproduct categories, according to the European Union, are tomato and other veg-etable preserves, jams and marmalades, pickled vegetables, and fruit juices andnectars (European Commission 1997). Turkey’s classification of the fruit and veg-etable processing industry covers: canned fruits and vegetables, frozen fruits andvegetables, dried vegetables, tomato paste, concentrated fruit juice, olives, driedfigs, raisins, other dried fruits, nuts and nut products, and jams and marmalade asmain product categories. Turkey’s classification of the fruit and vegetable pro-cessing industry products includes first-stage processed agricultural products, whichare subject to the European Community customs duties.
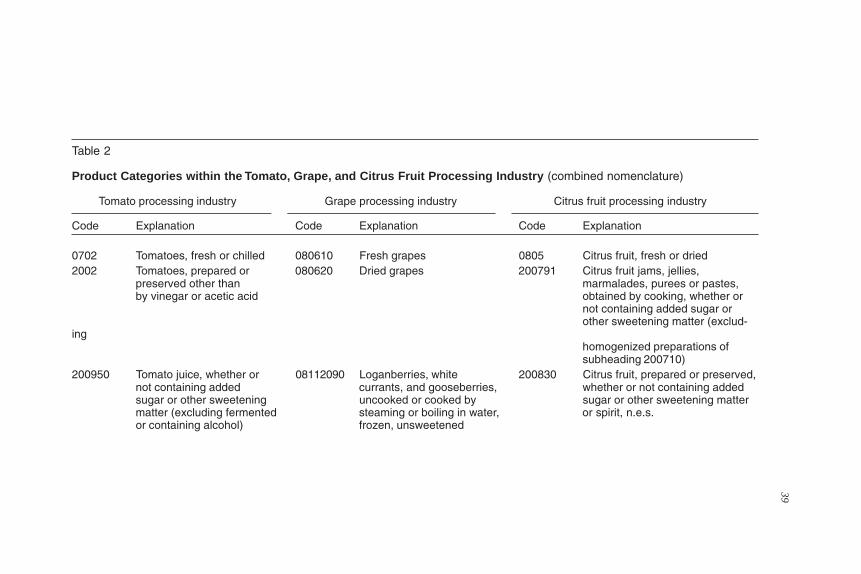
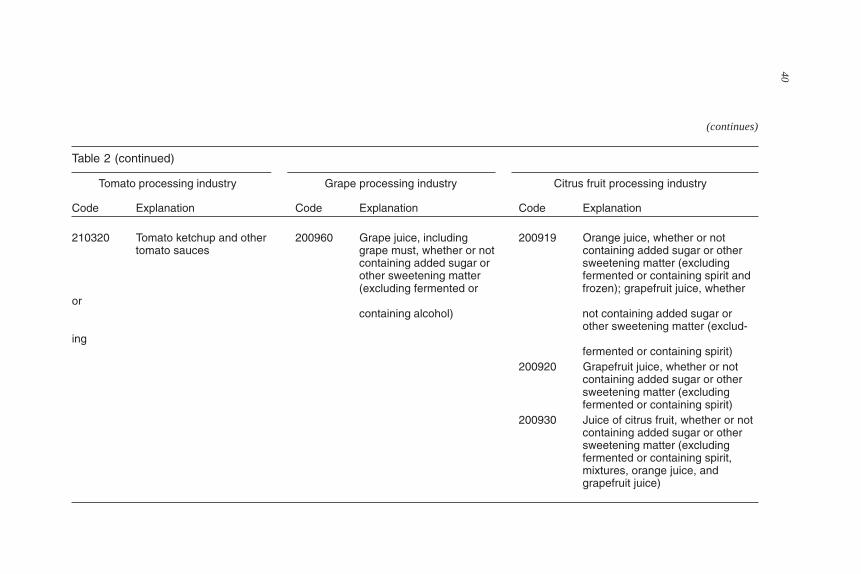
Among the above product categories, tomato, grape, and citrus fruit processingindustry products are the top three product categories with the highest shares inTurkey’s total fruit and vegetable processing industry exports (Akgüngör et al.2002). Table 2 reports the product categories within the tomato, grape, and citrusprocessing industries.
The aim of this study is to explore the competitive power of Turkey’s tomato,grape, and citrus fruit processing industry exports in the EU markets. The studyspecifically aims to fulfill the following:
Objective 1: Determine the rival EU countries that produce and export tomato,grape, and citrus fruit processing industry products to the European Union.
Objective 2: Measure the competitive power of Turkish tomato, grape, and citrusfruit processing industry products in the EU market against the rival EU membercountries.
Objective 3: Elaborate on the effect of relative prices on Turkey’s market sharein the EU market and explore whether relative prices matter in determining therelative market share of the Turkish exports and rival EU countries in the EUmarket.
Methods
Determining the Rival EU Countries (Objective 1)
We determine the rival EU countries by the export similarity index (ESI) devel-oped by Finger and Kreinin (1979). The ESI determines whether the export com-position of the rival countries or country groups becomes similar or dissimilarover time. We therefore ask the following question: To what extent does the shareof Turkey’s tomato, grape, and citrus fruit industry good exports in Turkey’s totalfruit and vegetable processing industry good exports match with those of each ofthe EU member countries?
( ) ( ) ( )( )r r i i ri
B ab c x a c x b c2
1ESI , min , , , 100,
-
È ˘= = ¥Í ˙
Î ˚Â
MA
Y–JU
NE
200239
Table 2
Product Categories within the Tomato, Grape, and Citrus Fruit Processing Industry (combined nomenclature)
Tomato processing industry Grape processing industry Citrus fruit processing industry
0702 Tomatoes, fresh or chilled 080610 Fresh grapes 0805 Citrus fruit, fresh or dried2002 Tomatoes, prepared or 080620 Dried grapes 200791 Citrus fruit jams, jellies,
preserved other than marmalades, purees or pastes,by vinegar or acetic acid obtained by cooking, whether or
not containing added sugar orother sweetening matter (exclud-
inghomogenized preparations ofsubheading 200710)
200950 Tomato juice, whether or 08112090 Loganberries, white 200830 Citrus fruit, prepared or preserved,not containing added currants, and gooseberries, whether or not containing addedsugar or other sweetening uncooked or cooked by sugar or other sweetening mattermatter (excluding fermented steaming or boiling in water, or spirit, n.e.s.or containing alcohol) frozen, unsweetened
40R
USSIA
N A
ND
EA
ST E
UR
OP
EA
N F
INA
NC
E A
ND
TR
AD
E
(continues)
Table 2 (continued)
Tomato processing industry Grape processing industry Citrus fruit processing industry
210320 Tomato ketchup and other 200960 Grape juice, including 200919 Orange juice, whether or nottomato sauces grape must, whether or not containing added sugar or other
containing added sugar or sweetening matter (excludingother sweetening matter fermented or containing spirit and(excluding fermented or frozen); grapefruit juice, whether
orcontaining alcohol) not containing added sugar or
other sweetening matter (exclud-ing
fermented or containing spirit)200920 Grapefruit juice, whether or not
containing added sugar or othersweetening matter (excludingfermented or containing spirit)
200930 Juice of citrus fruit, whether or notcontaining added sugar or othersweetening matter (excludingfermented or containing spirit,mixtures, orange juice, andgrapefruit juice)
MAY–JUNE 2002 41
where xi(a,c) = the share of good i exports in Turkey’s (market a) total fruit andvegetable industry good exports to the European Union (marketc).
xi(br,c) = the share of good i exports in country r’s (market br) total fruitand vegetable industry good exports to the European Union (mar-ket c).
r = France, Belgium, Netherlands, Germany, Italy, United Kingdom,Denmark, Greece, Portugal, Spain, Sweden, Finland, or Austria.
i = (1) aggregate value of grape, tomato, and citrus fruit processingindustry exports; (2) aggregate value of fruit and vegetable pro-cessing industry exports, excluding tomato, grape, and citrusfruit industry good exports.
ESIr = export similarity index of country r and Turkey with respect totomato, grape, and citrus fruit processing industry good exportsamong total fruit and vegetable processing industry exports.
Measuring Competitiveness (Objective 2)
Although the ESI for pairs of countries shows export patterns, it is not an index ofan indication of international competitiveness. Competitiveness is a relative con-cept and it can only be measured through comparing pairs of countries or countrygroups. There are many ways of defining competitiveness.
Most authors define competitiveness as “an advantage of firms or industriesvis-à-vis their competitors in domestic or international markets” (Cockburn et al.1998). Another definition is “to secure a relatively high return on factors of pro-duction and relatively high employment levels on a sustainable basis” (EuropeanCommission 1994). A broader definition of competitiveness is the ability to secureand profitably maintain market share (Martin et al. 1991).
Given a broad definition of the concept, it is not surprising to find out that thereis not a unique way to measure competitiveness. There are many ways to obtain anindicator of competitiveness. Among the most widely used competitiveness indi-cators are relative profits, costs, or prices (Atto 1987). Another way to demon-strate relative competitiveness is by observing revealed competitive advantagethrough export market shares of pairs of industries in a given market. FollowingHeidensohn and Hibbert’s (2000) suggestion that an analysis of revealed competi-tive advantage compared to cost or price differences offers a more valid approachfor international competitiveness, we adopt the following competitiveness indicesthat focus on relative market share (Balassa 1965).
Revealed Comparative Advantage (RCA) Index
( ) ( ) ( ){ }B B A Ai iX X X XRCA ln / / / ,=
42 RUSSIAN AND EAST EUROPEAN FINANCE AND TRADE
where XiB is Turkey’s exports of good i to the European Union; XB is Turkey’s total
exports to the European Union; XiA is the rival country’s exports of good i to the
European Union; and XA is the rival country’s total exports to the European Union.A positive value of RCA means that Turkey has a comparative advantage against
the rival EU country in the EU market.
Comparative Export Performance (CEP) Index
( ) ( ){ }B B A Ai iX X X XCEP ln / / / ,=
where XiB is country B’s exports of good i, XB is country B’s total exports, Xi
A is theworld total exports of good i, and XA is total world exports.
An index value of Turkey higher than the index value of country r indicatesrelative competitive advantage of Turkey against country r.
Determining the Effect of Relative Prices onCompetitiveness (Objective 3)
What factors determine the international competitiveness of a country over an-other country in a specific industry? There are two alternative viewpoints on thesources of international competitiveness. On one hand, competitiveness calls forhigh sensitivity of exports to costs. Relative costs matter for international com-petitiveness. On the other hand, relative costs on international trade become lessimportant due to heightened competition on quality differences and more sophis-ticated products (Carlin et al. 2001). Factors such as the ability of creating andsharing knowledge and turning knowledge into innovations became major deter-minants to create and sustain competitive advantage (Porter 1990).
Previous research on Turkey’s international competitiveness suggests that Tur-key has a competitive advantage over the rival countries, particularly in industrieswhose primary input is agriculture and that the competitiveness is due to costdifferences (Barlow and S*enses 1995; Celasun and Rodrik 1989; Kotan and Sayanforthcoming; Krueger and Aktan 1992; Tansel and Togan 1987; Uygur 1987). Theirfindings are consistent with the Ricardian theory of competition, which suggests thatthe countries will specialize in industries in which they have a comparative costadvantage. We therefore explore whether the competitiveness of Turkish tomato,grape, and citrus fruit processing industry exports are due to cost advantage.
To test the hypothesis that export prices determine the competitiveness of Tur-key against rival firms in the EU markets, we estimate the EU import demand ofprocessed tomatoes, grapes, and citrus fruits from the rival EU countries. Thedependent variable is EU imports of processed tomatoes, grapes, and citrus fruitsfrom Greece, Spain, and Portugal. The regression equation’s independent vari-ables are own price, price of imports from Turkey (as a substitute), average EU
MAY–JUNE 2002 43
disposable income, and EU population. If Turkey has a competitive power due toprice advantage, we expect that the EU exports from the rival countries will besignificantly affected by the Turkish export prices. Turkish exports will thereforebe considered as substitutes to the EU exports from the rival countries. The avail-able Eurostat data set covers annual observations during the 1976–1997 period.
Similar macroeconomic conditions may affect the EU import demand of eachof the product groups from the rival countries, implying that the disturbances ofthe import equations of the three product groups from the three rival countriesmay be correlated. We therefore estimate that three sets have seemingly unrelatedregression (SUR) equations: SUR equations of EU imports of processed tomatoes,grapes, and citrus fruits from the rival EU countries. When the residuals are corre-lated, the SUR estimator is more efficient, because it takes into account the entirecorrelation matrix of all equations.
Empirical Results
Rival EU Countries
The resulting index numbers of export similarity are presented in Table 3. ESIsreveal that the processed fruit and vegetable export composition (when “tomato,grape, and citrus products” and “the remaining processed fruit and vegetable prod-ucts in aggregate” are taken into account) of Greece, Spain, and Portugal becameincreasingly similar to the export composition of Turkey during the 1994–1997period. We therefore explore and compare the price competitiveness of Turkey’sfruit and vegetable exports with Greece, Portugal, and Spain.1
Competitiveness Indices
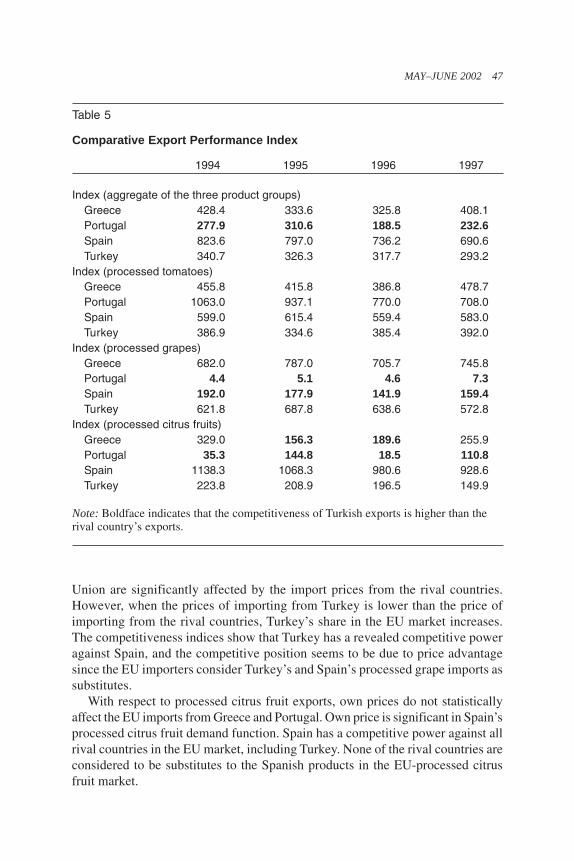
Tables 4 and 5 report the RCA and CEP indices of Turkey and the three rivalcountries, respectively. Both indices reveal that Turkey has a comparative advan-tage over Portugal when the three product groups are considered in aggregate.When the three groups of products are considered separately, we see that Turkeydoes not have a competitive advantage for processed tomato exports over the rivalcountries. For the grape processing industry exports, Turkey has a competitivepower over Portugal and Spain. For the processed citrus products industry, Turkeyhas competitive power over Portugal and Greece.
Effect of Relative Prices on Competitiveness
The time series models offer a framework for predicting the values of a particularvariable by observing its past values. Once a stochastic model for the error term isdetermined and a time series model for the dependent variable is specified, onecan estimate the coefficients of the model.
44R
USSIA
N A
ND
EA
ST E
UR
OP
EA
N F
INA
NC
E A
ND
TR
AD
E
Table 3
Similarity Index for Tomato, Grape, and Citrus Fruit Processing Industry Exports of Turkey and the EU Member Countries (importingcountry—European Union)
Percentchangein ESI
1994 1995 1996 1997 during the1994–1997
T+G+C* Other** ESI T+G+C Other ESI T+G+C Other ESI T+G+C Other ESI period
Notes: * Minimum value of the share of country r’s and Turkey’s total value of tomato (T), grape (G), and citrus fruit (C) processing industrygoods in country r’s and Turkey’s total fruit and vegetable exports to the European Union. ** Minimum value of the share of country r’s andTurkey’s total value of fruit and vegetable processing exports excluding tomato, grape, and citrus fruit products in country r’s and Turkey’stotal fruit and vegetable exports to the European Union.
Note: Boldface indicates that the competitiveness of Turkish exports is higher than therival country’s exports.
Inspection of autocorrelations and partial autocorrelations of the logarithms ofthe dependent variable of the equation reveal that all dependent variables can bespecified by a first-order autoregressive process (AR(1)). We then add the otherindependent variables to the model with an AR(1) error structure and estimate theEU import demand function of processed grapes, tomatoes, and citrus fruit pro-cessing industry exports from Turkey’s competitors.
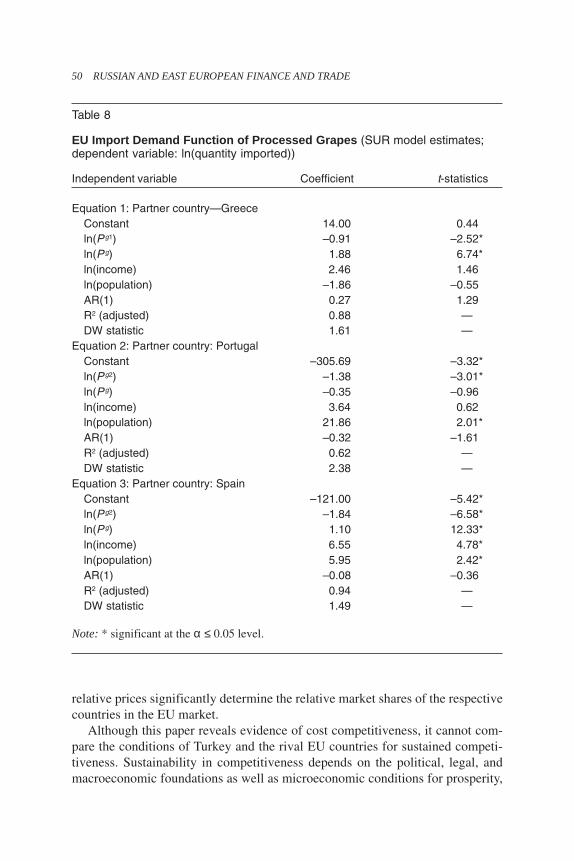
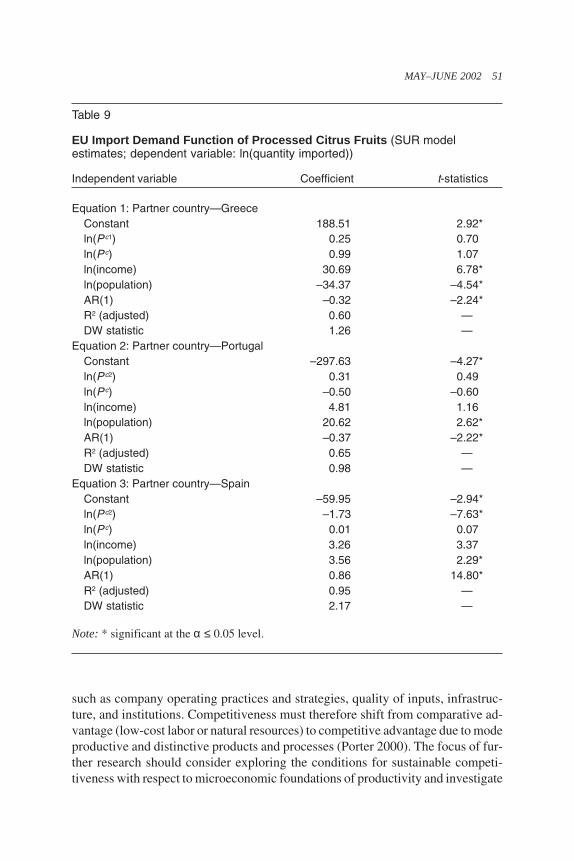
The variables used in the econometric model are defined in Table 6. The regres-sion results are reported in Tables 7, 8, and 9. The models reveal that the EU-processed tomato import prices significantly affect the EU-processed tomato importsfrom Greece, Portugal, and Spain. Unlike the other two rivals, the EU tomatoimports from Greece depend on Turkey’s export prices of processed tomatoes aswell. This result implies that Turkish-processed tomato exports are substitutes forthe EU-processed tomato imports from Greece. Competitiveness of Greece andTurkey’s processed tomato exports to the EU market significantly depends onrelative prices.
With respect to processed grapes, Turkish imports are substitutes for the EUimports from Greece and Spain. The processed grape imports of the European
MAY–JUNE 2002 47
Union are significantly affected by the import prices from the rival countries.However, when the prices of importing from Turkey is lower than the price ofimporting from the rival countries, Turkey’s share in the EU market increases.The competitiveness indices show that Turkey has a revealed competitive poweragainst Spain, and the competitive position seems to be due to price advantagesince the EU importers consider Turkey’s and Spain’s processed grape imports assubstitutes.
With respect to processed citrus fruit exports, own prices do not statisticallyaffect the EU imports from Greece and Portugal. Own price is significant in Spain’sprocessed citrus fruit demand function. Spain has a competitive power against allrival countries in the EU market, including Turkey. None of the rival countries areconsidered to be substitutes to the Spanish products in the EU-processed citrusfruit market.
Table 5
Comparative Export Performance Index
1994 1995 1996 1997
Index (aggregate of the three product groups)Greece 428.4 333.6 325.8 408.1Portugal 277.9 310.6 188.5 232.6Spain 823.6 797.0 736.2 690.6Turkey 340.7 326.3 317.7 293.2
Note: Boldface indicates that the competitiveness of Turkish exports is higher than therival country’s exports.
48 RUSSIAN AND EAST EUROPEAN FINANCE AND TRADE
Conclusion
This paper investigated the competitive power of the Turkish fruit and vegetableexports in the EU markets. The findings suggest that in the context of the threeproduct groups with highest shares in Turkey’s total processed fruit and vegetableexports (processed tomatoes, grapes, and citrus fruits), Turkey has a competitivepower in processed grape and citrus fruit exports, whereas there is no indication ofcompetitiveness for processed tomato exports.
With the exception of processed citrus fruit exports, the EU imports of pro-cessed grapes and tomatoes are significantly affected by the EU import prices forproducts of Turkish origin. It is therefore possible to conclude that relative exportprices matter in determining Turkey’s competitiveness in the EU-processed to-mato and grape market.
Table 6
Variables Used in the Econometric Model
Variable What the variable measures Average value
Income EU gross national product in 1990 prices 4,933.4(1 billion euro)
P t EU average price of processed tomatoes 0.648imported from Turkey (import value/quantityimported) (ECU)
Pg EU average price of processed grapes 0.943imported from Turkey (import value/quantityimported) (ECU)
Pc EU average price of processed citrus fruits 0.508imported from Turkey (import value/quantityimported) (ECU)
Pt1,Pg1,Pc1 EU average price of processed tomatoes, 0.678processed grapes and processed citrus fruits 0.773imported from Greece (import value/quantity 0.574imported) (ECU)
Pt2,Pg2,Pc2 EU average price of processed tomatoes, 0.832processed grapes and processed citrus fruits 0.978imported from Portugal (import value/quantity 0.552imported) (ECU)
Pt3,Pg3,Pc3 EU average price of processed tomatoes, 0.629processed grapes and processed citrus fruits 0.684imported from Spain (import value/quantity 0.489imported) (ECU)
Population EU population (1,000) 350,216.1
MAY–JUNE 2002 49
Implications for Further Research
The paper focuses on examining Turkey’s competitive power of processed toma-toes, grapes, and citrus fruits with respect to relative market share against the rivalEU countries in the EU market. The reported evidence in the paper implies that
Table 7
EU Import Demand Function of Processed Tomatoes (SUR model estimates;dependent variable: ln(quantity imported by the EU from the partner country))
Notes: * significant at the α ≤ 0.05 level. The significance of the price variables is froma one-tailed test.
50 RUSSIAN AND EAST EUROPEAN FINANCE AND TRADE
relative prices significantly determine the relative market shares of the respectivecountries in the EU market.
Although this paper reveals evidence of cost competitiveness, it cannot com-pare the conditions of Turkey and the rival EU countries for sustained competi-tiveness. Sustainability in competitiveness depends on the political, legal, andmacroeconomic foundations as well as microeconomic conditions for prosperity,
Table 8
EU Import Demand Function of Processed Grapes (SUR model estimates;dependent variable: ln(quantity imported))
such as company operating practices and strategies, quality of inputs, infrastruc-ture, and institutions. Competitiveness must therefore shift from comparative ad-vantage (low-cost labor or natural resources) to competitive advantage due to modeproductive and distinctive products and processes (Porter 2000). The focus of fur-ther research should consider exploring the conditions for sustainable competi-tiveness with respect to microeconomic foundations of productivity and investigate
Table 9
EU Import Demand Function of Processed Citrus Fruits (SUR modelestimates; dependent variable: ln(quantity imported))
the sophistication of the environment within which the firms in respective coun-tries compete.
Note
1. The percentage increase in the ESI suggests that Sweden should also be among therival EU member countries for the tomato, grape, and citrus fruit processing industry goods.However, a close examination of the exports of subgroups of products reveal that Swedenis a major exporter of the product code 08112090 (see Table 2), while having a relativelylow share in other product subgroups. Since Sweden does not compete in the same sub-groups of products, it is not considered to be a rival country and therefore is excluded fromthe analysis.
References
Akgüngör, S.; H.C. Akdag¬; and A. Tuncay. 2002. “Innovative Culture and Total QualityManagement: A Case Study of Turkish Fruit and Vegetable Processing Industry Smalland Medium Scale Enterprises.” In The First Annual SMS Conference Proceedings, ed.M. Tümer. Magosa: Eastern Mediterranean University.
Akgüngör, S.; R. Funda Barbaros; and N. Kumral. 2001. “Türkiye’de Meyve ve SebzeIsleme Sanayinin Avrupa Birligi Piyasasinda Sürdürülebilir Rekabet Gücü AçisindanDegerlendirilmesi” [Sustainable Competitiveness of the Turkish Fruit and VegetableIndustry in the European Union Market]. Project Report 2001-3, Agricultural Econom-ics Research Institute, Ankara.
Arikbay, C. 1997. “Gümrük Birligi Kosullarinda Türkiye Gida Sanayi: Gelismeler veBeklentiler” [Turkish Fruit Industry within the Customs Union: Developments and Pros-pects]. In Gümrük Birlig¬i ve Rekabet Açisindan Géda Sanayi [Proceedings of the FoodIndustry in the Context of Customs Union Seminar]. Øzmir: National Productivity Cen-ter and Aegean Union of Exporters.
Atto, E.W. 1987. “Relative Total Costs—An Approach to Competitiveness Measurementof Industries.” Management International Review 27, no. 1: 47–58.
Balassa, B. 1965. “Trade Liberalization and Revealed Comparative Advantage.” Manches-ter School of Economics and Social Studies 33, no. 1: 99–123.
Barlow, R., and F. Senses. 1995. “The Turkish Export Boom: Just Reward or Lucky?”Journal of Development Economics 48: 111–133.
Carlin, W.; A. Glyn; and J. van Reenen. 2001. “Export Market Performance of OECDCountries: An Empirical Examination of the Role of Cost Competitiveness.” The Eco-nomic Journal 111, January: 128–162.
Celasun, M., and D. Rodrik. 1989. “Debt, Adjustment and Growth: Turkey.” In DevelopingCountry Debt and Economic Performance, vol. 3, ed. J.D. Sachs and S.M. Collins, pp.615–808. Chicago: University of Chicago Press.
Cockburn, J.; E. Siggel; M. Coulibaly; and S. Vezina. 1998. “Measuring Competitivenessand Its Sources: The Case of Mali’s Manufacturing Sector.” African Economic PolicyPaper Discussion Paper No. 16, United States Agency for International Development,Bureau of Africa, Washington, DC.
European Commission. 1994. “An Industrial Competitiveness Policy for the EuropeanUnion.” Bulletin of the European Union, Luxemburg: Office for Official Publicationsof the European Union.
MAY–JUNE 2002 53
———. 1997. Panorama of the European Industry, 1996. Luxemburg: Office for OfficialPublications of the European Union.
European Community. 1987. “Treaty Establishing the European Community as Amendedby Subsequent Treaties, Rome, 25 March, 1957.” In Treaties Establishing the EuropeanCommunities, 3d ed. Luxembourg: Office for Official Publications of the EuropeanCommunities.
———. 1996. Panorama of European Business 1996. Luxembourg: Office for OfficialPublications of the European Communities.
Finger, J.M., and M.E. Kreinin. 1979. “A Measure of Export Similarity and Its PossibleUses.” The Economic Journal 89, December: 905–912.
Heidensohn, K., and E.P. Hibbert. 2000. “A Sectoral Analysis of Europe’s Competitive-ness.” Competitiveness Review 7, no. 2: 25–37.
Kotan, Z., and S. Sayan. Forthcoming. “A Comparative Investigation of Price Competitive-ness of Turkish and South East Asian Exports in the European Market: 1990–1997.”Forthcoming in Russian and East European Finance and Trade.
Krueger, A.O., and O.H. Aktan. 1992. Swimming Against the Tide: Turkish Trade Reform inthe 1980s. San Francisco: International Center for Economic Growth.
Martin, L.; R. Westgren; and E. van Duren. 1991. “Agribusiness Competitiveness AcrossNational Boundaries.” American Journal of Agricultural Economics 73, no. 5,1456–1464.
Porter, M. 1990. The Competitive Advantage of Nations. New York: Free Press.———. 2000. “The Current Competitiveness Index: Measuring the Microeconomic Foun-
dations of Prosperity.” In The Global Competitiveness Report 2000, ed. M. Porter, J.D.Sachs, and A.M. Warber, pp. 41–58. New York: Oxford University Press.
State Planning Organization. 1998. 1999 Yélé Programé Destek Çalis*malaré [Report on theSupporting Work for the 1999 Annual Program]. State Planning Organization, Ankara.
Tansel, A., and S. Togan. 1987. “Price and Income Effects of Turkish Foreign Trade.”Weltwirtschaftliches Archiv September: 521–534.
Uygur, E. 1987. “SESRTCIC Ecometric Model of the Turkish Economy.” Statistical, Eco-nomic and Social Research and Training Centre for Islamic Countries, Ankara.