06,,FH/RDGV’DWDCompilation of Medium Scale Ice Indentation Test Results and Comparison to ASPPR by Claude Daley, Daley R&E, 30 Kenmare Pl., Nepean, Ontario, K2J-3L9 March 1994 Submitted to National Research Council Canada
Transcript
06,�,FH�/RDGV�'DWD�
Compilation of Medium Scale Ice Indentation Test Results and Comparison to ASPPR
by
Claude Daley,
Daley R&E,
30 Kenmare Pl.,
Nepean, Ontario,
K2J-3L9
March 1994
Submitted to
National Research Council Canada
ii
Daley R&E
ABSTRACT
The Medium Scale Indentor (MSI) Tests refer to a unique series of ice load experiments that have been conducted in the Canadian Arctic. The work began in 1984 when a group of oil companies conducted iceberg indentation tests at Pond Inlet. In 1989 and 1990, under the direction of the Canadian Coast Guard and the National Research Council, the apparatus was re-configured to investigate loads on ship panels. Medium scale indentor tests (MSI) were conducted at Hobson’s Choice Ice Island. Various spherical, flat and wedge shaped indentors were employed in a large trench cut into the multi-year ice if the ice island. During this period attention was being focused on the mechanics of ice failure and on the flaking process in particular. In 1993, a series of flaking tests were conducted near Resolute, with the use of flat-jacks, Hobson’s Choice having disintegrated in the interim. The report presents the main data of the MSI tests in summary form. The MSI data, along with shipboard measurements are compared to the Canadian Arctic Shipping Pollution Prevention Regulations (ASPPR) ice loads. In general the MSI tests provide support for the levels of the design pressures in the ASPPR rules. The MSI tests have also provided much new scientific information. The tests have shown that ice flaking and ice extrusion are very important to the development of ice force. The work has opened new scientific questions, particularly concerning the interplay between extrusion and flaking processes.
ACKNOWLEDGMENTS
Dr. Robert Frederking is thanked for his support and useful discussions during the project. Mr. Victor Santos-Pedro is thanked for his comments on the report. The data was compiled and provided by Sandwell Inc. The funding for the project was provided by the National Research Council, the Canadian Coast Guard Northern and the Panel on Research and Development (PERD).
iii
Daley R&E
TABLE OF CONTENTS ABSTRACT ii ACKNOWLEDGMENTS ii LIST OF FIGURES iv
1.0 INTRODUCTION 1
2.0 DESCRIPTION OF ICE LOAD DATA 2
2.1 Overview of MSI Data 2
2.2 Overview of Ship Data 9
3.0 DESCRIPTION OF ASPPR 13
3.1 Design Plate Pressure 13
3.2 Design Pressures for Framing 15
3.3 Sensitivity to Vessel Size 17
4.0 PRESSURE-AREA ANALYSIS 19
4.1 Direct Contact Shape 19
4.2 Extrusion Processes 28
4.3 Influence of Geometry 31
5.0 COMPARISON WITH ASPPR 33
5.1 ASPPR-MSI Tests Pressure-Area Comparison 33
5.2 ASPPR- Ship Tests Pressure-Area Comparison 36
6.0 DISCUSSION 39
6.1 General Results 39
6.2 Pressure-Area Effects and Ship Size 39
6.3 Recommendations 40
7.0 CONCLUSION 41
8.0 REFERENCES 42
iv
Daley R&E
LIST OF FIGURES
Figure 1. Key Map for All Tests. 2 Figure 2. Sketch of Test Arrangement at Pond Inlet 3 Figure 3. Pressure-Area Data from 3 m2 Pond Inlet Indentor Tests 4 Figure 4. Sketch of Hobson’s Choice Ice Tests 5 Figure 5. Pressure-Area Data from Hobson’s Choice ‘89 Wedge Indentor Tests 5 Figure 6. Sketch of Hobson's Choice Ice Faces in 1990. 6 Figure 7. Pressure-Area data for Hobsons’s Choice ‘90 Tests. 7 Figure 8. Flatjack Test Arrangement 8 Figure 9. Pressure-Area Data from Resolute Flatjack Tests 8 Figure 10. Sketch of CANMAR KIGORIAK. 9 Figure 11. Pressure-Area Data from Resolute 1981 KIGORIAK Tests 10 Figure 12. Sketch of M.V. ARCTIC 10 Figure 13. Pressure-Area Data from 1984 M.V. ARCTIC Ramming Tests 11 Figure 14. Sketch of USCGC POLAR SEA 11 Figure 15. Pressure-Area Data from 1983 POLAR SEA Tests 12 Figure 16. ASPPR Pressure-Area Relationship for CAC1 longitudinally framed bow. 14 Figure 17. ASPPR Pressure-Area Relationship for CAC1 transversely framed bow. 14 Figure 18. ASPPR Frame Load Shape and Sub-areas. 15 Figure 19. ASPPR Framing and Plating Pressure-area Plots. 16 Figure 20. Pressure-Area Plot for Three Ship Sizes. Plate and Frame P-A Plots are Shown. 17 Figure 21. Pressure versus Displacement for Plating at 0.16 m2 and Framing at 1 m2. 18 Figure 22. Direct Contact Geometry in Hobson’s Choice '90 Test TFR04 20 Figure 23. Direct Contact Geometry in Hobson’s Choice '90 Test TFR02 21 Figure 24. Definition Aspect Ratio in Level Ice (after Sandwell, 1992) 22 Figure 25. Comparison of Aspect Ratios in Level and Pyramidal Ice 23 Figure 26. Idealized Pattern of Direct Contact 24 Figure 27. Pressure versus Aspect Ratio for a Unit Line Load in Direct Contact (Eqn.10) 25 Figure 28. Pressure versus Aspect Ratio for Equation (12) 26 Figure 29. Pressure-Area based on Equation (14) 27 Figure 30. The Evolution of Pressure vs. Area for MSI Test TFR02 28 Figure 31. Extrusion with Local and Global Flaking 29 Figure 32. View of Contact Shape with PVDF pressures superimposed. 30 Figure 33. Pressure vs. Area for Three types of Indentors 31 Figure 34. Pressure vs. Area for two Wedge Indentor Tests 32 Figure 35. Pond Inlet Tests compared to ASPPR for 10 kT CAC1. 33 Figure 36. Hobson's Choice '89 Spherical Indentor Tests Compared with ASPPR 10 kT CAC1. 34 Figure 37. Hobson's Choice '89 Wedge Indentor Tests Compared with ASPPR 10 kT CAC1 35 Figure 38. Hobson's Choice '90 All 3 Ram Tests Compared with ASPPR 10 kT CAC1 35 Figure 39. Resolute Flatjack Tests Compared with ASPPR 10 kT CAC1 35 Figure 40. KIGORIAK Data Compared with ASPPR 6.8 kT CAC1 36 Figure 41. POLAR SEA Data Compared with ASPPR 13 kT CAC1 37 Figure 42. MV ARCTIC Data Compared with ASPPR 40 kT CAC1 37 Figure 43. Comparison of ASPPR Pressures with all Measured Data. 38
1
Daley R&E
1.0 INTRODUCTION
The Medium Scale Indentor (MSI) Tests refer to a unique series of ice load experiments that have been conducted in the Canadian Arctic. The work began in 1984 when a group of oil companies conducted iceberg indentation tests at Pond Inlet. The tests were conducted with the use of a large spherical indentor driven by 4 hydraulic actuators, each with a 4 MN capacity.
The development of the ASPPR shipping regulations in the late 1980’s produced a need for corroborating ice load data. In 1989 and 1990, under the direction of the Canadian Coast Guard and the National Research Council, the apparatus was re-configured to investigate loads on ship panels. Medium scale indentor tests (MSI) were conducted at Hobson’s Choice Ice Island. Various spherical, flat and wedge shaped indentors were employed in a large trench cut into the multi-year ice if the ice island. During this period attention was being focused on the mechanics of ice failure and on the flaking process in particular. In 1993, a series of flaking tests were conducted near Resolute, with the use of flat-jacks, Hobson’s Choice have disintegrated in the interim.
The aim of the present effort is the bring together all the above data, and examine their impact on and significance to the ASPPR shipping regulations. This report presents the main data of the MSI tests in summary form. The references list the several source documents that contain all the original data and photographs. In general the MSI tests have provided support for the levels of the design pressures in the ASPPR rules.
The MSI tests have also provided much new scientific information. The tests have shown that ice flaking and ice extrusion are very important to the development of ice force. The work has opened new scientific questions, particularly concerning the interplay between extrusion and flaking processes.
2
Daley R&E
2.0 DESCRIPTION OF ICE LOAD DATA
The following pages will summarize seven sets of ice load data. Four of the projects are field indentor experiments which used large actuators and flatjacks to load prepared ice faces at various sites in the Canadian Arctic. The second group of three projects are shipboard ice load measurements, in which local and global loads were obtained from strain gauges during ship trials in multi-year ice. Figure 1 shows the locations at which the seven data sets were collected.
)LJXUH����.H\�0DS�IRU�$OO�7HVWV��
2.1 Overview of MSI Data
The Medium Scale Indentor (MSI) projects began with the construction of a large indentor apparatus for ice indentation tests in iceberg ice in 1984. The tests were funded by a group of oil companies (Mobil, Chevron, Gulf and Petro-Canada) and conducted by Geotech Inc. of Calgary. The hydraulic indentor was very large, consisting of 4 hydraulic rams, each capable of pushing with 4 MN. After the tests at Pond Inlet further tests in multi-year ice were conducted at Rea Point (this data confidential until 1995). The experimental apparatus was subsequently donated to Memorial University in Newfoundland. In 1989 and 1990 the equipment was refurbished by Sandwell (former Geotech personnel) and used to conduct tests in thick multi-year ice at Hobson’s Choice
3
Daley R&E
Ice Island. The last project (to date) in this group of projects was the flatjack flaking tests conducted in first year ice at Resolute in the spring of 1993 (Hobson’s Choice having broken up). A concise description of each project, together with summarized data is given below.
2.1.1 Pond Inlet 1984
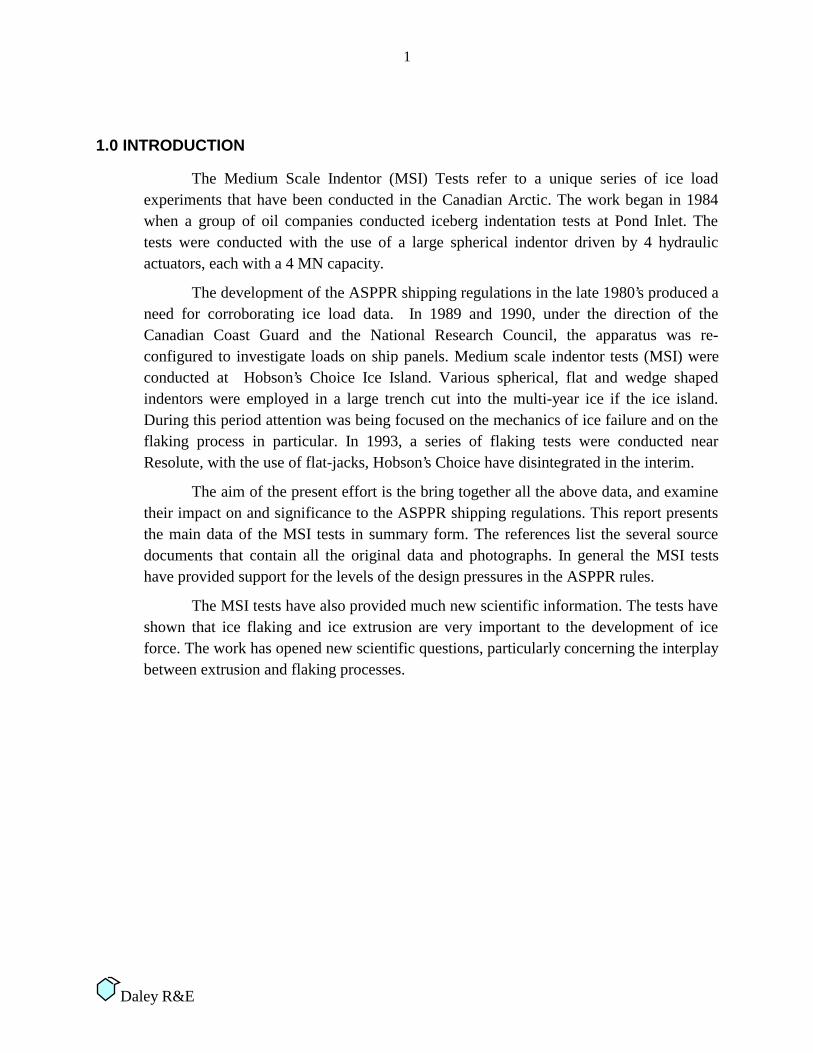
The tests at Pond Inlet were the first in the series of medium scale indentor tests. The project was conducted by Geotech Inc. of Calgary on behalf of Mobil Oil Canada Limited and a group of oil companies. A large spherical indentor, driven by four large hydraulic cylinders, was forced into a prepared ice face. The ice face was in a lateral tunnel excavated into the side of a grounded iceberg, near the settlement of Pond Inlet on the northern coast of Baffin Island, NWT. Figure 2 shows a sketch of the test arrangement at Pond Inlet.
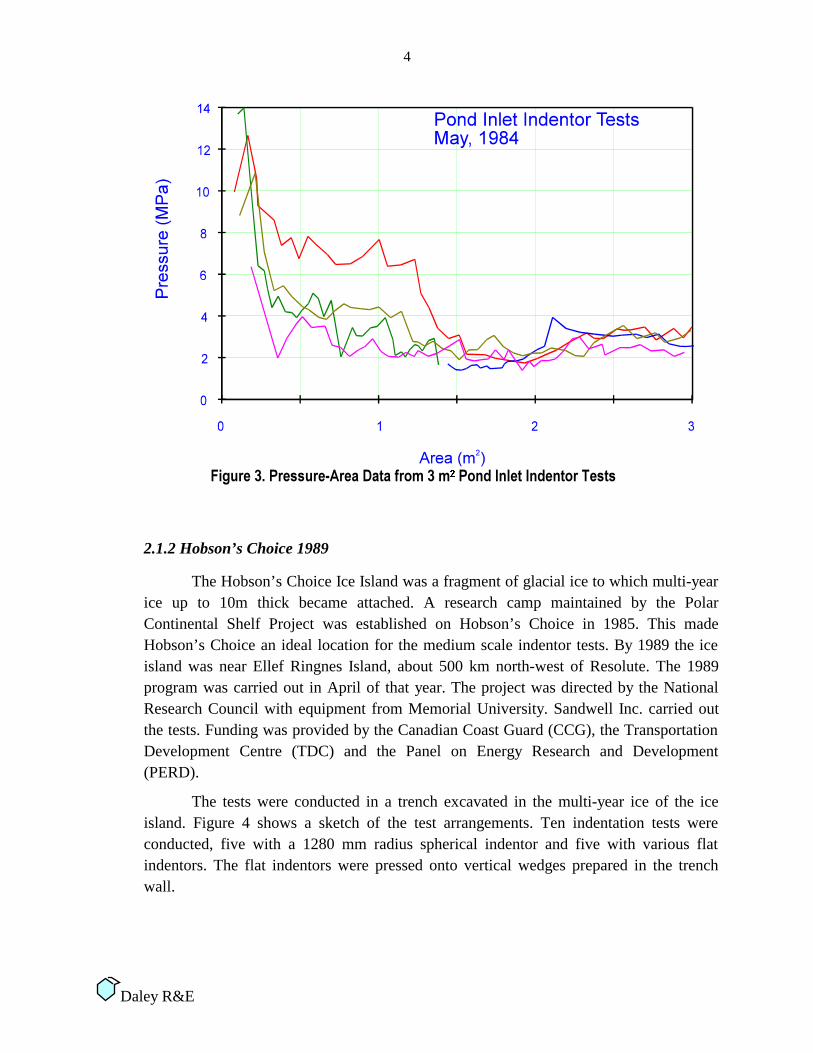
The Hobson’s Choice Ice Island was a fragment of glacial ice to which multi-year ice up to 10m thick became attached. A research camp maintained by the Polar Continental Shelf Project was established on Hobson’s Choice in 1985. This made Hobson’s Choice an ideal location for the medium scale indentor tests. By 1989 the ice island was near Ellef Ringnes Island, about 500 km north-west of Resolute. The 1989 program was carried out in April of that year. The project was directed by the National Research Council with equipment from Memorial University. Sandwell Inc. carried out the tests. Funding was provided by the Canadian Coast Guard (CCG), the Transportation Development Centre (TDC) and the Panel on Energy Research and Development (PERD).
The tests were conducted in a trench excavated in the multi-year ice of the ice island. Figure 4 shows a sketch of the test arrangements. Ten indentation tests were conducted, five with a 1280 mm radius spherical indentor and five with various flat indentors. The flat indentors were pressed onto vertical wedges prepared in the trench wall.
5
Daley R&E
)LJXUH����6NHWFK�RI�+REVRQV�&KRLFH�,FH�7HVWV�
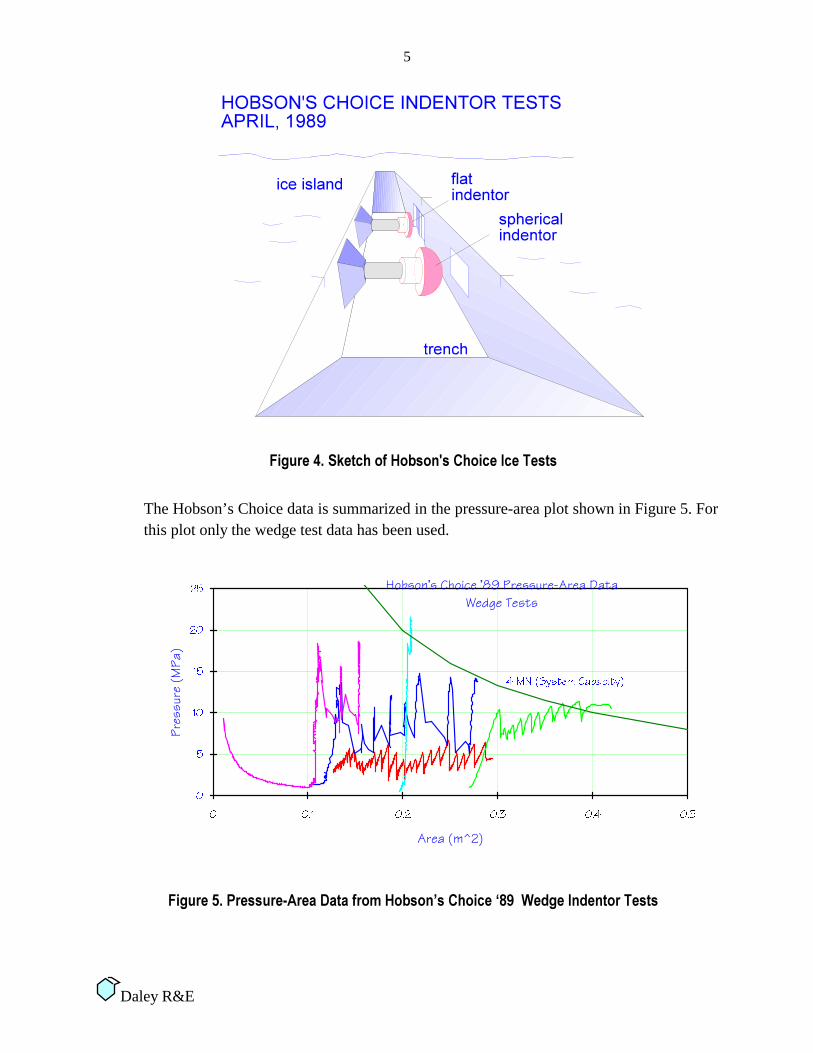
The Hobson’s Choice data is summarized in the pressure-area plot shown in Figure 5. For this plot only the wedge test data has been used.
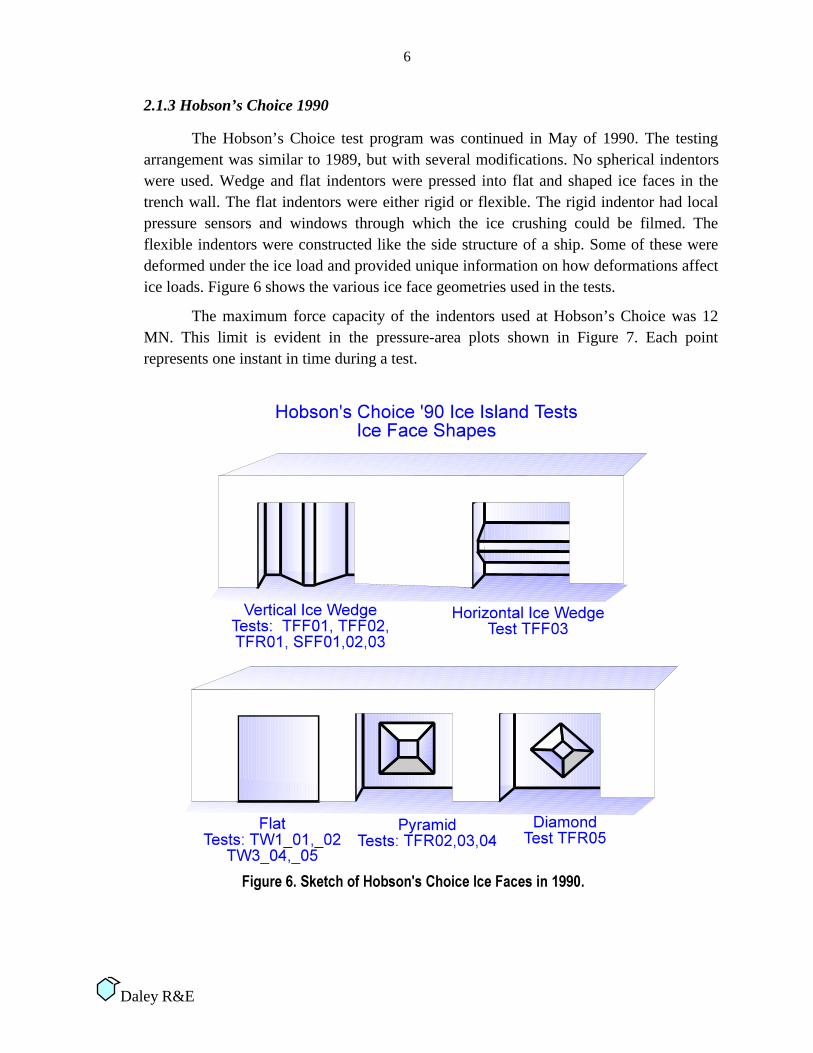
The Hobson’s Choice test program was continued in May of 1990. The testing arrangement was similar to 1989, but with several modifications. No spherical indentors were used. Wedge and flat indentors were pressed into flat and shaped ice faces in the trench wall. The flat indentors were either rigid or flexible. The rigid indentor had local pressure sensors and windows through which the ice crushing could be filmed. The flexible indentors were constructed like the side structure of a ship. Some of these were deformed under the ice load and provided unique information on how deformations affect ice loads. Figure 6 shows the various ice face geometries used in the tests.
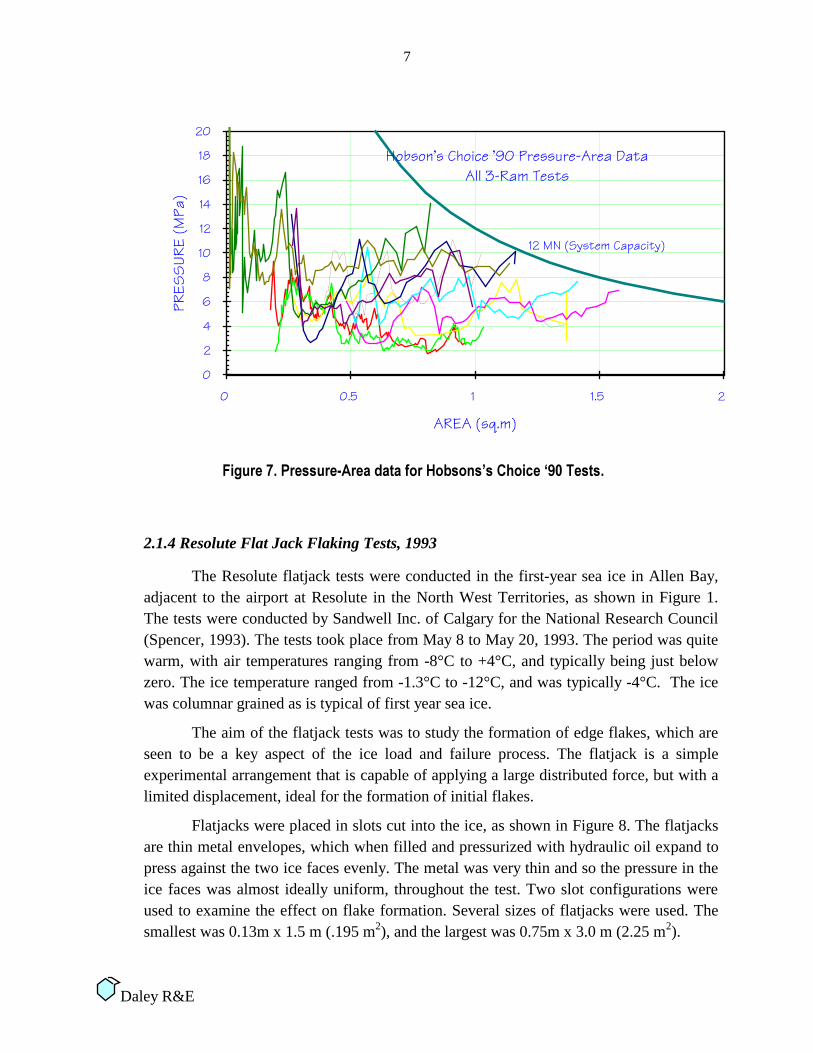
The maximum force capacity of the indentors used at Hobson’s Choice was 12 MN. This limit is evident in the pressure-area plots shown in Figure 7. Each point represents one instant in time during a test.
The Resolute flatjack tests were conducted in the first-year sea ice in Allen Bay, adjacent to the airport at Resolute in the North West Territories, as shown in Figure 1. The tests were conducted by Sandwell Inc. of Calgary for the National Research Council (Spencer, 1993). The tests took place from May 8 to May 20, 1993. The period was quite warm, with air temperatures ranging from -8°C to +4°C, and typically being just below zero. The ice temperature ranged from -1.3°C to -12°C, and was typically -4°C. The ice was columnar grained as is typical of first year sea ice.
The aim of the flatjack tests was to study the formation of edge flakes, which are seen to be a key aspect of the ice load and failure process. The flatjack is a simple experimental arrangement that is capable of applying a large distributed force, but with a limited displacement, ideal for the formation of initial flakes.
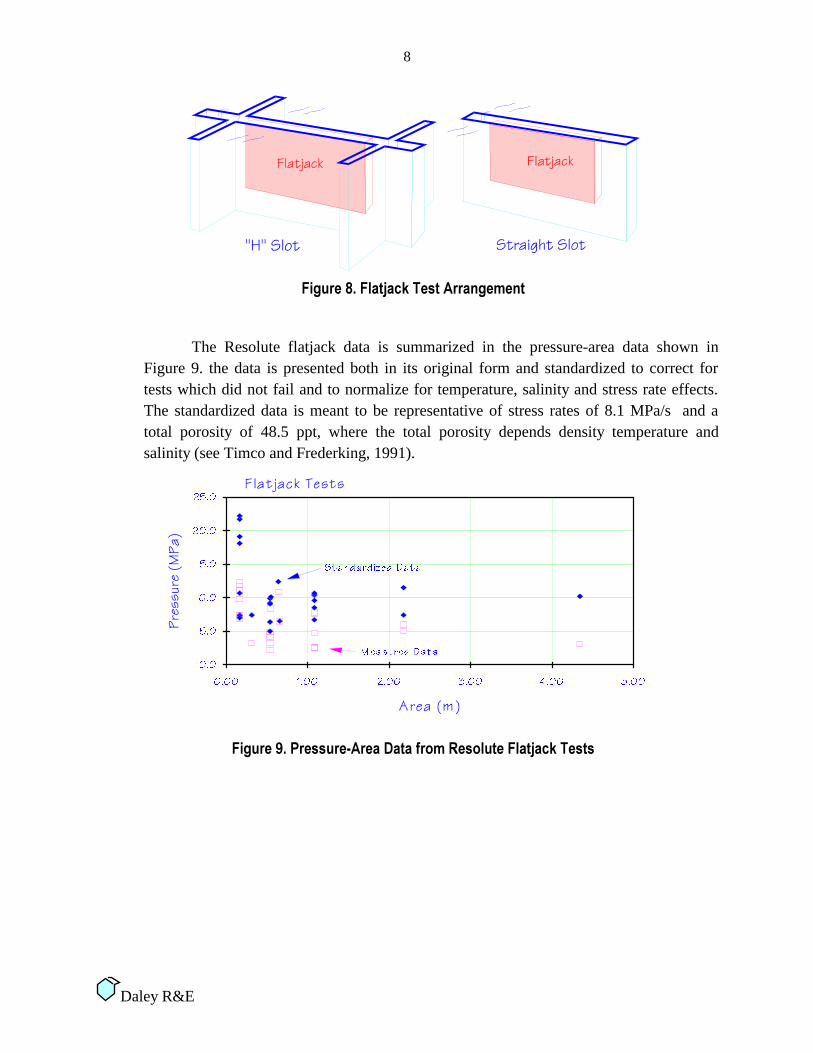
Flatjacks were placed in slots cut into the ice, as shown in Figure 8. The flatjacks are thin metal envelopes, which when filled and pressurized with hydraulic oil expand to press against the two ice faces evenly. The metal was very thin and so the pressure in the ice faces was almost ideally uniform, throughout the test. Two slot configurations were used to examine the effect on flake formation. Several sizes of flatjacks were used. The smallest was 0.13m x 1.5 m (.195 m2), and the largest was 0.75m x 3.0 m (2.25 m2).
8
Daley R&E
�
)LJXUH����)ODWMDFN�7HVW�$UUDQJHPHQW�
The Resolute flatjack data is summarized in the pressure-area data shown in Figure 9. the data is presented both in its original form and standardized to correct for tests which did not fail and to normalize for temperature, salinity and stress rate effects. The standardized data is meant to be representative of stress rates of 8.1 MPa/s and a total porosity of 48.5 ppt, where the total porosity depends density temperature and salinity (see Timco and Frederking, 1991).
There have been three ship trials which have produced extensive multi-year ice pressure data. The KIGORIAK is an combined offshore supply ship and icebreaker operated by Canadian Marine Drilling Co. (CANMAR) in the Beaufort Sea. The ARCTIC is an OBO (oil-bulk) operated by Canarctic Shipping Co. Her ice operations are normally in the Baffin Bay / Parry Channel area. The Polar Sea is one of two sister ships which are the largest of the U.S. Coast Guard icebreaker fleet. She normally operates in Alaskan and Antarctic waters. All three vessels have been the subject of extensive ice load measurement programs.
2.2.1 Kigoriak Data
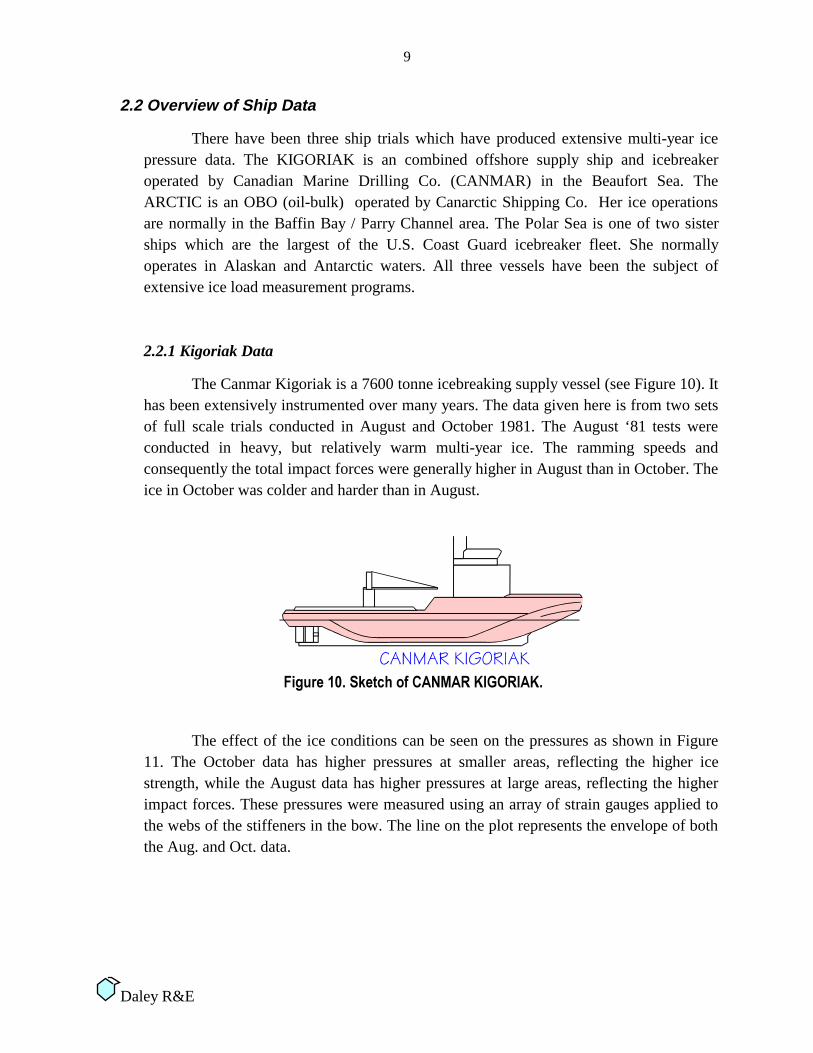
The Canmar Kigoriak is a 7600 tonne icebreaking supply vessel (see Figure 10). It has been extensively instrumented over many years. The data given here is from two sets of full scale trials conducted in August and October 1981. The August ‘81 tests were conducted in heavy, but relatively warm multi-year ice. The ramming speeds and consequently the total impact forces were generally higher in August than in October. The ice in October was colder and harder than in August.
)LJXUH�����6NHWFK�RI�&$10$5�.,*25,$.��
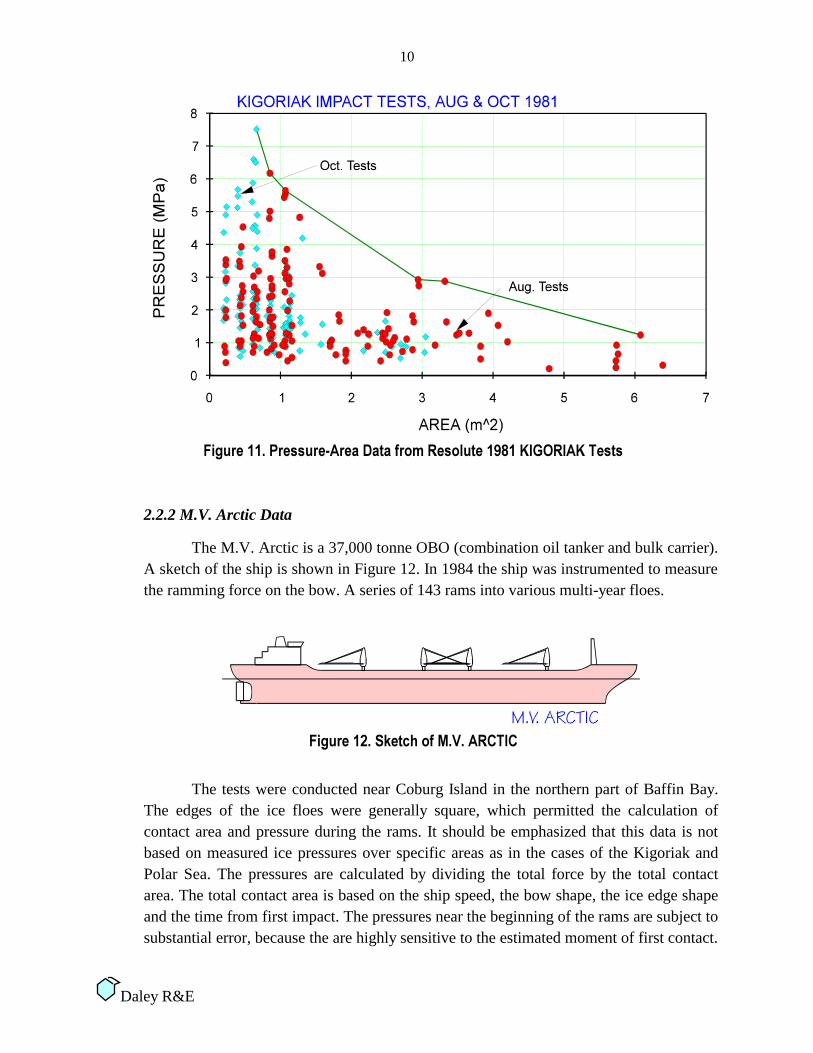
The effect of the ice conditions can be seen on the pressures as shown in Figure 11. The October data has higher pressures at smaller areas, reflecting the higher ice strength, while the August data has higher pressures at large areas, reflecting the higher impact forces. These pressures were measured using an array of strain gauges applied to the webs of the stiffeners in the bow. The line on the plot represents the envelope of both the Aug. and Oct. data.
The M.V. Arctic is a 37,000 tonne OBO (combination oil tanker and bulk carrier). A sketch of the ship is shown in Figure 12. In 1984 the ship was instrumented to measure the ramming force on the bow. A series of 143 rams into various multi-year floes.
)LJXUH�����6NHWFK�RI�0�9��$5&7,&�
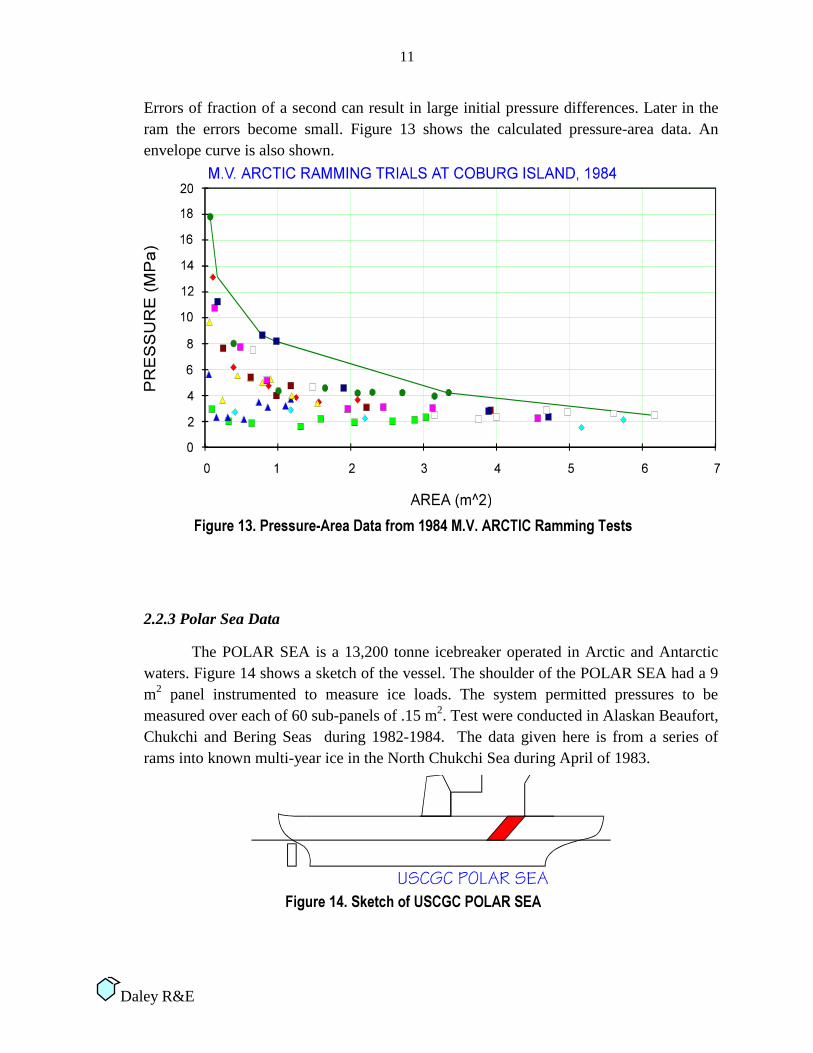
The tests were conducted near Coburg Island in the northern part of Baffin Bay. The edges of the ice floes were generally square, which permitted the calculation of contact area and pressure during the rams. It should be emphasized that this data is not based on measured ice pressures over specific areas as in the cases of the Kigoriak and Polar Sea. The pressures are calculated by dividing the total force by the total contact area. The total contact area is based on the ship speed, the bow shape, the ice edge shape and the time from first impact. The pressures near the beginning of the rams are subject to substantial error, because the are highly sensitive to the estimated moment of first contact.
11
Daley R&E
Errors of fraction of a second can result in large initial pressure differences. Later in the ram the errors become small. Figure 13 shows the calculated pressure-area data. An envelope curve is also shown.
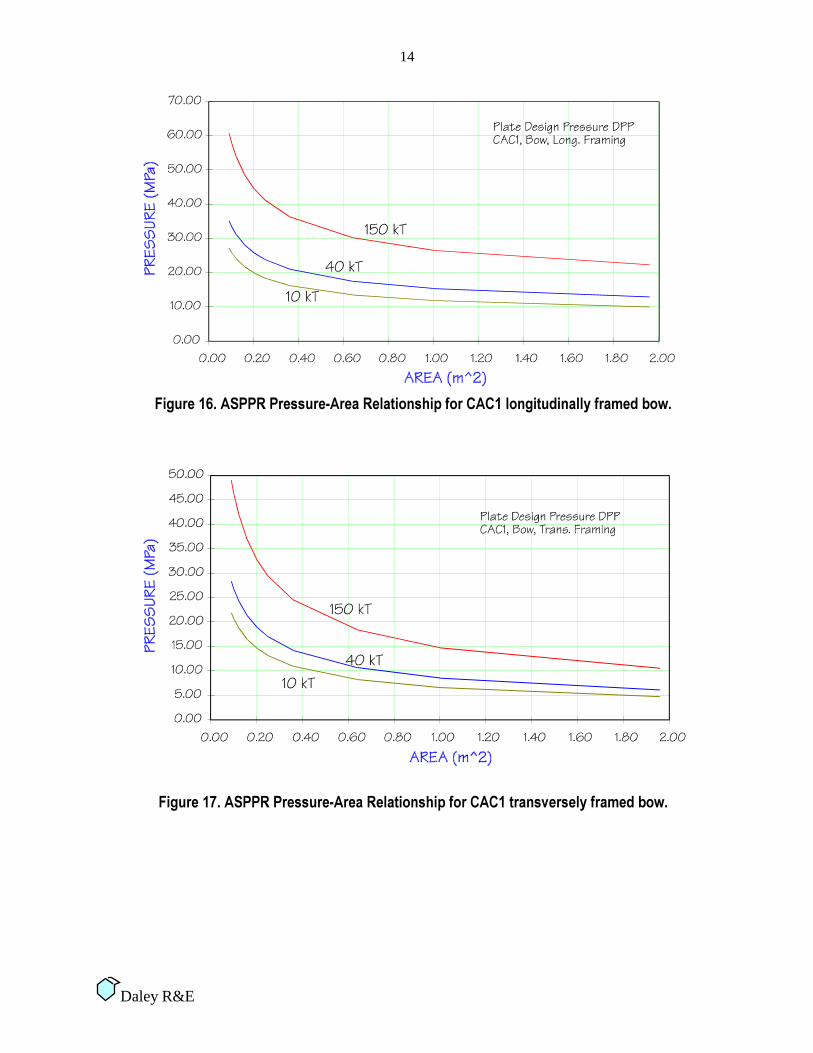
The POLAR SEA is a 13,200 tonne icebreaker operated in Arctic and Antarctic waters. Figure 14 shows a sketch of the vessel. The shoulder of the POLAR SEA had a 9 m2 panel instrumented to measure ice loads. The system permitted pressures to be measured over each of 60 sub-panels of .15 m2. Test were conducted in Alaskan Beaufort, Chukchi and Bering Seas during 1982-1984. The data given here is from a series of rams into known multi-year ice in the North Chukchi Sea during April of 1983.
)LJXUH�����6NHWFK�RI�86&*&�32/$5�6($�
12
Daley R&E
Figure 15 shows two types of ice pressure measurements from the Polar Sea. The data points give the average pressure over the entire contact. Within the contact area there are higher pressures over smaller areas. The line labeled ‘Peak Meas.’ represents the highest pressures measured over those areas. These peak pressure measurements are comparable with the KIGORIAK pressure measurements.
The Arctic Shipping Pollution Prevention Regulations (ASPPR) were revised in 1989 after extensive research and analysis. The revisions are being implemented as an Equivalent Standard for the Construction of Arctic Class Ships. The following sections describe the ice load and pressure aspects in the new ASPPR.
3.1 Design Plate Pressure
The design plate pressure (DPP) depends on the vessel size, power, ice class, hull area, frame spacing and orientation. The formula for DPP is ;
where “AF” is the hull area factor (1 for bow, .5 for mid/stern, .3 for bottom) “CF” is the class factor (1, 0.8,0.6, and 0.4 for CAC1, CAC2, CAC3 and CAC4) “OF” is the orientation factor (1 for transverse framing, 1+UxS for longitudinal framing) “U” is weighting factor (0.8 for bow, 0.4 for mid/stern, 0 for bottom)
Equation (1) can be simplified by assuming that the power can be approximated by
P = ×32
3∆ (2) which simplifies equation (1) to;
DPPAF CF OF
SMPa=
× × × + ×( . ( . ( ))).5 79 0 09824 0 9∆ (3)
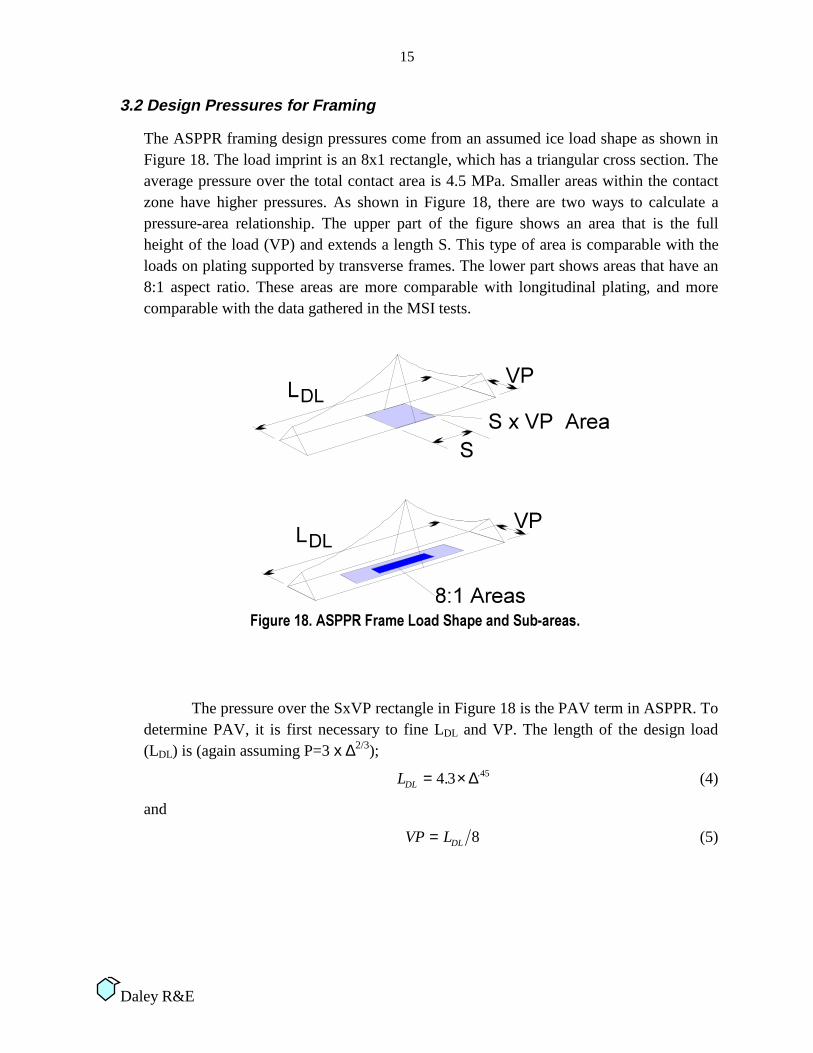
Figures 16 and 17 illustrate the pressure-area aspect of equation 3. The area is equal to S2, which is the important area for plating design. The bow area of a CAC1 class vessel is used as a basis for comparison. Figure 16 shows the pressures for plating supported by longitudinal framing, and Figure 17 shows the case for transverse framing. Three ship sizes (10 kT, 40 kT and 150 kT displacement) are given.
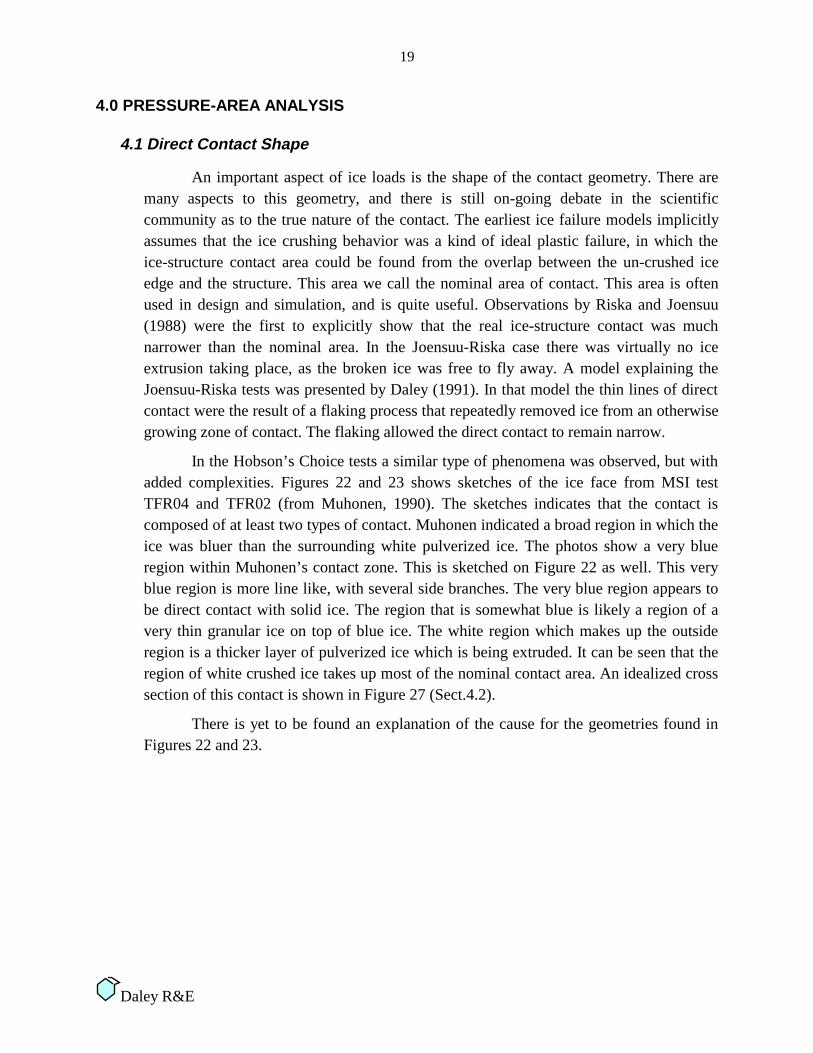
The ASPPR framing design pressures come from an assumed ice load shape as shown in Figure 18. The load imprint is an 8x1 rectangle, which has a triangular cross section. The average pressure over the total contact area is 4.5 MPa. Smaller areas within the contact zone have higher pressures. As shown in Figure 18, there are two ways to calculate a pressure-area relationship. The upper part of the figure shows an area that is the full height of the load (VP) and extends a length S. This type of area is comparable with the loads on plating supported by transverse frames. The lower part shows areas that have an 8:1 aspect ratio. These areas are more comparable with longitudinal plating, and more comparable with the data gathered in the MSI tests.
The pressure over the SxVP rectangle in Figure 18 is the PAV term in ASPPR. To determine PAV, it is first necessary to fine LDL and VP. The length of the design load (LDL) is (again assuming P=3 x ∆2/3);
LDL = ×4 3 45. .∆ (4)
and
VP LDL= 8 (5)
16
Daley R&E
With X=S/LDL, PAV is determined from a table or the following equations;
PAVX
=+
+1
0 0544 2850 7( . ).. MPa X < 0.2 (6)
or
PAVX
=+
+1
0 33841 6( . ).. MPa X > 0.2 (7)
In the case of the 8x1 imprint the width is S/8, so the area is S2/8 rather than SxVP. The appropriate pressure is PAV x (2-S/(8 VP)). Both the 8x1 and SxVP pressure-area plots for the frames together with the longitudinal and transverse plating pressure-area plots are shown in Figure 19 for the bow of a 10,000 tonne CAC1 vessel.
The framing and plating design pressures do not form a continuous function, but they do line up quite well from about .5 m2 to 1 m2. Plating design area (SxS) would not normally be much larger than about 1 m2, and typically it is .15 m2. This shows that the plate and frame design pressures follow a very similar logic.
17
Daley R&E
3.3 Sensitivity to Vessel Size
The sensitivity to vessel size is a very important aspect of the ASPPR requirements. Figures 16 and 17 have shown how ship size affects the plate design pressure-area curves. Figure 19 shows the plate and frame pressure-area plots together. These are for longitudinal plating and 8x1 frame areas. While the 10,000 tonne and 40,000 tonne ships show a good match between the plating and framing, the 150,000 tonne ship shows a big mismatch in plate and frame pressures. The reason for the discrepancy is made clear by Figure 20. The plate pressures increase more steadily with displacement than do the frame pressures. Equation (3) shows that that the incremental plate pressures are a function of ∆.9, while the frame pressures are more weakly dependent on the displacement. This is an important aspect of the ASPPR which will be discussed again in the following sections.
An important aspect of ice loads is the shape of the contact geometry. There are many aspects to this geometry, and there is still on-going debate in the scientific community as to the true nature of the contact. The earliest ice failure models implicitly assumes that the ice crushing behavior was a kind of ideal plastic failure, in which the ice-structure contact area could be found from the overlap between the un-crushed ice edge and the structure. This area we call the nominal area of contact. This area is often used in design and simulation, and is quite useful. Observations by Riska and Joensuu (1988) were the first to explicitly show that the real ice-structure contact was much narrower than the nominal area. In the Joensuu-Riska case there was virtually no ice extrusion taking place, as the broken ice was free to fly away. A model explaining the Joensuu-Riska tests was presented by Daley (1991). In that model the thin lines of direct contact were the result of a flaking process that repeatedly removed ice from an otherwise growing zone of contact. The flaking allowed the direct contact to remain narrow.
In the Hobson’s Choice tests a similar type of phenomena was observed, but with added complexities. Figures 22 and 23 shows sketches of the ice face from MSI test TFR04 and TFR02 (from Muhonen, 1990). The sketches indicates that the contact is composed of at least two types of contact. Muhonen indicated a broad region in which the ice was bluer than the surrounding white pulverized ice. The photos show a very blue region within Muhonen’s contact zone. This is sketched on Figure 22 as well. This very blue region is more line like, with several side branches. The very blue region appears to be direct contact with solid ice. The region that is somewhat blue is likely a region of a very thin granular ice on top of blue ice. The white region which makes up the outside region is a thicker layer of pulverized ice which is being extruded. It can be seen that the region of white crushed ice takes up most of the nominal contact area. An idealized cross section of this contact is shown in Figure 27 (Sect.4.2).
There is yet to be found an explanation of the cause for the geometries found in Figures 22 and 23.
The aspect ration refers to the ratio of the length of the contact to the depth of the contact (long dimension : short dimension). The aspect ratio is known empirically to influence the ice load, although the precise reason is still somewhat uncertain. In the MSI data reduction and analysis report by Sandwell (1992), there is a discussion of the aspect ratio effects. Those arguments will be examined further here.
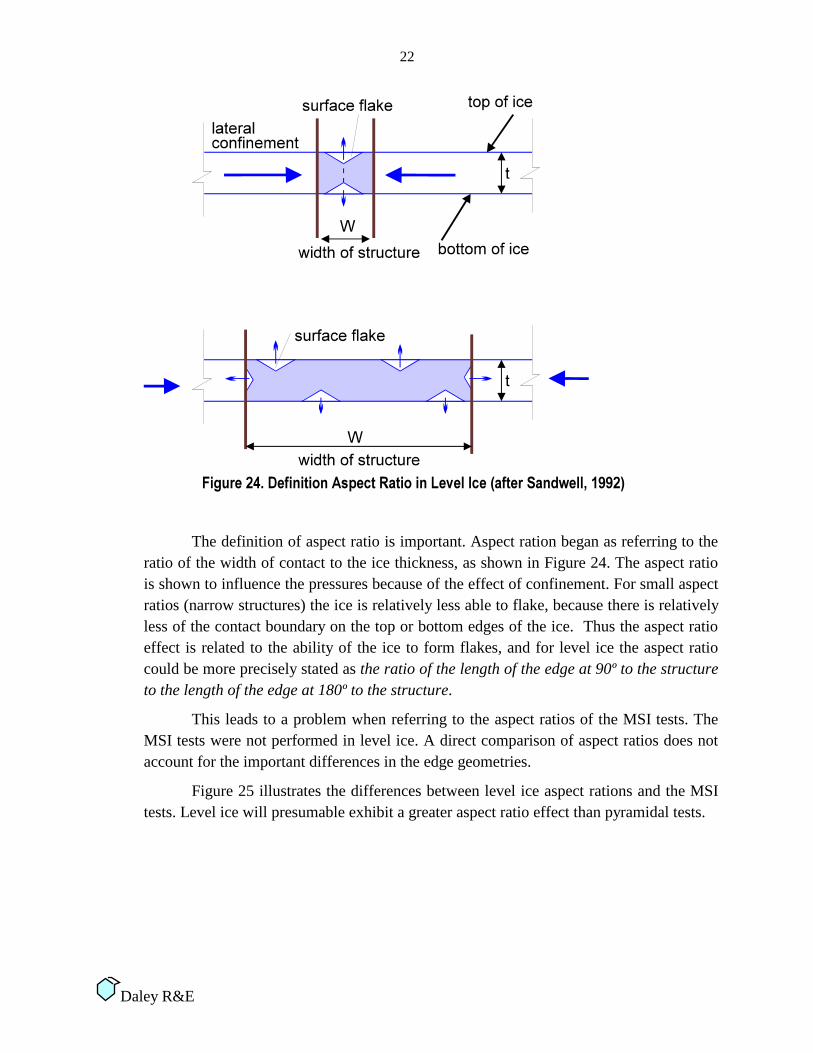
The definition of aspect ratio is important. Aspect ration began as referring to the ratio of the width of contact to the ice thickness, as shown in Figure 24. The aspect ratio is shown to influence the pressures because of the effect of confinement. For small aspect ratios (narrow structures) the ice is relatively less able to flake, because there is relatively less of the contact boundary on the top or bottom edges of the ice. Thus the aspect ratio effect is related to the ability of the ice to form flakes, and for level ice the aspect ratio could be more precisely stated as the ratio of the length of the edge at 90º to the structure to the length of the edge at 180º to the structure.
This leads to a problem when referring to the aspect ratios of the MSI tests. The MSI tests were not performed in level ice. A direct comparison of aspect ratios does not account for the important differences in the edge geometries.
Figure 25 illustrates the differences between level ice aspect rations and the MSI tests. Level ice will presumable exhibit a greater aspect ratio effect than pyramidal tests.
In the case of the MSI tests Sandwell discussed the influence of the direct contact shape on the aspect ratio and pressure-area effects. The direct contact shapes (Figs.22 &23) were idealized as and X-Y pattern as shown in Figure 26. All if the ice load was assumed to be transmitted by a line-like direct contact as shown in the figure. The width of the direct contact is w, the pressure in the direct contact is po. Assuming that w is small compared to the width b, then the total force transmitted by the direct contact is;
( )[ ]Force p w a bo= ⋅ ⋅ + ⋅ ⋅ −2 2 1 (8)
which means that the average pressure is;
( )[ ]pp w
a ba bav
o=⋅⋅
⋅ + ⋅ ⋅ −2 2 1 (9)
Appendix E contains the Mathcad calculations and plots for this section. These are also on the disk which accompanies this report.
24
Daley R&E
)LJXUH�����,GHDOL]HG�3DWWHUQ�RI�'LUHFW�&RQWDFW�
Using the substitution for aspect ratio α=a/b and area A=a b, Eqn (9) can be re-stated in terms of aspect ratio and area;
( )
pp w
Aavo=
⋅⋅ +
⋅ −
αα
2 2 1 (10)
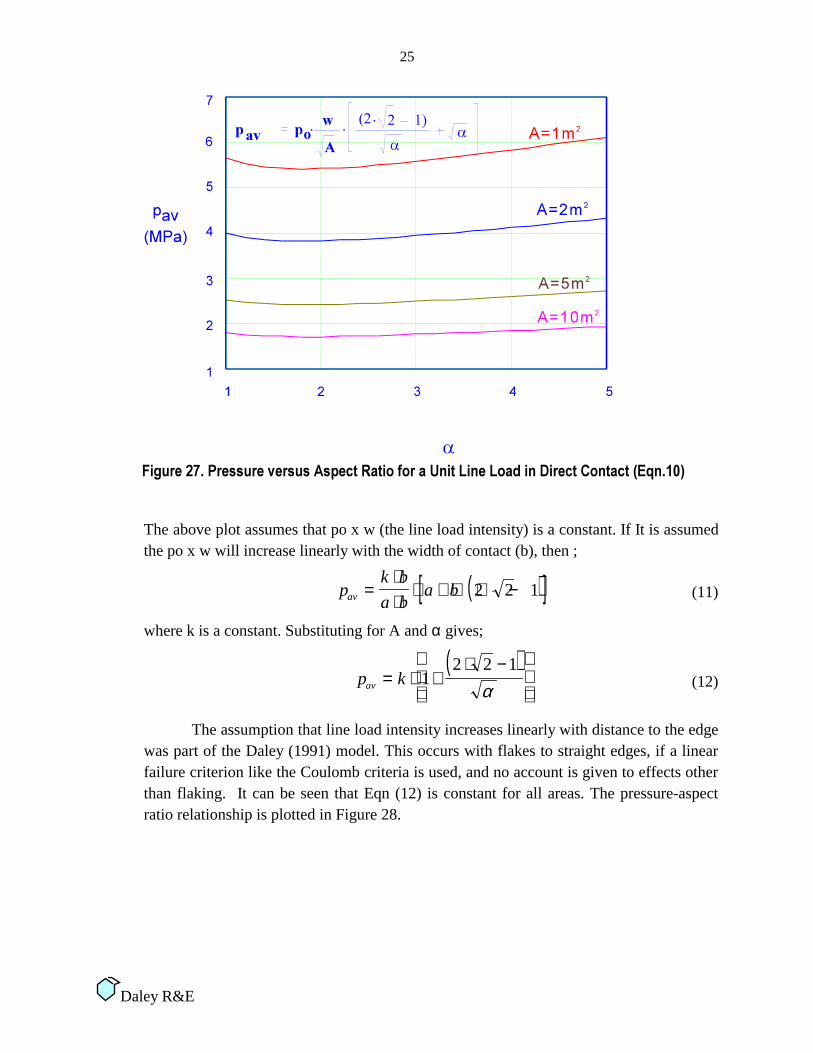
Eqn (10) is plotted as pressure vs. aspect ratio in Figure 27 (for four different areas).
The above plot assumes that po x w (the line load intensity) is a constant. If It is assumed the po x w will increase linearly with the width of contact (b), then ;
( )[ ]pk b
a ba bav =
⋅⋅
⋅ + ⋅ ⋅ −2 2 1 (11)
where k is a constant. Substituting for A and α gives;
( )
p kav = ⋅ +⋅ −
12 2 1
α (12)
The assumption that line load intensity increases linearly with distance to the edge was part of the Daley (1991) model. This occurs with flakes to straight edges, if a linear failure criterion like the Coulomb criteria is used, and no account is given to effects other than flaking. It can be seen that Eqn (12) is constant for all areas. The pressure-aspect ratio relationship is plotted in Figure 28.
In the Sandwell report Equation (12) was arrived at from reasoning that the pressure should not rise with either aspect ratio or area. This constrains the equation so that only equation (12) is possible (was equation 7.9 in the Sandwell report). It is worthwhile to relax these constraints to see what will result.
If the line load intensity is assumed to increase more than linearly with increasing contact width b, such that po x w = k x bn, n>1, then equation (12) becomes instead;
( )
p k bavn= ⋅ ⋅ +
⋅ −
−1 12 2 1
α (13)
which, if we assume that b A= (so that areal changes are independent to aspect ratio changes), we get;
( )
p k Aav
n
= ⋅ ⋅ +⋅ −
−1
2 12 2 1
α (14)
Equation 14 is plotted as pressure versus area in Figure 29. In this case n is 2 and α is 8:1. This would occur in the case of extrusion, which cause pressures to rise as the length of the extrusion path increases.
27
Daley R&E
)LJXUH�����3UHVVXUH�$UHD�EDVHG�RQ�(TXDWLRQ������
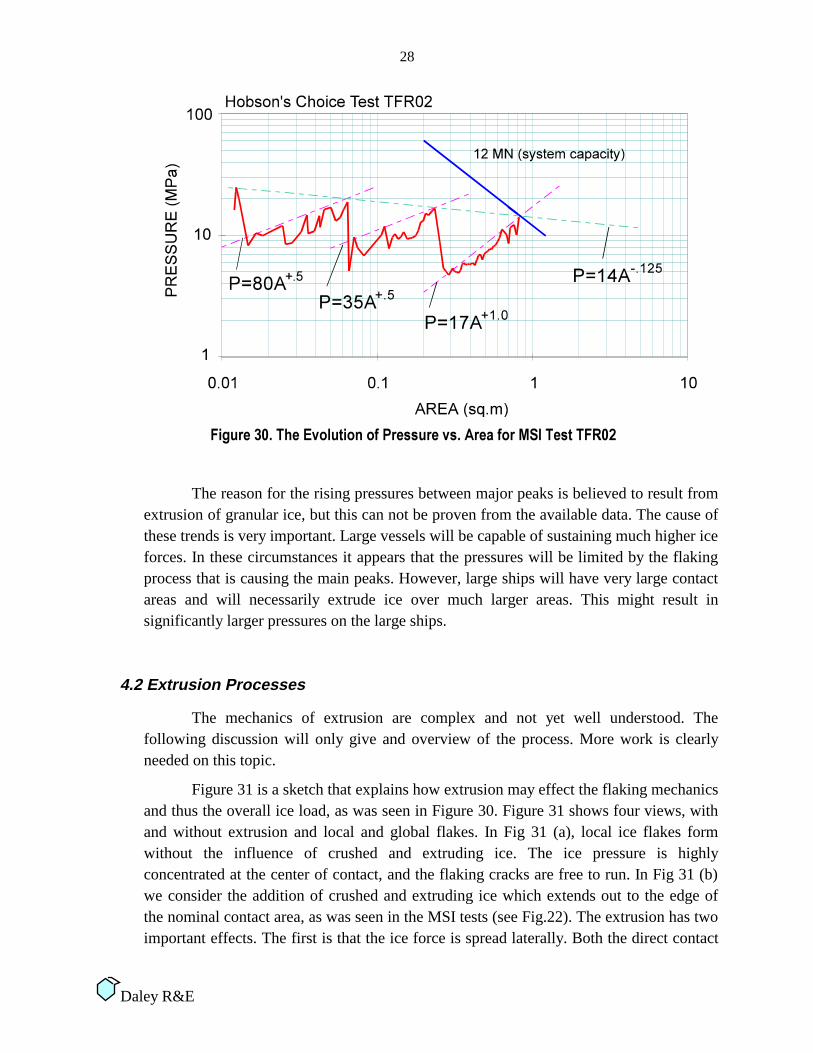
The MSI tests provided some indication of rising pressures with increasing areas. Figure 30 plots the pressure-area curve from the MSI test TFR02 on log-log scales. The curve contains two important phenomena. First notice that there is a sequence of four major peaks. These peaks together form a trend of decreasing pressure with area. The equation which fits the general decreasing trend is;
P A= ⋅ −14 125. (15)
After each peak there is a major drop in the pressure (note that the area was growing as the test proceeded). Between each major peak the pressure rose as the area rose. The three rising trends follow the equations;
The reason for the rising pressures between major peaks is believed to result from extrusion of granular ice, but this can not be proven from the available data. The cause of these trends is very important. Large vessels will be capable of sustaining much higher ice forces. In these circumstances it appears that the pressures will be limited by the flaking process that is causing the main peaks. However, large ships will have very large contact areas and will necessarily extrude ice over much larger areas. This might result in significantly larger pressures on the large ships.
4.2 Extrusion Processes
The mechanics of extrusion are complex and not yet well understood. The following discussion will only give and overview of the process. More work is clearly needed on this topic.
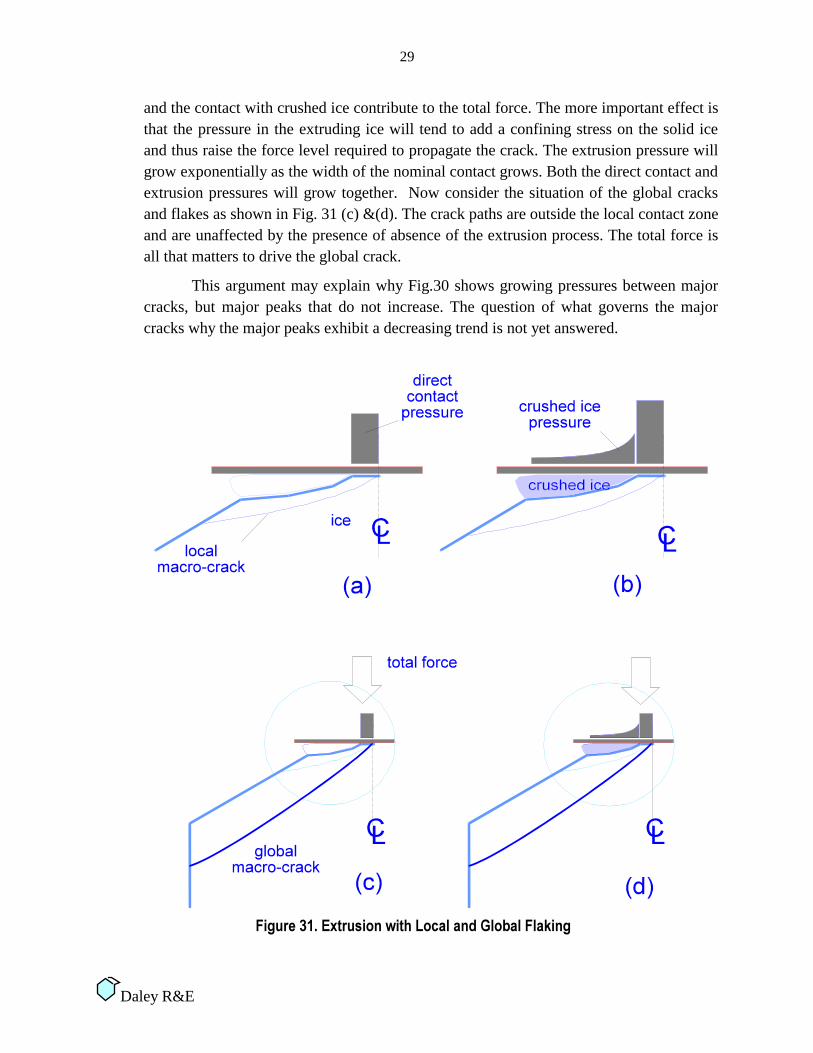
Figure 31 is a sketch that explains how extrusion may effect the flaking mechanics and thus the overall ice load, as was seen in Figure 30. Figure 31 shows four views, with and without extrusion and local and global flakes. In Fig 31 (a), local ice flakes form without the influence of crushed and extruding ice. The ice pressure is highly concentrated at the center of contact, and the flaking cracks are free to run. In Fig 31 (b) we consider the addition of crushed and extruding ice which extends out to the edge of the nominal contact area, as was seen in the MSI tests (see Fig.22). The extrusion has two important effects. The first is that the ice force is spread laterally. Both the direct contact
29
Daley R&E
and the contact with crushed ice contribute to the total force. The more important effect is that the pressure in the extruding ice will tend to add a confining stress on the solid ice and thus raise the force level required to propagate the crack. The extrusion pressure will grow exponentially as the width of the nominal contact grows. Both the direct contact and extrusion pressures will grow together. Now consider the situation of the global cracks and flakes as shown in Fig. 31 (c) &(d). The crack paths are outside the local contact zone and are unaffected by the presence of absence of the extrusion process. The total force is all that matters to drive the global crack.
This argument may explain why Fig.30 shows growing pressures between major cracks, but major peaks that do not increase. The question of what governs the major cracks why the major peaks exhibit a decreasing trend is not yet answered.
Figure 32 shows a 3D plot of ice pressures measured in a region of crushed and extruding ice during test TFR03 (Hobson’s Choice ‘90). A sketch of the contact face showing the hard ice and crushed ice regions. The pressures plotted were measured at 1.2 seconds into the test. The pressures were measured using PVDF sensors, which allowed a contiguous measurement of pressure. The 3D pressure plot indicated that the pressures in the crushed ice were growing as the distance from the outside edge increased. There are two cases of more inward pressures being lower than their outward neighbors, This adds complexity to the situation. Without knowledge of the thickness of the extruding layer and the properties of the extruding ice, it is not possible to fully explain these measurements.
Figure 33 show three types of indentor geometries from the 1990 Hobson’s Choice tests. The flat rigid indentors show generally the highest pressures, with the flat flexible showing somewat lower values, and the wedge indentors showing the lowest pressures. These results are not conclusive but do suggest that the indentor properties do significantly influence the average pressures.
Figure 34 shows two wedge indentor tests. A large number of large and small peaks are excetionally well correlated. This suggests that the failure process is not the result of random events, but follows a failure sequence that depends on the ice and indentor parameters. This supports the idea that ice failure is a chaotic rather than a random process.
The tests at Pond Inlet were performed in iceberg ice with a spherical indentor capable of a maximum of 16 MN of force. These tests, along with all the other MSI tests are compared to the pressure-area relationship for a 10,000 tonne CAC1 design load, longitudinally oriented (the upper curves in Fig.19). The question of which ASPPR design load to compare with is open to debate. The MSI tests were not meant to represent a particular vessel, nor to reflect the statistical aspects that are included in ASPPR. The interaction geometries and the ice selection in the MSI tests were selected to represent a severe interaction. So in some ways the MSI tests were more severe than ASPPR, and in some ways less. The 10,000 tonne CAC1 vessel is a good point of comparison, as it is in the range of the sizes of the icebreakers Kigoriak and Polar Sea.
Figure 35 shows the Pond Inlet data together with a curve representing the ASPPR pressure-area values. The trends are similar, with the ASPPR values being higher particularly at the larger areas. This as partly due to the reason that the 10 kT ship could experience higher total forces. The 16 MN force limit for the indentor tests is also shown.
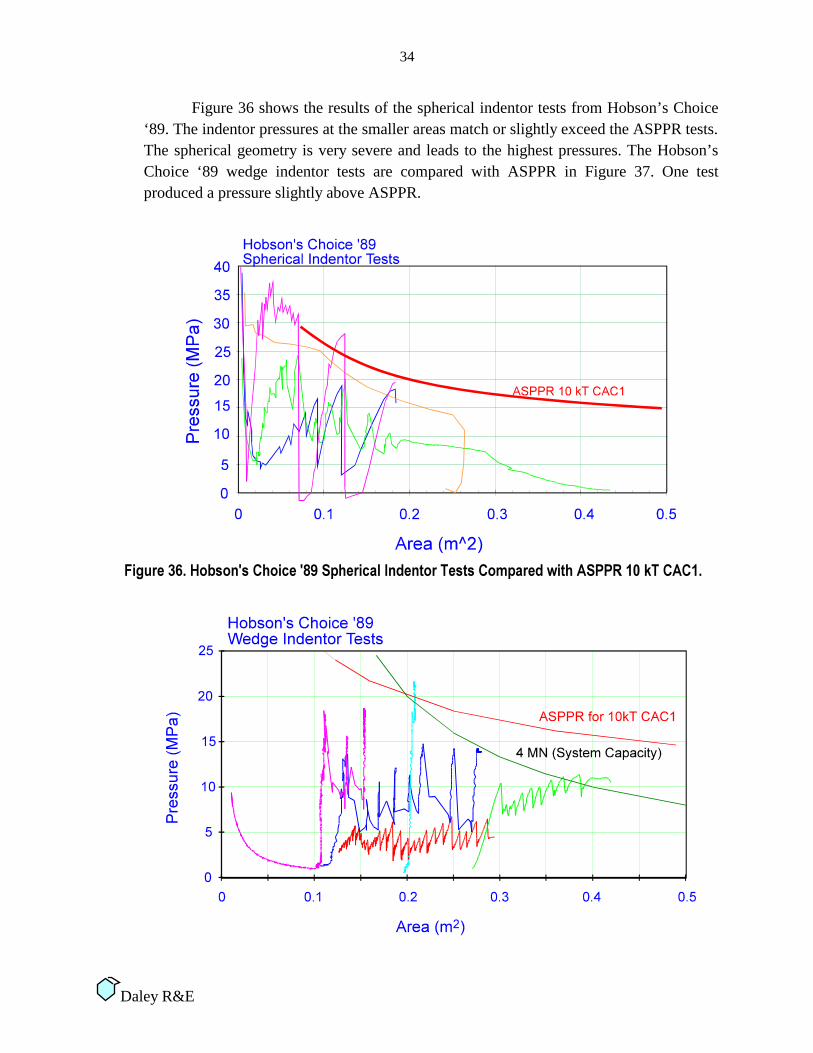
Figure 36 shows the results of the spherical indentor tests from Hobson’s Choice ‘89. The indentor pressures at the smaller areas match or slightly exceed the ASPPR tests. The spherical geometry is very severe and leads to the highest pressures. The Hobson’s Choice ‘89 wedge indentor tests are compared with ASPPR in Figure 37. One test produced a pressure slightly above ASPPR.
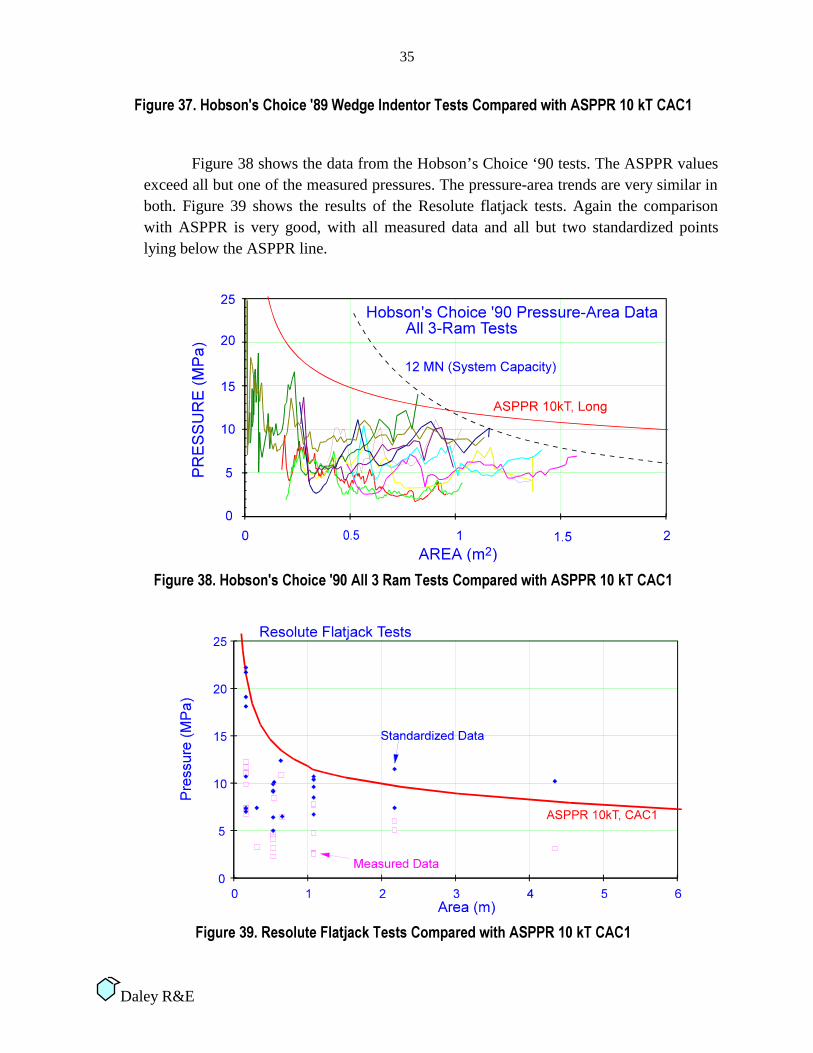
Figure 38 shows the data from the Hobson’s Choice ‘90 tests. The ASPPR values exceed all but one of the measured pressures. The pressure-area trends are very similar in both. Figure 39 shows the results of the Resolute flatjack tests. Again the comparison with ASPPR is very good, with all measured data and all but two standardized points lying below the ASPPR line.
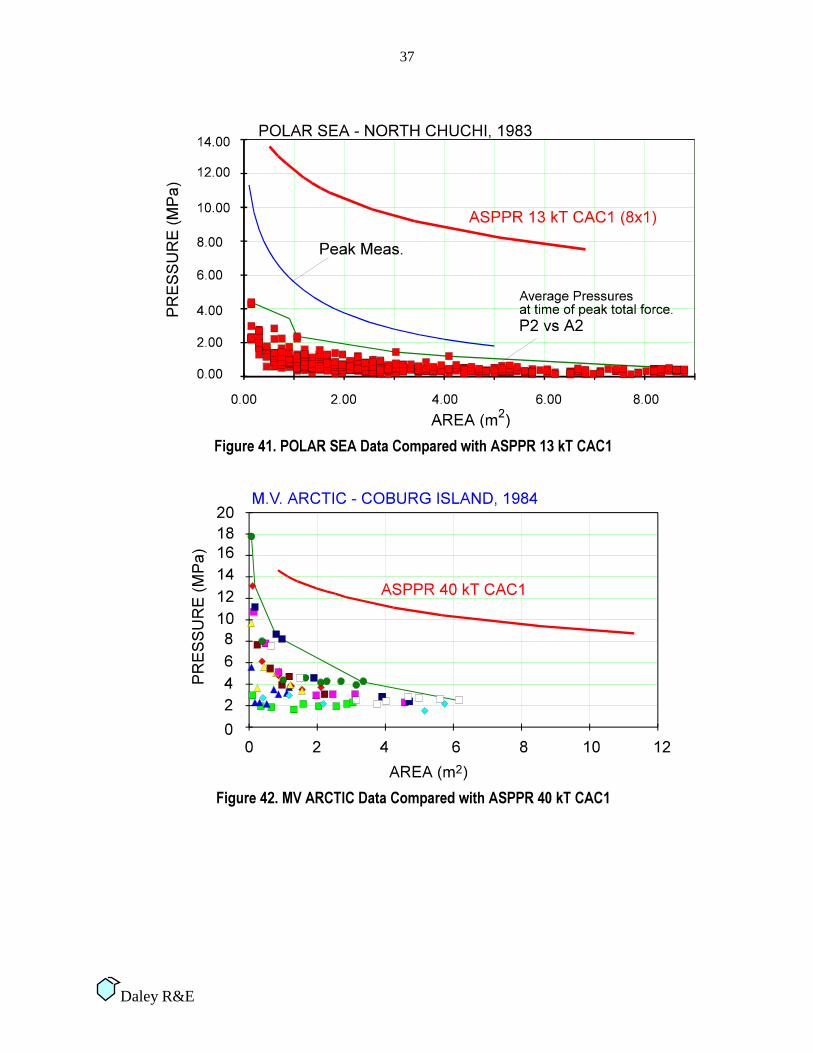
As mentioned previously, there are three ships that have produced data that was used in the development of the ASPPR. Figure 40 shows the data from the KIGORIAK compared to the 8x1 pressure-area relationship for a CAC1 vessel of 6800 tonnes. Figures 41 and 42 show the values for the POLAR SEA and the MV ARCTIC. The ASPPR pressures are well above the measured values. This comparison is quite conservative and illustrates some of the differences between ship data and the MSI experiments. The ASPPR values in the plots are for CAC1 ships (which none of these ships are) using the most severe pressure-area shape (the 8x1 shape was used here rather than the SxVP shape). This was done so that these comparison would be the same as the MSI-ASPPR comparisons.
The two main reasons why the ASPPR values are higher than the measurements is that ASPPR is meant to reflect many more impacts than occurred during the tests, and higher impact speeds. The pressures at small areas are strongly dependent on the number of impacts, while the pressures at large areas are strongly dependent on the impact force which depends on the impact velocities. In producing the CAC1 design values the ship data was extrapolated to higher speeds and greater number of impacts (to 16 kts and 10,000 impacts).
Remembering that the MSI data was only just below the ASPPR values, this comparison illustrates that the MSI tests produced much higher values than the ship testing.
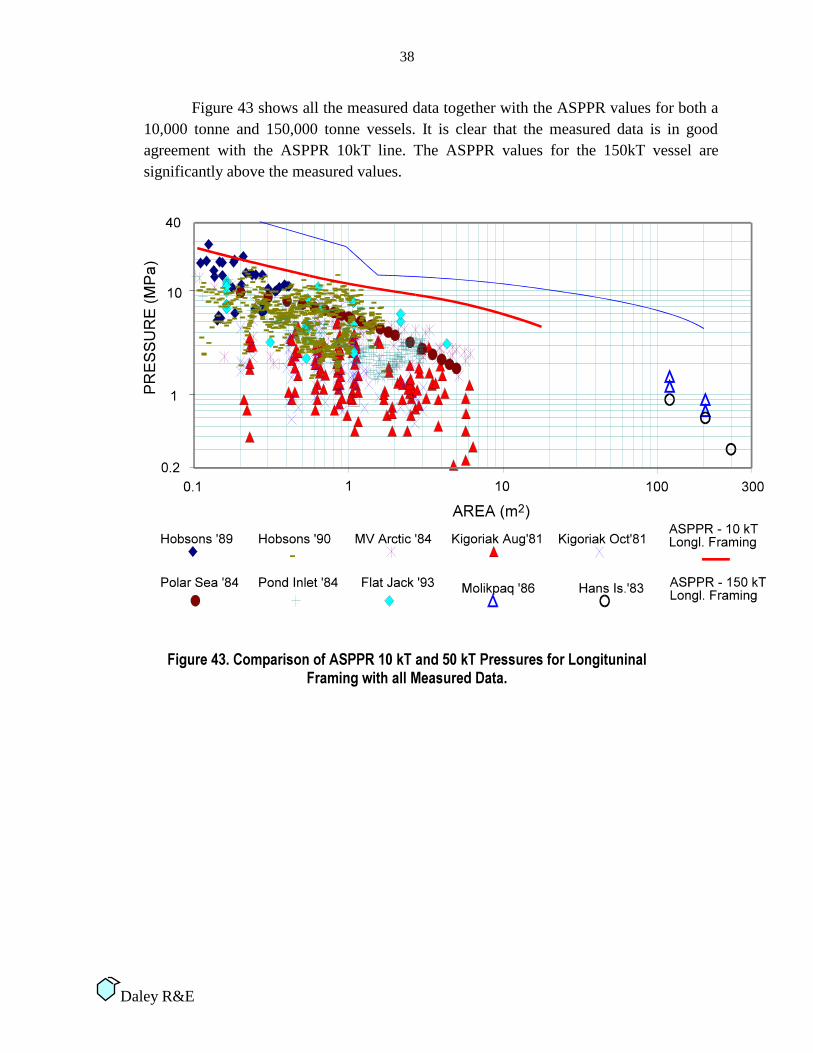
Figure 43 shows all the measured data together with the ASPPR values for both a 10,000 tonne and 150,000 tonne vessels. It is clear that the measured data is in good agreement with the ASPPR 10kT line. The ASPPR values for the 150kT vessel are significantly above the measured values.
The plots in section 5 show that the MSI tests resulted in pressures that are in excellent agreement with the values in ASPPR. There are a few cases of MSI pressures which exceed ASPPR, but only by small amounts. As the MSI tests were conducted with very severe geometric conditions, one can conclude that the MSI tests show ASPPR design ice pressures to be just about right, neither too low nor too high.
The comparison of controlled tests to a design standard poses many problems. The MSI tests were not extensive enough in terms of contact geometries, ice properties of number of rams to shed much light on the statistics of ice loads. The ASPPR loads were based on the statistics of full scale ship measurements, and on the experience of actual ship designs. This makes direct comparison open to question. The extreme conditions of the MSI tests leads one to suppose that the results could be compared with the ASPPR which is meant to reflect the worst annual impacts (worst of several thousand random impacts). That the comparisons are so close supports this idea somewhat.
6.2 Pressure-Area Effects and Ship Size
The ASPPR standard was developed on the basis of experience and measurements on existing ships. The ASPPR rules attempt to extend this experience to much larger ships. The plate and framing design pressures are dependent on ship size. Figures 20 and 21 show how the pressures increase with size. There are two obvious concerns that arise from these plots. For large ships (150 kT for example) there seems to be a mismatch between the framing and plating design pressures that does not occur for ships below 40 kT. It is also clear that the plating design pressure rises much faster with displacement than does the framing pressure. The MSI tests have indicated that there can be a tendency of pressure to rise with increasing interaction area (see Fig.30 for example). Extrusion seems to be the cause of this phenomena. However, it seems that major failures (global fractures) limit the buildup of the pressures and have the overall result of decreasing pressures as the imprint size grows.
Figure 43 shows that the measured field data provides good support for the ASPPR values for a 10,000 tonne ship. The data is, however, well below the design values for a 150,000 tonne ship. The influence of displacement in ASPPR may be too strong.
40
Daley R&E
6.3 Recommendations
The MSI tests have supported the general form and trends of the ASPPR design ice loads. As well, the tests and the present analysis has raised some important questions. The key issue concerns the way in which ship size affects the ice pressures. The following recommendations are made;
• The inconsistency between plate and frame design pressures for large ships in ASPPR should be corrected. (See Figure 19)
• The process of ice extrusion during ship-ice interaction warrants further study. Specialized laboratory tests, mathematical modeling and if possible full scale tests should be conducted to investigate this issue. With a workable model or understanding of the mechanics of extrusion, there is much full scale and experimental data that could be re-visited to provide the necessary information to corroborate a theory.
• The ice pressures appear to be limited by major flakes. The mechanics of such flakes needs futher investigation. The Resolute flaking tests should be re-designed and continued, possibly in the lab and in the field. The issue of 3-dimensional flakes of the kind that must have occured in he MSI tests needs further investigation. This will help to explain the contact patterns and pressure distributions seen in the MSI tests.
• The statistical aspects of the influence of ship size on pressures should be examined.
• With results of the above investigations in hand, the influence of ship size in ASPPR should be re-examined.
41
Daley R&E
7.0 CONCLUSION
The Medium Scale Indentor Tests have resulted in a large and valuable data set concerning ice loads during ship-ice and structure-ice contact. The pressures measured were high in comparison to values measured on ships. The main reason for this was the highly controlled nature of the tests, and the severe interaction geometries chosen. Even so, the MSI pressures are within the range of the design loads in the ASPPR. One can conclude that the MSI tests represent the extreme cases which the ASPPR design loads are meant to cover.
From a practical point of view the MSI tests were successful in providing evidence against which to compare the ASPPR. Progress was made on the question of the correct influence of ship size on the design pressures. Currently ASPPR has design pressures rising strongly with increasing ship size. The MSI data has indicated that macroscopic cracking may limit the pressures, even on large ships. While no conclusion of this issue can be made at this time, the MSI tests have shown that the key to answering this question lies in how pressures are affected by the interplay between extrusion (tending to raise pressures) and flaking (tending to limit pressures).
From a scientific point of view, the tests have provided data and observations which give new insight and permit the development of theoretical models of ice-structure and ship-ice interaction. The practical concerns about pressures leads to the scientific questions about the nature of macroscopic cracking, flaking processes, and the formation and extrusion of crushed ice.
42
Daley R&E
8.0 REFERENCES
Canadian Coast Guard “Proposals for the Revision of the Arctic Shipping Pollution Prevention Regulations” Transport Canada Report TP9981, Ottawa, Dec. 1989.
Canadian Coast Guard, Proposed Equivalent Standards for the Construction of Arctic Class Ships, Ottawa, 16-Mar. 1993.
Daley, C. 1991, “Ice Edge Contact - A Brittle Failure Process Model”, Acta Polytechnica Scandinavica, Mechanical Engineering Series No. 100, Helsinki 1991, published by the Finnish Academy of Technology.
Daley, C. 1992, “Ice Edge Contact and Failure”, Cold Regions Science and Technology, 21 (1992) 1-23, Elsevier Science Publishers, Amsterdam.
Frederking, R., Blanchet, D., Jordaan, I.J., Kennedy, N.K., Sinah, N.K. and Stander, E., “Field Tests of Ice Indentation at Medium Scale, Ice Island, April 1989” Client Report for Canadian Coast Guard and Transportation Development Centre, By Institute for Research in Construction, National Research Council, Ottawa, October, 1990.
Jordaan, I.J., and McKenna, R.F., “Processes of Deformation and Fracture of Ice in Compression”, in Ice-Structure Interaction, Jones S.J., et.al. (Eds), IUTAM-IAHR Symposium St. John’s, Newfoundland, Canada, Pub. by Springer Verlag, 1991.
Muhonen, A., “Medium Scale Indentation Tests - PVDF pressure measurements, ice face measurements and Interpretation of crushing video”, Client Report by Helsinki University of Technology, Ship Laboratory, Feb.20, 1991.
Sandwell., “1990 Ice Indentator Tests - Field Test Report and Executive Summary” Report of Project 112390 by Sandwell Inc., Calgary, Alberta, Vol. I and II November 1990.
Sandwell., “Medium Scale Uniform Pressure Tests on First-Year Sea Ice at Resolute Bay, N.W.T. 1993” Draft Final Report, Project 113077 by Sandwell Inc., Calgary, Alberta, to National Research Council, Institute for Mechanical Engineering, Ottawa, Vol. I and II, August 1993.
Sandwell., “Reduction and Analysis of 1990 and 1989 Hobson’s Choice Ice Indentation Tests Data” Final Report, Project 112588 by Sandwell Inc., Calgary, Alberta, to Conoco Inc. Exxon Prod. Res. Co., Mobil R and D Corp. and National Research Council of Canada, August 1992.
Timco, G.W., and Frederking, R.M.W. (1991), “Seasonal Compressive Strength of Beaufort Sea Ice Sheets”, IUTAM-IAHR Symposium on Ice-Structure Interaction, St. John’s Newfoundland, 1989, Publ. by Springer-Verlag.