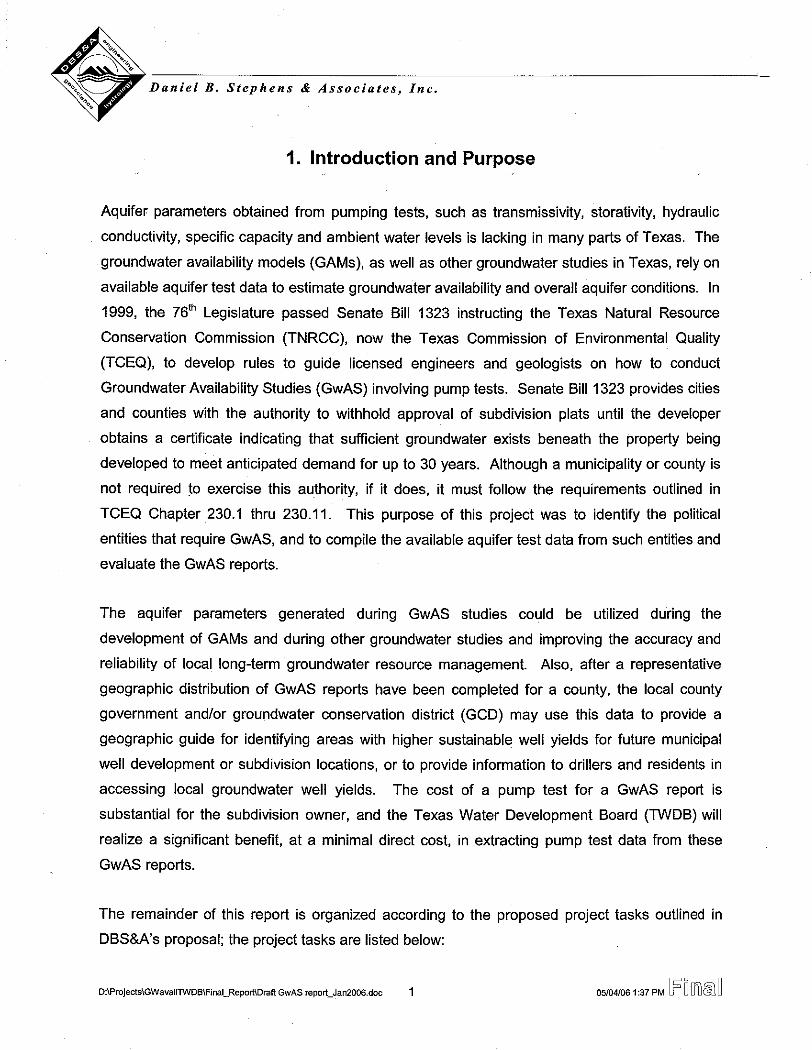
COMPILATION OF PUMPING TESTS IN TRAVIS AND HAYS COUNTIES, CENTRAL TEXAS BSEACD Data Series Report 2010-0701 July 2010 Barton Springs/Edwards Aquifer Conservation District 1124 Regal Row Austin, Texas
Transcript
COMPILATION OF PUMPING TESTS IN TRAVIS AND HAYS COUNTIES, CENTRAL TEXAS
BSEACD Data Series Report 2010-0701 July 2010 Barton Springs/Edwards Aquifer Conservation District 1124 Regal Row Austin, Texas
i BSEACD Data Series Report 2010-0701
Disclaimer
All of the information provided in this report is believed to be accurate and reliable; however, the Barton Springs/Edwards Aquifer Conservation District and contributing authors assume no responsibility for the use of the information provided as there may be unintended errors and omissions of information. Cover: Clockwise from upper left, photographs of pumping wells taken during pumping tests at: the Higginbotham Tract (Edwards), KBDJ Quarry (Middle Trinity), Estates of Shady Hollow (Edwards), and Ruby Ranch #5 (Middle Trinity).
ii BSEACD Data Series Report 2010-0701
COMPILATION OF PUMPING TESTS IN TRAVIS AND HAYS COUNTIES, CENTRAL TEXAS Brian B. Hunt, P.G., Brian A. Smith, Ph.D., P.G., and Jenna Kromann Barton Springs Edwards Aquifer Conservation District Douglas A. Wierman, P.G. John K. Mikels, P.G. GEOS Consulting, Austin Texas Kirk Holland, P.G., General Manager
Dr. Robert D. Larsen- President Board of Directors
Precinct 3 Mary Stone- Vice President Precinct 1 Gary Franklin- Secretary Precinct 2 Jack Goodman Precinct 4 Craig Smith Precinct 5 BSEACD Data Series Report 2010-0701 July 2010 Barton Springs/Edwards Aquifer Conservation District 1124 Regal Row Austin, Texas
iii BSEACD Data Series Report 2010-0701
CONTENTS Abstract……………..…………………………………………………….1 Introduction……………………………………………………………….2 Overview of Data…...…………………………………………………….2 Hydraulic Parameters……………………………………………………..7
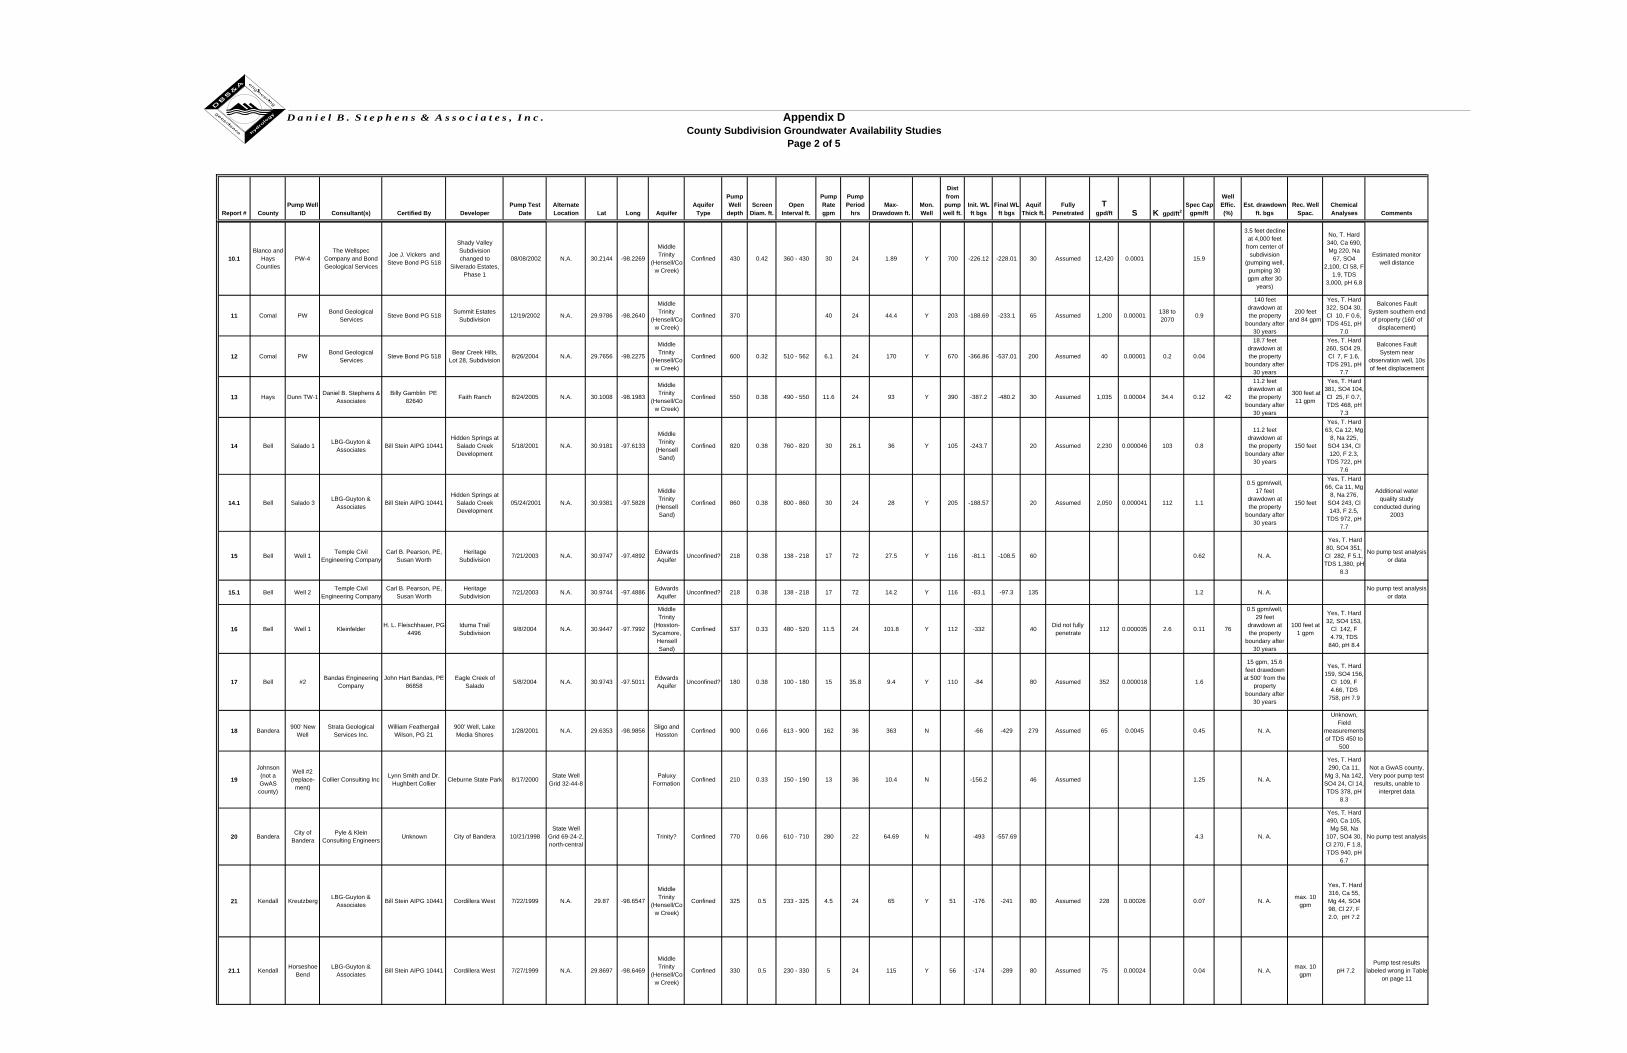
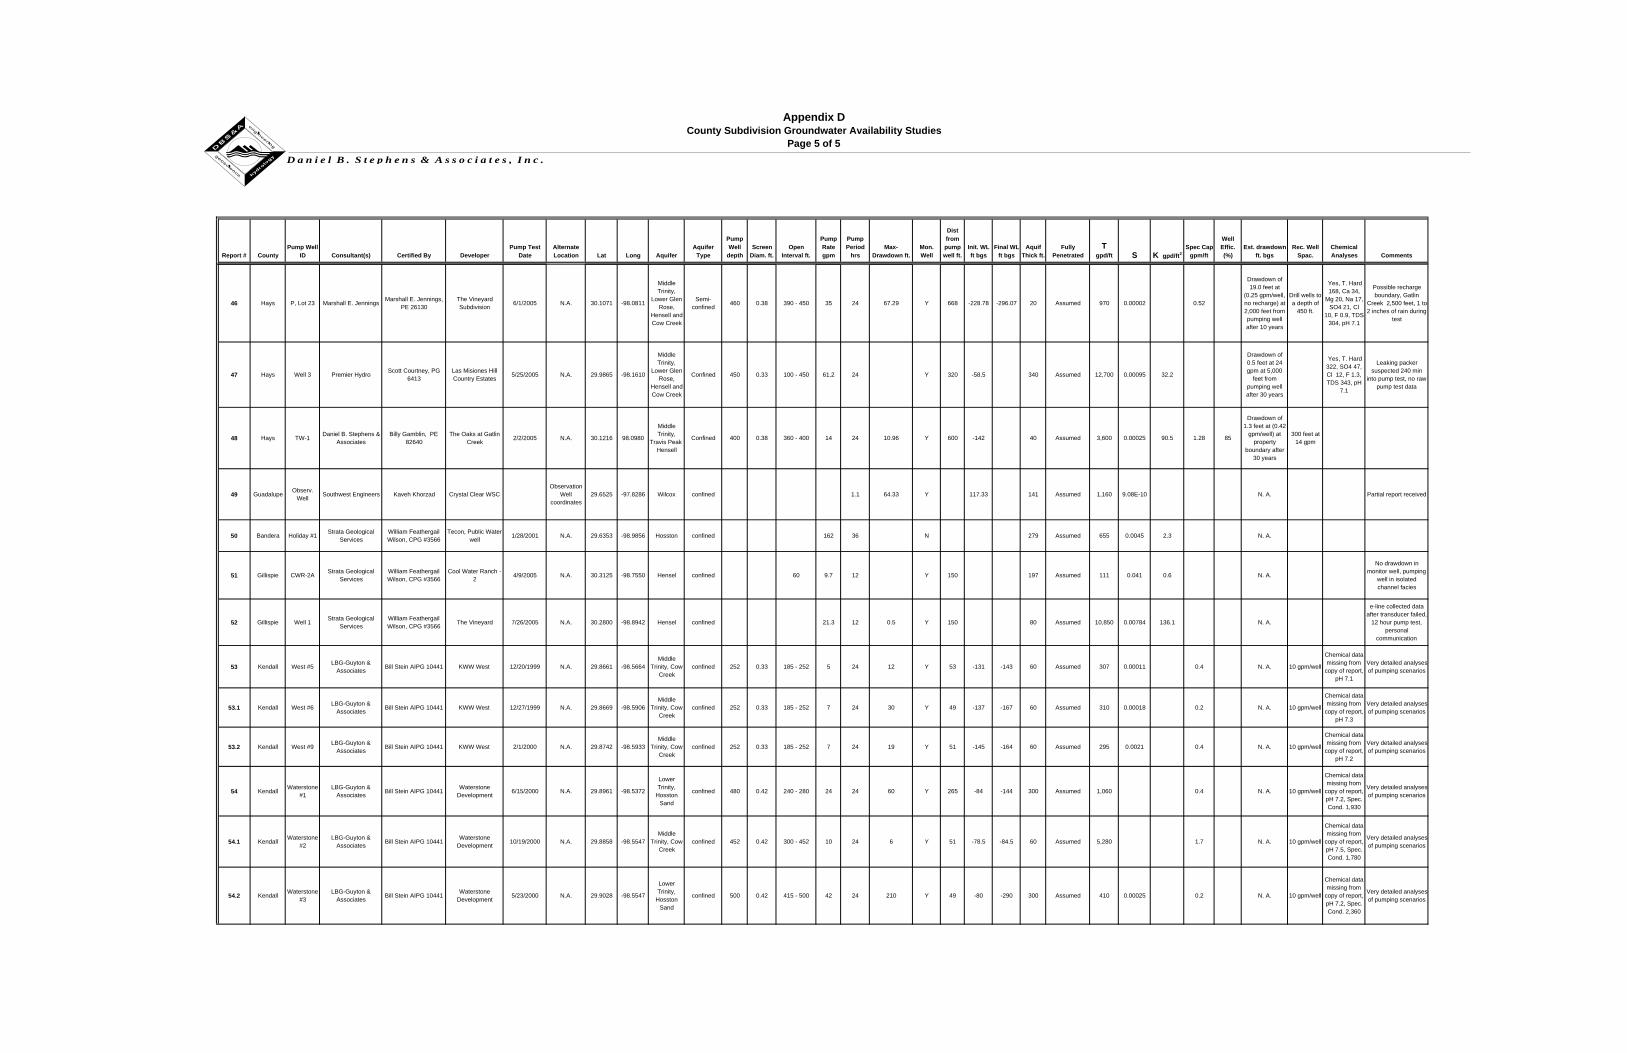
FIGURES Figure 1. General Map of Major Aquifers and Location of Tests Figure 2. Detailed Map of Aquifers and Location of Tests Figure 3. Box and Whisker Plot of Transmissivity and Storativity by Aquifer Figure 4. Comparison of K Values in Compiled Reports with Published Ranges in K Values TABLES Table 1. Reports Source Data Table 2. Summary of Tests by Aquifer Table 3. General Inventory of Pumping Test Reports and Map Key Table 4. Summary of Average Hydraulic Conductivity Values by Aquifer Table 5. Summary of Hydraulic Conductivity Values of Aquifers with Sparse Data Table 6. Summary of Average Transmissivity Values by Aquifer Table 7. Summary of Transmissivity Values of Aquifers with Sparse Data Table 8. Summary of Average Storativity Values by Aquifer Table 9. Summary of Storativity Values of Aquifers with Sparse Data APPENDICES Appendix 1: Detailed Pumping Test Summary Table Appendix 2: Excerpt from TWDB Contract Report 2005-483-554: Tests from County Water Availability Studies, May 4, 2006 Appendix 3: Guidelines for Hydrogeologic Reports and Tests Conducted Within the Jurisdictional Boundaries of the Barton Springs / Edwards Aquifer Conservation District, January 2007 Appendix 4: Compact Disk Containing Scanned Pumping Test Reports
COMPILATION OF PUMPING TESTS IN TRAVIS AND HAYS COUNTIES, CENTRAL TEXAS Brian B. Hunt, P.G., Brian A. Smith, Ph.D., P.G., and Jenna Kromann Barton Springs Edwards Aquifer Conservation District Douglas A. Wierman, P.G. John K. Mikels, P.G. GEOS Consulting, Austin Texas ABSTRACT Groundwater is an important natural resource for Central Texas, providing the sole source of water in many areas, for municipal, domestic, industrial, livestock, and ecological needs. To sustainably manage the groundwater resources it is essential to have data that characterize the hydraulic parameters of the aquifers. This type of data is often not readily available. This document compiles reports of 85 pumping tests conducted in Central Texas and presents key information summarized from each report, including hydraulic parameters such as hydraulic conductivity, transmissivity, and storativity. Location maps of the tests are provided, along with statistical summaries in the form of tables and box plots. The summarized hydraulic data in this report are compared to ranges of published values. The results of this compilation indicate that the highest transmissivity and storativity values are within the Edwards Aquifer, followed by the Middle Trinity, the Lower Trinity, and the Upper Trinity Aquifers. Pumping tests are an important method for determining hydraulic parameters. The data presented in this report will be useful to future groundwater modeling, groundwater availability, and other aquifer studies.
2
BSEACD Data Series Report 2010-0701
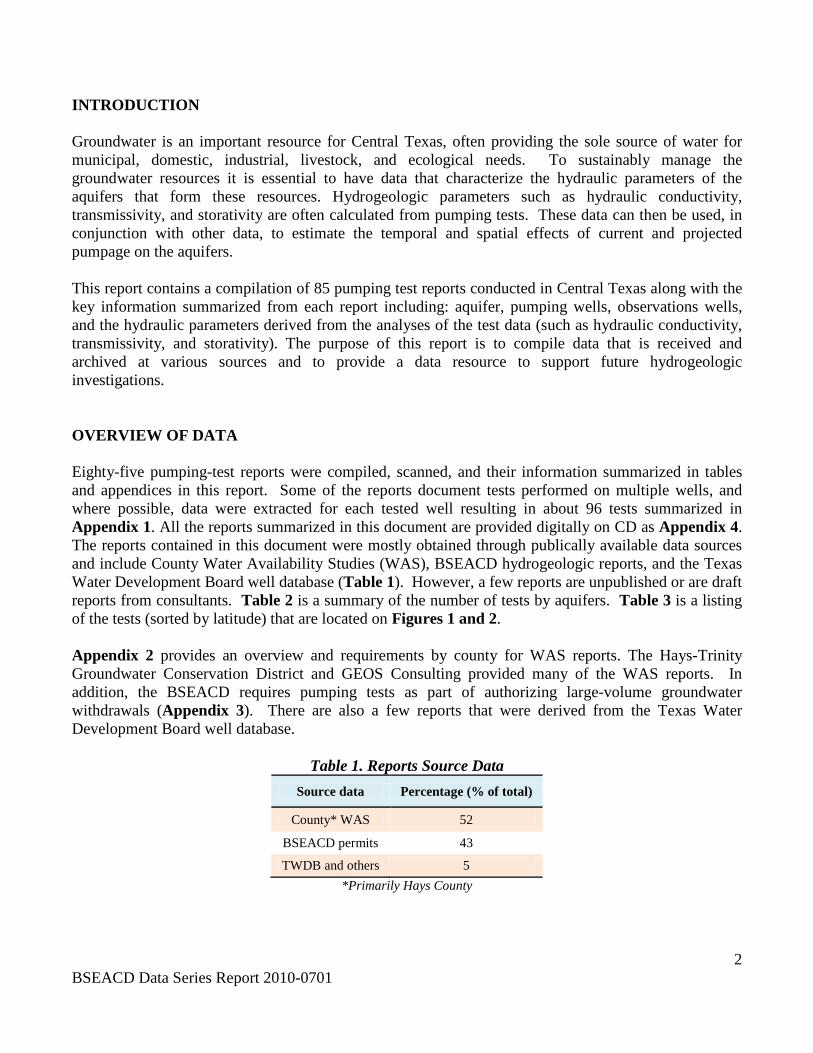
INTRODUCTION Groundwater is an important resource for Central Texas, often providing the sole source of water for municipal, domestic, industrial, livestock, and ecological needs. To sustainably manage the groundwater resources it is essential to have data that characterize the hydraulic parameters of the aquifers that form these resources. Hydrogeologic parameters such as hydraulic conductivity, transmissivity, and storativity are often calculated from pumping tests. These data can then be used, in conjunction with other data, to estimate the temporal and spatial effects of current and projected pumpage on the aquifers. This report contains a compilation of 85 pumping test reports conducted in Central Texas along with the key information summarized from each report including: aquifer, pumping wells, observations wells, and the hydraulic parameters derived from the analyses of the test data (such as hydraulic conductivity, transmissivity, and storativity). The purpose of this report is to compile data that is received and archived at various sources and to provide a data resource to support future hydrogeologic investigations. OVERVIEW OF DATA Eighty-five pumping-test reports were compiled, scanned, and their information summarized in tables and appendices in this report. Some of the reports document tests performed on multiple wells, and where possible, data were extracted for each tested well resulting in about 96 tests summarized in Appendix 1. All the reports summarized in this document are provided digitally on CD as Appendix 4. The reports contained in this document were mostly obtained through publically available data sources and include County Water Availability Studies (WAS), BSEACD hydrogeologic reports, and the Texas Water Development Board well database (Table 1). However, a few reports are unpublished or are draft reports from consultants. Table 2 is a summary of the number of tests by aquifers. Table 3 is a listing of the tests (sorted by latitude) that are located on Figures 1 and 2. Appendix 2 provides an overview and requirements by county for WAS reports. The Hays-Trinity Groundwater Conservation District and GEOS Consulting provided many of the WAS reports. In addition, the BSEACD requires pumping tests as part of authorizing large-volume groundwater withdrawals (Appendix 3). There are also a few reports that were derived from the Texas Water Development Board well database.
Table 1. Reports Source Data Source data Percentage (% of total)
County* WAS 52
BSEACD permits 43
TWDB and others 5 *Primarily Hays County
3
BSEACD Data Series Report 2010-0701
Table 2. Summary of Tests by Aquifer
Aquifer No. Tests*
Edwards 42**
Upper Trinity 4
Middle Trinity 35
Lower Trinity 11
Ellenburger-San Saba 1
Simsboro (Carrizo-Wilcox) 1
Wilcox (Upper Calvert Bluff) 1
Sum 95*
* approximate number, some reports have multiple tests **includes 1 Edwards-Upper Trinity hybrid completion
Photograph of water-level monitoring with an e-line during KBDJ Quarry Middle Trinity pumping test.
4
BSEACD Data Series Report 2010-0701
Table 3. General Inventory of Pumping Test Reports and Map Key. Wells are sorted by latitude.
Map ID Name Aquifer
1 Lantana Ridge Middle Trinity
2 Bridlewood No. 1 Middle Trinity
3 Bridlewood
(West Windmill)
Edwards
4 Cielo Middle Trinity
5 Little Arkansas Upper Trinity
6 Las Misiones Middle Trinity
7 Hermosa Upper Trinity
8 River Mountain
Upper & Middle Trinity
9 Pinnacle Ridge Middle Trinity
10 Kyle No.4 Edwards
11 Mustang Ranch Middle Trinity
12 Synergy Ranch
Wilcox (Upper;
Calvert Bluff)
13 Monarch No. 4 Edwards
14 Plum Creek (Tecon) No. 3 Edwards
15 Goforth No.5 Edwards
16 Centex Well 415 Edwards
17 Ruby Ranch No. 5 Middle Trinity
18 Ruby Ranch No. 4 Edwards
19 Running
Rope/Sierra West
Middle Trinity
20 Penbur Well Edwards
21 Centex Well 414 Edwards
22 Kelly's Country Middle Trinity
23 Buda No. 3 Edwards
24 Running Rope Upper Trinity
25 Ruby Ranch No. 3 Edwards
26 Plum Creek (Tecon) No. 1 Edwards
27 Goforth No.4 Edwards
28 Ruby Ranch No. 1 Edwards
29 Buda No. 1 Edwards
30 Buda No. 2 Edwards
31 High View Middle Trinity
32 Riverwild Middle Trinity
33 Venado Ranch Middle Trinity
34 Higginbotham Well Edwards
35 Hunter Edwards
36 Creek Ridge Simsboro (Carrizo-Wilcox)
37 Mt. Sharp Lower Trinity
38 Mandola Middle Trinity
39 Leisurewoods No. 6 Edwards
40 Oak Forest Middle Trinity
41 Cimarron Well No. 2 Edwards
42 Porter No. 1 Edwards
43 Huntington Estates No. 1 Edwards
44 Creedmoor-Maha Site 1 Edwards
45 Elliott Ranch No. 1 Edwards
46 Cimarron Well No. 3 Edwards
47 Elliott Ranch No. 2 Edwards
48 Porter No. 2 Edwards
49 Faith Dunn Ranches Middle Trinity
50 Oaks at Gatlin Creek (TW-1) Middle Trinity
51 Heatherwood Middle Trinity
52 Creedmoor-Maha Site 2 Edwards
53 Homestead at Gatlin Creek Middle Trinity
54 Manchaca Optimist Club Edwards
55 Onion Creek Golf No. 3 Edwards
56 Onion Creek Golf No. 1 & 2 Edwards
57 Shady Hollow Well No. 1 Edwards
58 Brushy Top 2006 (RBT 1A) Middle Trinity
59 Shady Hollow Well No. 2 Edwards
60 Kennedy Ranch Middle Trinity
61 Brushy Top 2005 No. 3 Lower Trinity
62 Brushy Top 2006 (RBT 3A) Lower Trinity
63 Chama Trace Pumping Well Lower Trinity
64 Roger Hanks Lower Trinity
65 Dos Lagos Middle Trinity
66 Valley Verde Middle Trinity
67 Foster Ranch/Belterra Lower Trinity
68 Shady Valley Middle Trinity
69 Capital Soccer Edwards
70 Polo Club Lower Trinity
71 Independence Park Edwards
72 Sunset Valley Edwards
73 Goldenview Middle Trinity
74 Freescale (Well No. 2)
Middle and Lower Trinity
75 Freescale (Well No. 1) Middle Trinity
76 Walnut Springs
Ellenburger-San Saba
77 St. Andrews No. 3 Middle Trinity
78 St. Andrews No. 2 Lower Trinity
79 Carr Well (Robert Small) Middle Trinity
80 Fronterra Lower Trinity
81 Deerfield Estates Middle Trinity
82 Westridge Middle Trinity
83 Heather Hills Lower Trinity
84 Forrister Well Edwards
85 Rudy's Bar-B-Q Edwards
86 Driskill Hotel Well Lower Trinity
87 Walking W Ranch Middle Trinity
88 Woodlands Middle Trinity
89 EMS Well Middle Trinity
5 BSEACD Data Series Report 2010-0701
Figure 1. General Map of Major Aquifers and Location of Tests. Major aquifers basemap from the TWDB.
6 BSEACD Data Series Report 2010-0701
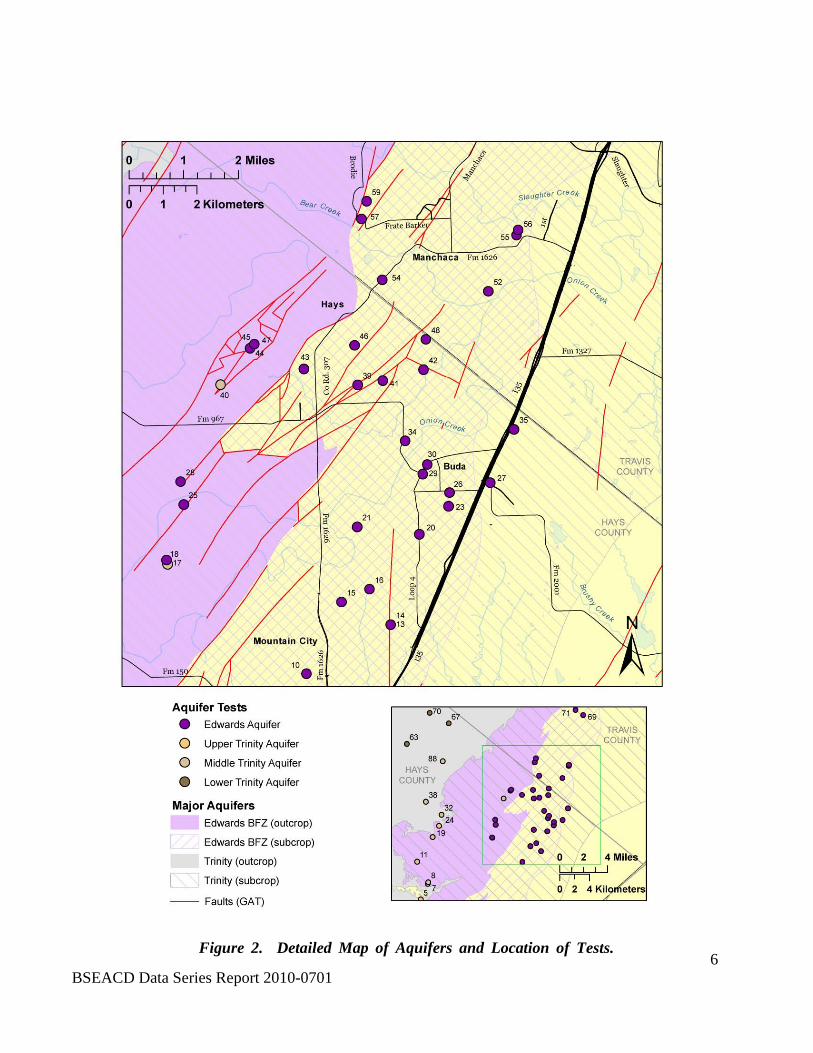
Figure 2. Detailed Map of Aquifers and Location of Tests.
7 BSEACD Data Series Report 2010-0701
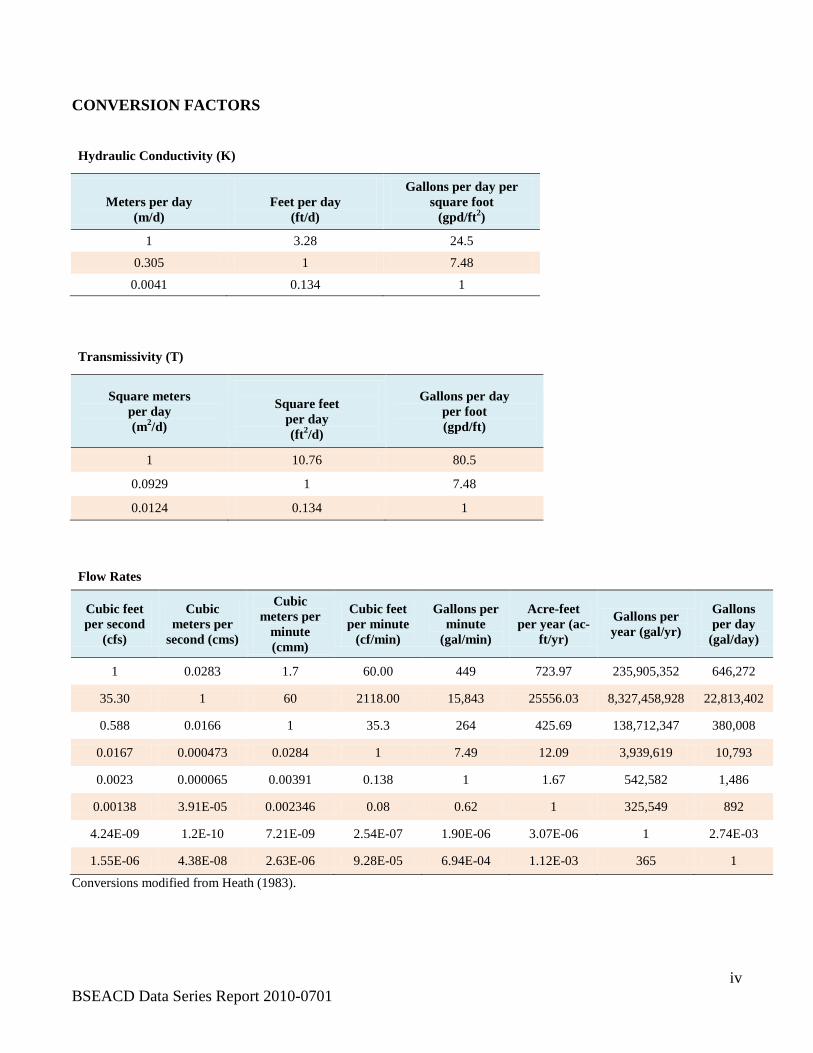
HYDRAULIC PARAMETERS An aquifer performs two primary functions: to store (porosity) and to transmit (permeability) water (Driscoll, 1986). Water-availability studies typically determine or estimate these aquifer characteristics with pumping-test data. Pumping tests are a common method for determining an aquifer’s hydraulic parameters, including storativity (S), transmissivity (T), and hydraulic conductivity (K). Appendix 1 contains a detailed summary of information and hydraulic parameters from each pumping test in this report. Hydraulic Conductivity and Transmissivity Hydraulic conductivity (K) is a measure of the volume of water that can move through porous media in a given interval of time under a given hydraulic gradient and is expressed in units of feet per day (ft/day) (Kruseman and Ridder, 1992). This property is primarily a function of the size and shape of pores and their interconnection. Transmissivity (T), which is the product of K multiplied by the saturated thickness of the aquifer, is the term commonly used in groundwater investigations and is expressed in terms of gallons per day per foot (gpd/ft). This term reflects the transmission capability of the entire thickness of an aquifer (Driscoll, 1986). Tables 4 through 7 summarize results for hydraulic conductivity and transmissivity presented in Appendix 1. Figures 3 and 4 are visual displays of the data by aquifer. All data summarized here were derived from the average of reported transmissivity values, or in some reports or tests the single value reported to be most reasonable (hereafter reported as “average”). Hydraulic conductivity was derived in this report by dividing the average transmissivity by the thickness of the aquifer as reported, or as estimated in other publications. Figure 3 is a box plot of the range of transmissivity by aquifer. The data indicate that the values from each aquifer overlap in range. However, the median values indicate the Edwards Aquifer has the highest permeability followed by the Middle Trinity, Lower Trinity, and Upper Trinity Aquifers. The Upper Trinity Aquifer has relatively few tests and is presented here for comparison. The T values presented in Figure 4 are within the range of karst limestone, limestone and dolomite and sandstone reported in Freeze and Cheery (1979). Table 4. Summary of Average Hydraulic Conductivity Values by Aquifer
Table 6. Summary of Average Transmissivity Values by Aquifer
Edwards T
(gpd/ft) Upper Trinity T
(gpd/ft) Middle Trinity T
(gpd/ft) Lower Trinity T
(gpd/ft) Min 97 60 225 100 Max 774,565 231 12,716 10,000 Average 71,849 144 3,988 2,214 Median 15,000 143 2,275 1,500 Q1 (25%) 4,443 80 988 340 Q3 (75%) 70,250 208 6,300 2,750 n (count) 40 4 34 11
Table 7. Summary of Transmissivity Values of Aquifers with Sparse Data
Aquifer Average Transmissivity (gpd/ft)
Ellenburger-San Saba 3
Simsboro (Carrizo-Wilcox) 750
Wilcox (Upper; Calvert Bluff) 7,500
Storativity Storativity (S) is a dimensionless measure (coefficient) of the volume of water that can move into or out of a unit area of porous material, relative to a unit rise or drop of head. In effect, S is a measure of the percentage of total aquifer volume (aquifer matrix plus contained water) that can be released. The magnitude of S is highly influenced by the aquifer setting (i.e. confined or unconfined) and the compressibility of the aquifer material. Tables 8 and 9 summarize storativity results from Appendix 1. Figure 3 is a visual display of S by aquifer. All data summarized are the average of calculated storativity values, or the value reported to be most reasonable, from each report. About 60% of all tests in this document report storativity values estimated from the literature rather than being directly calculated; those values are indicated in Appendix 1 with an “e.” The primary reason for estimating the storage coefficients from the literature is due to a lack of measureable drawdown in observations wells, or the lack of observation
9 BSEACD Data Series Report 2010-0701
wells. Only S data derived from calculations using observation wells (i.e. no estimates from the literature) are presented in the tables and figures. Figure 3 shows that S values range from 0.1 to 0.00001, with the interquartile range and median values indicating predominantly confined conditions where S < 0.001 (Weight and Sonderegger, 2001). Some S values in Figure 3 fall in the range of leaky or semi-confined aquifer systems. Owing to the limits of the compressibility of water, storativity values less than 10-6 are considered to be impossible in porous media aquifers (Weight and Sonderegger, 2001). The median S value for the Edwards was the highest, followed by the Middle Trinity, Lower Trinity, and the Upper Trinity Aquifers. However, there is relatively limited data from the Lower and Upper Trinity Aquifers. Table 8. Summary of Average Storativity Values by Aquifer
Edwards S (all data)
Edwards S (calc)
Upper Trinity S (all data)
Upper Trinity S
(calc)
Middle Trinity S (all data)
Middle Trinity S
(calc)
Lower Trinity S (all data)
Lower Trinity S
(calc)
Min 6.29E-05 2.00E-04 1.0E-05 1.00E-05 1.85E-06 1.85E-06 4.00E-06 4.00E-06
Max 1.00E-01 1.00E-01 5.00E-03 1.30E-05 4.00E-02 3.40E-02 5.00E-03 5.00E-03
Average 6.10E-03 8.07E-03 1.26E-03 1.17E-05 3.56E-03 2.60E-03 8.40E-04 1.69E-03
Median 7.00E-04 8.50E-04 1.25E-05 1.20E-05 1.30E-04 5.00E-05 1.00E-04 5.00E-05
Table 9. Summary of Storativity Values of Aquifers with Sparse Data Aquifer Reported Storativity Calculated Storativity
Ellenburger-San Saba 9.00E-05 9.00E-05
Simsboro (Carrizo-Wilcox) 3.00E-04 nd
Wilcox (Upper; Calvert Bluff) 3.00E-04 3.00E-04 nd = no data
10 BSEACD Data Series Report 2010-0701
Fig
ure
3. B
ox a
nd W
hisk
er P
lot o
f Tra
nsm
issi
vity
and
Sto
rativ
ity b
y A
quife
r. Th
e ra
nge
in st
orat
ivity
val
ues f
or
conf
ined
, sem
i-con
fined
, and
unc
onfin
ed a
re a
ppro
xim
ate
and
deri
ved
from
Wei
ght a
nd S
onde
regg
er (2
001)
.
11 BSEACD Data Series Report 2010-0701
Figure 4. Comparison of K Values in Compiled Reports with Published Ranges in K Values. Figure modified from Freeze and Cheery (1979) showing hydraulic conductivity for different rock and sediment types.
12 BSEACD Data Series Report 2010-0701
ACKNOWLEDGMENTS This compilation represents a tremendous amount of information and work by many consulting and agency geologists, hydrogeologists, and engineers. Their collective work and information are valued and appreciated. For this compilation, Douglas A. Wierman, P.G. provided hard copies of Water Availability Studies (WAS) that the Hays-Trinity Groundwater Conservation District has compiled over the years. John K. Mikels, P.G. (GEOS Consulting) also provided numerous pumping test reports—some of the tests that he provided would never have reached the public if not for his efforts. Ronald Fieseler, P.G. also provided several pumping tests from Blanco County. Finally, over the years various District staff have helped plan, execute, and review many of the pumping tests from the BSEACD included in this compilation. Those individuals include: Nico Hauwert, Ph.D., P.G., Joe Beery, Brian B. Hunt, P.G., Brian A. Smith, Ph.D., P.G., Ronald Fieseler, P.G., Mark Mathis, Stefani Campbell, and Beckie Morris. Special thanks to Robin Gary for assisting the authors in making the maps (Figures 1 and 2). REFERENCES
Driscoll, Fletcher R., 1986, Groundwater and Wells. Second Edition. Johnson Screens, St. Paul, Minnesota. Pp. 1089. Freeze R., and J. Cherry, 1979, Groundwater. Prentice-Hall, Englewood Cliffs, Prentice-Hall, New Jersey, 604 p. Heath, R., 1983, Basic Ground-Water Hydrology. U.S. Geological Survey Water-Supply Paper 2220, United States Government Printing Office, Denver, Colorado, 84 p. Kruseman, G.P. and N.A. de Ridder, 1992, Analysis and Evaluation of Pumping Test Data, second edition, International Institute for Land Reclamation and Improvement (ILRI) Publication 47, Netherlands, 377 p. Weight, W.D., and J.L. Sonderegger, 2001, Manual of Applied Field Hydrogeology, McGraw-Hill, 608 p.
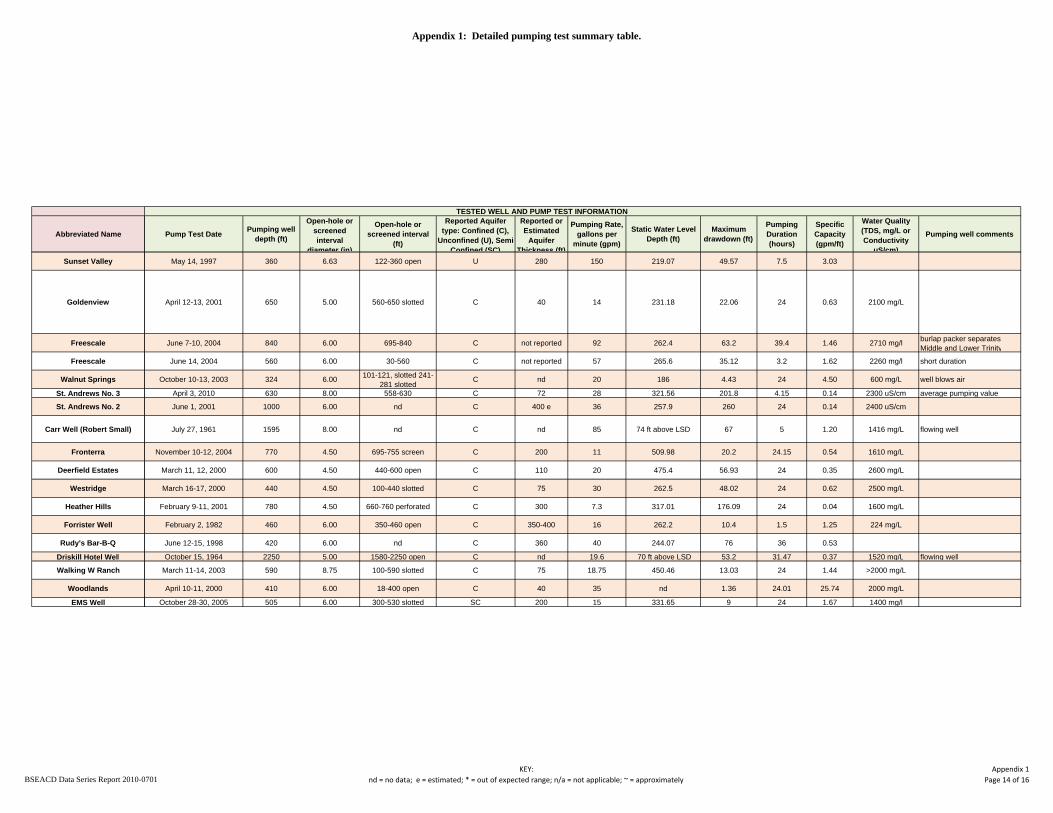
Appendix 1
Detailed Pumping Test Summary Table
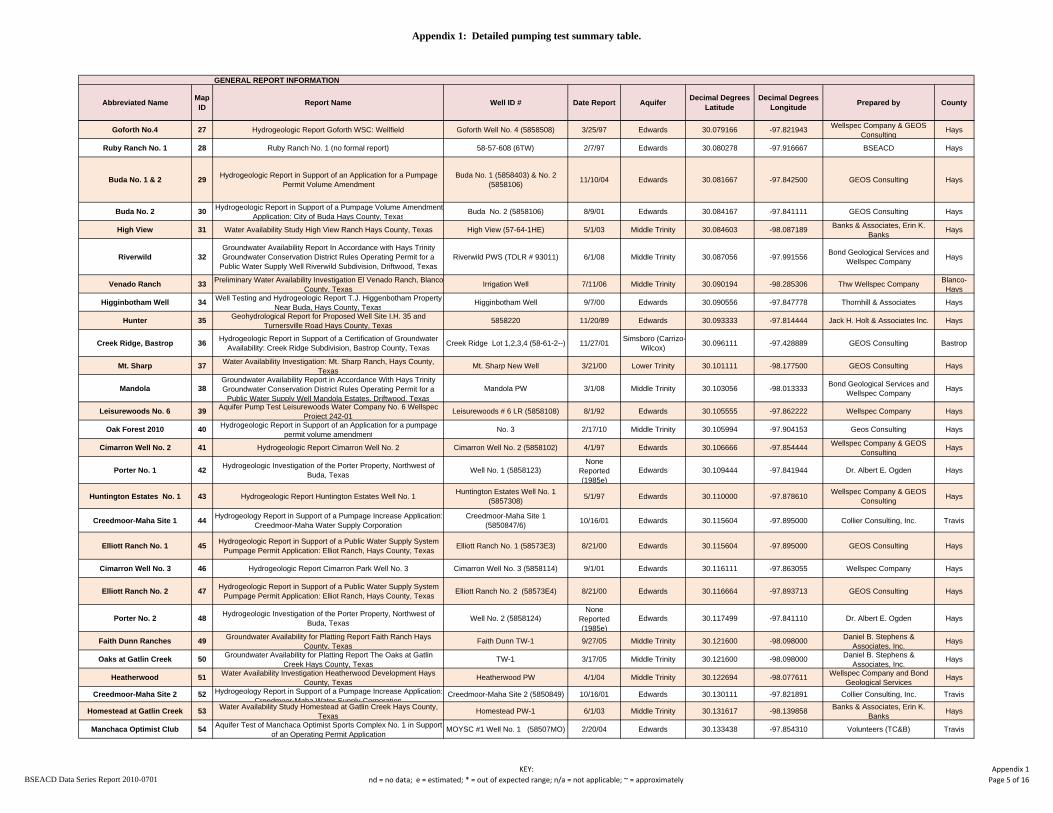
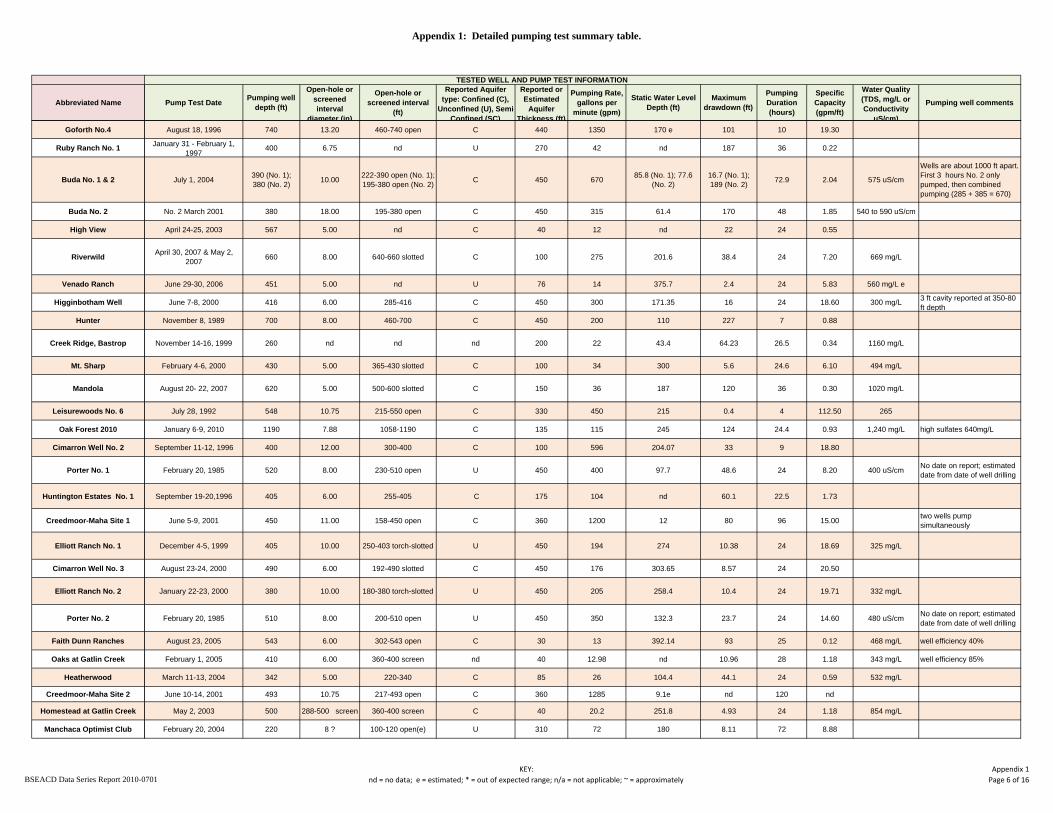
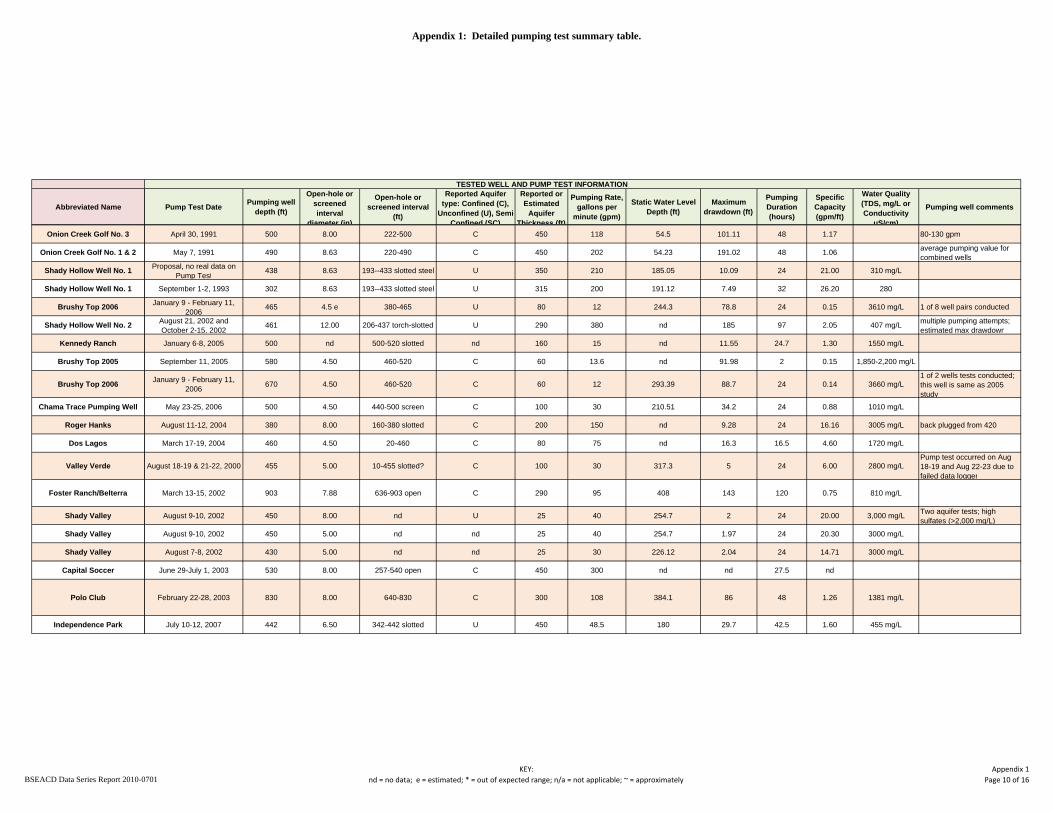
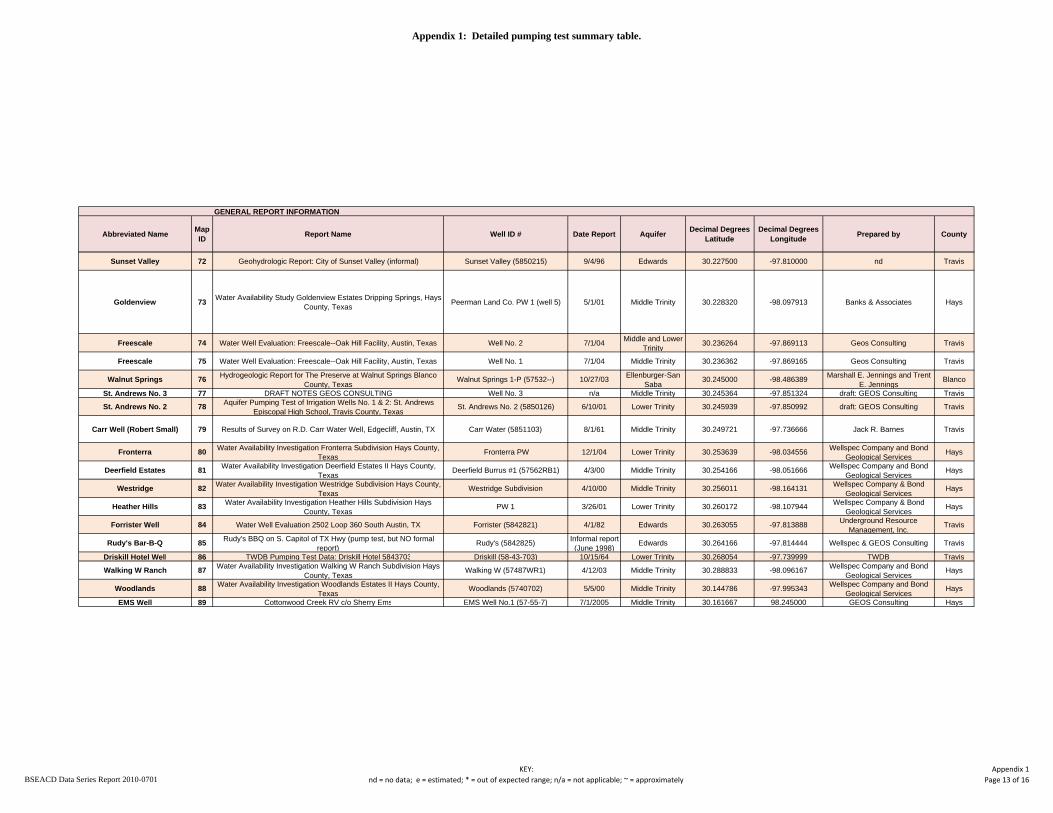
Appendix 1: Detailed pumping test summary table.
GENERAL REPORT INFORMATION
Abbreviated Name Map ID Report Name Well ID # Date Report Aquifer Decimal Degrees
Bridlewood 2 Ground-Water Resource Investigation for the Bridlewood Ranches Development Hays County, Texas Bridlewood No. 1 (68088--) 4/1/03 Middle Trinity 29.895567 -98.059483 LBG-Guyton Associates Hays
Bridlewood 3 Ground-Water Resource Investigation for the Bridlewood Ranches Development Hays County, Texas Bridlewood West Windmill 4/1/03 Edwards 29.902267 -98.074267 LBG-Guyton Associates Hays
Cielo 4 Water Availability Study Cielo Ranch A Proposed Subdivision in Hays County, Texas (has updates by JM)
Little Arkansas 5 Water Availability Investigation: Little Arkansas Tract, Hays County, Texas
Little Arkansas Well 1/2/00 Upper Trinity Aquifer
29.984011 -98.021742 GEOS Consulting Hays
Las Misiones 6 Water Availability Certification Las Misiones Hill Country Estates Wimberley, Hays County, Texas
Las Misiones Well #3 6/1/05 Middle Trinity 29.986472 -98.160972 Premier Hydro Hays
Hermosa 7 Water Availability Study Hermosa Paloma Subdivision Hays County, Texas
Hermosa PW-1 1/1/06 Upper Trinity Aquifer
30.003194 -98.011444 Banks & Associates, Erin K. Banks
Hays
River Mountain Ranch 8 Water Availability Investigation: River Mountain Ranch-Section 6, Phase 2 Hays County, Texas RMR Test well (5764903) 7/27/01 Upper & Middle
Kyle No.4 10 Well Testing and Hydrogeologic Report: City of Kyle Well No. 4 Hays County, Texas
Kyle No. 4 Well with Plum Creek (5857916) (--9N1) 1/1/98 Edwards 30.028830 -97.878740 GEOS Consulting, Wellspec
Company, Kiva Productions Hays
Kyle No.4 10 Hydrogeologic Report in Support of an Application for a Class B Conditional Pumpage Permit Kyle No. 4 Well (5857916) 11/17/08 Edwards 30.028830 -97.878740 GEOS Consulting Hays
Mustang (True) Ranch 11 Groundwater Availability Study of Mustang Ranch Subdivision Mustang Ranch 54A (57638--) 6/24/08 Middle Trinity 30.030278 -98.026389 Wet Rock Groundwater Services, L.L.C
Hays
Synergy Ranch 12 Certification of Groundwater Availability For Platting & Supporting Hydrogeological Report: Synergy Ranch, Bastrop County, Texas Synergy Ranch Lot 26; (58-62-705) 6/15/07 Wilcox (Upper;
Monarch #4 13 Well Testing and Hydrogeologic Report - Monarch Utilities, Inc., Plum Creek Water System, Hays County, Texas
Monarch #4 Well (5858708) 7/23/07 Edwards 30.041666 -97.852777 Thornhill Group, Inc. Hays
Plum Creek (Tecon) No. 3 14 Plum Creek Water System Well #3 Hydrogeologic Report PCWS Well #3 (5858708) 9/14/03 Edwards 30.041666 -97.852777 Wet Rock Groundwater Services
Hays
Goforth No.5 15 Hydrogeologic Report in Support of a Pumpage Permit Application: Goforth W.S.C. No. 5 Well, Hays County, Texas
Ruby Ranch No. 4 18 Hydrogeologic Report in Support of a Pumpage Volume Amendment Application: TWC Enterprises/ Ruby Ranch, Hays County, Texas 58575TWC4 5857512 9/10/01 Edwards 30.058611 -97.921110 GEOS Consulting Hays
Running Rope/Sierra West 19 Water Availability Investigation: Running Rope Estates (Sierra West Sec. 2A) Hays County, Texas Sierra West No. 2 (58574RR1) 5/19/00 Middle Trinity 30.059722 -98.004444 GEOS Consulting Hays
Penbur Well 20 Penbur Farms Water Well No. 1 Penbur Well No. 1 (5858410) 9/1/95 Edwards 30.065628 -97.843776 Wellspec Company Hays
Centex 21 Hydrogeologic Study Report 5858414 12/1/03 Edwards 30.067777 -97.862777 RMT, Inc. Hays
Centex Well 414 21 Geohydrologic Repot Centex 5858414 8/1/93 Edwards 30.067777 -97.862777 R.W. Harden & Associates, Inc. Hays
Centex Well 414 21 Geohydrologic Report Centex 5858414 4/1/91 Edwards 30.067777 -97.862777 R.W. Harden & Associates, Inc. Hays
Kelly's Country 22 Water Availability Study Kelly's Country A Proposed Subdivision in Hays County, Texas
Kelly's Country (57644KC) 10/1/04 Middle Trinity 30.068917 -98.092333 Banks & Associates, Erin K. Banks
Hays
Buda No. 3 23 Hydrogeologic Report in Support of a Pumpage Volume Amendment Application: City of Buda Hays County, Texas
High View 31 Water Availability Study High View Ranch Hays County, Texas High View (57-64-1HE) 5/1/03 Middle Trinity 30.084603 -98.087189 Banks & Associates, Erin K. Banks
Hays
Riverwild 32Groundwater Availability Report In Accordance with Hays Trinity Groundwater Conservation District Rules Operating Permit for a
Public Water Supply Well Riverwild Subdivision, Driftwood, TexasRiverwild PWS (TDLR # 93011) 6/1/08 Middle Trinity 30.087056 -97.991556 Bond Geological Services and
Wellspec Company Hays
Venado Ranch 33 Preliminary Water Availability Investigation El Venado Ranch, BlancoCounty, Texas
Irrigation Well 7/11/06 Middle Trinity 30.090194 -98.285306 Thw Wellspec Company Blanco-Hays
Higginbotham Well 34 Well Testing and Hydrogeologic Report T.J. Higgenbotham Property Near Buda, Hays County, Texas
Higginbotham Well 9/7/00 Edwards 30.090556 -97.847778 Thornhill & Associates Hays
Hunter 35 Geohydrological Report for Proposed Well Site I.H. 35 and Turnersville Road Hays County, Texas
5858220 11/20/89 Edwards 30.093333 -97.814444 Jack H. Holt & Associates Inc. Hays
Creek Ridge, Bastrop 36 Hydrogeologic Report in Support of a Certification of Groundwater Availability: Creek Ridge Subdivision, Bastrop County, Texas Creek Ridge Lot 1,2,3,4 (58-61-2--) 11/27/01 Simsboro (Carrizo-
Cimarron Well No. 2 41 Hydrogeologic Report Cimarron Well No. 2 Cimarron Well No. 2 (5858102) 4/1/97 Edwards 30.106666 -97.854444 Wellspec Company & GEOS Consulting
Hays
Porter No. 1 42 Hydrogeologic Investigation of the Porter Property, Northwest of Buda, Texas Well No. 1 (5858123)
None Reported (1985e)
Edwards 30.109444 -97.841944 Dr. Albert E. Ogden Hays
Huntington Estates No. 1 43 Hydrogeologic Report Huntington Estates Well No. 1 Huntington Estates Well No. 1 (5857308) 5/1/97 Edwards 30.110000 -97.878610 Wellspec Company & GEOS
Consulting Hays
Creedmoor-Maha Site 1 44 Hydrogeology Report in Support of a Pumpage Increase Application: Creedmoor-Maha Water Supply Corporation
Creedmoor-Maha Site 1 (5850847/6) 10/16/01 Edwards 30.115604 -97.895000 Collier Consulting, Inc. Travis
Elliott Ranch No. 1 45 Hydrogeologic Report in Support of a Public Water Supply System Pumpage Permit Application: Elliot Ranch, Hays County, Texas Elliott Ranch No. 1 (58573E3) 8/21/00 Edwards 30.115604 -97.895000 GEOS Consulting Hays
Cimarron Well No. 3 46 Hydrogeologic Report Cimarron Park Well No. 3 Cimarron Well No. 3 (5858114) 9/1/01 Edwards 30.116111 -97.863055 Wellspec Company Hays
Elliott Ranch No. 2 47 Hydrogeologic Report in Support of a Public Water Supply System Pumpage Permit Application: Elliot Ranch, Hays County, Texas Elliott Ranch No. 2 (58573E4) 8/21/00 Edwards 30.116664 -97.893713 GEOS Consulting Hays
Porter No. 2 48 Hydrogeologic Investigation of the Porter Property, Northwest of Buda, Texas Well No. 2 (5858124)
None Reported (1985e)
Edwards 30.117499 -97.841110 Dr. Albert E. Ogden Hays
Faith Dunn Ranches 49 Groundwater Availability for Platting Report Faith Ranch Hays County, Texas
Faith Dunn TW-1 9/27/05 Middle Trinity 30.121600 -98.098000 Daniel B. Stephens & Associates, Inc.
Hays
Oaks at Gatlin Creek 50 Groundwater Availability for Platting Report The Oaks at Gatlin Creek Hays County, Texas
TW-1 3/17/05 Middle Trinity 30.121600 -98.098000 Daniel B. Stephens & Associates, Inc.
Hays
Heatherwood 51 Water Availability Investigation Heatherwood Development Hays County, Texas
Heatherwood PW 4/1/04 Middle Trinity 30.122694 -98.077611 Wellspec Company and Bond Geological Services
Hays
Creedmoor-Maha Site 2 52 Hydrogeology Report in Support of a Pumpage Increase Application: Creedmoor-Maha Water Supply Corporation
Creedmoor-Maha Site 2 (5850849) 10/16/01 Edwards 30.130111 -97.821891 Collier Consulting, Inc. Travis
Homestead at Gatlin Creek 53 Water Availability Study Homestead at Gatlin Creek Hays County, Texas
nd = no data; e = estimated; * = out of expected range; n/a = not applicable; ~ = approximatelyAppendix 1Page 8 of 16
Appendix 1: Detailed pumping test summary table.
GENERAL REPORT INFORMATION
Abbreviated Name Map ID Report Name Well ID # Date Report Aquifer Decimal Degrees
LatitudeDecimal Degrees
Longitude Prepared by County
Onion Creek Golf No. 3 55 Geohydrological Report for Onion Creek Wells Manchaca, Texas OC-3 (5850836) 7/15/91 Edwards 30.144999 -97.813055 Jack H. Holt & Associates Inc. Travis
Onion Creek Golf No. 1 & 2 56 Geohydrological Report for Onion Creek Wells Manchaca, Texas OC-1 (5850835) OC-2 (5850853)
7/15/91 Edwards 30.146388 -97.812500 Jack H. Holt & Associates Inc. Travis
Shady Hollow Well No. 1 57 Results of Test Well Installation Shady Hollow Estates Water Supply System
Shady Hollow Estates Well No. 1 (5850731)
7/1/83 Edwards 30.149721 -97.860555 Underground Resource Management, Inc.
Travis
Shady Hollow Well No. 1 57 Hydrogeologic Report Shady Hollow Well No. 1 Shady Hollow Well No. 1 (5850731) 11/1/93 Edwards 30.149721 -97.860555 Wellspec Company Travis
Brushy Top 2006 58 Groundwater Availability Study Ranches of Brushy Top Subdivision Blanco County, Texas
Shady Hollow Well No. 2 59 Installation and Pumping Tests: Shady Hollow Well No. 2 Shady Hollow Well No. 2 (5850743) 2/4/03 Edwards 30.154444 -97.858888 GEOS Consulting Travis
Kennedy Ranch 60 Water Availability Investigation Kennedy's Ranch Subdivision Hays County, Texas
Kennedy Ranch 2/1/05 Middle Trinity 30.156333 -98.181694 Wellspec Company and Bond Geological Services
Hays
Brushy Top 2005 61 Ground Water Availability Assessment Brushy Top Ranch Subdivision
Brushy Top #3 9/11/05 Lower Trinity 30.162723 -98.415676 William Feathergail Wilson Blanco
Brushy Top 2006 62 Groundwater Availability Study Ranches of Brushy Top Subdivision Blanco County, Texas RBT 3A 2/21/06 Lower Trinity 30.162723 -98.415676 Bond Geological Services Blanco
Chama Trace Pumping Well 63 Water Availability Investigation Chama Trace Subdivision Hays County, Texas
Chama Trace Pumping Well 6/1/06 Lower Trinity 30.173611 -98.039111 Wellspec Company and Bond Geological Services
Hays
Roger Hanks 64 Water Availability Investigation Roger Hanks Business Park Hays County, Texas
Roger Hanks Business Park Well No. 1 (5756480)
9/1/04 Lower Trinity 30.184166 -98.146110 Wellspec Company& Bond Geological Services
Hays
Dos Lagos 65 Water Availability Investigation Dos Lagos Subdivision Hays County, Texas
Dos Lagos PW-1 (5755604) 4/1/04 Middle Trinity 30.193610 -98.165555 Wellspec Company and Bond Geological Services
Hays
Valley Verde 66 Water Availability Investigation Valley Verde Subdivision Hays County, Texas Valley Verde Test Well 9/20/00 Middle Trinity 30.196750 -98.216944 Wellspec Company & Bond
Geological Services Hays
Foster Ranch/Belterra 67 Test Well Drilling and Preliminary Groundwater Availability Study Mak Foster Ranch, L.P. Belterra/ Foster Ranch Hays County, Texas Foster Ranch Well No. 1 (5849413) 4/12/02 Lower Trinity 30.198055 -97.980278 Wellspec Company & Bond
Geological Services Hays
Shady Valley 68 Water Availability Investigation Shady Valley Subdivision Units II, III, and IV, Hays County, Texas
PW 2&3 (PW-4) 9/12/02 Middle Trinity 30.202200 -98.219700 Wellspec Company and Bond Geological Services
Hays
Shady Valley 68 Water Availability Investigation Shady Valley Subdivision Unites II, III, and IV Hays County, Texas (Sierra West Sec. 2A)
PW 2&3; (57554PH1 & 2) 9/12/02 Middle Trinity 30.202222 -98.219722 Wellspec Company and Bond Geological Services
Hays
Shady Valley 68 Water Availability Investigation Shady Valley Subdivision Unites II, III, and IV Hays County, Texas (Sierra West Sec. 2A)
PW-4; (57551PH1) 9/12/02 Middle Trinity 30.202222 -98.219722 Wellspec Company and Bond Geological Services
Hays
Capital Soccer 69 Preliminary Hydrogeologic Report: Capital Soccer Club No. 1 Well 5850231 7/3/03 Edwards 30.206670 -97.791940 GEOS Consulting Travis
Polo Club 70 Water Availability Investigation , The Polo Club, Hays County, Texas PC-2 6/27/03 Lower Trinity 30.211000 -98.006833 Wellspec Company & Bond Geological Services Hays
Independence Park 71 Hydrogeologic Report in Support of an Application for a Pumpage Permit: Independence Park Irrigation Well
Indp. Park (5850234) 9/21/07 Edwards 30.213056 -97.802500 GEOS Consulting Hays
BSEACD Data Series Report 2010-0701KEY:
nd = no data; e = estimated; * = out of expected range; n/a = not applicable; ~ = approximatelyAppendix 1Page 9 of 16
Appendix 1: Detailed pumping test summary table.
Abbreviated Name
Onion Creek Golf No. 3
Onion Creek Golf No. 1 & 2
Shady Hollow Well No. 1
Shady Hollow Well No. 1
Brushy Top 2006
Shady Hollow Well No. 2
Kennedy Ranch
Brushy Top 2005
Brushy Top 2006
Chama Trace Pumping Well
Roger Hanks
Dos Lagos
Valley Verde
Foster Ranch/Belterra
Shady Valley
Shady Valley
Shady Valley
Capital Soccer
Polo Club
Independence Park
TESTED WELL AND PUMP TEST INFORMATION
Pump Test Date Pumping well depth (ft)
Open-hole or screened interval
diameter (in)
Open-hole or screened interval
(ft)
Reported Aquifer type: Confined (C),
Unconfined (U), Semi-Confined (SC)
Reported or Estimated
Aquifer Thickness (ft)
Pumping Rate, gallons per
minute (gpm)
Static Water Level Depth (ft)
Maximum drawdown (ft)
Pumping Duration (hours)
Specific Capacity (gpm/ft)
Water Quality (TDS, mg/L or Conductivity
uS/cm)
Pumping well comments
April 30, 1991 500 8.00 222-500 C 450 118 54.5 101.11 48 1.17 80-130 gpm
May 7, 1991 490 8.63 220-490 C 450 202 54.23 191.02 48 1.06 average pumping value for combined wells
September 11, 2005 580 4.50 460-520 C 60 13.6 nd 91.98 2 0.15 1,850-2,200 mg/L
January 9 - February 11, 2006 670 4.50 460-520 C 60 12 293.39 88.7 24 0.14 3660 mg/L
1 of 2 wells tests conducted; this well is same as 2005 study
May 23-25, 2006 500 4.50 440-500 screen C 100 30 210.51 34.2 24 0.88 1010 mg/L
August 11-12, 2004 380 8.00 160-380 slotted C 200 150 nd 9.28 24 16.16 3005 mg/L back plugged from 420
March 17-19, 2004 460 4.50 20-460 C 80 75 nd 16.3 16.5 4.60 1720 mg/L
August 18-19 & 21-22, 2000 455 5.00 10-455 slotted? C 100 30 317.3 5 24 6.00 2800 mg/LPump test occurred on Aug 18-19 and Aug 22-23 due to failed data logger
March 13-15, 2002 903 7.88 636-903 open C 290 95 408 143 120 0.75 810 mg/L
August 9-10, 2002 450 8.00 nd U 25 40 254.7 2 24 20.00 3,000 mg/L Two aquifer tests; high sulfates (>2,000 mg/L)
June 29-July 1, 2003 530 8.00 257-540 open C 450 300 nd nd 27.5 nd
February 22-28, 2003 830 8.00 640-830 C 300 108 384.1 86 48 1.26 1381 mg/L
July 10-12, 2007 442 6.50 342-442 slotted U 450 48.5 180 29.7 42.5 1.60 455 mg/L
BSEACD Data Series Report 2010-0701KEY:
nd = no data; e = estimated; * = out of expected range; n/a = not applicable; ~ = approximatelyAppendix 1
Page 10 of 16
Appendix 1: Detailed pumping test summary table.
Abbreviated Name
Onion Creek Golf No. 3
Onion Creek Golf No. 1 & 2
Shady Hollow Well No. 1
Shady Hollow Well No. 1
Brushy Top 2006
Shady Hollow Well No. 2
Kennedy Ranch
Brushy Top 2005
Brushy Top 2006
Chama Trace Pumping Well
Roger Hanks
Dos Lagos
Valley Verde
Foster Ranch/Belterra
Shady Valley
Shady Valley
Shady Valley
Capital Soccer
Polo Club
Independence Park
OBSERVATION WELL INFORMATION
Obs well (yes or no)
Nearest Monitor well distance (ft)
Nearest Monitor well drawdown (ft)
Farthest Monitor well distance (ft)
Farthest Monitor well drawdown
(ft)Obs well comments
yes 151 15 617 4
yes 333 550 617 550 estimated from OC-3 distances
no n/a n/a n/a n/a
yes 1000 <0.1 n/a n/a no change measured
yes 470 16.2 n/a n/a
yes ~1250 <0.1 ~4250 0 No measurable drawdown
yes 740 1.65 n/a n/a
No n/a n/a n/a n/a
no n/a n/a n/a n/a Middle Trinity monitored but no measurableeffect
yes 300 10.9 n/a n/a distance estimated on map
no n/a n/a n/a n/a
yes ~450 3.3 n/a n/a distance estimated on map
yes 600 1.3 n/a n/a
no n/a n/a n/a n/a
yes 600 1.85 n/a n/a
yes 600 1.89 n/a n/a
yes nd nd n/a n/a
yes 2500 0.9 n/a n/a distance estimated on map
yes PC-3: 1,200 9.9 PC-4: 3,069 5Middle Trinity monitor well (PC-1) 1,200 ft from pumping well; no drawdown; heads about 80 feet higher than lower Trinity
yes 700 0.9 1850 <0.1 distance estimated on map
BSEACD Data Series Report 2010-0701KEY:
nd = no data; e = estimated; * = out of expected range; n/a = not applicable; ~ = approximatelyAppendix 1
Page 11 of 16
Appendix 1: Detailed pumping test summary table.
Abbreviated Name
Onion Creek Golf No. 3
Onion Creek Golf No. 1 & 2
Shady Hollow Well No. 1
Shady Hollow Well No. 1
Brushy Top 2006
Shady Hollow Well No. 2
Kennedy Ranch
Brushy Top 2005
Brushy Top 2006
Chama Trace Pumping Well
Roger Hanks
Dos Lagos
Valley Verde
Foster Ranch/Belterra
Shady Valley
Shady Valley
Shady Valley
Capital Soccer
Polo Club
Independence Park
PUMPING TEST FINDINGS: HYDRAULIC PARAMETERSAverage
Carr Well (Robert Small) 79 Results of Survey on R.D. Carr Water Well, Edgecliff, Austin, TX Carr Water (5851103) 8/1/61 Middle Trinity 30.249721 -97.736666 Jack R. Barnes Travis
Fronterra 80 Water Availability Investigation Fronterra Subdivision Hays County, Texas
Fronterra PW 12/1/04 Lower Trinity 30.253639 -98.034556 Wellspec Company and Bond Geological Services
Hays
Deerfield Estates 81 Water Availability Investigation Deerfield Estates II Hays County, Texas
Deerfield Burrus #1 (57562RB1) 4/3/00 Middle Trinity 30.254166 -98.051666 Wellspec Company and Bond Geological Services
Hays
Westridge 82 Water Availability Investigation Westridge Subdivision Hays County, Texas
Westridge Subdivision 4/10/00 Middle Trinity 30.256011 -98.164131 Wellspec Company & Bond Geological Services
Hays
Heather Hills 83 Water Availability Investigation Heather Hills Subdivision Hays County, Texas
PW 1 3/26/01 Lower Trinity 30.260172 -98.107944 Wellspec Company & Bond Geological Services
Hays
Forrister Well 84 Water Well Evaluation 2502 Loop 360 South Austin, TX Forrister (5842821) 4/1/82 Edwards 30.263055 -97.813888 Underground Resource Management, Inc.
Travis
Rudy's Bar-B-Q 85 Rudy's BBQ on S. Capitol of TX Hwy (pump test, but NO formal report)
972 Transmissivity used in availability calculations; Total drawdown in pumping well is unclear; higher values of drawdowns (76 ft) not explained in report but possibly interference, note page 4-1 is missing
1,200 nd nd nd nd 1.00E-03 e nd nd Theis, Copper-Jacob Reported as "conservative nominal" values
1,600 2.00E-03 Theis, Copper-Jacob Reported as "conservative nominal" values
coordinates29.6525 -97.8286 Wilcox confined 1.1 64.33 Y 117.33 141 Assumed 1,160 9.08E-10 N. A. Partial report received
50 Bandera Holiday #1 Strata Geological Services
William Feathergail Wilson, CPG #3566
Tecon, Public Water well 1/28/2001 N.A. 29.6353 -98.9856 Hosston confined 162 36 N 279 Assumed 655 0.0045 2.3 N. A.
51 Gillispie CWR-2A Strata Geological Services
William Feathergail Wilson, CPG #3566
Cool Water Ranch - 2 4/9/2005 N.A. 30.3125 -98.7550 Hensel confined 60 9.7 12 Y 150 197 Assumed 111 0.041 0.6 N. A.
No drawdown in monitor well, pumping
well in isolated channel facies
52 Gillispie Well 1 Strata Geological Services
William Feathergail Wilson, CPG #3566 The Vineyard 7/26/2005 N.A. 30.2800 -98.8942 Hensel confined 21.3 12 0.5 Y 150 80 Assumed 10,850 0.00784 136.1 N. A.
e-line collected data after transducer failed,
12 hour pump test, personal
communication
53 Kendall West #5 LBG-Guyton & Associates Bill Stein AIPG 10441 KWW West 12/20/1999 N.A. 29.8661 -98.5664
Middle Trinity, Cow
Creekconfined 252 0.33 185 - 252 5 24 12 Y 53 -131 -143 60 Assumed 307 0.00011 0.4 N. A. 10 gpm/well
Chemical data missing from
copy of report, pH 7.1
Very detailed analysesof pumping scenarios
53.1 Kendall West #6 LBG-Guyton & Associates Bill Stein AIPG 10441 KWW West 12/27/1999 N.A. 29.8669 -98.5906
Middle Trinity, Cow
Creekconfined 252 0.33 185 - 252 7 24 30 Y 49 -137 -167 60 Assumed 310 0.00018 0.2 N. A. 10 gpm/well
Chemical data missing from
copy of report, pH 7.3
Very detailed analysesof pumping scenarios
53.2 Kendall West #9 LBG-Guyton & Associates Bill Stein AIPG 10441 KWW West 2/1/2000 N.A. 29.8742 -98.5933
Middle Trinity, Cow
Creekconfined 252 0.33 185 - 252 7 24 19 Y 51 -145 -164 60 Assumed 295 0.0021 0.4 N. A. 10 gpm/well
Chemical data missing from
copy of report, pH 7.2
Very detailed analysesof pumping scenarios
54 Kendall Waterstone #1
LBG-Guyton & Associates Bill Stein AIPG 10441 Waterstone
Development 6/15/2000 N.A. 29.8961 -98.5372
Lower Trinity,
Hosston Sand
confined 480 0.42 240 - 280 24 24 60 Y 265 -84 -144 300 Assumed 1,060 0.4 N. A. 10 gpm/well
Chemical data missing from
copy of report, pH 7.2, Spec. Cond. 1,930
Very detailed analysesof pumping scenarios
54.1 Kendall Waterstone #2
LBG-Guyton & Associates Bill Stein AIPG 10441 Waterstone
Development 10/19/2000 N.A. 29.8858 -98.5547Middle
Trinity, Cow Creek
confined 452 0.42 300 - 452 10 24 6 Y 51 -78.5 -84.5 60 Assumed 5,280 1.7 N. A. 10 gpm/well
Chemical data missing from
copy of report, pH 7.5, Spec. Cond. 1,780
Very detailed analysesof pumping scenarios
54.2 Kendall Waterstone #3
LBG-Guyton & Associates Bill Stein AIPG 10441 Waterstone
Development 5/23/2000 N.A. 29.9028 -98.5547
Lower Trinity,
Hosston Sand
confined 500 0.42 415 - 500 42 24 210 Y 49 -80 -290 300 Assumed 410 0.00025 0.2 N. A. 10 gpm/well
Chemical data missing from
copy of report, pH 7.2, Spec. Cond. 2,360
Very detailed analysesof pumping scenarios
Appendix 3
Guidelines for Hydrogeologic Reports and Tests Conducted Within the Jurisdictional Boundaries of the Barton Springs / Edwards Conservation District
Guidelines for Hydrogeologic Reports and Tests Conducted Within the Jurisdictional Boundaries of the Barton Springs / Edwards Conservation District
January 2007
I. Introduction
In accordance with the District’s Rules and Bylaws and the District’s Well Construction Standards, a hydrogeologic report may be required as part of the application for a pumping permit or increase in the permit, constructing, drilling, or modifying nonexempt wells. These guidelines are intended to assist professionals involved in conducting hydrogeologic studies (and the associated test) of existing and proposed groundwater pumping systems in the Barton Springs segment of the Edwards . These guidelines provide some standards and District expectations of the hydrogeologic studies, and have been prepared with consideration for the local hydrogeologic conditions typically experienced in the region. Planning and implementation of the test shall be closely coordinated with the District to insure that the proposed study is consistent with District standards, however, the groundwater professional conducting the investigation is solely responsible for the accuracy and validity of the report. Prior to the commencement of the hydrogeologic investigation the District shall approve a written work plan that describes the design, approach, potential uncertainties, and remedies to those uncertainties. An approved work plan shall include all components of the District guidelines for hydrogeologic reports and tests in the Barton Springs Segment of the Edwards , but is not limited only to these guidelines. Deviation from these guidelines may occur with District approval and should be addressed in the work plan. District staff may recommend that permit requests be rejected due to hydrogeologic reports that do not meet the District standards outlined below.
II. Purpose and goals of the Hydrogeologic Study
Hydrogeologic studies provide essential information for water-resource management for both the District and the permittee. As new water-use systems and increased demands are added to the Edwards, hydrogeologic studies (and tests) are an essential tool to assess and document the potential influences on local wells and to understand the local characteristics.
The primary goals of the hydrogeologic report that must be addressed in the report are summarized below:
1. Properties: Hydrogeologic parameters including transmissivity and storage need to
be calculated from an test. From these parameters, the report should estimate the effects of current and projected pumpage on the water levels on surrounding wells for a one and three year period, unless otherwise specified by the District. Additionally, the report should also identify the presence of nearby hydrogeologic barriers, specific recharge features, public water supplies, or other factors that may influence this pumpage over time.
2. Impacts To Wells: The study should produce a map of the maximum drawdown from the test for the surrounding monitored wells.
3. Changes in Water Quality: The study should indicate if water quality changes are likely to occur as a result of future pumping demands. In cases where pumping wells are located near the bad-water line or in an area where significant contribution may be received from the Glen Rose or other s of differing and distinguishable water quality, field and lab measurements shall be performed in conjunction with an test to assess possible water quality changes.
III. Aspects of the Hydrogeologic Report and Test Guidelines
Below are some aspects of the hydrogeologic report that must be addressed for the District to adequately assess the report. test guidelines (collection and analyses of data) should follow those discussed in Driscoll (1986) and Kruseman and de Ritter (1991), or other published sources.
A. Description of the Well Site and Water System
The report must present a description of the project and indicate, using text and maps, the location of the well site(s) and site-system configuration. A description of the current and anticipated annual pumping demands should be addressed along with typical pumping schedules, such as, frequency, duration, peak demand hours, and pumping rates of the pumped well. The location and volume of water-storage facilities on and adjacent to the well site should be discussed.
B. Geology & Description
The geologist or hydrogeologist should provide a description of their hydrogeologic conceptual model. This should include discussion on hydrogeologic aspects of the , such as the conditions (e.g. confined, semi-confined, unconfined), thickness and lateral continuity. Evidence to support this model must include a geologic and hydrogeologic stratigraphic description of the well site and surrounding area prepared by the geologist or hydrogeologist. A geologic map and cross sections illustrating the outcropping geologic units well bore geology, structural features (faults), and potential recharge influences on groundwater flow must be provided. In general, the cross sections should be aligned perpendicular and parallel to the direction of regional faulting. Pre-pump test potentiometric surfaces, maximum drawdown, and theoretical maximum drawdown for 3 years should be shown on the cross sections. Geologic and hydrogeologic information may be derived from drilling logs, state well records, geotechnical borings, geophysical logs, site mapping of outcrops (by a qualified geologist), surface geophysical methods, and in conjunction with published geological maps. A potentiometric map should be prepared showing the elevations of the potentiometric surface of the proposed for usage. The potentiometric map should be based on water-level measurements taken within a 2-week period prior to the test. The water- level measurements should be limited to wells screened in the same , unless impacts between s are being assessed.
C. Inventory of potential recharge and discharge locations
The report must include an inventory of all known wells (private and public water source), surface ponds or reservoirs, major karst features, springs, or any other source of water recharge and
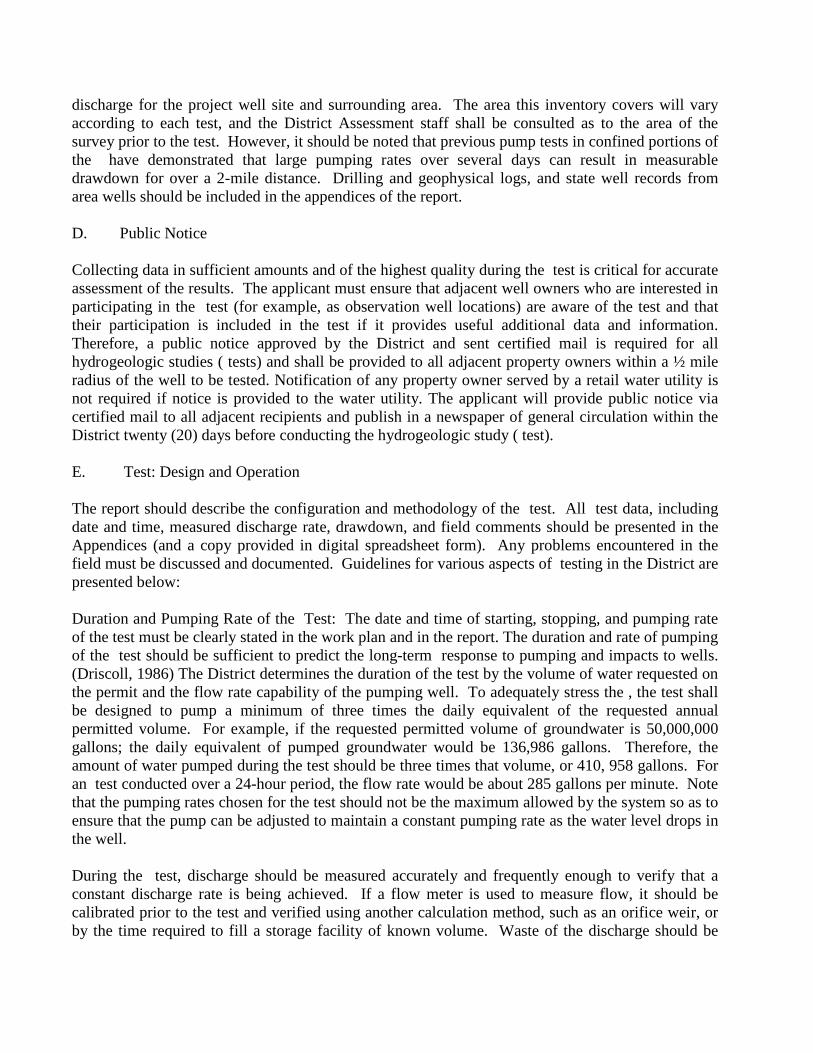
discharge for the project well site and surrounding area. The area this inventory covers will vary according to each test, and the District Assessment staff shall be consulted as to the area of the survey prior to the test. However, it should be noted that previous pump tests in confined portions of the have demonstrated that large pumping rates over several days can result in measurable drawdown for over a 2-mile distance. Drilling and geophysical logs, and state well records from area wells should be included in the appendices of the report.
D. Public Notice
Collecting data in sufficient amounts and of the highest quality during the test is critical for accurate assessment of the results. The applicant must ensure that adjacent well owners who are interested in participating in the test (for example, as observation well locations) are aware of the test and that their participation is included in the test if it provides useful additional data and information. Therefore, a public notice approved by the District and sent certified mail is required for all hydrogeologic studies ( tests) and shall be provided to all adjacent property owners within a ½ mile radius of the well to be tested. Notification of any property owner served by a retail water utility is not required if notice is provided to the water utility. The applicant will provide public notice via certified mail to all adjacent recipients and publish in a newspaper of general circulation within the District twenty (20) days before conducting the hydrogeologic study ( test).
E. Test: Design and Operation
The report should describe the configuration and methodology of the test. All test data, including date and time, measured discharge rate, drawdown, and field comments should be presented in the Appendices (and a copy provided in digital spreadsheet form). Any problems encountered in the field must be discussed and documented. Guidelines for various aspects of testing in the District are presented below:
Duration and Pumping Rate of the Test: The date and time of starting, stopping, and pumping rate of the test must be clearly stated in the work plan and in the report. The duration and rate of pumping of the test should be sufficient to predict the long-term response to pumping and impacts to wells. (Driscoll, 1986) The District determines the duration of the test by the volume of water requested on the permit and the flow rate capability of the pumping well. To adequately stress the , the test shall be designed to pump a minimum of three times the daily equivalent of the requested annual permitted volume. For example, if the requested permitted volume of groundwater is 50,000,000 gallons; the daily equivalent of pumped groundwater would be 136,986 gallons. Therefore, the amount of water pumped during the test should be three times that volume, or 410, 958 gallons. For an test conducted over a 24-hour period, the flow rate would be about 285 gallons per minute. Note that the pumping rates chosen for the test should not be the maximum allowed by the system so as to ensure that the pump can be adjusted to maintain a constant pumping rate as the water level drops in the well.
During the test, discharge should be measured accurately and frequently enough to verify that a constant discharge rate is being achieved. If a flow meter is used to measure flow, it should be calibrated prior to the test and verified using another calculation method, such as an orifice weir, or by the time required to fill a storage facility of known volume. Waste of the discharge should be
avoided as much as possible, particularly during low water-level conditions in the and should be routed to storage tanks or to other water systems when possible. If the water must be discharged to surface drainages off-site, the pumped water should be routed so that it does not recharge into the tested in the vicinity of the pumping well during the test.
Aggregate Well Fields: If the study involves the assessment of two or more pumping wells, each well may be pumped separately to measure their combined effects. If the wells are sufficiently close, it may be possible to pump the wells simultaneously. Pumping each well separately, and allowing sufficient time for recovery between tests, can more accurately measure parameters.
1. Number and Location of observation wells: Observation wells should be selected radially around the pumping well, although drawdown measurements should be focused on wells where the greatest drawdown is anticipated, such as following along strike of the dominant fault trend. The location of observation wells will vary depending if conditions are confined or unconfined. The number of monitor wells will vary depending on the scale of the test and accessibility. Note that the district can help locate monitor wells and acquire access when applicable.
2. Water-Level Data: Pre- and post- test water-level measurementsshould be collected to adequately document local background conditions in the . All water-level measurements should be within 0.01 feet precision. Precipitation and stream flow on the recharge zone (from USGS flow stations) should be reported during the test. tests should not be conducted during or immediately after significant rain events, because of the rapid change in water levels that often follows in this . Because water levels are dropping rapidly within the first several hours of pumping, water level measurements should be taken frequently. The use of automated data loggers and pressure transducers should be used whenever possible and verified with frequent manual e-line measurements Arrangements need to be made and testing schedules should be coordinated with other area pumping wells to avoid pumpage interferences that could result in misleading or uncertain results. The District can help coordinate these efforts.
3. Recovery: The recovery of water levels in the pumping and observation wells should be monitored immediately following the pumping period until all of the wells reach at least 90% of their original water level or have achieved a constant level for 2 hours. Data from the recovery phase should be nearly a mirror image of the pumping phase data when plotted arithmetically.
Note: Incomplete recovery and deviations from the theoretical recovery trends should be addressed. Several of the monitored wells should be measured beyond the recovery period of the pumping phase to establish regional and local water level trends.
F. Analyses of Test Data
This section should be prepared by a groundwater professional describing the hydrologic information and the methods used to characterize the and discuss the limitations of the data and analyses. parameters are generally measured using an test. However, other methods of
estimating parameters exist, such as, those based on grain size or geophysical response of the rock matrix, or the specific capacity of the well. These methods are generally insufficient alone to provide accurate measurement of the properties, but may be used to provide supplemental information.
1. Presentation of the water-level data should include a graph of the arithmetic
(non-log) water-level elevation versus time for all the data from each well. From these graphs, long- and short-term trends, the lack of full recovery of water levels, and evidence of boundaries can be addressed.
2. Discussion of the analyses and methods used to calculate transmissivity and
storage coefficients must be presented. Most commonly, curve-matching techniques are applied to achieve the optimal fit between theoretical relationships (e.g. Theis) and measured field data. Numerical modeling of pumptest data has also been developed (e.g. MODFLOW and RADFLOW), and can be used in conjunction with curve-matching techniques (see Johnson et al., 2001).
Semi-log and log-log graphs of drawdown versus time must show the measured data
and the theoretical curve used to calculate the parameters. All data manipulation should be clearly described. Most importantly, deviations from these theoretical curves must be addressed and may include issues, or violations of assumptions, such as: recharge, partial penetration of wells, fluctuating pumping rate, delayed yield, leakage, atmospheric responses, regional water-level trends, and interference from other wells.
G. Evaluation of Potential Water-Level and Quality Impacts
The effects of pumpage from the investigated wells on the and surrounding wells
must be evaluated. 1. A map of the maximum measured drawdown and discussion about how those
numbers were determined must be provided. If more than one well is pumped, the maximum drawdown from each test should be shown separately, and the drawdown effects of each test may be summed, if appropriate, in each observation well and presented in a separate map. Regional water-level trends and spring flow at Barton Springs should be discussed. These data can be obtained from the District. Maximum drawdown determinations may need to be adjusted for regional water level trends.
2. The calculation of transmissivity and storage coefficients can be used to
predict future water-level declines for a given time period and pumping rate. These theoretical graphs showing drawdown over distance, such as the modified Cooper-Jacob Equation, are a useful tool to evaluate the effects of future pumping on surrounding well owners and public water supplies. A map of this theoretical drawdown shall be presented in the report for given time periods.
3. Additionally, the report should document and discuss any water-quality trends
that may have occurred due to the groundwater withdrawals. Analytical results should be
provided in the appendices. Arrangements can be made with the District to take field and some basic laboratory measurements in conjunction with an test.
H. Supplemental Information
Due to the test-specific nature of these investigations, additional information can
significantly enhance the results of the investigation. Below are some items that should be considered within the scope of work for the hydrogeologic studies:
1. In the absence of good geological and geophysical control data, a suite of
geophysical logs (and down-hole camera) should be performed on the pumping well. 2. In the absence of sufficient observation wells, a scientific monitor well
(borehole) should be completed in the well field.
References
Driscoll, Fletcher R., 1986, Groundwater and Wells. Second Edition. Johnson Screens, St. Paul, Minnesota. Pp. 1089.
Johnson, G.S., D.M. Cosgrove, and D.B. Frederick, 2001. A Numerical Model and Spreadsheet Interface for Pumping Test Analysis, Groundwater, July-August 2001, Vol. 39, No. 4, Pp. 582-592.
Kruseman, G.P., and N.A. de Ridder, 1991, Analysis and Evaluation of Pump Test Data, Second Edition, ILRI, Netherlands. 377 p.
Acknowledgments
This document is modified from original guidelines written by former District Hydrogeologist Nico Hauwert, P.G. These guidelines have been modified by Assessment Staff Dr. Brian A. Smith, P.G., Brian Hunt, P.G., and Joseph Beery.
Appendix 4
Compact Disk Containing Scanned Pumping Test Reports