China Climate Change Partnership Framework - Enhanced strategies for climate-proofed and environmentally sound agricultural production in the Yellow River Basin (C-PESAP) Situation Analysis of Shaanxi Province Compiled and Written by MIN Ancheng & HAN Qinfang Checked by JIA Zhikuan Northwest Agriculture and Forestry University Yangling, Shaanxi, P R China
Transcript
China Climate Change Partnership Framework - Enhanced strategies for climate-proofed and environmentally sound agricultural production in the Yellow River Basin (C-PESAP)
2.2.2.2 Non-agricultural income of rural residents ............................................................. 26
2.2.3 Contribution of agriculture, food transformation industries and food trade to GDP ........ 29
2.2.3.1 Contribution of agriculture to GDP......................................................................... 29
2.2.3.2 Contribution of food processing to GDP................................................................. 30
2.2.3.3 Export of major agricultural products ..................................................................... 31
2.2.4 Food consumption and degree of self-sufficiency ............................................................ 31
2.3 Partners and stakeholder institutions ......................................................................................... 31
2.3.1 Characteristics of farming communities ........................................................................... 31
China Climate Change Partnership Framework - Enhanced strategies for climate-proofed and environmentally sound agricultural production in the Yellow River Basin (C-PESAP)
- 2 -
2.3.2 Farmer associations and interest groups ........................................................................... 32
2.3.3 Research organisations, extension services, NDRC and other governmental institutions 36
Global warming has become an indisputable fact and one of the major environmental
problems that the human race has ever faced. According to a change curve of land surface
temperature between 1000 AD and 2100 AD, released by IPCC, the change in temperature
before the 19th century was quite smooth. In contrast, the temperature rise has been quite
significant since the middle of the 19th century. Moreover, according to different scenario
models, it is predicted that the temperature rise will be even more abrupt in the future. The
Third Assessment Report issued by IPCC pointed out that the average annual temperature
rise since 1860 has been 0.6°C±0.2°C.
The margin of temperature rise in the 20th century in the northern hemisphere may be
the largest in the past 1,000 years. The temperature change in the past century can be
roughly divided into the following periods: growth from the beginning of the 20th century to
the 1950’s, oscillation from the 1950’s to the 1970’s, global rise at the end of 1970’s,
dramatic rise which was up to 0.3~0.4℃ in the 1980’s and 1990’s. The 1990’s were the
warmest decade and 1998 the warmest year in history. For China, the temperature rose by
0.4~0.5℃ over the past century, slightly lower the world average which stood at 0.6℃.
The reason for and law of climate change are still beyond the control of human beings.
But according to the IPCC report issued in 1995, a lot of evidence can prove that human
activities have exerted a recognizable impact on global climate. The latest IPCC report
released in 2001 further confirmed that the global warming in the 20th century resulted from
human activities. The consumption of fossil fuels and mass deforestation by human beings
ruined the natural circulation of carbon. One of the consequences is the increase of CO2
content in the atmosphere. According to the IPCC report, in the future, the temperature will
continue to rise as a result of the emission of manmade greenhouse gases, and the global
temperature will rise for 1.4~5.8℃ by 2100 despite the cooling effect of manmade pollutants.
In the 21st century, global warming has become one of the most complicated challenges for
the human beings.
People’s cognition of climate change, and the possible impacts of climate change on the
production and living of human beings experienced three important stages: prevention in the
1970’s, mitigation in the 1980’s and adaptation proposed by IGBP. At present, how to adapt
to the climate change has become a focus of international study. Adaptation refers to the
adjustment made by the natural and manmade systems to the new or changing environment.
The adaptation to climate change refers to the advantage-seeking and disadvantage-
avoiding response made by the natural and manmade systems to the actual or anticipated
stimulating climate factors and their impacts. Presently, human beings are still unable to
completely prevent climate change, but they can take measures to cope with (actively adapt
China Climate Change Partnership Framework - Enhanced strategies for climate-proofed and environmentally sound agricultural production in the Yellow River Basin (C-PESAP)
·2·
to) climate change. At the same time, they should restrain their activities to lower energy
consumption and reduce the emissions of greenhouse gases so as to mitigate the climate
change as much as possible.
1.1.2 Impact of climate change on agriculture in the Yellow River Basin
Agricultural production and agricultural eco-environment are the most susceptible to the
threat of climate change, and the eco-environment is the most sensitive to climate change.
According to the IPCC report, global climate change will exert a significant impact on
agricultural production, which is adverse in some areas, especially in areas that have poor
adaptation, low adjustment ability and fragile production.
Over 60% of the Yellow River Basin is arid and semi-arid area. It is an important and
strategic grain producing base in China. The sown area of wheat in the Huang-Huai-Hai
Plain accounts for 36%~40%, and the output takes up about 50% of the national total in
recent ten years. Moreover, the Yellow River Basin, especially the middle and lower reaches,
span multifold agricultural and ecological types, including the ecologically-fragile typical agro-
pastoral zone, Loess Plateau which easily gets dry and the Huang-Huai-Hai Plains which are
in severe shortage of water supply. The Yellow River Basin is also an important place of
water source for China’s northwestern and northern parts, where water is in severe short
supply. As the global temperature rises, most areas in the Yellow River Basin begin to get
dry, where the natural runoff witnessed a dramatic decline. The Yellow River began to get
dry in the lower riches in the 1970’s, and this phenomenon got more frequent. The number
and duration and coverage of this phenomenon increased significantly. The climate warming
and drying directly affects the farming and animal husbandry in rain-fed areas. The drying-up
of the Yellow River also makes it difficult to sow and irrigate in a timely manner in the lower
reaches of the Yellow River, resulting in reduction in agricultural production. Many
environmental problems, including more frequent strong sandstorms, land degradation and
desertification, lowering ground water level, soil salinization, water and soil loss, are closely
related to climate warming and drying-up. The Loess Plateau in the middle and lower
reaches of the Yellow River covers one half of the area of the whole valley. It is a climate-
sensitive and environmentally-fragile area, where rain-fed agriculture prevails and farming
and animal husbandry relies heavily on climate conditions.
The Loess Plateau in Shaanxi is in the center of the whole Loess Plateau, covering
18.5% of the total area of Loess Plateau in China, consisting of the loess plateau north of the
Weihe River and the loess hilly and gully region in the north of the province. The typical loess
hilly and gully region in the north of the province, in particular, the area north of Yan’an is
characterized by poor natural resources for agriculture and low agricultural production level.
Due to the long-time excessive cultivation, extensive cultivation, and severe vegetation
destruction, this area is prone to drought and one of the areas which report the worst water
and soil loss in the middle and lower reaches and even across China. Moreover, it is an area
Situation Analysis of Shaanxi Province
·3·
where water and soil loss is extremely severe in China and the world, and the eco-
environment is very fragile.
Climate change constitutes a multi-scale, omni-directional, multilayered and long-term
impact on agriculture. The climate warming and drying-up, frequent extreme drought and
flood and land degradation poses unprecedented challenges to the agricultural production in
the Yellow River Basin. Currently, China’s measures and strategies for climate change are
rather simple and the research is inadequate which is mostly focused on the change in unit
crop yield in different climate scenarios and climate factors (temperature, accumulated
temperature, precipitation and CO2 content) and the impact on the eco-environment. The
research on the strategic countermeasures to cope with climate change in agriculture is quite
inadequate, and the research on comprehensive measures and how to protect farmland and
eco-environment is even less. Agriculture is the foundation of our national economy.
Therefore, we must well research on how to adapt to the long-term climate change.
1.1.3 Project Origin
At the beginning of 2007, the Spanish government donated US$500 million to the United
Nations for the UN-Spain MDG Achievement Fund, which is dedicated to the work of UN
offices on the UN “Millennium Development Goals” on the global scale. Later on, the UN
offices in China and Chinese government were granted US$13 million for activities in the
areas of climate change, environment and energy. On October 9, 2008, the launch meeting
of the UN-China Climate Change Partnership Framework Meeting was held in Beijing. The
framework project will be executed for three years (from 2008 to 2010) to provide support for
policies on climate change and encourage the development and extension of new
technologies. The goals of the project include: (1) incorporate the national strategic
guidelines on climate change into the national policies, laws and regulations, facilitate and
intensify the formulation and implementation of policies on climate change; (2) increase the
fund-raising ability of localities and partners for technology transfer and innovation; and (3)
ensure the ability of fragile areas to adapt to climate change.
The Strategic Study on Environment-friendly Eco-agriculture on Climate Change in the
Yellow River Basin is part of the framework project on the adaptation to climate change,
jointly undertaken by the Ministry of Agriculture, the Food and Agriculture Organization of UN
and the Chinese Academy of Agricultural Sciences. It is dedicated to the agricultural pollution,
frequent drought and ecological problems caused by climate change in the Yellow River
Basin. It chooses the major agricultural eco-types for cross-disciplinary and integrated
research on protective technology and strategy in agriculture. The project is mainly carried
out in Ningxia, Shaanxi, Henan and Shandong in the middle and lower reaches of the Yellow
River.
China Climate Change Partnership Framework - Enhanced strategies for climate-proofed and environmentally sound agricultural production in the Yellow River Basin (C-PESAP)
·4·
1.2 General description of the study area
1.2.1 The Yellow River Basin
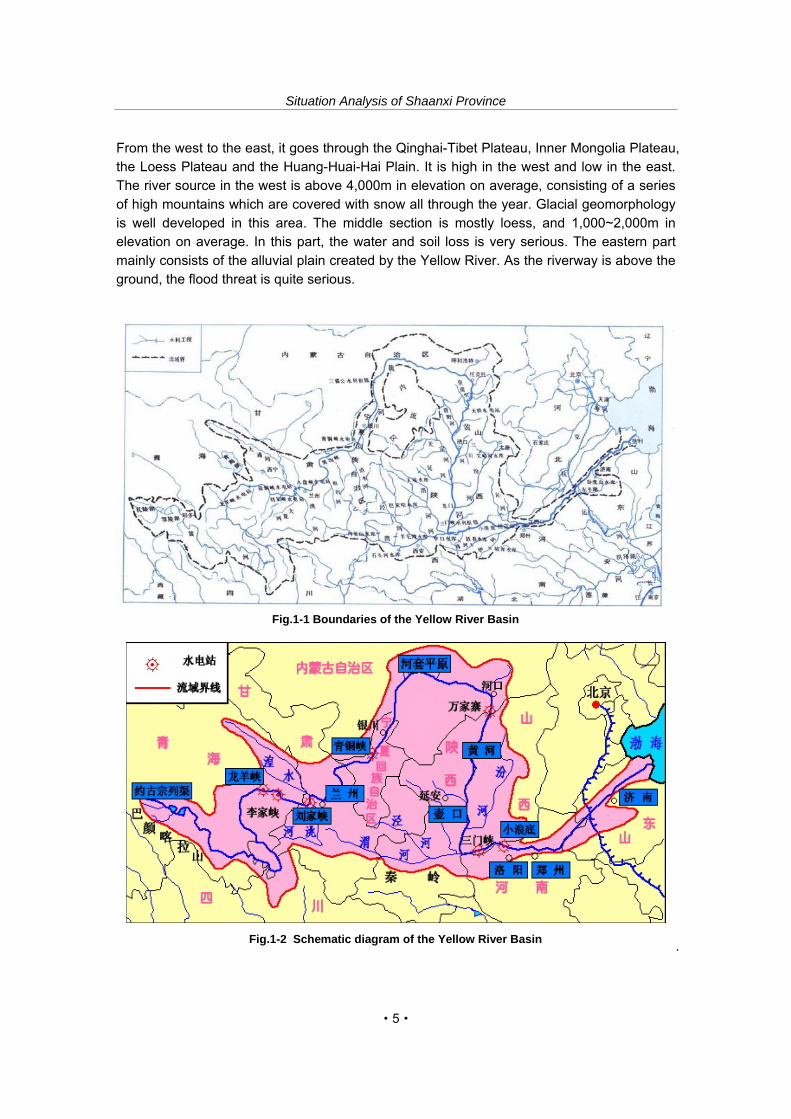
The Yellow River originates from the Yueguzonglie Basin at an elevation of 4,500m at the northern foot of the Bayankala Mountain in the Qinghai-Tibet Plateau. It runs through 9 provinces and autonomous regions, including Qinghai, Sichuan, Gansu, Ningxia, Inner Mongolia, Shanxi, Shaanxi, Henan and Shandong, and enters Bohai Sea at Kengli County of Shandong Province. Its main stream is 5,464 km long. The section upward Hekou Town of Tuoketuo Qi of Inner Mongolia is called the upper reaches, where there are 43 large tributaries (whose drainage area is more than 1,000km2) and whose runoff accounts for 60% of the whole river. The section upward Lanzhou is mostly covered with good vegetation. Going through many canyons, the main stream between Maduo and Qingtongxia has rich hydropower resources. The section downward Qingtongxia is the Hetao Plain which boasts developed irrigation and is an important agricultural base in the Yellow River Basin and open to navigation. Floods and ice run exist in the plain area along the river. The section between Hekou Town and Taohuayu of Zhengzhou of Henan Province is the middle reaches. The area along the river is Loess Plateau where vegetation is sparse. There are 30 large tributaries in this part (with the Fenhe River and the Weihe River being the largest). This section mostly runs through the loess hilly and gully regions where the flood and sand (especially coarse sand) of the Yellow River mainly come from. The section between Hekou Town and Yumenkou marks the longest continuous canyons along the main stream, which also boasts rich hydropower resources. Downward the canyon is the famous Hukou Waterfall. Between Yumenkou and Sanmenxia, the Yellow River runs through the Fenwei Graben, and the river valley broadens. Between Yumenkou and Zhaguan (called Xiaobei Mainstream for short), the mainstream is 132.5km long, where the riverway is wide, shallow and messy, and the variation resulting from scouring and silting is violent. The section upward Xiaolangdi between Sanmenxia and Taohuayu sees the last canyons. Running through the canyons, the Yellow River enters the plain areas, where there are also rich hydropower resources. The section between Taohuayu and the estuary is the lower reaches. Except for the section between Dongping Lake and Jinan on the southern bank where there are low hills, the rest of this part mainly resorts to dikes to keep the water from running over. Due to the silt of sand, the riverbed is normally 3~5m, and even 10m higher than the ground along both banks. Therefore, the river is also called the “Hanging River”. In this section, there are much fewer tributaries. Most of the areas along both banks are irrigation areas, and the mainstream is navigable. Because of the silt of sand, the estuary keeps extending and swinging, giving rise to strong epeirogeny.
The Yellow River Basin is situated between 95°53′~119°05 E and 32°10′~41°50′ N. It starts from Bayankala Mountain in the west, enters the Bohai Sea in the East, extends to the Qinling Mountains in the south and reaches the Yinshan Mountains in the north. It is 1,900 km long from the east to the west, and 1,100km wide from the south to the north, covering an area of 795,000 km2. Most of it is in the northwest of China (Figure 1-1 and Figure 1-2). With a vast territory, the Yellow River Basin features violently different terrain and topography.
Situation Analysis of Shaanxi Province
·5·
From the west to the east, it goes through the Qinghai-Tibet Plateau, Inner Mongolia Plateau, the Loess Plateau and the Huang-Huai-Hai Plain. It is high in the west and low in the east. The river source in the west is above 4,000m in elevation on average, consisting of a series of high mountains which are covered with snow all through the year. Glacial geomorphology is well developed in this area. The middle section is mostly loess, and 1,000~2,000m in elevation on average. In this part, the water and soil loss is very serious. The eastern part mainly consists of the alluvial plain created by the Yellow River. As the riverway is above the ground, the flood threat is quite serious.
.
Fig.1-1 Boundaries of the Yellow River Basin
Fig.1-2 Schematic diagram of the Yellow River Basin
China Climate Change Partnership Framework - Enhanced strategies for climate-proofed and environmentally sound agricultural production in the Yellow River Basin (C-PESAP)
·6·
As the Yellow River Basin faces the ocean in the east and lies inland, the regional gap in temperature, precipitation, evaporation, sunshine/heat resources and frost-free period is quite significant. The climate in the valley is roughly classified into arid, semi-arid and semi-humid. It is quite dry in the west and humid in the east. The annual average precipitation in the valley is around 470mm for many years. The annual average rainfall in the southwest can be up to 1,000mm. In contrast, the annual average rainfall in Wulanbu and the desert area in the northwest is less than 125mm. The precipitation between June and October accounts for 65%~85% of the whole year. The largest monthly precipitation falls in July and August. The annual average evaporation is 700-1,800mm for many years. The annual average temperature is 1C˚-8C˚ in the upper reaches, 8C˚-14C˚ in the middle reaches and 12C˚-14C˚ in the lower reaches. The frost-free period is as long as 50-100 days upward Xunhua in the upper reaches 150-180 days in the middle reaches and 200-220 days in the lower reaches. In terms of cropping system, double cropping prevails in the southeast and single cropping in the northwest. Because of inadequate heat, no crops can be grown in the Qinghai-Tibet Plateau and the Qilian Mountains in the west except for gully areas. The land use varies greatly in the valley. Consisting of mostly grassland, the Erdos Plateau and the Qinghai Plateau is a pastoral area and an important animal industry base in China. The mountainous areas in this part are mostly covered with forest and shrubbery. The Hetao Plain, Ningxia Plain and Fenwei Plain are mostly irrigated land. The Loess Plateau and Taihang Mountains are mostly dry land and grassland, which are agro-pastoral transitional areas. The Huanghuai Plain consists of much paddy field and dry land. According to the statistics of 1990, the area of farmland totals 11.93 million ha, accounting for 12.5% of the national total. The area of forest and grassland stands at 10.20 million ha and 27.93 million ha respectively.
1.2.2 Shaanxi
Shaanxi is also called "Qin” or “Shaan” for short. It is generally recognized as the cradle of the Chinese nation and the origin of the Chinese civilization. In ancient times, Emperor Xuanyuan made an ancient cooking vessel here and divided China into nine parts, in which “Yongzhou” lay in Shaanxi. As early as 1.1 million years ago, the “Lantian Pithecanthrope” at beginning of human history lived and multiplied along the Bahe River. The Banpo Relics” east of the Xi’an proper demonstrates the advance and civilization of the matrilineal clan societies 6,000~7,000 years ago. About 5,000~6,000 years ago, Yan Emperor and Huang Emperor, the first ancestors of the Chinese nation, led their own clans to create the Chinese civilization in the Loess Plateau in the northwest of Shaanxi. Houji, the first ancestor of the Chinese farming civilization taught people farming and created the farming civilization. King Wen of Zhou laid down the ritual system and King Wu of Zhou presented vavasories. Then, Emperor Qin Shihuang (the first emperor of China) united China. After that, the Han and Tang dynasties created splendid cultures. Cang Jie, the inventor of the Chinese characters, created the Chinese characters here. Zhang Qian explored the Silk Road and Sima Qian wrote the Records of Historians, the biographical book in China. Shaanxi remained the political, economic and cultural center in ancient China. For more than 1,100 years, 13
Situation Analysis of Shaanxi Province
·7·
dynasties built their capitals in Shaanxi. Moreover, four peasant uprisings (led by Liu Xuan, Chimei, Huang Chao and Li Zicheng) set up their regimes here for 11 years. Shaanxi created a splendid history of civilization for the Chinese nation and left rich and precious cultural relics.
1.2.2.1 Shaanxi profile
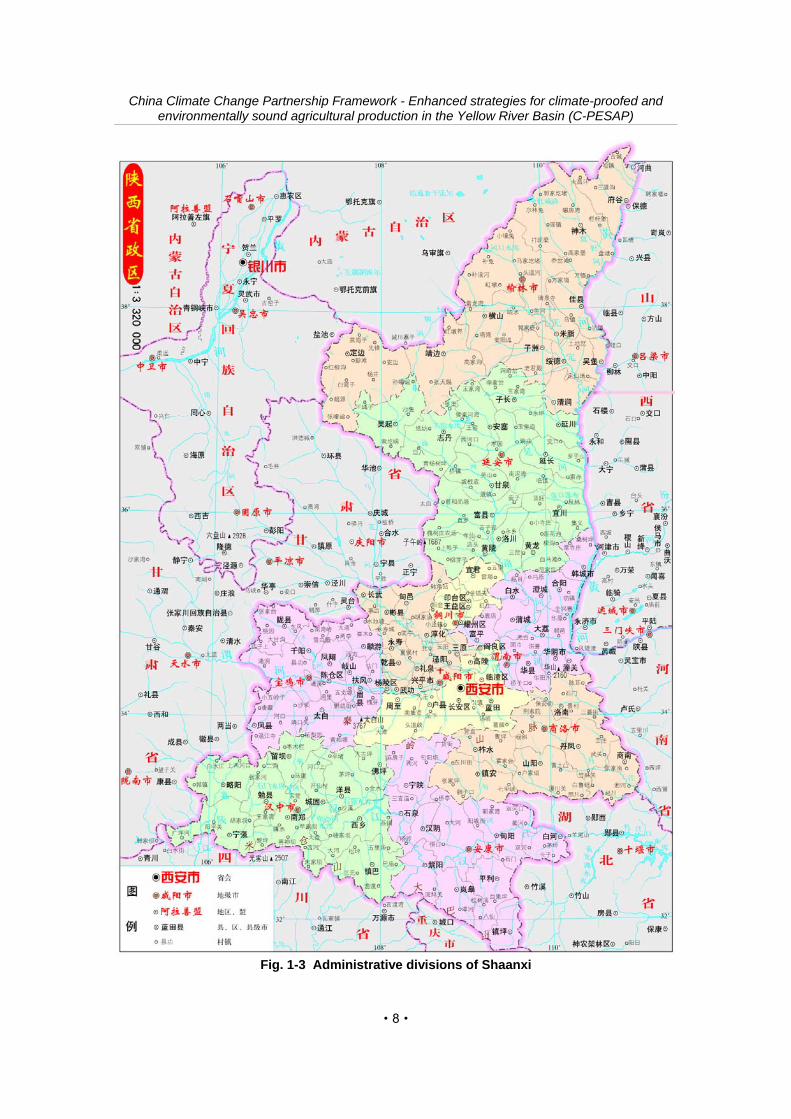
Shaanxi is located in the northeastern part of Central China. It is situated at 105'29"~111'15" east longitude and 31'42"~39'35" north latitude. The geodetic origin of China is within Jingyang County of the province. In administrative division, Shaanxi is in the east of northwest China. It borders Shanxi across the Yellow River in the east, Gansu and Ningxia in the west, Inner Mongolia in the north, Sichuan and Chongqing in the south, and Henan and Hubei in the southwest. It is an inland province bordering the largest number of provinces in China. It is an important transportation hub that connects the east, northwest and southwest (See Figure 1-3). It is about 850km long from the south to the north, and 160~490km wide from the east to the west. It covers an area of 205,800 km2, 2.14% of the national total, ranking the 12th in China. It has one sub-provincial city (Xi’an), one sub-provincial demonstration zone (Yangling Agricultural Hi-tech Industries Demonstration Zone), nine prefecture-level cities (Baoji, Xianyang, Weinan, Tongchuan, Hanzhong, Yan’an, Yulin, Ankang and Shangluo), 107 county-level administrative units (24 districts, 3 county-level cities and 80 counties) which is comprised of 1,747 towns and street offices, 31,197 villagers’ committees and 1,989 committees of neighborhood residents. The permanent residents of the province numbered 37.62 million in 2008 (ranking the 17th among the 31 provinces, municipalities and autonomous regions in China excluding Hong Kong, Macau and Taiwan). The agricultural population accounts for about 73% of the total. The proportion is 105.79:100 between male and female population, and 42.1%:57.9% between urban and rural population. The population of Han nationality accounts for more than 99.4% of the total. The large ethnic minorities in the province include Hui, Manchu and Mongolian.
China Climate Change Partnership Framework - Enhanced strategies for climate-proofed and environmentally sound agricultural production in the Yellow River Basin (C-PESAP)
·8·
Fig. 1-3 Administrative divisions of Shaanxi
Situation Analysis of Shaanxi Province
·9·
As the province is narrow and long from the south to the north, and home to the “North
Mountains” (the lithoid hill ranges mainly consisting of lime stone in the southern rim of the
Loess Plateau in the north and the transitional area to the Guanzhong Basin), and the “South
Mountains” (Qinling) runs across the province from the west to the east, the province can be
divided into three regions that are diametrically different in terms of geography, history,
culture and climate (Therefore, Shaanxi is also called “San Qin Da Di”). Amongst, in the
north of the province are the Loess Plateau and the Maowusu Desert which used to be the
domain of nomadic tribes, where the language is the Jin dialect, and the climate is temperate
semi-arid. The Guanzhong area consists of Weihe Plain and mesa, which is also known as
the “eight hundred li of land of abundance”, the origin of the central Chinese civilization and
first choice of capital in many feudal dynasties. It is an important grain production base in
northern China, where the language is the Zhongyuan dialect and the climate is temperate
semi-humid. The south of the province features “two mountains with a plain in between”,
namely the Qinling Mountains and Daba Mountains, and the Hanshui Valley between them.
It is the origin of the Chinese nation and the major agricultural zone in Shaanxi which boasts
rich sub-tropical resources. It is also the major rice and rape production base in Shaanxi,
where the language is the southwest dialect and the climate is sub-tropical humid.
As more than one third of the land and population of province are located in the south of
the Qinling Mountains, Shaanxi is truly a province which spans the south and north of China.
1.2.2.2 Topography
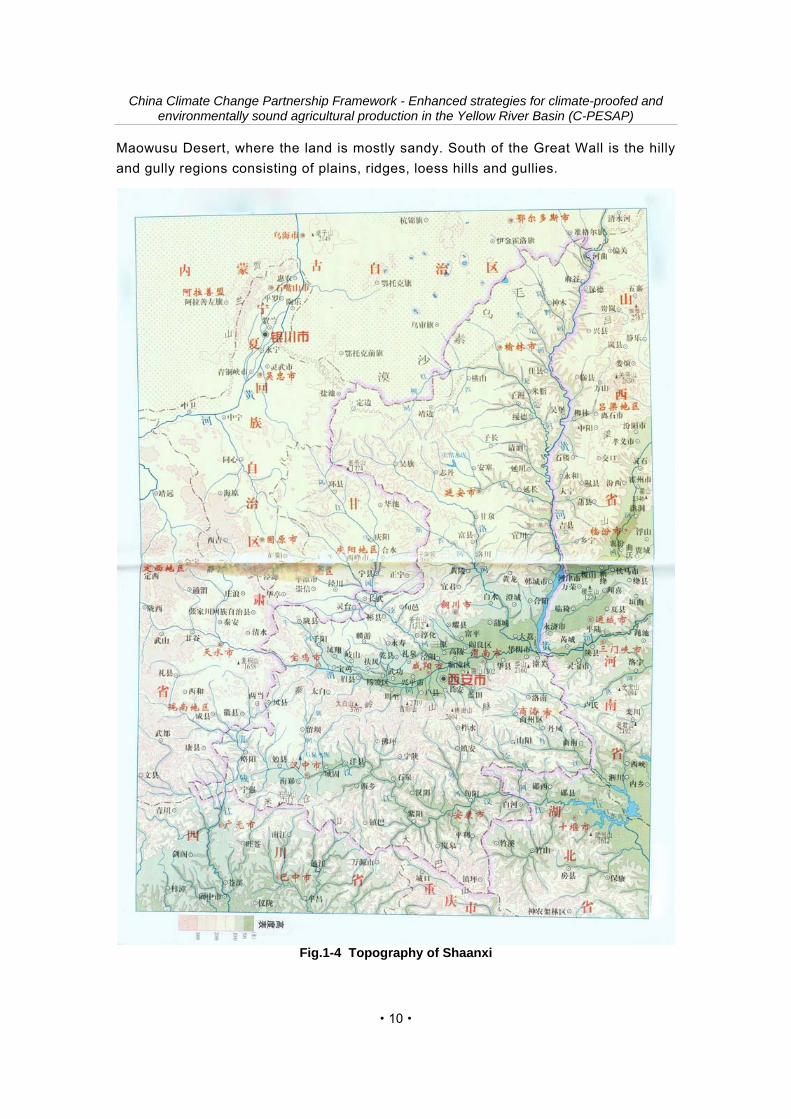
In China’s ladder-shaped terrain, Shaanxi is located at the second stage which is
characterized by variant landforms. In general, it is high in the south and north, and low in
the center. Moreover, this area is also declining from the west to the east in elevation (See
Figure 1-4). The “North Mountains” and Qinling Mountains divide the province into three
natural regions, i.e. the Shaanbei Plateau in the north, the Guanzhong Plain (also known as
the Guanzhong Basin”) in the center and the Qinling-Daba Mountainous Area in the south.
The size of mountainous areas totals 74,100 km2, accounting for 36% of the total provincial
area. The total area of plateau is 92,600 km2, taking up 45% of the total, the plain is 39,100
km2 in area, accounting for 19%, and the size of water area is 4,030 km2, representing 2% of
the total.
Loess plateau in the north: Located north to the “North Mountains”, it is an
important part of the Loess Plateau in China. It is high in the northwest and low in the
southeast. The elevation is 900~1,500m above sea level. The total area is 92,500
km2, 45% of the provincial total. Except for the sand drift region along the Great Wall
and some mountainous areas, this region is mostly covered with a loess layer
50~100m in thickness, and the maximum thickness of the loess layer is up to 200m.
The water and soil loss in this area is serious. North of the Great Wall is the
China Climate Change Partnership Framework - Enhanced strategies for climate-proofed and environmentally sound agricultural production in the Yellow River Basin (C-PESAP)
·10·
Maowusu Desert, where the land is mostly sandy. South of the Great Wall is the hilly
and gully regions consisting of plains, ridges, loess hills and gullies.
Fig.1-4 Topography of Shaanxi
Situation Analysis of Shaanxi Province
·11·
Weihe Basin in Guanzhong: It is adjacent to the Qinling Mountains in the south,
borders the “North Mountains” in the north, starts from Baojixia in the west and ends
at Tongguan Gangkou in the east. It is about 360km long from the east to the west,
wide the in the east and narrow in the west, covering an area of 39,100km2,
accounting for about 19% of the provincial area. It is mostly comprised of river terrace
and loess tableland, where the land is flat and soil fertile, making itself known as the
“Eight hundred li of land of Qin”. It is an important wheat and maize production base
in north China. The Weihe River runs across the basin into the Yellow River. The
riverbed is flat and low in elevation which is 326~600m above sea level. On both
sides southward and northward the riverbed of the Weihe River, the terrain is rising in
asymmetrical ladder shape, transiting from the first and second layers of alluvial
terrace to the first and second layers of loess tableland which is 200~500m higher
than the Weihe River. The tableland is wide, normally 460~800m above the sea level.
It is a major grain production region in Guanzhong area. South of the Weihe River is
mostly alluvial plain. The loess tableland spreads discontinuously, above 250~400m
higher than the Weihe River, presenting a ladder or gradient shield shape, declining
slightly from the north foot of the Qinling Mountains to the Weihe Plain. Currently, this
area has grown into a comprehensive agricultural base with forestry and gardening as
the major pillars.
Qinling-Daba Mountainous Area in the south: It is located south of the Qinling Mountains,
covering an area of 74,017 km2, taking up 36% of the provincial total. It is characterized by
“two mountains with a plain in between”, namely the Qinling Mountains and Daba Mountains,
and the Hanshui Valley and Danjiang Plain between them. The section of Qinling Mountains
in Shaanxi is the main body of the mountains, which is 400~500km long from the east to the
west and 300km wide from the south to the north. The slope is abrupt in the north and gentle
in the south. The mountain is generally 1,500~3,000m above the sea level, 1,000~3,000m
higher than the Guanzhong Basin and Hanzhong Basin. The main part of the mountain is in
the north, where there are many peaks more than 2,000m high (including, Yuhuang
and Huashan Mountain) that forming the highest part of the Qinling Mountains. Southward,
the terrain is gradually gentle and become hills at the rim of the Hanzhong Basin. The Daba
Mountains between Shaanxi and Sichuan runs from the southeast to the northwest, about
300km long, 1,500~2,000m above seal level, and 1,000~1,500m higher than the Guanzhong
Basin and Hanzhong Basin. The Hanjiang River runs between the Qinling Mountains and
Daba Mountains and across the hilly areas at Mianxian, and creates an alluvial plain which is
about 100km long and 5~25km wide between Wuhou Town of Mianxian to Longtingpu of
Yangxian. Then it runs along a V-shaped canyon into the Ankang Basin before flowing into
Hubei Province. The area west of the Hanjiang Valley is part of the hilly area in the upper
reaches of the Jialing River. There the land rises and falls gently, and valley is wide, making
a main water and land passageway between Shaanxi and Sichuan.
China Climate Change Partnership Framework - Enhanced strategies for climate-proofed and environmentally sound agricultural production in the Yellow River Basin (C-PESAP)
·12·
1.2.2.3 Climate
Shaanxi is controlled by continental monsoon climate, featuring distinctive regional
differences. Two level-1 climate and agricultural area borders run across it. The province is
covered by many mountainous areas and sloping fields. It is said that “there are four
seasons in the mountain, and the weather is different 10 li (5km) away.” The average annual
precipitation is 573.3mm (60%-70% of which falls in July-October). The average annual
temperature is 13.8˚C sunshine duration 2,119.1 hours, wind speed 1.7m/s, frost-free period
236.6 days, and accumulated temperature (≥10˚C) 2,800-4,900�. The humid area (where
the aridity is less than 1.0) and semi-humid area (where the aridity is between 1.0 and 1.5)
accounts for 39.2% and 26.7% of the total respectively. The climate in the province is
characterized by warm and windy spring when the temperature rises fast and unsteadily,
rainfall is inadequate, and windy in Shaanbei; hot and rainy summer when the rainfall is
concentrated in July-September, thunderstorm and torrential rain is frequent, hail and gust
occur frequently in Weibei region, intermitted with “summer drought”; cool and humid autumn
when temperature drops fast, much rain in Guanzhong and Shaannan regions; cold and dry
winter featuring low temperature, low rainfall and snow. As the province extends for over
800km from the south to the north, crossing several latitudes, there is much difference in the
climate in the south and the north of the province. From the north to the south, the province
spans the warm, temperature warm and northern sub-tropical zones, and arid, semi-arid,
semi-humid and humid zones. The annual average temperature is 7-16˚C for many years.
The precipitation fall into three temperate zones, i.e. the warm zone in the north, the
temperate warm zone in the southern part of north, Guanzhong and the south foot of the
Qinling Mountains (more than 1,000m above sea level), and the northern sub-tropical zone in
the south. North of the Great Wall is controlled by temperate arid and semi-arid zones. The
rest of Shaanbei and Guanzhong Plain are ruled by temperate warm semi-arid or semi-
humid climate. The Shaannan Basin is dominated by northern sub-tropical humid climate
and most of the mountainous areas are controlled by temperature warm humid climate.
The temperature and rainfall in the province generally decline from the south to the north.
At the same time, they are greatly affected by the mountainous terrain (See Table 1-1). The
temperature rises and falls fast in spring and autumn. The temperature difference between
the south and the north is small in summer and large in winter. Rainfall across the whole
province varies greatly from season to season. Summer sees the largest rainfall which
accounts for 39%~64% of the annual total. In summer, Shaanbei sees the largest rainfall in
summer, followed by autumn when the rainfall accounts for 20%~34% of the annual total.
Spring registers less rain than autumn. Rainfall in spring takes up 13%~24% of the annual
total. Winter has the least rainfall which only accounts for 1%~4% of the annual total.
Torrential rain starts in April and ends in November, concentrating in July and August. In
Guanzhong and Shaannan, the first spring rain which is around 300mm normally falls in the
beginning and middle of April. Heavy rain normally comes in late June and the beginning of
July. During this period, torrential is highly concentrated. Guanzhong and Shaannan see
much flood. In autumn, Guanzhong and Shaannan see a period of frequent rain called
autumn rainstorms which normally comes between the beginning and middle of September.
Situation Analysis of Shaanxi Province
·13·
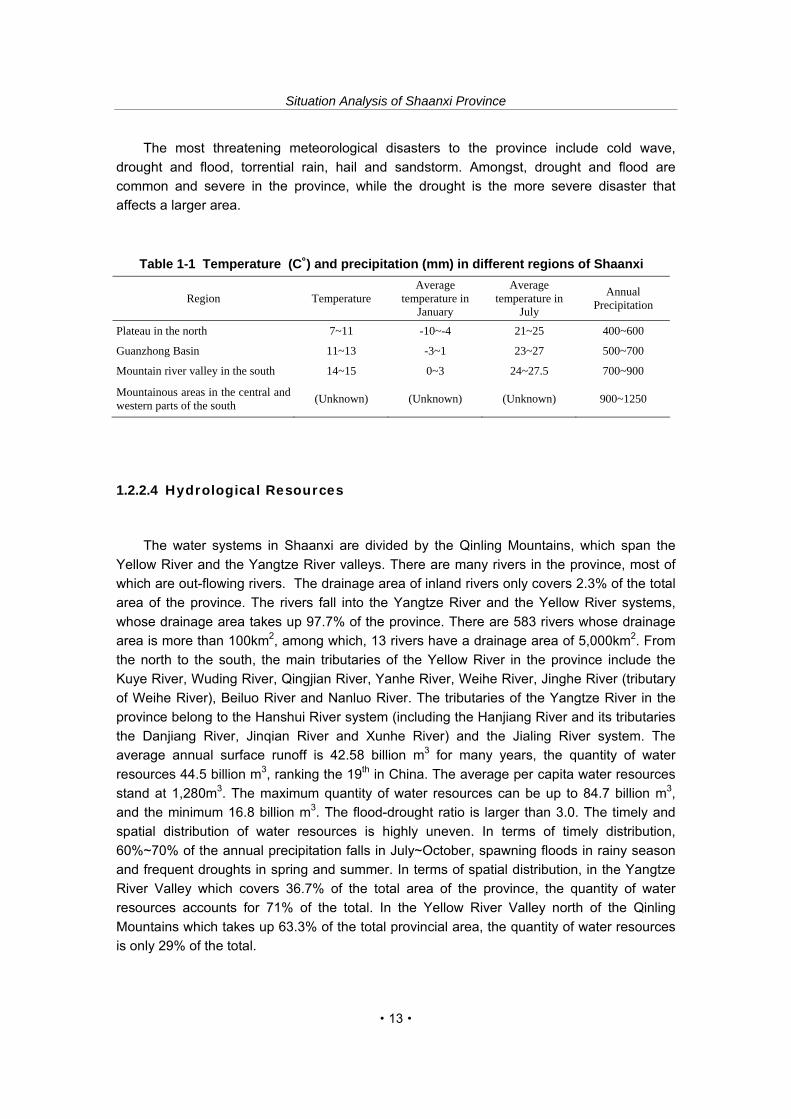
The most threatening meteorological disasters to the province include cold wave,
drought and flood, torrential rain, hail and sandstorm. Amongst, drought and flood are
common and severe in the province, while the drought is the more severe disaster that
affects a larger area.
Table 1-1 Temperature (C˚) and precipitation (mm) in different regions of Shaanxi
Region Temperature Average
temperature in January
Average temperature in
July
Annual Precipitation
Plateau in the north 7~11 -10~-4 21~25 400~600
Guanzhong Basin 11~13 -3~1 23~27 500~700
Mountain river valley in the south 14~15 0~3 24~27.5 700~900
Mountainous areas in the central and western parts of the south
(Unknown) (Unknown) (Unknown) 900~1250
1.2.2.4 Hydrological Resources
The water systems in Shaanxi are divided by the Qinling Mountains, which span the
Yellow River and the Yangtze River valleys. There are many rivers in the province, most of
which are out-flowing rivers. The drainage area of inland rivers only covers 2.3% of the total
area of the province. The rivers fall into the Yangtze River and the Yellow River systems,
whose drainage area takes up 97.7% of the province. There are 583 rivers whose drainage
area is more than 100km2, among which, 13 rivers have a drainage area of 5,000km2. From
the north to the south, the main tributaries of the Yellow River in the province include the
Kuye River, Wuding River, Qingjian River, Yanhe River, Weihe River, Jinghe River (tributary
of Weihe River), Beiluo River and Nanluo River. The tributaries of the Yangtze River in the
province belong to the Hanshui River system (including the Hanjiang River and its tributaries
the Danjiang River, Jinqian River and Xunhe River) and the Jialing River system. The
average annual surface runoff is 42.58 billion m3 for many years, the quantity of water
resources 44.5 billion m3, ranking the 19th in China. The average per capita water resources
stand at 1,280m3. The maximum quantity of water resources can be up to 84.7 billion m3,
and the minimum 16.8 billion m3. The flood-drought ratio is larger than 3.0. The timely and
spatial distribution of water resources is highly uneven. In terms of timely distribution,
60%~70% of the annual precipitation falls in July~October, spawning floods in rainy season
and frequent droughts in spring and summer. In terms of spatial distribution, in the Yangtze
River Valley which covers 36.7% of the total area of the province, the quantity of water
resources accounts for 71% of the total. In the Yellow River Valley north of the Qinling
Mountains which takes up 63.3% of the total provincial area, the quantity of water resources
is only 29% of the total.
China Climate Change Partnership Framework - Enhanced strategies for climate-proofed and environmentally sound agricultural production in the Yellow River Basin (C-PESAP)
·14·
Table 1-2 Length and Drainage Area of Major Rivers in Shaanxi
River Length (km) Drainage Area (km2) Water System
Wuding River 491.2 30,261 Yellow River
Yanhe River 284.3 7,687 Yellow River
Jinghe River 455.1 45,421 Yellow River
Weihe River 818 62,440 Yellow River
Beiluo River 680.3 26,905 Yellow River
Jialing River 244 9,930 Yangtze River
Hanjiang River 652 61,959 Yangtze River
Danjiang River 244 7,551 Yangtze River
1.2.2.5 Forest, fauna and floral resources
In 2007, the forest area in the province totaled 7.6756 million ha, the forest coverage
rate 37.26%, and the stock volume 361 million m3. The area of natural forest reached 4.6759
million ha, mainly in the Qinling-Daba mountains, Guanshan Mountain, Huanglong Mountain
and Qiaoshan Mountain. Due to complicated climate and topographical conditions, Shaanxi
boasts a variety of fauna and floral resources, making the province a natural museum. In
particular, the Qinling and Daba mountains are called the “gene library”, where there are
3,300 types of wild seed plants, accounting for 10% of the national total, 30 rare plants, and
800 medicinal plants. The Chinese kiwi-fruit, sea buckthorn, gynostemma plant and
selenium-rich tea resources merit development. The output and quality of raw lacquer rank
the top in China. Jujube, walnut and tung oil are traditional export products of the province.
Table 1-3 Statistics of land resources of Shaanxi in 2007
Item Area (million ha) Proportion (%)
Total area 20.580 100.0
Farmland 4.049 19.7
Paddy field 0.195 0.9
Dry land 2.980 14.5
Irrigated land 0.856 4.2
Forest 10.354 50.3
Shrub land 2.364 11.5
Scattered wood land 0.324 1.6
Land uncovered with wood 0.996 4.8
Grassland 3.066 14.9
Artificially improved grasslasnd 0.229 1.1
Garden plots 0.705 3.4
Others 2.406 11.7
Situation Analysis of Shaanxi Province
·15·
The output of herbal plants, including gastrodia tuber, eucommia, bitter apricot kernel and
liquorice is huge in China. The province is also home to many precious wild vertebrates.
There are 604 species of wild animals, 380 birds and 147 mammals, all of which account for
30% of the national total. There are 77 amphibian reptiles, taking up 13% of the national total.
There are also 69 precious animals, including 12 animals that are listed as the grade one
protected animals such as giant panda, golden monkey, takin and ibis.
1.2.2.6 Land Resources
See Table 1-3 for the land resources of the province in 2007. Large proportion of dry-
farming land is a distinctive characteristic of the land resources in the province. In the current
farmland, paddy field and irrigated land only covers 26% of the total farmland area, with the
resting 74% being dry-farming land. Moreover, the land quality is poor. About 70% of the
area suffers water and soil loss, among which 40% is slope land.
1.2.2.7 Social Economy
According to preliminary calculation, the GNP of Shaanxi totaled RMB685.132 billion in 2008, 2.83% of the national total. Amongst, the added value of the primary industry was RMB75.372 billion, 11% of the total. The added value of the secondary industry reached RMB 384.208 billion, 56.1% of the total. The added value of the tertiary industry amounted to RMB 225.552 billion, 32.9% of the total. The per capita product stood at RMB18,246. A total of RMB 483.515 billion was invested in fixed assets across the province. The industrial added value of industrial enterprises above a designated size reached RMB 298.807 billion. The import and export reached US$8.368 billion (including US$ 2.961 billion of import and 5.407 billion of export). In 2008, the total retail sales of consumer goods in the province totaled RMB225.609 billion, up 25.3% year on year, hitting a record high since 1998. The per capita disposable income of urban residents amounted to RMB12,858 and the per capita net income of rural residents reached RMB3,136. As is shown in Table 1-4, the per capita disposable income of both urban and rural residents in the province in 2007 was far below the national average, and behind the other three provinces covered in the project (The per capita disposable income of urban residents in Ningxia, Henan and Shandong ranked the 25th, 18th and 8th respectively, while that of rural residents in the three provinces ranked 25th, 17th and 8th respectively).
China Climate Change Partnership Framework - Enhanced strategies for climate-proofed and environmentally sound agricultural production in the Yellow River Basin (C-PESAP)
·16·
Table 1-4 Proportion and ranking of some socio-economic indicators of the province in China
2007 2008 Index
Shaanxi National Proportion
(%) Ranking Shaanxi National
Proportion (%)
Total population (million) 37.48 1,321.29 2.84 17 37.62 1,328.02 2.83
Per capita disposable income of urban residents (RMB)
10,763 13,786 78.07 26 12,858 15,781 81.48
Per capita nonproductive expenditure of urban residents (RMB)
8,427 9,997 84.30 17 — — —
Per capita net income of rural residents (RMB)
2,645 4,140 63.89 28 3,136 4,671 67.14
Per capita nonproductive expenditure of rural residents (RMB)
2,560 3,224 79.40 22 — — —
Note: The data for 2007 comes from the Shaanxi Statistical Yearbook 2008. The data of 2008 was from the Statistical Communiqué of the People's Republic of China on the 2008 National Economic and Social Development and the Statistical Communiqué of Shaanxi Province on the 2008 National Economic and Social Development. The national data excludes HK SAR, Macau SAR and Taiwan.
Situation Analysis of Shaanxi Province
·17·
2 Agriculture situation in Shaanxi
2.1 Production and cropping systems
Shaanxi is located in the middle and lower reaches of the Yellow River. As it spans temperate zone and north sub-tropical zone, it is suitable for the growth of many grain and cash crops, including wheat, maize, bean, rice, cotton, grain sorghum, millet, potato, sweet potato, rape, peanut, water melon, sweet melon, tobacco, bast fiber crops, sugar crops and vegetables. The fruits grown the province include apple, pear, orange, peach, plum, apricot, guava, cherry, jujube, Chinese gooseberry, walnut, Chinese chestnut, tea, mulberry and flowers.
2.1.1 Main crops, production and cropping areas
The major crops grown in Shaanxi include grain, cotton, oil and other cash crops. Amongst, summer grain crops mainly include wheat, and autumn crops mainly include maize, soybean and rice. Rape is the major oil crop, followed by peanut. Other cash crops include vegetables, flue-cured tobacco and melons, followed by bast fibre crops and sugar crops. Among grain crops, summer crops cover 39%~50% (with the average being 45.3%) of the total sown area and the output takes up 35%~52% (with the average being 43.7%) of the total. Amongst, wheat is the major crop, whose sown area accounts for 69.8%~89.7% of the total sown area of summer crops. The sown area of autumn crops takes up 50%~61% (with the average being 54.7%) of the total sown area, and the output 48%~65% (with the average being 56.3%) of the total. Amongst, maize is the major crop, whose sown area accounts for 30.3%~59.9% of the total of autumn crops, followed by soybean and rice which account for 8.3%~16.3% and 4.9%~7.7% of the total respectively. The sown area of the three crops take up 48%~76% of the total sown area of autumn crops.
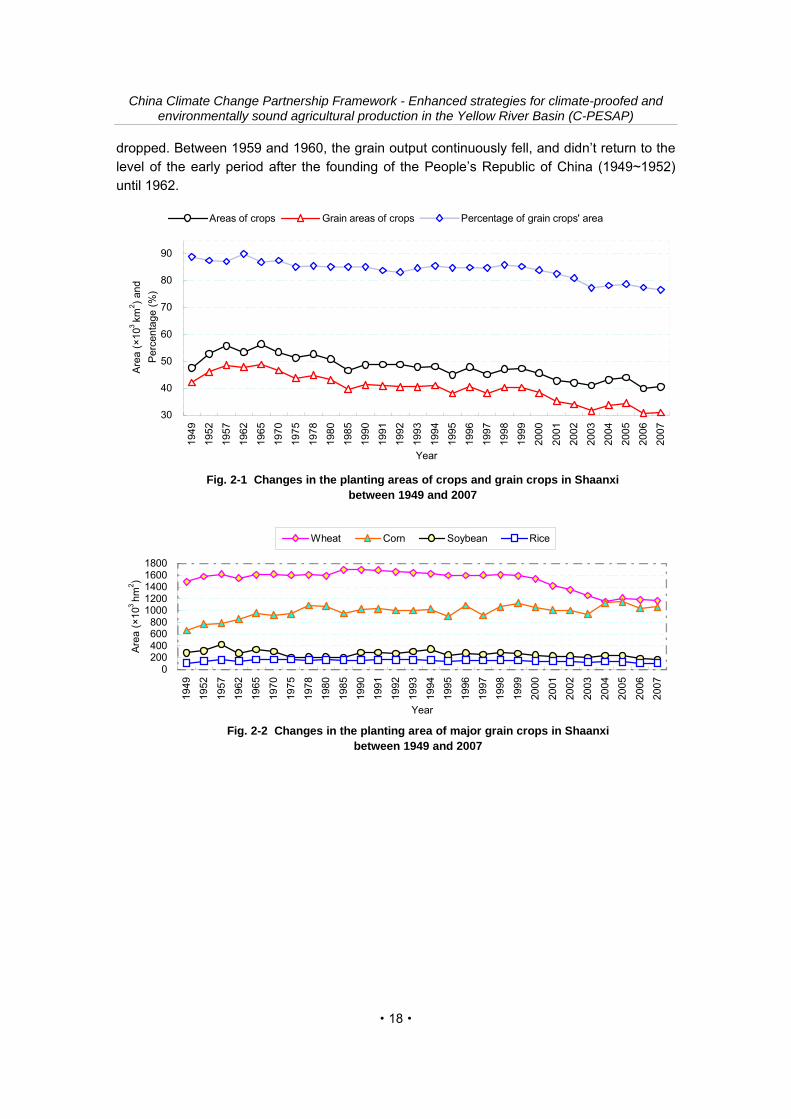
Since the founding of the People’s Republic of China, the total sown area of crops, grain crops, total output and unit yield grain of Shaanxi Province witnessed some changes in different stages, as illustrated in figures 2-1, 2-2, 2-3 and 2-4. The proportion of grain crops in the total sown area of crops is declining from 88.8% at the beginning to 76.6% in 2007.
In the early period after the founding of the People’s Republic of China, with the land reform and recovery of rural economy, the sown area of crops and grain crops registered a rapid growth (Figure 2-3), which grew from 4.743 million ha to 5.576 million ha and from 4.210 million ha to 4.853 million ha respectively. The grain output also rose steadily from 3.31 million tons in 1949 to 4.44 million tons in 1957. The unit grain yield also increased (Figure 2-4) from 786kg/ha in 1949 to 915kg/ha in 1957(the total output and unit yield of rice suffered a major setback in 1952 due to natural disasters).
Between 1958 and 1962, because of the “Great Leap Forward Movement” which unilaterally focused on industrial development and the natural disasters in three years, the agricultural production was severely affected. The total sown area of crops and grain crops
China Climate Change Partnership Framework - Enhanced strategies for climate-proofed and environmentally sound agricultural production in the Yellow River Basin (C-PESAP)
·18·
dropped. Between 1959 and 1960, the grain output continuously fell, and didn’t return to the level of the early period after the founding of the People’s Republic of China (1949~1952) until 1962.
Fig. 2-1 Changes in the planting areas of crops and grain crops in Shaanxibetween 1949 and 2007
30
40
50
60
70
80
90
1949
1952
1957
1962
1965
1970
1975
1978
1980
1985
1990
1991
1992
1993
1994
1995
1996
1997
1998
1999
2000
2001
2002
2003
2004
2005
2006
2007
Year
Are
a (×
103
km2 )
and
Per
cent
age
(%)
Areas of crops Grain areas of crops Percentage of grain crops' area
Fig. 2-2 Changes in the planting area of major grain crops in Shaanxibetween 1949 and 2007
0200400600800
10001200140016001800
1949
1952
1957
1962
1965
1970
1975
1978
1980
1985
1990
1991
1992
1993
1994
1995
1996
1997
1998
1999
2000
2001
2002
2003
2004
2005
2006
2007
Year
Are
a (×
103
hm2 )
Wheat Corn Soybean Rice
Situation Analysis of Shaanxi Province
·19·
Fig. 2-3 Changes in total grain output in Shaanxi between 1949 and 2007
0
200
400
600
800
1000
1200
140019
49
1952
1957
1962
1965
1970
1975
1978
1980
1985
1990
1991
1992
1993
1994
1995
1996
1997
1998
1999
2000
2001
2002
2003
2004
2005
2006
2007
Year
Out
put (
10 m
illio
n kg
)
Wheat Corn Soybean Rice Whole grain
Fig. 2-4 Changes in unit yield of major grain crops in Shaanxibetween 1949 and 2007
0
1000
2000
3000
4000
5000
6000
7000
1949
1952
1957
1962
1965
1970
1975
1978
1980
1985
1990
1991
1992
1993
1994
1995
1996
1997
1998
1999
2000
2001
2002
2003
2004
2005
2006
2007
Year
Uni
t yie
ld (
kg/h
m2)
Wheat Corn Soybean Rice Grain crops
In 1965, the sown area of crops and grain crops in Shaanxi grew to the highest level to
5.334 million and 4.661 million ha respectively. The unit yield of grain also reported a
significant increase. The total grain output rose to a new level of 6.075 million tons, up 52%
over 1962. After that, due to the continuous decline in farmland area, the total sown area of
crops and grain crops also dropped. In particular, they fell by the largest margin between
1965 and 1985. However, thanks to the cultivation of disease-resistant breeds, improvement
of farmland water conservancy conditions, the mass production and application of fertilizers,
the unit yield and total output of grain were greatly increased (except in a few years when
they slightly dropped due to natural disasters). In 1990, the total grain output reached 10.707
million tons.
Between 1991 and 1992, due to major changes in planting structure, the proportion of
sown area of grain corps reported a decline (See Figure 2-1), and rose somewhat in 1993
and 1994. As a result of falling sown area and unit yield of wheat and soybean, the total
China Climate Change Partnership Framework - Enhanced strategies for climate-proofed and environmentally sound agricultural production in the Yellow River Basin (C-PESAP)
·20·
grain output dropped successively in 1991 and 1992 to 10.47 million and 10.361 million tons
respectively.
Between 1993 and 1999, except in 1995 and 1997 when the total sown area of crops
and grain crops dropped dramatically because of severe drought, the sown area generally
presented a slow decline. But the grain output fluctuated dramatically as a result of frequent
drought. After a good harvest in 1993 (with the total output being 12.156 million tons),
drought protracted for three years to 1995. After that, drought occurred in 1997, 1999 and
2000. The sowing of grain crops were directly affected by the drought in 1995 and 1997.The
total grain output reached 9.446 million tons, 9.134 million tons, 10.444 million tons and
10.816 million tons in 1994, 1995, 1997 and 1999 respectively. When the harvest was good
in 1996 and 1998, the grain output totaled 12.713 million tons and 13.031 million tons
respectively.
Between 2000 and 2007, due to drought and other reasons, the proportion of sown
areas of crops and grain crops in the total area dropped greatly (except in 2004 and 2005
when the proportion rose somewhat). The extreme meteorological phenomena (dry and
warm winter, abnormal coldness in spring, rainstorm, hail and gale) occurred frequently. As a
result, the unit yield was affected. However, the total grain output increased year after year.
But because the sown area was decreasing, the total grain output still remained low. Even in
2004 and 2005 when the output was higher (11.604 million tons and 11.395 million tons
respectively), the output didn’t return to the level of harvest years at the end of the 20th
century.
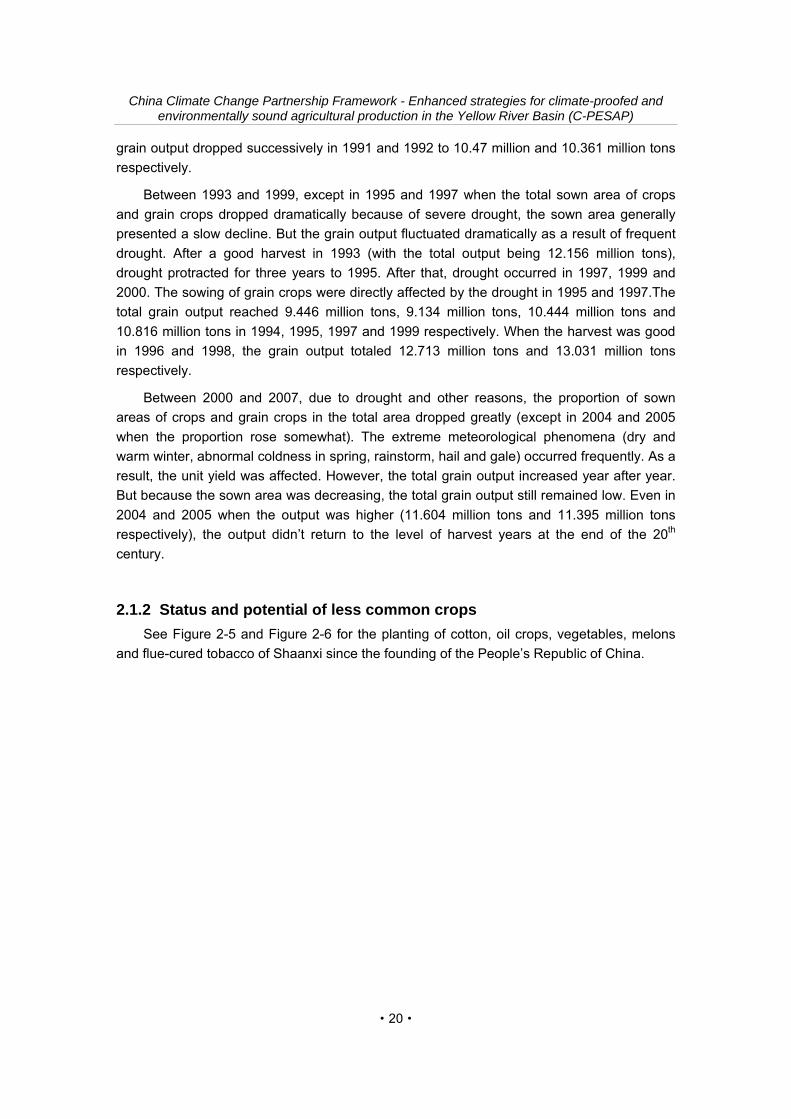
2.1.2 Status and potential of less common crops
See Figure 2-5 and Figure 2-6 for the planting of cotton, oil crops, vegetables, melons
and flue-cured tobacco of Shaanxi since the founding of the People’s Republic of China.
Situation Analysis of Shaanxi Province
·21·
Fig. 2-5 Changes in the planting areas of cotton, oil and other major cashcrops in Shaanxi between 1949 and 2007
0
50
100
150
200
250
300
350
40019
49
1952
1957
1962
1965
1970
1975
1978
1980
1985
1990
1991
1992
1993
1994
1995
1996
1997
1998
1999
2000
2001
2002
2003
2004
2005
2006
2007
Year
Are
a (×
103
hm2)
Cotton Oil crops Tobacco Vegetables Melons
Fig. 2-6 Proportions of planting areas of cotton, oil and other cash crops intotal crops in Shaanxi between 1949 and 2007
0
2
4
6
8
10
12
1949
1952
1957
1962
1965
1970
1975
1978
1980
1985
1990
1991
1992
1993
1994
1995
1996
1997
1998
1999
2000
2001
2002
2003
2004
2005
2006
2007
Year
Pro
port
ion
(%)
Cotton Oil crops Other cash crops
1. Cotton
As is shown in Figure 2-5, the change in planting area of cotton was basically the same
as that of grain crops before 1980. The area grew rapidly at the beginning after the founding
of the People’s Republic of China, which rose to 3.21 million ha, and the output grew to a
record high of 116,200 tons. Then the area dropped to 193,000 ha, and the output fell to
45,000 tons. After that, the area returned to 269,000 ha, and the output surged to 114,700
tons in 1965. In the next 15 years, the planting area of cotton slowly declined (while the
proportion remained basically stable). Except in 1978 when the unit yield was high (420kg/ha)
and the total output 105,400 tons, the total output of cotton witnessed a continuous drop in
other years (Figure 2-7). From 1980, the planting area began to slide significantly to only
China Climate Change Partnership Framework - Enhanced strategies for climate-proofed and environmentally sound agricultural production in the Yellow River Basin (C-PESAP)
·22·
94,700 ha in 1985. Although the unit yield increased (450kg/ha), the total output only
reached 43,000t (Figure 2-7). Then the planting area gradually picked up to 139,000 ha in
1992. The unit yield also rose continuously to 675~690kg/ha in 1990 and 1991. The total
output reached 90,000t in 1991. However, the production was reduced due to natural
disasters in 1992 (with the unit yield being only 405kg/ha), severely hurting the enthusiasm
of farmers. From 1993, the planting area began to slide again to less than 28,000 ha in 1999
when the total output was only 19,500t, a record low since the founding of the People’s
Republic of China. Then from 2000, the planting area began to rise again, and the unit yield
was also greatly increased (except in 2003). As a result, the total output reported a rapid
growth. In 2007, there were seven counties that were listed as commodity cotton bases,
whose planting area totaled 66,000ha, 74.2% of the province. The total output reached
71,000t, 79.2% of the province.
Fig. 2-7 Total output and unit yield of cotton in Shaanxi between 1949 and2007
0100200300400500600
700800900
100011001200
1949
1952
1957
1962
1965
1970
1975
1978
1980
1985
1990
1991
1992
1993
1994
1995
1996
1997
1998
1999
2000
2001
2002
2003
2004
2005
2006
2007
Year
Tot
al o
utpu
t (×
100t
on)
&
unit
yiel
d (k
g/hm
2 )
Total output Unit yield
2. Oil Crops
The smallest sown area of oil crops reached only 92,000 ha (1962), representing 1.73%
of the total sown area of crops. Between 1978 and 1992, the sown area grew rapidly from
130,000 ha to 323,000 ha, up 148%, and the proportion in total sown area of crops increased
to 6.6%. From 1993, the sown area of oil crops presented a slow decline. But the proportion
of oil crops in total sown area of crops remained stable at about 6.1%~7.0% (Figure 2-5 and
Figure 2-6). As the unit yield kept rising, the total output maintained on track, reaching a
record high of 460,000t in 2004. In 2006 and 2007, because of the declining sown area, the
total output stood at 410,000t and 390,000t respectively. At present, the oil crops in Shaanxi
mainly include rape and peanut, whose sown area account for 65% and 11% of the total
sown area of oil crops respectively.
3. Other Cash Crops
Unlike grain, cotton and oil crops, other cash crops like vegetables, fruits and melons
reported a spiraling sown area because of higher economic values. The sown area
increased from 44,000 ha at the beginning after the founding of the People’s Republic of
Situation Analysis of Shaanxi Province
·23·
China to 463,000 ha in 2007, and the proportion of sown area in total of crops grew from
0.9% to 11.4% (Figure 2-6). Amongst, vegetables saw the rapidest growth in sown area,
followed by fruits and melons (Figure 2-5). The production of flue-cured tobacco began to
rise at the beginning of the 1980’s, dropped somewhat in late 1990’s, and got stable from the
beginning of the 21st century. Because of the shrinking market demand and unstable
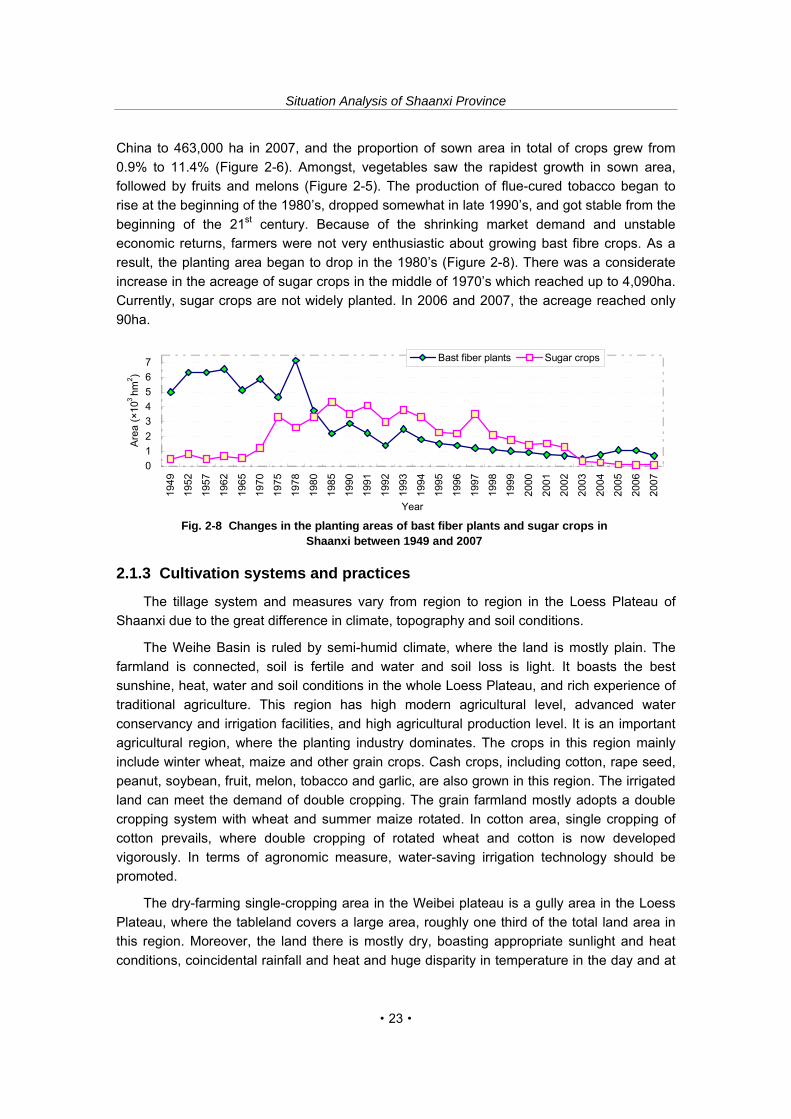
economic returns, farmers were not very enthusiastic about growing bast fibre crops. As a
result, the planting area began to drop in the 1980’s (Figure 2-8). There was a considerate
increase in the acreage of sugar crops in the middle of 1970’s which reached up to 4,090ha.
Currently, sugar crops are not widely planted. In 2006 and 2007, the acreage reached only
90ha.
Fig. 2-8 Changes in the planting areas of bast fiber plants and sugar crops inShaanxi between 1949 and 2007
0
1
2
3
4
5
6
7
1949
1952
1957
1962
1965
1970
1975
1978
1980
1985
1990
1991
1992
1993
1994
1995
1996
1997
1998
1999
2000
2001
2002
2003
2004
2005
2006
2007
Year
Are
a (×
103
hm2 )
Bast fiber plants Sugar crops
2.1.3 Cultivation systems and practices
The tillage system and measures vary from region to region in the Loess Plateau of
Shaanxi due to the great difference in climate, topography and soil conditions.
The Weihe Basin is ruled by semi-humid climate, where the land is mostly plain. The
farmland is connected, soil is fertile and water and soil loss is light. It boasts the best
sunshine, heat, water and soil conditions in the whole Loess Plateau, and rich experience of
traditional agriculture. This region has high modern agricultural level, advanced water
conservancy and irrigation facilities, and high agricultural production level. It is an important
agricultural region, where the planting industry dominates. The crops in this region mainly
include winter wheat, maize and other grain crops. Cash crops, including cotton, rape seed,
peanut, soybean, fruit, melon, tobacco and garlic, are also grown in this region. The irrigated
land can meet the demand of double cropping. The grain farmland mostly adopts a double
cropping system with wheat and summer maize rotated. In cotton area, single cropping of
cotton prevails, where double cropping of rotated wheat and cotton is now developed
vigorously. In terms of agronomic measure, water-saving irrigation technology should be
promoted.
The dry-farming single-cropping area in the Weibei plateau is a gully area in the Loess
Plateau, where the tableland covers a large area, roughly one third of the total land area in
this region. Moreover, the land there is mostly dry, boasting appropriate sunlight and heat
conditions, coincidental rainfall and heat and huge disparity in temperature in the day and at
China Climate Change Partnership Framework - Enhanced strategies for climate-proofed and environmentally sound agricultural production in the Yellow River Basin (C-PESAP)
·24·
night, and a wide variety of crop species. However, rainfall is limited and evenly distributed in
different seasons. Drought occurs frequently, and the eco-environment is quite fragile.
Agriculture in this region is dominated by planting which contributes more than 70% of the
total agricultural output. Due to the effect of natural factors, wheat is the major crop in this
region, where the tillage system is single cropping. The farming is extensive. Much of the
land is farmed but not fertilized, or much more attention is paid to farming while the
fertilization is ignored. As a result, soil in this region is quite infertile, soil fertility exhausted
and land productivity low. Drought is the most severe threat to agriculture in this region.
Straw mulching, film mulching, rotation and fallow, forage and grain rotation, less tillage and
no tillage are all the measures that can effectively preserve water and fertility of soil.
Therefore, they should be adopted in light of local conditions.
The loess hilly dry-farming land in the north of the province where single cropping
system is adopted is abundant with sunshine resources, and the heat resources can meet
the normal growth requirements of late autumn crops. But because of drought, soil infertility,
serious water and soil erosion, the eco-environmental conditions in this region are quite poor,
and agricultural productivity is low, severely affecting the utilization of sunshine and heat
resources. Agriculture in this region is characterized by extensive cultivation. Grain crops
dominate in this region, including grain, millet, potato, wheat and broom corn millet. The
tillage system is single cropping. Drought is the major factor that hinders agriculture, while
low soil fertility is the direct reason for low and unstable grain output. Drought-fighting and
soil moisture-preserving measures are emphasized, such as drought-resistant and high-yield
ditch, film mulching and hole seeding. To prevent water and soil loss, contour tillage, contour
farming, strip cropping and other water and soil-preserving measures are adopted in
mountainous areas. The extension of level furrow planting and furrow and ridge planting is
also emphasized. This region should be built into a forestry and animal husbandry base,
where, in light of the characteristic of much per capita farmland, green manure and bird's-foot
should be planted, and forage rotation should be adopted to increase content of organic
substance in soil. Moreover, afforestation should be vigorously developed in this region to
preserve the water and soil, boost animal husbandry and farming. The farmland should
adopt conservation tillage measures, including level furrow planting, furrow and ridge
film mulching and furrow seeding, level ditch at an interval of slope and strip cropping of
grain and grass to reduce the water and soil loss.
2.2 Socio-economic aspects 2.2.1 Crop prices, income and profitability
The output of agricultural products is very volatile because it is highly prone to the effect
of climate change and many other factors. Moreover, affected by the market supply and
demand, the price of agricultural products often fluctuates. According to related information,
the price of agricultural products kept rising in 2007, hitting a record high of 18.87% in the
third quarter, and up 11.42% in the first three quarters. Amongst, the price of agricultural
Situation Analysis of Shaanxi Province
·25·
(planting) products went up 10.89%, that of forestry products rose 1.54%, and that of animal
husbandry products (livestock products) surged 12.88%. The price of food, oil and vegetable
products was high in 2007, giving rise to spiraling CPI. The price of oil products rose by
33.26%, representing the largest margin. The average price of wheat in the first three
quarters was RMB1.39/kg, up RMB0.06/kg year on year. The price of maize in the first three
quarters was RMB1.32, 1.35 and 1.41/kg respectively, with the average price being
RMB1.36/kg. The price of oil products remained high, with the price index up 33.26%. The
price of peanut, rape seed and sesame also rose significantly. Amongst, the price of rape
seed went up RMB1.02/kg year on year and that of vegetables rose 11.52%. The major
reason for high vegetable price was that there was much rain in the summer of 2007, the
pests were severe and caused low output, and consequently the price rose. The price of
fruits rose 15.7% in the first three quarters. In the year, the price of livestock products went
spiraling and hit a record high in the third quarter. The price of live pig and pork was 20.73%
higher than in 2006, and surged 74.69% year on year in the third quarter. The price of poultry
eggs went up 18.08%, and the price of eggs hit the highest level in the second quarter and
began to fall in the third quarter. The price of eggs was RMB5.96, 7.26 and 6.18/kg in the
first three quarters respectively. Against the backdrop of nationwide rising price of
agricultural products in the second quarter, the price of agricultural products in the province
also remained at a high range, up 8% year on year. The price index was 101.07 for farming,
110.6 for forestry, 116.71 for animal husbandry and 100 for fishery. The major products that
spawned the index rise included maize, live pig and egg. The price of maize was
RMB1.35/kg, up 21.19%; the price of live pig was RMB9/kg and that of pork was
RMB11.57%, up 20.11% and 18.41% respectively. The price of egg was RMB7.15, up
16.69%.
In 2008, the price of agricultural products also remained high in Shaanxi, which began to
drop considerately in the first quarter of 2009, down 8% year on year. The price of planting
industry fell 11.9%. Amongst, the price of wheat went up by 5.5% year on year. The price of
maize fell dramatically. The price of vegetables rose 6.41%, and the price of fruits declined.
At the same time, the price of animal products also dropped. The price of live pig witnessed
an abrupt decline of 11.9% year on year in the first quarter. The price of pork reported a fall
of 10.7%. Due to the effect of falling price of pork, the price of live sheep/goat and mutton
also registered a small margin of drop. Because of the melamine, the sales volume and price
of dairy products posted a downturn. The cow and goat milk went down 20.1% and 40%
respectively year on year. The price of poultry eggs rose slightly. The price of eggs went up
2% year on year.
The price hike of agricultural products is often accompanied with the increasing price of
production materials (chemical fertilizer, agricultural film and diesel oil). In particular, the
price of diesel oil remained high in recent years. Moreover, the agricultural and animal
husbandry does not deliver a high profitability. As a result, the price rise of agricultural
products does not bring much more profit to farmers. On the contrary, if the price drops,
farmers will suffer much loss. In particular, vegetable, fruit and melon planters will face
severe market risks.
China Climate Change Partnership Framework - Enhanced strategies for climate-proofed and environmentally sound agricultural production in the Yellow River Basin (C-PESAP)
·26·
2.2.2 Agricultural credit and non-agricultural income
2.2.2.1 Shaanxi rural credit cooperative union
Founded on December 1 of 191, Shaanxi Rural Credit Cooperative Union is called
SRCCU for short. After more than five decades of growth, it has developed into a financial
institution whose offices cover all the urban and rural areas, which is staffed with a large
number of employees, has a large business scale, employs a flexible operating mechanism,
serves an array of customers, applies advanced settlement methods, and provides a full
range of services. It serves as a main force in the economic development in the province,
especially in rural areas. In August of 2004, 107 county-level credit cooperative unions
initiated SRCCU, which substitutes the provincial government to administer the rural credit
cooperatives in the province. As of the end of November of 2007, the savings deposited at
and loans lent by SRCCU stood at RMB108.425 billion and 77.818 billion respectively, which
accounted for 12.91% and 15.58% of the total of financial institutions in the province, ranking
the forth and first in the financial sector. The profit made by SRCCU reached RMB1.409
billion. Intra-bank depositing and drawing is achieved among all the rural credit cooperatives.
The system of SRCCU also interworks with that of China UnionPay. Moreover, SRCCU
issued its own bank card, Futai Card, strengthening the settlement and financial service
ability of rural credit cooperatives. Credit business in rural areas has become an important
source of funds for farmers in the province to carry out business activities.
2.2.2.2 Non-agricultural income of rural residents
The income of rural residents comprises wages income, family business income,
property income and transfer income. Amongst, family business income includes the income
from the primary industry (farming, forestry, animal husbandry and fishery), the secondary
industry (industry and construction) and the tertiary industry (traffic, transportation, post,
wholesale and retail, catering, social service, culture, education, health and other household
business activities). If divided into agricultural and non-agricultural sectors, the non-
agricultural income consists of wages income, income from forestry, animal husbandry and
fishery, income from the secondary and tertiary industries, property income and transfer
income. See Figure 2-9 for the per capita net income and non-agricultural income of rural
residents of Shaanxi in 2001~2007, and see Table 2-1 for the composition. From Table 2-1,
we can see that the income from forestry, animal husbandry and fishery, the secondary and
tertiary industries account for a smaller and declining proportion in the non-agricultural
income of rural residents in the province.
Situation Analysis of Shaanxi Province
·27·
Fig. 2-9 Per capita net income and non-agricultural income of ruralresidents in 2001~2007
The development of non-agricultural sectors is a primary approach to increase the income of farmers rapidly. The process of rapid income growth of farmers is closely related to agricultural modernization and development of non-agricultural sectors. Generally, the larger proportion of non-agricultural sectors account for in the economy, the more rapidly the income of farmers will grow. According to the spot check of related departments, in all the villages where the per capita income of farmers reached RMB3,000, industry is developed rapidly. Villages which feature strong economic strength and good village appearance have village-run businesses. Moreover, the tertiary industry has become an important or even the main source of income for farmers in places where the tertiary industry grows rapidly. For instance, Shangwang Village of Chang’an District in Xi’an is one of the earliest villages that started to develop farmer household tourism. 108 of the 183 households in the village run farmer household tourism which employ around 500 people, 40% of whom are from other places. Since the farmer household tourism was initiated, the per capita net income of farmers in the village increased from less than RMB1,000 in 2003 to RMB8,000 in 2006. Seizing the opportunity brought by the highway and rapid development of tourism, Zhashui County developed farmer household tourism business in five towns and six villages. 206 households are engaged in this business, employing 1,300 people. In January~August of
Table 2-1 Composition of per capita net income of rural residents in 2001~2007
China Climate Change Partnership Framework - Enhanced strategies for climate-proofed and environmentally sound agricultural production in the Yellow River Basin (C-PESAP)
·28·
2007, revenues from the business reached RMB5.8 million, and the per capita income stood at RMB2,600. Moreover, the development of native chicken raising, traditional food processing, vegetable growing, transportation and other businesses are boosted, providing a new way for more than 1,000 people from over 2,000 families to increase their income. On strength of Zhougong Temple and Wuzhangyuan Scenic Spot, and by providing local snacks including Qishan-style noodles, Qishan County develops folklore tourism which involves more than 300 households, accommodating more than 400,000 visitors each year. The annual average household income is more than RMB20,000, and the highest household income is up to RMB200,000. In addition, the tertiary industry in rural areas, including logistics, transportation and folk crafts grow at a rapid pace. For instance, the vegetable
market run by farmers of Jingyang has more than 300 fixed booths that employ nearly 1,000 people. Vegetables from the market are sold to other provinces in China’s northwest, playing an important role in raising the income of vegetable planters and increasing the employment. The cash income of local farmers is 50% higher than the provincial average. Regional professional markets are developed for dominant products, such as the garlic of Huaxian, tea of Hanzhong, miscellaneous grain of Shaanbei. More and more farmers are engaged in marketing and related services for such products. This not only greatly increases their income, but also boosts the local economic growth and raises the income of farmers in surrounding areas. The transport service providers in the province reached 22,000 in number in 2006, 15,000 more than in 2004. In recent years, the export of labor service has also become an important income source of farmers and a notable income contributor. According to statistics, two thirds of the outgoing laborers from Shangluo receive less than junior high school education. Following the principle of “training before export”, a total of 418,000 rural
laborers were trained between 2002 and 2006, and 139,000 rural laborers were trained between January and August of 2007. More than 80% of the outgoing rural laborers are trained, yielding a sound effect.
Due to its unique historical background of the province, non-agricultural development in Shaanxi started late, grew at a slow pace, and accounted for a small proportion. Compared with the national average, especially the developed regions in China east, Shaanxi still has a large gap to cover in terms of developing the non-agricultural sectors and increasing the income of farmers, and this gap continues to widen. The household net income from the secondary and tertiary industries in rural areas was only RMB132.5 (excluding the income from labor services in urban areas) in 1996 and RMB233 in 2007, up only RMB100.5. In many cities, the market for rural laborers is nearly saturated. As a result of the transition of labor service export from number-oriented to quality-oriented, the room for farmers to increase their incomes by providing labor service in urban areas is quite limited. Due to the restriction of cultural quality and technique, most of the farmers who work in urban areas are only engaged in simple, onerous and low-income services. The income gap between different regions and farmers is widening. The income of farmers in areas which are close to cities and towns, boast sound conditions for agricultural production, rich mineral and tourism resources is relatively higher and grows faster. In poverty-stricken, remote and backward areas, the income of farmers is lower and lacks growth potential. The income gap between farmers in these areas is constantly widening.
Situation Analysis of Shaanxi Province
·29·
2.2.3 Contribution of agriculture, food transformation industries and food trade to GDP
2.2.3.1 Contribution of agriculture to GDP
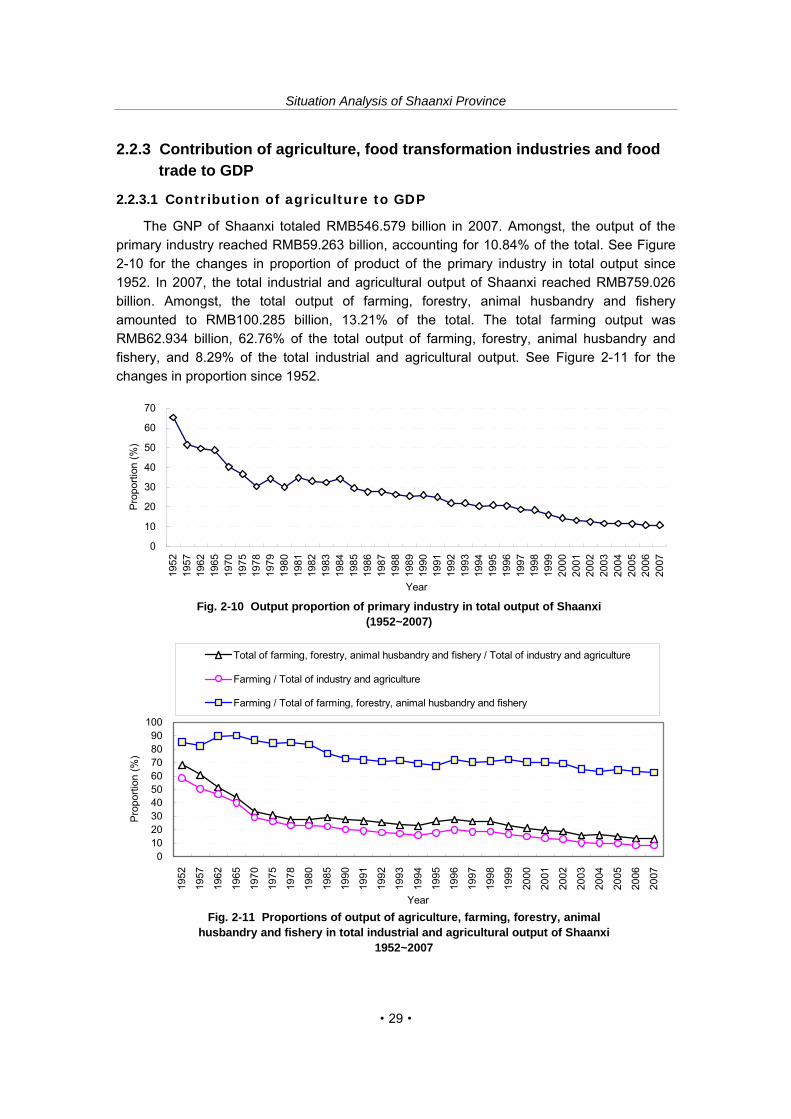
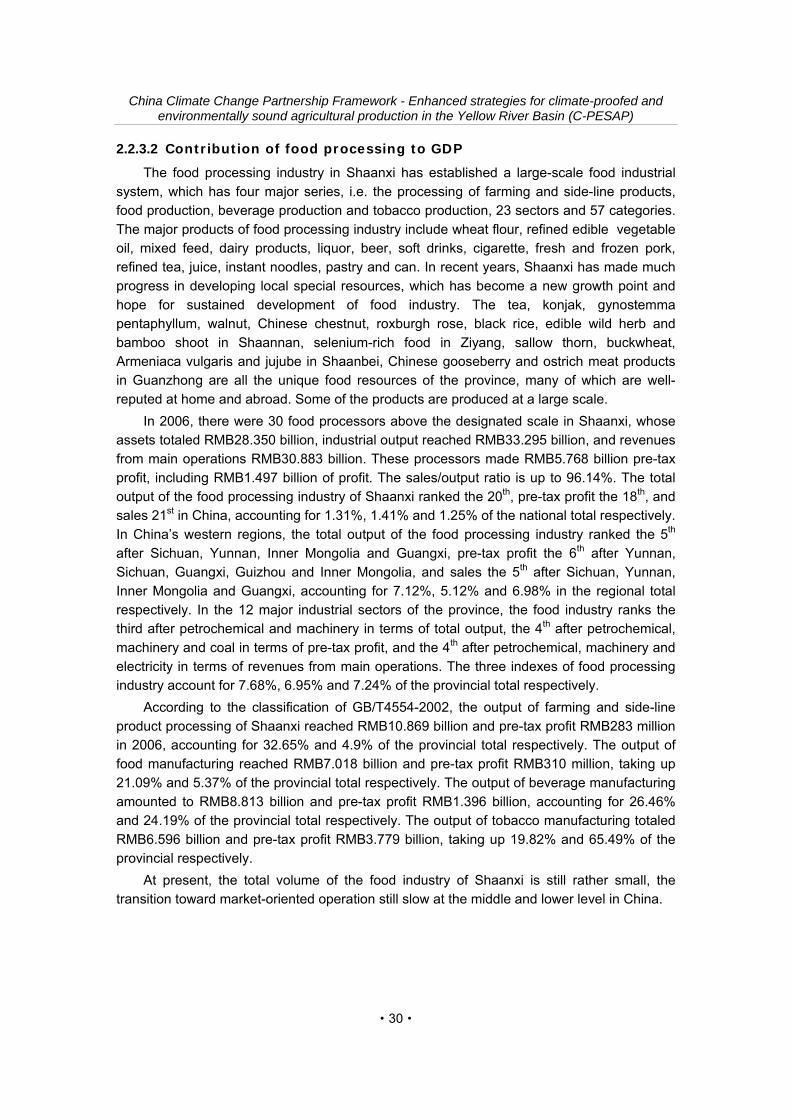
The GNP of Shaanxi totaled RMB546.579 billion in 2007. Amongst, the output of the primary industry reached RMB59.263 billion, accounting for 10.84% of the total. See Figure 2-10 for the changes in proportion of product of the primary industry in total output since 1952. In 2007, the total industrial and agricultural output of Shaanxi reached RMB759.026 billion. Amongst, the total output of farming, forestry, animal husbandry and fishery amounted to RMB100.285 billion, 13.21% of the total. The total farming output was RMB62.934 billion, 62.76% of the total output of farming, forestry, animal husbandry and fishery, and 8.29% of the total industrial and agricultural output. See Figure 2-11 for the changes in proportion since 1952.
Fig. 2-10 Output proportion of primary industry in total output of Shaanxi(1952~2007)
0
10
20
30
40
50
60
70
1952
1957
1962
1965
1970
1975
1978
1979
1980
1981
1982
1983
1984
1985
1986
1987
1988
1989
1990
1991
1992
1993
1994
1995
1996
1997
1998
1999
2000
2001
2002
2003
2004
2005
2006
2007
Year
Pro
port
ion
(%)
Fig. 2-11 Proportions of output of agriculture, farming, forestry, animalhusbandry and fishery in total industrial and agricultural output of Shaanxi
1952~2007
0102030405060708090
100
1952
1957
1962
1965
1970
1975
1978
1980
1985
1990
1991
1992
1993
1994
1995
1996
1997
1998
1999
2000
2001
2002
2003
2004
2005
2006
2007
Year
Pro
port
ion
(%)
Total of farming, forestry, animal husbandry and fishery / Total of industry and agriculture
Farming / Total of industry and agriculture
Farming / Total of farming, forestry, animal husbandry and fishery
China Climate Change Partnership Framework - Enhanced strategies for climate-proofed and environmentally sound agricultural production in the Yellow River Basin (C-PESAP)
·30·
2.2.3.2 Contribution of food processing to GDP
The food processing industry in Shaanxi has established a large-scale food industrial system, which has four major series, i.e. the processing of farming and side-line products, food production, beverage production and tobacco production, 23 sectors and 57 categories. The major products of food processing industry include wheat flour, refined edible vegetable oil, mixed feed, dairy products, liquor, beer, soft drinks, cigarette, fresh and frozen pork, refined tea, juice, instant noodles, pastry and can. In recent years, Shaanxi has made much progress in developing local special resources, which has become a new growth point and hope for sustained development of food industry. The tea, konjak, gynostemma pentaphyllum, walnut, Chinese chestnut, roxburgh rose, black rice, edible wild herb and bamboo shoot in Shaannan, selenium-rich food in Ziyang, sallow thorn, buckwheat, Armeniaca vulgaris and jujube in Shaanbei, Chinese gooseberry and ostrich meat products in Guanzhong are all the unique food resources of the province, many of which are well-reputed at home and abroad. Some of the products are produced at a large scale.
In 2006, there were 30 food processors above the designated scale in Shaanxi, whose assets totaled RMB28.350 billion, industrial output reached RMB33.295 billion, and revenues from main operations RMB30.883 billion. These processors made RMB5.768 billion pre-tax profit, including RMB1.497 billion of profit. The sales/output ratio is up to 96.14%. The total output of the food processing industry of Shaanxi ranked the 20th, pre-tax profit the 18th, and sales 21st in China, accounting for 1.31%, 1.41% and 1.25% of the national total respectively. In China’s western regions, the total output of the food processing industry ranked the 5th after Sichuan, Yunnan, Inner Mongolia and Guangxi, pre-tax profit the 6th after Yunnan, Sichuan, Guangxi, Guizhou and Inner Mongolia, and sales the 5th after Sichuan, Yunnan, Inner Mongolia and Guangxi, accounting for 7.12%, 5.12% and 6.98% in the regional total respectively. In the 12 major industrial sectors of the province, the food industry ranks the third after petrochemical and machinery in terms of total output, the 4th after petrochemical, machinery and coal in terms of pre-tax profit, and the 4th after petrochemical, machinery and electricity in terms of revenues from main operations. The three indexes of food processing industry account for 7.68%, 6.95% and 7.24% of the provincial total respectively.
According to the classification of GB/T4554-2002, the output of farming and side-line product processing of Shaanxi reached RMB10.869 billion and pre-tax profit RMB283 million in 2006, accounting for 32.65% and 4.9% of the provincial total respectively. The output of food manufacturing reached RMB7.018 billion and pre-tax profit RMB310 million, taking up 21.09% and 5.37% of the provincial total respectively. The output of beverage manufacturing amounted to RMB8.813 billion and pre-tax profit RMB1.396 billion, accounting for 26.46% and 24.19% of the provincial total respectively. The output of tobacco manufacturing totaled RMB6.596 billion and pre-tax profit RMB3.779 billion, taking up 19.82% and 65.49% of the provincial respectively.
At present, the total volume of the food industry of Shaanxi is still rather small, the transition toward market-oriented operation still slow at the middle and lower level in China.
Situation Analysis of Shaanxi Province
·31·
2.2.3.3 Export of major agricultural products
In 2007, the major export of agricultural products of Shaanxi included 13,846t of corn and corn products, valued at US$3.788 million, 2,125t of vegetables, value at US$2.545 million, 26,545t of dried bean, valued at US$19.329million, 40,305t of fresh, dry fruits and nuts, valued at US$24.447 million, 15,147t of edible oil seeds, valued at US$6.839 million, 300t of edible vegetable oil (including palm oil), valued at US$279,000, 1,561t of dried pepper, valued at US$2.959 million, 687t of flue-cured tobacco, valued at US$1.562 million, and 991t of natural honey, valued at US$1.736 million.
2.2.4 Food consumption and degree of self-sufficiency
The total grain production and supply is basically balanced in Shaanxi for many years. However, because of accelerated urbanization and industrialization, and agricultural restructuring, grain consumption is on the rise. There is a structural conflict between breeds and regions. The total grain output of the province is around 11.50 million tons each year, ensuring normal supply of grain. At present, the grain and oil stock is at a record high in history.
2.3 Partners and stakeholder institutions
2.3.1 Characteristics of farming communities
At the end of 2009, the total population of Shaanxi was 37.48million. The male/female ratio was 105.85. Rural residents accounted for 59.38% of the total. The proportion of agricultural population dropped from 85.32% in 1978 to 72.44%. People between 0~14 years old accounted for 18.14%, people between 15~64 years old 72.91% and people above 65 years old 8.96% of the total. Among people above 15 years old, illiterates took up 8.89%, higher than the national average of 8.40%, ranking the 11th in China. Among the male
population above 15 years old, illiterates accounted for 5.07%, higher than the national average of 4.35%, ranking the 9th in China. Among the female population above 15 years old, illiterates took up 12.64%, higher than the national average of 12.44%, ranking the 13th across the country. From Table 2-2 we can see that the proportions of people above 6 years old who receive no education and receive more than senior high school education are higher than the national average, and the proportions of people who receive less than primary school or junior high school education are lower than the national average. This shows that the nine-year compulsory education is less popular in Shaanxi than the national average.
There are 4.3 permanent residents in each family in rural areas, including 2.8 full and half laborers. On average, each laborer needs to support 1.5 people.
China Climate Change Partnership Framework - Enhanced strategies for climate-proofed and environmentally sound agricultural production in the Yellow River Basin (C-PESAP)
·32·
Table 2-2 Comparison between the proportion of people above 6 years in Shaanxi with different education background (%) and national average in 2007
Whole Male Female Level of education
Shaanxi National average
Shaanxi National average
Shaanxi National average
No schooling 8.38 8.01 4.91 4.36 11.85 11.73
primary school 28.81 31.80 27.15 30.18 30.47 33.44
Junior High School 39.18 40.22 41.54 43.05 36.81 37.35
Senior high school 15.91 13.41 17.66 15.18 14.15 11.61
College and above 7.72 6.56 8.74 7.23 6.72 5.87
Note: The latest data on the age composition and education background of rural population of Shaanxi is not available in related statistics.
2.3.2 Farmer associations and interest groups
The farmers’ associations and related groups in Shaanxi are mostly various cooperation
organizations which carry out cooperation for mutual assistance between producers and
marketers of the same agricultural products or the suppliers and users of the same
agricultural production and operation services on the basis of household contracted
responsibility. They are formed on a voluntary basis, conduct independent operation and
democratic management, provide service independently, and assume sole responsibility for
their profits or losses so that farmers can better adapt to the market economy and solve the
problems of information, technology, fund, supply and marketing in production and operation.
Such new market entities are the bridges between the independent farmers and the market,
which serve as important carriers that better organize the farmers for market access and
promote the industrial operation in agriculture. They also advance the transition from
traditional agriculture to modern agriculture. They play an active role in promoting agricultural
technologies, organizing standardized production, lowering costs for group purchase,
unifying sales and increasing revenues.
The economic cooperation organizations between farmers began to emerge and
develop from 1992. At that time, the grassroots technological and economic departments,
collective economic organizations in rural areas and rural supply and marketing cooperatives
failed to meet the diversified demand because of management mechanism, technological
competence, awareness and service model. Consequently, some large professional families
tried to set up various non-governmental organizations for cooperation on funds, technology,
production, supply, marketing, and processing on the basis of professional production,
including farmers’ technology associations, farmers’ technology research associations and
cooperatives. These professional cooperation organizations make up the demerits of the
social service systems in rural areas and become the links between farmers and market,
farmers and businesses, farmers and governments. They are hailed and supported by
farmers, and attract the attention of government leaders at various levels. In 1995, upon the
Situation Analysis of Shaanxi Province
·33·
approval of the State Council, Shaanxi was listed as one of the first pilot provinces for
farmers’ associations. It carried out pilot in Fengxiang, Jingyang, Huxian and Linwei counties.
After that, other parts of the province explored to establish farmers’ cooperation
organizations and accumulated much experience in this regard. In particular, they made
outstanding achievements on the farmers’ cooperation organizations for two advantageous
sectors, i.e. fruit and animal husbandry. The per capita income of members is higher than
non-members. In 1998, the provincial government expanded the pilot coverage to 17
counties/districts. It also issued the Opinions on Accelerating the Farmers’ Cooperation
Organizations in 2004 and 2009, and unveiled a host of preferential policies. From 2008, a
certain amount of special fund is earmarked from the government budgets at various levels
to support the farmers’ cooperation organizations to provide information, technology and
product certification services, formulate quality standards and train the members. The
preferential policies include: to temporarily exempt farmers’ cooperation organizations from
corporate income tax for the revenues they make by providing technical and labor services
during agricultural production; to exempt farmers from value-added tax for the sales of self-
produced agricultural products, and those that are classified, sorted out, primarily processed,
packed up and added trademarks by farmers without changing the shape; exempt the
revenues from farming machinery operation, drainage and irrigation, prevention and control
of diseases and pests, insurance for farming and animal husbandry, related technical
services, hybridization, prevention and control of epidemic diseases for livestock and poultry
from business tax; levy the value-added tax at a rat of 13% for the agricultural product
processors which meet requirements of taxation laws; and provide preferential taxation
policies stipulated in documents for farmers’ cooperation organizations that are listed as
leading enterprises of agricultural industrialization at the national and provincial level. When
farmers’ cooperation organizations purchase tax-free agricultural products, the taxable
amount can be calculated at a rate of 10% upon the purchase vouchers approved by
taxation authority. When farmers’ cooperation organizations need land to set up agricultural
technology demonstration bases, flower and plant nursery bases and procure agricultural
products, the village collective economic organizations can ensure the land supply on the
principle of willingness and payment by renting the land or becoming a shareholder. The land
and resources administration at various levels should give priority and grant the construction
land quota to agricultural product processors. The electricity and pricing authorities should
approve and apply non-industries and common industries electricity fee to the electricity
used by farmers’ cooperation organizations for primary processing of agricultural products.
Moreover, support should be rendered to farmers’ cooperation organizations in terms of
project declaration, import & export rights and talent introduction, and credit service should
be strengthened in this regard.
The farmers’ cooperation organizations are normally set up according to the local
dominant industries and special agricultural products. For instance, the farmers’ cooperation
organizations in Shaanbei are mainly for cattle raising, sheep/goat raising, miscellaneous
grain crops, jujube and jam. Farmers’ cooperation organizations in Guanzhong are mainly for
fruit, cultivation, vegetables, plants and flowers. Shaannan mainly develops organizations on
China Climate Change Partnership Framework - Enhanced strategies for climate-proofed and environmentally sound agricultural production in the Yellow River Basin (C-PESAP)
·34·
edible fungi, Chinese medicinal herbs, tea, silkworm and konjak. Such organizations are
mostly engaged in farming, forestry, animal husbandry, side-line products and fishery, and
also the storage, transportation, processing, purchase and marketing of agricultural and side-
line products. As fruit and animal husbandry are the two pillar agricultural sectors, farmers’
cooperation organizations on them are the commonest, which account for 29% and 25% of
the total number. These cooperation organizations, according to their cooperation level and
relations, fall into three categories. The first category is the technical cooperation
organizations, which take up 70% of the total. In such organizations, farmers only cooperate
on a small range of areas at a low level, and the relations between members and
organizations are “loose”. Such organizations emerge of themselves and perish of
themselves. The second category of organizations is intended for technical cooperation,
which account for 20% of the total. The relations between members and organizations are
closer. The third category is intended for economic cooperation, which take up around 10%
of the total. The operation of these organizations involves companies, cooperation
organizations and farmers. The organizations (cooperatives) and members share both the
interest and risks. The relations between them are the closest.
Farmers’ cooperation organizations effectively boost industrial development and
increase farmers’ income. This is mainly because they accelerate the innovation in rural
operation mechanisms, and new agricultural industrialization organizations are set up on
strength of new mechanisms; they accelerate the organization of farmers for market access
and lower the transaction costs of agricultural products; they speed up the transfer of
agricultural technological research achievements to productivity, and improve the quality of
agricultural products and the efficiency of agricultural production; they quicken the
restructuring of agriculture and rural economy, and improve the overall benefits of agriculture;
they accelerate the industrialized operation of agriculture, and bring some profits for farmers
from processing and circulation; and they speed up the conversion of government functions,
improve the decision-making efficiency, and increase the service function. As of the end of
2008, there were 3,544 farmers’ cooperatives which had 47,123 members, including 44,680
farmers that accounted for 94.8% of the total. Many of the organizations have been
registered at the industry and commerce authority, and business licenses for legal entities
have been granted.
A lot of practice has proven that the farmers’ cooperation organizations not only help
members sell their products in a timely manner, but also help to sell the products at a good
price. For instance, Guanlu Town, Linwei District of Weinan City established a
comprehensive farmers’ association on the base of local agricultural technology station in
1997, and set up sub-associations in 15 villages, covering 70% of the farmers, integrating
the four major sectors, i.e. melon in greenhouse, autumn vegetables, cotton and cow. In
2005, the per capita income of farmers in the town reached RMB3,200, 55.3% higher than
the average in the town. Yanliang District of Xi’an City, through the farmers’ cooperation
organizations, launched “Fukang” branded melon, “Dongding” branded Chinese date and
“Lvyan” branded vegetable, and the certification for five pollution-free agricultural products,
Situation Analysis of Shaanxi Province
·35·
including eggplant, cabbage, vegetable marrow and melon, and the certification of six
pollution-free vegetable bases. In 2006, it was difficult to sell celery in many parts of the
province. Celery could hardly be sold even at RMB0.16/kg. Many farmers chose to let the
celery rot in the field. In contrast, members of Yanliang Xinxing Lvyan Vegetable Cooperative
managed to break even because the cooperative helped them find buyers. The seven
farmers’ associations at Baqiao District of Xi’an, including the forest association, has 6,017
members, and RMB42.805 million of assets, RMB6.015 million on average. The fixed assets
of these associations total RMB18.555 million, RMB2.651 million on average. The circulating
fund amounts reach RMB12.00 million, RMB3.464 million on average. The associations
attracted a total of RMB5.985 contributions from members, RMB763,000 on average. The
average annual per capita income of members is 26%~55% higher than the local average.
Since its establishment, the pig raising cooperative of Qingliangshan of Huxian has set up a
feed factory, introduced fine boar from Beijing and Yangling, purchased various equipment to
prevent and control the diseases of live pigs and done its best to help members out.
Currently, the association has 206 members, more than 1,000 boars and 10,000 live pigs in
stock. In 2007, the association supplied more than 20,000 live pigs and brought RMB30,000
of profit to members. The annual average income of the association members was up to
RMB5,000. Founded in 2000, Nan’anshan apple cooperative at Jingzhao of Luochuan
County attracts members from both the local village and 38 members from other villages.
The association attracted RMB82,500 of share contribution, and yield RMB150 of dividend
for reach share. Currently, it has set up three apple sales offices at Guangzhou and other
large/medium cities, and reached long-term partnership with Huasheng Fruit Group. It has
also passed the certification of supermarket alliance in Canada and U.K. to provide
inspection-free export products for the two countries. Driven by the Nan’anshan apple
cooperative, Luochuan, a major apple growing county, has established 139 similar
organizations.
At present, the farmers’ cooperation organizations in Shaanxi are still at a preliminary
stage, characterized by imbalanced development and small coverage. In some places, the
cooperation organizations are dominated by formalism, and have various problems in terms
of external environment, corporate governance structure, policy support, fund, etc. The
Opinion on Accelerating the Development of Farmers’ Cooperatives unveiled by the
provincial government in 2009 clearly iterated the determination to improve the registration
service, provide preferential project policies, increase financial support, provide preferential
taxation, intensify credit support, guarantee the land and electricity supply, consolidate talent
support, enhance coordination, build demonstration projects, strengthen publicity and help
expand the market to guide and facilitate the sound and rapid development of farmers’
cooperatives and increase the number of farmers’ cooperatives in the province to 10,000 by
2012.
China Climate Change Partnership Framework - Enhanced strategies for climate-proofed and environmentally sound agricultural production in the Yellow River Basin (C-PESAP)
·36·
2.3.3 Research organisations, extension services, NDRC and other
governmental institutions
The research agencies for agriculture and climate change include the agricultural
universities and city research institutes. The technology extension centers include the
provincial agricultural technology center (head office), city extension centers, county and
town extension stations. The government departments include the department of agriculture,
department of water conservancy, bureau of meteorology, bureau of environmental
protection and corresponding authorities at the city and county level. The government
departments are mainly responsible for the implementation of central and local policies,
guidelines and regulations concerning agriculture and rural areas, planning, managing and
regulating the agricultural production. The agricultural technology extension centers are
responsible for demonstrating and extending new agricultural technologies, guiding crop
management, formulating technology processes and standards, technical guidance on
quality of agricultural productions, demonstrating and extending new technologies for cash
crops and constructing demonstration bases. The research institutes mainly conduct
research on the cultivation of high-yield, good quality and stress and drought-resistant
breeds, tillage and cultivation, soil fertilization and high-efficiency utilization of water and
fertility, and the prevention and control of water and soil loss.
Northwest A&F University, a participant of the project is an agricultural university under
the Ministry of Education, and co-administered by many ministries/commissions and Shaanxi
provincial government. In 1934, approved by the then central government, Mr. Yu Youren, a
famous patriot, and General Yang Hucheng chose Yangling, cradle of China’s farming
civilization, to initiate the National Northwest Junior College of Agriculture and Forestry,
which was renamed Northwest Agriculture College and Northwest Agriculture University
successively. In 1979, on the basis of the original Forestry Department of the Northwest
Agriculture College, the Northwest Forestry College was established. In September of 1999,
approved by the State Council, seven research and higher education institutes, namely
Northwest Agricultural University, Northwest Forestry College, Institute of Soil and Water
Conservation, Northwest Institute of Water Resources Science, Shaanxi Academy of
Agricultural Sciences, Shaanxi Provincial Academy of Forestry, and Northwest Institute of
Botany, were integrated to be Northwest A&F University. Since its establishment 70 years
ago, the university has been dedicated to agriculture, aiming at frontier technology, adhered
to the national and regional strategic demand, and actively carried out fundamental and
application research for agricultural production. Before the merger of the research and higher
education institutes, it had made some significant research achievements on somatic cell
cloning, embryonic stem cell, hybrid wheat and eco-environmental governance. Outstanding
research accomplishments include the development and release of “Bima-1”, the most
widely planted wheat variety in China, and “Xiaoyan-6”, the leading replacement variety.
Researchers of the university also developed apple variety “Qinguan”, the most commonly
Situation Analysis of Shaanxi Province
·37·
planted apple variety in China. The new university boasts a large pool of researchers and
experts on breeding, water and fertilization, cultivation, plant conservation, gardening, food
processing and agricultural economy. It closely combines production, education and
research and actively demonstrates, extends and industrializes the research achievements.
Moreover, it was the first to launch the new agricultural technology extension model which
centers on universities, attracting much attention and support from the governments. It
established 14 demonstration stations, 60 demonstration bases and 23 expert courtyards in
Shaanxi and other provinces for in-depth technology demonstration and extension. It plays
an increasingly important role in the development of regional dominant industry. The direct
economic returns from the extension of research achievements amount to more than RMB19
billion.
2.3.4 Non-governmental organisations
The concept of NGO was first initiated in the 1940s. At that time it referred to the non-
governmental organizations that didn’t take profit maximization as the primary goal. Currently,
there is no consistent and generally accepted definition for NGO in the world. There are
various names for it, such as the third sector, non-governmental organization, non-profit
organization and volunteer organization. In China, NGO normally refers to non-governmental,
non-profit, independently-managed, non-partisan organizations which are of voluntary nature,
and committed to the resolution of various social problems. This conception is accepted by
most scholars. NGO emerged mainly in the 1990’s. In particular, it grew dramatically amidst
the globalization in the 1980’s and 1990’s. It has five distinctive characteristics, i.e. non-profit,
non-governmental, commonweal, voluntary and autonomous. Amongst, non-profit and non-
governmental are the most fundamental, which distinctively distinguish NGO from
government and market. Presently, there are few completely non-profit NGOs in Shaanxi. In
terms of non-governmental, voluntary and autonomous nature, the farmers’ technology
associations can be deemed as NGOs.
China Climate Change Partnership Framework - Enhanced strategies for climate-proofed and environmentally sound agricultural production in the Yellow River Basin (C-PESAP)
·38·
3 Climate change projections and other drivers of
change
3.1 Climate change scenarios for the YRB
Over the past five decades, especially since the 1980’s, the climate drying and warming
has been more and more obvious around the world, giving rise to enlarged arid areas and
exacerbating drought. The north of China has also experienced this phenomenon. Against
the backdrop of global temperature rise, the climate warming is more significant on the Loess
Plateau. At the same time, the aridity trend became intensified. Drought occurred at the
Yellow River Valley for 11 consecutive years from 1632 to 1642. From the 1970’s, the Yellow
River began to have natural dry-up. In 26 years between 1972 and 1997, dry-up occurred in
20 years in the lower reaches. In particular, since 1990’s, dry-up became more frequently,
and the duration grew longer. In 1991, the dry-up only lasted 13 days, which prolonged to be
83 days, 64 days, 71 days, 122 days and 136 days in 1992, 1993, 1994, 1995 and 1996
respectively. The length of river dry-up was up to 704km. There are various reasons for the
dry-up of the Yellow River. But increasing aridity trend, declining precipitation and rising
water utilization are the most direct reasons.
Shaanxi is located in the east of China’s northwest, and center of the Loess Plateau. It is
controlled by monsoons. Many studies show that it is one of the regions in the world that are
sensitive to climate change. Shi Ya, et al [2002] pointed out that the climate in China’s
northwest might change from warm and dry in the 20th century to warm and humid. Yu
Shuqiu, et al [2003], by studying the precipitation and temperature statistics for the past 50
years, said that the climate in China’s northwest experienced an abrupt jump which is 6~8
years later than the climate jump in China. As a result, the temperature grew by 0.51� and
annual precipitation went up 5.2%. Zuo Hongchao, et al [2004], by studying the sequence of
climatological data and current NCEP/NCAR reanalysis data, pointed out that in the past five
decades, the change in China’s average temperature aligned with that in global average
temperature, while the center of China’s northwest saw the fastest temperature rise which
covered the largest area. The precipitation in arid area in the northwest grew significantly.
Moreover, the precipitation in winter generally rose, while the rainfall in most areas was on
the decline in autumn.
3.1.1 Temperature
Gao Bei, et al [2006], by analyzing the climate information from 96 meteorological
stations in Shaanxi, pointed out that in nearly 40 years between 1961 and 2000, after the low
temperature in the late 1960’s, the average temperature in Shaanxi posted a jump around
1985 which was 5~7 years later than the jump in China, and 1 year earlier than the jump in
Situation Analysis of Shaanxi Province
·39·
the northwest. The temperature dropped 1.39� after the jump, down 0.37� in spring, 0.50�
in summer, up 0.45� in autumn and 0.76� in winter. The extreme temperature grew
significantly. In particular, the extreme lowest temperature went up dramatically after the
1990’s
Figure 3-1 illustrates the change in average temperature between 1952 and 2002
recorded by three meteorological
stations at Yulin, Yan’an and Xi’an
of Shaanxi. Although because of
disparity in latitude, the three places
have different absolute values of
annual average temperature, and
there was a fluctuation in
temperature, the annual average
temperate at the three places
between 1952 and 2002 was on the
rise. This is consistent with what is
observed around the world.
The analysis of the temperature data recorded by the three meteorological stations at
Yulin, Yan’an and Xi’an between 1989 and 2008, the inter-annual variation in the highest
average temperature in the day is the largest in January and July, which is up to 7�. The
high-temperature and low-temperature year occur by turns. The temperature rise was quite
significant in the 1990’s, which began to decline in the 21st century (Figure 3-2, Figure 3-3
and Figure 3-4).
Fig. 3-2 Highest daily average temperature in Yulin, Xi’an and Yan’anbetween 1989 and 2008
14
15
16
17
18
19
20
21
22
1989
1990
1991
1992
1993
1994
1995
1996
1997
1998
1999
2000
2001
2002
2003
2004
2005
2006
2007
2008
Year
Tem
pera
ture
( ℃)
Yulin
Yan'an
Xi'an
Trend of Yulin
Trend of Yan'an
Trend of Xi'an
Fig. 3-1 Change in annual average temperature in
Yulin, Yan’an and Xi’an between 1952 and 2002 (LIU Xiaoqing, et al, 2006)
China Climate Change Partnership Framework - Enhanced strategies for climate-proofed and environmentally sound agricultural production in the Yellow River Basin (C-PESAP)
·40·
Fig. 3-3 Highest daily average temperature in Xi’an, Yan’an and Yulin inJanuary between 1989 and 2008
-6
-4
-2
0
2
4
6
8
10
1989
1990
1991
1992
1993
1994
1995
1996
1997
1998
1999
2000
2001
2002
2003
2004
2005
2006
2007
2008
Year
Tem
pera
ture
( ℃)
Yulin
Yan'an
Xi'an
Trend of Yulin
Trend of Yan'an
Trend of Xi'an
Fig. 3-4 Highest daily average temperature in Xi’an, Yan’an and Yulin in Julybetween 1989 and 2008
28
29
30
31
32
33
34
35
36
1989
1990
1991
1992
1993
1994
1995
1996
1997
1998
1999
2000
2001
2002
2003
2004
2005
2006
2007
2008
Year
Tem
pera
ture
( ℃)
Yulin
Yan'an
Xi'an
Trend of Yulin
Trend of Yan'an
Trend of Xi'an
3.1.2 Precipitation
According to the analysis of Gao Bei, et al [2006], Liu Yinge [2007], Yuan Sufen, et al
[2008] and Dong Jie, et al [2009], the average annual precipitation in Shaanxi is 607.3mm.
Among the four seasons, summer sees the largest rainfall which amounts to 283.8mm,
accounting for 46.7% of the year, followed by autumn which reports 178.8mm of rainfall,
taking up 28.6%. The rainfall in spring comes the third, which stands at 131.7mm, accounting
for 21.7% of the year, and the rainfall in winter comes the last, amounting to 18.0mm, taking
up 3.0% of the year. The maximum average annual rainfall occurred in 1964, reaching
868.6mm, and the minimum annual rainfall was in 1997, amounting to 416.7mm. The
disparity was up to 451.9mm. There was a huge inter-annual disparity. The period between
the early 1960’s and middle 1980’s saw much rain. Then the rainfall began to drop. The
period between 1988 and 2000 saw less rain. Except for Guanzhong and Shaannan where
the precipitation rose, most of the other parts of the province saw declining precipitation, but
the decline was less than 9.0%. The south of the province saw a drop up to 9.5%~20.0%.
Situation Analysis of Shaanxi Province
·41·
There was a regional distribution in the change in precipitation. The drop in the south was
quite higher than that in Guanzhong and Shaanbei. The precipitation fell in spring and winter,
and rose in summer and autumn, but the trend was not obvious. The increase in summer
and autumn in the west was more obvious than in the east. Before 1979, rainfall in summer
mainly exhibited a negative anomaly, with the average precipitation anomaly percentage
being -7.8%. After 1979, the rainfall mainly displayed a positive anomaly, with the average
precipitation anomaly percentage being 5.8%. In particular, there was a major increase from
the 1990’s, most significantly in the west of Guanzhong and the west of Shaannan. In
summer, the rainfall rose in the south and fell in the north. In autumn, the rainfall had a wave-
shaped drop. From the middle of 1980’s, there was less rain in autumn. The major decline
was in Suide and Qingjian, where the drop was more than 30%. The inter-annual change in
rainfall in spring was quite obvious in the province. The rainfall mainly displayed a positive
anomaly in the 1960’s, a negative anomaly from early 1970’s to the middle of 1980’s, a
positive anomaly from the middle of 1980’s to early 1990’s, and a negative anomaly in the
1990’s. The rainfall in winter began to decline, but the decline was not large. The positive
and negative anomalies appeared by turns, with the oscillation cycle being around 3a. In the
1980’s, it began to be gentle. 1989 saw the highest rainfall in winter, which reached 50.1mm.
The precipitation grew slightly from 2000.
See Figure 3-5 for the change in annual precipitation in Xi’an, Yan’an and Yulin between
1989 and 2008. We can see that there was quite a disparity in annual precipitation. In
particular, between 2001 and 2003, drought and flood occurred alternately in Xi’an between
2001 and 2003. In the 1990’s, the precipitation dropped significantly. In the first few years of
the 21st century, the precipitation first grew but then began to fall.
Fig. 3-5 Annual precipitation in Xi’an, Yan’an and Yulin between 1989 and2008
200
300
400
500
600
700
800
900
1989
1990
1991
1992
1993
1994
1995
1996
1997
1998
1999
2000
2001
2002
2003
2004
2005
2006
2007
2008
Year
Ann
ual p
reci
pita
tion
(mm
)
Yulin
Yan'an
Xi'an
Trend of Yulin
Trend of Yan'an
Trend of Xi'an
According to agricultural traditions, the periods between March and May, June and
August, September and November, and December and February are spring, summer,
China Climate Change Partnership Framework - Enhanced strategies for climate-proofed and environmentally sound agricultural production in the Yellow River Basin (C-PESAP)
·42·
autumn and winter respectively. Then the change in seasonal precipitation in Xi’an, Yan’an
and Yulin between 1989 and 2008 was as shown in figures 3-6, 3-7 and 3-8 respectively.
Fig. 3-6 Seasonal precipitation in Yulin between 1989 and 2008
0
50
100
150
200
250
300
350
400
450
50019
89
1990
1991
1992
1993
1994
1995
1996
1997
1998
1999
2000
2001
2002
2003
2004
2005
2006
2007
2008
Year
Pre
cipi
tatio
n (m
m)
Spring
Summer
Autumn
Winter
Fig. 3-7 Seasonal precipitation in Yan'an between 1989 and 2008
0
50
100
150
200
250
300
350
400
450
500
1989
1990
1991
1992
1993
1994
1995
1996
1997
1998
1999
2000
2001
2002
2003
2004
2005
2006
2007
2008
Year
Pre
cipi
tatio
n (m
m)
Spring
Summer
Autumn
Winter
Situation Analysis of Shaanxi Province
·43·
Fig. 3-8 Seasonal precipitation in Xi'an between 1989 and 2008
0
50
100
150
200
250
300
350
400
450
500
1989
1990
1991
1992
1993
1994
1995
1996
1997
1998
1999
2000
2001
2002
2003
2004
2005
2006
2007
2008
Year
Pre
cipi
tatio
n (m
m)
Spring
Summer
Autumn
Winter
From figures 3-6, 3-7 and 3-8, we can see that there was less precipitation in winter and spring, the precipitation mainly concentrated in summer or autumn (autumn in Yulin), the rainfall was uneven inter-annually, and there was a huge disparity. Figure 3-8 clearly shows that serious drought occurred in summer and autumn continuously between 1995 and 1997 in Xi’an, spring drought occurred in 2000 and 2001, summer and autumn floods in 2003, spring drought and summer flood in 2007.
In general, in nearly ten years in the 21st century, there was a rise tendency in precipitation in summer and autumn.
3.1.3 Relations between Temperature and Precipitation
By analyzing the data on annual average temperature, precipitation, seasonal average temperature and precipitation in five counties and districts of Hanyuan area of Weibei between 1955 and 1997, Yin Shuyan, et al (2000) found that both the annual average and seasonal temperature rose, the precipitation declined and the climate got warm and dry. In arid Weibei, the impact of climate warming on aridity was quite significant. The annual precipitation and the precipitation in summer and spring is closely related to the annual average temperature, the average temperature in summer and spring. The higher the temperature, the less the precipitation. The relations between them can be expressed with a quadratic polynomial regression equation. The precipitation in winter is highly related to the average temperature in the season. The rainfall exhibited an exponential decline while the temperature rises. The formulas for them are as follows:
Annual: P=-19.611t2+307.77t-487.49, r=0.4468**,
Summer: P=9.8056t2-489.62t+6331.4, r=0.5671**,
Spring: P=15.338t2-375.2t+2387.9, r=0.4367**,
Winter: P=10.81e-2.048t, r=0.3260**
China Climate Change Partnership Framework - Enhanced strategies for climate-proofed and environmentally sound agricultural production in the Yellow River Basin (C-PESAP)
·44·
In which, P stands for precipitation, t average temperature, ** highly related (p<0.01), and *related (p<0.05).
3.1.4 Frost period
In Figure 3-9, the change in frost period in Xi’an, Yan’an and Yulin between 1998 and 2006 shows that the warming in winter in Yulin and Xi’an was intensified.
Fig. 3-9 Frost period in Xi'an, Yan'an and Yulin between 1998 and 2006
100110120130140150160170180190200
1998
1999
2000
2001
2002
2003
2004
2005
2006
Year
Fro
st p
erio
d (d
ay)
Yulin
Yan'an
Xi'an
Trend of Yulin
Trend of Yan'an
Trend of Xi'an
3.1.5 Extreme meteorological phenomena
With global warming, the climate change becomes more uncertain. Extreme
meteorological phenomena may become more frequent at any time. This is shown by the
major flood that occurred in the Weihe River in the autumn of 2003, in the Hanjiang River
and Weihe River valleys in autumn of 2005 and 2007.
From late August to early October of 2003, rainfall was abnormally higher in Shaanxi
which experienced rarely-seen continuous strong rainfall. Between July 11 and 16, the
rainfall amounted to 3~28mm in the north of Shaanbei, 20~138 mm in the south of Shaanbei,
50~146mm in Guanzhong, 50~100mm in Ankang and Shangluo of Shaannan, and
40~215mm in Hanzhong. There was a torrential rain in 10 counties on July 15. The rainfall in
Ningqiang reached 184.6mm, the record high in 46 years since the local meteorological
station was set up. Between August 21 and October 10, the rainfall was 140~460mm in
Shaanbei, 380~480mm in most parts of Guanzhong, 330~500mm in most parts of Shaannan,
650~770mm in Zhenba, Ningxia, Shiquan and Ziyang. Compared with the same time of other
years, the rainfall was twice-three times higher in most parts of Shaanbei, Guanzhong and
Shaannan areas, three-four times higher in 10 counties, including Heyang, Chengcheng,
150~250% higher in the west of Shaannan. The average rainfall in Yan’an and Guanzhong
was the highest since 1961, and the second highest in Shaannan, only second to that in
1964. From August 23 to September 20, there were 14 days of rainstorm which happened
for 118 counties/times (statistics of precipitation between 20:00 and 22:00). The frequency
Situation Analysis of Shaanxi Province
·45·
and intensify of the rainstorm was never seen in the meteorological record. The floods in late
August of 2003 caused severe damages. According to statistics, 8.42 million people from 85
counties (cities/districts) and 3 state-run farms were affected. 64 people died, 59 people
were missing, and 950,000 people were relocated in emergency. 720,000 ha of crops were
affected, 960,000 rooms collapsed or destroyed, the infrastructure of traffic, power,
communication, school and hospital, and also water conservancy facilities were severely
damaged. More 1,100 places on the dikes of river mainstreams and tributaries, totaling
746km, over 30,000 places of water conservancy facilities were damaged, and 27,000 ha of
farmland was destroyed. There were over 980 places on the dikes that saw leakage, piping
and slide-collapse. 58 dike control projects and 896 buttresses reported foundation
displacement or collapse. There were 8 levee breaches on the tributary in Nanshan. In the
most-severely flooded Huaxian and Huayin, 300,000 people were evacuated, 20,000 ha of
autumn crops suffered total harvest failure, and 19,000 were flooded or demolished by water.
The direct economic loss caused by disasters in the province totaled RMB10 billion. In
addition, the climate in 2003 was also characterized by warm winter, cold wave, abnormal
coldness in the beginning of winter, early soaking rain in spring, drought in May and June,
abnormally fewer sandy days in spring, hail, gust and heavy fog.
From December of 2006 to February of 2007, like other parts in northern China, Shaanxi
also experienced a warm winter, when the average temperature was 2� higher than normal.
In particular, in February of 2007, the average temperature was 3~6� higher than normal.
The warm winter was followed by abnormal coldness in spring. There was a severe drought
in April and May. All these are abnormal climate conditions, compared with previous years.
Especially in the flood season, the climate was exceptionally abnormal. Rainstorm occurred
repeatedly in parts of Shaannan, causing extremely heavy mountain torrents and landslides
and giving rise to serious losses. According to statistics, 18 million people were affected, 96
peopled died and 66 people went missing. The direct economic losses reached RMB13.5
billion. Between July 1 and July 7, the east and south of Guanzhong, and parts of Shaannan
suffered rainstorm and torrential rain which affected 8 counties and 5 counties respectively.
Yangxian posted the highest rainfall which amounted to 187.3mm, the record high since the
local meteorological station was set up. The rainstorm on the evening of July 4 almost
covered the whole province. From July 26 to July 30, twelve meteorological stations reported
rainstorm and one station reported torrential rain. The highest rainfall was in Shangnan,
which amounted to 183.4mm, a record high since the local meteorological station was
established. On August 6~9, most parts of Guanzhong and parts of Shaannan saw strong
rainfall accompanied with thunderbolts. During this period, 32 local meteorological stations
reported rainstorm and 9 stations reported torrential rain. Liquan registered 215mm of rainfall,
the highest in Guanzhong, and Foping posted 103.5mm of rainfall, the highest in Shaannan.
The strongest thunder happened between 17:00 and 23:00 of August 8. There were 7,780
lightnings during this period. Xianyang reported the largest number of lightnings which
reached 3,106 in number. From August 27 to 31, Shaanxi experienced a rainstorm.
According to statistics, 37 local meteorological stations reported rainstorm, and 5 stations
reported torrential rain. The rainfall in Foping was up to 208.6mm, the highest in the province,
China Climate Change Partnership Framework - Enhanced strategies for climate-proofed and environmentally sound agricultural production in the Yellow River Basin (C-PESAP)
·46·
which was rarely seen in history. In Xi’an, as a result of the rarely-seen rainy weather, the
monthly rainfall reached the highest level since 1958, while the monthly average temperature
dropped to 25.3�, the lowest level in 18 years. In subsequent August and September,
thundershower and rainstorm happened frequently and in a very “special” manner – the
strong thundershower and rainstorm normally happened in the first half of the night and
stopped in the second half. Then the sky cleared up in the next morning as if nothing had
happened. On July 30, August 8~9 and September 4, each time when there was a rainstorm,
the traffic was cut off at dozens of road sections because of ponding. The ponding in
underpass tunnels was up to 50cm~120cm deep. Many parked vehicles were almost
submerged by water. On the morning of September 4, a bus which carried 45 passengers in
the urban area suddenly caught fire because of water seepage into the drive. The
passengers had to flee for their lives by jumping out of the bus. Thunderbolt, gust and hail
were also much more vehement than previous years. According to the statistics of Shaanxi
Provincial Lightning Protection Center, there were 107 lightnings in Xi’an from wee hours to
15:00 on September 4, and there were a total of 1,085 lightnings in the whole province. The
rainfall reached 119.6mm in ten hours in Gaoling County near Xi’an and the deepest ponding
in the urban area was up to 120cm in depth, the highest level since the county began to keep
rainfall records.
From September 26 to October 13, Shaanxi experienced an exceptional cloudy days
alternated with rain. During this period, the total precipitation was 213mm in Qingjian, the
highest in Shaanbei, 126mm in Longxian, the highest in Guanzhong and 309mm in
Ningqiang, the highest in Shaannan. In most parts of Shaanxi, the rain lasted more than 10
days, the most severe protracted rain in 50 years. On October 6~8, affected by cold air, the
province saw a temperature drop up to 6~8�, wind and snow from the north to the south,
which was rarely seen in the central and northern regions of the province in nearly 50 years.
In particular, on October 7~8, Jinbian, Dingbian and Wuqi in the north saw snow, which was
about 20 days earlier than usual. The snow was the earliest in Dingbian and Wuqi since
1971. Rain, low temperature and snow affected more than 3.69 million people in 15
counties/districts of Yulin and Yan’an, 6 people were injured and 61,700 ha of crops were
affected, including 30,500 ha of land that suffered total harvest failure. 11,297 rooms of
houses and cave-houses collapsed and 27,545 rooms of houses and cave-houses were
damaged. 291 head of large livestock died. The direct economic losses amounted to
RMB2.9 billion, including RMB1.96 billion in agriculture.
Situation Analysis of Shaanxi Province
·47·
Fig. 3-10 Traffic was cut off for about one hour at Yanxiang Road of Xi’an
after about 30-minute rainstorm around 18:00 on July 31 of 2007
3.2 Scenarios of other drivers of change
3.2.1 Demographic growth, migration and urbanisation
In recent years, the natural population growth rate rose slightly (4.01‰, 4.04‰, 4.05‰
and 4.08‰ in 2005, 2006, 2007 and 2008 respectively). At the end of 2008, the number of
permanent residents in the province totaled 37.62 million, up 140,000 year on year. The
population influx mainly occurred in Sui, Tang and late Qing dynasties and during the Anti-
Japanese Aggression War period. Most of the incoming population moved to cities and
towns, accelerating the urbanization. The incoming population exerted certain influence on
the local language, etiquettes, dressing, food, consumption, and folk customs. In turn, they
were affected by the local customs and traditions. The large incoming population not only
drove the local agriculture and reclamation, but also spurred the local industry and
commerce, and boosted the cultural prosperity. On the other hand, because of the incoming
population and the natural growth, the local population and density was greatly increased.
The per capita farmland in Guanzhong area declined significantly. As a result of the rapidly-
increasing population, the farmland, grassland fuel and water resources were in short supply,
giving rise to predatory operation of natural resources, excessive reclamation, pasturing,
woodcutting and water consumption. Consequently, the fragile eco-environment deteriorated,
area of land desertification increased, land salinization exacerbated, farmland and water
resources declined.
China Climate Change Partnership Framework - Enhanced strategies for climate-proofed and environmentally sound agricultural production in the Yellow River Basin (C-PESAP)
·48·
Fig. 3-11 Population in Shaanxi between 1978 and 2008
25
27
29
31
33
35
37
39
1978
1980
1985
1990
1991
1992
1993
1994
1995
1996
1997
1998
1999
2000
2001
2002
2003
2004
2005
2006
2007
2008
Year
Pop
ulat
ion
(M
illio
n)
3.2.2 Economic development and industrialization
In 2007, the total industrial and agricultural output of Shaanxi amounted to RMB759.026
billion, up 482% over 1949. The proportion of industrial output rose from 31.5% in 1949 to
86.8% (Figure 3-12). The industrial development improved people’s living standards and
promoted agricultural production. At the same time, however, it accelerated the consumption
of land, coal, oil and water resources, and increased the discharge/emission of pollutants
and greenhouse gases.
Fig. 3-12 Proportions of industrial output in the total of industrialand agricultural output of Shaanxi between 1952 and 2007
0102030405060708090
100
1952
1957
1962
1965
1970
1975
1978
1980
1985
1990
1991
1992
1993
1994
1995
1996
1997
1998
1999
2000
2001
2002
2003
2004
2005
2006
2007
Year
Pro
port
ion
(%)
3.2.3 Changes of land use and land cover
From August 5 of 1999, Shaanxi began to implement the “returning cultivated land to
forests, closing off hillsides to facilitate afforestation, giving relief to local residents in the form
of grain and encouraging individual contractors to manage concerned areas” policies, and
took the lead in carrying out a large-scale pilot of returning farmland to forest in China. In
2000, 34 counties (cities and districts) were included in the pilot. In 2001, 43 counties (cities
Situation Analysis of Shaanxi Province
·49·
and districts), and 13 counties (cities and districts) of Yan’an were included in the pilot
program, making Yan’an the only pilot city for returning farmland into forest in China. In 2002,
the “Return Farmland into Forest” project was formally kicked off. 96 counties (cities and
districts) in the province were covered in the project. The scale of the project got increasingly
large year by year.
Between 1999 and 2005, China set a target of returning 22.5435 million ha of land into
forest, including returning 8.9975 million ha of farmland into forest, building 12.2527 million
ha of forest on barren mountains and wasteland, and closing off 1.2933 million ha of hillsides
to facilitate afforestation. Shaanxi was assigned to return 2.0597million ha of land into forest,
including returning 1.0059 million ha of farmland into forest, building 0.9938 million ha of
forest on barren mountains and wasteland, and closing off 60,000 ha of hillside to facilitate
afforestation, ranking the first in China. By the end of 2005, Shaanxi had returned 2.0515
million ha of land into forest, including returning 1.0059 million ha of farmland into forest,
building 0.9909 million ha of forest on barren mountains and wasteland, and closing off
54,800 ha of hillside to facilitate afforestation. Between 1999 and 2004, the land returned into
2.0859 million families with a population of 8.3097 million.
By returning land into forest, the eco-conditions in some parts of the province were
improved. Some areas almost became forests. In key areas, the “ridges, loess hills, valleys,
slopes and tablelands” were planned in an overall manner, and “mountains, rivers, field,
forests and roads” were comprehensively treated. The serious water and soil loss was
mitigated. The Loess Plateau in the north which used to lack trees is now covered with green
vegetation, taking on a new look. The climate conditions were improved, area of water and
soil loss reduced, and the absorption of CO2 increased.
China Climate Change Partnership Framework - Enhanced strategies for climate-proofed and environmentally sound agricultural production in the Yellow River Basin (C-PESAP)
·50·
4 Vulnerability of agricultural ecosystems and production to potential impacts of climate change and other drivers of change
The fragility of agricultural eco-system refers to the level of response of agricultural
production to climate, environmental changes and other sensitive factors, and the
comprehensive unstable response of local socio-economy, production and eco-environment
to changes. It is a function indicating the sensitivity of agricultural eco-system to external
pressure and self adaptability.
Humidity is a major restrictive ecological factor in the Loess Plateau. In the process of
desertification and its reverse process—ecological recovery, moisture plays a decisive role.
The warming and drying trend in which the precipitation declines, temperature rises and
evaporation intensifies will further exacerbate the lack of water resources. At the same time,
the rising temperature and declining precipitation will exert a negative impact on soil and
vegetation in the valley. The impact of aridity on the soil in the Loess Plateau is mainly on the
dry layer of soil, which in turn, poses a more negative impact on the ecological recovery such
as afforestation. Consequently, the intensify of soil erosion changes with the seasonal
transition. The soil loss is mainly concentrated in summer. Moreover, the strong sandstorm
will be more frequent, land degradation, desertification, lowering ground water level, soil
salinization and other environmental problems will be triggered.
4.1 Changes in cropping periods
As the annual average temperature rises, warm winter also occurs from time to time,
which, on the one hand, will be adverse to the growth of some crops which need to be
vernalized (such as wheat), advance the flowering and maturity periods of such crops,
shorten the growth period, and lower the output, and on the other hand, increase the winter
survival rate of over-winter livestock, help some artificially-cultivated plants (such as the
flowers and vegetables cultivated in greenhouses). This may be the good impact of rising
temperature on human beings.
However, abnormal warm winter will result in wild growth and excessive density of
wheat seedlings, which in turn, will cause excessive consumption of soil nutrients. This is
bad for wheat seedlings in later growth periods. At the same time, as the temperature is high
at the year beginning and plants are less resistant to cold, abnormal warm winter will exert a
negative impact on wheat later on. Warm winter will also advance the flowering period of fruit
trees, significantly lower the cold and stress resistance of fruit trees. If “abnormal coldness in
spring” occurs during the flowering period, the risk of cold will rise, increasing the base and
Situation Analysis of Shaanxi Province
·51·
communities of over-winter diseases and pests, and the risk of outbreak and spread of
diseases and pests during the growth period of crops, especially in spring.
In Guanzhong, the sown period of wheat is postponed for nearly 10 days, harvest period
advanced 5~7 days, and growth period shortened around 15 days. Wheat reports wild winter
growth or even abnormal jointing. The dry and hot wind at the beginning of summer makes
the wheat droop, leading to a dramatic reduction in output. The flowering period of apple is
advanced for more than half of a month, increasing the probability of spring cold and low
temperature for fruit trees. As a result of high temperature in summer, fruits are smaller in
size than in normal years.
4.2 Occurrence of floods and droughts
Among the natural disasters in Shaanxi, drought is the most frequent. From the 2nd
century B.C to 1949, drought occurred for more than 600 times. There were 234 province-
wide droughts, accounting for 39% of the total. By region, there were 271 droughts in
Shaanbei, 250 droughts in Shaannan and 326 droughts in Guanzhong. The period between
the 6th century A.D and the 10th century A.D. saw frequent droughts. There were 37 peak
droughts in the 8th century A.D. The period between the 14th century A.D. and the 18th
century A.D. was another time when droughts occurred frequently. The 15th century A.D. saw
the largest number of droughts, when 38 droughts occurred, more than in the 8th century A.D.
In 100 years between 1800 and 1899, there were 41 droughts, once each 2.44 year on
average. There were 41 inter-annual droughts, including 6 droughts that lasted two years, 3
droughts that lasted 3 years and 2 droughts that lasted 4 years. Between 1900 and 2000,
there were 53 droughts, once every 1.9 years on average. The number of inter-annual
droughts was 12, including 6 droughts that lasted 2 years, 3 droughts that lasted 3 years and
1 drought that and 11 years. In recent 200 years, there were 22 inter-annual droughts,
including 12 droughts that lasted 2 years, 6 droughts that lasted 3 years, 2 droughts that
lasted 4 years, and 1 drought that lasted 6 years and 11 years respectively. From the
beginning of last century to 1949, there were 19 droughts. In 480 years between 1470 and
1949, the drought that lasted more than 2 years occurred 23 times across the province, 19
times in Shaanbei, 14 times in Shaannan, and 23 times in Guanzhong. The drought that
lasted 3~5 years occurred 8 times across the province, 7 times, 5 times and 10 times in
Shaanbei, Shaannan and Guanzhong respectively. The longest duration of drought was 15
years in Guanzhong which also reported the strongest continuation of drought. Drought was
more frequent in Guanzhong, which was the most severe natural disaster both in terms of
frequency and severity. The high concentration of precipitation was an important reason for
the frequent flood and drought. In more than 40 years after 1950, there was a major drought,
medium drought and slight drought every 10 years, 5 years and 2 years respectively.
The floods and droughts in Shaanxi have following characteristics:
(1) Droughts were more frequent than floods
China Climate Change Partnership Framework - Enhanced strategies for climate-proofed and environmentally sound agricultural production in the Yellow River Basin (C-PESAP)
·52·
The number of years that experienced droughts was more than those which suffered
floods, and the coverage of drought was larger than that of floods. According to historical
records, from the 2nd century B.C. to 1985, there were 239 province-wide droughts, 6.3 times
that of floods. There were 300 droughts in Shaanbei, 6 times that of floods, and 343 droughts
in Guanzhong, 3.9 times that of floods, 258 droughts in Shaannan, 2.5 times that of floods. In
250 years between 1700 and 1949, there were 63 floods and drought disasters, including 49
drought disasters and 14 flood disasters. The number of drought disasters is 3.5 times that of
flood disasters. Amongst, there were 28 major drought disasters and only 5 major flood
disasters. Each drought disaster covered 35 counties on average, while each flood disaster
affected only 25 counties on average. In conclusion, the drought disaster was more serious
than flood disaster in Shaanxi.
Liu Yinge, et al [2006] analyzed the droughts and floods in Shaanxi between 1951 and
2000. See Figure 4-1 and Figure 4-2. Overall, the proportion between the number of years
which had droughts, floods and normal years was 1.46:1.38:1. Drought was more frequent
than flood, and the number of years that suffered serious drought was 1.5 times that suffered
serious flood. From region-specific occurrence of droughts and floods, the probability of flood,
drought, serious drought and serious flood is roughly the same. The number of years that
suffered serious drought is more than that of years which had slight drought. That is to say,
once there was a drought, it would be very serious. In Guanzhong area, the number of dry
years was obviously larger than the number of years that had floods, and the number of
years that suffered serious flood and drought was the same, and so was the number of years
which had serious drought and flood. The number of years which reported slight drought was
about twice that of years that reported serious drought and flood. There were two years that
reported major flood and drought respectively. This shows that the climate in Guanzhong
was slight arid. The probability of flood, drought, serious drought and serious flood was
roughly the same in Shaannan. The probability of serious flood was higher than slight flood.
Situation Analysis of Shaanxi Province
·53·
(2) Drought mostly occurred in spring and summer
Spring drought, summer drought and protracted drought in spring and summer were the
major drought forms. In Shaanbei, Guanzhong and Shaannan, however, there was a
significant difference in dry seasons. The probability of summer drought was the highest in
Shaanxi, which was 36%, followed by spring drought whose frequency was 19%, and
autumn drought whose frequency was 8%. Among inter-seasonal droughts, protracted
drought in spring and summer reported the highest probability, whose frequency was 11%.
About 59% of the major droughts were spring droughts and protracted droughts in spring and
summer. There was a small seasonal difference in drought in Shaannan. June, August and
November registered more droughts than other months. In Shaanbei, spring drought was the
most frequent, where the frequency of drought in March~June was over 50%. The period
Table 4-1 Probability of drought and flood in Shaanxi 1951~2000 (%)
Region Flood Serious flood Drought Serious drought
Shaanbei (North Shaanxi) 28 14 26 16
Guanzhong (Middle Shaanxi) 26 14 36 14
Shaannan (South Shaanxi) 24 16 26 14
Shaanxi (As a whole) 26 12 36 18
Table 4-2 Annual grading of drought and flood in Shaanxi between April and September 1951~2000
China Climate Change Partnership Framework - Enhanced strategies for climate-proofed and environmentally sound agricultural production in the Yellow River Basin (C-PESAP)
·54·
between July and September was dry. In October, the probability of drought increased. In
Guanzhong, the period between March and April saw fewer droughts which began to rise in
May, hit the peak in June, declined in July, rose in August, fell in September and went up
again in October.
(3) Droughts and floods occurred in the same year. Droughts came first, followed
by floods, and then droughts and floods occurred alternately
As spring drought and summer flood were most frequent in Shaanxi, and both could
affect the whole province, droughts and floods often occurred alternately in the province.
There were floods in dry years. This was an important characteristic of aridity in Shaanxi.
When there were floods and droughts in the same year, droughts often came first, followed
by floods. This happened in the whole province, some parts or even some counties. When
droughts came before floods in the same year, summer droughts came before autumn floods,
spring droughts came before summer floods, and spring and summer droughts came before
autumn floods. There were also a few years when floods came before droughts. Inter-
annually, droughts and floods also occurred alternately.
(4) Droughts lasted a longer duration, and widespread droughts often occurred
continuously
There were two types of protracted droughts. The first type was inter-annually protracted
drought. The longer the drought lasted, the larger area it affected. The areas affected by
droughts that lasted two years were mostly concentrated in Guanzhong and south of
Shaanbei (south of Yan’an). Areas affected by droughts that lasted four years involved most
counties in the province. In the years that suffered major droughts, droughts almost lasted
inter-annually. The other type of protracted droughts was inter-monthly or inter-seasonal
drought, including protracted droughts that lasted in spring and summer, winter and spring,
summer and autumn, autumn, winter and spring respectively. Although such droughts were
small in number, they lasted a longer period and inflicted larger damages. The duration of
droughts varied from region to region in Shaanxi. The longest duration could be up to 7
months in Shaanbei, and 3 months in Shaannan.
4.3 Decline in Available Water Resources
4.3.1 Change in surface water resources
Precipitation is the most important source of river runoffs in Shaanxi. It bears heavily on
the quantity of water resources. The change in quantity of surface water resources aligned
with the change in temperature and precipitation. From the 1950’s to 1990’s, as the
Situation Analysis of Shaanxi Province
·55·
precipitation exhibited a cyclic change, surface water resources also showed such a change.
In the 1990’s, due to the dramatic decline in precipitation, the quantity of surface water
resources dropped to 149.8mm, the lowest level since the 1950’s.
The average annual quantity of surface water resources in 45 years between 1956 and
2000 was 40.93 billion m3, including 9.82 billion m3 in the Yellow River valley and 31.11
billion m3 in the Yangtze River valley. The quantity of water resources in Shaanbei,
Guanzhong and Shaannan was 3.57 billion m3, 6.88 billion m3 and 3.05 billion m3
respectively. In the 45 years, the change in quantity of surface water resources aligned with
the change in temperature and precipitation in the province. In the 1970’s and the 1990’s, the
precipitation dropped, and so did the surface water resources. But the decline of surface
water resources was greater than that of precipitation. In the 1950’s, the 1960’s and the
1980’s, the precipitation increased, and so did the surface water resources. But the increase
of surface water resources was greater than that of precipitation. In the 1990’s, the
precipitation dropped the most significantly, and reached the lowest level. It was the same
with surface water resources. Compared with the average annual in 24 years between 1956
and 1979, the quantity of surface water resources dropped 1.09 billion m3, including 940
million m3 in the Yellow River valley and 150 million m3 in the Yangtze River valley. In
addition to the local surface water resources, the quantity of incoming water resources also
dropped, especially in the Yellow River valley. Compared with the average quantity of
incoming water resources in 24 years between 1956 and 1979, the average in 45 years
declined 620 million m3, down 13% in the Yellow River valley, and 370 million m3, down 5.2%
in the Yangtze River. The decline was up to 770 million m3 in the Weihe River valley, down
7.3%.
Between 2000 and 2006, except in 2003 and 2005 when the quantity of surface water
resources in the province, the Yellow River valley and the Yangtze River valley was 40.93 m3,
9.82 billion m3 and 31.11billion m3 respectively higher than the inter-annual average, in the
remaining five years, the quantity of surface water resources was lower than the average in
slightly dry and dry years.
4.3.2 Change in ground water resources
Due to various reasons, the quantity of surface water resources dropped, and river
runoffs failed to meet the demand of water. Therefore, the exploitation of ground water was
intensified. According to the observation data of groundwater level between 1980 and 2000,
the groundwater level in Guanzhong kept falling, the area where groundwater level dropped
constantly increased, and the area where groundwater level was stable fluctuated. This was
mainly because the precipitation dropped, more and more ground water was exploited and
the surface water resources declined. In the sand area in Shaanbei, due to the poor natural
conditions, vast land, small population density, and limited human activity, the groundwater
China Climate Change Partnership Framework - Enhanced strategies for climate-proofed and environmentally sound agricultural production in the Yellow River Basin (C-PESAP)
·56·
resources were developed at a very low level. Therefore, in most regions, the groundwater
level was stable. In Hanzhong Basin, because the groundwater resources were less
exploited and the water supply conditions were good, the groundwater level was basically
stable. Areas where groundwater resources were excessively exploited were mainly in the
concentrated water supply sources for living and industrial production for medium/large cities
in Guanzhong along the Weihe River and its tributaries. Because of the long history of
groundwater exploitation and the large quantity of groundwater exploited, there are 12
groundwater overdraft areas in Xi’an, Baoji, Xianyang and Weinan, whose size totaled
594.54km2, causing serious ground fissures and cave-ins in Xi’an.
Between 1980 and 2000, the total quantity of groundwater in the province totaled 15.24
billion m3, including 7.54 billion m3 in the Yellow River Valley and 7.70 billion m3 in the
Yangtze River valley. By region, there were 2.54 billion m3 in Shaanbei, 5.02 billion m3 in
Guanzhong and 7.68 billion m3 in Shaannan. Compared with the average in 24 years
between 1956 and 1979, the quantity of groundwater resources in the province dropped 1.27
billion m3. The quantity of groundwater resources rose 10 million m3 in the Yellow River
Valley, and dropped 1.28 billion m3 in the Yangtze River Valley. The precipitation infiltration
supply in the plain areas of the Yellow River Valley reached 3.08 billion m3, 460 million m3
more than 2.62 billion m3, the average level in 24 years. The precipitation infiltration supply in
the plain areas of the Yangtze River Valley reached 210 million m3, 10 million m3 more than
the average level in 24 years. As the Yangtze River Valley covers a large mountainous area,
inter-annual change in the groundwater resources was mainly caused by precipitation and
river infiltration supply. Between 1990 and 2000, the precipitation and river runoffs in the
Yangtze River Valley dropped dramatically, resulting in a significant decline in the
groundwater resources in the Yangtze River Valley.
Except in 2003 when the quantity of groundwater resources in the province, the Yellow
River Valley and the Yangtze River Valley was higher than inter-annual average, in the
remaining six years between 2000 and 2006, the quantity of groundwater resources was
lower than the inter-annual average in dry and very dry years.
4.3.3 Change in total water resources
In 45 years between 1956 and 2000, the inter-annual average quantity of water
resources in the province reached 43.89 billion m3, including 12.48 billion in the Yellow River
Valley and 31.41 billion in the Yangtze River Valley. By region, the quantity was 4.46 billion
in Shaanbei, 8.64 billion in Guanzhong and 3.08 billion in Shaannan. Compared with the
inter-annual average in 24 years between 1956 and 1979, the total quantity dropped 320
million. The total quantity dropped 350 million in the Yellow River Valley and rose 30 million
in the Yangtze River Valley.
Situation Analysis of Shaanxi Province
·57·
4.3.4 Water use
By sector, the water consumption by industry grew 39.7 million m3 each year on average
between 1980 and 2000. It rose the most rapidly in the 1990’s at a rate of 59.2 million m3
annually. The consumption by agricultural irrigation was generally on the decline at an
increasingly slow pace. This is because of the agricultural restructuring, urbanization,
declining area of farmland and extension of water-saving irrigation technology. The
consumption of water for living purposes in urban and rural areas increased 15.4 million m3
and 9.6 million m3 each year on average, which grew the most rapidly in the 1990’s at 17.4
million m3 and 8.5 million m3 every year respectively. Due to the low water consumption rate,
most of the water consumed for living and industrial purposes in urban areas is directly
discharged into rivers without being treated, exacerbating the river pollution. The water
consumption in forestry, animal husbandry and fishery rose 16.5 million m3 each year on
average. In the 1990’s it rose the most rapidly at 20.6 million m3 annually.
Currently, the total annual water demand in Shaanxi was 11.2 billion m3, and water
resources available reach 9.2 billion m3. There is a gap of 2 billion m3, including 1.3 billion m3
in Guanzhong and 200 million m3 in Shaanbei. It is predicted that the gap will grow to 8.3
billion m3 by 2020. In case of protracted drought, the gap between water supply and demand
may further expand.
4.4 Loss of soil fertility and desertification
The soil fertility declines for various reasons. Soil becoming sandy and thinner plow
layer due to water and soil loss, falling accumulation and faster decomposition of organic
substance in soil as a result of rising temperature and declining precipitation, poorer soil tilth
because of the massive application of chemical fertilizer and ignorance of organic fertilizer,
pollution and secondary salinization of soil may all lead to declining soil fertility. Water and
soil loss is an important reason for falling soil fertility in the Loess Plateau in northern
fragility, vegetation fragility and human factors, such as the intensity and duration of
precipitation and wind, type and thickness of soil, type and nature of plants and vegetation,
gradients and length of slopes, and measures that people take to prevent the soil from being
destroyed.
According to the desertification monitoring report of the State Forestry Administration, in
2005, the size of land desertification in Shaanxi reached 10,344km2, which was on the
China Climate Change Partnership Framework - Enhanced strategies for climate-proofed and environmentally sound agricultural production in the Yellow River Basin (C-PESAP)
·58·
decline. There were two reasons for the decline. Firstly, the sand prevention and control
efforts in these desertification areas for years have accomplished significant results, and the
southward movement of shifting sand was checked. Secondly, as a result of amelioration of
carrying soil into farmland and water diversion for flushing sand dune, some of the sandy
land was converted into irrigatable farmland. People and governments at various levels in
these areas were engaged in afforestation for years. Moreover, there was more rainfall in
recent years (The annual average rainfall in Yulin for years was 405mm. The annual average
rainfall reached 510.5mm in the past three years). Consequently, the survival rate of artificial
afforestation was higher. In addition, government at all levels took some measures to
intensify the management and promoted the recovery of vegetation in sandy areas,
converted a large number of wandering dunes into semi-fixed sand land, and semi-fixed
sand land into fixed sand land.
4.5 Salinisation of soils
Soil salinization refers to the decline in land productivity caused by the accumulation of
soluble salt which is harmful to plants in soil because of rising groundwater level or
inappropriate irrigation. According to a survey on eco-environment, the land of soil
salinization in Shaanxi reached 85,587.3 ha in 2004, 20,765 ha more than 1999. The overall
change in soil salinization in the province was not significant. Yulin saw the largest area of
soil salinization. In term of intensity, soil salinization in the irrigated areas in Guanzhong and
Shaanbei is mostly of light and medium level, and high in some areas. Land salinization in
the Wuding River Valley along the Great Wall is mostly of light and medium level. Salinized
land in the Dingjing Plateau is mostly in stripe shape.
4.6 Effects of other environmental factors
In addition to temperature, precipitation and soil fertility, agricultural production is also
affected by topography, terrain, wind, sunshine, diseases and pests. In the hilly and gully
areas in the Loess Plateau in the north, and the Qinling-Daba mountainous areas in the
south, water and soil loss is the primary factor that affects the eco-environment. Over 80% of
the farmland in these areas is slope land whose gradient is 15°~25°. Each year, the annual
water loss in the slope land is up to 300~450m3/ha, and the annual soil loss 75~150t/ha,
which leads to the massive loss of organic substance, N, P and other nutrients. As a result,
the soil in farmland gets increasingly infertile, and the ability to preserve water and nutrients
drops.
Situation Analysis of Shaanxi Province
·59·
4.7 Estimated overall impact on crop production
The impact of climate change on agricultural production is both conducive and adverse.
Climate warming provides better conditions than the past, which is conducive to agricultural
restructuring, prolonging the growth period of some crops (such as vegetables) and
increasing the output. At the same time, however, climate warming shortens the growth
period of some other crops (such as winter wheat) and lowers the output and quality.
Climate warming is conducive to the wintering and multiplication of pests, increasing the
base of over-winter pests and bacterium sources, results in the outbreak and spread of
diseases and pests and accelerated decomposition of microorganisms. Therefore, the soil
are forced to increase the application of fertilizer, pesticides and labor work, significantly
raising the agricultural cost and investment demand.
The intensifying precipitation fluctuation, and the rising proportion of precipitation in
spring and summer in annual total, i.e. the precipitation becoming more concentrated, will
mitigate the restriction of inadequate water resources to agricultural development, and at the
same time, cause drought and flood. These will pose a considerate negative impact on
agricultural production. In more than 40 years after 1950, the area that suffered drought was
more than 1.333 million ha each year in Shaanxi, averagely, and the grain output was
reduced correspondingly by 800 million kg. In particular, in 1994 and 1995, the grain output
dropped by 2.7 billion kg and 3.0 billion kg respectively as a result of drought. Take 1990’s
as example, 30% of the agriculture in Shaanxi was affected by drought in major drought
years, and the disaster rate was more than 20%. In 1995, Shaanxi suffered a major drought.
The total grain output dropped 25% year on year. The water quantity in the Yellow River,
Bailong River and Hanjiang River declined dramatically. 3.6 million people and 1.6 million
head of livestock had difficult access to drinking water. In 1997, another major drought hit the
province. More than 1.3287 million ha of crops were affected, 46,700 ha of autumn crops
withered and died. People and livestock had difficulty in accessing drinking water. Due to the
major drought in 2000, the output of winter grain crops dropped, and some areas even
suffered total harvest failure. As a result of floods in 1998, most farmland in Hanzhong and
Guanzhong suffered total harvest failure. Moreover, due to high temperature and humidity,
corn suffered severe diseases and pests.
Altogether, the impact of climate change on agricultural production in Shaanxi is much
more adverse then conducive, which threatens the food security to a certain degree.
China Climate Change Partnership Framework - Enhanced strategies for climate-proofed and environmentally sound agricultural production in the Yellow River Basin (C-PESAP)
·60·
5 Assessing the impacts of agriculture on the environment
Agriculture is based on the application of natural and ecological resources (land, climate
and water). Agricultural production and eco-environment rely on and affect each other. With
economic development and technology advance, agricultural production experiences great
changes that pose negative impacts on the natural eco-environment on which agriculture
and human rely on. Such impacts mainly include the excessive resource utilization, pollution
and the threat to biodiversity.
5.1 GHG emissions and carbon sequestration
5.1.1 Categories of greenhouse gases
The reason for climate change varies in different dimensions and periods. After
analyzing ice core, tree ring, historical records and coral, Mann drew a conclusion: The
temperature fluctuation in the northern hemisphere was mainly caused by the solar activity in
the 17th century, volcanic activity in the 18th and 19th century, and change in the content of
greenhouse gases in the 20th century. By analyzing the temperature change over the past
1,000 years, people found an unassailable fact -- the rate of temperature rise in the 20th
century was never seen in the past 1,000 years.
Greenhouse Gases (GHGs) refer to the natural or man-made gases in the
atmosphere which can absorb and release the radiation of certain wavelength in the
spectrum of thermal infrared radiation from the surface of the earth, the atmosphere and
clouds, to cause greenhouse effects. The molecules of such gases mostly consist of odd
atoms. The most important greenhouse gas is H2O, followed by CO2, CH4, N2O, O3, PFCs,
HFCs, HCFCs and SF6. These gases have different abilities to absorb heat. The heat
absorbed by each CH4 molecule is 21 times of that absorbed by a CO2 molecule. The heat
absorbed by N2O is even higher, which is 270 times of that absorbed by CO2. Currently, the
gases that can absorb the most amount of heat are HFCs and PFCs. As their content in
the atmosphere is very small, these gases are also called trace gases. The greenhouse
effect caused by different greenhouse gases is not only related to the characteristics of the
greenhouse gases absorbing long-wave radiation (wavelength and intensity), but also related
to their content. The greenhouse effect caused by H2O is about 60%~70% of the total
greenhouse effect, and that caused by CO2 is about 26% of the total.
Changes in the contents of greenhouse gases in the atmosphere are mainly controlled
by natural factors and processes. However, human activities affect this natural evolution
process. In particular, the consumption of fossil fuels and deforestation since the beginning
of industrialization have greatly changed the chemical ingredients of the atmosphere, not
Situation Analysis of Shaanxi Province
·61·
only significantly increasing the contents of CO2, CH4 and N2O, but also adding some new
greenhouse gases that originally did not exist in nature, such as CFCs and SF5CF3. The
latest research shows that the concentration of two “new” greenhouse gases (NF3 and SO2F2)
in the atmosphere is rising rapidly. Both gases are used in industry to partially substitute
other hazardous greenhouse gases and gases that consume O3.
In the 1970’s, people found that the purely man-made CFCs in the atmosphere not only
destroyed O3 in the atmosphere, but also caused much greenhouse effect. The heat
stabilized by each molecule of SF5CF3, which is generated by high-voltage equipment, is
18,000 times that of CO2. Normally, the greenhouse effect caused by the increased content
of greenhouse gases in the atmosphere as a result of human activities is called enhanced
greenhouse effect. From the beginning of the industrial revolution to 1990, the contribution of
enhanced greenhouse effect by increased CO2, CH4, CFCs and N2O is about 62%, 21%,
13% and 4% respectively.
5.1.2 Emissions of greenhouse gases in agricultural Production
The fourth IPCC assessment report shows that agriculture is a major source of
greenhouse gas emissions. It is estimated that the CH4 emitted by agriculture on the global
scale accounts for 50% of the CH4 emission caused by human activities.
According to the 2004 Initial National Communication on Climate Change of the
People's Republic of China, the total greenhouse house emission by China in 1994 reached
3.650 billion tons of carbon dioxide equivalent. Amongst, CO2, CH4 and N2O accounted for
73.05%, 19.73% and 7.22% of the total respectively. The greenhouse gas emission by
agriculture took up 17% of the total. The emission of CH4 from agricultural activity reached
17.196 million tons, accounting for 50.15% of the total. Amongst, the emission of CH4
reached 11.049 million tons from animal raising and 6.147 million tons from paddy field. In
1994, the emission of N2O stood at 628,000 tons because of the application of chemical
fertilizer, 155,000 tons from animal dung and animal husbandry and 786,000 tons from
agricultural source, taking up 92.43% of the total emission in China.
Related studies show that we can reduce the emission of CH4 per head of beef cattle by
15%~30% through improving the nutrition of ruminant animals, lower the unit emission of
CH4 from paddy field through the extension of intermittent irrigation, household annual
emission of greenhouse gases by 2.0~4.1 tons of carbon dioxide equivalent through applying
marsh gas; we can lower the emission of N2O of unit farmland by 50%~70% through
popularizing slow-release and long-acting fertilizer. In 2007, the sown area of crops reached
4.045 million ha. Amongst, the sown area of rice and corn stood at 108,000 ha and 431,000
ha respectively. The number of cattle, horse, donkey, mule and pig totaled 10.647 head.
Currently, no estimate is available for the emission of greenhouse gases related to
agricultural production in Shaanxi. In particular, in recent years, Shaanxi vigorously
popularized the construction of household marsh gas pools. By the end of 2007, there were
China Climate Change Partnership Framework - Enhanced strategies for climate-proofed and environmentally sound agricultural production in the Yellow River Basin (C-PESAP)
·62·
731,000 household marsh gas pools. The coverage of marsh gas pools reached 10%. It is
planned that by 2012, 1.5 million household marsh gas pools will be built to increase the total
number to 2.2 million and the coverage will be raised to 32% to mitigate the pollution of
livestock and poultry dung and the emission of CH4.
5.1.3 Impact of agricultural production on carbon sequestration
Carbon circulates at a very rapid pace in the agricultural eco-system. In the field, crops
absorb CO2 through photosynthesis, and produce grain, feed and stalks. They serve as a
carbon sink. The produced grain and feed are consumed by people and animals and CO2
is emitted. The agricultural eco-system is an indirect source of carbon. For the agricultural
eco-system, the largest carbon source is soil in which the input of carbon is mainly decided
by the vegetation biomass on the ground and residue in soil. The loss of carbon in soil is
mainly decided by the rate of microorganism decomposition and the erosion rate of surface
soil.
Change in land utilization may be the most important factor that leads to the in creasing
CO2 content in atmosphere besides the burning of oil and coal. Amongst, the size expansion
of land (farmland and pasturage) for agricultural purposes and the reduction of forest area
are the major factors, because this change will not only lower the carbon pool in ground
vegetation, but also spawn the reduction of carbon pool in soil. Regarding land utilization and
organic carbon in soil, researches generally show that the conversion of forest or grassland
into farmland will lower the content of organic carbon in soil. Moreover, after years of planting,
the content of organic carbon in soil still can’t return to the level before the land utilization is
changed. Therefore, the Kyoto Protocol takes the stabilization of grassland and afforestation
as important measures to mitigate the rise of CO2 content in atmosphere. On the contrary, if
natural plants re-appear and grow in agricultural land, ground vegetation and soil may
sequestrate the carbon.
Agricultural fertilization will not only affect the supply of carbon to soil by affecting the
biomass of ground vegetation, but also affect the activity of microorganisms in soil. Therefore,
agricultural fertilization will surely lead to changes in soil carbon pool. Although the long-term
application of inorganic fertilizer, especially inorganic nitrogenous fertilizer, will promote the
growth of roots and increase the residue of stubbles, it will, due to the decline of soil C/N
value and rise in activity of microorganisms in soil, accelerate the decomposition and
mineralization of existing carbon and fresh organic carbon in soil. As a result, not only will the
total amount of organic carbon in soil fall, but also the decline of light-fraction organic carbon
will be far greater than that of heavy-fraction carbon. Consequently, the content of organic
carbon that does not oxide easily in soil will rise and the organic substance in soil ages. The
mixed application of both organic and inorganic fertilizer will supply organic carbon and
improve the physical properties of soil, increasing both the total amount of organic carbon
and the content of active organic carbon in soil.
Situation Analysis of Shaanxi Province
·63·
Traditional cultivation destroys the aggregate structure of soil, and exposes the organic
carbon in soil. In cultivation, the surface soil is fully mixed and the frequency and intensify of
aridity/humidity alternation increased. The permeability and porosity of soil gets better, soil
moisture and temperature conditions get improved, and microorganisms become more active,
accelerating the decomposition of organic carbon in soil. Less/no tillage can both mitigate the
erosion of organic carbon in soil to improve the sustainability of agriculture, and extend the
circulation cycle of stalks and other organic substance in soil to lower the emission of
greenhouse gases. In addition, less/no tillage, plus the returning of stalks to farmland, will
help accumulate both organic carbon and nitrogen nutrients in soil.
With regard to the management of crop stubble, when stalks are burned, not only will
carbon be directly emitted, but also the loss of organic carbon in soil will be accelerated
because of decomposition. When stalks are returned to farmland, the decline of organic
substance in soil will be mitigated. The most effective measure to reduce the emission of
CO2 from farmland is to increase the proportion of stalks returned to farmland.
In recent years, the agriculture technology departments in Shaanxi have constantly
intensified formula fertilization and encouraged the application of organic fertilizer and
returning of stalks to farmland. At the same time, government departments have also taken
rigid measures to mitigate the burning of stalks in fields to increase soil carbon pool.
Moreover, the area of afforestation and land returned from farmland to forest to increase the
carbon sequestration.
5.2 Over-exploitation of water resources
The consumption of water resources in agriculture mainly refers to the consumption in
irrigation. Factors that affect the water demand for agricultural purposes mainly include the
sown area and proportion between paddy field and dry land, price of water for agriculture
and natural precipitation. The excessive utilization of water resources in agriculture mainly
comes from the inadequate supply from natural precipitation and surface water, and
extensive irrigation, such as flooding irrigation.
China is a country whose water resources are inadequate. In 2006, the total water
supply in Shaanxi reached 8.408 billion m3, only one half of the national average. Amongst,
the supply of surface water stood at 4.855 billion m3, accounting for 57.7% of the total water
supply, ground water 3.482 billion m3, taking up 41.4% of the total, and other sources 71
million m3, representing 0.9% of the total. The per capita water resources in Guanzhong
which boasts a high density of population and economy is only about 15% of the national
average. Therefore, Shaanxi is a province that lacks water. Water consumed in agriculture in
the province takes up 71.89% of the total consumption. In some developed countries, this
proportion is below 50%. The inadequate total amount, extensive utilization of water
China Climate Change Partnership Framework - Enhanced strategies for climate-proofed and environmentally sound agricultural production in the Yellow River Basin (C-PESAP)
·64·
resources and low utilization efficiency lead to excessive exploitation and many other
problems. Currently, the transportation loss of water for irrigation is quite significant, and the
average coefficient of water efficiency of canal system is less than 0.7. The utilization rate of
water for irrigation is only around 0.4 in the province, and around 0.53 in some large
irrigation areas.
The main reasons for huge water loss in transportation and low water utilization
coefficient include: (i) Water conservancy facilities age seriously. In the province, the loss of
water in tunnel transportation accounts for over 80% of the total loss of water for irrigation; (ii)
most irrigation areas in Shaanxi still adopt the traditional and backward flooding irrigation.
The irrigation quota is generally too high, which is about 6,750~7,500m3/ha, 100% and even
200% higher than the actual demand in some places. As a result, the utilization rate of water
for irrigation is very low, leading to a very low utilization efficiency and serious waste of water
resources; (iii) in recent years, the area of water-saving irrigation projects is on the rise.
Currently, the area of water-saving irrigation in the province is about one third of the total
area of effective irrigation. Moreover, most of the completed water-saving irrigation projects
adopt channel seepage-proof and pipeline water conveyance irrigation technologies. The
area of land using high-tech sprinkler irrigation and micro irrigation only covers 3% of the
total area of effective irrigation; (iv) because of poor management and maintenance of water-
saving equipment, many water-saving facilities lie idle; (v) people have poor water-saving
conception and awareness. People in some counties still adopt flooding irrigation and
extensive irrigation. They don’t accept and get accustomed to water-saving irrigation, can’t
accept the idea of using loans for water conservation; and (vi) the economy is less
developed, and the investment in water-saving irrigation is inadequate.
5.3 Pollution of soil, water and food
Modern agriculture can produce enough grain on decreasing land. The role of chemical
fertilizer and pesticide is notable. Fertilization is one of the important means to increase the
output of grain crops. Appropriate fertilization will not only increase the output, but also
improve the product quality. The application of pesticides can prevent the large-scale
outbreak of crop diseases and pests. In addition, the application of mulch film in arid and
semi-arid rainfed farmland greatly raises the utilization rate of moisture in soil, mitigates the
impact of aridity on crop growth, and increases the output. However, the application of these
means will also cause pollution to the environment in which crops grow and the pollution of
agricultural products. It will not only have a negative impact on agricultural production, but
also threat the health of human beings and the existence of other living things.
Situation Analysis of Shaanxi Province
·65·
5.3.1 Pollution sources
(1) Pesticide: It is a mixture of substance used to kill pests, which can be chemical
substance, biological agent (bacterial agent), anti-biotics, disinfector or substance used to
ward off pests. Some pesticides are non-degradable organic pollutants. 98% of the pesticide
and weedicide that is sprayed will be sprayed and left on other objects (crops, soil, air, water,
sediment, food and human beings) than the targets. When sprayed, pesticides float in the
wind to other areas, and cause potential pollution to these areas (small pesticide residue is
detected in environmental mediums and organisms in the Antarctic, the Arctic, the Himalayas
and Greenland where pesticides have never been used). The residual pesticide that does
not break up enters soil and water, causing soil pollution and water pollution, and then food
pollution as it is absorbed by crops. In addition, when killing pests and increasing the output
of crops, pesticide also kills good microorganisms in soil and then changes the composition
and ecological structure of soil, and lowers the ability of soil for self-rehabilitation. The plant
fumigant and weedicide that are used in agricultural production will also indirectly change the
microbial community structure of soil. The long-term application will lower the productivity of
soil.
(2) Chemical fertilizer: Nitrogenous fertilizer mainly includes ammonium nitrogen
fertilizer, nitric nitrogen fertilizer and amide nitrogen fertilizer. In the presence of oxygen,
ammonium nitrogen fertilizer can be oxidized by microorganisms in soil into nitric nitrogen
and nitrite nitrogen. These negative ions can’t be absorbed by soil. Instead, they will easily
flow into groundwater with water to cause groundwater pollution. Excessive N and P flows
into rivers and lakes with drainage from farmland and rainwater, giving rise to rich nutrition to
water bodies, the rapid reproduction of algae and other planktons, lowering dissolved oxygen
in water and deteriorating water quality. As a result, fish and other aquatic organisms die in a
massive scale. When the amount of nitrate absorbed by plants is larger than the amount that
can be reduced, nitrate accumulates in the roots, stems and leaves of plants. After these
parts are eaten by people, livestock and poultry, nitrate is converted into nitrosamines by
bacteria and reductase, which will harm people, poultry and livestock. The content of nitrate
and nitrite in vegetables is much higher among all the agricultural products.
(3) Agricultural film: The residual agricultural film does not biologically degrade, which
causes soil pollution and further affects the quality of farmland, crop growth and even the
quality of agricultural products. One of the important ingredients of agricultural film is BPA
which can cause some health problems. This ingredient is not immobilized in plastic products.
Instead, it enters water and is even directly absorbed at time of contact with human skin to
damage people’s health.
(4) Livestock and poultry excreta: With the economic development and improvement
of people’s living standards, livestock and poultry industry expands rapidly. The pollution
caused by livestock and poultry excreta gets increasingly severe. When stacked and used
China Climate Change Partnership Framework - Enhanced strategies for climate-proofed and environmentally sound agricultural production in the Yellow River Basin (C-PESAP)
·66·
inappropriately, livestock and poultry excreta may pollute the water environment, and further
affect the quality of drinking water. Such excreta may also carry pathogenic bacteria to bring
risks to people’s health.
(5) Wastewater: If industrial wastewater is recycled as irrigation water, it will
unavoidably pollute the land and agricultural products.
(6) Heavy metal: The heavy metal that causes pollution in agriculture normally refers to
lead, mercury, chromium, cadmium, arsenic, copper and zinc. The heavy metal pollution
comes from various sources, such as the solid waste or wastewater from industry, pesticide
and fertilizer (such as phosphate fertilizer; produced from phosphorus ore). However, unlike
organic pollutants, heavy metal does not decay in the environment. Therefore, it can
accumulate in soil and agricultural products, hinder the growth of crops, lower the quality of
agricultural products, and even cause the death of crops. In a word, it can bring harm to
people, livestock and poultry through the food chain.
5.3.2 Current conditions of agricultural pollution in Shaanxi
(1)Environmental pollution caused by pesticides
The consumption of pesticide in Shaanxi has remained around 15,000 tons since 2000.
For instance, the consumption reached 14,500t in 2005 and 15,700t in 2006. Each farmer
household buys 2.58kg of pesticide on average. Among all the pesticides, insecticide and
acaricide account for 35% of the total, bactericide 40%, weedicide 10%~15%, and others
(plant growth regulator and rodenticide) 10%. Fruit trees and vegetables consume the largest
amount. Fruits and vegetables, whose sown area is less than 30% of the farmland, consume
about 60%~70% of the total pesticide. The increase in sown area of fruit trees is the major
reason behind the increase in pesticide consumption.
(2)Pollution caused by chemical fertilizers
In general, chemical fertilizer, especially nitrogenous fertilizer, is excessively applied in
Shaanxi. According to surveys, the excessive application of nitrogenous fertilizer is 128kg/ha
for maize field in the irrigation areas in Chuandao of Shaanbei, 21kg/ha for paddy field in
Shaannan, 55kg/ha for wheat field and 56kg/ ha for maize field in Guanzhong. As a result, a
total of 122,000 tons of nitrogenous fertilizer is lost every year in Shaanxi. In the 1990’s a
spot check was conducted on 93 wells in three counties in northern Shaanbei, and 74 wells
in 24 counties in Guanzhong and Weibei. It was found that the content of nitrate nitrogen in
the water of 21.5% of the wells was higher than 11mg/L. The content of nitrate nitrogen in
the water of some wells was even up to 70.0mg/L. The content of nitrate nitrogen in the
water of 29.73% of the 74 wells in Guanzhong and Weibei areas was higher than 11mg/L,
and the content was even up to 99.4% in some wells. In Yan’an where the water and soil
loss was serious, the content of nitrogen (excluding sand, which mainly came from various
fertilizers) in runoffs was up to 28.48t. In Hanzhong, the content of nitrate in 30% of the
Situation Analysis of Shaanxi Province
·67·
vegetables was higher than the standard. In Weinan, the content in 31% of the vegetables
was higher than the standard. This ratio was in 36% in Tongchuan and 32.5% in Xi’an. This
phenomenon was also very serious in Baoji, Yangling and Xianyang. The content of nitrate in
some vegetables was even over 3 times higher than the standard, and the content of nitrite
was 6.6 times higher than the level that was allowed. This indicated that the excessive
application of nitrogenous fertilizer posed a significant impact on the quality of agricultural
products in Shaanxi.
(3)Pollution caused by waste of livestock and poultry
Animal husbandry is an important sector for farmers in Shaanxi to increase their income.
In recent years, it has grown rapidly. According to statistics, in 2006, there were 11.6 million
pigs, 9.3 million goats/sheep, 76 million chickens and ducks and 3 million cattle in the
province. The dung of livestock and poultry also grew at a rapid pace. Currently, the dung of
livestock and poultry amounts to 50.0952 million tons each year. The dung mainly comes
from large livestock (mostly cattle) and pigs. Backyard livestock farmers normally raise the
livestock beside their houses. The air, water and soil would be seriously pollution. Some
farmers built marsh gas pools, significantly mitigating the pollution caused by waste of
livestock and poultry.
(4)Pollution caused by residual mulch film
The residual mulch film in Shaanxi totals 4,500t (calculated at an application of 15,000t)
each year. In the province, the area of cotton land adopting mulch film is about 70,000 ha,
causing 490~630t of residual mulch film each year. In addition, mulch film is also applied in
pepper field. It is estimated that when the rate of residual mulch film is 60kg/ha, the output of
maize will be reduced by 11%~23%, and the output of wheat will be reduced by 9%~16%. A
conservative estimate shows that the total output of maize and wheat in Shaanxi is reduced
by 190,000t and 140,000t each year because of residual mulch film.
5.4 Loss of biodiversity and natural ecosystems
5.4.1 Profile of Biodiversity
Biodiversity refers to the diversity and variability among living organisms and the
ecological complexes in which they occur. Diversity is the fundamental characteristic of all
life systems, which can be divided into four levels, i.e. genetic diversity, species diversity,
ecosystem diversity and landscape diversity. Biodiversity at different levels are inter-
connected. Genetic diversity gives rise to species diversity. The combination of different
forms of species decides the community, ecosystem and landscape diversity. Amongst,
species diversity is the most fundamental. According to the study of canopy levels in tropical
rain forest and deep sea bottom, there are now an estimated 80 million species on the earth.
Biodiversity is one of the most distinctive characteristics of the earth, which is also a
core part of the life support system on the earth. It enables the ecosystems to have their
China Climate Change Partnership Framework - Enhanced strategies for climate-proofed and environmentally sound agricultural production in the Yellow River Basin (C-PESAP)
·68·
unique features and functions to present huge economic value and public value. It is the
foundation for the existence and development of human race, providing the resources and
environment for the human beings. Many aspects of human beings is closely connected with
the maintenance of biodiversity which not only directly provides food, energy, medicinal and
industrial materials, but also plays an important role in maintaining the balance and stability
of ecosystems, sequestrating solar energy, adjusting hydrology and climate, absorbing and
decomposing pollutants, storing nutrients, promoting nutrient circulation and maintaining the
evolution process, as well as people’s leisure, entertainment, education and scientific
research. In addition, there are still a large number of wild species whose practical values
are still unknown, which have huge potential values. It is estimated that biodiversity creates
about US$33 trillion worth of values for human beings each year. As one of the few
“countries with a high degree of biodiversity” in the world, China is home to 10%~14% of the
total species in the world. The value of biodiversity in China amounts to US$4.6 trillion each
year.
Due to the rapidly-growing population and accelerated human economic activities, the
biodiversity which has evolved over billions of years on the earth is now under serious threat.
The decline in biodiversity because of human activities is increasingly severe. The ecological
functions are weakened or even get lost, posing a serious threat to the existence and
development of human race. In the past 50 years, human beings changed the biodiversity at
an race and dimension that are unseen before in history. The extinction rate of species was
1,000 times the typical background rate in the history of the earth.
Although China boasts a high biodiversity level, in recent years, because of the huge
pressure as a result of increasing demand for resources and eco-environment due to rapid
population and economic growth, many plants and animals are endangered. At present, 61%
of the original habitats are lost, 40% of the ecological systems have seriously degraded, and
15%~20% of the species are endangered. A lot of genetic diversity is lost. Among the 740
world endangered species listed in the Convention on International Trade in Endangered
Species of Wild Fauna and Flora, there are 189 in China. Take liquorice which is known as
“king of herbs” as example. It mainly grows in Inner Mongolia, Xinjiang, Gansu and Ningxia.
In the 1950’s, the distribution area of liquorice was around 3.2~3.5 million ha, and the
reserve totaled about 5 million tons. Currently, the area where liquorice is concentrated is
only 1.1 million ha, down 70%, and the total reserve is only around one fifth of the level in the
1950’s. At the current exploitation rate, we can hardly find any living wild liquorice in China in
5 years. In 2000, the IUCN Red List specified 49 flora species and 70 fauna species that
were endangered because of environmental impact. According to statistics, in China, there
were 10,000 breeds of wheat in 1949. But in 1970, only 1,000 breeds were grown in
farmland. The same trend is seen in animals.
Situation Analysis of Shaanxi Province
·69·
5.4.2 Reasons for the loss of biodiversity
There is no denial that biodiversity loss may occur in natural conditions. Some species,
because of their genetic characteristics, are fragile to environment, or are distributed in a
small area. As a result, the germ plasm (gene) is purified, i.e. the genetic diversity drops.
Consequently, such species are endangered. Once there is a pressure from the environment,
these species which have low genetic diversity will become extinct. For instance, the genetic
diversity of cathaya argyrophylla and metase-quoia glyptoboides is rather low. Besides
natural elimination, the impact of human activities is a major reason for accelerated loss of
biodiversity. Most human activities are related to agriculture.
(1) The habitats are destroyed and reduced in number. Some tropical rain forests are
cultivated into permanent farmland and pasture (most of which is later abandoned). As a
result, the area of tropical forests is reduced for more than half. The deforestation, blind
reclamation of wasteland and grassland, excessive pasturing which destroys the grassland
and leads to degradation of grassland ecosystem and exacerbated desertification, irrational
development of swamp and construction of water conservancy projects will all destroy and
diminish the existence environment of species.
(2) Predatory excessive utilization, such as long-time picking and digging of some
precious medicinal herbs, over-hunting of terrestrial animals, and over-fishing of marine life.
(3) Environmental pollution. Pesticide, oil and lead pollution will endanger or extinct
some species. In particular, raptors at top of the food chain are the most severely affected.
According to statistics, at present, the productivity of two thirds of the birds in the world is
declining. Habitat pollution is undoubtedly an important reason for this. The pollution also
poses an increasingly severe threat to raptors. According to statistics, at least 100,000 water
birds die from oil pollution in the world every year.
(4) Simplification of farming and forestry breeds. From a systematic biodiversity
perspective, agricultural system is becoming a system which only has one or two species,
changing the field landscape and lowering the biodiversity. In agriculture, to get the highest
output, normally a single high-yield species is planted. In the values of human society,
organisms that are conducive to the existence and development of human race are
considered to be “economic organisms”, while many other precious germplasm resources
become extinct before they are fully known.
(5) Introduction of external species. As a member of the ecosystem, each plant
occupies a position in the food chain in its original place. All plants restrict each other.
Therefore, the community remains relatively stable. This is the general law in nature. Once
an external species invades, it will disturb the existing balance, affecting and even seriously
destroying the biodiversity, and causing the extinction of local species. According to the
statistics of China’s Ministry of Agriculture, there are now at least 380 species of plants, 40
species of animals and 23 species of microorganisms that are invading China. Each year,
China Climate Change Partnership Framework - Enhanced strategies for climate-proofed and environmentally sound agricultural production in the Yellow River Basin (C-PESAP)
·70·
the direct economic losses in various sectors of national economy amounts to RMB19.859
billion.
(6) Fragility of organisms to environmental change. When the environment is destroyed
by human activities, the population of many species will shrink, and some species even
become extinct. Biologists observe that not all species have the same possibility of becoming
extinct. Some special species are especially fragile endangered. Such species have narrow
geographical distribution, small and declining species population, low density of population,
large body size. They lack effective dissemination means, carry out seasonal migration, live
in a stable environment, form permanent or temporary community, and are prone to the
hunting and collection of human race.
5.4.3 Situation of biodiversity in Shaanxi
Shaanxi is in the inland of China. It has complex natural environments, and regular
latitude zonation. It has a variety of habitats, species, natural and historical relics that need to
be protected. Qinling Mountains are the natural boundary for the south and north of China.
The complex topography and varied climate environment give rise to rich biodiversity.
Therefore, the Qinling Mountains become a “natural gene library” of species in the world,
including many precious and endangered species such as giant panda, golden monkey,
yakin, south China tiger, red ibis, uniflora, yew, magnolia officinalis and davidia involucrate.
The Yellow River, Hanjiang River and Weihe River valleys give birth to a lot of wetland and
rare birds. The Loess Plateau in Shaanbei is the central Loess Plateau in China, where there
are many typical eco-environments and rare species of semi-arid zones. According to the
latest statistics, there are 150 families, 833 genera and over 3,700 species of flora, 753
species of vertebrates (including 26 species of amphibians, 51 species of reptiles, 397
species of birds, 146 species of mammals, and 133 species of fish) in Shaanxi. There are
also 12 species of wild animals under Grade-1 national protection, 67 species of wild animals
under Grade-2 national protection, and 50 species of flora under national and provincial
protection. Shaanxi is the only habitat of red ibis in China, and the second home to giant
panda. It also has a large population of golden monkey, antelope, whooper swan and other
rare animals. In recent years, a certain population of brown eared pheasant and red-crowned
crane which are listed as animals under Grade-I national protection has been found. Many of
the animals are listed in China Red Data Book of Endangered Animals, List of Wild Animals
under National Protection (1989), Law of the People's Republic of China on the Protection of
Wild Animals, Convention on International Trade in Endangered Species of Wild Fauna and
Flora, Sino-Japanese Agreement on Migratory Bird for the Protection of Birds and
Convention on Wetlands of International Importance Especially as Waterfowl Habitat.
Except for gingkgo which is a cultivated or semi-cultivated species, all the other 44
species endangered flora are all wild species, including Himalayan mayapple which is known
as “Head of Herbs”, whose rhizome, root and fruit are rich in pobophyllotoxin, an effective
Situation Analysis of Shaanxi Province
·71·
cure to various cancers. There are also precious herbs like syringa pinnatifolia, trillium, tuber
of elevated gastrodia, eucommia, paeonia rockii hybrids and dwarf peony, and important
medicinal plants, such as Chinese goldthread, dysosma versipellis and magnolia officinalis.
and other trees are all quality tree species for lumber and high-mountain afforestation.
Eucommia, mandrel and other trees are important materials for chemical industry.
To preserve the unique and rare fauna and flora resources, Shaanxi has set up several
national and provincial animal and plant reserves, and wetland reserves to maintain the
biodiversity in the province.
China Climate Change Partnership Framework - Enhanced strategies for climate-proofed and environmentally sound agricultural production in the Yellow River Basin (C-PESAP)
·72·
6 Status and gaps of adaptation to climate change and the reduction of unsustainable land use
6.1 National policies and initiatives
In recent years, top Chinese leaders have involved themselves in the mitigation of global
warming, and have taken a series of important measures. In 2006, the 4th Session of the
10th National People’s Congress approved the Guideline for the 10th Five-Year Program,
proposing to lower the energy consumption per unit of GDP by 20% in five years. In 2007,
China formally said goodbye to the old development concept of “rapid and sound growth”,
and initiated the concept of “sound and rapid growth”, taking the quality of development as
the priority calculation index. On June 4, 2007, China's National Climate Change Program
was officially released. It was the first comprehensive policy document on climate change
that the Chinese government drafted in response to the United Nations Framework
Convention on Climate Change in light of China’s national conditions and the internal
requirements for sustainability.
China's National Climate Change Program mainly reviewed the conditions of climate
change in China and the efforts made to cope with the climate change, analyzed the impact
of climate change on China, the challenges to China, proposed the guiding concept,
principles, goals, related policies and measures for climate change, and expounded China’s
basic footings on climate change issues and demand for international cooperation. It will play
a guiding role in China’s efforts to cope with the climate change. Moreover, China's National
Climate Change Program is also the first national program on climate change unveiled by
developing countries. According to the program, by 2010, China will achieve the targets of
controlling greenhouse gas emissions and enhancing the ability to adapt to climate change,
including lowering the energy consumption per unit of GDP by 20% by 2005, reducing the
emission of carbon dioxide, increasing the forest coverage rate to 20%, and the ratio of area
of natural reserves in national total land area to 16%. Obviously, energy conservation and
emission reduction has become a focal issue attracting attention from the whole society, and
also a priority task of the central government. To fulfill the tasks specified in the program,
provide technology support for the implementation of the program, and improve China’s
ability to cope with the climate change, the Ministry of Science and Technology, National
Development and Reform Commission, Ministry of Foreign Affairs, Ministry of Education,
Ministry of Finance, Ministry of Environmental Protection, Ministry of Agriculture, Ministry of
Water Resources, State Forestry Administration, State Oceanic Administration, China
Meteorological Administration, Chinese Academy of Sciences, National Natural Science
Foundation and China Association for Science and Technology issued the China's Scientific
and Technological Actions On Climate Change at the beginning of June, 2007.
Situation Analysis of Shaanxi Province
·73·
China took active policies and actions to cope with climate change in agriculture, forest
and other natural eco-systems, water resources, and in fragile coastal areas. It has
accomplished great achievements in this regard. In agriculture, China has unveiled and
implemented the Agriculture Law, Grassland Law, Fisheries Law, Land Administration Law,
Regulations on Responses to Major Emergent Animal Epidemics and Regulations on
Grassland Fire Prevention, established and improved a policy and regulation system for
climate change in agriculture. It has intensified the construction of agricultural infrastructure
and water conservancy facilities, expanded the area of irrigation, improved the irrigation
efficiency and the overall drainage and irrigation ability of farmland, popularized water-saving
technologies in dry-farming areas, and strengthened the disaster prevention, resistance and
relief in agriculture. Moreover, China has enhanced the development of biomass energy and
lowered the discharge of waste in agriculture. It has also carried out a “Seeds Project” to
cultivate high-yield, good-quality, drought, flood, high-temperature, disease and pest
resistant breeds. In this regard, China (i) further enhanced the extension of fine breeds and
increased the coverage of fine breeds; (ii) consolidated the prevention and control of major
animal epidemics, put in place and improved an animal epidemic prevention system and
intensified the monitoring and warning of animal epidemics; (iii) returned farmland into
pasture, carried out grassland enclosure, built artificial meadow in grassland areas,
strengthened the construction of fire infrastructure in grassland, protected and improved the
eco-environment in grassland; and (iv) fostered and protected aquatic organisms to preserve
aquatic organism resources and aquatic eco-environment.
The incentive policies include the subsidy for biomass energy facilities (marsh gas pool),
seeds and conservation tillage machine and equipment.
Of course, the key to the implementation of related policies is local governments. On
June 11 of 2008, the Climate Change Program of Shaanxi Province was adopted by the 11th
standing meeting of the provincial government. This program was drafted in response to the
Circular of the State Council about Printing and Circulating the China's National Climate
Change Program. It analyzed the impact of climate change on Shaanxi and the challenges
facing the province, proposed the guiding concepts, principles and targets, and the key areas
and major tasks of the province. It also, in light of the actual conditions, put forth related
guaranty measures for climate change. It is a provincial guiding document that was drafted in
response to China’s National Climate Change Program, which will play a guiding role in the
work on climate change in the province.
China Climate Change Partnership Framework - Enhanced strategies for climate-proofed and environmentally sound agricultural production in the Yellow River Basin (C-PESAP)
·74·
6.2 Yellow River Basin and selected focus areas
6.2.1 Human capacity and awareness
(1) Meteorological department
The county meteorological bureaus provide meteorological service in light of the local
agricultural restructuring, efforts to increase farmers’ income and construction of new
countryside, publish various agricultural meteorological consultancy periodicals to release
meteorological service for agriculture on a regular and irregular basis. Such service include
climate analysis and assessment, soil moisture content of farmland and crop growth
conditions, monitoring of ecological climate environment, agricultural meteorological
disasters, advice on production and countermeasures, and agricultural meteorological
service in close connection with crops. They provide service and support for agricultural
production authorities to make correct judgment, give guidance in a timely manner, and
effectively cope with disasters. The service products transit from single weather forecast to
multidimensional, multifold and series of services that cater to the demand of socio-economic
development. At present, there are various information products they produce and release
for agriculture, which play an important role in the organization of the production of cash
crops, disaster prevention and mitigation.
The county meteorological bureaus actively collect information about local agriculture,
learn about the farming progress and disasters, provide series of meteorological service
before, during and after agricultural production for not only winter wheat, maize and other
field crops, but also apple, pear and other fruits. They actively promote the application of
“12121” mailbox, set up electronic display to solve the problem of “last mile” in serving
agriculture. The electronic display shows the soil moisture content, disaster information and
other information service products in a timely manner. They provide the service products
both in written form and through radio station, TV station, electric display and SMS.
(2) Department of agricultural technology extension
This department pays much attention to the extension and application of clean
agricultural production technologies, such as pollution-free pesticide, environment-friendly
mulching material, amelioration of fruit trees to lower the occurrence of diseases and pests,
and breed restructuring. It also helps lower the pollution of waste from agricultural production,
develops circular economy in ecological orchards, popularizes the returning of stalks to field
and deep tillage technology, and drought-resistant crop breeds.
(3) Farmers
Farmers conscientiously adjust their production practice, learn about meteorological
information from various channels to restructure their production, and minimize the losses
caused by extreme meteorological phenomena.
Situation Analysis of Shaanxi Province
·75·
Of course, due to the long time of agricultural production, “experience-based agriculture”
still has much influence among farmers and officials. The sense of “information-based
agriculture” has not been built up. The effect of meteorological service for agricultural product
is not significant. In the face of climate change, the extent that farmers and rural communities
adjust their production practice is decided by how much agricultural technologies they master
and how much their income is.
In the face of possible output reduction or new opportunities caused by climate change,
competent authorities launch active publicity campaigns and restructure the agriculture in a
well-planned manner to minimize the losses, achieve potential benefits, and increase the
resistance of agriculture to the negative impact of climate change.
6.2.2 Adaptation processes
Shaanxi is a large agricultural province whose agriculture is very sensitive to climate
change. The measures to enhance the ability of agriculture to adapt to climate change
include: (1) intensify the construction of agricultural infrastructure and boost the construction
of modern agriculture; (2) restructure the agriculture and cropping system, and select stress-
resistant breeds; (3) enhance the extension of agricultural technologies and develop
ecological agriculture; and (4) vigorously carry out the construction of key afforestation
projects, and strengthen the preservation of the existing forest resources and other natural
eco-systems.
6.2.3 Measures for reducing unsustainable land use
Against the backdrop of climate change, the major problems in the utilization of land
resources in Shaanxi mainly include serious water and soil loss, land desertification,
shortage of water resources, low efficiency of land resources utilization, degradation of
grassland and wetland. At present, the major measures to reduce the non-sustainable
utilization of land resources include:
(1) Carried out farmland construction centering on water storage facilities. In recent 10
years, the province has vigorously carried out small valley control and farmland capital
construction, including building various terraces and dike fields, and adopting contour
farming, ridge tillage, and high-yield ditch technologies.
(2) Built a rain-collection water-saving agricultural technology system in arid land, set up
a comprehensive technology system to improve the productivity of water resources,
increased the utilization efficiency of precipitation and land productivity to effectively control
the water and soil loss.
China Climate Change Partnership Framework - Enhanced strategies for climate-proofed and environmentally sound agricultural production in the Yellow River Basin (C-PESAP)
·76·
(3) Developed water-saving irrigated agriculture. Shaanxi built supportive facilities for
large irrigation areas, put in place and improved a high-efficiency irrigation system,
accelerated the construction of rainwater storage and utilization facilities in hilly and arid
areas, actively popularized drought-resistant breeds and water-saving technologies to
improve the efficiency of water utilization, vigorously built small water conservancy facilities,
established a scientific water utilization management system, reformed the pricing
mechanism of water for agricultural purposes, and strengthened the construction of IT-based
management system in irrigation areas.
(4) Built a land utilization model of diversified development for forestry, farming and
animal husbandry. Great achievements have been made in this regard. In particular, the
model combining grain and fruit production carried out in arid tableland areas in Weibei
increased the agricultural benefits, and significantly raised the ability of farmers to resist
drought disasters.
Situation Analysis of Shaanxi Province
·77·
7 Potential C-PESAP strategies, adaptation and implementation scenarios and cost/benefit estimates
7.1 Human capacity and awareness
7.1.1 Potential strategies
(1) Strengthen the publicity and training to increase people’s awareness of climate
protection. Use various media to increase people’s knowledge on climate change;
consolidate the education of young people to foster an awareness of climate change among
them; build sustainable consumption models among the public to contribute to the protection
of global climate. Launch various exhibitions, questionnaires, wall-newspapers, paintings,
lectures and performances to popularize knowledge on climate change and how to mitigate
and cope with climate change in schools, families and communities so as to enhance
people’s awareness of environmental protection and foster a good behavior. Increase the
awareness of government officials, agricultural service providers and farmers on climate
change.
(2) Adapt to climate change. Governments at various levels give priority to climate
change in their climate change strategy to promote agricultural production and ensure food
security. The measures they take include: (i) strengthen the rational development and
utilization of water resources and pay much attention to the development of rainfed
agriculture; (ii) control the water and soil loss to improve the eco-environment; (iii) establish a
rational agricultural production structure, improve the utilization efficiency in arid areas, give
full play to the production potential in arid areas, properly deal with the relations between
planting and forestry and animal husbandry, between ecology and environment, between
social economy and natural conditions to build an optimal agricultural structure which
features benign ecological circulation for maximum bio-yield to meet the social demand.
(3) Make the best use of positive impact of climate change in agricultural production. An
important measure to mitigate the impact of climate change is to give full play to the
advantages. The climate change which is mainly characterized by temperature rise has a
significant impact on the output increase of crops. Therefore, we should further restructure
planting, improve the distribution of agricultural products that enjoy an advantageous position,
enhance high/stable-yield intensive agricultural technologies, and make full use of the
positive impact of climate change on agricultural production in recent years for constant
improvement of agricultural production.
(4) Develop low-carbon agriculture to lower the discharge of agricultural waste. We
should unveil related policies to guide farmers to increase the application of organic fertilizer,
put an end to the burning of stalks, and reduce the application of chemical fertilizer and
pesticide to improve the farmland quality. We should also give full play to the role of fruit and
forestry industries in carbon sequestration. Moreover, we should build and renovate the
China Climate Change Partnership Framework - Enhanced strategies for climate-proofed and environmentally sound agricultural production in the Yellow River Basin (C-PESAP)
·78·
marsh gas pools in rural areas to build clean rural areas. In light of the construction of eco-
environment, we should vigorously carry out the construction of energy forests.
(5) Pay attention to the monitoring, forecast and prevention of disastrous meteorological
phenomena. Build and improve a warning system for disaster relief to provide technological
support to minimize the grain loss caused by meteorological disasters. Against the backdrop
of global warming, decision makers should review the existing disaster relief plans, and pay
more attention to risk mitigation and adaptability enhancement. Accelerate the construction
of climate change projects, and improve the innovation in climate change. Integrate
technological research, development of adaptation and mitigation technologies and ability
enhancement into the national and local 11th five-year programs.
(6) Cope with the threat of extreme meteorological disasters. We should pay special
attention to the threat of extreme meteorological disasters to agricultural production and food
security. We should, based on the prevention of major disasters and continuous disasters,
manage to stabilize the self-supply of grain according to the climate and grain production
conditions in different periods.
7.1.2 Implementation scenarios
After the Climate Change Program of Shaanxi Province was issued, Weinan, Xianyang,
Yan’an and Baoji have conveyed this program to their subordinates to enhance the
knowledge of governments on climate change.
Governments at all levels should well improve the public awareness of climate change.
TV, radio, Internet and newspaper should be made full use for publicity on climate change to
create s sound social atmosphere. Colleges/universities, research institutes and public
resources should be mobilized to launch training programs on climate change. Knowledge
on climate change should be introduced into the teaching of primary and secondary schools.
Education on climate change should be carried out in urban and rural areas. Sustainable
way of living should be encouraged and promoted, the idea of power and water conservation
should be popularized. People’s awareness for garbage recycling and classification should
be enhanced for a consumption model featuring lower greenhouse gas emissions. The role
of businesses and general public in supervising government work should be given full play.
Hotlines and websites should be established to facilitate the report of environmental
accidents, involve the general public and all walks of life in the mitigation of global climate
change. Various measures should be taken to increase the awareness of governments and
general public on climate change for a sound social atmosphere by 2010.
In the short run, we should actively develop and use renewable resources and optimize
the energy structure. By 2010, the proportion of coal in the energy consumption should fall
for 3~5 percentage points, and the proportion of natural gas, hydraulic power, wind power
and solar power should increase for 5~8 percentage points. The coverage of household
marsh gas pool should be over 30% in rural areas, and marsh gas projects should be
Situation Analysis of Shaanxi Province
·79·
established in more than 50% of the livestock and poultry gardens, and the ratio of
renewable resources in the primary energy structure increased to 10%. By 2010, we should
build 1 million mu of energy forests in the mountainous areas of Shaannan and sandy areas
in Shaanbei, which will further grow to 10 million mu by 2020 to meet the material demand
for 500,000 tons of biodiesel oil. Moreover, we should develop straw power generation in
Guanzhong, and refuse power generation in Xi’an, Baoji and Xianyang to promote the
development of “low carbon economy”.
We should intensify the facilities of disaster relief by establishing a well-coordinated
disaster prevention and relief system. A disaster relief system should be established for
floods, geological disasters, diseases and pests, forest and grassland fire and human effects.
The monitoring, forecasting and early warning of disastrous climate incidents should be
improved to minimize the losses caused by such disasters. By 2010, 20% of the places with
potential geological disasters should be controlled, up to 80% of the hails should be
artificially suppressed, the losses caused by hail should be reduced for over 50%, and the
rainfall should be increased by 1.0~1.5 billion tons artificially each year. In addition, major
forest and grassland fires should be avoided.
7.1.3 Cost-benefit estimates
According to the Stern Review on the Economics of Climate Change compiled by
Nicholas Stern, climate change is an undisputable fact. If it goes on as now, by the end of
the 21st century, the global temperature will rise 2~3℃, which will cause a decline of up to
5~10% in global GDP, and even more than 10% in some poor countries. If measures are
taken now, and the content of greenhouse gases is controlled between 450×10-6~550×10-6
by 2050, the cost will be only 1% of the GDP. The review proposed long-term stable carbon
price policies, low-carbon technology development policies, and policies to remove the
barriers to behavioral change and ensure the effective implementation of emission reduction
initiatives. Currently, global cooperation and climate initiatives which targets at adaptation
are economically practical, and conducive to the fulfillment of climate targets.
According to the estimate of IPCC, 2.48 trillion tons of carbon is stored in the terrestrial
eco-system around the world. Amongst, 1.5 trillion tons are stored in the forest eco-system.
Forests cover 27.6% of the earth’s surface, the carbon reserve in forest vegetation takes up
77% of the total reserve in vegetation in the world, the carbon reserve in forest soil accounts
for 39% of the total carbon reserve in soil around the globe, and the carbon reserve in forest
eco-system is about 57% of the total carbon reserve in terrestrial eco-system. At present, the
value of carbon sequestration, oxygen production and storage by forests in Shaanxi is about
RMB8.99075 billion (according to the sixth forest census). The productivity of forest land in
Shaanxi is not high. The growing stock per unit area is only 85.3% of the national average
(75.05m3/ha), and 55.5% of the world average. The mean annual increment in forested land
is only 2.25m3/ha, lower than the national average (3m3/ha·a) and much lower than the level
China Climate Change Partnership Framework - Enhanced strategies for climate-proofed and environmentally sound agricultural production in the Yellow River Basin (C-PESAP)
·80·
of countries with developed forestry industry (5~7m3/ha·a). Therefore, forests have much
potential in carbon sequestration.
As the third largest fruit-producing province in China, Shaanxi takes the fruit industry as
the dominant industry in agriculture. There is still much potential in increasing the carbon
sequestration by developiing fruit forests. Moreover, as the province is narrow and long from
the south to the north, it has various climate zones and complex topographies, presenting
much room for the development of forestry.
Between 1961 and 2000, the climate productivity in the Loess Plateau was
7,762.1kg/(ha.a) on average. However, due to climate warming, the soil aridity is
exacerbated. As a result, the climate productivity is generally on the decline at a rate of
10.45kg/(ha.a). The major crops grown in Shaanxi include winter wheat and maize. If the
current trend goes on, and adaptive wheat breeds have not substitutes, the yield of winter
wheat will drop 10%~15% on average. Irrigation can partially offset the negative impact of
climate change for no higher than 5%. As a result of climate warming, the output of spring
maize will drop 2%~7%, and that of summer maize will fall 5%~7%. The output of irrigated
maize will drop 2%~6%, and that of unirrigated maize will fall 3%~6%. That is to say, climate
change will result in a 3%~6% reduction in total maize output on average. The reduction
when irrigation is available is smaller than otherwise. In general, climate change has more
negative impacts on maize production. The major reason for output reduction is the
shortening growth period and higher temperature in the growth period. That is to say, in
addition to reducing the output, climate change will also lower the ROI of wheat by 10%~15%,
and that of maize by 3%~6%.
7.2 Adaptation processes
7.2.1 Potential strategies
(1) Increase the cropping index, adjust the tillage system and make full use of the heat
resources. Generally speaking, climate warming is conducive to the multi-cropping system:
Thecropping index will go up. The area of double cropping for maize and wheat, triple
cropping of wheat, maize and wheat in two yars, and double cropping of rape and maize will
go up. To improve the economic returns of agriculture, the multi-cropping system for
interplanting of various cash crops will be developed significantly.
(2) Enhance the management of agricultural production and mitigate the negative impact
of climate change. Adjust the management measures, including effective utilization of water
resoruces, control of water and soil loss, increasing irrigation and fertilization, prevention and
control of diseases and pests, and extension of ecological agricultural technologies, to
increase the adaptability of the agricultural eco-system. Improve the comprehensive control
of salinine and sandy wasteland, and water and soil loss, gradually ameliorate medium/low-
Situation Analysis of Shaanxi Province
·81·
yield farmland into high-yield land. At the same time, study and popularize accurate tillage
technologies based on automation and intelligence, adopt modern agricultural managment,
lower the cost of agriculturla production, and improve the land utilization efficiecy and
productivity.
(3) Improve the agricultural infrastructure and conditions, and increase the abililty to
prevent meteorological disasters. To mitigate the impact of climate change on agriculture, we
must constantly improve the adaptability of agricultural eco-system to climate change and
disaster relief ability. We must also renovate the aged drainage and irrigation facilities,
increase the irrigated area, develop water-saving agriculture and scientific irrigation to
improve the water utilization efficiency. Moreover, we must intensify the construction of
facilities for comprehensive natural disaster prevention. Due to climate change, arid and
semi-arid areas in the north will become more unstable and more arid. In these areas, we
should focus on soil amelioration and water control, intensify farmland capital construction,
improve agricultural ecology and environment and build high-and-stable-yield farmland.
(4) Cultivate and apply stress-resistant breeds, strengthen the study of technologies that
can stablize and increase the yield. We should enhance the development of and research on
biological technologies, stress resistance, facility agriculture and precision agriculture,
increase human abilty to cope with climate change and their impact on agriculture,
mannually reduce the negative impact of climate change on crops, cultivate and apply
stress-resistant breeds that are drought, flood, high and low temperature tolerant. Based on
the analysis of future allocation of light, temperature and water resources and the new
pattern of meteorological disasters, we should ameliorate crop and breed distribution.
7.2.2 Adaptation scenarios
Currently, the average cropping index of farmland in Shaanxi is 136%. As the climate
gets warm, the effective active accumulated temperature rises. By adjusting the cropping
system, increase the area of interplannting, and move the area that adopts mult-cropping
system northward, we are likely to increase the cropping index by around 15% within a short
time.
To ward off natural disasters, agriculture is internally restructured, the sown area of
grain crops is on the decline, while the area of high-efficiency cash crops is on the rise. In
terms of sown area, the proportion btween grain crops and cash crops including mulberry,
tea and fruits was adjusted from 71:29 in 1991 to 65:35 in 2003, with the proportion of cash
crops going up 6 percentage points. In total output, the proportion between grain, cash and
fruit crops was changed from 50.9:28.4:20:7 in 1991 to 43.3:34.4:22.3 in 2003, with the
proportion of grain crops going down for 7.6 percentage points, and that of cash crops and
fruits going up 6 and 1.6 percentage points respectively. In cash gardening crops, the sown
area of traditional cash crops such as oil and flue-cured tobacco remains stable, while that of
medicinal materials, vegetables, tea and flowers increases rapidly. According to traditional
China Climate Change Partnership Framework - Enhanced strategies for climate-proofed and environmentally sound agricultural production in the Yellow River Basin (C-PESAP)
·82·
statistics, the growth rate is up to 2.67%, 4.9% and 42.7% respectively. The product quality
is further improved. Since the autumn of 2002, the sown area of low-yield and inferior-quality
grain crops has been declining, and that of high-quality grain crops and speical cash crops
has been rising. In sumemr grain crops, the sown are of quality wheat is 382,270 ha, up
36.7%, accounting for 31% of the total sown area of wheat. In autumn grain crops, the sown
area of maize is 136,000ha.
7.2.3 Cost-benefit estimates
As a result of climate change (especially temperature rise in winter), it is easier for many
pests and pathogens to survive winter, so the base of disease and pest sources increase.
Due to temperature rise, pests begin to grow at an earlier time, and hibernate for winter at a
late time. The number of pest generations in one year increase, and the probability of
repeated damages to farmland increases. The increase in the content of CO2 leads to
declining content of nitrogen in plants. As a result, pests increase their feed intake to meet
the demand for protein. The change in crops and increase in cropping index may make it
easier for pests and pathogens to spread. When the temperature rises, microorganisms in
soil decomposes at an accelerated pace, leading to declining soil fertility. Carbon in the
organic substance in soil is an important part of carbon pool on the earth. It is involved in
global carbon circulation. CO2 and CH4 generated from the decomposition of organic
substance are important greenhouse gases. Organic substance in soil is very sensitive to
climate change. Temperature is an important environmental factor that affects the
decomposition rate. The content falls as the precipitation falls and temperature rises.
Comparison of change in soil fertility under different temperatures and application of urea
shows that when the application of urea is 450~1,125kg/ha and the daily average
temperature is 15~28�, if the temperature rises for one degree, the release of quick-acting
nutrient increases about 4%, and the release cycle gets 3.6d shorter. Under the same
temperature, the higher the urea application is, the larger the release of quick-acting nutrient
will be.
The diseases and pests exacerbate, the decomposition of organic substance in soil
accelerates, and the release cycle of chemical fertilizer gets shorter. Climate change will also
raise the irrigation cost, and the expenses for soil amelioration, water and soil maintenance,
and consequently raise the agricultural investment and cost. On the other hand, the negative
development of agricultural eco-environment will also increase the agricultural cost. It is
estimated that by 2000, 2025 and 2050, the proportion of newly-added investment for climate
change accounts for 2.4%, 7.9% and 17.0% of the agricultural investment in 1990
respectively in China. In Shaanxi, because the plains in Shaannan and Guanzhong generally
adopt the double cropping system, due to the cropping index, the newly-added investment
for climate change will be higher than the national average.
Situation Analysis of Shaanxi Province
·83·
7.3 Measures for reducing unsustainable land use
7.3.1 Potential strategies
The area of the Yellow River Valley in Shaanxi is 1.183 million ha, accounting for 60.4%
of the total area of the province. The increasing number of temperature rise, falling rainfall,
drought and other extreme climate and meteorological incidents due to climate change
poses a significantly negative impact on agricultural production in this area. It is estimated
that the output of dry land and irrigated area in the whole Loess Plateau only accounts for
20%~40% and 50%~70% of the light-temperature potential productivity respectively.
Therefore, we should increase the climate potential productivity of crops by protecting the
farmland quality to ensure grain security after the output of major grain crops is reduced
because of climate change. The strategic measures to reduce non-sustainable utilization of
land resources include:
(1) Adopt the strictest farmland protection system to make sure that the total acreage of
farmland does not decline, the quality does not deteriorate, and the land purpose is not
changed. Carry out water conservation in large irrigated areas, build and improve a high-
efficiency irrigation system. Speed up the construction of rainwater collection and storage
facilities in hilly and arid areas, actively popularize dry-farming and water-saving
technologies, and improve the water utilization efficiency. Vigorously build small water
conservancy projects, set up a scientific water utilization management system, enhance the
construction of IT-based management and dispatch system in irrigated areas for a high-
efficiency land utilization mechanism.
(2) Strengthen the farmland capital construction, improve the agricultural eco-
environment and build high/stable-yield farmland to constantly increase the ability to cope
with climate change and disasters.
(3) Develop mulching cultivation and protected agriculture, intensify the development of
and research on photosynthesis, biological nitrogen fixation, biological technologies, stress
resistance and precision agriculture to increase the land productivity and the adaptability to
climate change.
(4) Increase the number and area of natural reserves to preserve natural secondary
forest, wildwood and biodiversity in forest. At time of afforestation, select thermophilous,
drought, disease and pest resistant breeds, increase the competition of breeds in adaptation
to climate change and migration, and the adaptability to environmental change.
7.3.2 Implementation scenarios
After the strategies are implemented, the water and soil loss, soil pollution by chemical
fertilizer and pesticide, secondary salinization and desertification in Shaanxi is effectively
alleviated. The proportion of middle/low-yield farmland is reduced, quality of farmland
China Climate Change Partnership Framework - Enhanced strategies for climate-proofed and environmentally sound agricultural production in the Yellow River Basin (C-PESAP)
·84·
improved, unit yield of grain significantly increased, and the conflict between people and land
effectively ameliorated. Wetland, forest, grassland and farmland are well preserved and the
structure further optimized. Moreover, the vegetation coverage rate is greatly increased and
total amount of CO2 sequestrated by plants and soil raised, which can help lower the content
of CO2 in the atmosphere.
7.3.3 Cost-benefit estimates
Through the rational development and optimized allocation of water resources, the new
mechanism for the construction of water conservancy facilities will be improved. By 2010, the
qualification rate of water function areas will be raised to 80% by 2010, rivers whose
drainage area is over 1,000km2 will maintain ecological flow, and the exploitation of
groundwater in large/medium cities along the Weihe River will be reduced by 10%. The
water supply in 13 cities including Xi’an will be increased by 918 million m3 and the reusing
rate of industrial water will be raised to 65%. The utilization coefficient of agricultural
irrigation water will be increased to 0.55.
In summer, level the field and land in Guanzhong and Weibei, carry out farmland capital
construction, and focus on the construction of water conservancy facilities in autumn and
winter. Intensify the construction of supportive facilities in irrigated areas and water-
conserving renovation, continue to implement the renovation funded by the loans of the
World Bank in Guanzhong and water-conserving renovation in large/medium irrigated areas,
and vigorously build water-saving irrigation demonstration areas. Complete RMB269 million
investment for the supportive and water-saving renovation projects in 9 irrigated areas in
Guanzhong, including the design of 10 backbone projects, renovation of 36,700ha of
medium/low-yield farmland and reform 449 branch and lateral canals. After the
implementation of these projects, the annual water storage will be increased by 96 million m3,
193,300 ha of irrigated area will be improved, and the grain output will rise by nearly
600,000t.
Significantly increase the carbon sink by intensifying afforestation, returning farmland to
forest and grassland, preserving natural forest resources, controlling water and soil loss and
carrying out farmland capital construction. By 2010, 30,000km2 of water and soil loss will be
controlled, 1 million ha of forest will be added, 330ha of grass seed base and 2,000ha of
reproducing base will be constructed. Moreover, the forest coverage rate will be increased
from the current 37.2% to 42% to absorb a total of 16 million tons of CO2 annually.
Situation Analysis of Shaanxi Province
·85·
8 References
[1] WANG Ninglian, YAO Tandong, SHAO Xuemei. Greenhouse gases and climate: past
cheanges and their signinificane for the future. Advance in Earth Sciences, 2001, 16(6):
821~828
[2] LIU Xiaoqing, ZHAO Jingbo, YU Xuefeng. Study on the climatic warming-drying trend in the
Loess Plateau and the countermeasures. Arid Zone Research, 2006, 23(4): 627~631
[3] YAO Yubi, LI Yaohui, WANG Yirong, et al. Effects of the climate and climatic productivity in
the Loess Plateau of China on global climate change. Agricultural Research in the Arid
Areas, 2005, 23(2): 202~208
[4] MOA, FAO, CAAS. Training Materials of C-PESAP. 2009
[5] YU Fan, ZHANG Guanghui, LIU Yumei. Analysis on effects of global climate change on
water resource in the Yellow River Basin. Journal of China Hyrology, 2008, 28(5): 52~56
[6] LIN Yinping, QIAN Yunping, HUANG Yanlin. Harmful effect of the water-break of Yellow
River and utilization countermeasure of water resourse. Water Resources & Water
Engineering, 1997, 8(3): 53~58
[7] WANG Qin. Studies on sustainable agriculture for the Loess Plateau. Journal of Arid Land
Resources and Environment, 1997, 11(2): 9~14
[8] GONG Jianfu, WANG Yirong. Response of climate in Loess Plateau in China to global
change. Agricultural Research in the Arid Areas, 2005, 23(6): 6~11
China Climate Change Partnership Framework - Enhanced strategies for climate-proofed and environmentally sound agricultural production in the Yellow River Basin (C-PESAP)
·86·
[21] WEI Minzhou. Development of non-agroindustry: an important way to rapidly increasing
farmers income. Journal of Northwest University(Philosophy and Social Sciences Edition),
[37] GAO Bei, LI Ke, LI Yanli. Analysis of Shannxi climate changes during past 40 years. Journal
of Chengdu University of Information Technology, 2006, 21(2): 291~295
[38] YUAN Sufen, TANG Haiping. Variations of the cimatic caracteristics in the past 40 years of
Jinghe River Basin, Loess Plateau of China. Journal of Arid Land Resources and
Environment, 2008, 22(9): 43~48
[39] ZHANG Yufang, XING Dawei, LIU Ming yun, et al. Discussion on history extraordinary
drought in Guanzhong region. Northwest Water Resources & Water Engineering, 2002,
13(3): 15~18
[40] YIN Shuyan, HUANG Chunchang, YAN Junping, et al. The impact of climate warming on
precipitation in Weibei Dryland of Shaanxi Province. Journal of Shaanxi Normal University
(Natural Science Edition), 2000, 28(4): 111~114
[41] DONG Jie, ZHOU Shuyan, WANG Rongxian. A comparative analysis of climate change for
Yulin, Xi’an and Ankang. Journal of Qufu Normal University, 2009, 35(1): 102~106
[42] LIU Xiaoqiong, LIU Yansui, YAN Junping, et al. Analysis on climatic changes under global
climatic change — A case study of Yulin City. Journal of Arid Land Resources and
Environment, 2008, 22(1): 54~59
Situation Analysis of Shaanxi Province
·87·
[43] CHENG Shuiying LI Tuansheng. Advances in research of land degradation. Journal of Arid
Land Resources and Environment, 2004, 18(3): 38~43
[44] XU Yajun, DANG Kunliang, LV Ming. Analysis of the land degradation in Shaanxi. Shaanxi
Forest Science and Technology, 2008, (3): 19~23
[45] LIU Tuo. Studies of desertifieation and It’s control strategies in China. Doctoral dissertation
submitted to Beijing Forestry University, 2005
[46] ZHU Zhenda. The status and prospect dsertification in China. Acta Gographical Sinica,
1994, 49(Supplement): 650~657
[47] LI Yuhong. Investigation and appraisal of soil desertification. Geological Technoecnomic
Management, 2004, 26(3): 35~37
[48] XUE Pingshaun. Population migration and its impact in Shaanxi during the Sui and Tang
Dynasties. Researches In Chinese Economic History, 2004, (4): 61~70
[49] CHAO Xiaohong. Inbound migration of Shaanxi and assimilation of natives during late Qing
Dynasty. The Journal of Chinese Social and Economic History, 1998, (1): 66~74
[50] HANG Zhiliang, ZHANG Tao, ZHANG Qian. Population, resources, environment and
sustainable development in northwest area of China. Journal of Arid Land Resources and
Environment, 1997, 11(2): 1~8
[51] LI lixia. A study of social influence about the immigrants in Shaanxi during the China’s
Resistance War against Japan. Northwest Population, 2007, 28(3): 42~46
[52] WANG Aiping, CHEN Qian. Preliminary study on ecological immigration in Shaanxi. Soil &
Water Conservation of China, 2003, (11): 24~25
[53] PANG Lei. The impact of climate changes on water resources in Shaanxi. Shaanxi Water
Resources, 2009, (3): 39~42
[54] GUO Shixing. An analysis of the impact of climate changes on water resources in Shaanxi.
Shaanxi's Water Conservancy and Hydroelectric Power Technologies, 2008, (1): 16~18
[55] JING Yong. Changes of water resources conditions in recent 50 years and countermeasure
in Shaanxi Province. China Water Resources, 2008, (7): 44~46
[56] XIONG Yijie. Research on the forecast models for agricultual water demand in the Shaanxi
Province. Ground Water, 2006, 28(1): 10~13
[57] KANG Yang, ZHANG Hongcheng. The situation and sustainable development of water
resources in Shaanxi. China Business, 2008, (20): 21~23
[58] GUAN Shuaipeng, ZHAO Xiangui, LIANG Na. On safety threshold of agricultural water
resources based on food security in Shaanxi Province. Agricultural Research in the Arid
Areas, 2008, 26(6): 241~245
[59] XU Qin, LI Zhengying. Problems of agricultural water use in Shaanxi and strategies for
water saving irrigation. Journal of Yangling Vocational & Technical College, 2008, 7(3):
59~61
[60] XU Hengzhou, XIAO Yi, WU Guancen. An empirical analysis of the impact of organic
agriculture on agricultural production environment. Xinjiang State Farms Economy, 2007,
(8): 31~34
China Climate Change Partnership Framework - Enhanced strategies for climate-proofed and environmentally sound agricultural production in the Yellow River Basin (C-PESAP)
·88·
[61] MENG Chunyan, LIU Jianguo, WANG Xiaoguang. Evaluation of agricultural production
influencing the ecological environment of rural inhabitation. Journal of Anhui Agri. Sci., 2006,