26
Complaints to Water Companies England and Wales April 2016 – March 2017 2016-17 report September 2017
Complaints to Water Companies
England and Wales
April 2016 – March 2017
2016-17 report September 2017

The Consumer Council for Water (CCWater) is the statutory consumer body representing the interests
of the customers of water and sewerage (WASC) and water only companies (WOC) in England and
Wales. Our duties include:
Handling customers’ complaints against the water companies, and providing customers with
advice about water and sewerage issues;
Monitoring company performance through our complaint handling, debt and complaint
assessments and companies’ quarterly reports; and
Researching customers’ views about the services they receive and the value for money of those
services, and on their expectations for services.
Taken together, this allows us to work with the industry, regulators and other stakeholders to improve
the services offered to, and paid for by, customers.
This is our eleventh complaints report, and the second of four reports about companies’ performance in
2016/17 that CCWater will publish this year. The other reports will cover:
Staying Afloat - customer vulnerability in the water sector (September 2017);
Sewerage resilience (October 2017); and
Water resilience (November 2017).
As in previous years, the main focus of this report is on the number of written complaints (via post,
email, web or fax) from customers to companies. As well as providing more detailed information,
written complaints continue to provide the most consistent and comparable way of assessing the
performance of each company.
However, we recognise that customers increasingly contact their company by other means, principally
by telephone. Some of these contacts are categorised as ‘unwanted contacts’1 rather than written
complaints. We have, therefore, looked at both written complaints and unwanted contacts before
arriving at a view about an individual company’s performance. Indeed, for future reports, we will be
looking to report complaints through all channels, including various forms of social media.
The introduction of retail competition in the non-household market, where customers in England2 can
choose the provider of their billing and meter reading services, post-dates the timeframe for this report.
Nevertheless, we have extended the section on non-household complaints to provide a view on
whether written complaint numbers are rising or falling now that business customers have a choice of
retailer.
This isn’t the only change to the report. First, it is shorter. Secondly, we have extended the timeframe
on several tables and charts to nine years. Thirdly, we have added more detail to the sections covering
complaints to CCWater and future action by CCWater to provide a more rounded picture of complaint
handling in the sector.
1 An ‘unwanted contact’ is when a customer calls their water company to get an issue resolved. The contact is
unwanted from the customer’s perspective because they would not need to make the call if they had no issue with their bill or water or sewerage service. 2 Retail water competition does not apply in Wales. Only those non-household customers who use more than 50
megalitres of water a year can switch retailer.

In various tables within the report we have used a Red, Amber, Green colour scheme. This has helped us
to highlight, for example:
Deteriorating performance in comparison to the previous year (for Table 1); 0r
Performance against industry averages where Amber represents ± 25% with Green better than,
and Red worse than, that range (for Tables 2 and 3).
Detailed data on complaint and unwanted contact numbers can be found in appendices 1 to 11.
We hope you like the new look of the report, and would welcome your feedback. Comments should be
sent to [email protected]

Contents
1 Executive Summary 1 Chart 1: Written complaints and unwanted telephone contacts, 2004-05 to
2016-17
Table 1: Written complaints and unwanted contacts, 2016-17 v 2015-16
2 Company Performance – Overview 6 Chart 2: Written complaints per 10,000 connections in 2016-17 and changes
from 2015-16
Chart 3: Unwanted contacts per 10,000 connections in 2016-17 and changes from 2015-16
Chart 4: Written complaints and unwanted contacts, 2016-17 Table 2: Written complaints per 10,000 connections 2008-09 to 2016-17
3 Company Performance – Further Detail 12 Chart 5: Complaints by main category, 2008-09 to 2016-17 Table 3: Complaints by main category per company, 2016-17 Chart 6: Complaints dealt with at the first stage of companies’ procedures,
2016-17
4 Non-Household Complaints 17 Chart 7: Non-household written complaints per 10,000 connections, 2016-17 v
2015-16
5 Complaints Received by CCWater 19 Chart 8: Written complaints received by companies and all complaints
received by CCWater, 2004-05 to 2016-17
6 Future Work by CCWater 21
Appendices 1 to 11
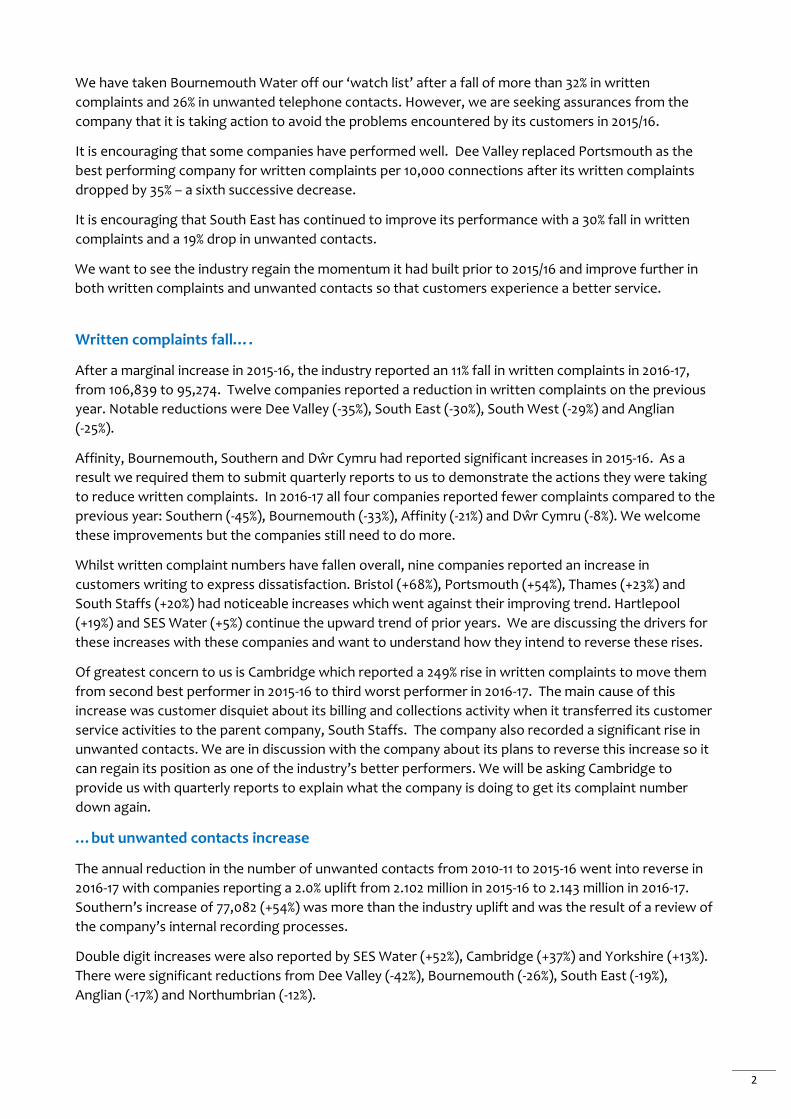
95,274 Written complaints
received – an 11% fall on the
previous year
9 Companies reporting an
increase in complaints
249 Percentage increase in
written complaints
reported by Cambridge
2,143,040 Total number of unwanted
contacts – an increase of
41,356 on 2015-16
2:1
The ratio of complaints
from non-household to
household customers per
10,000 connections
17 Percentage increase in
complaints about metering
2016/17 IN NUMBERS
1 EXECUTIVE SUMMARY
After significant reductions in previous years, the improving trend
of written complaints and unwanted contacts has stalled since
2014/15.
The year-on-year improvements in written complaints stopped in
2015/16 with a slight increase seen and for 2016/17 the industry
reported an increase in unwanted contacts, when customers call
their water company with an issue considered ‘unwanted’ from the
customer’s perspective. This increase offset the improvements
made for written complaints in the year.
We believe there are major opportunities for the industry to
improve its handling of billing and charges issues to avoid the need
for customers to contact their company.
Despite written complaints having fallen there are areas of concern
which we want the industry to address. The number of written
complaints and unwanted telephone contacts to companies is well
over 2.2 million. This is high and we are challenging companies to
reduce their complaints further. We have been pressing companies
repeatedly to get their customer service right first time. If they did
so they would see a dramatic decrease in customer dissatisfaction.
At a company level, performances have been mixed: Cambridge
saw a substantial increase in written complaints and unwanted
contacts. We have asked the company to give us quarterly reports
to explain what action it is taking to tackle the root causes of its
increase to get complaints back down.
Increases in both written complaints and unwanted contacts were
also reported by SES Water (formerly Sutton and East Surrey
Water)3 and Thames, which is above the industry average on both
measures. We will closely monitor the performance of these two
companies.
We are also continuing to ask for quarterly reports from three of
the four worst performing companies for written complaints in
2015-16 – Southern, which still has the highest complaints per
10,000 connections; Dŵr Cymru, which remains the second worst;
and Affinity. All three companies have reported decreases but need
to do more to reduce their complaints even further.
3 The former Sutton and East Surrey Water was rebranded as SES Water in February 2017.
1
2
We have taken Bournemouth Water off our ‘watch list’ after a fall of more than 32% in written
complaints and 26% in unwanted telephone contacts. However, we are seeking assurances from the
company that it is taking action to avoid the problems encountered by its customers in 2015/16.
It is encouraging that some companies have performed well. Dee Valley replaced Portsmouth as the
best performing company for written complaints per 10,000 connections after its written complaints
dropped by 35% – a sixth successive decrease.
It is encouraging that South East has continued to improve its performance with a 30% fall in written
complaints and a 19% drop in unwanted contacts.
We want to see the industry regain the momentum it had built prior to 2015/16 and improve further in
both written complaints and unwanted contacts so that customers experience a better service.
Written complaints fall….
After a marginal increase in 2015-16, the industry reported an 11% fall in written complaints in 2016-17,
from 106,839 to 95,274. Twelve companies reported a reduction in written complaints on the previous
year. Notable reductions were Dee Valley (-35%), South East (-30%), South West (-29%) and Anglian
(-25%).
Affinity, Bournemouth, Southern and Dŵr Cymru had reported significant increases in 2015-16. As a
result we required them to submit quarterly reports to us to demonstrate the actions they were taking
to reduce written complaints. In 2016-17 all four companies reported fewer complaints compared to the
previous year: Southern (-45%), Bournemouth (-33%), Affinity (-21%) and Dŵr Cymru (-8%). We welcome
these improvements but the companies still need to do more.
Whilst written complaint numbers have fallen overall, nine companies reported an increase in
customers writing to express dissatisfaction. Bristol (+68%), Portsmouth (+54%), Thames (+23%) and
South Staffs (+20%) had noticeable increases which went against their improving trend. Hartlepool
(+19%) and SES Water (+5%) continue the upward trend of prior years. We are discussing the drivers for
these increases with these companies and want to understand how they intend to reverse these rises.
Of greatest concern to us is Cambridge which reported a 249% rise in written complaints to move them
from second best performer in 2015-16 to third worst performer in 2016-17. The main cause of this
increase was customer disquiet about its billing and collections activity when it transferred its customer
service activities to the parent company, South Staffs. The company also recorded a significant rise in
unwanted contacts. We are in discussion with the company about its plans to reverse this increase so it
can regain its position as one of the industry’s better performers. We will be asking Cambridge to
provide us with quarterly reports to explain what the company is doing to get its complaint number
down again.
…but unwanted contacts increase
The annual reduction in the number of unwanted contacts from 2010-11 to 2015-16 went into reverse in
2016-17 with companies reporting a 2.0% uplift from 2.102 million in 2015-16 to 2.143 million in 2016-17.
Southern’s increase of 77,082 (+54%) was more than the industry uplift and was the result of a review of
the company’s internal recording processes.
Double digit increases were also reported by SES Water (+52%), Cambridge (+37%) and Yorkshire (+13%).
There were significant reductions from Dee Valley (-42%), Bournemouth (-26%), South East (-19%),
Anglian (-17%) and Northumbrian (-12%).

3
Performance in the round
Up to 2015/16 we saw an improving trend in both written complaints and unwanted contacts. This
reflected a mixture of factors:
below inflation bill increases;
companies simplifying and/or improving the policies and processes that annoy customers; and
companies being more active in engaging with customers through webchat and social media
about activities that have impacted, or might impact, customers in a specific locality.
However, following a slight increase in written complaints in 2015/16, the industry reported a rise in
unwanted contacts for 2016/17. This was partly down to Severn Trent incorrectly reporting the number
of written complaints in 2015/16 and Southern reviewing its internal process of its recording of
unwanted contacts in 2016/17. But even taking these two companies out of the equation, the
improvements would only have been slight. We want to see the industry do more to avoid the need for
customers to complain in the first place.
Chart 1: Written complaints and unwanted telephone contacts, 2004-05 to 2016-17
*2009/10 was a pilot year for unwanted contacts which may not be truly reflective of industry performance.
**Before 2014/15 the figures for unwanted contacts included both household and non-household customers. From
2015-16 the number is solely for household customers.
Across the industry the picture is mixed. Nine companies reported a fall in both written complaints and
unwanted contacts, and are to be commended for doing so. Foremost among these were Dee Valley,
Bournemouth, South East and Anglian. Reasons for these improvements vary from changes to company
complaint handling processes, faster response times to telephone calls, greater empowerment of staff,
and increased customer empathy.
However, four companies reported an increase in both written complaints and unwanted telephone
contacts. As already mentioned, the performance of Cambridge is particularly worrying as the company
had for several years been one of the industry’s best performers. SES Water’s increase in unwanted
0
50
100
150
200
250
300
0
1000
2000
3000
4000
5000
6000
7000
Wri
tten
Co
mp
lain
ts t
o In
du
stry
00
0's
Un
wan
ted
Tel
eph
on
e C
on
tact
s '0
00
s
Unwanted Contacts
Written Complaints

4
contacts, at over 50%, is also of concern as this company, too, generally has been a solid performer.
While written complaint increases for Thames and Wessex could be considered as glitches against their
long-term downward trends, the increase in unwanted contacts may not be. But with only two years of
comparable data to draw upon we will monitor the companies’ performance closely over the coming
year, as well as the unwanted contacts for the industry, to ensure a worsening trend is not emerging.
Thames remains a comparatively poor performer, being one of the worst for unwanted contacts per
10,000 connected properties. Wessex, however, is in a much better position for both written complaints
and unwanted contacts.
Table 1: Written complaints and unwanted contacts, 2016-17 v 2015-16
Written complaints
Water and sewerage
companies
Unwanted telephone contacts
2015-16 2016-17
Change
%
Per 10,000 connected properties 2015-16 2016-17
Change %
Per 10,000 connected properties
15,797 8,773 -44.5 42.5 Southern 143,224 220,306 53.8 1125
7,128 6,582 -7.7 42.0 Dŵr Cymru 116,095 111,667 -3.8 774
4,018 2,840 -29.3 34.1 South West 59,240 55,055 -7.1 716
15,823 19,384 22.5 33.0 Thames 499,337 511,792 2.5 917
12,681 9,478 -25.3 31.6 Anglian 135,718 112,570 -17.1 395
13,033 10,479 -19.6 30.7 United Utilities 195,438 183,403 -6.2 577
11,175 13,305 19.1 30.5 Severn Trent 254,076 238,398 -6.2 580
8,065 6,740 -17.4 27.9 Yorkshire 185,517 210,300 13.4 925
3,771 3,404 -9.7 26.4 Northumbrian 92,702 81,950 -11.6 675
1,678 1,950 16.2 15.0 Wessex 69,086 75,984 10.0 625
Water only companies
140 488 248.6 34.8 Cambridge 4,297 5,897 37.2 449
123 146 18.7 32.6 Hartlepool 1,865 1,809 -3.0 427
5,360 4,237 -21.0 28.4 Affinity 151,447 157,736 4.2 1116
2,590 2,101 -18.9 25.7 Essex & Suffolk 44,298 40,138 -9.4 520
745 1,251 67.9 23.6 Bristol 27,280 26,229 -3.9 528
579 610 5.4 21.1 SES Water 14,887 22,563 51.6 830
652 440 -32.5 21.3 Bournemouth 9,963 7,407 -25.7 385
830 999 20.4 15.7 South Staffs 22,303 20,053 -10.1 360
2,147 1,496 -30.3 14.9 South East 51,338 41,764 -18.6 444
275 423 53.8 13.3 Portsmouth 11,609 11,031 -5.0 369
229 148 -35.4 11.6 Dee Valley 11,964 6,988 -41.6 594
106,839 95,274 -10.8 30.0 Total/average 2,101,684 2,143,040 2.0% 721
Key
Increase on previous year for written complaints or unwanted contacts and >25% above
average per 10,00 connections
Average written complaints or unwanted contacts per 10,000 connections
Decrease on previous year for written complaints or unwanted contacts and <25%
below average per 10,000 connections

5
Complaints from non-household customers
For the past two years companies have provided data on written complaints from non-household
customers. This has helped CCWater, the companies and others to understand whether there are
underlying problems being experienced by non-household customers which need to be fixed. Most
non-household customers use more water than households and therefore pay higher charges for both
usage and other tariffs, such as surface water drainage based on site area and standing charges. These
and other reasons, such as entitlement to a leakage allowance and loss of trade through supply
interruptions, brought about the higher proportion of non-household customer complaints. On a per
10,000 connections basis non-households remain twice as likely to complain as household customers.
For 2016/17 this was 63.3 v 30.0 written complaints per 10,000 connections.
The introduction of retail competition for non-household customers in England from 1 April 2017,
therefore, presented retailers (of existing companies and of new entrants) with a challenge: reduce the
causes of complaints or potentially see customers switch to another retailer. Although the new retail
market is less than six months old, the early signs are that written complaints to the new retailers are
lower than those for the same period in 2016-17. However, CCWater has received an increase in written
complaints together with a six-fold increase in enquiries from non-household customers. Much of the
increase in complaints can be attributed to teething problems in the new retail market which should
disappear once retailers become more familiar with the processes that underpin it. Nevertheless, we
are monitoring this closely to ensure that problems are resolved quickly for customers.
Causes of complaint
Of the 95,000 written complaints (household and non-household) received during 2016-17, more than
54,000 related to billing and charges matters. This category has always accounted for over half of all
written complaints received by companies. They also account for over half of all complaints handled by
CCWater. The near 10,000 fall in this category accounts for the vast majority of the overall reduction in
complaints. We believe that there are major opportunities for the industry to improve its handling of
billing and charges issues to avoid customers having to complain.
Written complaints about water supply, sewerage services and other activities all showed modest falls.
However, written complaints about metering increased by 17% mainly because of problems experienced
by Severn Trent when it outsourced its metering operations in 2015, and by Bristol and Wessex who
introduced compulsory metering programmes for premises that changed occupancy.
Table 3 in Chapter 3 provides data for each company against each of the five written complaint
categories: billing and charges, water supply, sewerage service, metering and ‘other’ complaints.
Written complaints escalated to company senior management
In last year’s report we challenged all water companies to resolve 95% of their written complaints at the
first point of contact by 2020. After several years of being close to the target, the companies
collectively beat it in 2016-17 with 95.2% resolved first time. But the picture is uneven with SES Water
resolving 99.2% at the first contact but Dee Valley unable to resolve 13.5% of written complaints without
them being escalated to the company’s senior management.
Chart 6 in Chapter 3 provides data for each company.
Complaints to CCWater
Each year CCWater handles approximately 9% of the written complaints received by companies. In 2016-
17 we received 8,711 telephone and written complaints against water companies, around 1,250 fewer
than in 2015-16. We formally investigated six complaints which were not resolved through the
companies’ complaints procedures.
6
2 COMPANY PERFORMANCE - OVERVIEW
Since CCWater was created in October 2005, we have worked with the water companies to get them to
adopt a ‘right first time’ approach to dealing with customers. Whether customer queries are about bills,
operational issues or are simple enquiries, we want companies to deal with them quickly and without
any hassle. When things do go wrong it is crucial that companies apologise and correct the mistake
quickly. Their failure to do so can lead to a complaint, whether by telephone (an unwanted contact) or
in writing. We know customers are using other channels to complain, including social media, webchat
and text messaging. We are working with the industry and Ofwat to include data from these channels
in company complaints reporting, and will incorporate this into our future annual complaints reports.
Over the past two years we have seen mixed results from both the industry as a whole and from
individual companies. There was a slight increase for written complaints in 2015/16 and last year
companies reported a higher number of unwanted contacts. We welcome the improvements but feel
that a total of 2.2 million written complaints and unwanted telephone contacts is not acceptable.
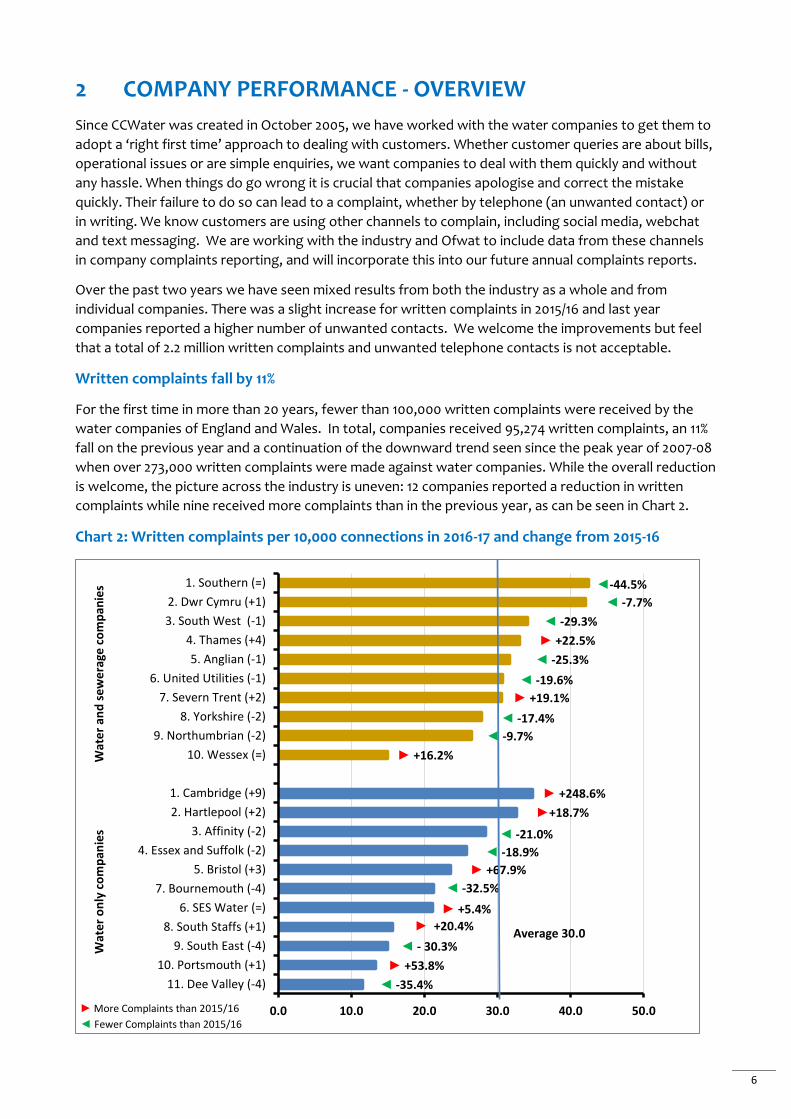
Written complaints fall by 11%
For the first time in more than 20 years, fewer than 100,000 written complaints were received by the
water companies of England and Wales. In total, companies received 95,274 written complaints, an 11%
fall on the previous year and a continuation of the downward trend seen since the peak year of 2007-08
when over 273,000 written complaints were made against water companies. While the overall reduction
is welcome, the picture across the industry is uneven: 12 companies reported a reduction in written
complaints while nine received more complaints than in the previous year, as can be seen in Chart 2.
Chart 2: Written complaints per 10,000 connections in 2016-17 and change from 2015-16
◄ -35.4%
► +53.8%
◄ - 30.3%
► +20.4%
◄ -32.5%
► +5.4%
► +67.9%
◄ -18.9%
◄ -21.0%
►+18.7%
► +248.6%
► +16.2%
◄ -9.7%
◄ -17.4%
► +19.1%
◄ -19.6%
◄ -25.3%
► +22.5%
◄ -29.3%
◄ -7.7%
◄-44.5%
0.0 10.0 20.0 30.0 40.0 50.0
11. Dee Valley (-4)
10. Portsmouth (+1)
9. South East (-4)
8. South Staffs (+1)
6. SES Water (=)
7. Bournemouth (-4)
5. Bristol (+3)
4. Essex and Suffolk (-2)
3. Affinity (-2)
2. Hartlepool (+2)
1. Cambridge (+9)
10. Wessex (=)
9. Northumbrian (-2)
8. Yorkshire (-2)
7. Severn Trent (+2)
6. United Utilities (-1)
5. Anglian (-1)
4. Thames (+4)
3. South West (-1)
2. Dwr Cymru (+1)
1. Southern (=)
► More Complaints than 2015/16
◄ Fewer Complaints than 2015/16
Average 30.0
Wat
er
on
ly c
om
pan
ies
Wat
er
and
se
we
rage
co
mp
anie
s

7
Unwanted contacts increase by 2.0%
Companies report telephone contacts from household customers considered to be ‘unwanted’ from the
customer’s point of view. These include contacts about the level and make-up of bills, customer reports
of a service issue, and repeat calls about a leak or sewer blockage.
The annual reduction in unwanted contacts from 2010-11 to 2015-16 went into reverse in 2016-17 with
companies reporting a 2.0% uplift, from 2.101 million to 2.143 million. Seven companies reported
increased levels of unwanted contacts, as can be seen in Table 1 in the Executive Summary and in Chart
3 below.
Chart 3: Unwanted contacts per 10,000 connections in 2016-17, and change from 2015-16
Southern’s increase of 77,082 (+54%) in unwanted contacts – by far the highest in the industry – was the
result of a review of internal recording processes and positioned it as the worst performing company.
This is important because unwanted contacts form part of Ofwat’s Service Incentive Mechanism4 which
can provide companies with a reward or a penalty depending on their customer contact performance.
4 Ofwat incentivises water companies to improve their customer service performance through its Service Incentive Mechanism
(SIM). This measures service to household customers through a count of total customer contacts and complaints and a survey of customers who contacted their company. Companies that perform well are given up to 0.5% additional revenue in the first year of the five-year price review period, with poor performers handed a penalty of up to -1%.
◄ -5.0% ◄-10.1%
◄-25.7%
◄-3.0%
◄-18.6%
►+37.2%
◄-9.4%
◄-3.9%
◄-41.6%
►+51.6%
►+4.2%
◄-17.1%
◄-6.2%
◄-6.2%
►+10.0%
◄-11.6%
◄-7.1%
◄-3.8%
►+13.4%
►2.5%
►+53.8%
0 200 400 600 800 1000 1200
South Staffs
Portsmouth
Bournemouth
Hartlepool
South East
Cambridge
Essex & Suffolk
Bristol
Dee Valley
SES Water
Affinity Water
Anglian
United Utilities
Severn Trent
Wessex
Northumbrian
South West
Dŵr Cymru
Thames
Yorkshire
Southern
Wat
er
on
ly c
om
pan
ies
W
ate
r an
d s
ew
era
ge c
om
pan
ies
Average 721

8
Performance in the round
In previous years, most companies have reported annual falls in both written complaints and unwanted
contacts. This year, only nine companies reduced both measures of customer contact. For the
remaining 12 companies, the picture was more complicated.
To provide a more rounded picture of company performance we have used both written complaints
and unwanted contacts to inform our view of company performance. An increase against one or both
measures may not necessarily be a cause of concern if it was small, a temporary spike in the long-term
downward trend or did not materially affect the company’s position as one of the better performing
companies. Chart 4 below shows how companies fared against both measures in 2016-17 with the
better performing companies shown in the lower left area of the scattergraph.
Chart 4: Written complaints and unwanted contacts, 2016-17
Key
Water and sewerage companies
Water only companies
Cause for concern – update on 2015-16
Last year’s report identified that four companies – Affinity, Bournemouth, Dŵr Cymru and Southern –
had reported increasing or continuing high levels of written complaints. We asked those companies to
provide us with interim reports for the first six months of 2016-17 (and subsequently for each quarter).
In these reports, we asked the companies to demonstrate how improvements to their policies,
processes and practices were leading, or would lead, to reductions in written complaints.
Affinity
Anglian Bournemouth
Bristol
Cambridge
Dee Valley
Dwr Cymru
Essex&Suffolk
Hartlepool
Northumbrian
Portsmouth
Severn Trent
South East
Southern
South Staffs
South West
SES Water
Thames
United Utilities
Wessex
Yorkshire
0
20
40
60
80
100
120
0 5 10 15 20 25 30 35 40 45 50
Un
wan
ted
Co
nta
cts
pe
r 1
,00
0 c
on
ne
ctio
ns
Written Complaints per 10,000 connections
Poorer performers
Better performers
9
Our Delving into Water 2016 report commented that while all four companies were making progress in
reducing complaint numbers they were unlikely to be below 2014-15 levels by the end of the reporting
year. With the exception of Southern Water, this early view was confirmed when the companies’
submitted their full year data.
Southern
Although Southern continues to be the worst performing company, it reduced written complaints by
almost 45%. During the year, the company improved its digital communication channels and made a
series of changes to its billing and debt prevention processes. This included establishing a dedicated
customer service team to contact customers most likely to see increases in metered bills, to check
whether this was attributable to a leak on the customer’s supply pipe or a change in household size, and
to offer water efficiency advice. However, as mentioned above, the company’s performance on
unwanted contacts was very poor.
Bournemouth
Bournemouth reduced written complaints by one-third through improvements to their case
management system and better analysis of the root causes of complaints. The company has now
returned to its usual position of being one of the better performing companies. It also reduced
unwanted contacts by 26%.
Affinity
Affinity reduced written complaints by 21% through a focus on improving operational processes as a
series of lengthy supply interruptions had been a major cause of customer dissatisfaction. Making it
easier for customers to contact the company and keeping customers informed about issues were other
reasons the company cited for a fall in complaints. However, it did see an increase in unwanted contacts
in the year which we expect the company to reverse in 2017/18. The company is the second worst
performer for unwanted contacts per 10,000 connected properties.
Dŵr Cymru
Dŵr Cymru created a team to target problems early before they developed into a complaint. The
company also addressed some billing system errors and modified some of its debt management related
communication. However, the company’s ongoing debt recovery focus and human errors meant that
complaints did not reduce as quickly as we would have liked. Dŵr Cymru’s written complaints fell by
just 8%. The company remains the second worst performer with the gap between it and the industry
average not narrowing to an appreciable degree. Unwanted contacts fell by just 4%.
Even though all four companies reduced written complaints during the year, for Affinity, Bournemouth
and Dŵr Cymru it was not to a point where they bettered their respective 2014-15 performance. As
such, we have asked Affinity, Dŵr Cymru and Southern – as it remains the worst performer for written
complaints and unwanted contacts – to continue to provide interim reports for the first six months of
the 2017-18 reporting year. We will then assess whether their performance has improved sufficiently to
allow us to discontinue such reports. We are content that the actions taken by Bournemouth have put
it on course to deliver improved results, and we no longer require it to submit interim reports.
Cause for concern in 2016-17
For most of the past decade Cambridge has been one of the better performing companies, often
receiving between one-third and one-half of the industry average of written complaints per 10,000
connections. 2016/17 was very different, with the company reporting a 249% increase in written
complaints. At 34.8 per 10,000 connections the company is now worse than the industry average.
10
A major reason for the significant increase in written complaints was the decision to transfer billing and
collection activities to the offices of the parent company, South Staffs. As is the case with many
company system changes, they can have an adverse effect on customer service. We have, therefore,
asked Cambridge to update us every three months on what action it is taking to reduce written
complaint numbers and allay customer concerns.
Eight other companies reported increases in written complaints. In some cases, this may be a
temporary downturn rather than a sign of a longer-term deterioration in performance. For example,
Thames, which had been steadily reducing written complaint numbers over several years, saw a 23%
increase this year. This took them above the industry average for the year but still below their 2014-15
performance, as Table 2 shows.
The increases reported by Wessex (+16%), Bristol (+68%), Portsmouth (+54%) and South Staffs (+20%)
were from a comparatively low base and have not affected their standing as the better performing
companies. Wessex, however, also reported an increase in unwanted contacts, many relating to the
company’s decision to compulsory meter on change of occupancy.
We will monitor the performance of all four companies during 2017-18 to assess whether they are
reversing the rise in written complaint numbers. If not, we will take whatever action is appropriate.
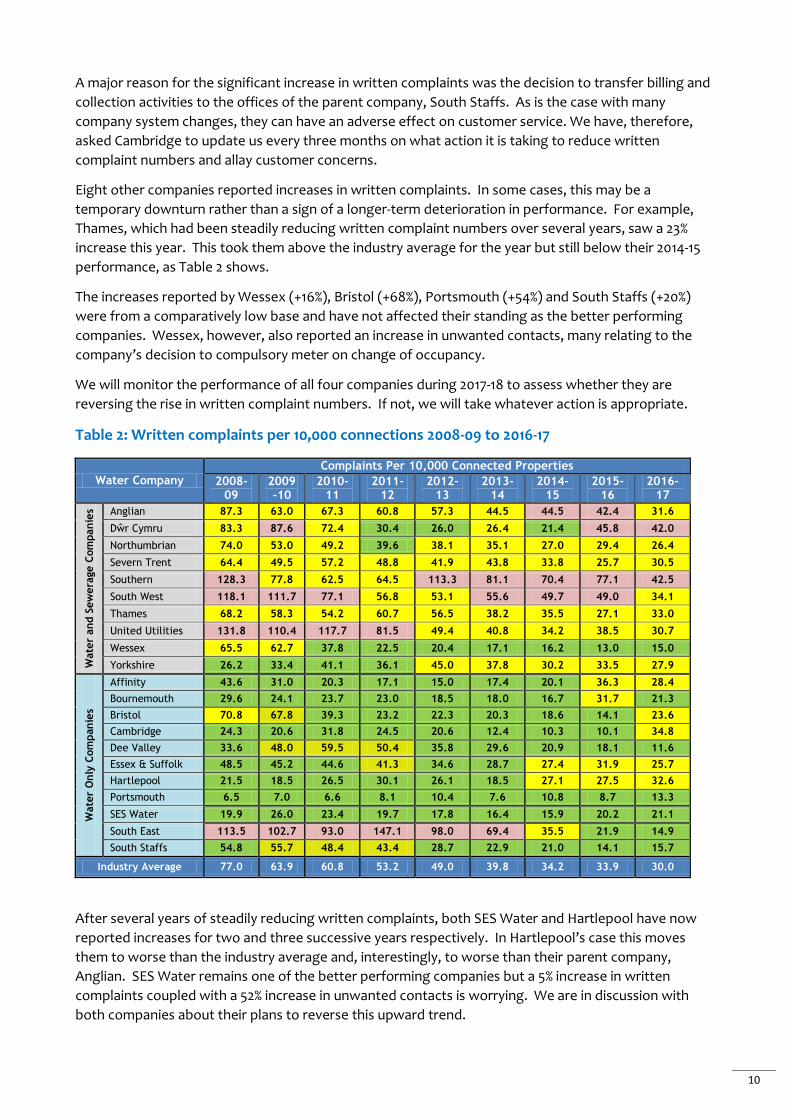
Table 2: Written complaints per 10,000 connections 2008-09 to 2016-17
Water Company
Complaints Per 10,000 Connected Properties
2008-09
2009-10
2010-11
2011-12
2012-13
2013-14
2014-15
2015-16
2016-17
Wate
r and S
ew
era
ge C
om
panie
s Anglian 87.3 63.0 67.3 60.8 57.3 44.5 44.5 42.4 31.6
Dŵr Cymru 83.3 87.6 72.4 30.4 26.0 26.4 21.4 45.8 42.0
Northumbrian 74.0 53.0 49.2 39.6 38.1 35.1 27.0 29.4 26.4
Severn Trent 64.4 49.5 57.2 48.8 41.9 43.8 33.8 25.7 30.5
Southern 128.3 77.8 62.5 64.5 113.3 81.1 70.4 77.1 42.5
South West 118.1 111.7 77.1 56.8 53.1 55.6 49.7 49.0 34.1
Thames 68.2 58.3 54.2 60.7 56.5 38.2 35.5 27.1 33.0
United Utilities 131.8 110.4 117.7 81.5 49.4 40.8 34.2 38.5 30.7
Wessex 65.5 62.7 37.8 22.5 20.4 17.1 16.2 13.0 15.0
Yorkshire 26.2 33.4 41.1 36.1 45.0 37.8 30.2 33.5 27.9
Wate
r O
nly
Com
panie
s
Affinity 43.6 31.0 20.3 17.1 15.0 17.4 20.1 36.3 28.4
Bournemouth 29.6 24.1 23.7 23.0 18.5 18.0 16.7 31.7 21.3
Bristol 70.8 67.8 39.3 23.2 22.3 20.3 18.6 14.1 23.6
Cambridge 24.3 20.6 31.8 24.5 20.6 12.4 10.3 10.1 34.8
Dee Valley 33.6 48.0 59.5 50.4 35.8 29.6 20.9 18.1 11.6
Essex & Suffolk 48.5 45.2 44.6 41.3 34.6 28.7 27.4 31.9 25.7
Hartlepool 21.5 18.5 26.5 30.1 26.1 18.5 27.1 27.5 32.6
Portsmouth 6.5 7.0 6.6 8.1 10.4 7.6 10.8 8.7 13.3
SES Water 19.9 26.0 23.4 19.7 17.8 16.4 15.9 20.2 21.1
South East 113.5 102.7 93.0 147.1 98.0 69.4 35.5 21.9 14.9
South Staffs 54.8 55.7 48.4 43.4 28.7 22.9 21.0 14.1 15.7
Industry Average 77.0 63.9 60.8 53.2 49.0 39.8 34.2 33.9 30.0
After several years of steadily reducing written complaints, both SES Water and Hartlepool have now
reported increases for two and three successive years respectively. In Hartlepool’s case this moves
them to worse than the industry average and, interestingly, to worse than their parent company,
Anglian. SES Water remains one of the better performing companies but a 5% increase in written
complaints coupled with a 52% increase in unwanted contacts is worrying. We are in discussion with
both companies about their plans to reverse this upward trend.
11
Better performers
For the sixth successive year, the number of written complaints Dee Valley received has reduced. This
year’s 35% fall enabled the company to replace Portsmouth as the best performing company. Dee Valley
also reported a 42% fall in unwanted contacts.
South East has continued its improvement with a further 30% fall in written complaints and a 19%
reduction in unwanted contacts and is now one of the better performing companies.
Notable improvements
Last year Anglian and South West were among the poorer performing companies for written
complaints. This year, following written complaint reductions of 25% and 29% respectively, they have
moved into the average performance band. Both companies also reported reduced unwanted contacts
during the year. South West, however, continues to compare poorly and we expect the company to
improve further.
United Utilities and Essex & Suffolk also reported double-digit decreases in written complaints. The fall
in United Utilities’ written complaint numbers came from household customers as the company’s non-
household customers continue to complain in large numbers – further detail is provided in Chapter 4.
Both companies also managed to reduce unwanted contacts this year.
While Yorkshire reported a 17% reduction in written complaints this was offset by a 13% increase in
unwanted contacts. The company remains in the average performance band for written complaints but
is now the a poor performer on unwanted contacts. This is something the company will need to
address during 2017-18 and beyond.
Monitoring company performance
We will continue to monitor company performance on written complaints and unwanted contacts.
While we welcome the fall in written complaints overall, we are concerned that almost half of the
companies reported a rise in complaint numbers. We acknowledge that for some companies this may
be a temporary issue. If, however, this turns out to be a sign of a longer term deterioration in
performance then we will press the companies concerned to tackle the cause of the problems.
On unwanted contacts, we expect those companies with increasing numbers to put in place measures
to arrest the slide.

12
3 COMPANY PERFORMANCE – FURTHER DETAIL
Causes of complaints by category
We ask companies to report written complaints data against five main categories: billing and charges,
water supply, metering, sewerage services and ‘other complaints’ which includes administrative
activities.
As Chart 5 shows the biggest fall in written complaints has come in the area which has consistently
generated over half of all written complaints, namely billing and charges.
Chart 5: Written complaints by main category, 2008-09 to 2016-17
Billing and charges
The reduction in written complaints about billing and charges is due in large part to both CCWater and
the companies having devoted considerable time and effort on:
Affordability issues – all companies now have social tariffs in place to help those in financial
difficulty pay their bills. While the terms of each scheme and level of support available to customers
varies, social tariffs are currently helping over 260,000 customers. Many customers struggling to
pay their bills may not be claiming their full benefit entitlements. CCWater’s website includes a
Benefits Calculator, supplied and updated by Turn2Us, a national charity that helps people access
not only available benefits but also charitable grants and support services.
Debt management – customers must pay their bills, but sometimes short-term family or financial
circumstances can cause a customer to miss a payment or two. We are working with companies
and advice agencies on the quick identification of such customers. By doing so, companies can
0
10,000
20,000
30,000
40,000
50,000
60,000
70,000
80,000
90,000
100,000
110,000
120,000
130,000
140,000
150,000
Wri
tte
n C
om
pla
ints
(In
du
stry
to
tal)
Billing&Charges Water Service Sewerage Metering Other

13
provide reassurance to the customer that debt recovery action will not be taken while they are in a
temporary vulnerable position.
Simplifying tariffs – water companies have a multitude of tariffs, many of which are for historical
reasons, including those where two companies merge but retain their old tariffs. This can cause
confusion especially where a customer moves property within the same company area but finds
that they are paying totally new (and possibly higher) charges.
Many companies have also invested in new billing systems designed to make payments easier to
process and to interface with other IT systems. As Table 3 shows, written complaints about billing and
charging matters were 21.1 per 10,000 billed properties with most companies mentioned under ‘cause
for concern’ in the previous chapter reporting higher than industry average figures.
Table 3: Written complaints per 10,000 connections* by main category per company, 2016-17
Company Billing and
charges Water supply
Metering Other Sewerage
service
Water and sewerage companies
Anglian 28.8 5.1 1.7 3.9 4.8
Dŵr Cymru 26.3 3.8 0.9 12.3 3.3
Northumbrian 20.8 3.7 2.9 1.5 2.1
Severn Trent 14.8 8.6 13.4 2.0 5.1
Southern 36.4 3.3 0.9 0.6 4.5
South West 15.7 4.5 1.3 9.7 5.1
Thames 29.7 9.1 3.0 0.4 6.2
United Utilities 22.3 4.9 4.2 1.2 3.1
Wessex** 12.2 5.8 0.9 2.5 2.5
Yorkshire 12.9 7.3 1.6 2.0 6.4
Water only companies
Affinity 15.3 8.4 5.5 1.7 Bournemouth 14.1 3.6 1.6 2.4 Bristol** 7.3 8.2 1.8 7.2 Cambridge 25.6 2.8 1.1 5.2 Dee Valley 7.9 2.7 0.8 0.7 Essex & Suffolk 19.9 3.3 1.8 1.4 Hartlepool 11.4 11.6 1.7 8.9 Portsmouth 7.6 5.3 0.3 0.3 SES Water 17.2 2.3 2.2 0.6 South East 7.9 4.1 2.4 1.1 South Staffs 11.3 1.8 2.9 2.3
Industry average 20.8 6.2 3.3 2.4 4.8 *The company and industry average numbers in this table do not total those in Table 2. This is because, in this table, we use
billed properties, metered properties, and water and sewerage connections as denominators for billing metering, water and
sewerage complaints, respectively.
**Billing services for Bristol and Wessex are carried out by a joint billing operation, ‘Bristol and Wessex billing services’. Under
billing and charges where the services are shared by both companies we have only included Bristol Water’s connections.
14
Operational complaints
In 2016-17 the weather was generally benign with the result that written complaints for water supply
and sewerage services fell by 4.9%. On a per 10,000 connections basis, written complaints about water
supply were 6.2 while those about sewerage services were 4.8. However, Hartlepool reported a high
level of written complaints about the water supply, largely due to a series of supply interruptions in the
early part of 2016, and there were higher than average figures reported by Thames, Severn Trent,
Affinity and Bristol.
Two companies had significantly higher than average levels of written complaints about sewerage
services. For Thames, this was for the third successive year, although it did represent a fall on previous
years. Yorkshire also reported a fall in written complaint numbers as there was no repeat of the wide
scale flooding of the previous year. During the year CCWater received fewer sewerage service
complaints against both companies compared to 2015-16.
Metering complaints
Written complaints about companies’ metering activities include the siting of the meter, its installation,
repairs, and restoration of gardens and pathways disturbed during an installation or repair. Written
complaints about metered charges are included within the billing and charges category.
Over half of all properties in England and Wales are metered. Most companies in the water-stressed
south and east of England have implemented, or are implementing, compulsory metering programmes
that aim for around 95% of all properties to be metered. Some properties can’t be metered because of
technical difficulties, such as the layout of the property or pipework. Other companies across England
and Wales are selectively metering on change of occupancy or are promoting the meter option.
Given this backdrop, it had been encouraging that written complaints about metering had fallen for
three successive years to under 5,000. This downward trend was thrown into reverse in 2015-16 and last
year the increase continued with a 17% rise in written complaints to over 5,400. Most of this increase
was attributable to Severn Trent which, having fully outsourced its metering operations, failed to put in
sufficiently robust management controls for the contract. The company has now fully reviewed the
processes and procedures of its partner, rectified the problems, and is carrying out regular audits to
ensure compliance with agreed customer service standards.
Two other companies reported higher than average levels of written complaints about metering,
though both companies reported a fall on the previous year. Affinity has embarked on a compulsory
metering programme and received some customer complaints relating to the timing and quality of the
installation of its meters. United Utilities’ household metering complaints reduced in the year and we
expect this progress to continue into 2017-18.
Other complaints
This category mostly includes complaints about administrative issues including those associated with
the company’s telephone system or website, or about the making and keeping of appointments.
As in previous years, two companies – Dŵr Cymru and South West – reported the highest number of
written complaints in this category. At 12.3 and 9.7 per 10,000 connections respectively their
performance is five and four times the industry average. Bristol, at 7.2, also has a history of high levels
of written complaints in this category.
We plan to talk to all three companies to better understand what is driving written complaints in this
category, such as administrative or telephone issues, for example.
15
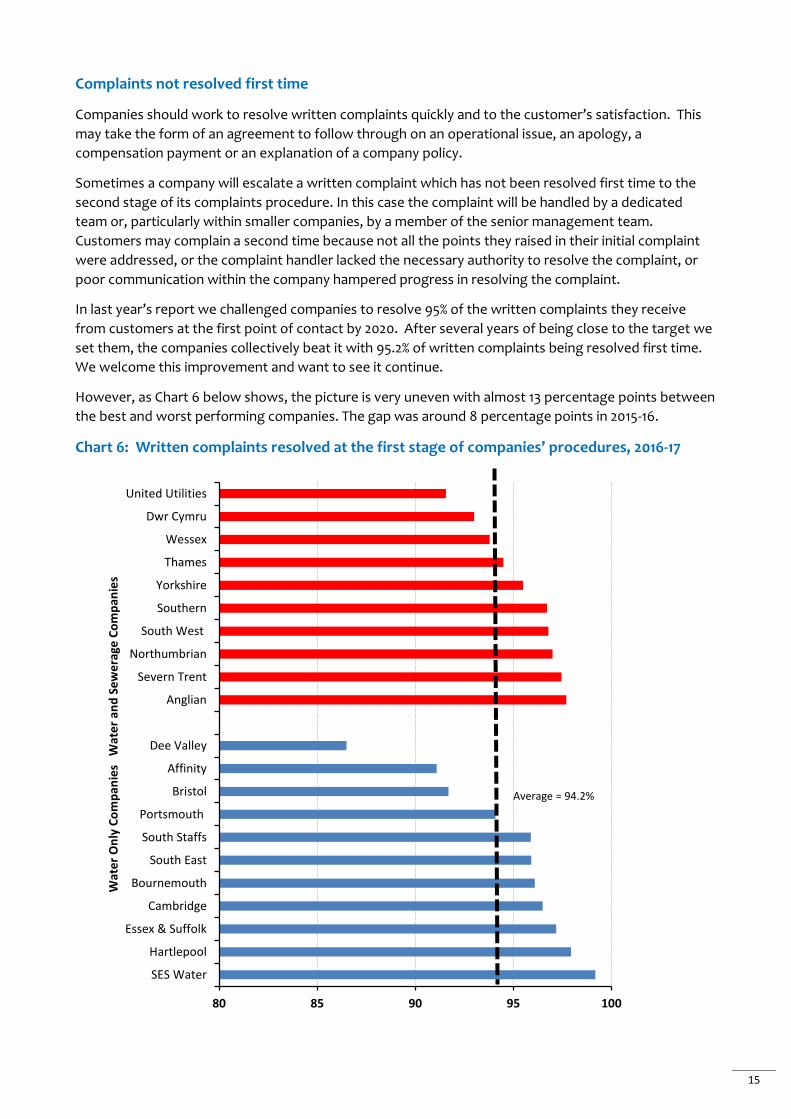
Complaints not resolved first time
Companies should work to resolve written complaints quickly and to the customer’s satisfaction. This
may take the form of an agreement to follow through on an operational issue, an apology, a
compensation payment or an explanation of a company policy.
Sometimes a company will escalate a written complaint which has not been resolved first time to the
second stage of its complaints procedure. In this case the complaint will be handled by a dedicated
team or, particularly within smaller companies, by a member of the senior management team.
Customers may complain a second time because not all the points they raised in their initial complaint
were addressed, or the complaint handler lacked the necessary authority to resolve the complaint, or
poor communication within the company hampered progress in resolving the complaint.
In last year’s report we challenged companies to resolve 95% of the written complaints they receive
from customers at the first point of contact by 2020. After several years of being close to the target we
set them, the companies collectively beat it with 95.2% of written complaints being resolved first time.
We welcome this improvement and want to see it continue.
However, as Chart 6 below shows, the picture is very uneven with almost 13 percentage points between
the best and worst performing companies. The gap was around 8 percentage points in 2015-16.
Chart 6: Written complaints resolved at the first stage of companies’ procedures, 2016-17
80 85 90 95 100
SES Water
Hartlepool
Essex & Suffolk
Cambridge
Bournemouth
South East
South Staffs
Portsmouth
Bristol
Affinity
Dee Valley
Anglian
Severn Trent
Northumbrian
South West
Southern
Yorkshire
Thames
Wessex
Dwr Cymru
United Utilities
Wat
er
On
ly C
om
pan
ies
Wat
er
and
Se
we
rage
Co
mp
anie
s
Average = 94.2%

16
It is interesting to note that three of the five companies with performance levels above 97% were also
companies with increased levels of written complaints this year. These were Hartlepool, SES Water and
Severn Trent.
In contrast, Dee Valley, which reported the lowest level of written complaints this year, was by far the
worst performer with 13.5% complaints escalated to the company’s senior management team. Three-
quarters of the escalated complaints were about billing and charges matters with the remainder about
operational issues.
Once again, United Utilities (91.6%) and Affinity (91.1%) appear among the poorer performers. United
Utilities household customers saw a reduction in second stage complaints. However, its non-household
arm, Water Plus5, reported a high number of second stage billing complaints. We expect Water Plus’s
performance to improve during 2017-18.
5 Water Plus is a water retail company formed in 2016 as a joint venture between United Utilities and Severn Trent.

17
4 NON-HOUSEHOLD COMPLAINTS
Level of complaints still a worry
For the past two years, companies have provided data on written complaints from non-household
customers who include commercial premises, factories, farms, educational establishments, hospitals
and local authorities. We will use this data to make sure any service failures are addressed quickly.
With the non-household retail market (the billing, meter reading and front line customer service) in
England6 opening on 1 April 2017, retailers participating in the market (existing companies or new
entrants) are faced with a challenge: reduce the causes of written complaints – either through
improving their own offering or by putting pressure on wholesalers to improve their services – or face
the threat of their customers switching to another retailer.
Although the number of written complaints fell from 12,196 to 11,722, non-households remain twice as
likely to complain as household customers. On a per 10,000 connections basis this was 63.3 v 30.0
respectively in 2016-17.
There are, as ever, significant variations between companies, as Chart 7 shows.
Chart 7: Non-household written complaints per 10,000 connections: 2016-7 v 2015-16
*From 1 June 2016 United Utilities traded as Water Plus, a water retail company for its non-household customers.
6 In Wales, the non-household retail market is limited to customers who use at least 50 megalitres of water per year.
In England, no such thresholds apply.
◄-7.7 % ◄ -13.3%
◄ -41.8% ~ 0%
►+186.7%
◄-45.0 %
◄ -40.2%
► +300.0%
►+78.2%
◄-16.7%
► +3.8%
► +28.0%
◄ -43.8%
►+15.2 %
◄ -0.4%
◄ -42.2%
-0%
►+13.9%
◄ -9.4%
► +7.1%
► +8.3%
0 25 50 75 100 125 150
SES Water
Dee Valley
South East
South Staffs
Portsmouth
Bournemouth
Affinity
Cambridge
Bristol
Hartlepool
Essex & Suffolk
Wessex
South West
Severn Trent
Thames
Anglian
Northumbrian
Yorkshire
Southern
Dŵr Cymru
United Utilities*
► More complaints than 2015/16 ◄ Fewer complaints than 2015/16
Average 63.3
Wat
er
on
ly c
om
pan
ies
Wat
er
and
se
we
rage
co
mp
anie
s
18
At 132.4 written complaints per 10,000 connections United Utilities (trading as Water Plus) is by far the
worst performing company – 40% higher than the next worst company, Dŵr Cymru. Of the 3,000
written complaints that United Utilities received, 380 related to water supply and sewerage services,
both of which remain the responsibility of the company’s wholesale arm. 2,600 complaints were about
billing which will need to be addressed next year.
In Wales, most non-household customers have no choice of retailer so we monitor complaints from
non-household customers very carefully. It is, therefore, disappointing that Dŵr Cymru should have high
– and growing – numbers of written complaints from their non-household customers. This is in stark
contrast to Dee Valley, the other company operating mainly in Wales, where non-household written
complaints reduced by 13%. Dŵr Cymru needs to do more to improve its service to non-household
customers and compare well to the new retailers in future reports.
CCWater helping business customers in the new retail market
CCWater has an important role in the new retail water market in resolving complaints against both
wholesalers and retailers. Some customers will resolve a dispute with their retailer by switching but
many customers might find that this option has limited or no benefit.
Smaller businesses that use less water and do not have procurement experts on hand could find
themselves less able than larger organisations to negotiate price savings. For these smaller businesses,
customer service may be a more important market factor for them.
CCWater will continue to offer advice and support to non-household customers; helping to raise
awareness of the retail market and what choices customers have. And we will continue to assist
customers in resolving complaints that reach an impasse with retailers and wholesalers.
Forward look
The non-household retail market in England is less than six months old but early signs are that written
complaints to retailers are lower than for the same period in 2016-17. However, CCWater has received
more complaints and enquiries from non-household customers. Most of those contacting us are small
and medium sized businesses which are:
unsure about the name of their retailer – this is unsurprising as water companies have either
sold their non-household retail business to a new retailer, merged with another company, or
rebranded their retail arm. With many retailers having similar names, this may be causing
confusion amongst customers;
unable to find tariffs from other retailers to compare prices and thus engage effectively in the
market; and
upset about delays in resolving operational problems because of poor communication between
the retailer and wholesaler.
These may be teething problems but nevertheless we will continue to monitor the new market through
the complaints we receive and other available information to ensure companies address complaints
quickly and effectively. We will also continue to monitor how the companies in Wales – where retail
competition is available only to a small number of large water users – are responding to their non-
household customers.

19
5 COMPLAINTS RECEIVED BY CCWATER
Complaint numbers fall by 13%
A key focus of our role is to work with companies to make sure they get things right first time for their
customers. We help customers who have queries and concerns about the services they receive, the cost
of those services, and their company’s response to their enquiry. Although our website has answers to
a series of Frequently Asked Questions about water and sewerage services, we nevertheless receive
around 10,000 enquiries from customers each year.
We provide customers with advice on how they should take forward a dispute with their water
company or provide assistance in pursuing a formal complaint against their company. Last year, 8,711
customers registered a complaint7 with us about their company, a 13% fall on the previous year and in
line with the reduction in written complaints received by the companies.
Indeed, as Chart 8 shows, complaints to CCWater have broadly followed the downward trend in written
complaints to the water industry.
Chart 8: Written complaints received by companies and all complaints received by CCWater,
2004-05 to 2016-17
7 Complaints registered by CCWater can either be in writing (letter or email) or via the telephone. In the case of
complaints received by telephone we follow these through with the complainant and company.
0
2000
4000
6000
8000
10000
12000
14000
16000
18000
20000
0
50,000
100,000
150,000
200,000
250,000
300,000
Wri
tte
n c
om
pla
ints
to
wat
er
com
pan
ies
Companies
CCWater
Co
mp
lain
ts t
o C
CW
ate
r

20
CCWater investigations
Some customers approach CCWater for advice before they write to their water company but others
seek our help immediately because they are unsure about how to express their concerns or because
English is not their first language. In those circumstances we write to the company on behalf of the
customer setting out their concerns and suggesting a pragmatic resolution. Companies nearly always
accept our recommendations as this ensures a speedy conclusion to the complaint.
Occasionally, when a customer is still dissatisfied after going through their company’s complaints
process, we will open a formal investigation. Last year, we carried out six formal investigations which
we believe reflects the constructive relationship we have developed with the water companies over
many years. All the complaints we investigated formally resulted in the company taking further action
or making a payment to the customer.
If, after CCWater involvement, the customer remains dissatisfied with the outcome of their complaint,
there is an option to use an alternative dispute resolution scheme called WATRS. For complaints which
reach deadlock, WATRS will make a decision that is binding on the company although the customer may
still pursue the complaint via legal means. Nearly all complaints were resolved without the need for
customers to use the scheme. In 2016-17, 164 customers used WATRS.
Compensation and rebates
Many complaints are resolved through the company apologising for its action or inaction, making good
damage caused during operational activities, or amending a policy.
For some billing complaints, a rebate together with interest charges or a goodwill payment will resolve
the complaint. During 2016-17 we secured a total of approximately £800,000 in rebates for customers.
In addition, we also secured around £500,000 of compensation for customers where the service
received from their companies was not acceptable.
How we use our complaints data
The enquiries we receive and the complaints we handle tell us a lot about the operational activities and
customer service issues of each company. We hold regular meetings with the companies to discuss
complaint issues, and to explore how individual companies might improve their policies, processes or
practices to reduce complaints. We also encourage companies to adopt good practice and we share
our view on which companies are offering the best service to customers.
21
6 FUTURE CCWATER WORK
Keeping the pressure on companies who gave us cause for concern
The water industry has managed to steadily reduce written complaint numbers from over 273,000 in the
peak year of 2007-08 to just over 95,000 in 2016-17. However, nine companies reported increases in
written complaints in 2016-17, with Cambridge moving from the better to the poorer performance band
following a 249% rise in complaints. Seven companies reported an increase in unwanted contacts.
As stated in earlier chapters, we will:
Require Affinity, Dŵr Cymru and Southern to provide us with quarterly reports for the first six
months of the 2017-18 reporting year. We will then assess whether there is a continuing need
for these reports;
Require Cambridge to provide quarterly interim reports for the entirety of the 2017-18
reporting year to demonstrate how it is going to address its customer service issues and
reduce complaints; and
Monitor the performance of the worst performing companies on written complaints and
unwanted contacts per 10,000 connections to assess whether their respective increases were
temporary spikes in performance or signs of a longer term deterioration. If they are the latter,
then we will take appropriate action to get the problems resolved.
We have also been in discussion with Hartlepool about its written complaints numbers and with SES
Water about both measures. We expect both companies to show improvement in performance in next
year’s report.
Targeting further reductions in written complaints and unwanted contacts
The challenge for all companies, irrespective of current performance, is how to further reduce customer
dissatisfaction with the price of water and sewerage services, with the services themselves and with
administrative activities.
Billing and charges issues remain the largest source of customer dissatisfaction at over 50% of all written
complaints received, so starting there would seem sensible. Annual increases in unmetered charges or
unexpectedly large metered bills often generate contact and complaints, but so do billing errors. As
this report shows, some companies have established teams to interrogate meter reading data, identify
higher than normal bills and then proactively contact the customer to discuss possible reasons for it.
Those companies with high levels of billing complaints may like to consider following suit.
While customers rate highly the services provided by the companies, it is often because they are
available 24/7 without fail. When there is an operational incident, customers can be understanding if
the period off supply is short and the company is both seen to be working to restore the service and
keeping customers informed of what is going on.
As CCWater’s annual Water Matters research shows, customer satisfaction with the value for money of
the services provided is consistently 15-20 percentage points below satisfaction with those services.
Surprisingly, given that energy bills are typically three times water and sewerage bills, energy
companies fare better on customer perceptions of value for money. The water industry should look
again at how the best companies interact with their customers so that they can emulate the messaging
and promotional work.
No single initiative will dramatically reduce unwanted contacts and written complaints. Instead, water
companies should look at existing policies, processes and practices to see whether and how they can be
improved. Root cause analysis of complaints may help. CCWater can also provide advice on where

22
improvements could be made to reduce customer dissatisfaction. We would encourage the better
performing companies to share their good practice with the rest of the industry.
Extending our reporting of complaints
In future years, we intend to report on complaints received by companies through all channels,
including various forms of social media. This is intended to provide a complete picture of customer
dissatisfaction with services given that customers are using multiple channels to contact companies.
Clearly, this will be a significant change from our current practice of focussing on written complaints
and unwanted contacts.
Complaints assessments
Each year, we undertake assessments of a selection of companies’ written complaint handling
processes. We adopt a risk-based approach to these assessments, focusing on those companies whose
complaints performance gives us cause for concern.
Our assessments involve visiting a company to examine 25 randomly sampled written complaints. This
is designed to test whether the companies are following their complaint procedure and our written
complaint guidance in the identification, recording and handling of customers’ written complaints.
Over the past few years we have been successful in getting companies to change those processes for
the benefit of customers. For example:
All companies now operate a simpler, two-stage process for customers which speeds up the
time it takes to resolve a written complaint;
Some companies have introduced mechanisms to keep customers better informed about issues
that might take a considerable time to resolve. This is particularly important where the
resolution may involve a large capital scheme to improve reliability of supply or to prevent
sewer flooding; and
Greater empowerment of front-line staff to resolve queries or complaints to the customer’s
satisfaction rather than to meet internal targets on closing complaints.
Overall view of industry performance
We are disappointed that the industry has not been able to maintain its year-on-year improvement for
written complaints and unwanted contacts. 2.2 million negative customer contacts is too many and the
industry needs to work harder to improve.
We welcome the reduction in written complaints. However, there is still a lot of work to be done on
unwanted telephone contacts and complaints across the industry.
The huge increase in written complaints from customers of Cambridge turned it from one of the best
performers to one of the worst in the space of a year. Where we see companies needing to do better,
as in this case, we will press them to do so.
The gap between the best and worst companies for complaints per 10,000 connections has started to
close but we want to see this reduce even further in future years. We also want to see the downward
trend of unwanted telephone contacts over previous years resume in 2017-18 and beyond.


