Claremont Evaluation Center: LA84 Foundation Evaluation Report 1 LA84 Foundation 2013-14 Evaluation Report Complete Findings Report Prepared for LAUSD Beyond the Bell & the LA84 Foundation REVISED April 27, 2015 Submitted by: Claremont Evaluation Center Claremont Graduate University Tiffany Berry, PhD Michelle Sloper, MA In Collaboration with Glenn Daley
Transcript
Claremont Evaluation Center: LA84 Foundation Evaluation Report 1
LA84 Foundation 2013-14 Evaluation Report
Complete Findings Report
Prepared for LAUSD Beyond the Bell & the LA84 Foundation
REVISED April 27, 2015
Submitted by: Claremont Evaluation Center
Claremont Graduate University Tiffany Berry, PhD
Michelle Sloper, MA
In Collaboration with Glenn Daley
2 Claremont Evaluation Center: LA84 Foundation Evaluation Report
Executive Summary
The following report details descriptive findings from the 2013-14 academic year and longitudinal findings, when possible, to understand the current status and historical trends in sports program attendance, implementation quality, and student participant outcomes for the partnership between the LA84 Foundation and Los Angeles Unified School District (LAUSD) Beyond the Bell (BTB). Three primary data sources were used to explore these evaluation priorities: (1) sports attendance records from LAUSD middle school sites, (2) observational data of sports activity quality, (3) students’ academic records. Several useful and interesting findings emerged from these data sources. Participation in Sports Activities
The number of students involved in LA84 Foundation sports activities, and the average level of participation by individual students, continues to rise dramatically.
o LA84 Foundation sports have grown in total participation (all sports, with duplicate students) and in the number of individual students participating (all students, with duplicate sports).
o LA84 Foundation sports programs engage more than 10% of all students in the schools where programs are located.
o High participation in LA84 Foundation sports has risen, while low (casual) participation has declined over time since 2008-09.
o The proportion of students participating in multiple sports has increased. o While most LA84 Foundation sports participants are male, the number of female
participants has grown steadily over time. o Although most LA84 Foundation sports participants are Hispanic, reflecting the
populations of their schools, the percentage of participants who are Black is double the non-participant percentage of students who are Black in the same schools.
Quality of Sport Activities Implemented
The large majority of sports sessions were satisfactory or superior (i.e., activity selection, activity setting, staff performance, and student behavior).
o Activities are most effectively structured for success when program leaders intentionally select and manage appropriate activities for each session and have access to adequate space and equipment.
o In highly rated sports sessions, positive coaching strategies were also frequently observed. Staff were observed providing strong support for student development, giving appropriate feedback to scaffold student learning, possessing high levels of sports knowledge, maintaining strong organization over the session, and interacting positively with student participants.
When activities received high ratings for staff performance, they were also more likely to have high ratings for student behavior, demonstrating an important relationship between staff and student behaviors.
Claremont Evaluation Center: LA84 Foundation Evaluation Report 3
o Positive student participation was characterized by interest, concentration, respect for peers and staff, cooperation and teamwork.
There was a lack of variability across observational findings, which demonstrates some potential limitations of the observational tool.
o It is recommended that the BTB observational tool be revised to more clearly examine important processes relevant for promoting positive youth development/skill development in sports activities.
Sports Participant Outcomes
English Learners among LA84 Foundation sports participants show higher rates of redesignation to English-proficient status and greater gains on proficiency tests than matched comparison students.
o Overall, LA84 Foundation sports students redesignated at a faster rate than non-participants (1% to 2%). They showed gains averaging over four scaled score points more than non-participants. These results are educationally important given the potential for the development of basic English communication skills during sports.
LA84 Foundation sports participants demonstrate greater success in the transition to high school than matched comparison students.
o Regular participation in LA84 Foundation sports (more than 15 days) during 8th grade is associated with higher pass rates for Algebra 1 and more advanced mathematics courses in grades 9 and 10 compared to a constructed comparison sample of non-sports program participants.
o Regular participation in LA84 Foundation sports in grade 8 was associated with higher GPA marks in core courses in grades 8 through 10 compared to non-participants.
o There was no consistent relationship between LA84 Foundation sports participation in middle school and school-day attendance, or academic test scores.
o Given the available data sources, it is challenging to explain why sports participation is linked to later academic differences given the non-academic nature of the program implemented and the lack of relationships with school-day attendance.
Key Recommendations
Strengthen targeted recruitment efforts including sixth grade students, females, and English-language learners, and continue to facilitate multiple-sport participation and student retention across the middle school years.
Develop a stronger conceptual understanding of sports participation, using a logic model, to inform broader explorations of participant outcomes and identify important mechanisms for student development. This logic model can inform evaluation and quality improvement.
Improve the measurement tools employed for evaluation purposes, including using a more comprehensive observational system, gathering more participant-level data using surveys or interviews/focus groups, and leveraging other available data sources.
Continue to invest in continuous quality improvement efforts informed by evaluation data to ensure that program activities maximize positive student experiences and most effectively produce intended developmental impacts.
4 Claremont Evaluation Center: LA84 Foundation Evaluation Report
Regular Levels of Sports Participation ................................................................................................................. 7 High, Medium, & Casual-Level Sports Participation ............................................................................................ 9 Regular Participation by Core Sport .................................................................................................................. 10 LA84 Foundation Sports by Student Demographics .......................................................................................... 13
Combinations of Sports by Gender & Ethnicity .............................................................................................. 13 Sport by Gender ............................................................................................................................................ 14 Sport by Grade Level ..................................................................................................................................... 14 Sport by Ethnicity .......................................................................................................................................... 15 Sport by Socioeconomic Status...................................................................................................................... 16 Sport by English Learner Status ..................................................................................................................... 17
Summary of Attendance Findings & Trends ...................................................................................................... 18
Section 2. Program Quality Observations .......................................................................................... 19
Structured Observational Quantitative Findings ............................................................................................... 20 Quality Ratings by Sport .................................................................................................................................... 21 Structured Observation Qualitative Findings .................................................................................................... 21
Summary of Program Quality Findings .............................................................................................................. 28 Limitations of Observational Data .................................................................................................................... 29
Interim Outcome Indicators .............................................................................................................................. 30 Gains in CELDT Scores ................................................................................................................................... 30 Redesignation Rates ...................................................................................................................................... 31 School Attendance ........................................................................................................................................ 31
Long-Term Academic Outcomes ........................................................................................................................ 31 Completion of Algebra I in Grade 8; Completion of Math Courses in Grades 9 & 10 ...................................... 32 Completion of Core Academic Courses in Grades 8-10 .................................................................................. 33 Grade Point Average (GPA) in Core Academic Courses (Grades 8-10) ............................................................ 34 Standardized Test Scores ............................................................................................................................... 35
Summary of Sports Participant Outcomes ........................................................................................................ 35
Appendix A: Statistical Matching for Outcomes Analyses .................................................................. 38
Claremont Evaluation Center: LA84 Foundation Evaluation Report 5
Introduction
Since its inception following the 1984 Olympic Games in Los Angeles, California, the
LA84 Foundation has supported the development of a sports culture in the greater Los Angeles
area through the provision of instrumental and financial support to organizations serving
children and youth. Since 2007, the LA84 Foundation has partnered with Los Angeles Unified
School District (LAUSD) Beyond the Bell (BTB) to support sports programming for middle school
afterschool program participants across the district in its afterschool program providers.
Sports activity participation has been linked to positive youth developmental outcomes
across domains, including physical health outcomes (i.e., increased cardiovascular fitness,
strength, endurance, and flexibility), social and emotional competencies (i.e., self-knowledge
and emotion regulation, psychological resilience) and academic performance (Bartko & Eccles,
2003; Coatsworth & Conroy, 2007; Eccles et al., 2003; Le Menestrel & Perkins, 2007). Sports
activities are uniquely poised to contribute to youth development because these contexts
possess many qualities essential to the promotion of positive youth development (PYD),
including close relationships with adult staff members, positive peer interactions,
psychologically and physically safe environments, challenging activities, and opportunities for
skill building and decision making (Fraser-Thomas et al., 2005; Petitpas, Cornelius, & Van Raalte,
2008). Given that these activities are unique developmental contexts, it is essential that sports
organizations make strong commitments to evaluation as a means to understanding current
operations, trends in participation among students, and how program participation is
associated with intended participant outcomes. The following report represents the first year of
collaboration between these organizations and the Claremont Evaluation Center (CEC) to
examine evaluation data sources.
The 2013-14 evaluation report is organized around three primary components. Findings
reported here are descriptive in nature, providing an understanding of the current status and
historical trends in sports participation trends, program implementation, and student outcomes.
First, participation in sports activities was examined by gathering attendance records
across the 2013-14 academic year for sports participants and examining 2013-14 trends by
student characteristics (i.e., gender, grade, ethnicity). This report also includes historical trends
in attendance records across previous academic years, as early as 2008-09. To gain a clear
Participation in Sports Activities
High-Quality Activities
Implemented
Sports Partcipant Outcomes
6 Claremont Evaluation Center: LA84 Foundation Evaluation Report
picture of the quality of sports activity implementation, the second section summarizes the
observational findings for several facets of program quality including activity selection, activity
setting, staff performance, and student behaviors. Third, to capture sports participant
outcomes, academic records were used to examine both interim indicators (i.e., school
attendance, English language learner status) and long-term student outcomes (8-10th grade
course completion, core course grade point average, and test scores) associated with sports
participation. When possible, sports participants were compared to a match sample of non-
participants.
Claremont Evaluation Center: LA84 Foundation Evaluation Report 7
Section 1. Attendance Findings & Trends
The first component of the evaluation process was to examine the attendance patterns
for the 2013-14 academic year (overall and by participant characteristics), as well as examine
longitudinal trends in sports participation since the 2008-09 academic year. These analyses will
focus primarily on the four “core” sports offered by the LA84 Foundation/BTB partnership,
unless otherwise specified. Through the 2012-13 academic year, the four core sports were
football, basketball, soccer, and softball. In 2013-14, volleyball replaced softball as a core sport,
with softball becoming a supplemental sport. For the current academic year (2013-14), the
supplemental sports were futsal, rugby (with both fall and spring seasons), Run-4-Fun, softball,
tennis, and track & field. Each of the core sports operates for an eight-week season, with a
maximum of forty days per sport available. A student who participates in all four core sports
has the potential to participate in 160 days total. The supplemental sports vary in the length of
their seasons.
In this report, casual participants are those who participate for less than 15 days in a
school year. In some analyses, we make a distinction between medium and high participation as
subcategories of regular participation. We define high participation as at least 55 days of
attendance per year, which necessarily must include participation in more than one sport.
Medium participation means at least 15 days but less than 55 days per year.
Regular Levels of Sports Participation
Overall, during the 2013-14 school year, 127 schools reported student participation in
any LA84 Foundation sports, of which 100 schools reported participation in LA84 Foundation
core sports. There were 9,303 students with regular participation (at least 15 days of
participation) in LA84 Foundation core sports and 3,138 students with casual and/or
supplemental-sport only participation. Figure 1 shows how the number of students
participating in LA84 Foundation sports compares with students in the same schools who did
not participate in LA84 Foundation sports. In the same schools, there were 27,099 who
participated in other BTB after-school programs and 73,030 who did not participate in any BTB
after-school program component.
8 Claremont Evaluation Center: LA84 Foundation Evaluation Report
Figure 1. LA84 Foundation Sports Participation at Participating Schools
Note: 1. Individual students participating in multiple sports are counted only once in this graph. 2. Regular participation is defined as 15 or more days of attendance during the school year. Casual participation is defined as fewer than 15 days per year. Supplemental sports are LA84 Foundation sports other than the four core sports.
Figure 2 shows the combined number of regular participants in core sports for the
school years from 2008-09 through 2013-14. This graph includes volleyball in place of softball as
a core sport in 2013-14. Since individual students may participate in more than one sport, these
numbers may count an individual student up to four times per year.
9,303 3,138
27,099
73,030
0
30,000
60,000
90,000
LA84 core sport regular LA84 supplementalor casual
Non-LA84 after schoolparticipants
Non after schoolparticipants
Students in LA84 Programs, 2013-2014Compared to other students in the same schools
Claremont Evaluation Center: LA84 Foundation Evaluation Report 9
Figure 2. Longitudinal Growth in Participation in Core Sports from 2008-2014
Note: 1. Core sports are Football, Basketball, and Soccer in all years, Softball through 2012-13, and Volleyball replacing Softball for 2013-14. 2. Individual students participating in multiple sports are counted multiple times in this graph. 3. Regular participation is defined as 15 or more days of attendance per year for each sport counted.
This figure shows that there was a substantial increase in participants in all four core
sports in the 2011-12 school year, with the number of participants continuing to climb
(although at a slower rate) in subsequent years as demonstrated by the green line. LA84
Foundation participants showed an overall gain of about 92% in six years. The blue and red
lines, representing females and males respectively, also show growth in participation since
2008-09. The total number of male participants remains higher than the total number of female
participants. However, female participation has climbed by about 161% in five years, while
male participation has climbed by about 64% in the same period. Overall, these trends suggest
that participation in LA84 Foundation sports continues to grow across academic years for male
and female participants.
High, Medium, & Casual-Level Sports Participation
Additionally, the number of high attenders in LA84 Foundation sports has risen (at least
55 days of attendance per year), while low (or casual) participation has dropped over time
(those participating 15 days or less). In Table 1, student participation is categorized as high,
medium, and casual. Since 2008-09, high participation has climbed 233% and medium
participation has climbed 10%, while casual and supplemental-only participation has declined
8,271 8,376 8,761
14,226 14,87815,903
5,853 5,792 5,894
9,2019,521 9,597
2,418 2,584 2,8675,025 5,357
6,306
0
5,000
10,000
15,000
20,000
2008-09 2009-10 2010-11 2011-12 2012-13 2013-14
Nu
mb
er o
f R
egu
lar
Par
tici
pan
ts
Number of Regular Participants in Core Sports2008-09 through 2013-14
(with Volleyball replacing Softball in 2013-14)
All Male Female
10 Claremont Evaluation Center: LA84 Foundation Evaluation Report
14%.1 This table also shows that the number of students in LA84 Foundation sports has climbed
even while student populations at LAUSD middle schools declined. As a result, LA84 Foundation
sports participants represented more than 10% of all students in their middle schools in 2011-
12 for the first time, and about 12% of all students in their schools during 2013-14.
Table 1. High, Medium, and Casual Participation versus Non-Participation from 2008-2014
Note: 1. Each student is counted only once per year, regardless of number of sports. 2. Data for supplemental sports are only included for 2012-13 and 2013-14. 3. Only students in schools with LA84 Foundation programs are counted in non-LA84 Foundation sports participants’ figures and as the base of the percent.
Regular Participation by Core Sport
Sports participation trends were also examined by core sport across time. Figure 3
shows the number of regular participants in each of the four core sports for a six-year period.
For statistical continuity, softball is included for 2013-14, although it was no longer a core sport.
Basketball and soccer show rapid growth across the years including in 2013-14, while football
declined in 2013-14 after rapid growth in earlier years. Softball participation fell off by two-
thirds when it was dropped as a core sport, although the following figure shows that volleyball
participation (the core sport replacing softball) increased proportionately.
1 This figure understates the decline, since data for supplemental sports were not analyzed for years prior to 2012-2013. Thus, participation statistics for earlier years do not include supplemental-only students, while data for the last two years include those students.
Level of LA84 Participation 2008-2009 2009-2010 2010-2011 2011-2012 2012-2013 2013-2014
5-year
change
High Participation Students
(55+ days in core sports) 1,192 1,432 1,499 2,688 3,299 3,975 233%
Medium Participation Students
(15-54 days in core sports) 4,414 3,223 3,450 5,437 4,200 4,852 10%
the goals of the LA84 Foundation through providing opportunities for teaching, learning, and
competition (TLC) (n = 16). These activities embodied the LA84 Foundation mission through
supporting skill development or the application of learned skills in competition. Other highly
rated activities were characterized by positive leadership behaviors from staff members (i.e.,
modeling, good structure established, feedback) (n = 5) and engaged student participants
through balancing fun activities with challenge (n = 8). One observer noted the strong structure
and organization established in one exemplary soccer session, “Students worked in three
different sub-groups. One focused on dribbling and capturing the ball, the other focused on
blocking goals, and another focused on kicking goals. From a distance, it looked like a well-oiled
machine, with everyone on task and concentrating on their task.” Another observer noted that
one activity exemplified student engagement and positive peer interactions, “This was the best
tryout session I have ever seen because everyone was having fun and acting totally positively
towards one another. Everyone was taking the tryout seriously but enjoying themselves and
not putting each other down regardless of their skill level.” The appropriate use of equipment
provided by the LA84 Foundation was also characteristic of high quality activities (n = 2).
Poorly Rated Activity Selection (rated unsatisfactory or just adequate). The most
common feature of poorly rated activities was that the activity was unstructured and little
leadership was observed (n = 6). In many of these cases, the lack of structure and leadership
resulted in activities that were either not conducive to skill development, or did not include
intentional skill building components (n = 2). Additionally, some activity sessions struggled due
to a lack of appropriate equipment or limited use of available equipment (n = 4). One observer
noted, “One could not distinguish between the teams as they wore no uniforms or bibs. There
was also no scoreboard or LA84 Foundation banner. Bats and mitts issued by the LA84
Foundation were not used.”
1 8
77
22
0
20
40
60
80
100
Unsatisfactory Just Adequate Satisfactory Superior
Fre
qu
en
cy o
fAct
ivit
y Se
lect
ion
Rat
ings
Observer Rating
Claremont Evaluation Center: LA84 Foundation Evaluation Report 23
Activity Setting
The activity settings received very high ratings with 98% of sessions receiving ratings of
satisfactory or better, suggesting that sports activities are taking place in high-quality
environments across providers. Indeed, no activities received “unsatisfactory” ratings for the
setting. See Figure 13 for a complete summary of activity setting ratings.
Figure 13. Frequency of Observer Ratings for Activity Setting (N = 108)
Highly Rated Activity Setting (rated superior). For the majority of highly rated activity
settings, the space demonstrated a good match to the activity and was conducive to high-
quality implementation (n = 21). Additionally, the space included structures and permanent
equipment that was necessary for the activity (i.e., basketball hoops). Another important
component of highly rated settings was that the environment was clean and well maintained (n
= 8).
Poorly Rated Activity Setting (rated unsatisfactory or just adequate). All of the
qualitative notes for low-rated activity settings noted that there was a lack of necessary
equipment or necessary space (n = 2). Low ratings were due to small, logistical issues
concerning the lack of some non-essential equipment (i.e., scoreboards, banners).
Staff Performance
As one component of the activity process, high quality staff performance is essential to
promoting positive youth development. Research suggests that positive coaching techniques
include the following staff behaviors: providing technical instruction, emphasizing skill
development, tailoring the activity to participants’ skill levels, delivering appropriate and
0 2
87
19
0
10
20
30
40
50
60
70
80
90
100
Unsatisfactory Just Adequate Satisfactory Superior
Fre
qu
en
cy A
ctiv
ity
Sett
ing
Rat
ings
Observer Ratings
24 Claremont Evaluation Center: LA84 Foundation Evaluation Report
constructive feedback, emphasizing teamwork, and nurturing positive relationships with
students (Fraser-Thomas & Cote, 2006; Holt et al., 2006). Observational findings suggest that
approximately 83% of sessions had staff performance that was rated satisfactory of better,
however 18 sessions received lower ratings from observers (refer to Figure 14).
Figure 14. Frequency of Observer Ratings for Staff Performance (N = 108)
Highly Rated Staff Performance (rated superior). Staff members implemented many
positive coaching techniques to create high-quality environments for student participants. The
most common positive staff behavior was to provide high levels of encouragement and
feedback to students (n = 16) and create activities that emphasized learning and skill building (n
= 10). The following notes were written by observers to demonstrate the importance of
encouragement and feedback for participant skill building.
“The coach was experienced. He provided encouragement and positive reinforcement to
students, but also corrected improper postures and techniques. He did the correction in a
supportive tone without any yelling.” (Middle school volleyball activity)
“The coaches know the students names and provides encouragement and instruction. If a
play is not optimal, they suggest improvements for the next time.” (Middle school softball
activity)
“He watches the moves made by the players and coaches students individually, identifying
ways to improve.” (Middle school basketball activity)
This learning and skill building would not be possible without staff members possessing
the requisite knowledge about the sport (i.e., rules, techniques) (n = 11). The following observer
5
13
57
33
0
10
20
30
40
50
60
Unsatisfactory Just Adequate Satisfactory Superior
Fre
qu
en
cy S
taff
Pe
rfo
rman
ce R
atin
gs
Observer Ratings
Claremont Evaluation Center: LA84 Foundation Evaluation Report 25
notes for highly rated sessions illustrate the importance of knowledge about sports rules,
procedures, and techniques to support student development.
“The coach is a former professional player. He is fully involved with the students by calling
plays and watching the work of students.” (Middle school soccer activity)
“The coach was serious and clearly understood the rules of playing soccer, as well as the
necessary coaching strategies. He made playing enjoyable although he was preparing them
for a weekend tournament.” (Middle school soccer activity)
“The leader/coach was knowledgeable about softball. He provided individual batting
instruction to some students on batter stance and swing using softball terminology.”
(Middle school softball activity)
Additionally, positive coaching was observed via positive interactions between staff and
students (n = 8). Staff members were described as “attentive”, “flexible”, “supportive”, and
“respectful” in their interactions with students. Through these interactions, staff members
“created a very positive feeling” and “set a positive tone” in observed sports sessions.
In a similar vein, staff members used high-levels of organization in their sessions (n = 9)
and strong behavioral management (n = 11). Across sessions, observers noted, “clear routine,
procedures and rules were evident” in multiple sessions. Organization allowed for participation
of “students at various levels” as illustrated by the observer notes here.
“Program leader established clear expectations and boundaries, and provided informative
feedback, explaining what and why the activity would proceed as he described.” (Middle
school soccer activity)
“He was firm, positive, and kept the students active. He was assertive and very skilled in
disciplining his students. He firmly asked the students to quickly move through the cones and
instructed them on safety issues.” (Middle school football activity)
“Site coordinator and Program Leader were organized, followed a well-developed routine.
They were attentive to students and rules of the game, which they facilitated in such a way
to reinforce students knowledge and skills required for the game.” (Middle school basketball
activity)
Lastly, highly rated staff performance also included sessions in which staff members
displayed enthusiasm and modeled a positive attitude for student participants (n = 7). In one
particular session, the observer noted that the “…coach had passion for soccer and tried to
instill this in his students. He was right in the middle of the action and conducted his skill and
drill sessions while running along side the students. He yelled encouragement all along the way.
He reminded them about team work, not hogging the ball, and being aware and focusing on
their surroundings.”
Poorly Rated Staff Performance (rated unsatisfactory or just adequate). The most
pervasive concern about staff behaviors was a lack of appropriate leadership. In some cases,
26 Claremont Evaluation Center: LA84 Foundation Evaluation Report
staff members did not display leadership behaviors and provided no direction to structure the
activity (n = 14). Similarly, in many sessions, staff was observed providing no feedback, or
encouragement to student participants (n = 9). These sessions did not promote skill
development because no feedback or instruction was given to scaffold learning, and in these
sessions, observers noted a lack of student engagement. Examples of these concerning staff
behaviors are provided below.
“The coach was not observed talking to the students during the game. No skill building took
place.” (Middle school soccer activity)
“No coaching directions or skill building was evident during the activity. The leader used a
whistle to stop and start student activity. This leader did not engage students wandering in
or out.” (Middle school soccer activity)
“Two staff. No efforts to teach, assist, or inspire. Spent much of the time talking to each
other and to other staff who passed through including the coordinator.” (Middle school
basketball activity)
As these notes illustrate, these sports sessions were missed opportunities for student
growth, due to a lack of initiative, leadership, and effort by program staff. Staff performance is
essential to the success of sports activity sessions.
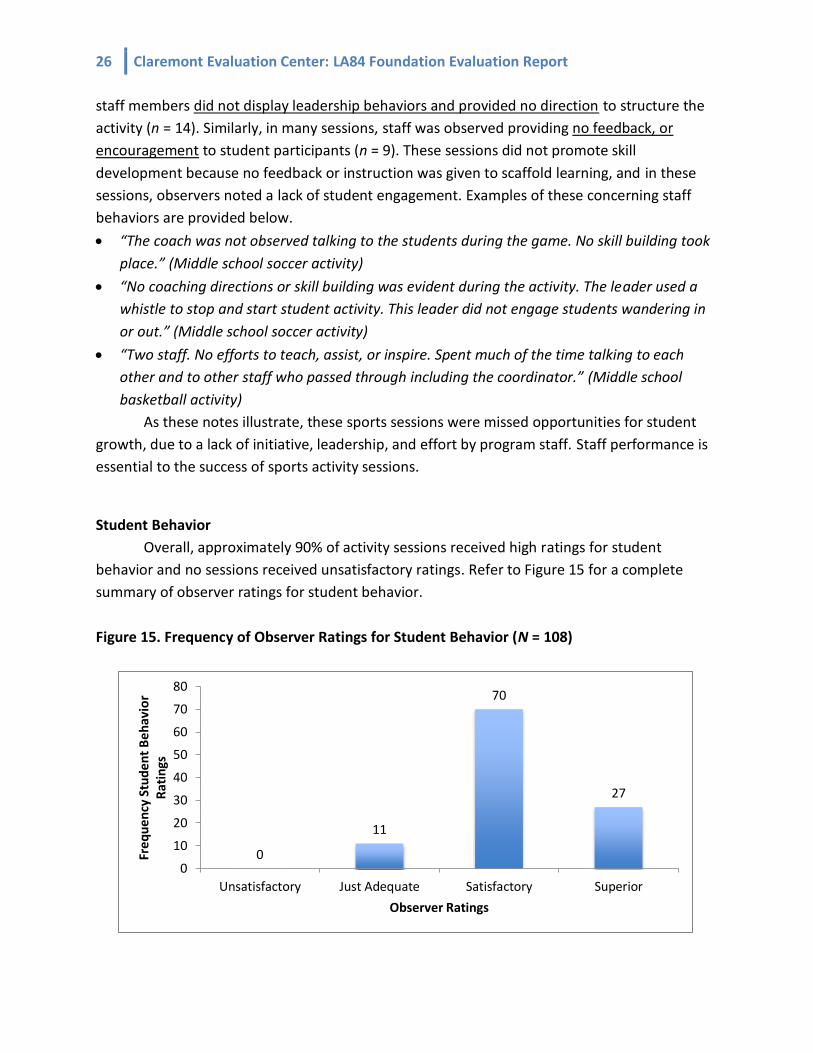
Student Behavior
Overall, approximately 90% of activity sessions received high ratings for student
behavior and no sessions received unsatisfactory ratings. Refer to Figure 15 for a complete
summary of observer ratings for student behavior.
Figure 15. Frequency of Observer Ratings for Student Behavior (N = 108)
0
11
70
27
0
10
20
30
40
50
60
70
80
Unsatisfactory Just Adequate Satisfactory Superior
Fre
qu
en
cy S
tud
en
t B
eh
avio
r R
atin
gs
Observer Ratings
Claremont Evaluation Center: LA84 Foundation Evaluation Report 27
Highly Rated Student Behaviors (rated superior). A high frequency of sessions exhibited
positive and productive student behaviors. In a large number of highly rated sessions, students
displayed positive emotions, such as interest and enthusiasm, and had high levels of
engagement in the sports activities (n = 22). Students were also observed engaging in positive
behaviors towards their peers, including teamwork, cooperation, supportive engagement and
strong sportsmanship (n = 16). In addition to positive peer interactions, students were observed
interacting positively with program staff by showing respect and responding to staff feedback in
a positive manner (n = 14). The exemplary sessions noted below demonstrate the potential for
student engagement and positive behavior.
“All students were wholly engaged, focused, interested, and motivated. They were
cooperative, worked well with each other, listened to and followed directions provided by
the program leaders.” (Middle school soccer activity)
“The students were engaged and maintained interest in the soccer game. They were
competitive and worked well with their teammates. Students listened to directions and
followed directions. They were respectful and cheered each other on. They called out to each
as they fielded the soccer ball.” (Middle school soccer activity)
“The students played hard and were very immersed in the game. They played fairly, listened
to the coaches and had lots of fun. It was a productive, active time for all involved.” (Middle
school soccer activity)
“The students were orderly, respectful, well-behaved and listened attentively to directions
and instructions. Students demonstrated interest in the activity and encouraged teammates
and peers. Students assisted with gathering and storing equipment.” (Middle school soccer
activity)
Poorly Rated Student Behaviors (rated unsatisfactory or just adequate). Eleven sessions
overall received low ratings for student behaviors (10% of total sessions). The vast majority of
student behaviors that received a low rating were characterized by disengagement, lack of
enthusiasm, and off-task behaviors (n = 9). A small number of student groups were also
observed acting disrespectfully towards program staff, or non-responsive to staff requests (n =
3). Observer notes about poor student performance illustrate some of these issues.
“Most students did not seem interested in the activity. The ball was kicked around between
the same four students during the game. Other students stood around talking to each other.
Two students sat on the benches and were working on what appeared to be homework.”
(Middle school soccer activity)
“Students that were up to bat did not stay behind the back stop and could have been hit by
stray balls. The catcher wore a face mask, but not a chest protector. Some females also sat
between the home and first bases eating, talking, and using their cell phones.” (Middle
school softball activity)
28 Claremont Evaluation Center: LA84 Foundation Evaluation Report
“The students were just standing around at the beginning. The girls were just standing
around socializing and never got totally engaged. Most of the boys participated but there
seemed to be a lack of commitment on this day.” (Middle school softball activity)
Many of these behaviors seem to be the result of poor session management, and lack of
supervision, interaction or engagement from program staff. Qualitatively, sessions where poor
staff performance was observed also seemed to be sessions were student behaviors were more
negative. Indeed, there was a strong, positive correlation between the staff performance and
student behavior quantitative ratings (r = .61, p < .001). This suggests that there is a relationship
between staff performance and student behaviors such that when staff performance was rated
highly, these sessions also had high ratings for student behaviors (and vice versa for poor
ratings). This relationship demonstrates the strongly interrelated nature of staff behaviors and
student engagement.
Many activity sessions exemplified the best practices necessary for promoting positive
youth development. These highly rated activity sessions provide some insight into the
ingredients for a successful sports activity. These insights are consistent with the body of
research and evaluation findings about promoting positive youth development in sports
activities.
In terms of the activity structure, high-quality sports activity sessions possessed the following
characteristics.
Activities were selected based on their potential for skill-development and embodied
the LA84 Foundation mission of teaching, learning, and competition (TLC).
Activities were selected to provide participants with enjoying activities coupled with
challenge to create high levels of engagement and motivation.
The activity setting was well matched to the activity, providing the necessary space for
effective activity implementation.
The activity setting was clean and well maintained.
The necessary equipment was available and the equipment was utilized in an
appropriate manner.
For the activity process, high-quality sports activity sessions possessed the following
characteristics.
Summary of Program Quality Findings
Claremont Evaluation Center: LA84 Foundation Evaluation Report 29
Staff members provided appropriate feedback coupled with encouragement to scaffold
learning and skill development among youth participants.
Staff members possessed high levels of knowledge about the sport being played that
was harnessed to demonstrate skills to participants and teach sports rules and
procedures.
Staff members developed strong session organization and structure to facilitate learning,
and used behavioral management techniques to manage the participants through the
session structure.
Staff engaged in positive interactions with all student participants and modeled positive
behaviors and positive emotions (i.e., enthusiasm, excitement).
Students were engaged in the activity, showing both interest and concentration.
Students interacted positively with peers throughout the activity, including cooperation,
encouragement, and teamwork.
Students were respectful to staff members, responded appropriately to staff requests
and directions, and understood the importance of participating in a safe manner.
Limitations of Observational Data
When analyzing and reviewing observational data, some limitations were discovered.
One concern with the observational data is that there was little variability across the
observational ratings, as evidenced by the high frequency of “satisfactory” (three) ratings across
categories. It is unlikely that sports activities were highly similar across providers and sports,
and thus it is plausible that there are some shortcomings of the observational data collection
system. Perhaps the broad categories observed do not pinpoint the important processes and
environmental features that may vary across site to capture the variability in program
implementation quality. The categories or ratings did not allow the observers to accurately
differentiate the important and distinct processes to identify low-quality and high-quality
sessions. Moving forward, it is proposed that the observational tool be revised to accommodate
more specific indicators of program quality.
30 Claremont Evaluation Center: LA84 Foundation Evaluation Report
Section 3. Sports Participant Outcomes
The third and final component of the 2013-14 evaluation efforts was to explore
outcomes for sports participants. These findings are limited to language development and
academic performance outcomes because these data could be ascertained from LAUSD records
from middle school sites. The quantitative findings include statistical profiles of students
participating in LA84 Foundation sports and when possible, a matched comparison sample, to
explore student outcomes for the 2013-14 school year. Additional information about the
matching techniques employed for these analyses can be located in Appendix A.
Interim Outcome Indicators
Interim outcome findings relate to groups of outcomes that take place more
immediately following (proximal to) sports participation, meaning these outcomes reflect
middle school outcomes that may be associated with sports participation that may predict later
participant outcomes. For this category, analyses included English language proficiency status,
and school-day attendance findings.
Gains in CELDT Scores One indicator of English language development is growth on the California English
Language Development Test (CELDT). We analyzed gains in CELDT test scores from 2010 to
2013. The CELDT test is given in the fall, so the CELDT given during the 2013-14 school year is
considered an end-of-year outcome for 2012-2013. At the time we conducted this analysis,
CELDT scores from fall 2014 were not available. The sample size in this analysis was limited by
the fact that students who redesignate as English Proficient no longer have to take the test, so
their progress is not reflected in the gains calculation. As a result, we found that this outcome
was sensitive to the sample matching criteria. Under some criteria, LA84 Foundation sports
participation was associated with an increase of more than 4 scaled score points, while under
other criteria virtually no impact was found. Notably, we did not find a negative association
under any of the scenarios. Using a regression method to obtain more precise estimates, we
found a significant effect size of 10% of a standard deviation for two years of exposure to LA84
Foundation sports programs. While encouraging, this is correlational data, meaning that a
relationship exists but it should not be interpreted as a causal impact. However, it suggests that
a focus on EL students might pay dividends, and further research with more data might show
the impact more reliably.
Claremont Evaluation Center: LA84 Foundation Evaluation Report 31
Table 4: CELDT Gains by Participation in Years
Years of
Participation
Number of
Participants
Number of
Comparison
Treatment
Group
Gains
Weighted
Comparison
Group Gains
Weighted
Difference Sig
Effect
Size in
SD
1 year 1,761 14,364 27.51 23.49 4.02 *** 0.044
2 years 1,659 13,803 42.67 38.11 4.56 *** 0.104
Note: Significance values *** p < 0.005
Redesignation Rates LA84 Foundation sports participants were also compared with closely matched non-
participants in terms of redesignation from Limited English Proficiency (LEP) to Reclassified
English Proficient (RFEP) status for students who started the year as English Learners. Overall,
LA84 Foundation sports participants redesignated at a faster rate than non-participants, by
about 1% to 2%, a small effect size but a significant outcome. Although small, these results are
important because they suggest that recruiting English Learners and providing opportunities for
English language use during after-school activities could have a cumulatively important impact
on English language development among middle school students.
School Attendance We examined school attendance as an outcome of interest for this analysis, under the
hypothesis that participation in LA84 Foundation sports in the afternoon might motivate higher
attendance in classes during the school day. This hypothesis cannot be verified with the data
we have available, since it is also probable that students who attend more often during the day
are naturally more likely to participate in the afternoon. In our statistical analyses, we found
positive correlations between LA84 Foundation participation and school day attendance, but
the size of the difference was negligible and statistical significance was inconsistent across
multiple models.
Long-Term Academic Outcomes
Because LA84 Foundation sports focus on middle school student participants, exploring
academic outcomes starting in 8th grade for students who participated regularly in grade 8, and
potentially 6th or 7th grade as well, can demonstrate persistent associations between academic
success and sports participation. These following academic outcomes span across 8-10th grades.
Given the duration of our longitudinal data set, there are only two class year cohorts for whom
we have both matching data prior to their entry to LA84 Foundation sports activities and
outcomes for subsequent tenth grade classes. In the future, we would like to add another
cohort year to the longitudinal analysis for greater sample size, and we would also like to
32 Claremont Evaluation Center: LA84 Foundation Evaluation Report
examine CAHSEE pass rates as an important tenth grade outcome. With more years of data, we
will also be able to examine outcomes in grades 11 and 12, although their connections with the
influence of middle school after school programs are likely to be even more tenuous than those
for grade 10.
Completion of Algebra I in Grade 8; Completion of Math Courses in Grades 9 & 10 Although Algebra 1 is traditionally a 9th grade course, current policies are to enroll and
complete Algebra I in 8th grade. It requires caution to use as an outcome, because the pass rate
is conditional on having the opportunity to take the class in 8th grade. For this analysis, any
eighth grade student who took Algebra I or a higher math course requiring Algebra I as a
prerequisite, was flagged as a baseline student. The number of those baseline students who
passed Algebra 1b, the required second semester of Algebra, or a higher math course, became
the denominator in a ratio greater than zero but less than one: the probability of success
conditional on taking the course.
Progress toward graduation requires credit for math courses beyond Algebra I, and a
number of such courses are electives as well. The pass rate indicator is the percentage of
students in the eight grade treatment and comparison groups who pass at least two semester
courses among this list of advanced math courses, including Geometry, Algebra II, Trigonometry,
Calculus, and a variety of Mathematical Analysis courses. Because it is not conditioned on
taking the courses, this indicator covers a variety of hazards including dropping out of school,
moving out of the district, and failing the Algebra I prerequisite, as well as failing the courses
actually attempted. However, avoiding these hazards is a positive outcome for the student, so
the indicator can be interpreted broadly. The selection of matched comparison students based
on data prior to grade 8 attempts to create equivalent groups that can be directly compared in
terms of this later outcome.
As shown in Table 5, we found statistically significant differences between treatment
and comparison groups in the pass rate for these math courses. The effect sizes were small,
especially for the tenth grade, but the effect sizes for eighth and ninth grade were large enough
to be considered academically important.2 In sum, these findings suggest that regular
participation in LA84 Foundation sports during 8th grade is associated with higher pass rates for
Algebra 1 and more advanced mathematics courses in grades 9 and 10 compared to a
constructed comparison sample of non-sports program participants.
2 To the extent that enrollment in ninth grade higher math courses is conditional on passing eighth grade Algebra I, these two results are not independent. They also exclude any effect on passing Algebra I in ninth grade, which is, for disadvantaged students in LAUSD, a more commonly faced and critical hurdle. However, because it is a positive outcome conditional on a negative outcome, passing Algebra I in eighth grade, we did not model it here. On the other hand, passing higher math courses in tenth grade is not conditional on which grade Algebra I was passed, so it is a composite effect.
Claremont Evaluation Center: LA84 Foundation Evaluation Report 33
Table 5: Math Pass Rates For Participants & Non-Participants
Completion of Core Academic Courses in Grades 8-10
Since progress into and through high school requires passing specified courses, the
number of core courses passed by a student in one year is a measure and predictor of success.
For this analysis, students were only compared to others in the same grade, because the
number of core courses required and available changes from grade to grade. In this report, the
core courses counted were the standard and advanced English Language Arts courses for each
grade, Algebra I or higher math for 8th grade, and higher math courses for 9th and 10th grades,
and grade-appropriate courses in science, history, and social studies. Note that this measure
also implicitly indicates that the student did not drop out of school prior to the grade counted
for these courses. Starting with matched comparison groups in grade 8, the number of courses
passed in subsequent grades means that a student both remained in LAUSD schools and
progressed in grade level, and also passed the courses needed to advance.
As shown in Table 6, we found significant differences between participant and
comparison groups in the number of core academic courses passed. The differences appear
small, less than a third of a semester course in grade 8, less than a fifth of a course in grade 9,
and less than a seventh of a course in grade 10. However, as measured by standard deviations
of the population, these are somewhat larger effect sizes than often seen in educational
research, and indicate the academic importance of the results. Compared to the sample of non-
participants, LA84 Foundation sports participants in 8th grade demonstrated high pass rates in
core academic courses in 8-10th grade.
34 Claremont Evaluation Center: LA84 Foundation Evaluation Report
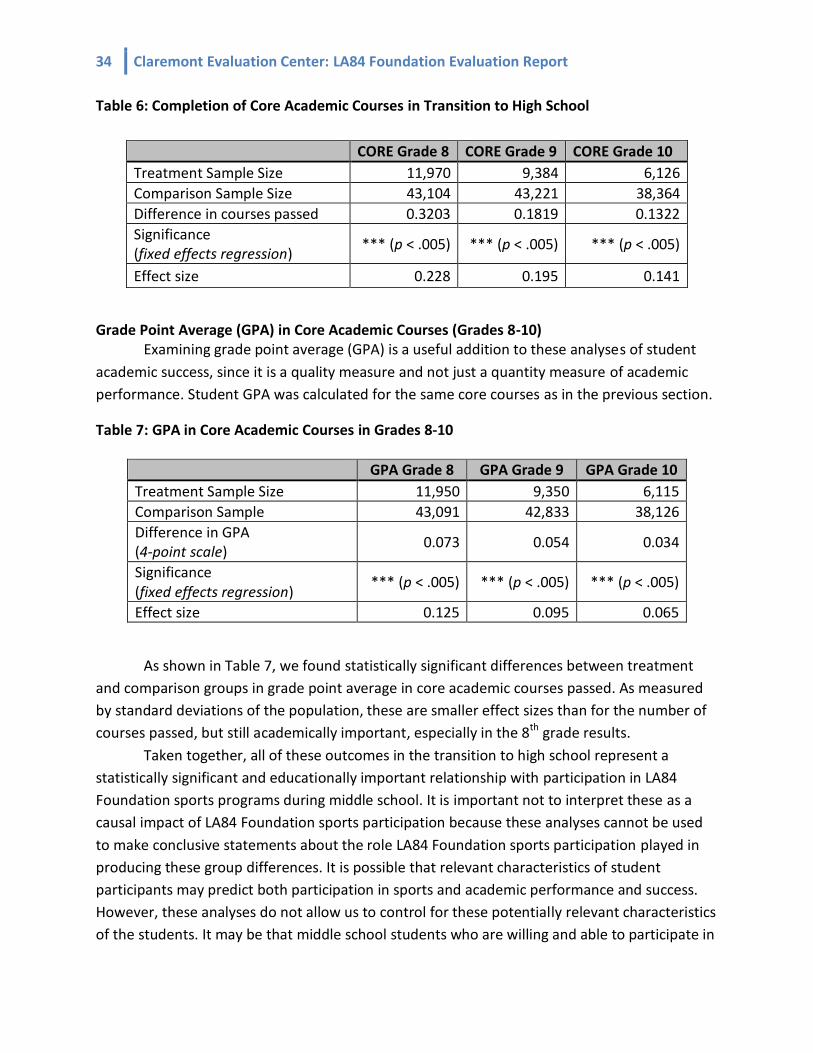
Table 6: Completion of Core Academic Courses in Transition to High School
CORE Grade 8 CORE Grade 9 CORE Grade 10
Treatment Sample Size 11,970 9,384 6,126
Comparison Sample Size 43,104 43,221 38,364
Difference in courses passed 0.3203 0.1819 0.1322
Significance (fixed effects regression)
*** (p < .005) *** (p < .005) *** (p < .005)
Effect size 0.228 0.195 0.141
Grade Point Average (GPA) in Core Academic Courses (Grades 8-10) Examining grade point average (GPA) is a useful addition to these analyses of student
academic success, since it is a quality measure and not just a quantity measure of academic
performance. Student GPA was calculated for the same core courses as in the previous section.
Table 7: GPA in Core Academic Courses in Grades 8-10
GPA Grade 8 GPA Grade 9 GPA Grade 10
Treatment Sample Size 11,950 9,350 6,115
Comparison Sample 43,091 42,833 38,126
Difference in GPA (4-point scale)
0.073 0.054 0.034
Significance (fixed effects regression)
*** (p < .005) *** (p < .005) *** (p < .005)
Effect size 0.125 0.095 0.065
As shown in Table 7, we found statistically significant differences between treatment
and comparison groups in grade point average in core academic courses passed. As measured
by standard deviations of the population, these are smaller effect sizes than for the number of
courses passed, but still academically important, especially in the 8th grade results.
Taken together, all of these outcomes in the transition to high school represent a
statistically significant and educationally important relationship with participation in LA84
Foundation sports programs during middle school. It is important not to interpret these as a
causal impact of LA84 Foundation sports participation because these analyses cannot be used
to make conclusive statements about the role LA84 Foundation sports participation played in
producing these group differences. It is possible that relevant characteristics of student
participants may predict both participation in sports and academic performance and success.
However, these analyses do not allow us to control for these potentially relevant characteristics
of the students. It may be that middle school students who are willing and able to participate in
Claremont Evaluation Center: LA84 Foundation Evaluation Report 35
a sports activity for at least 15 days of a school year are also students who are more likely to
complete required courses successfully in grade 8 and the first two grades of high school.
Standardized Test Scores Over several years of analysis, we have examined academic achievement in terms of
standardized test scores on the hypothesis that after-school sports participation might be
associated with higher test scores through such mediators as daytime attendance,
improvement of study habits and self-efficacy, and time provided for homework and tutoring.
However, we have been unable to identify consistent patterns in this relationship. The linkages
from after-school participation to academic test scores are tenuous at best, and confounded
with other relevant experiences or background characteristics of the students.
Using a constructed comparison group of non-participants, our findings demonstrate
that LA84 Foundation sports participants fair better on language development during middle
school and academic outcomes in 8th grade and through high school. LA84 Foundation sports
participants had higher rates of redesignation to English-proficient status compared to matched
comparison middle school students. Furthermore, participation in LA84 Foundation sports was
associated with higher pass rates for required math and other core courses in 8th grade and
high school (9-10th grade), as well as higher grade point averages for core courses, in
comparison to non-participating students. These consistent associations suggest that student
participants in sports programs demonstrate stronger academic success than non-participants,
although statements cannot be made about whether LA84 Foundation sports participation is
the cause of these effects. Other potential student outcomes, including middle school
attendance and standardized test scores, were not related to LA84 Foundation sports
participation.
Summary of Sports Participant Outcomes
36 Claremont Evaluation Center: LA84 Foundation Evaluation Report
Overall Recommendations
2013-14 Evaluation Recommendations
This report attempts to showcase the strengths and positive associations of sports
participation among middle school students, and suggest areas for targeted program
improvement. Based on the three primary data sources examined, the following
recommendations are developed to inform program practices in the upcoming years.
Strengthen targeted recruitment efforts for sports activities.
o Targeted recruitment efforts should be maximized to attract female students.
Female students probably have the greatest potential for growth among LA84
Foundation sports groups since they still represent only about 40% of the program’s
participants. Adding sports that are likely to have a substantial number of female
participants – as well as permitting soccer to overlap some of the other sports – may
be promising approaches to increasing female student participation.
o Continue to facilitate multiple-sport participation and retention of students across
the middle school years. This includes recruiting participants in the early middle
school years and retaining these students in the program over time.
o Employ targeted strategies to recruit English Learners and provide frequent
experiences of English language use during sports activities. These efforts could have
a cumulatively important impact on English language development among middle
school students.
Develop a stronger conceptual understanding of sports participation to inform broader
explorations of participant outcomes and identify important mechanisms for student
development.
o Research surrounding youth sports participation has identified a diverse range of
relevant intrapersonal, psychological, and social-emotional outcomes that are highly
aligned with sports participation in middle school and beyond. The LA84 Foundation
and BTB should consider expanding the participant outcomes beyond academic
achievement, especially to capture more proximal participant outcomes more
aligned to sports participation as they may reveal stronger impact and benefits for
participants.
o A logic model displaying the program’s intended theory about how it will lead to
positive youth development is recommended to illustrate more explicit links
between sports participation and relevant participant outcomes. This logic model
Claremont Evaluation Center: LA84 Foundation Evaluation Report 37
can guide future measurement of relationships between sports participation and
other non-academic outcomes employing additional evaluation measures.
o The program should also aim to identify mechanisms (and display them in the logic
model) that may explain positive academic results linked to sports participation so
that the program can strengthen and enhance those program components.
Improve measurement tools employed for evaluation purposes.
o Employ a more comprehensive measurement and observational system to fully
capture program implementation quality. A revised observational tool could
accommodate more specific indicators of program quality found in the published
literature, including positive staff-student relationships, peer relationships, positive
coaching, student leadership opportunities, active engagement, and skill
development
o Consider using surveys or qualitative interviews/focus groups to understand student
experiences in sports activities and the benefits they derive from participation.
o Leverage other available data sources to more fully capture participant experiences
and outcomes, including (but not limited to) the LAUSD Student Experience Survey.
Continue to invest in continuous quality improvement efforts informed by evaluation
data to ensure that program activities maximize positive student experiences and most
effectively produce intended developmental impacts.
38 Claremont Evaluation Center: LA84 Foundation Evaluation Report
Appendix A: Statistical Matching for Outcomes Analyses
The outcome analyses for English language development and the transition to high
school outcomes are based on carefully matching LA84 Foundation sports participants with
non-participating students in the same schools. The treatment group for these analyses
consisted of cohorts of students who participated in LA84 Foundation sports for 15 days or
more during their eighth grade year. Separate models were calculated for cohorts who started
participation in sixth, seventh, and eighth grades, thus reflecting three, two, and one year of
participation, respectively. A pooled model of eighth graders with all three starting grades was
calculated as well. The results presented in this report are based on the pooled model.
Comparison group students were matched with participants (treatment students) using
baseline data from the year before a participant's first year of participation. This helps to
ensure equivalent groups, since program effects could influence data from any year after
beginning participation. Since comparison students do not have a "first year of participation,"
the entire pool of comparison students was available for matching with treatment students in
the same grade cohort up to three times. However, the treatment groups were mutually
exclusive, with different baseline years and varying characteristics. Thus, each comparison
group was selected independently to match its own treatment group. Outcomes were
compared on a matched cell-for-cell basis, with the data for each comparison group weighted
by the number of treatment students in the same cell, instead of the number of comparison
students, to ensure statistical balance and avoid composition bias. Statistical significance was
conservatively determined using the number of treatment students in each cell as the nominal
sample size for both treatment and comparison groups in the same cell.
An alternate method using linear or logistic regression was also used to test the
sensitivity of results and obtain formal standard errors. Only treatment students and
comparison students from the above matching procedure were included in regression samples.
For linear regressions, fixed effects by school were used to avoid composition bias, and robust
standard errors using school as a clustering variable were obtained. For logistic regressions,
Generalized Least Squares (GLS) random effects by school were used to avoid composition bias.
Regression results were very similar to results from cell-by-cell matching, with the advantage of
providing formal standard errors and additional diagnostic statistics that would have to be
calculated more laboriously and in less standard ways for the matched results. For these
reasons, regression results rather than matched group results are presented in the tables and
figures in this report.
Tables A1 and A2 show the sample sizes for treatment and comparison groups by school
year and by years of participation in LA84 Foundation sports programs.
Claremont Evaluation Center: LA84 Foundation Evaluation Report 39
Table A1: Number of Students in Comparison Groups by School Year
Eighth Grade
Year Ending
Treatment
Students
Comparison
Students
2010 1,590 41,447
2011 2,043 37,864
2012 3,810 34,849
2013 4,027 32,695
2014 4,469 31,759
Total 15,939 178,614
Note: Totals for treatments are exclusive, with each student counted only once. Totals for comparisons are inclusive, with most students counted more than once.
Table A2: Number of Students in Comparison Groups by Years of Participation
Years of
Participation
Baseline for
Matching
Treatment
Students
Comparison
Students
Grade 8 (1 yr) Grade 7 11,457 178,614
Grades 7-8 (2 yrs) Grade 6 3,291 137,132
Grades 6-8 (3 yrs) Grade 5 1,191 99,270
Total
15,939 415,016
Note: Totals for treatments are exclusive, with each student counted only once. Totals for comparisons
are inclusive, with most students counted more than once.