Complete Life Cycle Assessment for Vehicle Models of the Mobility CarSharing Fleet Switzerland Gabor Doka, dipl. phil II Chemiker Doka Ökobilanzen Stationsstrasse 32 8003 Zürich Switzerland [email protected]Sabine Ziegler Dipl. Natw. ETH / FFU Mobility Car Sharing, Mühlenplatz 10 – 11 6000 Luzern 5 Switzerland [email protected]
Transcript
Complete Life Cycle Assessment for Vehicle Models of the Mobility CarSharing Fleet Switzerland
Gabor Doka, dipl. phil II Chemiker Doka Ökobilanzen Stationsstrasse 32 8003 Zürich Switzerland [email protected]
Sabine Ziegler Dipl. Natw. ETH / FFU Mobility Car Sharing, Mühlenplatz 10 – 11 6000 Luzern 5 Switzerland [email protected]
2
Mobility Car Sharing Switzerland has developed a new, extended Life Cycle Assessment tool to assess the complete environmental burden of their car models. At present Mobility CarSharing Switzerland has 1450 vehicles on the road, which are being shared by 40'000 customers and 800 businesses with a total of 5'500 employees using a shared car. 1. Car Sharing Switzerland – an introduction Mobility CarSharing Switzerland is the largest car sharing organisation in the world and services 40% of the whole car sharing customer community worldwide. Car sharing activities in Switzerland have a history of 12 years and havebeen stimulated by two cooperatives. 1997 saw the merger of these cooperatives into one nationwide provider 'Mobility CarSharing Switzerland'. Since then the growth rates have been in a take off phase of 30 – 50 % regarding customer and vehicle figures. Mobility CarSharing works in close collaboration with regional public transport (combined tickets with 13 tarification nets and the national railway system SBB AG). Car sharers are confirmed mobility combiners: they prefer a mixture of transportation means apart from the car. The figure below shows how after six months of membership the average car sharer has changed his/her transportation habits. 2. Use of transport means With this change in transportation habits a drastic modal split change follow. According to the scientifc study (Muheim 1998) a car sharer prefers taking public transport 80% of the time and uses a shared car only 20% of the time. This entails an energy reduction of 54%.
3
Tab. 1 Use of transport men as after car sharing membership
Active Users Transport means 100 % Car users
34.6 % rail / postalbus 9.1 %
20.1 % bicycle 8.0 %
17.4 % bus / tramway 9.6 %
8.1 % by foot 11.4 %
6.2 % CarSharing-Car -
5.4 % second vehicle 53.8 %
2.9 % motorcycle 1.6 %
1.8 % companycar 4.4 %
1.5 % friends car 0.7 %
0.6 % car rental -
0.5 % scooter 1.0 %
0.2 % taxi -
4
Fig. 1 grey and direct energy use of car sharing cars compared to other means of transport.
3. Mobility CarSharing Switzerland – 3 S Strategy The factors above may be subsumed as the lifestyle component of the ecological component of corporate responsibility. Mobility CarSharing Switzerland defines itself as a company with a responsibilty covering social and ecological aspects. Only with a transparent track record in these fields, a long-term economic sustainability can be archieved. The principle of 3 s strategy (sustainable services and systems) has proven especially in the service systems context to be key motivators in the economy as such (R. Mejkamp, 2000). Since Mobility CarSharing is a cooperative the revenue must be reinvested and there is a shift from the sole shareholder viewpoint to a higher more holistic viewpoint of including 3 – s strategies. However the cooperative members have to decide on these strategic goals. A user decides thus between low tariffs (for perhaps vehicles emitting more pollutants) and individual corporate responsibility (reinvesting revenvue on environemntal measures as a value). Still Mobility CarSharing Switzerland sees itself in the early business cycle stage of a pioneer company with goals such as service quality, network growth and vehicle reservation probability as a priority target. On the other hand Mobility owns the greater part of its fleet and needs criteria of buying and selling, which may be subordinate to the pure ecological criteria of the vehicles owned. Thus the clients are pulled into a broader sense of responsibility than a sole service user.
5
Fig.2 Three levels of responsibility
4. Motives for a new method in fleet management Environmentally conscious car fleet managers need comprehensive tools to choose environmentally well-performing car models. Up until now only coarse partial indicators like fuel consumption per kilometre, or EURO exhaust emission categories have been applied, which only cover a part of the environmental performance of a car. Consumer transport associations such as VCD/VCS-ATE provide lists with environmental scores for different car models [1]. These lists are based on an ad hoc methodology focussing on use phase impacts of vehicles. 5. The Mobility Life Cycle Assessment - Methods Mobility CarSharing Switzerland commissioned a study analysing the total life cycle of the vehicle models in their current fleet. The Life Cycle Assessment (LCA), encompasses burdens from resource extraction, to car manufacture, use and finally its disposal. To get an impression of the relative magnitude of the environmental burdens caused by different aspects of today’s car traffic, not only exhaust emissions, fuel consumption and material use for car and road infrastructure was heeded, but also health damages from road noise and motor vehicle accidents, environmental burdens from land use and landscape fragmentation were included in the assessment. The aim is to develop a comprehensive indicator expressing the environmental load of car models per vehicle kilometre. For this purpose a new valuation method--MUPB'97--was devised, which aggregates all burdens mentioned above into a single value [2]. The MUPB'97 method is a consistent extension of the well-known and broadly applied BUWAL method of ecological scarcity (Umweltbelastungspunkte, UBP'97 [3]) and is based on established political or societal goals regarding environmental problems in Switzerlandi.
i The name 'MUBP'97' was chosen due to the methodological kinship to the UBP'97/BUWAL valuation method. 'MUBP' means 'Mobility-Umwelt-Belastungs-Punkte' and can be translated as 'Mobility-Ecoscarcity'. The suffix '97' indicates that the valuation weights were derived from the Swiss environmental situation in 1997.
economic
social ecological
6
Environmental effects heeded in MUBP'97 Pollutants Global warming (CO2, CH4, N2O...)
Resources Energy raw materials (oil, uranium...) Disposal sites (various wastes) Land use Landscape fragmentation
Other health impacts
Road traffic noise Fatalities from road accidents Injuries from road accidents
f r o m U B P ' 9 7 ( B U W A L ) n e w i n M U B P ' 9 7 ( M o b i l i t y )
Tab. 2 Environmental effects heeded in the MUBP'97 valuation method.
23 car models in the current Mobility fleet were analysed in depth. For reasons of comparison, a statistical average of a Swiss passenger car model was assessed as well (cf. figure 1). The results are calculated for a total life time service of 150'000 vehicle-kilometres (= functional unit). 6. Mobility CarSharing fleet performance - Results 6.1 A summary Compared with an average Swiss passenger car in 1999, the car models of Mobility CarSharing Switzerland show up to 39% reduced overall burden as expressed in MUBP'97-points per vehicle kilometre. The best car models were found to be small limousines like VW Lupo TDI 3l, Opel Corsa and Smart. However, a minority of the car models have roughly equal impacts than the Swiss average . These car models are vans and large passenger vehicles for up to 8 passengers. The results will help Mobility fleet managers to promote a environmentally optimised acquisition of new cars. 6.2 A new focus is needed due to vehicle development The analysis also shows that for Mobility CarSharing cars regulated exhaust emissions like NOx, HC, CO and PM10 particles are at a very low level. Compared to these emissions, other burdens like health damages from noise and accidents, fuel manufacture and CO2 exhaust emissions are more relevant for the environment. Hence for modern cars, the regulated exhaust emissions can be considered to be of little importance in the overall environmental burden of the car. This result can be confirmed with other impact valuation methods such as Eco-indicator95+ [4] and is therefore not an artifact of the MUBP'97 valuation method. The results signifies that past efforts to reduce exhaust emissions were successful. But it also illustrates, that a car emitting little or no pollutants in exhaust gases is not purged completely from being environmentally burdening. Measures to reduce other burdens such as CO2 emissions, road noise, accident casualties and fuel manufacture promise to be more efficient to reduce the overall burden from modern cars in the future. Also land use aspects (road infrastructure, landscape fragmentation) and material consumption aspects (car manufacture,
7
servicing and disposal) will become increasingly significant, and, for low burdening cars can become more important than fuel-related issues. It is significant to note that roughly 50% of the total environmental burdens are indirect burdens. Indirect or 'grey' burdens do not occur directly at the place or time the car is used, but are caused indirectly during the whole car life cycle due to eg. fuel manufacture (precombustion) or grey burdens in material consumption. 6.3 The results in detail Mobility Category
Car model Short name Number in Mobility fleet (2000)
Cat. S Smart & Pulse man. Smart Pl m 17 Cat. S Smart & Pure man. Smart Pr m 17 Cat. S Smart & Pulse autom. Smart Pl a 17 Cat. A Fiat Punto 1.1 S50 Punto 51 Cat. A Opel Corsa 3 doors Corsa 3t 129 Cat. A VW Lupo 3l 1.2 TDI * VW Lupo 75 Cat. A Nissan Micra K11 Micra 0 Cat. B VW Golf 1.4 Golf 28 Cat. B Opel Astra 1.4 Astra 668 Cat. B Opel Corsa 5 doors Corsa 5t 129 Cat. B Opel Corsa autom. Corsa a 129 Cat. B Opel Combo Kasten. Combo 0 Cat. B Renault Kangoo 1.4 Kangoo 0 Cat. B Mazda 323 1.6 Mazda 323 0 Cat. C Fiat Punto Cabrio Punto Cabr. 10 Cat. C Opel Astra Cabrio Astra Cabr. 10 Cat. C Opel Sintra 2.2 Sintra 7 Cat. C Toyota Previa 2.4 Previa 10 Cat. C Nissan Serena 1.6 Serena 0 Cat. C VW Beetle 2.0 VW Beetle 16 Cat. C Fiat Barchetta 1.7 Barchetta Cabr. 7 Cat. C Opel Vectra 1.8 Vectra 6 Cat. T Toyota Hiace 2.7 Hiace 27
Average car Switzerland Ø CH 99
Tab. 3 Car models assessed in this study: 23 car models in 5 categories of the current Mobility fleet. An average Swiss car 1999 is assessed as comparison. The short name for the VW Lupo has a prefix * to remind it is a diesel car.
8
Fig. 3 Environmental impact – expressed in MUBP'97-points – for 23 different car models in the 5 categories of the current Mobility fleet. The VW Lupo has a prefix '*' to remind it is a diesel car. A current average Swiss passenger car is shown for comparison.
LCA results have usually a range of uncertainty of at least 20%. Therefore, it is advisable not to draw conclusions from small differences in the results. Hence the results should be classified into rough categories of comparable environmental load.
9
Total enviromental burden as compared to average Mobility
car Car models
Distinctly smaller * VW Lupo
Slightly smaller Corsa 3t, Corsa 5t, Smart Pr m, Smart Pl m, Smart Pl a, Punto, Corsa a, Punto Cabr., Micra, Vectra, Mazda 323
Distinctly bigger Previa, Serena, Ø PKW CH'99 , Hiace Tab. 4 Rough classification of environmental performance of the car models as compared to the average Mobility car. The models are listed in order of increasing environmental burden.
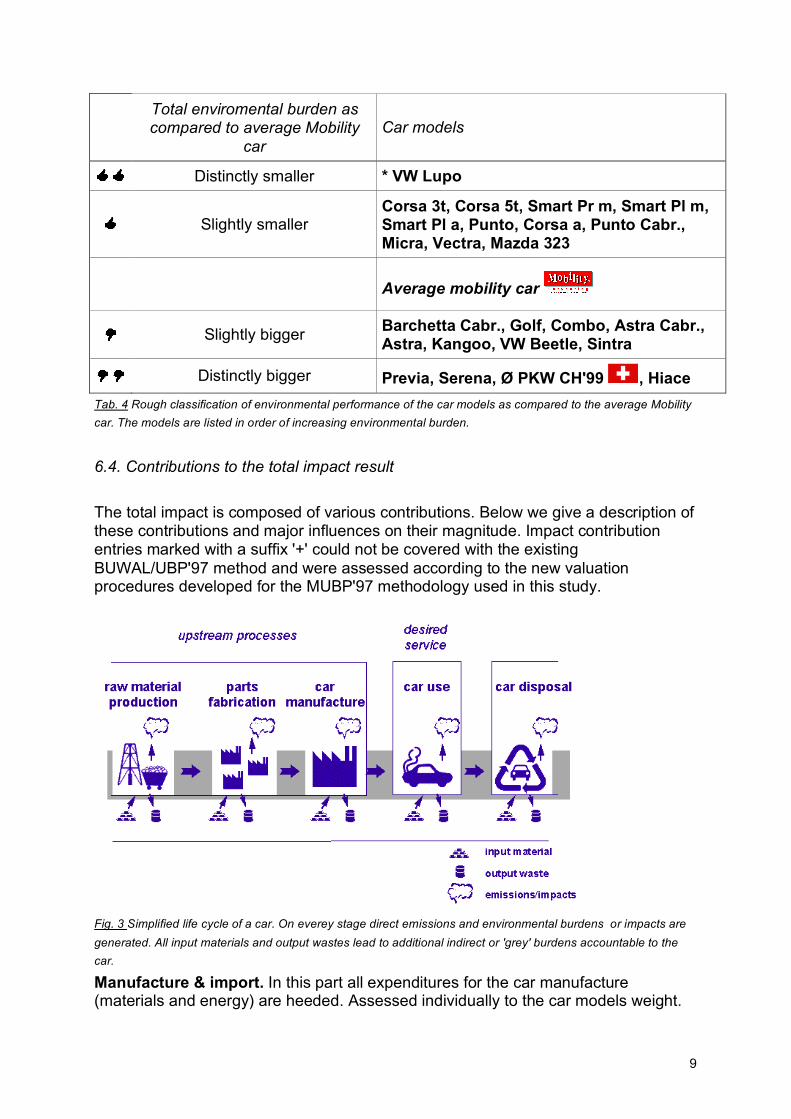
6.4. Contributions to the total impact result The total impact is composed of various contributions. Below we give a description of these contributions and major influences on their magnitude. Impact contribution entries marked with a suffix '+' could not be covered with the existing BUWAL/UBP'97 method and were assessed according to the new valuation procedures developed for the MUBP'97 methodology used in this study.
Fig. 3 Simplified life cycle of a car. On everey stage direct emissions and environmental burdens or impacts are generated. All input materials and output wastes lead to additional indirect or 'grey' burdens accountable to the car.
Manufacture & import. In this part all expenditures for the car manufacture (materials and energy) are heeded. Assessed individually to the car models weight.
10
This part basically depends on the manufacturing process and location of the car manufacturer. The consumer has but a very indirect choice of influencing this by either buying or not buying this car. Car manufactureres of course are able to make design choices here, as well as in engine performance issues below (fuel consumption, exhaust gases). Servicing. In this part all expenditures for the car maintenance (materials and energy) are heeded. Assessed with average data for passenger cars. Energy consumption of servicing stations make up for a good part of this contribution. This is dependent on the station management. Tyre replacement is another bigger influence. Servicing frequency might be partially dependent on driving style but also on the car model. Disposal. Disposal of the materials used for manufacture and maintenance is heeded here. A total life time of 10 years and 150'000km is assumed. After that the car will be dismantled in Switzerland. Most metal parts are assumed to be recycled. Plastics are incinerated. Assessed individually to the car model. Disposal is first of all a function of the input materials used for the car. Disposal options depend on on hand on the existing disposal channels in a region (recycling, incineration), and on the management of dismanteling old cars. Road infrastructure. The proportional amount of materials and energy for the national road infrastructure per car are assessed here. Separate effects which are also attributable to the road infrastructure as well are expressed below (land use, landscape fragmentation). Assessed with average data for passenger cars. Road infrastructure is determined by the technical engineering processes of roads on one hand. On the other hand roads are comissioned by political institutions. These in turn react to current situations and extrapolated prognoses on traffic development and propose various solutions to the percieved traffic problems. The vicious circle of "botttleneck traffic situation - new roads as a solution - increased attractivity - new bottleneck on a higher traffic level" is often ignored in this process. It is fair to say that roads generate new roads. It is obvious that this will be unsustainable in the long run and technical solutions of "environmentally friendly road building" are not sufficient to attain sustainability. Land use +. This is the consumption of land resources from land use due to road infrastructure. Assessed with average data for passenger cars. Land use from road infrastructure is in most cases irreversible, i.e. the roads are only very rarely eliminated once they are built, so there is little possibility to reduce these burdens. Landscape fragmentation +. Fragmentation of wildlife migrating routes due to highways and busy main roads. Assessed with average data for passenger cars. The effects of fragmentation can be alleviated for some animal species by special passages over or under the roads.
11
Fuel precombustion. Burdens form the manufacture and distribution of fuel (before combustion). Assessed individually to the car models fuel consumption. This part is dependent on fuel consumption which is dependent on the car model, but also driving style, possible extras like air conditioners. Since a cold motor uses more fuel than a warm motor the fuel consumption depends also on the average distance travelled per start (i.e average trip length). Other influences are type of trip (inner city, highway etc.), driving style, travelling speed. The precombustion is also dependent on the way fuel is produced, which can be influenced by fuel manufacturers, but only slowly since technology changes are merely gradual. The precombustion of diesel fuel has a 20% lower impact per liter than one liter of petrol. Carbon monoxide CO + , Nitrogen oxides NOx , Hydrocarbons HC, PM10 particles. These are all direct exhaust emissions. They have various deteriorating effects on human health and on the natural environment. Assessed individually to the car model. Exhaust emissions are dependent on the car model (engine and catalyst type), but also type of trip (inner city, highway etc.), driving style, travelling speed and fraction of cold starts per distance travelled (i.e average trip length). Carbon dioxide CO2. Exhaust emissions of Carbon dioxide. Assessed individually to the car model. Carbon dioxide emissions are dependent on the fuel consumption of the car (see conditions for consumption in the part 'fuel precombustion'). Diesel fuel has a 13% higher carbon content per liter than petrol. Health damages by noise +. Damages to Human health from road noise in residential areas. Assessed individually to the car model. The noise impacts are dependent on the noise level of the car (motor noise and tyre noise), but also driving style and road surface. Since the health damages during the night are much more severe than during the day the impact heavily depends on the distance travelled during the night. For the study an average share of 7% night-drives (22.00h to 6.00h) was assumed. The impact contribution from noise will be reduced by 23% of the devised figure for car trips only taking place during the day, or will be higher by 427% – or a factor of 5 – for car trips only taking place during the night(!). ** Health damages by accidents +. Damages to human health from traffic accidents. Included were casualties and injuries. Assessed with average data for passenger cars. Accident damages are dependent on the driving style, safety belt discipline, speed, alcohol consumption, type of road and weather, and the safety measures in the car design. Other use phase impacts. Includes other exhaust emissions like sulfur dioxide (SO2), nitrous oxide (Lachgas, N2O), lead traces (Blei, Pb). Assessed individually to the fuel type (petrol, diesel) of the car model. Also included here are zinc and cadmium emissions from tyre wear (Assessed with average data for passenger cars).
12
Lead trace emissions are only present in petrol cars (not diesel cars). This applies also to unleaded fuel (as used in Mobility cars) but of course on a lower level than in leaded petrol. Sulfur content of fuels was lowered by manufacturers in the past and is now on a very low level. Zinc and Cadmium emissions from tyre wear are dependent on rubber quality, air pressure, road surface and partially dependent on driving style. 5.3 Results per CarSharing category The cars in the assessment are not comparable in every respect, because they serve different uses. Most of the cars are passenger vehicles. The passenger cars have varying seat capacity from 2 seats (Smart) up to 8 seats (Previa). The Toyota Hiace however is decidedly a pure transport vehicle. Other cars like eg. the cabriolets or the Volkswagen Beetle are denoted as 'fun cars' with neither a strict passenger not freight transport utility, and rather serve as a 'transportainment' utility. So strictly the cars are not comparable or exchangable regarding the delivered service. Mobility CarSharing rents their vehicles in differently priced categories. These categories (Cat. S, A, B,C, and T) are indicated in the result chart above. The category prices increase in that same order. Since the customers are ready to pay the same amount of money for vehicles within one category, it is fair to say that the cars of this category perform comparable services (based on 'willingness-to-pay'). Therefore, cars within the same category can be considered comparable in terms of the delivered or percieved service. Prices for Mobility members in CHF as of Feb. 2001
Tariff per hour rent 7.00–23.00h
Tariff per kilometer travelled for trips up to 100km
Average tariff per km †
Vehicle category S 2.55 0.35 0.605 Vehicle category A 2.55 0.40 0.655 Vehicle category B 2.55 0.50 0.755 Vehicle category C 2.55 0.70 0.955 Vehicle category T 4.20 0.70 1.120 Tab. 5 Tariffs for Mobility car use in 5 categories. † the assumed speed over the whole trip is assumed to be 10km/h (= total travelled distance : travel time & stopover time). The tariffs for non-members has a similar structure, but on a higher price level.
13
Fig. 4 Environmental burden – expressed in MUBP'97-points – for 5 categories of car models and the average of the current Mobility fleet. A current average Swiss passenger car is shown for comparison.
Increasing price of the category generally signifies also an increase of environmental burden. This is not a surprising result, as environmental burden is partially correlated with fuel consumption which in turn will influence prices. An exception is category S, which is cheaper than category A, but produces more burden. Category S obtains a higher environmental burden than category A mainly due to a higher noise level of the models in this category. 6.5. Diesel vehicles and their performance Diesel cars are often thought to be environmenally worse than petrol cars, due to higher emissions of NOx and PM10 particles. Also, diesel fuel emits more CO2 per liter than petrol. On the other hand, diesel motor concepts often show reduced fuel consumption. In the case of the VW Lupo TDI 3l the elevated emissions of NOx and particles are more than compensated by the high reduction in fuel consumption. This result was confirmed using the valuation method Eco-indicator'95+ [4] and is therefore not an artifact of the MUBP'97 valuation method. However, the finding cannot stand for all diesel cars, as the Lupo is remarkably clean and fuel efficient compared to other available diesel car models. The Lupo is the only diesel car in the current Mobility fleet. 6.6. Light-weight material and the effects on the environment Separate analysis for the VW Lupo showed also that the increased use of light-weight materials like aluminium and magnesium in modern car concepts is
14
environmentally favorable: The additional environmental burdens caused by the use of these energy intensive materials are compensated through the reduced fuel consumption in the weight-reduced cars. It is advisable to check the environmental tradeoff of light-weight materials for each car design individually. However, average car weight has increased during the last decades, due to increased luxury in cars. The first VW Golf was 100 kilograms lighter than the current VW Lupo TDI 3l. Also changes in engine management promise to have a bigger influence on fuel reduction with a better ecological tradeoff than use of light-weight materials. 7. Conclusion and outlook The current study addressed different petrol and diesel car models only. However, an important advantage of the MUBP'97 methodology, compared to the VCS list [1], is it's full compatiblity with other fuel technologies, like natural gas, methanol, hydrogen or electricity as well as with other modes of passenger transport. In the future, it is easy for Mobility CarSharing Switzerland to assess new car technologies without the need to change the methodology. Additionally, this analysis can be applied to scenarios developped in the yearly planning. [1] K. Egli, U. Geiser, Ph. Hadorn (Eds.) "VCS-Auto-Umweltliste - Leitfaden zum ökologisch bewussten Autokauf - Ausgabe 2000/2001", Verkehrs-Club der Schweiz VCS-ATE, Energie 2000, Bern [2] G. Doka, "Mobility-Umweltbelastungspunkte'97 - an extension of the BUWAL UBP'97 valuation method for Mobility Car Sharing", (in preparation) [3] G. Brand, A. Scheidegger, O. Schwank, A. Braunschweig, "Methode der ökologischen Knappheit – Ökofaktoren 1997", Infras, BUWAL Schriftenreihe Umwelt Nr. 297, Februar 1998 [4] Jungbluth, N. "Umweltfolgen des Nahrungsmittelkonsums: Beurteilung von Produktmerkmalen auf Grundlage einer modularen Ökobilanz [Environmental consequences of food consumption]. Unpublished Dissertation (No. 13499), Swiss Federal Institute of Technology, Zürich, Switzerland. Available: http://www.dissertation.de/html/jungbluth__niels.htm


![Doka Catalogue[1]](https://static.documents.pub/doc/80x56/5571f30d49795947648d694d/doka-catalogue1.jpg)


