Page 1
ii
UNIVERSITI TEKNOLOGI MALAYSIA
DECLARATION OF THESIS / POSTGRADUATE PROJECT PAPER AND COPYRIGHT
Author’s full name : Abdirashid Hassan Abdi
Date of birth : 25th September 1987
Title : CLIENT SERVER APPLICATION FOR
SERVER FARM PERFORMANCE
MONITORING
Academic Session : 2011/2012(2)
I declare that this thesis is classified as:
I acknowledged that Universiti Teknologi Malaysia reserves the right as
follows:
1. 1. The thesis is the property of Universiti Teknologi Malaysia.
2. 2. The Library of Universiti Teknologi Malaysia has the right to
make copies for the purpose of research only.
3. 3. The Library has the right to make copies of the thesis for
academic exchange.
Certified by:
SIGNATURE SIGNATURE OF SUPERVISOR
P00076735 DR ISMAIL FAUZI ISNIN
(NEW IC NO. /PASSPORT NO) NAME OF SUPERVISOR
Date : 21 JUNE 2012 Date : 21 JUNE 2012
NOTES : * If the thesis is CONFIDENTAL or RESTRICTED, please attach with the
letter from the organization with period and reasons for
confidentiality or restriction.
CONFIDENTIAL (Contains confidential information under the
Official Secret Act 1972)*
RESTRICTED (Contains restricted information as specified
by the organization where research was
done)*
OPEN ACCESS I agree that my thesis to be published as
online open access (full text)
Page 2
ii
“I hereby declare that I have read this project and in my
opinion this project is sufficient in terms of scope and quality for the
award of the degree of master of computer science (information security)”
Signature : ...................................................
Name of Supervisor : DR ISMAIL FAUZI ISNIN
Date : JUNE 10, 2012
Page 3
ii
CLIENT SERVER APPLICATION FOR SERVER FARM PERFORMANCE
MONITORING
ABDIRASHID HASSAN ABDI
A project submitted in partial fulfillment of the
requirements for the award of the degree of
Master of Computer Science (Information Security)
Faculty of Computer Science and Information Systems
Universiti Teknologi Malaysia
JUNE 2012
Page 4
ii
I declare that this project entitled “Client Server Application For Server Farm
Performance Monitoring” is the result of my own research except as cited in the
references. The project report has not been accepted for any degree and is not
concurrently submitted in candidature of any other degree.
Signature : ....................................................
Name : Abdirashid Hassan Abdi
Date : JUNE 21, 2012
Page 5
iii
“Dedicated to my beloved family and friends, without their understanding,
supports, and most of all love, the completion of this work would not have been
possible.”
Page 6
iv
ACKNOWLEDGEMENT
First and foremost, I would like to thank Allah because of His blessings; I
would be able to successfully complete this dissertation. My word of appreciation
goes to Dr Ismail Fauzi Isnin for his priceless supervision, inspiring discussion and
fruitful collaboration. I am thankful for all his invaluable hours to provide
constructive critics, enthusiasm, immerse knowledge and continuous feedback.
Without his continued support and patience, this dissertation would not have been the
same as presented here.
My thanks also extend to my friends, for their enlightening companionship
and encouragement of trudging through all the moments from down to up the hill in
the run to complete this Master program. I would not have done it without the help
and motivation from all of you.
To my family, no words can describe my gratefulness for always being there
despite of the distance. They showered me with love and compassion and enrich my
life like no other. They are the source of comfort and kept me focus the priorities in
life and therefore, this work is dedicated to them.
Page 7
v
ABSTRACT
Workstation/PC server farms have become a cost-effective solution for high
performance computing. Server farm or server cluster is a collection of computer
servers usually maintained by an enterprise to accomplish server needs far beyond
the capability of one machine. Server farms often have backup servers, which can
take over the function of primary servers in the event of a primary server failure. It is
critical and important to monitor, control, and manage servers and various resources.
To address this issue, it needs present a performance monitoring tool used for such
cluster-based on client server systems, which can monitor resources such as CPU
utilization, memory usage, disk utilization and network bandwidth from time to time.
The design of the monitoring tool enables certain flexibility and extensibility to scale
up. Information of server resource and performance will be displayed in the format
of charts, and will be refreshed within specified interval. Experiments based on a
prototype system demonstrate that the tool can measure and collect necessary data as
needed and then visualize them by certain charts, exhibiting feasibility and good
usability.
Page 8
vi
ABSTRAK
Stesen kerja atau ladang pelayan telah menjadi penyelesaian yang kos efektif
untuk pengkomputeran yang berprestasi tinggi. Ladang pelayan atau pelayan
berkelompok adalah gabungan pelayan komputer yang biasanya dikendalikan oleh
syarikat untuk mencapai keperluan pelayan jauh di luar kemampuan sebsah mesin.
Ladang pelayan sering mempunyai salinan pelayan dimana ia boleh mengambil alih
fungsi pelayan utama apabila pelayan utama mengalami kerosakan. Ia adalah kritikal
dan penting untuk memantau, mengawal dan menguruskan pelayan dan sumber-
sumber yang lain. Untuk menangani masalah ini, ia memerlukan system aplikasi
pemantauan prestasi yang digunakan kepada sekelompok pelayan, yang boleh
memantau pelbagai sumber seperti penggunaan CPU, penggunaan cakera dan
rangkaian lebar dari semasa ke semasa. Rekabentuk sistem aplikasi pemantauan
prestasi ini membolehkan flesibiliti dan kebolehpanjangan skala meningkat.
Maklumat akan dipapar dalam format carta dan akan disegarkan dalam selang masa
tertentu. Eksperimen berdasarkan kepada sistem prototaip yang menggambarkan
system aplikasi ini boleh menilai dan mengumpul data yang berkaitan dan
digambarkan ke dalam bentuk carta dan menunjukkan kebolehgunaan yang baik.
Page 9
vii
TABLE OF CONTENTS
CHAPTER TITLE PAGE
DECLARATION ii
DEDICATION iii
ACKNOWLEDGMENT iv
ABSTRACT v
ABSTRAK vi
TABLE OF CONTENTS vii
LIST OF TABLES xi
LIST OF FIGURES xiii
LIST OF APPENDICES xv
1 RESEARCH OVERVIEW
1.1 Introduction 1
1.2 Problem Background 3
1.3 Problem Statement 5
1.4 Project Aim 5
1.5 Objectives of the project 5
1.6 Scope of the project 6
1.7 Organization of report 6
2 LITERATURE REVIEW
2.1 Introduction 8
2.2 Background Study of the Research 10
Page 10
ix
2.3 General issues on a server farm 11
2.3.1 Multiple cable system in one physical 13
2.3.2 Inspection of Traffic Don’t Change the Requirements 16
2.3.3 High availability Becomes Even More Critical 17
2.3.4 Planning Capacity is hard 19
2.3.5 Virtual Machines Mobility makes difficult Security 22
2.3.6 Security Virtualizing goes with Servers Virtualizing 23
2.4 Basic Concepts of Performance Measurement 25
2.4.1 Performance parameters 27
2.4.1.1 CPU utilization 27
2.4.1.2 Memory Utilization 27
2.4.1.3 Disk usage 28
2.4.1.4 Network bandwidth 29
2.5 System Monitoring 31
2.5.1 Monit Tool 31
2.5.2 Nagios Tool 33
2.5.3 Ganglia Tool 34
2.5.4 Card Tool 36
2.5.5 Parmon Tool 36
2.7 Chapter Summary 41
3 RESEARCH METHODOLOTY
3.1 Introduction 42
3.2 Operational Framework 42
3.2.1 Analysis tools of monitoring servers 46
3.2.2 Data Analysis Methods 46
3.2.3 Project Schedule 46
3.2.4 Prototype methodology 46
3.3 Use case of the proposed tool 48
3.4 Software And Hardware Requirements 53
3.4.1 Software Requirements 53
3.4.2 Hardware Requirements 54
3.5 Summary 55
Page 11
x
4 DESIGN PHASE
4.1 Introduction 56
4.2 Architecture of proposed system 57
4.3 Proposed Tool flowchart. 59
4.4.1 Server side flowchart 59
4.4.2 Client side flowchart 60
4.4 Monitoring Nodes 61
4.5 Techniques and Algorithms of the Proposed Tool 62
4.5.1 Client side algorithm 62
4.5.2 Server algorithm 64
4.5.3 Registered User and Organization algorithm 65
4.6 Retrieving Data 67
4.7 Design of proposed system 68
4.8 Chapter Summary 69
5 IMPLEMENTATION AND RESULTS
5.1 Introduction 70
5.2 Testbed for the Proposed Tool 71
5.2.1 Test Case 1 72
5.3 Server farm monitoring tools and proposed tool comparison 83
5.8 Chapter Summary 84
6 Conclusion and Recommendation
6.1 Introduction 85
6.2 Concluding Remarks 85
6.3 Contributions 87
6.4 Future works and recommendation 88
6.8 Chapters Summary 89
REFFERENCE 90
APPENDIX A 95
Page 12
xi
LIST OF TABLES
TABLE NO TITLE PAGE
2.1 Causes of high performance consumption for server farm 30
2.1 Comparing core functions in different monitoring tools 39
2.2 Comparing mechanisms in different monitoring tools 40
3.1 Details of operational framework 44
3.2 Use Case Description for client module 50
3.3 Use Case Description for server module 52
3.4 Software requirements 53
5.1 Comparison core functions of existing tools and proposed tool. 83
Page 13
xii
LIST OF FIGURES
FIGURE NO TITLE PA
GE
2.1 Literature review map 9
2.2 Overview of monit 32
2.3 An overview of Nagios 33
2.4 Ganglia architecture 35
2.5 PARMON architecture 38
3.1 Project Operational Framework 43
3.2 System prototyping 47
3.3 Evolutionary Prototyping 48
3.4 Use Case Diagrams for client side 49
3.5 Use Case Diagrams for server side 51
4.1 The architecture of the proposed tool 57
4.2 Flowchart of server side on proposed system 59
4.3 Flowchart of client side on proposed system 60
4.4 Pseudo code of the client 63
4.5 Pseudo code of the server 64
4.6 Registered User and Organization Algorithm 66
4.7 Code to get available Memory and CPU usage 67
4.8 Design of server side of proposed tool 68
5.1 Configuration of testbed 71
5.2 Main interface of the central monitoring 73
5.3 Adding New Client 74
5.4 Client list form 74
Page 14
xiii
5.5 Choose client form 75
5.6 Choosing performance type 76
5.7 Performance monitoring 77
5.8 Removing Counter 78
5,9 Change color 79
5.10 System information 80
5.11 CPU information 80
5.12 Memory information 81
5.13 Disk information 82
5.14 Network Bandwidth 82
Page 15
xiv
LIST OF APPENDICES
APPENDIX TITLE PAGE
A Gantt chart
95
Page 16
xv
CHAPTER 1
PROJECT OVERVIEW
1.1 Introduction
Now days every business linked to the Internet and also managing and
organizing e-business within each application, these applications are often prepared
within server farm. Server farm is a collection of servers or clusters in a secure; who
an internet seats vital needs on servers, to perform a solid reliable well-organized
service to clients. Servers must be flexible to failures, also able to hold significant
numbers of requests, and able to answer those needs fast. A server farm also known
as group of computers that helps the needs of organization that are not easily met by
single computer. These computers are placed in single house or housed different in
locations(Heo et al., 2011).
In 1980s can improve the performance of the computer by creating more
capable processors and quicker believed by several computer scientists. But in 1990s,
the concept of clustering was challenging this idea (Buyya, 2000), which
fundamentally means interconnecting two or more computers to achieve shared
functions as a single system. Actually the computers are extremely connected to each
other and collectively support the server needs and handle additional load that is
placed on the server. This additional load is distributed among the different farm
computers and different server components. So, it provides computing power for
advanced needs
Page 17
2
However most of server farms contain a primary and back-up system so that
if the main server goes down then the back-up system will prevent shutting down
your companies services (Hai Huang, 2009).
Early time server farms were used mostly in academic and research services
but has changed. But know universities and all companies are using server farms.
Though a mainframe can house up more than hundreds of virtual machines and eat
less energy. They are also easy to manage and maintain when it use server farms an
experts needs to fix physical problems while the mainframes is mostly likely a
software issues. However a large server farm wants a lot of cooling systems and
extremely large amount of power. For this reason, server farm is measured by
performance per watt rather than performance per processor.
A server farm present several advantages such as the following:
i. Delivery data is very fast and reliable
ii. The capacity is high
iii. Flexibility and scalability
iv. Cost effective physical placement and simplified
v. Secure remote management
vi. No single point of failure Redundancy
The goal is to give up server farm infrastructure (hardware, software, or both)
to the expectations of many computers and a single system Thus, back users can use
without knowing the computer that really works. Monitor a daunting task and
difficult since the workstations are designed to work as a typical stand-alone and not
part of a workstation. Can be facilitated by software systems that hold up the
watching of the whole systems at various levels by providing a graphical user
interface and integrated interface.
Page 18
3
1.2 Problem Background
Building a server farm is not easy there are a lot of challenges. One of the
most important issues is to make sure that the building is equipped with enough
power to handle the load of all the new devices that are planned to be installed.
Not only does the power need to be present, but it need also to be tested to
make sure that there are not frequent surges or sags which would cause the hardware
to shut-down and restart. The result of this is loss of data and possibly ruined
equipment. The data center is the core of every business that holds the assets and
applications that are often subjected to electronic attacks. The result of attackers
against a server farm will become losses of business for e-commerce that includes
business to business applications. Data centers are the end point where malicious
attacks take place. To protect the data center from Electronic attack is crucial for any
business.
However electronic attack can influence an increasing number of data server
centers and computers yearly, the issues of security in the server farms source of
general concern for large and small businesses. Protecting assets and data effectively,
the data centers will be free from malicious cyber attacks.
The basic types of security issues of the server farm is a denial of service
(DoS), reconnaissance, intrusion attacks, and malicious code copies and worms.
DOS Denial of service can influence all the data centers that will avoid the allowed
users for finishing easy business.
An attacker such intrusion can steal sensitive information. While the misuse
or abuse poll pirates steal and copy fingerprint server, this technique can be used
once. A self-duplicating program which can externally damage called worms, May
be left a denial of service and compromised servers for the risk of hackers with the
form of the back door. Hackers can use the code for those who request copies decode
Page 19
4
Passwords, select the files that hold secret information. Hackers who use code
copying can issue commands, decipher passwords and locate files that contain
confidential information.
The manageability also becomes principal important, while today in data
centers usually consist of hundreds or even thousands of nodes. The high-
performance systems differed significantly from today's heterogeneous machines
from the earlier period and now countenance the similar set of issues, and those large
spread systems. One of the main issues countenanced by high-performance systems
and distributed non-observation of the system state.
Due to a great enough of the contract and the linked computational,
applications placed I/O and network demands, failures in great scale systems turn
into commonplace. Treating hub wear and to maintain or keep up the health of the
system, the monitoring tool should be talented to fast identify errors so that it can be
repaired either through out-of-band means (e.g. restart) or automatically. In large
systems, the communication between a countless of computing nodes, it can be
complex links, storage devices network and switches.
Data center needs monitoring tool that arrests a part of these connections and
presented in ways that are interesting and often lead to a better understanding of the
behavior of the macroscopic.
A high quality tool of monitoring can help here as well as long as a worldwide view
of the system, which can be obliging in recognizing problems of performance and,
eventually, supplementary planning capacity.
The priority for administrators is to provide IT resources and services when
and where they’re needed. The question is, how?
Page 20
5
1.3 Problem Statement
Although server farm is a collection of servers or clusters, every server need
to be managed individually and secured. The question is how to monitor large
number of machines, it is critical and important to monitor and control servers and
various resources. Of course there are several Monitoring Tools such as Ganglia,
PARMON, Monit, Nagios and Card but they are all huge, which would consume a
lot of system resource when running and their architecture is complex.
1.4 Project Aim
The aim of this project is to develop a prototype client server base of resource
and performance monitoring tool for server farm. It can monitor and obtain
information and the status of the underlying resources of each server in the server
farm, such as CPU, Memory, disk utilization and network, and also visualize all
those information through graphical user interface (GUI).
1.5 Objectives of the Project:
1. To analyze available tools of resource and performance monitoring for Server
Farm.
2. To design and develop prototype of resource and performance monitoring for
Server Farm.
3. To test prototype of resource and performance monitoring for Server Farm.
Page 21
6
1.6 Scope of the Project
1. The analysis will be conducted mainly with tools about resource and
performance monitoring for sever farm.
2. The prototype will focus on monitoring resources and performance of the
servers such as such as CPU utilization, memory usage, disk utilization and
network bandwidth from time to time on demand.
3. The prototype will be using as front end C# .
1.7 Organization of Report
This project consists of five chapters. These chapters are organized according
to different works that involved in this study. The detailed organization of this
project is described in following paragraphs. This section presents how this report is
organize in different chapters.
Chapter 1 of this project consists of overview of the project, problem
background, problem statement, objectives, scope and Aim of this project.
Chapter 2 of this report presents a review of the literature related to the area
of management of server farm. It discusses monitoring tools in details that includes
Ganglia, PARMON, Monit, Nagios and Card.
Chapter 3 consists of wide description on project methodology, which
provides a full discussion about the flow of this project. This includes how the
operational and experimental work has been carried out for the study.
Chapter 4 discussed architecture and designs of proposed prototype in detail.
Designs include both the design of client-server system and the design of
Page 22
7
performance monitoring tool which has four critical functions such as CPU
utilization, memory usage, disk usage and network bandwidth.
Chapter 5 is the conclusion of overall chapters and future works in the
related area of monitoring and controlling server farm performance will be discussed.
This includes recommendations for further study.
Page 23
8
CHAPTER 2
LITERATURE REVIEW
2.1 Introduction
This chapter of literature review will help the researcher to provide a high
level of knowledge in the research area. The job of literature review is to probe
into areas that are of interest to the research study.
The researcher will be able to organize and present the research study. For
example, the literature review provides the reader real understanding of the
subject knowledge and better evaluation of the research study flow. The
following figure 2.1 shows diagram of the literature review.
Page 24
8
Figure 2.1 Map of Literature Review
Nagios
Monitoring resource
and performance
tools
Server farm
PARMON
Card
Monit
Ganglia
Literature Review (Chapter 2)
Resource and
Performance
Monitoring
metric
CPU Usage
Memory
Usage
Disk
Utilization
Network
bandwidth
Virtual Machines Mobility
makes difficult Security
General issues on
server farm
Security Virtualizing leaves
Server Virtualizing
Multiple System
one physical wire
Traffic Inspection
Requirements Don’t change
High Availability Becomes Even More Critical
Planning Capacity is hard
Page 25
10
2.2 Background Study of the Research
The Internet seats vital needs on severs, to perform a solid reliable well-organized
service to clients. Servers must be flexible to failures, also able to hold significant
numbers of requests, and able to answer those needs fast. A server farm also known
as association of computers that helps the needs of society that are not easily met by
individual computer. These computers are placed in individual firm or housed
different locations (Jayasinghe et al., 2011).
Building a server farm is not easy there are a lot of challenges. One of the most
critical issues is to make sure that the building is equipped with enough power to
handle the responsibility of all the new devices that are planned to be installed
(Gandhi et al., 2009).
Not only does the power need to be present, but it needs also to be tested to
make sure that there are not many surges or sags which would cause the hardware to
shut-down and restart. The result of this is loss of data and possibly ruined things. All
the wires of power even the ground wire should be tested to see if it goes all the way
back to the main circuit breaker. When it doing all standard testing it is the time to
consider another problem which would be keep the equipment resources(Niyato et
al., 2009).
Another issue in implementing a server farm would be to evaluate the
company’s expectations or needs for the future and present. Mostly focusing on how
much storage space is needed to support daily functions. The data center is the
purpose of every organization that holds the assets and applications that are often
subjected to electronic attacks.
Page 26
11
The result of attackers against a sever farm will become losses of critical
information for e-commerce that includes application of business to another business.
Data centers are end points where malicious attacks take place. To keep these attacks
are perfect for every business (Gandhi et al., 2010b).
2.3 General issues on a server farm
There are plenty of challengers when building a server farm for the first time. To
make sure is one of the mainly issues that the property is equipped with enough
power to handle the pressure of all of the new devices that are planned to be installed
(Heo et al., 2011).
Not only does the nation need to be present, but it needs to develop test and
ensure that there are not many surges or sags which would cause the hardware to shut
down and restart. This would result in lost data and possibly ruined equipment. The
ground wire should also be tested so as understand weather it all the way back to the
main circuit breaker.
After doing all the large testing it’s time to worry yet another problem which
would be to keep the equipment resources from the unavoidable fluctuations in
power. Even though the input power was tested for major stake and sags it will not
count for small fluctuations that will in fact destroy a system(Gandhi et al., 2010a).
Many people think that surge protectors are the way to go in which that that the
truth never be further. If a surge protector receives are generally stake and pops to
save the production hardware it does not always disconnect the power entirely,
leaving it vulnerable to another point.
Page 27
12
A good idea would be to invest in an Uninterruptible Power Supply. This will ensure
proper protection from surges and also provide a battery backup so that the system
will stay connected in case of a power outage.
Some Uninterrupted Power Supplies are set to automatically shut down so when the
batteries do run out of power there would be no unsaved data loss while others are
set to notify a trough to shutdown manually. If the server system is expected to
remain twenty four hours online a day and seven days a week then it may be wise to
invest in a generator large enough to warrant the entire room. Another problem in
implementing a server farm would be to evaluate the company’s expectations or
needs for the future and the present (Zhang et al., 2010).
Mainly focusing on how much storage space is needed to support daily functions.
This need is directly related to how big a server room needs to be. The equipment
needed can get quite complicated so ample space is required. On top of a big enough
space to keep the stuff there needs to be sufficient ventilation.
All the electronic devices in the server room dissipate heat and that heat needs to be
redirected out of the room. So a room in the middle of a building may not be the best
choice to make. It would be a lot easier to add more authority if needed and to
establish ducting to freshen a area that is on one of the sides (Li et al., 2009).
Today’s data centers the strongest attribute is virtualization of servers. Come
down to frames of servers into cheaper, smaller and more powerful the main
direction for every organization is virtual machine farms, saving hardware device,
power consumption, and air-conditioning capacity (Chunhong et al., 2008).
Page 28
13
2.3.1 Many cable systems in one physical
Most important difference between physical and virtual environment is the
failure of one network cable to join the physical server model of use and system
security manager. Although security policies are not necessary that every server has
its individual connection to the network business, the reality is that most projects can
benefit from the safety of the physical separation among the servers.
After that, very much difference between the actual servers simplify the
design, makes it easy to separate safety. There are many applications on multiple
servers with dissimilar security configurations will all appear on the same server, and
"wire" to exit from this server no longer gives us the physical separation(Saboori et
al., 2010).
The great thing in this case is that it is easy to solve. The Company may use
different types of tools used by VLAN, to provide the same level of security chapter,
which has always been. In other words, the firewall institutions familiar with CAN
(usually!) can be upgraded to handle the virtual server is very simple. Business is not
no need to change the way creating a basic security policy, for its own firewall
technology, which serves as a safety barrier for the year should continue to serve
them in a virtual environment on the wall vendor performance and ability to handle
this load. (This is another issue, but separately.), Have heard of the decision makers
that are already on the cart or go to the default virtual conference safely on a
proposal to transfer the security barrier in the virtual machine itself.
In other words, suggested the use of software-based security services to
virtual replacement of physical security. Virtual security tools can interact with the
system's infrastructure and a realistic model to confirm one-system/one-
application/one-wire least about.
Page 29
14
The idea that the installation of safety equipment, often to the virtual server, it
is determined that more than logic separation and control (Jin et al., 2007). It's an
interesting idea, and sure as if moving in the right direction. Unfortunately, the
majority of companies to avoid this way the plan to default immediately, four
reasons (Snyder, 2008):
1) And the near certainty of limited value. Met the software firewall can run
in a virtual machine, and some providers do not do more to increase the
effectiveness of a virtual environment. But the only standard product
upgrade security in a virtual environment without hooks and clear in the
hypervisor does not help to define the default project and limit the choice
of a. Virtual security services are very useful, there must be a real
integration in a virtual environment that leads to the following
reasons(Snyder, 2008).
2) Useful machine cannot be buying yet. Important features for the
security of a VPN, including knowledge of the status of each virtual
machine, especially devices that migration between servers and full
control of "virtual switches" in each virtual server . Without this hook a
hypervisor, security services can not do its job properly virtual. in the
major virtual environment, that Ware and VMsafe (to date) has an
application programming interface to enable the firewall fire properly
integrated with the hypervisor, although the Citrix and Microsoft will
most likely be the same frame soon. However, security vendors and
impose any tool that integrates seamlessly with VMsafe. This will change
quickly, but even if they are fully integrated security service did not start
in the virtual ship, and system administrators and security providers have
enough experience with them. not for the security situation in depth
infrastructure software virtual based on the new brand with an application
programming interface new, and we hope that we all work
properly(Snyder, 2008).
Page 30
15
3) Performance is unpredictable and expensive. When collocating
security services with virtual machine and other overhead costs of setting
standards and compete with the server applications to migrate to a virtual
environment. Expensive virtual server computer for general use, and if
the organization suddenly sending their virtual security team, they use
very expensive tools and resources to do something better in the hardware
on the device, have done. Security software makers have survived on their
own devices for several years, products that improve the environment -
not the traditional time-sharing one. For example, experiments that make
the standard of writing and one of the most popular security services, the
intensive use and the use of resources such as memory and hard disk that
is not balanced, giving them poor candidates for virtualization (Snyder,
2008).
If the hardware vendor uses its own security, and these shortcomings do not
matter. Sharing of security services used, resources can be devoted to other
virtual machines to be locked. More importantly, the company has now added
a terrain map of confusion in the virtual server: a new device with features
that are not known (for the company or the seller) at the time of default,
which may change at any shot in upcoming IPS signature or loaded V /
group.
4) Existing security model enterprise that way doesn’t work. The idea of
virtual security program attached in the hypervisor is interesting because
it allows for tighter control and security that is not grainy for all virtual
machines. What is interesting, but do not run this way data centers. And is
generally confined to the firewall for each system and other institutions
and reduce threats to the smaller number of larger servers from any
application environment. Most application servers are protected in small
groups or even by the actual location (such as data center cabinet / rack).
The default does not require a change in the security model at the firm
level. In reality. Unless there are changes in society are less vulnerable to
security problems if the company has spent the last 10 years building
Page 31
16
security using firewalls and IPS and other devices to reduce the threat,
they should move to the default strategy will not change suddenly the
security chain(Snyder, 2008).
However what is the alternative to deal with the various systems on the wired
one? Using traditional firewall? I worked the answer is yes, in the past, and it will
work well in the virtual world.
2.3.2 Inspection of Traffic Don’t Change the Requirements
Companies increasingly under the control of various systems to meet
regulatory and industry, as well as trying to do to manage and reduce their own risk,
Review of traffic technology such as intrusion detection and leak detection, and often
much more to meet this requirement, When we moved from physical servers to a
hypothetical situation, the need for checks passed unchanged Fortunately, the
solution of this question is easy to use the existing security services abroad. Leading
practices in this area to repeat the practice in the near future, If the institution fails to
install the SPI every server need not be present.
UTM with IPS device, and to prevent leakage to sit on a place in the network, this
copy of policies and practices is existing security. In The case where Traffic is
required to monitor the internal virtual server, and existing solutions, the instrument
can perform autonomous motion detector that connects to the virtual port
is "illegal" in the virtual switch, and capture traffic between virtual machines.
The sensor can be analyzed either directly or password, for more predictable
performance, the copy that traffic between the external Physical interface where the
traditional Inspection unit can do the job(Luo et al., 2002).
Page 32
17
2.3.3 High Availability Becomes Even More Critical
“Place every one of your eggs in the individual container-and see that container” is
generally satisfactory in a situation of virtual server that is the Mark Twain’s well-
known saying. For example the functionality of each server is achieved by reducing
number of servers, and also development of every server the value is possible impact
of any not working.
Essentially when a secret document may be physical or implied is in a way that is
untested, creating secret document highly available is perfect situation if you don’t
have already confirmed that a negligible employment creates additional argument for
programs like IPS and Firewall, and there is another reason to believe using outdoor
employment is HA. However it can be important to growth the external uses
accessibility, although is properly accepted wisdom and properly agreed. The major
danger is that the network availability also it can be justified by enhancing the
system to meet required conditions(Jayram et al., 2001).
Security architecture is the major concern for a virtualization process, though
the major concern is to incorporate technologies of active-active for services related
to firewalls compared to the easer strategy of active-passive. There are three
objectives and they are like the following:
1) Usually technology of active-active will grow well than normal reply time of
devices for the security. While an organization as speed 100 Mbps, a small
number of milliseconds alteration cannot affect them. But in context of
virtualization, it drives up uplink network connections, little changes in
functioning are enlarged higher speeds for access links of 1 Gbps and 10
Gbps. in general Using technologies of active-active decrease load on every
Page 33
18
security system while simultaneously are working, offering the chance for
improved functioning.
2) Advanced ranks of error acceptance. Through active-active configuration, a
quite number only are available during every specific part in the system. So if
there is any deficiency in any machine, device and method, only significant
amount of the net is involved by check and the likelihood of component
failure. Actually as soon as practical servers include both short stayed
connection of HTTP and also offer stayed connection of VPN, backup
connections, or sharing of files, technologies of active-active places fewer
risk than active-passive traffic. However when a high robust systems like
blade-builder systems or server farm are employed through various sharing
responsibility basics, the problem is greatly minimized The setting when a
single blade or firewall factor is reduced when it is handling 10 percent of the
traffic than when it is handling 100 percent of the traffic.
3) Theoretically, Active/active configurations and virtualized projects are
suitable for each other,. Virtualization is all about making use of well-
organized resources, ranging from physical space to hardware capacity. The
disorganization of active/passive firewalls has for long been disorganized and
this brought about a problem to security professionals. With virtualization
projects calling much larger devices, it is more suited to consider the cost
savings of using active/active and clustering technology where possible.
Whether an enterprises goes with clustering and active/active technologies or not, the
key point here is to ensure that high availability features of inline network and
security elements are easily configured and tested in any virtualization project.
A firewall is meant to protect servers but not a denial of service when a firewall
protected dozen severs, it was certainly a problem if that firewall stopped passing
traffic. When firewalls keep a dozen physical servers and a hundred virtual servers,
Page 34
19
this will amount to an overall failure of the business. Liberal use of joint aggregation,
different server ports, redundant network switches, and redundant links at all points-
along with HA clusters of security mechanism will reduce the net failure and
improve availability.
2.3.4 Planning Capacity is hard
When the default is to use more applications on the same device address, and
the network is the use of these materials will increase. Traditionally, the network is
heavy maintenance of their networks, especially in the data center, rather than for
capacity planning on the left side of each server. Removed with prices constantly on
the local network switching equipment, and can spend a lot of time at the expense of
100 Mbps and 1 Gbps and lives in distress does not deserve to simply just update
every switch in the rack Gigabit speeds and participation. If the bandwidth is less
than 1 Gigabit average server technology with remarkable efficiency(Ling and Zahir,
2002).
In the world of virtual servers, physical servers, or a group of a simple system
to saturate the link and 1 GB capacity planning, performance management and the
second is more important. Tools such as link aggregation that the reliability of the
system, from which a number of reasons, and now it is also important to bridge the
gap between the industrialized countries, the new 1 GB per second of precious and
more expensive 10 GB per second, and switch. The power supply can be used as
planned. If two virtual machines on the same server to transfer large amounts of data,
we cannot bear the weight of the network traffic.
But if one of these virtual machines to switch to other networks or other virtual
server, network traffic suddenly hit like a bomb ambitions may incur. These
dissimilarities in network performance and ability operation are also two vital
Page 35
20
insinuations for safety on the side of the sharing of default: basic services must be
adequate and must be based expansion.
Denied barely baseline to give an adequate picture of the achievements, but
there are some implicit signal about the value. Most firewalls and tools for the safety
of others are cooked on the Internet-oriented applications. in cyberspace, may
include the movement of everything instead of the failure of applications to support a
partnership or a video on the multiplayer online, The firewall on the long-term
relationship with the size of the package (or the back of the failure of the partnership,
for example) in the case, of middle of the ring. The other, the multicast performance
is less predictable.
While, according to documents provided by the data provider is a good first
step in measuring performance, and mitigation of threats, most HA active / active,
and a large number of security zones and rules to implement virtualization to take
him out of the area of comfort for most of the sheet firewall.
This suggests that instead of testing and monitoring of performance and should be
part of the plan of the project defaults. The institutions should not be surprised if the
traffic performance of them gives a. Different, higher or lower than expected.
Variable performance of the building is the safest way to ensure that security
applications that can support the current and future growth. Perhaps such features as
the process in parallel (with code based on the structure or group of devices the most
active / active are good ways to achieve this goal) Company grant from the edge for
success.
When selecting protection devices for performance, it is important to choose
the most sophisticated equipment product lines. It should be that the company did not
start with something up 1 GB per second, while providing security for the change
Page 36
21
along the way to go faster. What safety device is selected, a unique line of products
that can develop together and it is for them a variety of Gigabit speed 10 Gbps. The
company does not want a product line, or even worse, to other sources, and change
management, interfaces with complex security policies on the fly to review if they
are also at risk.
When you design security architecture for virtual environments is very large,
and companies should seek safety devices which are based on the balance of the
structure with the addition of processing elements in the structure of the car. These
types of safety devices tend to be a better world; companies increase the number of
processing elements, or timetables or by changing the deceleration speed of the
blades, if necessary.
The company does not want to buy a rolling structure of the blades on the first day,
but be able to remove the leaves and move easily reduce the amount of planning is
essential to the scope of the project increases.
Suggest a dirty instead of using the security services in the same way that
companies have more equipment probation usual in the network.
But the amount of work cannot from the virtual farm, more intelligent of the
lot, with a strong sense to develop using tools such as parallel processing
and hardware-based security structure is the best strategy.
Page 37
22
2.3.5 Virtual Machines mobility makes difficult Security
A feature of the traditional physical servers is that they tend to change
frequently. To load the application group and a group of units and to avoid any
sudden change of security policy in a number of servers is very slow. Rather the
opposite is true for virtual servers: To move the virtual machines and applications of
system administrators from physical server to physical server as part of the balance
and control. When using functions such as VMware VMotion, virtual machines
move more often in response to open the pregnancy and correction, and the system.
This movement and the application server security makes it difficult to identify (Li et
al., 2008).
Have already described this part is a chance to put a seal layer between
physical servers and security services as part of the basic design for a server farm
topology. This aggregation, which includes a large number of servers and VLAN
them in an instant and without this problem. The important point is the need for
adequate performance, and bandwidth in the security services. For larger server
farms, you may be asked for more than 1 GB link provided in bits per second or up
to 10 Gbps interfaces and interfaces to handle the load and to ensure portability
wireless. Pressure on the control and safety zone around the layer 2 hop away from
virtual machines, and will be transferred will not be a problem because it does not
change (except the MAC address of the server application) when moving virtual
machines between servers.
If the company removes a layer of product, the best solution is safer to match
the hardware configuration with support for the definition of area-based policy. In
this way, an application that is on one side of the firewall at the same time, but on the
other side on the other hand, does not need to re-design the security policy. In this
case, well-designed central management is a must. And determine security policies
for each unit do not work here.
Page 38
23
And "the urgent need for the policy management system that is nothing of the inner
movement of virtual machines. Security manager must be able to implement a policy
based on the applications and servers, instead of physical interfaces or devices,
distribution and determine recovery of this policy between security appliances.
2.3.6 Security Virtualizing goes with Servers Virtualizing
From the point of view is very high, default is simply to take the physical
servers and virtual servers grinding down. In the details, however, require much
more than that. A good default requires a lot of resources, including the ability of
multiple memories, CPUs, storage, and brings them together for greater efficiency.
Philosophically, it creates intellect for virtualization security tasks at the same
time: combine multiple security functions into a single device using this system more
efficient. Instead of a pile a stack of individual safety devices, it is best to match the
safety of the largest multi-functional unit on a farm and a large physical server with
multiple virtual machines.
Traditionally, companies refused and are often called this strategy to raise the
security UTM. Reasons in the category of best practices rather than an integrated
approach based on the LUNs UTM States are a legend in the part and a part of my
work. Since the actual scheme is fixed and clearly separated servers in racks or
curricula that provide similar results when Virtualizing a large number of servers
happened, and especially those who sit in different areas of protection, shift the
balance significantly in favor of the security services integrated UTM. The idea that
one UTM security services that can handle the various functions in all the different
sectors that are directly in accordance with the concept of virtualization (Aghajani et
al., 2010).
Page 39
24
UMTS consolidation of functions, allowing flexibility, The existence and
functions of the standard means that the motion of the virtual machine is not a
problem because mitigation technologies and security threats in place, anywhere,
anytime. UMTS also simplify the topology and distribution. Part of the difficulty of
building services applications available for a very good agreement, and all
communication between the enterprise network and application servers.
HA design of security services and one or two that provides multiple
functions is much easier than trying to ensure that all paths through all unnecessary
devices properly, scalable and available. With UTM in place and the institution has
the greatest ability to publish simplified.
To find devices UTM, who are ready to develop projects in virtual
environments is difficult, Also shown a past experience, creating and UTM devices
for many small businesses, the environment of medium and small office and home,
and have sufficient flexibility to support the operation of the company. The following
table shows some key areas to focus on the choice of UTM device for managing the
virtual environment.
2.4 Basic Concepts of Performance Measurement
It can be observed in the system behavior by changes in system status. Any
change in the system status reports neither the beginning nor the end of a given
activity (or inactivity) components in the system (a hardware component, a
component of the program or process). Any change in the state system, as was the
case: There is a transition from one state to another system, if certain conditions are
met. Devices to facilitate access to information about the changes in the system, the
current model of the devices that rely on information about individual components
and their interaction desired. In particular, one can not know how often is the
implementation of a particular process (for example, the number of times you entered
a particular state.) In this case, it is necessary only to detect the occurrence of the
Page 40
25
event and include the receipt of the statement significantly. Some examples of this
type of measurement are as follows: count tests on each disk, by measuring by
counting the night in a way to reduce the frequency of page faults, to measure the
frequency of memory parity error.(Yuanyuan et al., 2008).
It was available in the frequency of an event by dividing the number of
incidents that have accumulated along the period, interest. A more difficult and
include the synchronization of activities observed. The simplest case is to determine
what percentage of the average time for the system in a particular country.
Traditional measures of the channel and the CPU or I / O and used at the same time
(overlapping) channel CPU and L / S in this category. Finally, the most difficult
problem is that while individual cases of a particular activity, ie, to measure when it
enters a particular state, and the time that the system remains in this state. An
example of this type of problem is to measure the distribution of service time for the
processor, or the interval between the measurement errors, such as parity error,
disruption of the head disk memory.
In all three cases, and assumes that it is possible to detect changes in the state.
In fact, for the second category, it is not necessary to reveal exactly when the status
changes, in many cases, these types of measurements of samples from the second
state of the system. In response to a question about the status of the system at any
given time, at random, in the sense that nothing to do with these points on the
activities of the time measurement. Each monitors, as will or will not find in the case
of the system corresponding to the measurement of the activity. If he spent the
percentage of time in this case, to determine the percentage of successful
observations (the system was in a state of interest) for a number of observations.
It should be noted that the timers monitor the performance of the implementation of
this method. Since the sampling rate is generally very high (1 MHz - 10 MHz), it is
possible to convert a number of observations over time with high precision.
Page 41
26
However, if the measures taken by the programs that have been implemented
in the systems investigated, the sampling rate remains relatively low because the
costs associated with them, it is best to use the direct method is described below,
When the direct method is very simple. Reading hour when measuring the activity
begins and again when you're done.
The difference between the readings and the center of activity is measured. This
method requires, of course, can be detected from the events at the beginning and end
of each body. It was also assumed that there is adequate time with accuracy, and can
be accessed easily, and which appear on the screen for certain activities.
2.4.1 Performance parameters
2.4.1.1 CPU utilization
CPU utilization is a key performance metric. It can be used to track CPU
performance regressions or improvements, and is a useful data point for performance
problem investigations. It is also fairly ubiquitous; it is reported in numerous places
in the Windows family of operating systems, including Task Manager (taskmgr.exe),
Resource Monitor (resmon.exe), and Performance Monitor (perfmon.exe) (Xiaorui et
al., 2009).
The concept of CPU utilization used to be simple. Assume that there is a
single core processor fixed at a frequency of 2.0 GHz. CPU utilization in this
scenario is the percentage of time the processor spends doing work (as opposed to
being idle). If this 2.0 GHz processor does 1 billion cycles worth of work in a
second, it is 50% utilized for that second, fairly straightforward (Bridges et al.,
1992).
Page 42
27
2.4.1.2 Memory Utilization
Although the principle for estimating the service time for memory is the same
as that described in Resource Utilization and Performance,, it use a different formula
to estimate the performance impact of memory utilization than you do for other
system components. Memory is not managed as a single component such as a CPU
or disk, but as a collection of small components called pages. The size of a typical
page in memory can range from 1 to 8 kilobytes, depending on the operating system.
A computer with 64 megabytes of memory and a page size of 2 kilobytes contains
approximately 32,000 pages (Kundu et al., 2010).
When the operating system needs to allocate memory for use by a process, it
scavenges any unused pages within memory that it can find. If no free pages exist,
the memory-management system has to choose pages that other processes are still
using and that seem least likely to be needed in the short run. CPU cycles are
required to select those pages. The process of locating such pages is called a page
scan. CPU utilization increases when a page scan is required (Ramamoorthy and
Wah, 1981).
Memory-management systems typically use a least recently used algorithm to
select pages that can be copied out to disk and then freed for use by other processes.
When the CPU has identified pages that it can appropriate, it pages out the old page
images by copying the old data from those pages to a dedicated disk. The disk or disk
partition that stores the page images is called the swap disk, swap space, or swap
area. This paging activity requires CPU cycles as well as I/O operations.
2.4.1.3 Disk usage
Disk usage is the amount of space in a specified directory on a computer disk.
Disk usage results are usually based on the du command. Disk usage will display the
Page 43
28
total number of directories within the domain’s online space and is calculated in
kilobytes (KB). Disk usage also shows the entire directory paths in which files are
contained. The most commonly used command for monitoring disk space usage is
/usr/bin/df, which, by default, displays the number of free blocks and files on all
currently mounted volumes. Alternatively, many administrators create an alias for df
in their shell initialization script (for example, ~/.cshrc for C shell) like df -k, which
displays the amount of free disk space in kilobytes (Ohyama, 1994).
2.4.1.4 Network bandwidth
In computer networks, bandwidth is often used as a synonym for data transfer
rate - the amount of data that can be carried from one point to another in a given time
period (usually a second). This kind of bandwidth is usually expressed in bits (of
data) per second (bps). Occasionally, it's expressed as bytes per second (Bps). A
modem that works at 57,600 bps hastwice the bandwidth of a modem that works at
28,800 bps. In general, a link with a high bandwidth is one that may be able to carry
enough information to sustain the succession of images in a video presentation. It
should be remembered that a real communications path usually consists of a
succession of links, each with its own bandwidth. If one of these is much slower than
the rest, it is said to be a bandwidth bottleneck.
In electronic communication, bandwidth is the width of the range (or band) of
frequencies that an electronic signal uses on a given transmission medium. In this
usage, bandwidth is expressed in terms of the difference between the highest-
frequency signal component and the lowest-frequency signal component. Since the
frequency of a signal is measured in hertz (the number of cycles of change per
second), a given bandwidth is the difference in hertz between the highest frequency
the signal uses and the lowest frequency it uses. A typical voice signal has a
bandwidth of approximately three kilohertz (3 kHz); an analog television (TV)
Page 44
29
broadcast video signal has a bandwidth of six megahertz (6 MHz) -- some 2,000
times as wide as the voice signal.
The following table illustrates possible causes of high performance consumption for
server farm.
Table 2.1 shows causes of high performance consumption for server farm.
Causes Description
Application processes Process spawning lots of threads in high load condition
where there is no throttling at all. This can cause unusually
high CPU consumption just because of the unexpected load
on the application. This will generally consume the CPU
cycles available on the machine.
Other processes not
application process
This may be due to totally unrelated processes like batch
jobs, alerting jobs, cron jobs etc
System/OS processes Operating system has scheduled jobs/processes that can be
consuming high CPU for a particular time period. Generally
these processes run with higher priority (nice value) then
other regular application processes that may lead to
consuming high CPU.
many users are using the
application at the same
time
Several users are using application same time so this
generally will consume high memory.
External process External process clients can cause consuming more memory
many indexed items Too many indexed items in one index column caused by
unplanned increase in crawled content or changed type of
content
Query matching When the indexer and query matching components are
Page 45
30
component installed on
the index server but the
query matching
component has been
stopped
running on the same server, the query matching component
is responsible for deleting old index sets as it is activating
new sets. If the query matching component has been stopped
but the administrator has not suspended indexing, the
indexer will continue to produce new index sets based on
crawled content. As the query matching component is unable
to delete the old index sets, the disk usage will increase over
time.
Insufficient bandwidth Sometimes, a network just doesn't have the throughput it
requires. When a network does bog down, several options
typically exist for increasing capacity. Besides boosting up-
and downstream speeds
DNS errors DNS configuration errors can lead to numerous network
failures and generalized slow performance.
Spyware infestation Spyware, the scourge of the last few years, finally appears to
be meeting its match in business environments. The
development of potent anti-spyware tools, combined with
effective end user policies, is reducing the impact of
spyware in many organizations
Virus
A computer virus can cause a memory loss and other
problems. Viruses attach to files on your computer, causing
them to require more memory than normal.
2.5 System Monitoring
System monitoring is essential and is one of the most important responsibilities
that a system administrator has. Its aim is to be able to know at every moment what
is happening in the system, to detect the problems.
Page 46
31
2.5.1 MONIT (UNIX Systems Management) Tool
One of the famous managing and monitoring tools, Monit, it monitors
processes, file, directories and devices on UNIX system. Automatic maintenance is
conducted by monit and can execute meaningful causal actions in error situation. For
instance monit can start a process restart a process if does not run, respond and stop a
process if it uses too much resource. To monitor files, directories and devices it may
use MONIT for changes, such as timestamp changes, checksum changes or size
changes (MONIT, 1998).
However, control file can be configured based on free format monit, it is
controlled via an easy, token syntax oriented. Syslog logged by Monit or to its own
file of log and informs the conditions about error via alert messages of customizable.
Monit uses Many TCP/IP to carry out protocol checks, network checks and SSL
utilize for such checks. A HTTP(S) interface is provided by monit and to access the
monit server can use a browser
Figure 2.2 overview of monit
Page 47
32
2.5.2 Nagios
NAGIOS is one of tool that monitors the other network computers or
components status. It can monitor the network and it alert when effects happen. For
example if fails one the computers or the responding stops someway, Nagios will
send page an email, or allow to know in various ways. However the current status
shows a web page Nagios monitoring all the systems because Nagios has many
abilities, to set up can be complex.
Figure 2.3 an overview of Nagios.
Page 48
33
2.5.3 Ganglia Tool
Another scalable distributed monitoring system for high performance
computing systems such as clusters and Grids is Ganglia. The design is based on
hierarchy, federations of clusters is the target of ganglia. It relies based
listen/announce protocol on a multicast to monitor clusters state and a tree of point-
to-point used by ganglia, amongst connections delegates nodes of cluster to count
clusters and federate them, It widely leverages used technologies such as, XDR for
portable, compact transport data, XML for representation data and RRD tool for
visualization and storage data. There are achievement overheads when structures of
data and the algorithms on individual system are accepted high concurrency. The
implementation is healthy, ported to an wide set of operating systems and
architectures of processor, and is now in use on more than 500 clusters about the
world (Massie et al., 2004).
Ganglia are based on a hierarchical design targeted at federations of clusters
(Fig. 1). It relies based listen/announce protocol on a multicast to monitor clusters
state and uses connections of a tree of point-to-point between cluster of
representative nodes to clusters of federate and their state aggregation. Within each
cluster, Ganglia use on a well-known multicast address heartbeat messages as the
foundation for protocol of a membership. Membership is claimed by using the
heartbeat reception as a sign that the non-reception and available node of a heartbeat
over multiple of a small of a periodic interval announcement as a sign that
unavailable node. Each node monitors its local resources and sends multicast packets
containing monitoring data on a well-known multicast address whenever significant
updates occur. Applications may also send on the same multicast address in order to
monitor their own application-specific metrics.
Page 49
34
Ganglia distinguish between built-in metrics and application-specific metrics
through a field in the multicast Packets of monitoring will sent. All listening nodes
for both types of well-known address multicast metrics and gather and maintain
monitoring information for every node. Therefore, always all nodes have an
estimated view of the cluster’s state entire and this state is reconstructed easily after a
crash (Massie et al., 2004).
Figure 2.4 Ganglia architecture
Ganglia federate multiple clusters together using a tree of point-to-point
connections. All entities in the domain been federated are clustered before exiting, on
the other hand system on the high hierarchy specify aggregation points. Since, the
monitoring data of the cluster is copied on each system, the outgoing computer
represent a distinct cluster in a logical manner otherwise they represents a set of
clusters. (We specify multiple cluster nodes for each leaf to handle failures.) The
counting of each portion of the set is done in a timely interval.
Page 50
35
Monitoring data from both leaf nodes and aggregation points is then exported
using the same mechanism, namely a TCP connection to the node being polled
followed by a read of all its monitoring data.
2.5.4 CARD
CARD (Cluster Administration using Relational Databases) is system for
monitoring large clusters of cooperating computers. CARD scales both in capacity
and in visualization to at least 150 machines, and can in principle scale far beyond
that. The architecture is easily extensible to monitor new cluster software and
hardware. CARD detects a fault and determines the best way of recovery in a
systematic form. CARD uses a Java applet as its primary interface and it allows
internet users anywhere to use their browser to monitor the cluster (Patterson, 1997).
While monitoring large clusters; CARD identified four different problems
and the countermeasures. Initially they try to figure out the evolution of software and
hardware in a cluster. Secondly is the issue of fault tolerance mechanisms in the
cluster and the corresponding software. Thirdly is the explanation on how they
increase data scalability. Finally they explain how they display the statistical display
of information from a large number of systems (Patterson, 1997).
2.5.5 PARMON
PARMON allows the user to monitor system activities and resource
utilization of various components of workstation clusters. It monitors the machine at
various levels: Component, node and the overall level of the system displaying a
system image as individual. PARMON the administrator of the system lets
monitoring of the following functions
I. Utilization of system resource aggregations
Page 51
36
II. Activities of process.
III. Activities of system log.
IV. Activities of the kernel.
V. Many requests as similar source.
PARMON lets the client describe actions that trigger certainly when a party
condition is satisfied. It offers logical and physical outlooks of the of the system
components. The PARMON key features include the following (Buyya, 2000).
I. Development exploits of most modern technologies, software and
hardware features for imaging and communication.
II. Lets the user to build the structure of the database (groups and nodes)
includes the name of the node, interfaces of communication, and specific
unit to monitor the disk.
III. Holds recording details of the structure and configuration of the machine
to complete nodes of a cluster.
IV. Lets the system instrumentation of resources like a CPU, memory,
network and disk, and their parameters, both micro at and macro level.
V. Holds cluster monitoring at level of node, set of group or set of total
system, and therefore exhibits a single image of the system.
VI. Lets the performance equivalence of chosen operations on a family or
individual of workstations, interactive reference and real-time monitoring
(e.g. Memory, processor, network and disk utilization), and maintenance
of the normal tasks like cluster or node shutdown.
VII. The client PARMON is moveable of all programmed stages supporting
structure of Java runtime, JVM (Java Virtual Machine) and server
PARMON is moveable of running machines Linux or Solaris.
In PARMON there are parmon-server and parmon-client. The model of
system as shown in Figure 2.9 continue to the client–server case with monitoring
nodes acting as servers and systems of monitored or user-position acting as clients.
Page 52
37
The nodes of the cluster are able to monitor from any PC, workstation, or the cluster
node itself. The server of PARMON is weighted nodes that require monitoring
(Buyya, 2000).
Requests of the client the parameters values through passing message and
gets the answer of the server in messages form. The messages interpreted by the
client and converted them into proper format visualization of graphical. A client can
monitor selectively observe a few nodes of the group or all the nodes.
The cluster theory is supported by effective monitoring. A group kind of
group nodes are elected based on the resources allocation to different set of users.
Such a method of a grouping helps in collecting and monitoring statistics of the
usability, with which the administrator of the system can change the allocation
strategy of the resource.
Figure 2.5 PARMON architecture
PARMON is planned to take independent of other system monitoring; it a
easy method uses (there is no any protocol standard) for transferring data between its
servers and clients.
The layer of transport consists of sockets connected (TCP/IP) streams and the layer
of software uses messages character and strings. Required monitoring data is
retrieved by the client from the running server on the nodes of the cluster by
exchanging messages. The message normally requested by the client contains an
indicating etiquette what it is looking for. The reply message of the server contains a
strings of series, whose varies distance from one type of application to another.
Page 53
38
The following Table 2.1 shows comparing core functions in different
monitoring tools such as Ganglia, Parmon, Monit, Nagios and Card.
Table 2.2: Shows comparing core functions in different monitoring tools
Number of monitoring tools has been developed for high performance
computing PARMON is one of the most familiar who allows the user to monitor
system activities and resource utilization of various components of cluster’s
workstation. Also Ganglia is popular toolkit for systems of cluster and grids, which is
based on a hierarchical design. It exploits a multicast-based listen/announce protocol
to monitor states within clusters. In Ganglia architecture, a tree of TCP
(Transmission Control Protocol) connections between multiple daemons can
aggregate monitoring information for multiple clusters.
In monitoring tools is a critical and important task to monitor performance of
the servers From Table 2.1, out of 12 functions, there are four functions that can
successfully embed 100% of monitoring tools. These four functions are “CPU
activity”, “Memory activity”, “Disk activity” and “Network activity”. Process
Page 54
39
activity function all tools were embedded except Nagios tool. However there are also
other functions that are embedded some of the tools such as device activity all the
tools were embedded except Ganglia and Nagios.
Table 2.3: Shows comparing mechanisms in different monitoring tools
It need to identify the mechanisms of those tools like Ganglia, CARD,
Parmon, Monit and Nagios table 2.3 shows that the PARMON is designed to run
independent of other monitoring systems; it uses a simple mechanism (not any
standard protocol) for transporting information between its servers and clients. The
layer of transport consists of socket connected (TCP/IP) streams and the layer of
application uses messages character strings. The required monitoring information
retrieved by the client from running the server on the nodes of the cluster by
swapping messages. The request message of the client usually contains a code
representative what it is appearing for. The reply message of the server contains a
series of strings, whose varies length from single type of request to another. And also
both a ganglia and Monit are using TCP connection.. And CARD is used Hybrid
Push/Pull Protocol and finally Nagios is using Plug-ins available with the
distribution. Plug-ins for Nagios are Perl or other similar scripts that, when executed,
sends a specific data query to a device. The value returned from the plug-in is what
Nagios tracks, the plug-ins do all the work.
Page 55
40
2.6 Summary
In this chapter, we covered the area that is necessary for the development of
monitoring server farm tool. An investigation has been done on previous literature
from some resources such as internet, books, conferences and journal. We also
discussed some important concepts about monitoring systems such as server farm
monitoring tools and effective controlling servers and so on. Although this project
had gathered all the literature review about server farm security management, a good
understanding for each field is very important in order to develop effective server
farm monitoring tool.
Page 56
42
CHAPTER 3
PROJECT METHODOLOGY
3.1 Introduction
This chapter demonstrates short description of project methodology that will
be used in this research. As most excellent follow project methodology procedures,
tools and models must be named so as to fix the prototype. However the operational
framework of the project, schedule of the project, the researcher will discuss in this
chapter and afterward on the requirements of software and hardware for the proposed
prototype development
3.2 Operational Framework
To ensure that all the activities of this project are well-organized, it needs
project methodology to direct those activities to the right guidance. For instance to
collect all data linked to the project so as to develop a methodology or operational
framework. And also to ensure that all the jobs of the project have been clearly done.
As shown Figure 3.1 the operational framework of the project. And the Table
3.1 demonstrates the features of the project operational framework.
Page 57
42
PHASE 1 – Analysis of Tools Monitoring Server Farm
PHASE 2 – Design and
develop both system architecture and system design
PHASE 3 – Testing prototype and Repot written
Choose important functions and
add one extra function
Test Prototype
Report Writing
Prototype
accepted
No
Yes
Develop Prototype
Analyze existing Tools of
monitoring server Farm.
Compare core functions of
selected tools of monitoring
server Farm.
Design System Architecture.
Design Interface of client-
server monitoring
performance.
Figure 3.1 the Project operational framework
Page 58
43
Table 3.1: details of operational framework
NO PHASE OBJECTIVES TASKS INSTRUMENTS
/ METHOD
DELIVERABLES
1
Analysis of
existing
monitorin
g server’s
tools.
Comparin
g core
functions
of selected
tools.
Choosing
core
functions
add extra
function.
To analyze the
decided tools
such as
Ganglia,
PARMON,
Monit and
Card.
To identify
each tool his
own functions
and methods.
To compare
different
functions of
selected tools
To choose core
functions
Studies
monitoring
tools such
as Ganglia,
PARMON,
Monit and
Cared
Compariso
n of several
functions in
different
tools.
Determine
core
functions.
Performance
monitoring
tool of client-
server.
2 Design To design Designing Components
Page 59
44
Prototype
of
monitorin
g server
farm
Develop
the
prototype
prototype of
server farm
monitoring tool.
To develop
sub
component
of the
system\
To develop
GUI
interface
monitoring
server farm
prototype
(GUI
architecture)
.
Coding of
component1
Coding of
component2
Coding of
component 3
and features that
will be included
the monitoring
server farm
Prototype
(architecture
and design GUI
of the system).
4
Test the
Prototype
Write the
report
To design
system features.
To test the
prototype.
To get finalized
prototype.
To write the
final report of
the prototype.
Write the
report by
Combining
and
organizing
all the data
in
understanda
ble way.
Using report
writing skills.
Final
prototype.
Complete final
report.
Page 60
45
3.2.1 Analysis tools of monitoring servers.
This section analysis tools of monitoring servers the researcher is going to
highlight collected data during online research and offline research will be analyzed,
the methods used to analyze it and the data analysis tools used.
3.2.2 Data Analysis Methods
Analyzing information, the researcher can use one of the data analysis
techniques called qualitative and quantitative but in this research will be applied
quantitative method.
3.2.3 Project Schedule
The schedule of the project will roll through down tin general schedule of the
project contain the start date of the project and project end date, also the actions that
wanted to perform in the research according to the objectives of the project. The
project schedule details are exposed in Gantt chart attached in Appendix A.
3.2.4 Prototype methodology
System prototyping is a quick development of software so as to confirm
requirements. Using software prototyping assists developers and users to identify for
the system requirement, vulnerabilities, mistakes and omissions are identified. So
users can see how the system supports their work.
Page 61
46
Generally prototyping can be considered as risk reduction activity. In
particular it provides improved system usability closer match to the system needs,
improved design quality, improved maintainability and reduced overall development
efforts.
The Figure 3.2 shows prototyping process in the project. (Sommer Ville, 2000)
Figure 3.2 System prototyping
There are two approaches for prototyping: Evolutionary prototyping approach
and Throw-away prototyping. In this research, Evolutionary prototyping approach is
used where an initial prototype is produced and refined through a number of stages
as shown in Figure 3.3. (SommerVille, 2000).
Page 62
47
Figure 3.3 Evolutionary Prototyping
3.3 Use case of the proposed tool.
The use case diagram of the proposed tool is represented both client side and
server side. Figure 3.4 illustrates use case proposed tool for client side.
Yes
No
Develop abstract
specification
Build
prototype
system Test the
Prototype
system
Deliver
system System is
completed?
Page 63
48
Figure 3.4 Use Case Diagrams for client side
Page 64
49
This tool performs five main different Functions as figure 3.4 shows. From
table 3.2 the functions are Check System Information, Check CPU performance,
Check Memory Performance, Check Disk performance and Check Network
Bandwidth. The description of each function and the preconditions that requires
being present before each function are presented.
Use Cases Description Precondition
Check System
Information
System Information, which
contains basic information
about the target client
operating system
Windows operating systems
of version XP and higher.
And .Net Framework 2.0 or
later versions installed on the
clients and the server.
Check CPU
performance.
It collects CPU performance,
such as CPU usage,
Windows operating systems
of version XP and higher.
And .Net Framework 2.0 or
later versions installed on the
clients and the server.
Check Memory
Performance
Checks all nodes the Memory
Utilization, and visualizes the
server.
Windows operating systems
of version XP and higher.
And .Net Framework 2.0 or
later versions installed on the
clients and the server.
Check Disk
performance.
It collects Disk performance
information all the nodes and
shows in the server computer.
Windows operating systems
of version XP and higher.
And .Net Framework 2.0 or
later versions installed on the
clients and the server.
Check Network
Bandwidth.
First collect information about
Network bandwidth such
input signal and output, after
collection then visualize the
server.
Windows operating systems
of version XP and higher.
And .Net Framework 2.0 or
later versions installed on the
clients and the server.
Table 3.2 Use Case Description for client module
Page 65
50
Figure 3.5 shows as use case diagram for server module, this module first
receives the information from the client module and visualize to the control node.
Figure.3.5 Use Case Diagrams for server side
Page 66
51
As the above the table 3.3 the server module first of all receives the resource
information such system information, CPU usage, Memory usage, Disk utilization
and Network bandwidth and displays to the control node or the server.
Use Cases Description Precondition
Receive and display
System Information
It receives System
Information, which contains
basic information about the
target client operating system
and display.
Windows operating systems
of version XP and higher.
And .Net Framework 2.0 or
later versions installed on the
clients and the server.
Receive and display
CPU performance.
It receives the CPU usage, and
visualizes on the server or
control node.
Windows operating systems
of version XP and higher.
And .Net Framework 2.0 or
later versions installed on the
clients and the server.
Receive and display
Memory
Performance
Gets Memory Utilization, and
visualizes on the server.
Windows operating systems
of version XP and higher.
And .Net Framework 2.0 or
later versions installed on the
clients and the server.
Receive and display
Disk performance.
It receives Disk utilization and
shows on the server computer.
Windows operating systems
of version XP and higher.
And .Net Framework 2.0 or
later versions installed on the
clients and the server.
Receive and display
Network
Bandwidth.
First receives the information
about Network bandwidth
such input signal and output,
after receiving it will visualize
to the server.
Windows operating systems
of version XP and higher.
And .Net Framework 2.0 or
later versions installed on the
clients and the server.
Table 3.3 Use Case Description for server module
Page 67
52
3.4 Software And Hardware Requirements
In this section, the researcher talked about the hardware and software
requirements of the Monitoring servers’ prototype.
3.4.1 Software Requirements
Below is the Table 3.2 which summarizes software requirement for the
proposed prototype.
Table 3.4 software requirements
Software Purpose
Microsoft Visual
Studio 2008
The researcher will use this tool as front end of the
project.
Sparkling features of Microsoft Visual Studio 2008:
What you see is what you get visual design
surface
HTML, CSS, vbscript, and javascript Support
XML, RSS, and web services support
Visual data designers
Simplified debugging
Fully customizable
Easy to configure and deploy
MySQL
Provides the database for the prototype.
Page 68
53
In addition, it provides the following:
Data Manipulation (DM)
Data Definition (DD) elements.
MySQL is easy and user friendly and it can store.
EdrawMax EdrawMax is a tool which enables students, teachers
and business professionals to reliably create and
publish kinds of diagrams to represent any ideas.
Microsoft project 2007 Microsoft Office Project Server 2007 is a set of tools
which enables you to effectively manage and
coordinate work for an individual, team or enterprise.
In my project this tool will be used to create the project
schedule. And also will be used to create grant chart.
Microsoft Windows 7 Microsoft Windows 7 will be used as the Operating
system for the project development.
Microsoft word 2010 Microsoft word 2010 will be use for repot writing and
any writing of documents needed during the
development of the project.
3.4.2 Hardware Requirements
Hardware requirements are what types of hardware that is needed during the
development of the project. Below is the list of required hardware in the
development of the project:
1. Five computers.
2. Processor 2.0 GHz Pentium IV
3. Memory 1G of RAM.
Page 69
54
4. Hard Disk 40 GB.
5. Drive CD-ROM or DVD-ROM drive.
6. Display Super VGA (1024 x 768) or higher.
7. Mouse MS Mouse or compatible pointing device.
8. Network card.
3.5 Summary
This chapter talked about an overview of the project development
methodology. The researcher discussed in details the project operational framework
which shows the overall project operation. The researcher also discussed the phases
inside the operational framework. And at the end of this chapter the hardware and
software requirements were discussed.
Page 70
61
CHAPTER 4
DESIGN PHASE
4.1 Introduction
This chapter discusses the processes of designing a Client server application
for server farm performance monitoring tool that have the capability to monitor
server farm resource availability such as CPU usage, Memory usage, Disk usage and
Network bandwidth from time to time on demand.
However this chapter is organized as the flowing. Section 4.2 presents
architecture of proposed tool of client server application for server farm performance
monitoring. In section 4.3 use case diagram of the proposed tool. Also section 4.4
will visualize flowchart of the proposed tool. The technique and algorithm of the
proposed tool will be in section 4.5. Finally section 4.6 describes the design of the
proposed tool.
Page 71
56
4.2 Architecture of proposed system
High level tool architecture establishes the basic structure of the tool. So the
architecture of proposed tool is designed according to a “master-slave” model, as
illustrated in Figure.4.1:
Figure 4.1 the architecture of the proposed tool
Send information probe
Server
Node Information Manager
Disk Usage
Memory Usage
Network Usage
CPU Usage
Node
System Information
Disk Usage
Memory Usage
Network Usage
CPU Usage
Node
System Information
Disk Usage
Memory Usage
Network Usage
CPU Usage
Node
System Information
CPU Usage
Disk Usage Memory
Usage
Network
Usage
Information probe
System
Information
Client Node
Communication Module
Communication Module
Page 72
57
In the server farm, there are running a great number of service nodes and it must
be monitored. Control Node plays the role of a central monitoring, which
communicates with other nodes via the high-speed interconnection network. Thus,
there are two kinds of important modules in the monitoring tool, as follows:
1) Information Probe module
The Information Probe module is deployed on each cluster node, which directly
collects the running status of underlying resources.
According to the different kind of resource monitoring, five important functions
such as: System information, CPU usage, Memory usage, DISK usage, Network
bandwidth, which are in charge of collecting data about CPU, memory, disks,
network and Operating system (name of version, architecture) respectively. These
necessary data are periodically measured and updated, and then sent out from the
Information Probe module.
2) Information Manager
As shown in Figure.4.1, the Information Manager module gathers current status
of the nodes. And visualize to the control node as GUI graphical user interface.
Page 73
58
4.3 Proposed Tool flowchart.
4.3.1.1 Server side flowchart
Figure 4.2 describes in detail of how server side visualize collected data.
Detect connection
Yes
Figure 4.2 Flowchart of server side on proposed system
Start
Listening for incoming
clients connections
Connection
accepted
Information Request
Display
information
Terminate
the program
Exit
No
Yes
No
Received the information
Page 74
59
From figure 4.2, firstly the server starts to listen for incoming clients
connection, and it will detect some client request, so that the server may accept or
not, one’s the connection accepted it will request resource information to the clients
and displays as graphical user interface.
4.3.2 Client side flowchart
Figure 4.3 describes in detail of how client side collects the data.
Figure 4.3 Flowchart of client side on proposed system
Start
Connect
Get CPU usage
Get Memory usage
Get Disk usage
Get Network
bandwidth
Get OS name &
Architecture
Send resource information
Program
terminated
Exit
Yes
No
Page 75
60
As shown in figure 4.3, the process starts from the connection. Client will
send request related the connection to the server. If the server accepts the connection,
client will get request about resource information of current status of the client, it
will gather the resource information and sends to the control node.
4.4 Monitoring Nodes
The two major component of the proposed tool, first component is monitor
clients which collect the performance information like CPU usage, Disk usage,
Memory utilization and Network bandwidth after that will send to the control node,
the second component is Monitor Center, a graphical user interface centered server
accountable for interrelating with the monitor clients in addition to visualize received
information. Central monitor is developed, designed and applied using the art of
state, objected-oriented, Client server based and C#.NET 2008.
Following communication takes place among the proposed tool, server and client
frequently from time to time.
I. The administrator interacts with a proposed tool server as graphical user
interface for monitoring then select suitable option.
II. The proposed tool understands the administrator’s request then appeals to the
suitable event handler.
III. The event handler executes the suitable functions
IV. The administrator selects one of the set of nodes to monitor.
V. The proposed tool server maps the name and IP address of the clients.
VI. The proposed tool server changes the request of the user into messages then
talks them to the clients.
VII. The client of the proposed tool interprets the server messages, process its
request and communicate the result to the server.
Page 76
61
VIII. The proposed tool server understands the messages then changes them into
appreciate format, and it visualizes in the form of a pie chart, graph, text and
bar graph.
IX. Finally the server of the proposed tool closes all connections made to the
clients.
4.5 Techniques and Algorithms of the Proposed Tool
Performance counter monitors the behavior of the computer. These include
physical components, such as processors, disks, and memory, and system objects,
such as processes and threads.
There are also a large number of performance counters created (and
maintained) by the .NET common language run time environment. However to
collect data from remote machines one of the important technique is client server
model.
4.5.1 Client side algorithm
A client is a user that connects to a server, usually to demand data. Web
browser, for example play a role in the client when the materials downloaded from
the web server. Create a client socket with jobs. NET is a normal little messy, so it
needs to create an instance ClientInfo for event-driven access to data.
Page 77
62
Following pseudo code explains TCP client pseudo side.
Figure 4.4 Pseudo code of the client
The above figure 4.4 illustrates Pseudo code of the client, the process starts
to create socket, after creation the socket then connect to that socket, Do an active
connect specifying the IP address and port number of server and then loop Read and
Write Data into connect Socket to communicate with server, finally close the
connect socket.
Create socket, connectSocket
Do an active connect specifying the IP address
And port number of server
Get CPU usage
Get Memory usage
Get Disk usage
Get Network bandwidth
Get OS name & Architecture
Loop
Read and Write Data into connectSocket
To communicate with server
Close connectSocket
Page 78
63
4.5.2 Server Algorithm
In addition to receive and send information (such as a client), and the server
to keep track of which is linked to it, also helpful to be able to broadcast messages,
and send it to each customer's online (for example, a message indicating the server is
about to be taken down for maintenance).
Below figure 4.5 is Pseudo code of the server.
Figure 4.5 Pseudo code of the server.
Create socket
Bind socket to a specific port
Loop
Accept new connection (connectSocket)
Read and Write Data Into connectSocket to
Communicate with client
Request Information (CPU usage, Disk usage, Memory usage Network
bandwidth)
Receive Information (CPU usage, Disk usage, Memory usage Network
bandwidth)
Close connectSocket
Page 79
64
The above figure 4.7 is about Pseudo code of the server, the process starts to
create socket and then bind socket to a specific port where clients can contact,
Register with the kernel to listen that on socket for client and then loop to accept new
connection and read write data into the connection socket finally close connect
socket.
4.5.3 Registered User and Organization Algorithms
When install Windows, it needs to register the name and perhaps the
organization's name. it is to preserve this information by the operating system. When
asked about details such as this, it is useful to provide this information and default
values.
System.Management Namespace
System. Management namespace contains classes that allow the collection of
information on the management system of the equipment using the infrastructure of
the Windows operating system (WMI). This includes a large amount of information
on the current system, and hardware and operating system, including the names of
the registered user and organization.
NameSpace is provided in the library System. Management dynamic (DLL).
It does not include this DLL in Visual Studio by default. To access information using
WMI, add a reference to the DLL to the project, and should include the following
guidelines to simplify the code:
using System.Management;
Page 80
65
Reading the registration information can be used WMI class, management class the
first class to retrieve the information in connection with it, Required by law to be the
class constructor string parameter when creating a new instance of class
management. For additional registration information, and there is a need for a class
Win32_OperatingSystem. Management class to create the appropriate object, add the
following code
ManagementClass mc = new ManagementClass("Win32_OperatingSystem");
When the object is formed Management Class, should be performed in
GetInstances way to get a set of objects ManagementObject. This group contains one
object contains the value, and can be accessed using many of the indexer, Values of
the series 2, which are named "RegisteredUser" and "organization".
The following figure 4.6 illustrates the code uses the previously created
ManagementClass object to retrieve and output the registered user and organization:
Figure 4.6 Registered User and Orgnization Algorithm
string registeredUser = null;
string organisation = null;
foreach (ManagementObject mo in mc.GetInstances())
{
registeredUser = mo["RegisteredUser"].ToString();
organisation = mo["Organization"].ToString();
}
Console.WriteLine("User:\t{0}", registeredUser);
Console.WriteLine("Org.:\t{0}", organisation);
Page 81
66
4.6 Retrieving Data
The following methods are very useful in order to monitor the system and
particularly the amount such as CPU usage, Disk usage, Memory usage and
network bandwidth.
Figure 4.7 Code to retrieve available Memory and CPU usage
As shown, figure 4.7 illustrates sample code that retrieves available memory
and CPU usage .However the server retrieves required monitoring information
from the clients running on the cluster nodes by exchanging messages. Server
request message normally contains a code indicating what it is looking for such
CPU usage, Memory usage, Disk usage and Network bandwidth from time to
/*
First create the 2 performance counters
using the System.Diagnostics.PerformanceCounter class.
*/
protected PerformanceCounter cpuCounter;
protected PerformanceCounter ramCounter;
cpuCounter = new PerformanceCounter();
cpuCounter.CategoryName = "Processor";
cpuCounter.CounterName = "% Processor Time";
cpuCounter.InstanceName = "_Total";
ramCounter = new PerformanceCounter("Memory", "Available MBytes");
/*
Call this method to get
the current cpu usage.
*/
public string getCurrentCpuUsage(){
cpuCounter.NextValue()+"%";
}
/*
Call this method to get
the amount of the available RAM in Mb
*/
public string getAvailableRAM(){
ramCounter.NextValue()+"Mb";
}
Page 82
67
time. The client’s replies message contains several components that the server
requested already and sends to the control node.
4.7 Design of proposed system
As shown figure 4.8, the administrator can monitor performance of many clients
such as CPU usage, Memory usage, Disk usage, Network bandwidth and OS name
and architecture it also can watch status of different clients.
Figure 4.8 Design of server side of proposed tool
Page 83
68
4.8 Summary
This chapter presented proposed tool architecture of client server application
for server farm performance monitoring. The design details of the proposed tool and
different diagrams such as use cases diagram, flowcharts diagram of each client side
and server side, technique and algorithms of the proposed tool were discussed in
detail.
Page 84
76
CHAPTER 5
IMPLEMENTATION AND RESULTS
5.1 Introduction
In the previous chapter, design of the proposed tool which includes client
server monitoring performance method was presented. The proposed tool presents
the CPU usage, Memory usage, Disk utilization and network Bandwidth.
The remainder of this chapter is structured as follows. Section 5.2 is the main
focus of this chapter, which discusses results of the proposed tool including resource
usage of the clients such as system information, CPU usage, Memory Usage, Disk
utilization and Network bandwidth. Section 5.3 compares the results of the proposed
tool with the previous server farm performance monitoring tools. Finally section 5.4
concludes this chapter.
Page 85
70
5.2 Testbed for the Proposed Tool
In this section the testbed of the proposed tool testing is presented. Figure 5.1
shows the configuration of the testbed.
Figure 5.1 Configuration of testbed.
From Figure 5.1 there are five computers. One of them is Monitoring Center
and others are clients. The client computers collects performance information such as
system information, CPU usage, Memory usage, Disk utilization and Network
Bandwidth then visualizes the Monitoring center node.
Page 86
71
5.2.1 Test Case 1
Test case1 will monitor to the targeted machine, the name of the target
machine is XP1, and the IP Address of this machine is 192.168.232.6, the tool
collects the performance data such as system information, CPU usage, Memory
Usage, Disk utilization and Network Bandwidth and then visualize the central
monitor machine, so the name of the monitoring center is rashka pc and IP address is
192.168.232.1.
Figure 5.2 illustrates the main interface of the central monitoring machine
Page 87
72
Figure 5.2 main interface of the central monitoring
In figure 5.2 there is no performance data such system information, CPU
usage, Memory usage, Disk usage and network Bandwidth, to gather those
information it need first to register the clients that may be to visualize their
information. Figure 5.3 shows the client registration form.
Page 88
73
Figure 5.3 Adding New Client
The new client added will appear in client list form with a status field indicate
whether the server succeeded to connect to the client or failed.
Connected – the server has succeeded connecting to the client.
Failure – the server has failed connecting to the client
Figure 5.4 Client list form
Page 89
74
After fix the problem that was causing the server to fail connecting the client,
then may be needs to press the Status button to check the correct status. Each client
will appear in the drop down list of clients that located on the top right of the system
main interface. Use it in order to choose on which client that may needs to get it’s
information.
Figure 5.5 choose client form.
The main tab of the proposed tool is the performance tab, which contains any
performance counter available on the target client such as CPU usage, Memory
usage, Disk usage and Network Bandwidth and visualizes to the monitoring center.
The value of any counter are presented in a line graph, it can be watch up six
different graphs concurrently. In order to add a new counter, choose in the menu
View Counters Select Counters and select performance categories:
Page 90
75
Figure 5.6 Choosing performance type
. In the above figure 5.6, the administrator chose to see information
regarding the process of the target client, and specified the total processor time
percentage. In the bottom of the performance tab, the list of counters it may chose,
including each counter category and instance.
Page 91
76
Figure 5.7 performance monitoring
After adding a counter and can also remove it from the view by right clicking
the requested counter and choosing Remove Counter.
Page 92
77
Figure 5.8 Removing Counter
In order to distinguish between the different counters in a better way, it can
use the Change Color option. Right click the counter, which its color that may want
to change, then choose Change Color. The relevant graph will change its color to the
selected color. The following figure 5.9 illustrates changing the color to the counters.
Page 93
78
Figure 5.9 change color
The second tab is System Info, which contains basic information about the
target client operating system and selected performance counters, which may find
very useful. In the left side of the tab located the static information of the operating
system, Windows version and service pack, registered and logged on user, and the
list of available drivers. Notice that this data is not influenced by the system interval
and is collected once for each time you select this tab. In the right side there is
dynamic information of memory usages, CPU, threads counts and more. The data is
shown in both as graphs and as text.
The following figure 5.10 illustrates the system information such as computer
name, type of operating system, user name, and logical disk space.
Page 94
79
Figure 5.10 system information
Figure 5.11 CPU information
The above figure 5.11 describes the CPU usage with limit time interval also
the administrator can watch several components related to the processor such as
processor time and so on.
Page 95
80
Figure 5.12 Memory information
As illustrated Figure 5.12 memory information is one of the performance
counters and the above figure visualizes the memory usage.
Figure 5.13 Disk information
Page 96
81
According to the Figure 5.13, the monitoring center can visualize disk
information such disk utilization, the disk free space, logical average disk
transfer/sec and logical disk write/sec.
Figure 5.14 Network Bandwidth
Network bandwidth is one of the main functions of the proposed tool and
Figures 5.14 shows network input and network output bandwidth
Page 97
82
4.3. Server farm performance monitoring tools and proposed tool comparison
Table 5.1 shows comparison core functions of existing tools of monitoring
performance for server farm and proposed tool.
Table 5.1 comparison core functions of existing tools and proposed
tool.
Page 98
83
4.6 Summary
In this chapter presented testbed of the proposed tool including the client’s
performance such as system information, CPU usage, Memory Usage, Disk
utilization and Network. Finally the results of the proposed tool compared with the
previous server farm performance monitoring tools.
Page 99
84
CHAPTER 6
Conclusion and Recommendation
6.1 Introduction
This chapter summarizes the entire project work and discusses issues raised
throughout this project. In section 6.2 will be the overall conclusion of the project.
As well as the contributions are discussed based on objectives of this project and
visualized in section 6.3. The future enhancements of the projects are recommended
in section 6.4. Finally section 6.4 summarizes this chapter.
6.2 Concluding Remarks
In this project, Client server application for server farm performance
monitoring using visual studio special C # language and client server algorithm has
been proposed.
Page 100
85
In chapter 1, the domain of the study is discussed followed by the background
of the problem. The previous tools for the server farm monitoring have been
investigated and it leads to the statement of the problem and the objective of the
study. The project scope, motivation and aim of the project have been made after the
study objectives have been identified.
The purpose of this project is to develop a tool that cover five functions of a
client server application for server farm resource monitoring which are System
information, CPU usage, Memory Usage , Disk utilization and Network bandwidth.
Before the proposed tool is developed studies have been made towards the effective
functions will be applied to the proposed tool. The study conducted was based on the
tools related to the proposed tool.
In the first part of chapter 2 the overview of Server Farm attacks has been
presented follows by types of the attack and the symptoms of each type. This part has
also covered the discussion of the current general Monitoring tools of Server Farm.
After that the researcher has focused five tools of monitoring Server Farm called,
Monit, Nagios, Ganglia, Card and PARMON, the overview of those tools has been
presented.
Project methodology must be accomplished in order to propose a Client
server application for server farm performance monitoring tool. The methodology of
this project is presented in chapter 3 which contains three main phases. The first
phase is problem formulation that can be broken down into three phases which are
Analyze existing Tools of monitoring server Farm, Compare core functions of
selected tools of monitoring server Farm and Choose important functions and add
one extra function.
Second phase of the methodology is the design and development of the
proposed tool. The details of the proposed tool design including the flowchart of the
proposed tool, architecture and design of the proposed tool presented in chapter 4.
Page 101
86
Also the result of the proposed tool and comparison with previous tool are shown in
chapter 5. Contributions of this project are in the next section followed by future
works and recommendations.
6.3 Contributions
As mentioned in chapter 2, monitoring servers is one of the mechanisms that
can be used to confirm the availability of the servers. It provides a way to compare
servers before the attack and after the attack, if any changes related resource
availability of the servers’ occurs such as increasing CPU usage, Memory usage and
Disk utilization of the server it concludes that the server is attacked by DOS or
VIRUS and so on.
There are three objectives that need to be achieved in this project throughout
this study. Following paragraph describes each of the objectives in this study.
The first objective of this project is studding and analyzing available tools of
resource monitoring performance for Server Farm. The study took into consideration
the functions that they have used such CPU usage, Memory usage, Disk utilization
and Network bandwidth. The analysis has done in chapter two.
The second objective of this project is designing and developing prototype of
resource monitoring performance for Server Farm. That covers five functions of
monitoring resources using client server algorithms the design of the proposed tool
has presented in chapter 4.
The last objective in this project is testing prototype of resource monitoring
performance for Server Farm. The full result and discussing of the proposed tool is
presented in chapter 5.
Page 102
87
In summary, contribution in this study is as follows:
Designing a server application for server farm performance
monitoring that covers five function of resource monitoring which are
System information CPU usage, Memory usage, Disk utilization and
Network bandwidth.
Investigation of existing Tools is identified according to resource
monitoring server farm and presented in chapter two.
Results analysis of the proposed tool that uses client server algorithm
and the comparison with the previous tool.
6.4 Future works and recommendation
The proposed tool has contributed to the process of automating the server
farm attacks. In the future several modifications need to be considered in order to
improve and enhance the resource performance monitoring for servers and power of
the tool.
The tool has focused only environment of windows operating system.
Changing the structure and designing it in a way that covers the other environments
of operating systems such as Linux and UNIX is recommended.
Finally the proposed tool has five functions of resource monitoring server
farm and needs to add extra functions for future work.
Page 103
88
6.5 Summary
In this chapter, the research work through the study was concluded.
Contributions of the project also were discussed. Finally, future works and
recommendations were suggested in order to improve performance of the tool on the
future. However there is still a room for improvement that need to be done towards
the carried study.
Page 104
89
REFERENCES
Aghajani, M., Parolini, L. And Sinopoli, B.(2010). Dynamic Power Allocation In
Server Farms: A Real Time Optimization Approach. In: Decision And
Control (Cdc), 2010 49th Ieee Conference On, 15-17 Dec. 2010 2010. 3790-
3795.
Baronov, D. And Baillieul, J. (2012). Decision Making For Rapid Information
Acquisition In The Reconnaissance Of Random Fields. Proceedings Of The
Ieee, 100, 776-801.
Bhatia, A., Dhabe, P. S. And Pukale, S. G.(2009). Java Based Simulator To Detect
Zero-Day Silent Worms Using Actm. In: Advance Computing Conference,
2009. Iacc 2009. Ieee International, 6-7 March 2009 2009. 847-852.
Bridges, T., Kitchel, S. W. And Wehrmeister, R. M.(1992). A Cpu Utilization Limit
For Massively Parallel Mimd Computers. In: Frontiers Of Massively Parallel
Computation, 1992., Fourth Symposium On The, 19-21 Oct 1992 1992. 83-
92.
Buyya, R. (2000). Parmon: A Portable And Scalable Monitoring System For
Clusters. Software - Practice And Experience, 30, 723-739.
Cabrera, J. B. D., Lewis, L., Xinzhou, Q., Wenke, L., Prasanth, R. K., Ravichandran,
B. And Mehra, R. K.(2001). Proactive Detection Of Distributed Denial Of
Service Attacks Using Mib Traffic Variables-A Feasibility Study. In:
Integrated Network Management Proceedings, 2001 Ieee/Ifip International
Symposium On, 2001 2001. 609-622.
Chunhong, Z., Yang, J. And Lichun, L.(2008). Bandwidth And Efficiency Of P2psip
Based Server Farm. In: International Conference On Computer Science And
Software Engineering, Csse 2008, December 12, 2008 - December 14, 2008,
2008 Wuhan, Hubei, China. Ieee Computer Society, 495-498.1171.
Page 105
90
Gandhi, A., Gupta, V., Harchol-Balter, M. And Kozuch, M. A. (2010). Optimality
Analysis Of Energy-Performance Trade-Off For Server Farm Management.
In, 2010a P.O. Box 211, Amsterdam, 1000 Ae, Netherlands. Elsevier, 1155-
Gandhi, A., Harchol-Balter, M. And Adan, I. (2010b). Server Farms With Setup
Costs. Performance Evaluation, 67, 1123-1138.
Gandhi, A., Harchol-Balter, M., Das, R. And Lefurgy, C. (2009). Optimal Power
Allocation In Server Farms. In: 11th International Joint Conference On
Measurement And Modeling Of Computer Systems,
Sigmetrics/Performance'09, June 15, 2009 - June 19, 2009, 2009 Seattle, Wa,
United States. Association For Computing Machinery, 157-168.
Gang, X. And Minxia, Z. (2010). A Novel Method Of Outliers Within Data Streams
Based On Clustering Evolving Model For Detecting Intrusion Attacks Of
Unknown Type. In: Multimedia Information Networking And Security
(Mines), 2010 International Conference On, 4-6 Nov. 2010 2010. 579-583.
Gregg, D. M., Blackert, W. J., Heinbuch, D. V. And Furnanage, D. (2001). Assessing
And Quantifying Denial Of Service Attacks. In: Military Communications
Conference, 2001. Milcom 2001. Communications For Network-Centric
Operations: Creating The Information Force. Ieee, 2001 2001. 76-80 Vol.1.
Hanxun, Z., Yingyou, W. And Hong, Z. (2007). Modeling And Analysis Of Active
Benign Worms And Hybrid Benign Worms Containing The Spread Of
Worms. In: Networking, 2007. Icn '07. Sixth International Conference On,
22-28 April 2007 2007. 65-65.
Hai Huang, Y. R., Anees Shaikh, Ramani Routray, Chung-Hao Tan, Sandeep
Gopisetty (2009). Building End-To-End Management Analytics For
Enterprise Data Centers. Ieee Std 802.11a-1999.
Heo, J., Jayachandran, P., Shin, I., Wang, D., Abdelzaher, T. And Liu, X. (2011).
Optituner: On Performance Composition And Server Farm Energy
Minimization Application. Ieee Transactions On Parallel And Distributed
Systems, 22, 1871-1878.
Hofmann, S., Louizi, M. And Stoll, D. (2008). A Novel Approach To Identify
Denial-Of-Service Attacks Against Transport Network Resources. Photonic
Networks, 2008 Itg Symposium On, 1-8.
Hortos, W. S. (2010). Neural Methods Based On Modified Reputation Rules For
Detection And Identification Of Intrusion Attacks In Wireless Ad Hoc Sensor
Page 106
91
Networks. In: Evolutionary And Bio-Inspired Computation: Theory And
Applications Iv, April 7, 2010 - April 8, 2010, 2010 Orlando, Fl, United
States. Spie, The Society Of Photo-Optical Instrumentation Engineers (Spie).
Jayasinghe, M., Tari, Z., Zeephongsekul, P. And Zomaya, A. Y. (2011). Task
Assignment In Multiple Server Farms Using Preemptive Migration And Flow
Control. Journal Of Parallel And Distributed Computing, 71, 1608-1621.
Jayram, T. S., Kimbrel, T., Krauthgamer, R., Schieber, B. And Sviridenko, M.
(2011). Online Server Allocation In A Server Farm Via Benefit Task
Systems. In: 33rd Annual Acm Symposium On Theory Of Computing, July
6, 2001 - July 8, 2001, 2001 Creta, Greece. Association For Computing
Machinery, 540-549.
Jin, H., Henriksson, D., Xue, L. And Abdelzaher, T. (2007). Integrating Adaptive
Components: An Emerging Challenge In Performance-Adaptive Systems
And A Server Farm Case-Study. In: Real-Time Systems Symposium, 2007.
Rtss 2007. 28th Ieee International, 3-6 Dec. 2007 2007. 227-238.
Krishnamoorthy, S. And Dasgupta, P. (2004). Tackling Congestion To Address
Distributed Denial Of Service: A Push-Forward Mechanism. In: Global
Telecommunications Conference, 2004. Globecom '04. Ieee, 29 Nov.-3 Dec.
2004 2004. 2055-2060 Vol.4.
Kundu, A., Banerjee, C., Guha, S. K., Mitra, A., Chakraborty, S., Pal, C. And Roy,
R. (2010). Memory Utilization In Cloud Computing Using Transparency. In:
Computer Sciences And Convergence Information Technology (Iccit), 2010
5th International Conference On, Nov. 30 2010-Dec. 2 2010 2010. 22-27.
Li, C., Zhang, C., Yaowang And Yangji. (2008). Reliable And Scalable Dht-Based
Sip Server Farm. In: 2008 Ieee Global Telecommunications Conference,
Globecom 2008, November 30, 2008 - December 4, 2008, 2008 New
Orleans, La, United States. Institute Of Electrical And Electronics Engineers
Inc., 1762-1767.
Li, L., Zhang, C., Mi, W., Zhang, Y., Ma, T., Ji, Y. And Qiu, X. (2009). Sfdht: A Dht
Designed For Server Farm. In: 2009 Ieee Global Telecommunications
Conference, Globecom 2009, November 30, 2009 - December 4, 2009, 2009
Honolulu, Hi, United States. Institute Of Electrical And Electronics
Engineers Inc.
Page 107
92
Liedtke, J., Islam, N. And Jaeger, T. (1997). Preventing Denial-Of-Service Attacks
On A Μ-Kernel For Weboses. In: Operating Systems, 1997., The Sixth
Workshop On Hot Topics In, 5-6 May 1997 1997. 73-79.
Ling, T. And Zahir, T. (2002). Dynamic Task Assignment In Server Farms: Better
Performance By Task Grouping. In: Computers And Communications, 2002.
Proceedings. Iscc 2002. Seventh International Symposium On, 2002 2002.
175-180.
Luo, M.-Y., Yang, C.-S. And Tseng, C.-W. (2002). Content Management On Server
Farm With Layer-7 Routing. In: Applied Computing 2002: Proceeedings Of
The 2002 Acm Symposium On Applied Computing, March 11, 2002 - March
14, 2002, 2002 Madrid, Spain. Association For Computing Machinery, 1134-
1139.
Massie, M. L., Chun, B. N. And Culler, D. E. (2004). The Ganglia Distributed
Monitoring System: Design, Implementation, And Experience. Parallel
Computing, 30, 817-840.
Monit. (1998). Monit Unix Systems Management.
Http://Www.Tildeslash.Com/Monit/.
Niyato, D., Chaisiri, S. And Sung, L. B. (2009). Optimal Power Management For
Server Farm To Support Green Computing. In: 2009 9th Ieee/Acm
International Symposium On Cluster Computing And The Grid, Ccgrid 2009,
May 18, 2009 - May 21, 2009, 2009 Shanghai, China. Ieee Computer
Society, 84-91.
Ohyama, N. (1994). Usage Of Magneto-Optical Disks In Medical Information Filing
System. Magnetics In Japan, Ieee Translation Journal On, 9, 104-110.
Patterson, E. A. A. D. (1997). Extensible, Scalable Monitoring For Clusters Of
Computers. Http://Now.Cs.Berkeley.Edu/Sysadmin/Esm/Intro.Html.
Ramamoorthy, C. V. And Wah, B. W. (1981). The Degradation In Memory
Utilization Due To Dependencies. Computers, Ieee Transactions On, C-30,
813-818.
Saboori, E., Mohammadi, S. And Parsazad, S. (2010). A New Scheduling Algorithm
For Server Farms Load Balancing. In: Industrial And Information Systems
(Iis), 2010 2nd International Conference On, 10-11 July 2010 2010. 417-420.
Snyder, J. (2008). Virtual Machines, Networking Security,And The Data Center: Six
Key Issues And Remediation Strategies. Part Number: 200286-002 Oct 2008.
Page 108
93
Systems, C. (2006). Server Farm Security In The Business Ready Data Center
Architecture V2.1. 170 West Tasman Drive San Jose, Ca 95134-1706 Usa
Http://Www.Cisco.Com, Ol-9015-01 November 2006.
Xiaorui, W., Xing, F., Xue, L. And Zonghua, G. (2009). Power-Aware Cpu
Utilization Control For Distributed Real-Time Systems. In: Real-Time And
Embedded Technology And Applications Symposium, 2009. Rtas 2009. 15th
Ieee, 13-16 April 2009 2009. 233-242.
Xingang, Z., Yunkai, Z. And Fangwei, W. (2009). Control Strategy Based On
Worms Spread In Complex Network. In: Intelligent Information Technology
Application, 2009. Iita 2009. Third International Symposium On, 21-22 Nov.
2009 2009. 209-212.
Xiong, L., Sheng, D., Kunju, L. And Qiansheng, L. (2010). Multi-Agent-Based
Battlefield Reconnaissance Simulation By Novel Task Decompositionand
Allocation. In: Computer Science And Education (Iccse), 2010 5th
International Conference On, 24-27 Aug. 2010 2010. 1410-1414.
Xiuzhen, C., Shenghong, L., Jin, M. And Jianhua, L. (2011). Quantitative Threat
Assessment Of Denial Of Service Attacks On Service Availability. In:
Computer Science And Automation Engineering (Csae), 2011 Ieee
International Conference On, 10-12 June 2011 2011. 220-224.
Yuanyuan, Y., Shengfeng, Q. And Holland, R. (2008). Development Of A Project
Level Performance Measurement Model For Improving Collaborative Design
Team Work. In: Computer Supported Cooperative Work In Design, 2008.
Cscwd 2008. 12th International Conference On, 16-18 April 2008 2008. 135-
140.
Zhang, Y., Zhang, C., Ji, Y. And Mi, W. (2010). A Novel Load Balancing Scheme
For Dht-Based Server Farm. In: 2010 3rd Ieee International Conference On
Broadband Network And Multimedia Technology, Ic-Bnmt2010, October 26,
2010 - October 28, 2010, 2010 Beijing, China. Ieee Computer Society, 980-
984.
Page 109
94
APPENDIX A
GANTT CHART


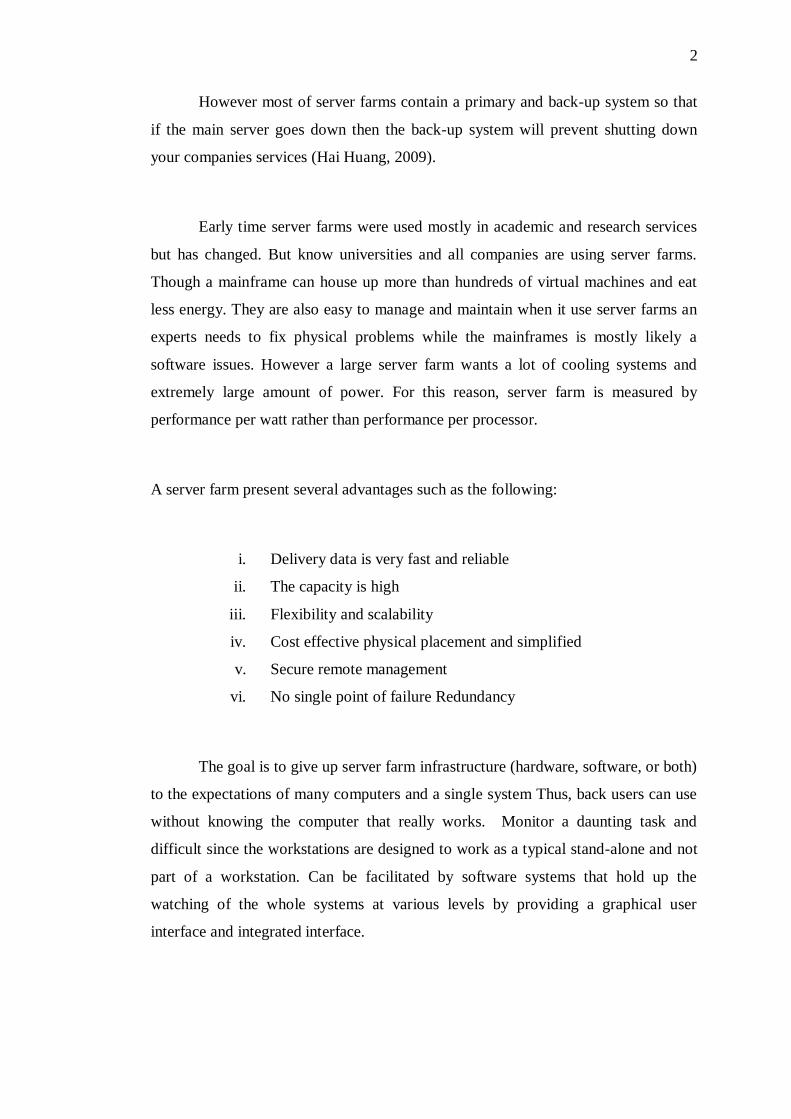
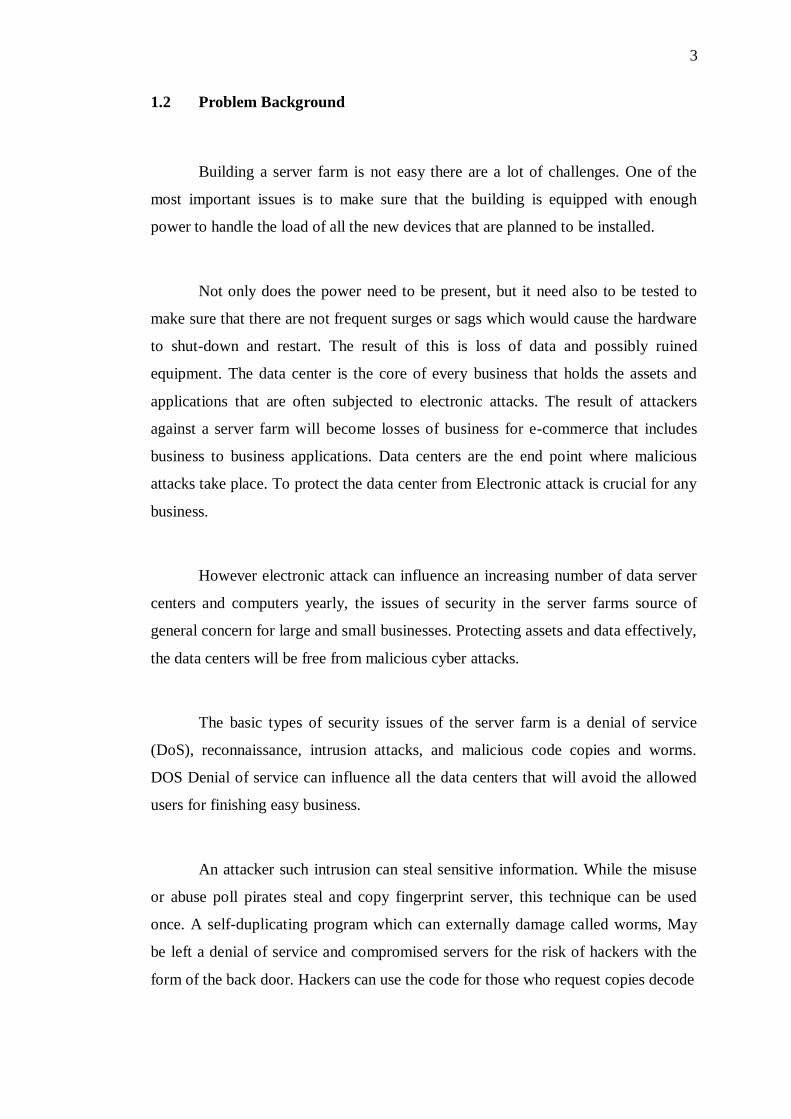


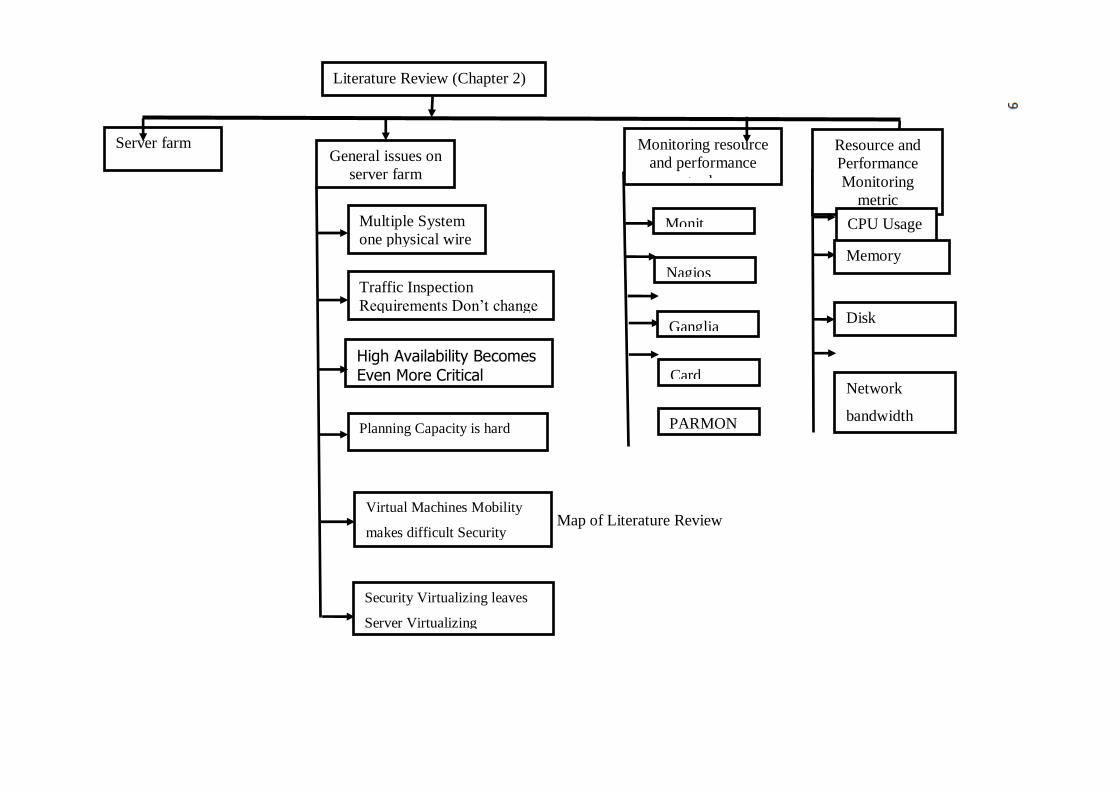


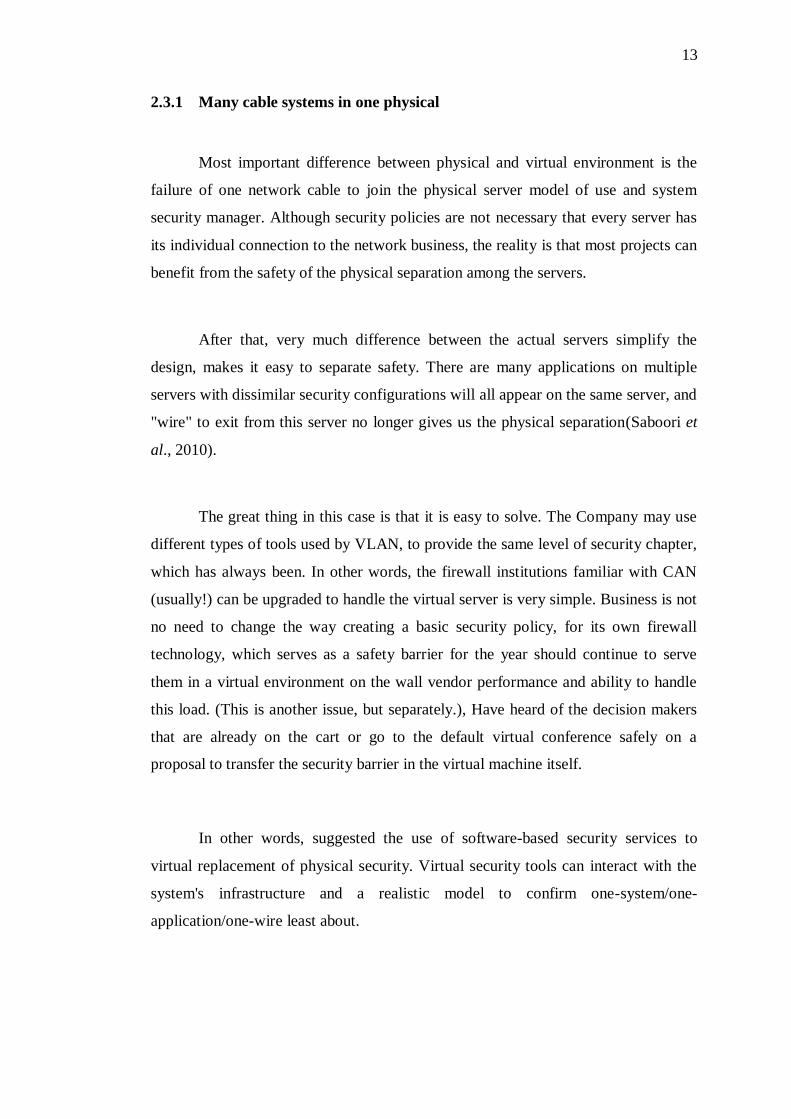


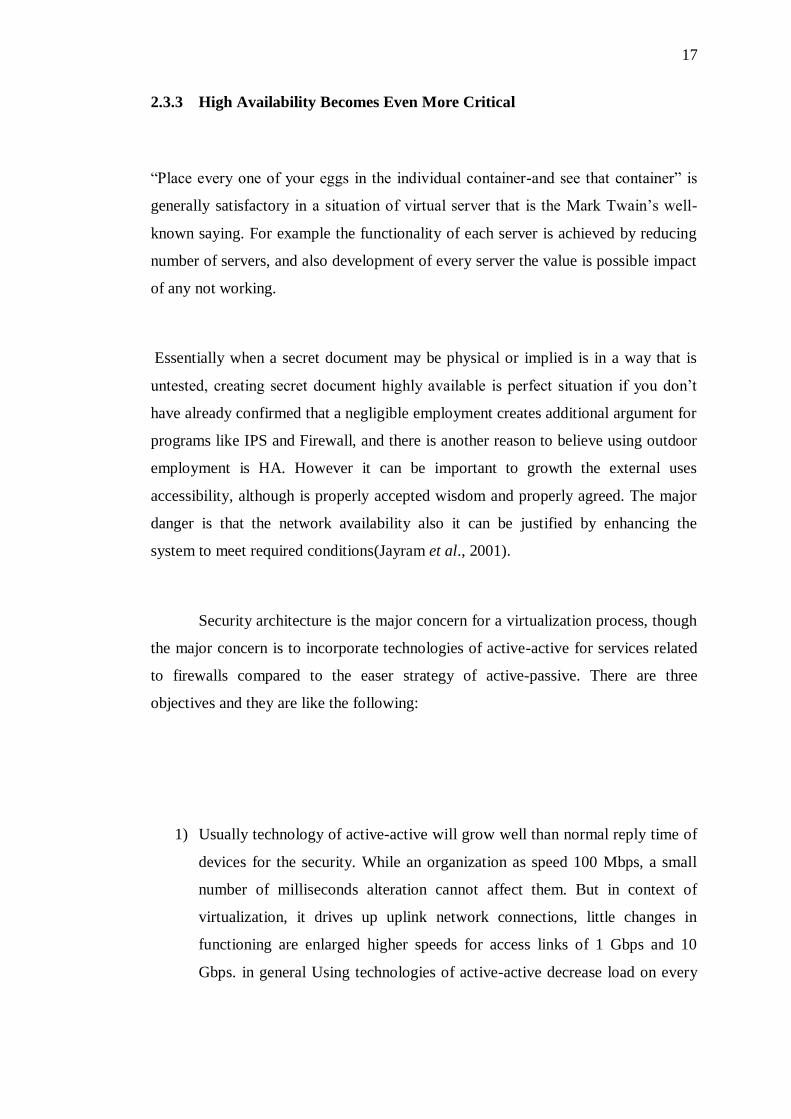
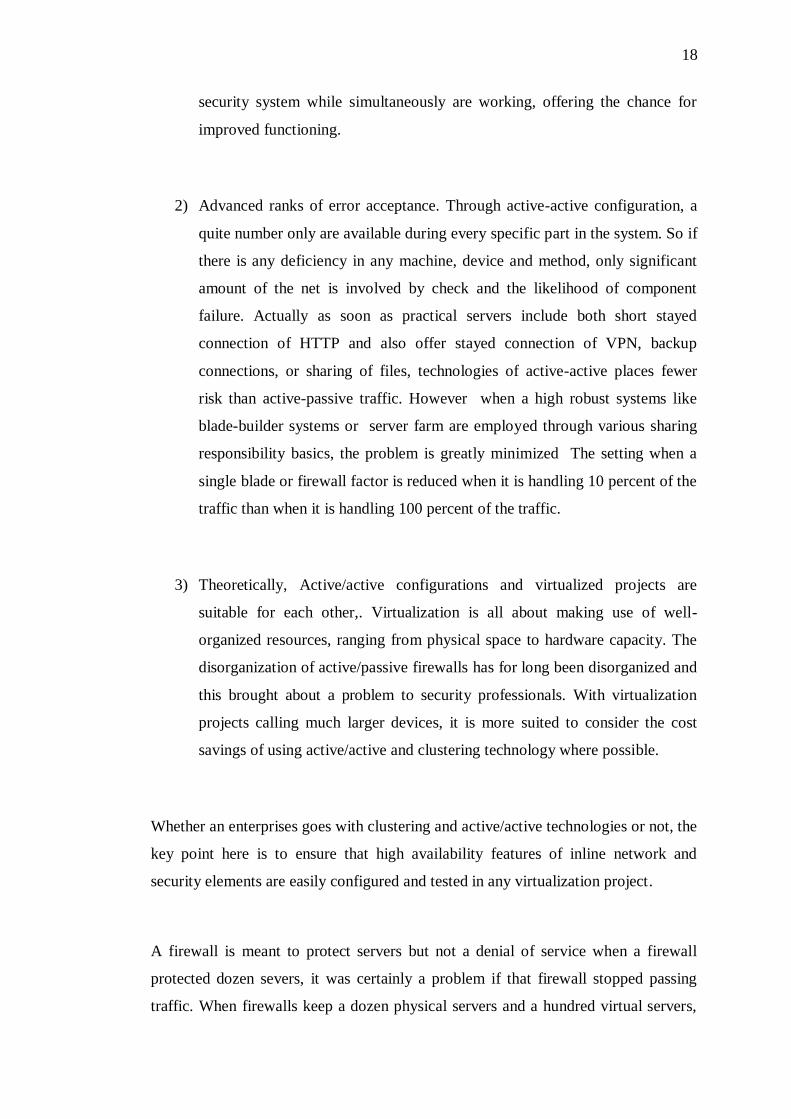


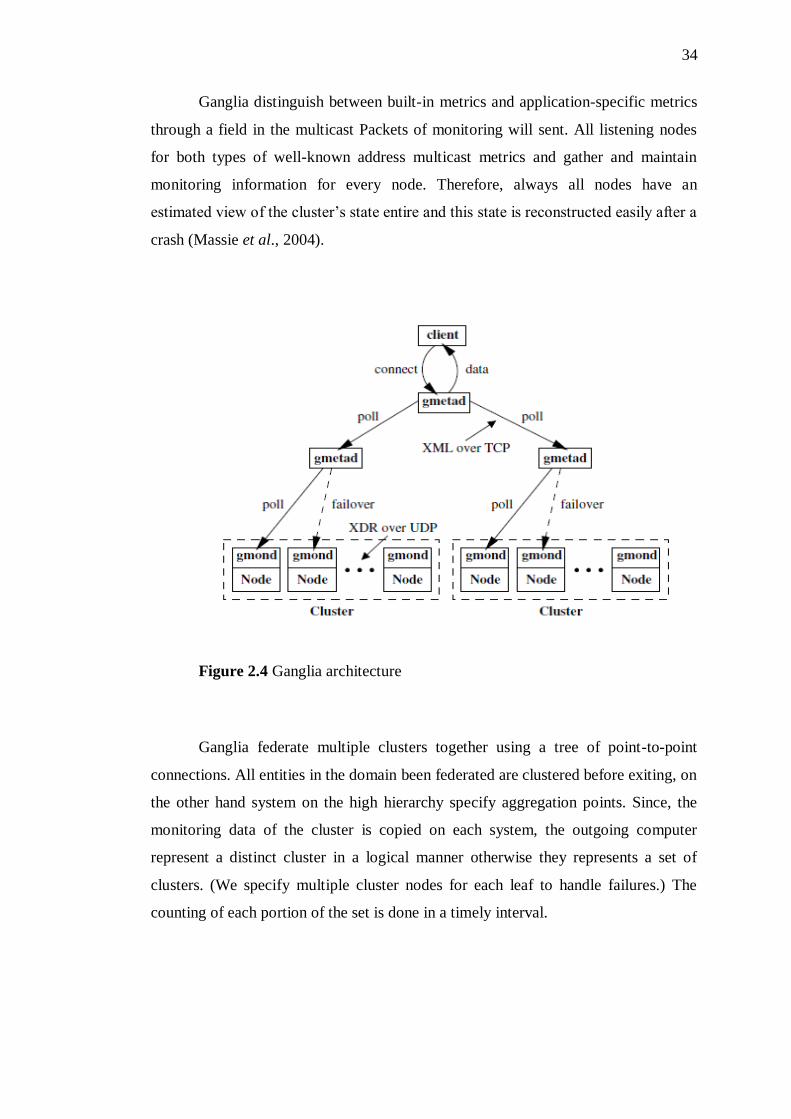


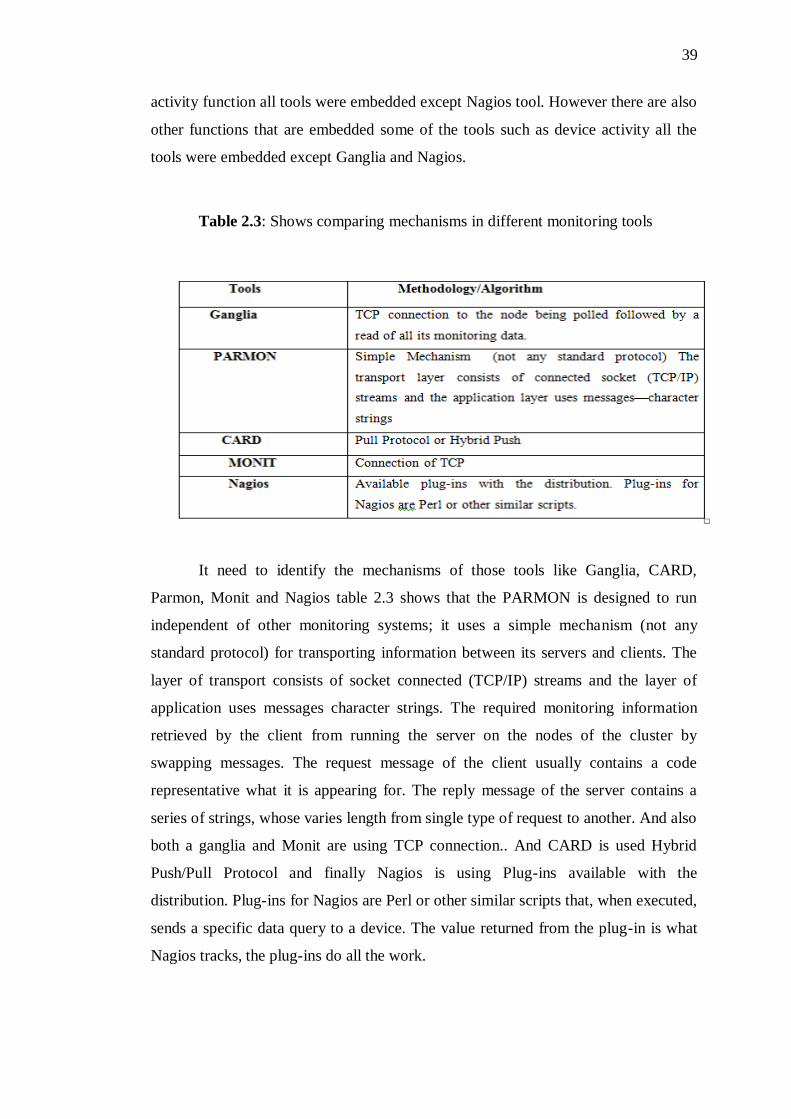


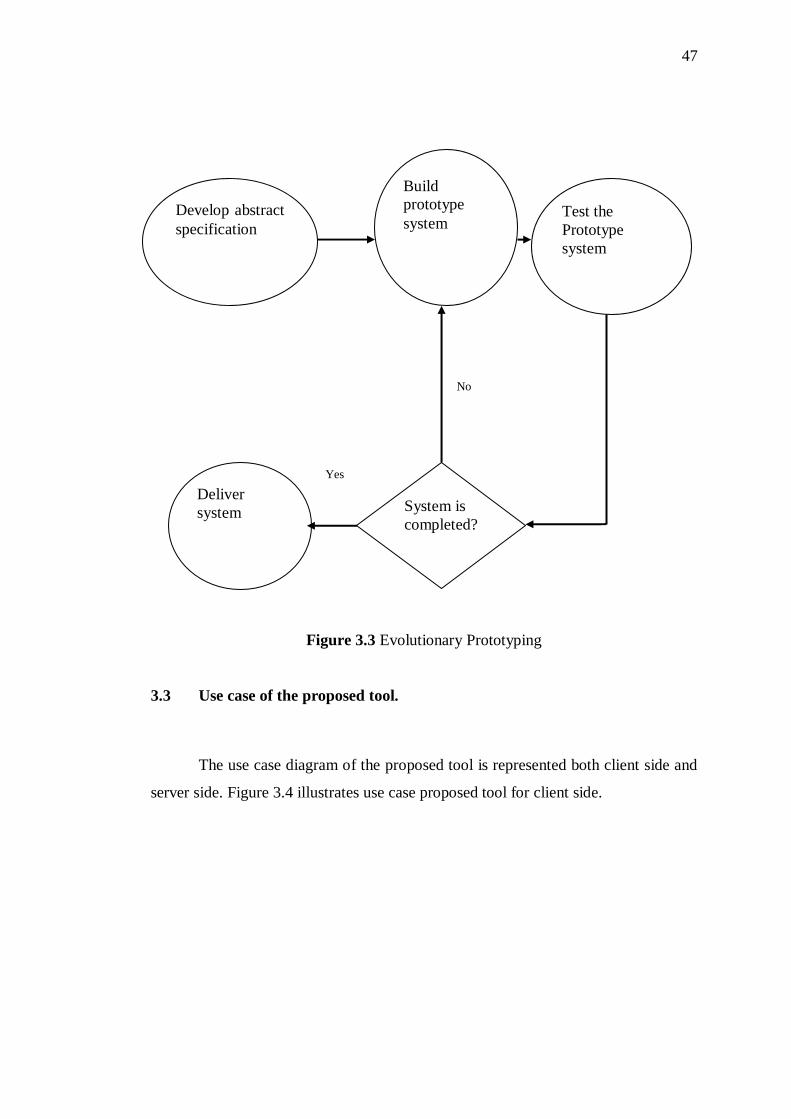
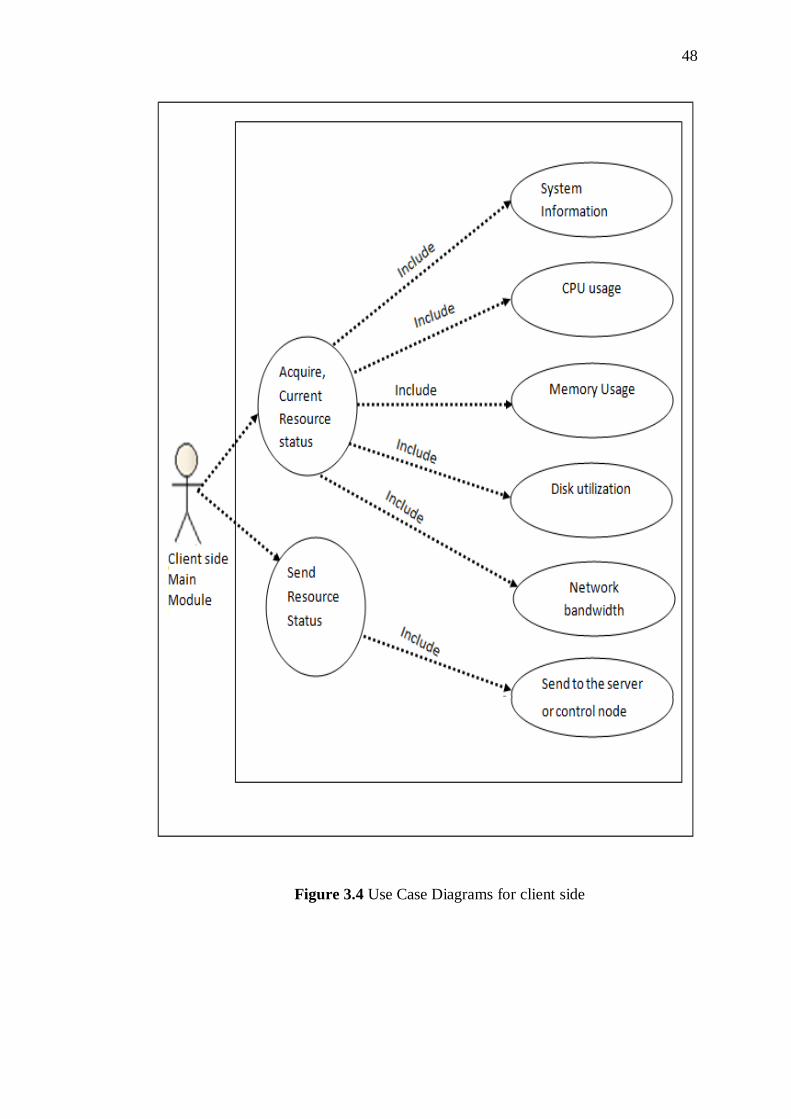


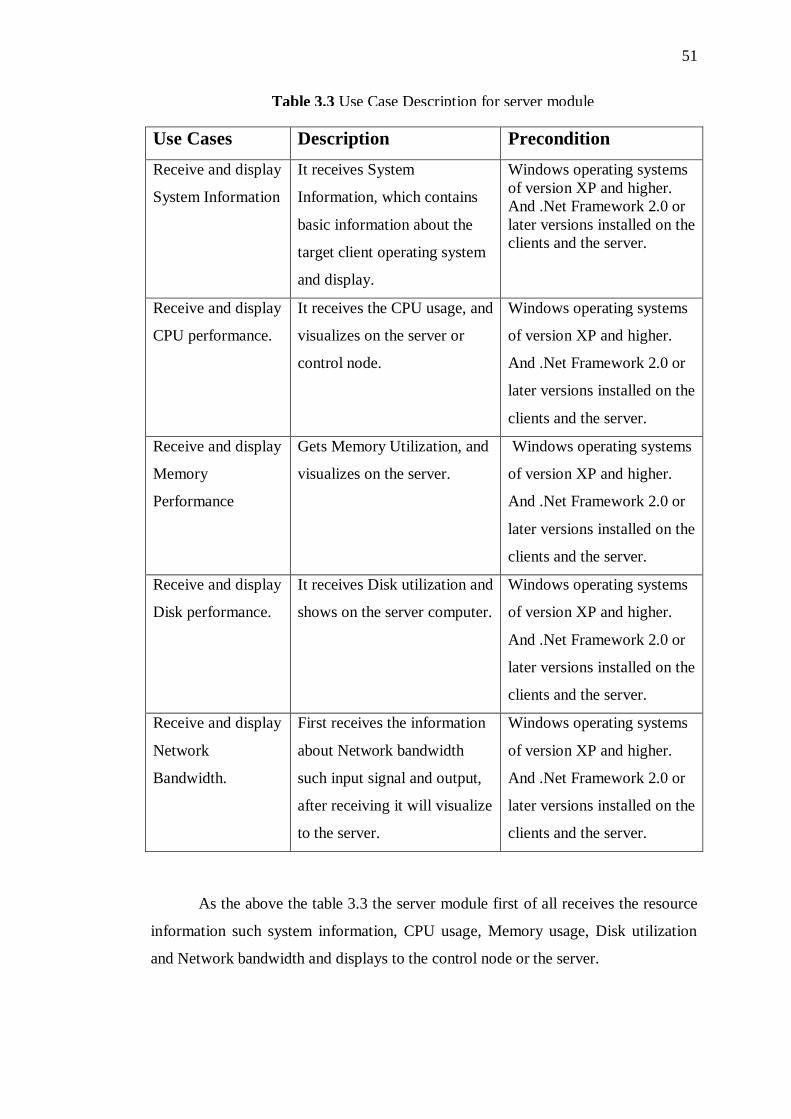


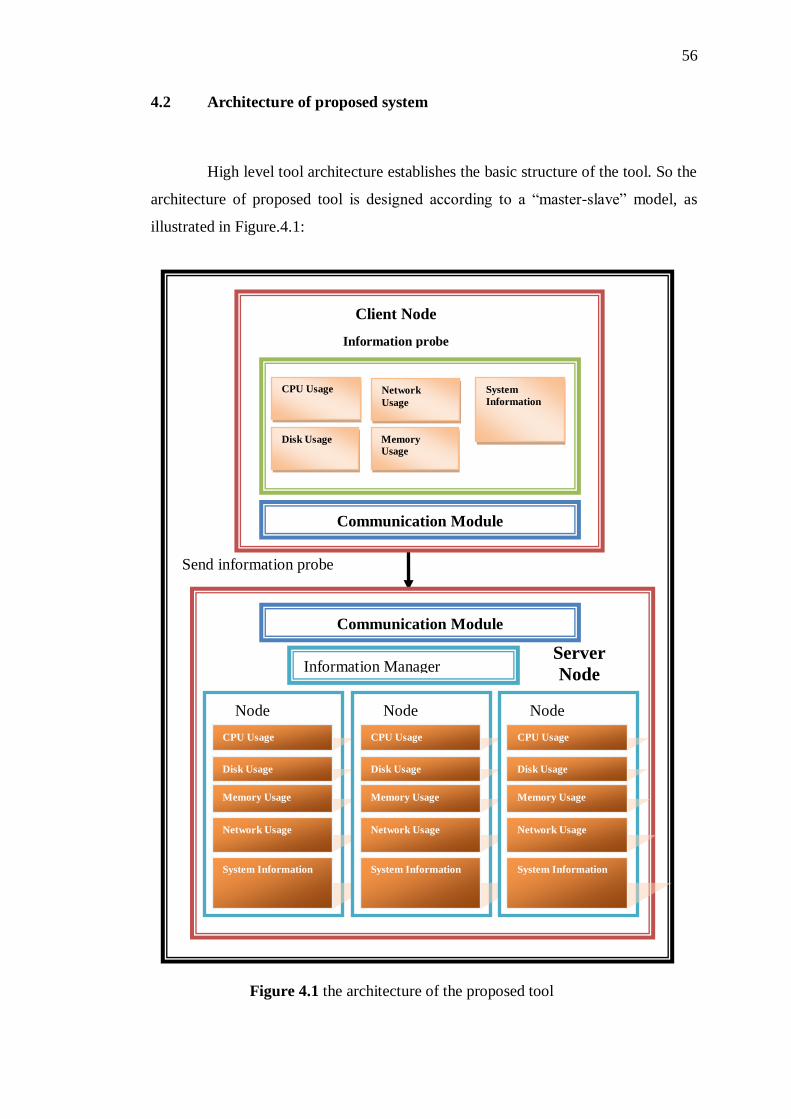

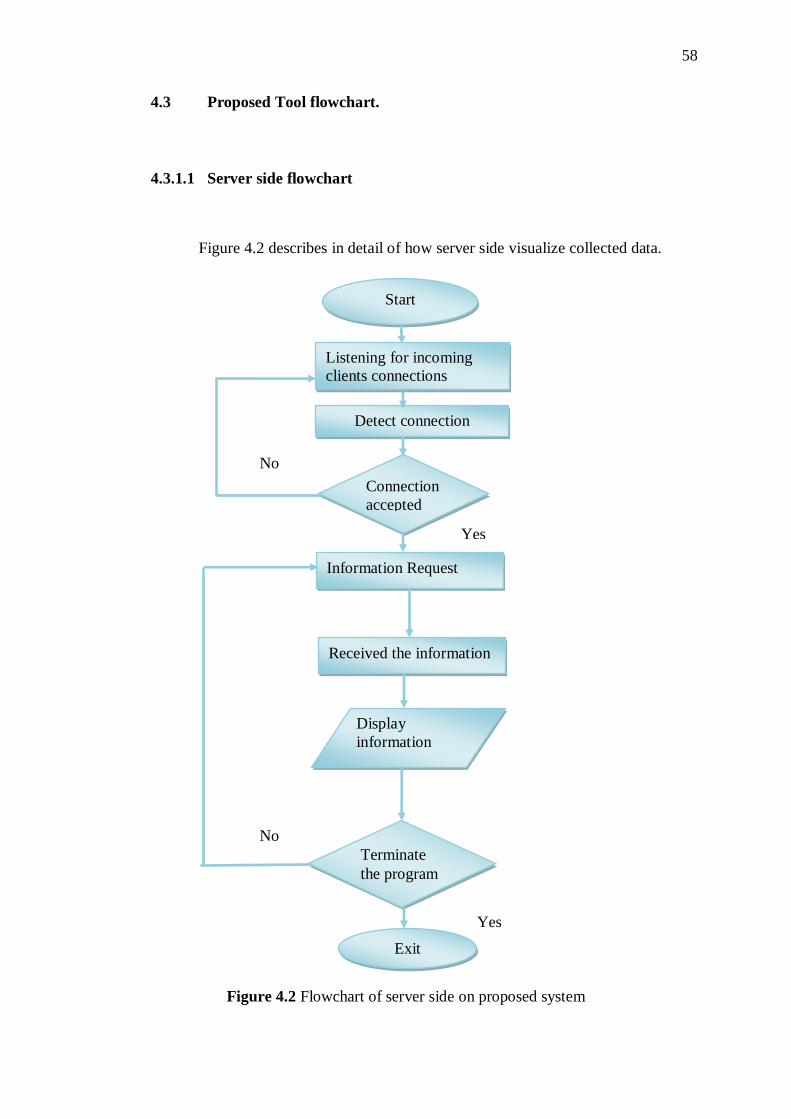

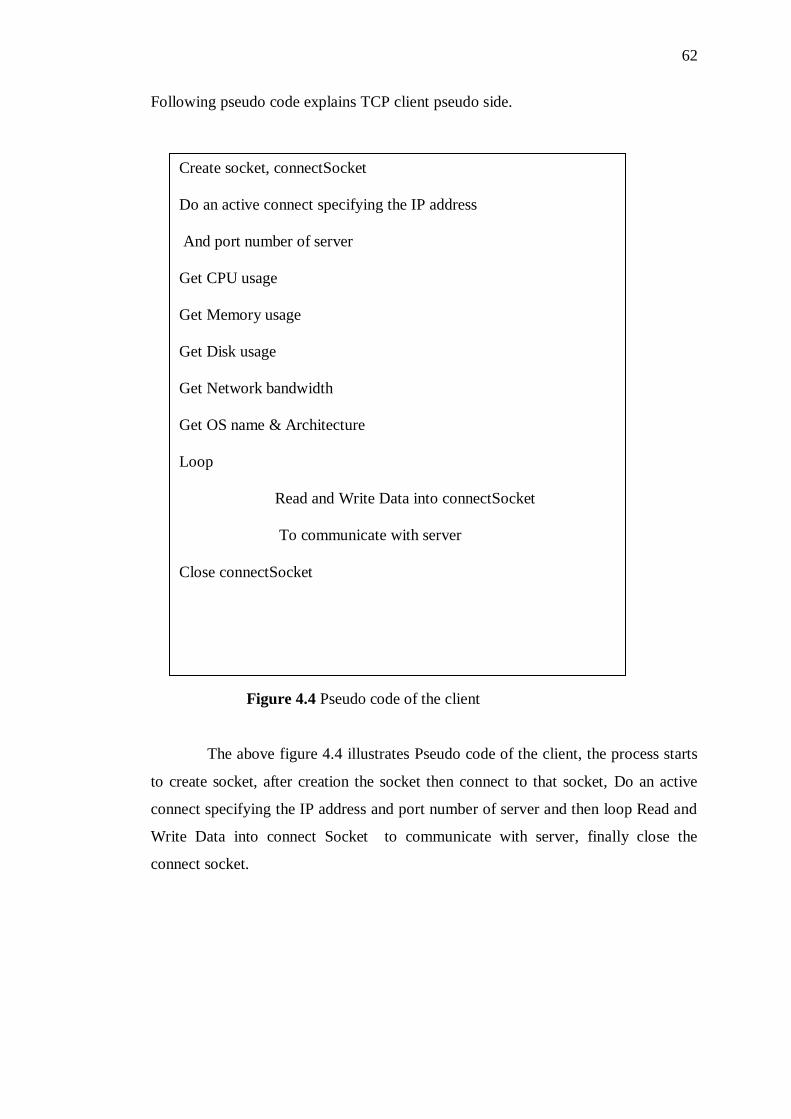


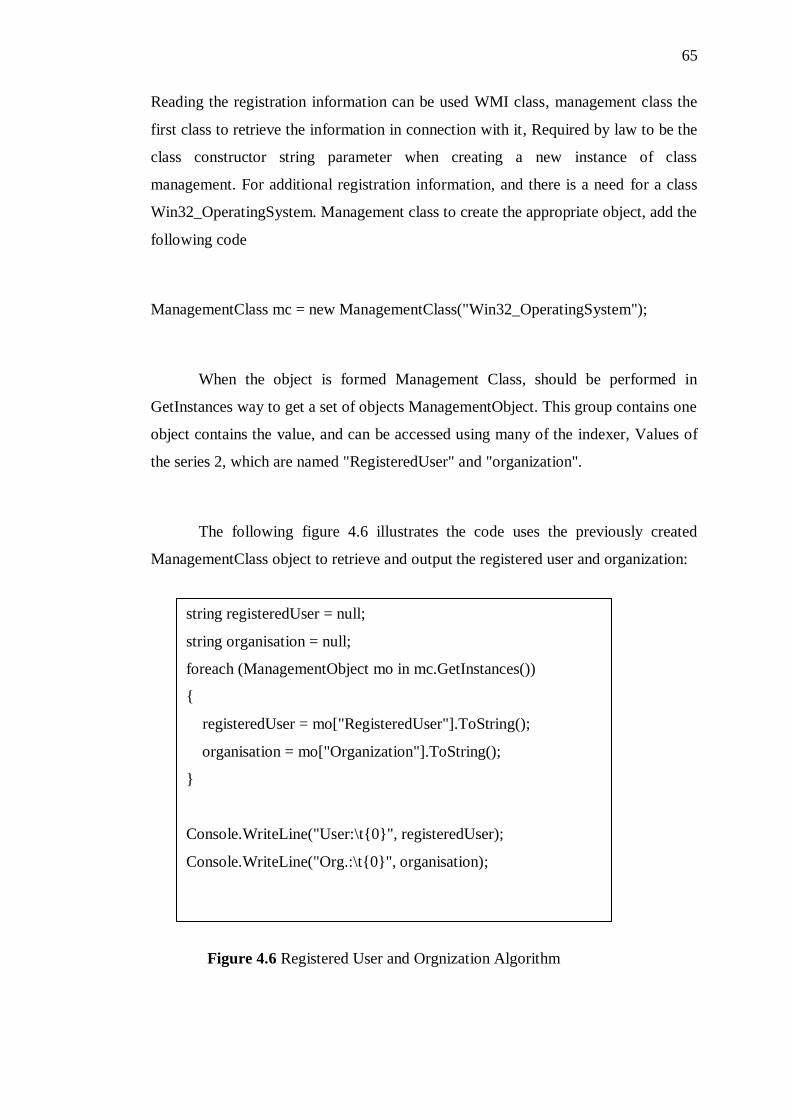
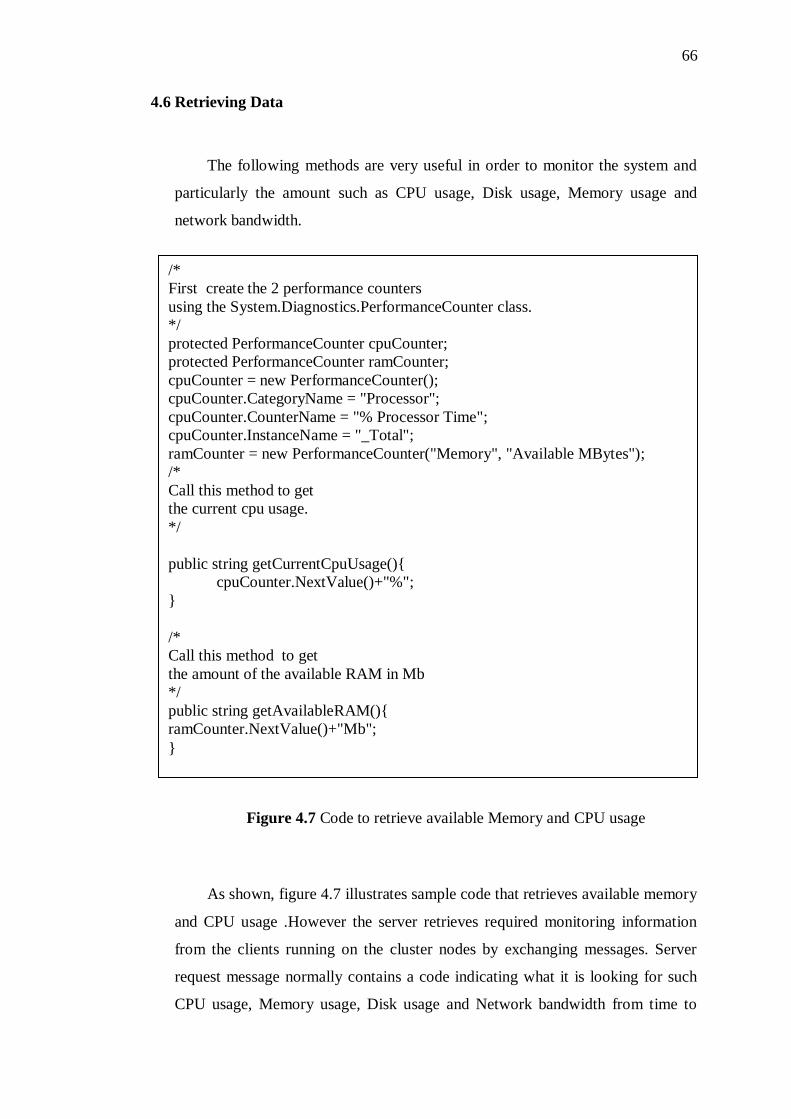
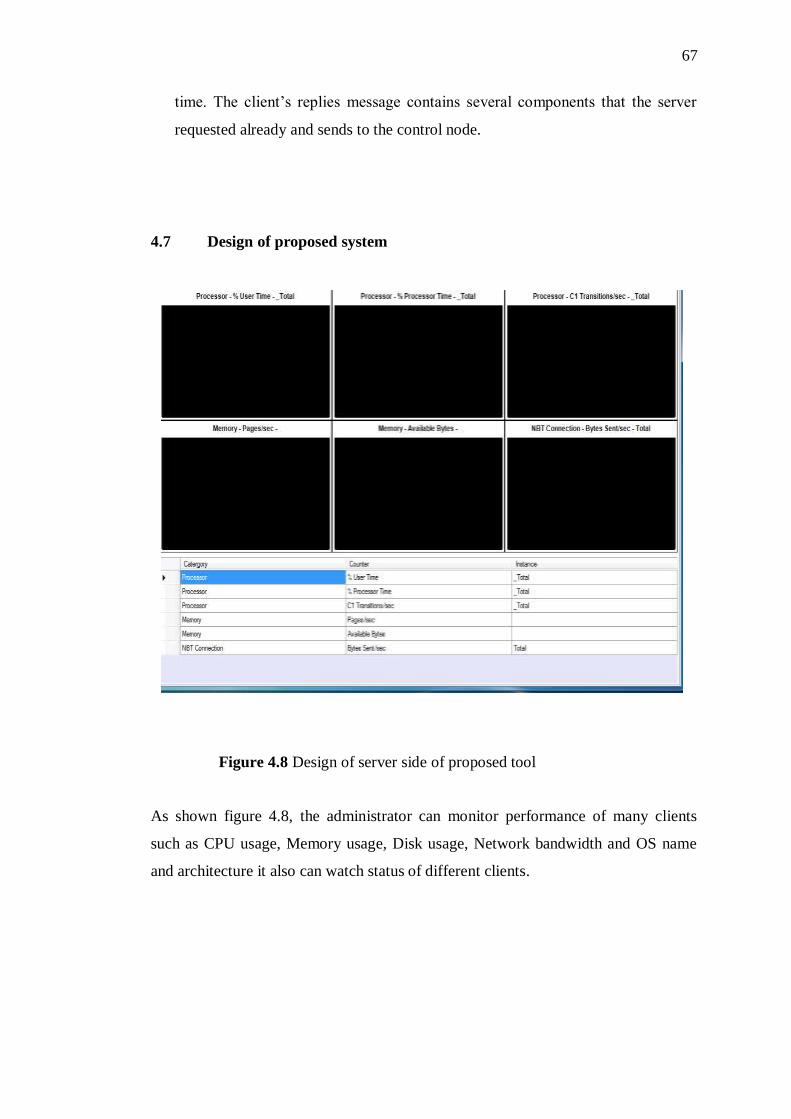
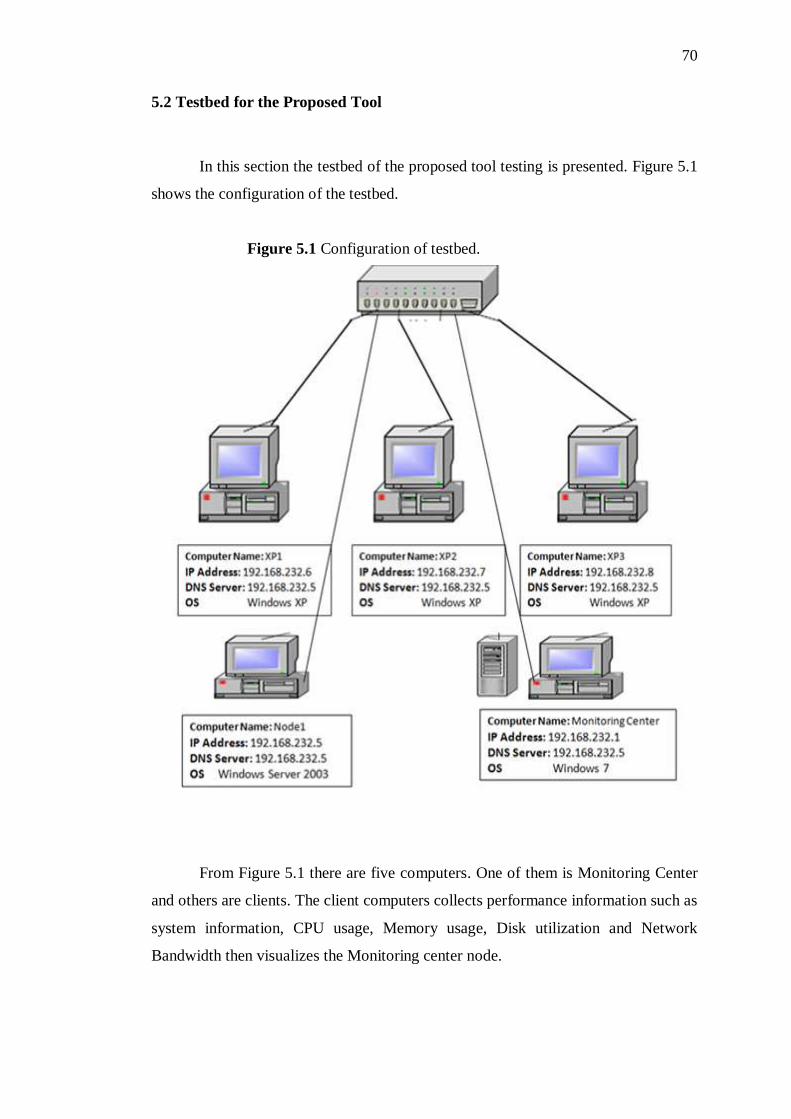
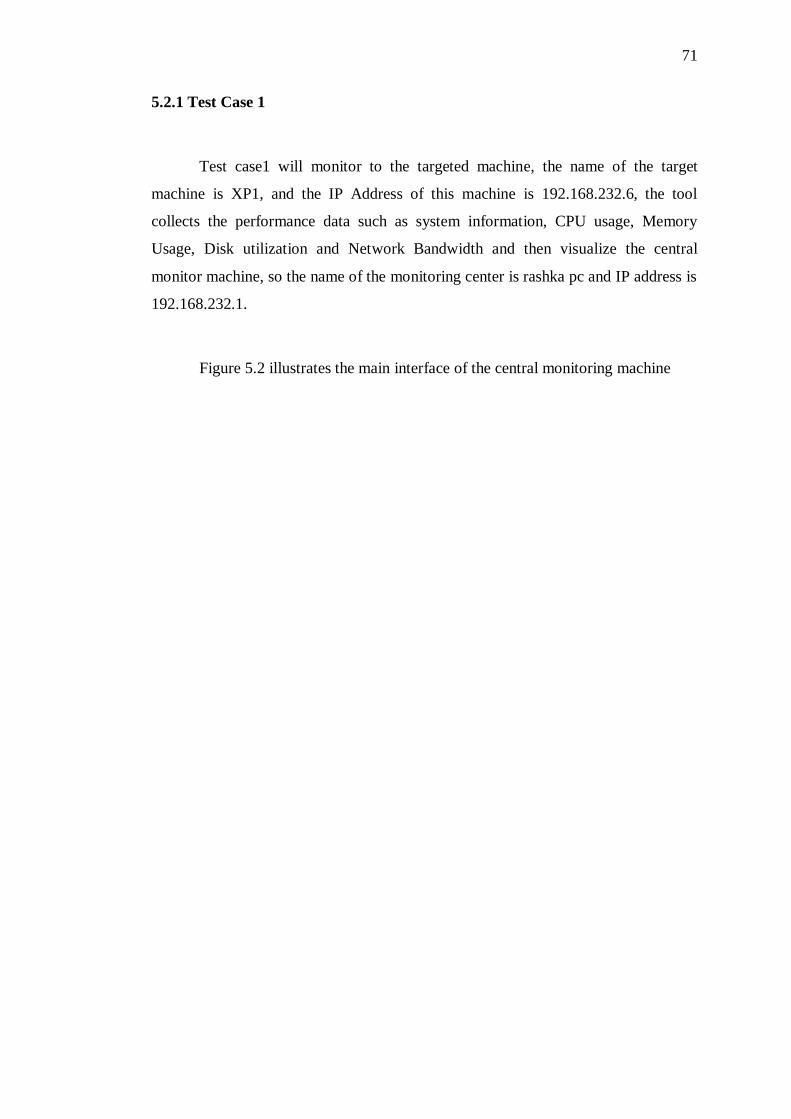
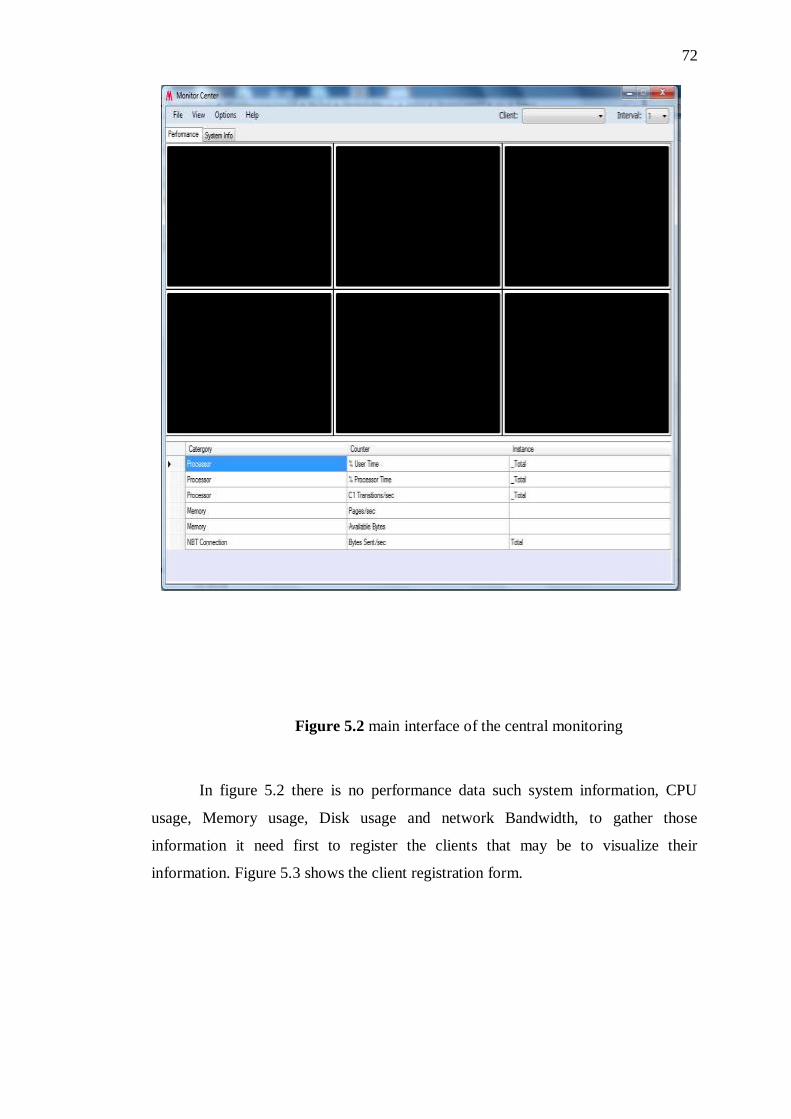


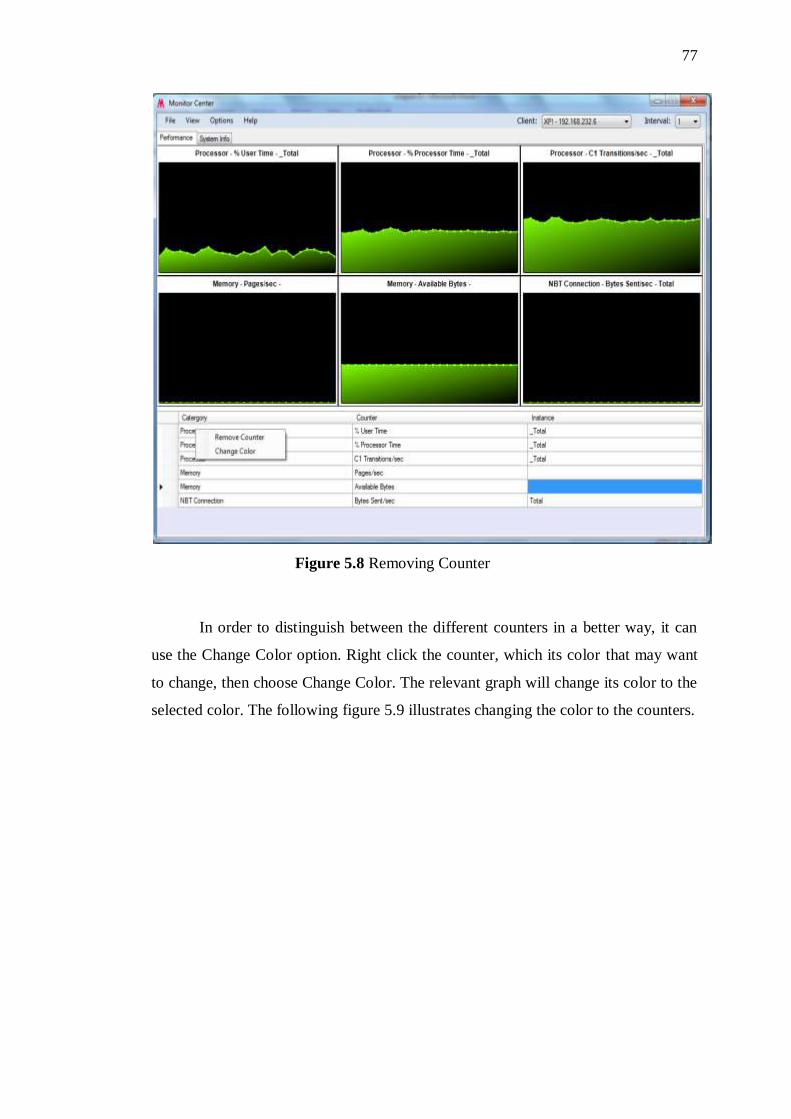
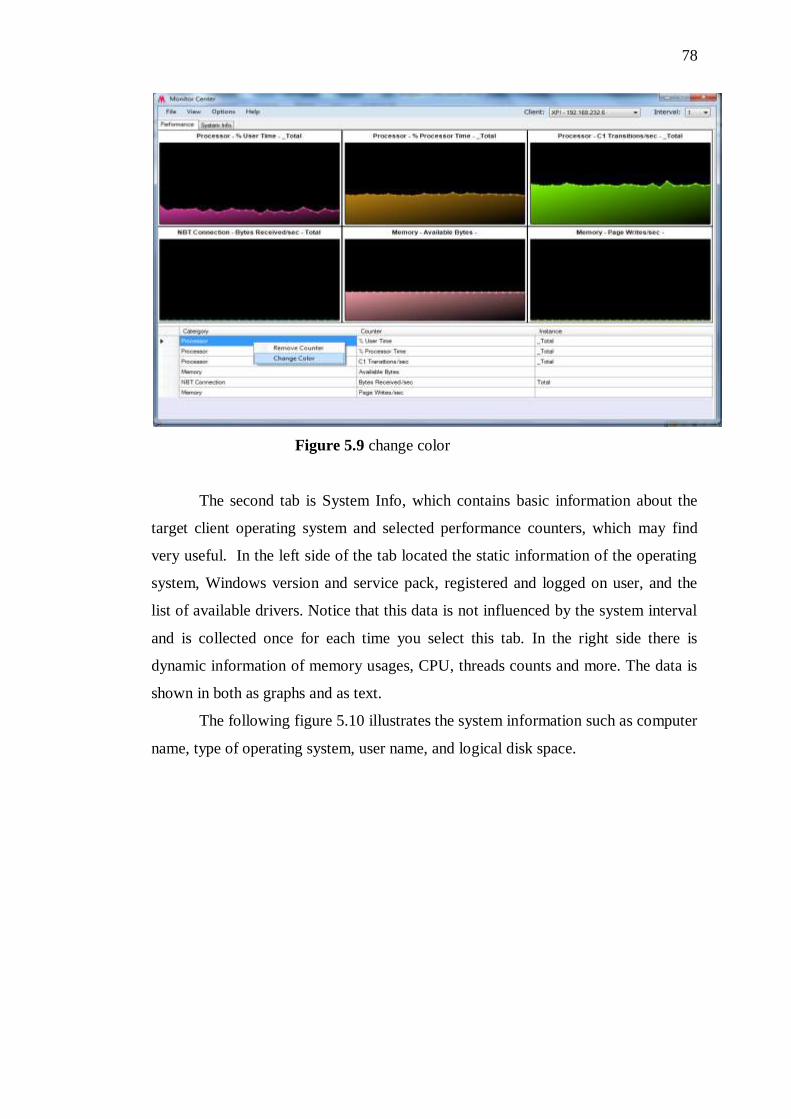
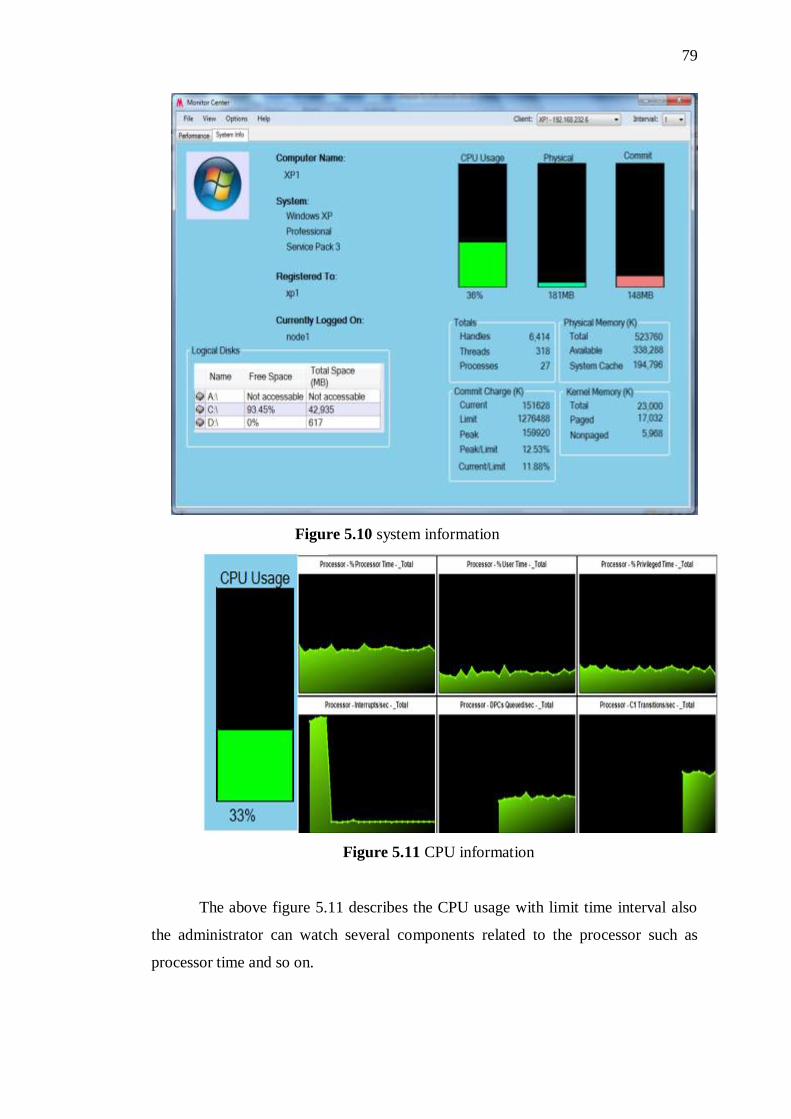
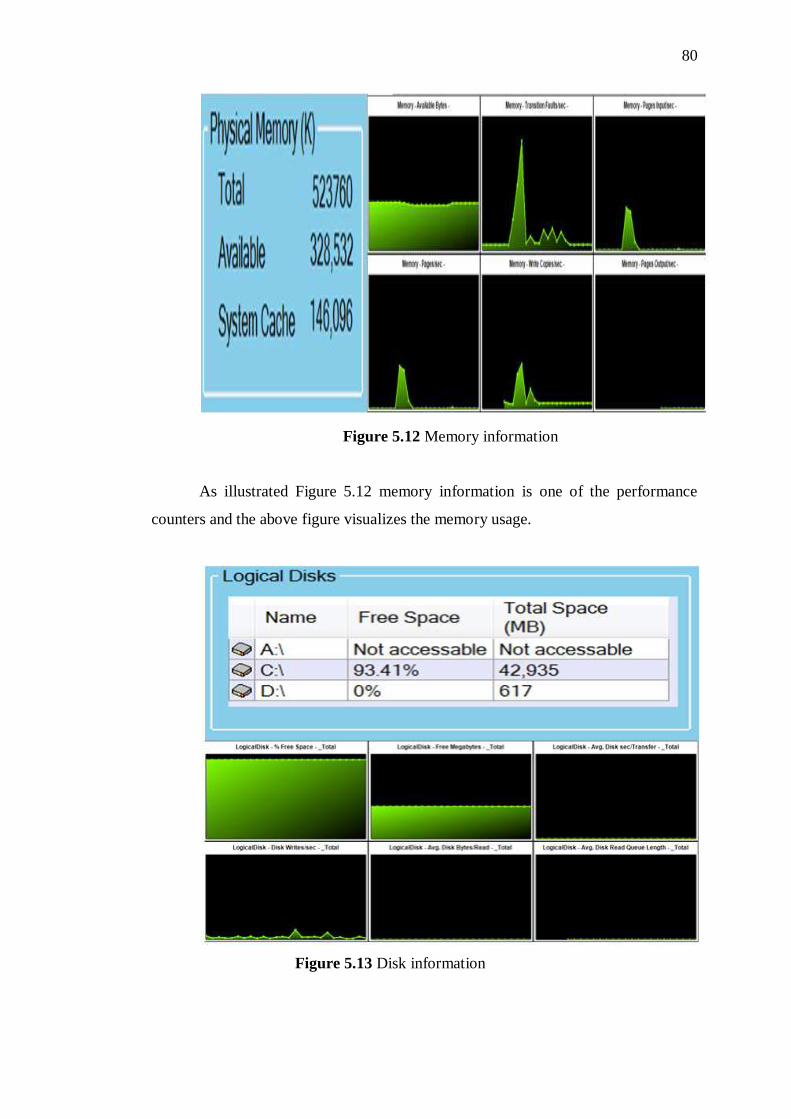
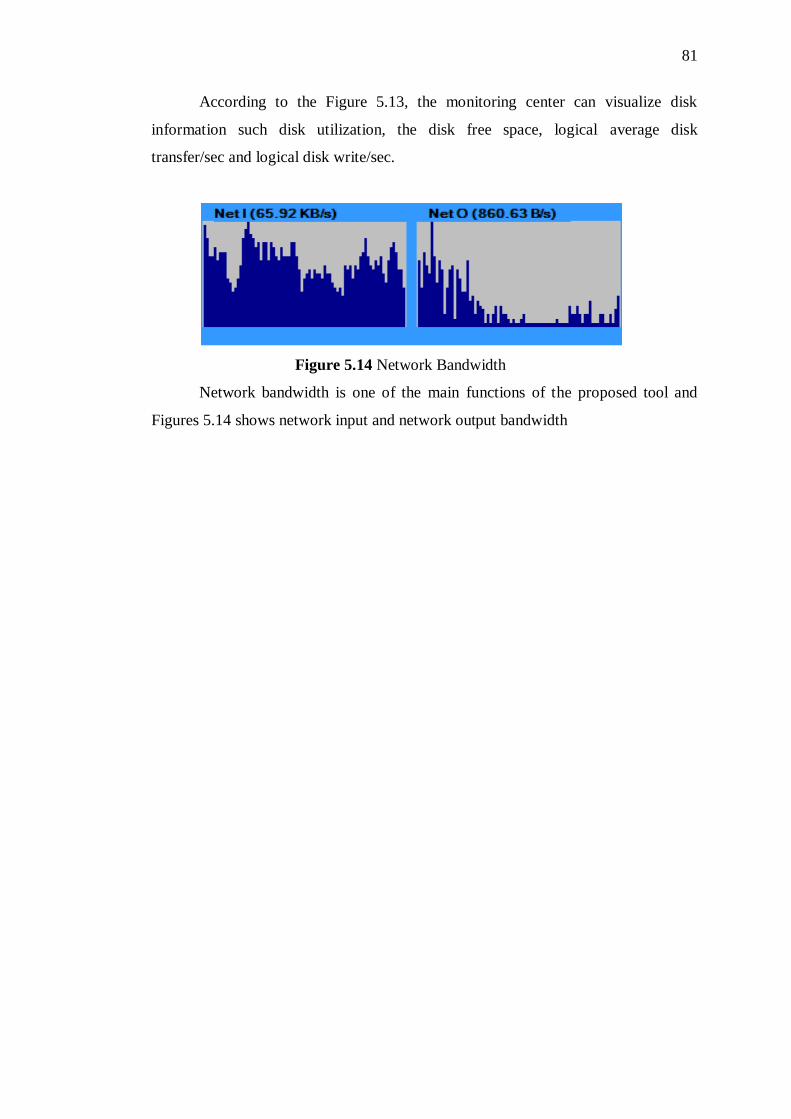
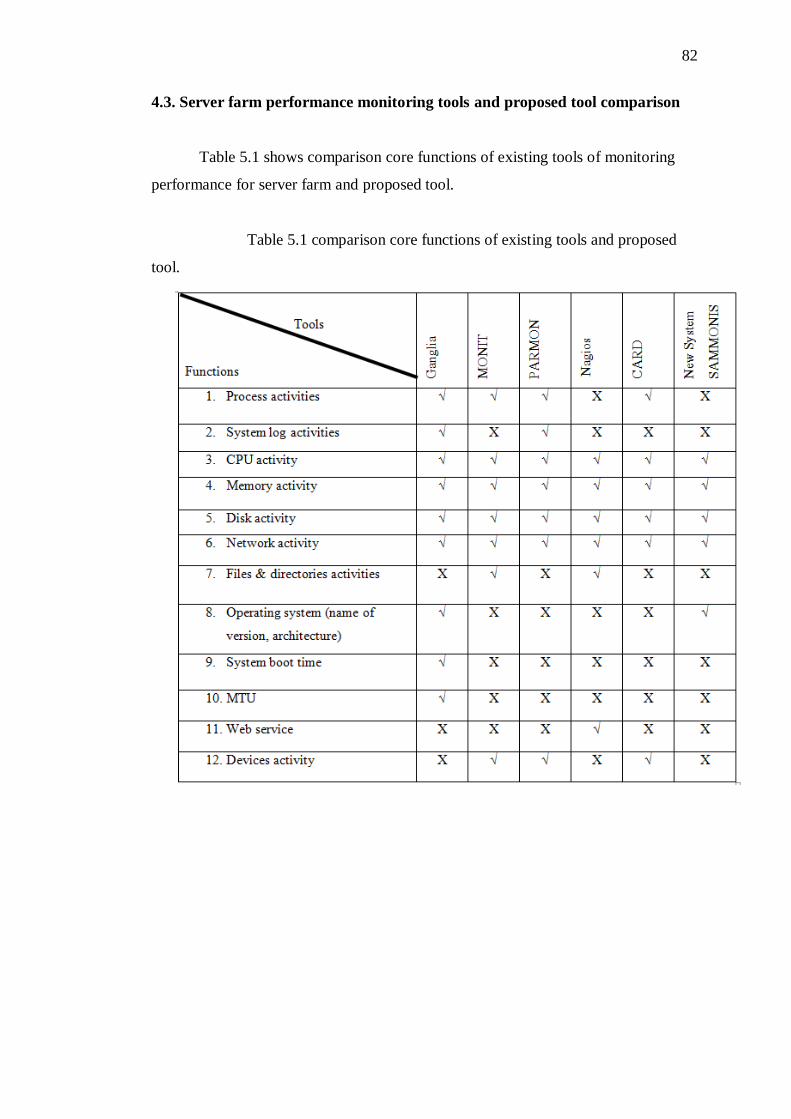


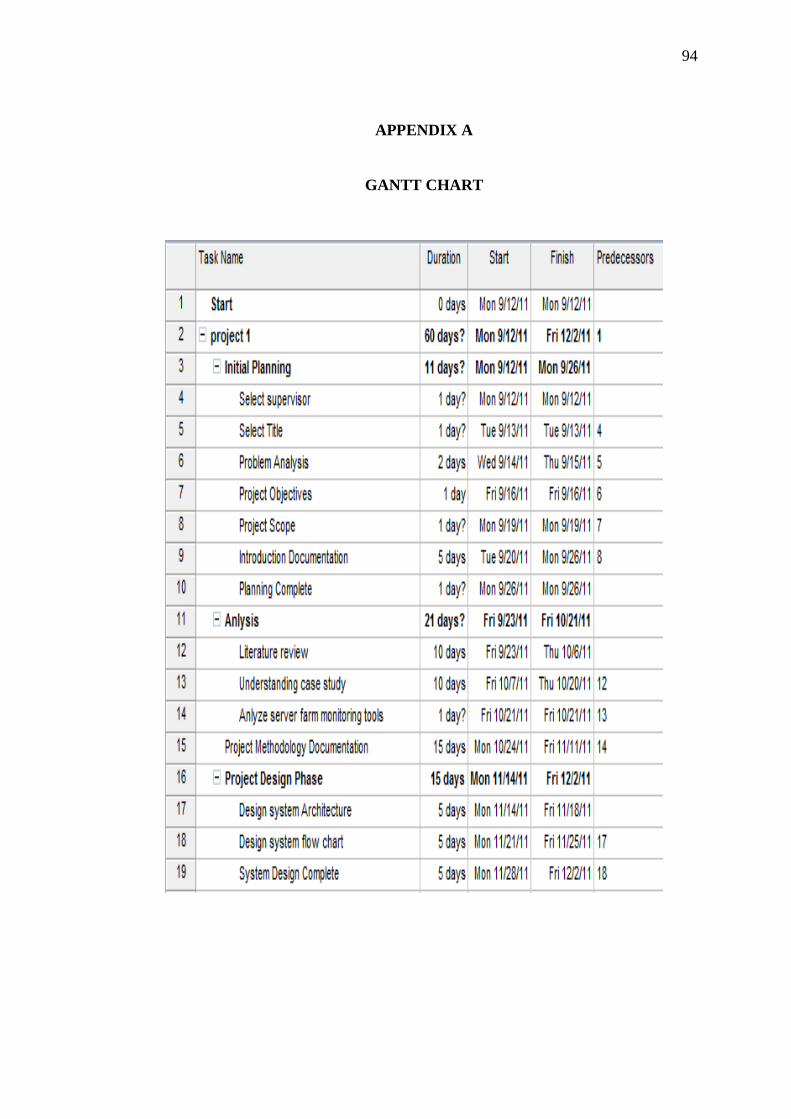
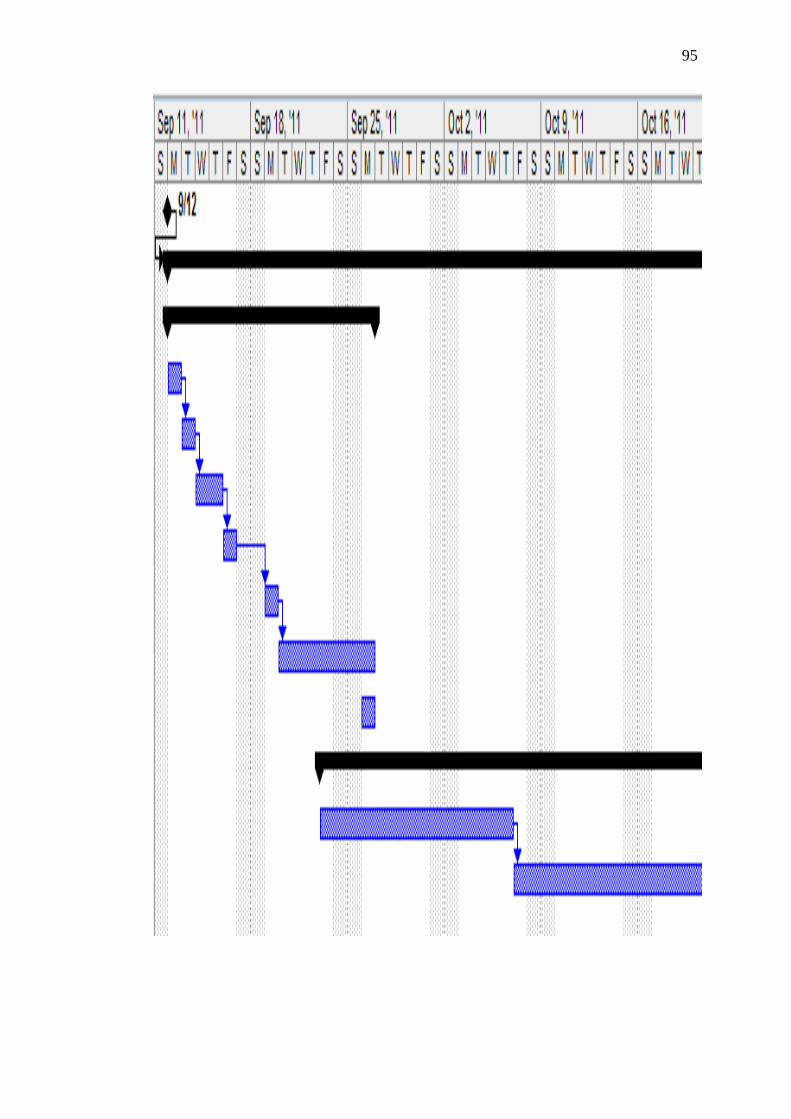


![Fermilab_Presentation_Filis_Coba [Repaired]](https://static.documents.pub/doc/80x56/58a044de1a28ab39648b4da1/fermilabpresentationfiliscoba-repaired.jpg)


![Constitution.pptx [Repaired]](https://static.documents.pub/doc/80x56/5695d1ab1a28ab9b029776f9/constitutionpptx-repaired.jpg)
![Aircel.pptx [Repaired]](https://static.documents.pub/doc/80x56/54e68d2b4a795943458b4ba7/aircelpptx-repaired.jpg)


