143
Annual report English 2012

1
StatnettAnnual report 2012
Kapittel 1Bakgrunn for prosjektet
Annual reportEnglish
2012

2
StatnettAnnual report 2012
Content
A word from the President and CEO 4
Highlights 2012 7 Grid report for the future 7 Statnett PAS 55 certified 8 Power cable between Norway and Germany 9 Statnett to build the world’s longest power cable 9 New grid plan for the Greater Oslo Area 10 Upgrading Mestervik switching station 10 The longest power line in Norway 11 First wind farm to receive electricity certificates 11 New power line in Rogaland Country 12 Upgrades needed in south-western Norway 12 Statnett – Norad collaboration 13 Mødalen-Samnanger in operation 14 New record electricity consumption 14
Finacial framework conditions 15 Key figures 18
Corporate social responsibility 19 Statnett’s corporate social responsibility reporting 19 Statnett and society 20 Climate and the environement 28 Our employees 31
GRI 38
Corporate governance 43 Corporate governance 43 Business 44 Share capital and dividend 45 Equal treatment of owners and transactions with closely related parties 45 Freely negotiable 46

3
StatnettAnnual report 2012
The enterprise General Meeting 46 Election committee 46 Corporate Assembly and Board of Directors: composition and independence 46 The work of the board of directors 47 Risk management and internal control 48 Remuneration of the Board of Directors 49 Remuneration of executive employees 49 Information and communication 49 Company takeover 50 Auditor 50
Board of Director’s report 51 Security of supply 52 Investments 55 Overview of major investment projects 56 Important project events in 2012 57 Research, development and competence building 58 Financial results 58 Risk 61 Employees and organisation 65 Corporate social responsibility 67 Environement and climate 67 Corporate governance 68 Outlook 69 Declaration from the Board of Directors and President and CEO 71
The Board of Directors 72
Finacial reporting 75 Statement of comprehensive income 75 Balance sheet 76 Statement of changes in equity 77 Cash flow statement 78 Notes 79 Auditor’s report 142

4
StatnettAnnual report 2012
A word from the President and CEO
A word from the President and CEO
WE ARE BuIlDInG THE nExT GEnERATIOn mAIn GRID – In A BAlAnCED WAy2012 was the year when the general public in earnest became aware that Statnett has started construction of the main grid of the future. We have obtained the first licences we need, we have the expertise and we are now fully focussed on pro-gressing with our projects. At the same time, reliable operations and safety will always be our number-one priority.
The power grid – a balancing actThere are major power fluctuations in our power system. Following a dry period in 2010/2011 with low inflow into the water reservoirs, we experienced a wet period and a good power situation from the spring of 2011 and throughout 2012. We went from historically low reservoir levels and a strained power situation to a period with high reservoir levels, followed by a normal power situation. After a period of import records, 2012 was a year with high power exports throughout the year. In January 2013, both electricity production and consumption records were set on different days in Norway.
Statnett must handle these situations, without consumers noticing, from day to day and from hour to hour. In recent years, we have seen an increase in people’s awareness of the importance of a reliable supply of power. The tolerance limit is probably lower than, say, 15 years ago, and the consequences of an outage have increased significantly.
The current climate changes make our balancing act even more challenging. The only long-term response is to make sure we have a stronger power grid, a task that we have already embarked on.
many ongoing projectsWe have stepped up our activities to develop the main grid of the future, but have not yet reached the desired investment pace. Whereas we invested just over NOK 3 billion in 2012, our aim is to increase annual investments to almost NOK 10 billion in a few years. We are developing our organisation accordingly, while working closely with regional grid companies and the supplier industry to secure good solutions and make sure we have the necessary capacity.
During the course of 2012, we acquired new licences and were allocated new tasks. We have, for instance, received a licence from the Norwegian Water
Auke Lont
President and CEO

5
StatnettAnnual report 2012
A word from the President and CEO
Resources and Energy Directorate (NVE) for Ofoten-Balsfjord-Hammerfest, and Statnett has made an investment decision in principle for the Ofoten-Balsfjord part. The activity level on the Ørskog-Sogndal line is high. We expect to complete Sima-Samnanger in 2013, the Skagerrak 4 subsea cable in 2014 and Ørskog-Sogndal in 2015. At the same time, upgrades are taking place in the south and east of Norway.
In the longer term, projects such as the Fosen project in central Norway will help Norway reach the goal of a renewable energy generation and consumption share of 67.5 percent in 2020. 2012 also represented a milestone in a climate perspec-tive, with the first green certificates being issued.
Flexible European marketThe strong fluctuations in the power system also demonstrate the importance of being part of a greater European market. When we experience the next dry year, it will result in a deficit in the Norwegian hydropower-based system. Consequently, we need access to power from other countries. The cables between Norway and Europe have functioned very well, both in terms of export and import of power. The cables play an important role in balancing the Nordic power system.
In the past year, we decided to proceed with two major international interconnec-tors, to Germany and the UK. The interconnectors are scheduled for completion in 2018 and 2020 respectively. We believe this is a balanced solution for every-one, be it a consumer in Oslo, a power plant in Indre Sogn, an aluminium plant in Høyanger or the wind turbines in Fosen. The upgrade of the domestic grid must take place in parallel with an upgrade of the power exchange capacity to other countries.
Internationally, the markets in north-western Europe became more closely con-nected following the launch of intraday trading on NorNed. Furthermore, Statnett is actively supporting further EU/EEA initiatives to promote a more efficient energy market.
Acceptance and support from societyMany parties are affected as we progress with our development projects. Consequently, Statnett has entered into an active and constructive dialogue with the affected parties, for instance in connection with Europe’s largest power line project Ofoten-Balsfjord-Hammerfest. During this project, Statnett maintains a constructive dialogue with all 13 municipalities and with reindeer husbandry inte-rests. In connection with the grid plan for the Greater Oslo area we have also established an early dialogue with more than 90 organisations, even though the specific projects will not be implemented for some time yet.
An important milestone of 2012 was the Norwegian government’s grid report «Building Norway – about grid developments». It is our job to put the expecta-tions to the power sector into words, both with regard to society’s need for a reliable supply of power, the opportunities for development of renewable power

6
StatnettAnnual report 2012
A word from the President and CEO
and to create new industrial activities. The grid report, which was endorsed by the Norwegian parliament, gave us a clear and specific mandate to continue our work. For instance, issues relating to a reinforced grid in northern Norway and the new international interconnectors are discussed and clarified in the grid report.
Moreover, the Ownership Report confirms that Statnett must be in a financial position which ensures that the enterprise is able to implement all socio-economi-cally profitable projects.
Cost-efficient developmentIn the updated investment plan, which was presented in the autumn, the invest-ment estimate has increased to NOK 50-70 billion for the coming decade. The high investment estimates are partly due to a broader investment scope and higher supplier costs, but also to greater uncertainty in a long-term perspective. In a situation with changing circumstances and where the supplier industry must be re-established after a decade of low activity, Statnett is developing the grid step by step and in a balanced way to ensure that the grid can be developed in a socio-economically viable manner at the lowest possible cost.
Statnett of the futureWe are creating a new Statnett. More than half of Statnett’s 1000 employees have joined the company in the last four years. In the interaction between experience and renewal we have developed a can-do and will-do company. This is reflected in the opening of our new head office in Nydalen in March 2013, as well as the new building in Trondheim which was opened in 2012.
This entails that we have an open plan office and common areas. We are lear-ning to communicate in a brand new way. Change is also evident in the organi-sation. As we are about to enter an intensive implementation phase, the Projects Division will change from a line organisation to a project organisation. The rest of the organisation will follow suit. We are talking about a change of culture as well as a change of mentality, to be able to complete the tasks and project we have committed to.
There are many challenges ahead, but we have what it takes to meet them. By maintaining an open dialogue, we must show that Statnett is a solid and attractive borrower. Through strong ICT expertise, we must ensure efficient and predicable communication between our plants, customers and production facilities. A new certification, PAS 55, will help maintain our assets in a systematic and cost-effici-ent manner. Clear HSE rules and, not least, a vibrant HSE culture, will help us to learn from past mistakes and prevent injuries and negative health effects.
The vision to build the next generation main grid is no longer just a vision. We have in earnest embarked on our task: to develop the grid of the future. However, we cannot do the job alone. We need sound long-term financial partners. We need solid and professional suppliers. And we need continued support from society.

7
StatnettAnnual report 2012
HighlightsGrid report for the future
Highlights
GRID REPORT FOR THE FuTuREStatnett will develop the next generation main grid, a plan endorsed by the Norwegian government. This emerges from a White Paper to the Norwegian par-liament, presented in March
The title of the report is ”Building Norway – about grid developments”, also refer-red to as the Grid Paper. In addition to endorsing main grid developments, the Norwegian government also emphasizes more efficient decision-making proces-ses for new grid projects.
According to the government’s assessments, the consequences of build-ing too few power lines are greater than the consequences of overinvestment. Furthermore, the government has pointed out that although the planning and lice-nsing process for power lines will still be an extensive and thorough process, the processing time must be reduced.
Changing the processFor Statnett progress of the power grid developments is also important.”We are are looking forward to changes that improves the social processes, whilst also reducing the processing time. Statnett will contribute by entering into constructive dialogues with affected parties in early phases and throughout the entire project development,” says Executive Vice President of Statnett, Gunnar G. Løvås.
The White paper proposes changes to the decision-making process. For instance, the Norwegian government would like to see political involvement at an early stage and to raise the power of decision to the level of the King in Council. The Norwegian Water Resources and Energy Directorate will remain the main energy authority for the licensing process. In addition, an external third party will review the project before it is submitted to the authorities. The government has pointed to the importance of grid companies involving stakeholders and affected parties at an early stage, to ensure that they have the opportunity to take part in the entire process.
more capacity in existing power linesA substantial part of Statnett’s projects involves upgrading power lines to a higher voltage level, where power lines are constructed in or along existing routes. The report states that it is positive if the grid companies can come up with solutions which will increase transmission capacity without major additional disruptions, such as voltage upgrades.

8
StatnettAnnual report 2012
HighlightsStatnett PAS 55 certified
STATnETT PAS 55 CERTIFIEDStatnett has been certified by Lloyd’s Register according to the quality standard PAS 55. The certification is part of Statnett’s ambition to strengthen professional operations and the development of the company’s own infrastructure.
PAS 55 is a standard representing best practice for asset management. Through audits conducted by Lloyd’s throughout 2012, Statnett has shown that the enter-prise satisfies the standard’s requirements.
Statnett owns and operates about 11 000 kilometres of power lines and cables and approximately 150 substations. The PAS 55 certification proves that Statnett has implemented important improvement measures and that the company does a good job of managing its own facilities in a comprehensive manner.
As PAS 55 certified, Statnett must demonstrate continuous improvement of the company’s asset management, thereby improving security of supply. Statnett aims to be a leader in professional operations and development of own infrastructure. The PAS 55 certification documents Statnett’s achievements in this respect.
Power trading is important for norwayThe Grid Paper also argues in favour of interconnectors: Power trading is impor-tant for security of supply in Norway. It contributes to efficient utilisation and helps protect the value of Norwegian hydropower. ”In addition to the extensive invest-ments we are planning to make in the domestic grid, Statnett is also planning to increase the capacity between Norway and other countries. We are therefore pleased that the Grid Paper endorses socio-economically profitable interconnec-tors,” Løvås says.

9
StatnettAnnual report 2012
HighlightsPower cable between Norway and GermanyStatnett to build the world’s longest power cable
STATnETT TO BuIlD THE WORlD’S lOnGEST POWER CABlEStatnett and the British company National Grid are cooperating on the construc-tion of a power cable between Norway and the UK, which will be the longest in the world. The project plays a key role in the development of the Northern European power grid.
After three years of planning and development, Statnett and National Grid signed an agreement in June 2012. The agreement confirms the parties’ commitment to continue the work on a subsea cable between Norway and the UK. The cable is expected to have a capacity of 1 400 MW and will be completed by 2020.
Both parties are now focusing on obtaining the required regulatory and environ-mental agreements and licences, and on procuring more than 700 kilometres of cable, as well as constructing two substations. A milestone for the project will be when the Norwegian licence application is submitted to the Norwegian authorities in the spring of 2013. The cable will be a keystone for grid developments in the countries bordering the North Sea and is a top priority for all parties involved.
POWER CABlE BETWEEn nORWAy AnD GERmAnyStatnett has entered into an agreement for the construction of a power cable bet-ween Norway and Germany. The project is a key part of the development of the Northern European power grid and the cable is scheduled for completion in 2018.
In 2012 Statnett, transmission system operator TenneT and the German state financial institution KfW signed an agreement for construction of a power cable between Norway and Germany. The new interconnector will promote further inte-gration of the Northern European power market. The project will thus support the ambitions for increased generation of renewable energy in the region and, conse-quently, the EUs and Norway’s climate and energy objectives.
Furthermore, the new cable will help strengthen security of supply and provide more stable electricity prices in the affected markets, by making the most of the differences in the power systems in Norway and on the Continent.
The cable has a planned capacity of 1 400 MW and is scheduled for completion in 2018. The completion date is based on an assumption that all licences necessary for the project are granted according to schedule, and that the suppliers are able to supply sufficient capacity in the relevant markets.

10
StatnettAnnual report 2012
HighlightsNew grid plan for the Greater Oslo AreaUpgrading Mestervik switching station
uPGRADInG mESTERvIk SWITCHInG STATIOnStatnett has been granted a licence for reconstruction and expansion of Mestervik switching station in Balsfjord. The upgraded facility is scheduled for completion and operation by the end of 2013.
In May 2012, the Norwegian Water Resources and Energy Directorate (NVE) gran-ted Statnett a licence for reconstruction and expansion of the Mestervik switching station in Balsfjord municipality in Troms. In the autumn of the same year, first ground was broken for the earthwork. This work involved re-laying of the tem-porary 132 kV cable between Bardufoss and Kvaløya. The work is now completed and the cable is in operation.
INEO, a French company with 14 500 employees, has been awarded the turn-key contract for Mestervik station. The company has special expertise in electrical engineering, information and communication systems and other related services. INEO has signed a contract with PEAB Bjørn Bygg, Tromsø for the subcontracting of the land and concrete work.
The licence decision entails demolishing the existing switching facility and replacing it with a new and upgraded facility. The service building will also be renovated. Start-up of the facility at the new Mestervik station is scheduled before the end of 2013.
The new switching station in Mestervik will improve security of supply in the region. Mestervik switching station will also be vital for the construction of the new 420 kV power line between Ofoten and Hammerfest.
nEW GRID PlAn FOR THE GREATER OSlO AREAPoliticians and other interest groups are positive to the opportunities represented by Statnett’s alternatives analyses for the Greater Oslo grid plan.
Improved security of supply, free-up of areas, fewer pylons close to residential areas and in the forested areas surrounding the capital, as well as facilitating for social development, are some of the benefits of the Alternatives Analysis for a Greater Oslo grid plan.
Governing Mayor Stian B. Røsland, Member of Parliament Jan Bøhler, Chief Adviser Oddvin Lund of the Norwegian Trekking Association and CEO of Enova Nils Kristian Nakstad were all positive to the process initiated by Statnett to estab-lish future grid solutions for the Greater Oslo area.
The main conclusions from the analysis include:1 No new routes.2 Upgrading the voltage and clearing up the main grid will provide the Greater
Oslo area with a more robust and reliable power grid.3 Capacity will increase by 60 percent, whereas area use will be reduced by 30
percent.

11
StatnettAnnual report 2012
HighlightsThe longest power line in NorwayFirst wind farm to receive electricity certificates
FIRST WInD FARm TO RECEIvE ElECTRICITy CERTIFICATESÅsen II wind farm in the municipality of Time in Rogaland County was the first wind farm to receive electricity certificates in Norway.
The wind farm started full-scale production of wind power on 8 March 2012. The Åsen II wind farm, which is owned by Solvind Åsen AS, has an installed capacity of 1.6 MW and a mean annual production of 4.9 GWh, corresponding to one year’s consumption for about 250 households.
Åsen II has made history in two ways, as far as electricity certificates are concer-ned. Firstly, it is the first wind farm to be granted electricity certificates in Norway. Secondly, it represents the first Norwegian contribution to Sweden and Norway’s common objective of developing 26.4 TWh of new renewable power generation in the period 2012-2020.
Statnett is responsible for keeping the electricity certificate register in Norway. This means that Statnett, among other responsibilities, issues electricity certificates to approved power plants. During the period from 1 January 2012 to the first quarter of 2013, Statnett issued 12 573 electricity certificates to 26 different power plants in Norway.
THE lOnGEST POWER lInE In nORWAyStatnett is planning to build what will become the longest power line in Norway. More than 500-kilometre long line will pass through three counties and help develop an entire region.
In May 2012, the Norwegian Water Resources and Energy Directorate granted Statnett a licence for the construction and operation of a 420 kV power line from Ofoten in the north of Nordland County, via Balsfjord in Troms, and all the way to Hammerfest in Finnmark County. The input that Statnett received prior to the lice-nce decision has contributed to a good solution which will significantly improve security of supply in the region.
In January 2013, the Statnett Board of Directors made an investment decision in principle for the southern section from Ofoten to Balsfjord. At the same time, the Board of Directors decided that the work on the northern section from Balsfjord to Skaidi will continue with the aim of realising the whole project.
The power line will play a key part in the further development and growth in the northernmost region in Norway. Moreover, the project will pave the way for new renewable energy production in the region and make up an important part of the next generation main grid.

12
StatnettAnnual report 2012
HighlightsNew power line in Rogaland CountyUpgrades needed in south-western Norway
uPGRADES nEEDED In SOuTH-WESTERn nORWAyTo ensure reliable operations and create new opportunities for use, the electricity grid from Kristiansand to Sauda must be upgraded.
This is the conclusion of two new Statnett reports. The electricity grid in southern Norway is already strained. An increase in the production of renewables, security of supply, interconnectors to Germany and the UK, as well as future energy con-sumption, will require a more robust grid.
«That’s why it is very important to upgrade the grid from Kristiansand to Sauda, the so-called Western Corridor,» says Senior Vice President Communications Kristian Marstrand Pladsen of Statnett.
To increase capacity quickly, it is necessary to first upgrade the voltage on the Kristiansand-Sauda section to 420 kV, and reinforce the Lyse-Duge and Solhom-Duge sections. Then, the Lyse-Sauda section must be reinforced, which will pro-vide two high-capacity interconnecting connections between Sauda and Feda and enable installation of an interconnector to Kvilldal. Finally, the Solhom substa-tion must be upgraded to 420 kV.
«This will ensure a robust grid with high capacity, facilitating for future needs. Moreover, it will enable an increase in the renewables production in southern and western Norway, and ensure sufficient capacity for future grid reinforcements in the northern region of western Norway,» Pladsen says.
nEW POWER lInE In ROGAlAnD COunTyStatnett has constructed a new power line from Sauda to Liastølen. The new power line came online in the summer of 2012, and contributes to a more reliable supply of electricity in the region.
The new power line in Rogaland is a small, but vital piece of Statnett’s long-term project of building the next generation main grid. The power line will provide an important foundation for the development of a coastal electricity ”highway”.
The new 420 voltage power line covers 29 kilometres between Sauda and Liastølen. In addition, the existing power line to Saurdal will be upgraded from 300 kV to 420 kV.
The cost of the new power line was just under NOK 200 million. Of this, NOK 14 million has benefitted local businesses in Sauda, Sand and Suldal.
Statnett has extensive investment plans for the Norwegian grid in the coming decade. Statnett’s ambition is to establish the next generation main grid by upgra-ding the existing 300 kV power lines and constructing new 420 kV power lines.
Pho
to: M
arita
Ims,
Sul
dals
post
en.

13
StatnettAnnual report 2012
HighlightsStatnett - Norad collaboration
STATnETT - nORAD COllABORATIOnStatnett and Norad have entered into a collaboration agreement which will strengthen the efforts to increase expertise in grid companies in developing coun-tries.
The objective is to improve grid companies in developing countriesThe agreement encourages interaction between the technical expertise in Statnett and the Norwegian Agency for Development Cooperation’s (Norad) development work.
“After having worked in East Africa for more than five years, we find that it is important to increase expertise in the grid companies, so that they can realise socio-economically profitable investment projects themselves. Norad has the same priority, and it is positive that we will now be able to learn from each other,” says President and CEO of Statnett Auke Lont.
Reduces povertyNorad has entered into collaboration agreements with various institutions, and Director of Norad Villa Kulild is pleased that they now have an agreement with Statnett.
”Statnett’s expertise is important to improve grid operations and make them more efficient, and to ensure a more reliable supply of electricity. We know that access to a reliable energy supply is essential for social and economic development. Businesses and industries often quote a poor power supply as the reason they don’t invest. Economic growth is vital for reducing poverty and energy is neces-sary to create jobs, establish businesses, promote industrial activity and stimulate commercial activities,” Kulild says.
She emphasises that sustainable and stable energy services at affordable prices are essential for reducing poverty in developing countries, and thus for achieving the millennium development goals.
“Access to energy affects many aspects of a person’s life, in terms of health, edu-cation, environment and their financial situation,” Kulild says.
Step by stepStatnett has already established collaboration projects with transmission sys-tem operators in Tanzania and Uganda. Such projects are also in the pipeline for Kenya and Mozambique. The goal is to establish a formal collaboration between the transmission system operators in the region.
“A close cooperation characterised by trust between the grid companies in a region is essential to ensure the best possible utilisation of the resources available. Furthermore, it is important to cooperate on optimal development of power grids between countries. In our experience, it’s all about taking one little step at the time before you see results of the collaboration. In this respect, African countries can learn a lot from the Nordic region,” says Auke Lont.

14
StatnettAnnual report 2012
HighlightsMødalen-Samnanger in operationNew record for electricity consumption
nEW RECORD FOR ElECTRICITy COnSumPTIOnOn Wednesday 23 January 2013, Norwegian power consumers broke the record for electricity use in one single hour. The new record is 24 180 MW.
Between 8 and 9 a.m. on this Wednesday morning in January, a new electricity consumption record was set in Norway in one single hour. The new record is 24 180 MW, or just over 24 million kilowatt hours.
The main reason for the high consumption was that at that time the temperature was below zero degrees Celsius in the whole country. It was particularly cold in southern and eastern Norway, where the population density is highest. The old record, 23 994 MW, was set on 6 January 2012.
Despite the record-high consumption and correspondingly high production, this did not affect the supply to end-users. High reservoir water levels, good access to production and no major faults in the main grid ensured stable operations and supplies, also on what was to become one of the coldest days all winter.
The Norwegian consumption is generally high on cold days and we have observed that peak power consumption is higher for each year. Consequently, we have to make sure that the system is able to handle even higher consumption peaks in the future. It is therefore important to strengthen the power grid in the whole country, a task that Statnett has already embarked upon.
møDAlEn-SAmnAnGER In OPERATIOnThe reconstruction of the existing power line between Mødalen and Samnanger will help increase transmission capacity between the northern and southern regi-ons of Western Norway, without increasing the number of pylons.
In connection with the construction of the power line between the Sima power plant and Samnanger substation, Statnett also rebuilt the existing power line bet-ween Mødalen and Samnanger. The new power line has been constructed for 420 kV voltage, whereas the old power line was for 300 kV. The project is part of a long-term project of upgrading the national main grid to 420 kV. The new section, which is about ten kilometres long, entered operation in June 2012. The section is part of the power line between Mauranger and Samnanger.
As the rest of the 300 kV grid is upgraded, more power can be transmitted bet-ween Western Norway’s northern and southern regions, without increasing the number of pylons. Further upgrades can be conducted after the Sima-Samnanger power line has entered operation, ensuring that security of supply is acceptable when some sections are disconnected for reconstruction.

15
StatnettAnnual report 2012
Financial framework conditionsStatnett’s revenues
Financial framework conditions
Statnett´s revenuesStatnett’s reported revenues consist of fixed grid tariffs from the main grid custo-mers and congestion revenues. Congestion revenues arise when electricity is transmitted from areas with low electricity prices to areas with high electricity pri-ces in the Nordic region and between Norway and the Netherlands. Grid tariffs are established prior to each calendar year.
The revenues are adjusted and controlled by the authorities through the Norwegian Water Resources and Energy Directorate (NVE) and it is annually established a permitted revenue. The permitted revenue will cover the costs of grid develop-ments and maintenance, and provide a reasonable return on the grid assets. This is based on the assumption that the transmission grid is operated, utilised and developed in an efficient way.
If the actual revenues diverge from the permitted revenue, higher or lower revenue will occur. In accordance with regulations from NVE, higher/lower revenue will even out over time through adjustment of future grid tariffs. Consequently, the higher/lower revenue represents temporary amounts in Statnett’s accounts.
To better understand Statnett’s underlying results, some key figures are presented adjusted for higher/lower revenue.
Revenue and result developmentSince 2008, Statnett has had significant higher/lower revenue. This has resul-ted in major fluctuations in Statnett’s recognised operating revenues and profit/loss. Revenues and profit or loss adjusted for higher/lower revenue shows that the underlying activities are much more stable than the accounts including higher/lower revenue. Statnett’s underlying revenues and profit for 2012 were on the same level as for 2011.
As Statnett’s grid activities are
monopoly-based, the company’s
revenues are regulated and con-
trolled by the Norwegian Resour-
ces and Energy Directorate (NVE).
2500
5000
0
-25002008 2009 2010 2011 2012
EBIT adjusted for higher/lower revenue
EBIT (IFRS) EBIT adj. for higher/lower revenue
MNOK

16
StatnettAnnual report 2012
Financial framework conditionsStatnett’s revenues
Higher/lower revenue developmentIn recent years, Statnett’s has predominantly had higher revenue. Accumulated higher revenue including interest was NOK 3 455 million at the end of 2012. Several factors have contributed to the accumulation of higher revenue.
2008: Statnett had a higher revenue, mainly due to higher congestion revenues than expected from NorNed during its first year of operation.
2009: Congestion revenues were low this year due to damage to the NorNed cable, and Statnett had a lower revenue of NOK 1 061 million.
2010: To cover the lower revenue, grid tariffs were increased in 2010 compared with 2009. Moreover, congestion revenues were higher in 2010 than assumed for a normal year. In total, this resulted in a higher revenue of NOK 2 187 million.
2011: Due to the accumulated higher revenue at the end of 2010 of NOK 1 554 million, somewhat lower tariffs were stipulated for 2011. Congestion revenues were however higher than expected in 2011, and the higher revenue totalled NOK 1 064 million. Accumulated higher revenue including interest was NOK 2 617 mil-lion at the end of 2011.
2012: On the basis of accumulated higher revenue, the tariffs were further reduced in 2012. The higher revenue for this year was due to higher congestion revenues than assumed, as well as somewhat lower permitted revenue due to lower inter-est rates and thus lower return on grid assets. In 2012, Statnett’s higher revenue amounted to NOK 838 million, after having taken into account the decision by NVE to change the revenue cap for previous years of NOK 272 million. Accumulated higher revenue including interest was NOK 3 455 million at the end of 2012.
Repayment of higher revenueStatnett has outlined a price strategy which sets the framework for stipulation of the annual main grid tariff. In accordance with the guidelines from the Norwegian Water Resources and Energy Directorate (NVE) Statnett emphasises considera-tion for stable and predictable grid tariffs over time. Consequently, repayment of higher revenue will take place over several years.
Year Accumulated
350030002500200015001000500
-500-1000-1500-2000
0
2008 2009 2010 2011 2012
Statnett´s higher/lower revenue over timeMNOK

17
StatnettAnnual report 2012
Financial framework conditionsStatnett’s revenues
Investments influences revenues and balance sheetCompleted investments are included as basis for Statnett’s permitted revenue, while investments recorded as plant under construction are not included. In 2008 the NorNed link was completed and the reserve power plants were installed. Consequently, investments were reduced in 2009, but have increased steadily in subsequent years. Tangible fixed assets have not increased correspondingly as major projects are being developed, and a large part of the increase is still recor-ded as Plants under construction. Net interest-bearing debt has therefore increased.
Statnett’s equity reported in the financial accounts includes accumulated higher/lower revenue. To show Statnett’s real equity, it is adjusted for accumulated higher/lower revenue after tax. As investments have increased in recent years, the adjusted equity ratio has been reduced.
35%
30%
25%
20%2008 2009 2010 2011 2012
Equity share
Equity share Equity share, adj. higher/lower revenue

18
StatnettAnnual report 2012
Key figures
key figuresHighlights profit & loss (amounts in NOK million) 2012 2011 2010 2009 2008
Reported figures
Revenue 5 334 5 497 7 247 2 862 4 256
EBITDA 2 260 2 426 3 945 259 1 722
Operating profit / EBIT 1 433 1 628 3 279 -403 1 194
Profit before tax 1 162 1 357 3 058 -668 1 742
Profit after tax 837 1 000 2 198 -480 1 517
Adjustments
Accumulated higher/lower (+/-) revenue 3 455 2 617 1 554 -633 428
Changes in accumulated higher/lower (+/-) revenue 838 1 064 2 187 -1 061 721
Underlying figures
Revenue 4 496 4 433 5 060 3 923 3 535
EBITDA 1 422 1 362 1 758 1 320 1 001
Operating profit / EBIT 595 564 1 092 658 473
Profit before tax 324 293 871 393 1 021
Profit after tax 234 234 623 284 998
Highlights balance sheet (amounts in NOK million)
Investments 3 152 2 384 1 892 1 278 2 620
Tangible fixed assets 17 877 17 396 16 396 15 870 14 850
Net interest-bearing debt, adjusteed
for fair value hedges 13 458 11 826 10 629 11 784 10 811
Equity 8 955 8 277 7 628 5 618 6 585
Equity adjusted for higher/lower revenue after tax 6 467 6 393 6 509 6 072 6 277
Total assets 25 794 23 881 22 070 19 342 20 919
Capital employed 21 879 19 739 17 836 16 640 15 541
Financial key figures
Return on capital employed before tax,
adjusted for higher/lower reveue 2.9% 3.0% 6.3% 4.1% 7.3%
Return on equity after tax 9.7% 12.6% 33.2% -7.9% 25.0%
Equity share 34.7% 34.7% 34.6% 29.0% 31.5%
Equity share, adjusted for higher/lower revenue 25.1% 26.8% 29.5% 31.4% 30.0%
Operational key figures
Employees, total 994 928 913 839
Km power lines 9 839 9 839 9 808 Not measured
Km land and subsea cables 703 703 703 Not measured
Absence due to illness % 3.6% 3.8% 3.8% 4.2%
Injuries with illness, own employees 8 11 3 4
Greenhouse gas emissions (CO2-equivalents) 12 918 9 831 10 981 25 382
Hours with insufficient security of supply 1 586 2 820 4 368 Not measured
Customer satisfaction (score) 69 71 64 59

19
StatnettAnnual report 2012
Corporate social responsibility 2012
Corporate social responsibility 2012
Statnett’s corporate social responsibility reportingWhat is corporate social responsibility in Statnett?
Corporate social responsibility in Statnett is all about understanding the expec-tations of the community, and handling these expectations in a manner which generates mutual respect. By doing so, corporate social responsibility in Statnett will deliver performance excellence and capacity which will ensure that we meet our main objectives. Statnett’s main objectives are described in more detail in Corporate Governance.
Corporate social responsibility is an integrated part of our fundamental values. These values form the very core of our management system and help us conduct our activities correctly. The fundamental values provide the foundation for building a positive, responsible, and sound corporate culture of confidence and coopera-tion at all levels.
The Norwegian government stipulates that state-owned companies should inte-grate social and environmental considerations in their daily operations. Statnett’s reporting complies with the globally recognised reporting framework, Global Reporting Initiative (GRI).
By following these guidelines, Statnett aims to provide a general and balanced overview of how we exercise our corporate social responsibility in the enterprise’s key areas. Statnett reports annually according to GRI. This was first implemen-ted in connection with the 2010 annual report. The GRI table contains references to where information about the individual indicators can be found, and to what extent these have been complied with.
Unless otherwise specified, the corporate social responsibility reporting covers all Statnett activities, including wholly-owned subsidiaries. Data is generally collected and collated with the aim of making the presentation as relevant and uniform as possible. Although great emphasis has been placed on ensuring completeness and correctness, there may be uncertainties in relation to some of the data.
As a long-term objective, Statnett’s will ensure that the corporate social responsi-bility reporting is verified by an independent third party and thus that the company is upgraded from GRI B to B+.
Dialogue with stakeholders
The company’s external relations and the internal and external dialogue with
Corporate social responsibility
in Statnett entails integration of
social and environmental consi-
derations in the company’s daily
operations and vis-à-vis our stake-
holders. As a result of its opera-
tions, the company has significant
corporate social responsibility.
Thus, corporate social responsibi-
lity is an integrated part of our fun-
damental values. Corporate social
responsibility is integrated in the
company’s corporate governance
and embedded in the enterprise’s
management and organisation.

20
StatnettAnnual report 2012
our stakeholders are key elements of Statnett’s perception of corporate social responsibility. This is equally important with respect to employees, customers and suppliers, the authorities, trade associations and unions, special interest groups and the general public.
Statnett engages in dialogue with the company’s stakeholders, both as part of our daily operations and in connection with specific activities and projects. Dialogues are comprehensive and take place at, for instance, regular meetings and during consultation processes relating to grid developments and specific development projects. Through early involvement and an open dialogue with local authorities, businesses, landowners and special interest groups, Statnett will continue to pro-mote exchange of ideas, constructive discussions and forward-looking solutions for energy supply and social development. Positive interaction with our custo-mers, suppliers and partners on issues relating to safety and the environment is important to promote safety and environmentally friendly solutions in a short and long-term perspective. Reputation surveys are also conducted.
Corporate social responsibility organisationState-owned companies should be at the forefront of corporate social responsi-bility (Report no. 10 (2008-2009) to the Storting). Statnett’s fundamental gover-ning principles help us meet the requirements and expectations laid down by our owner, employees, customers, suppliers and others stakeholders. All employees are responsible for familiarising themselves with Statnett’s management system and complying with the relevant requirements in their daily work. For more details about Statnett’s management system, see Corporate Governance.
Corporate social responsibility is an integrated part of Statnett’s corporate mana-gement. Statnett has established management policies for internal ethical guideli-nes, as well as ethical guidelines for our suppliers. Corporate social responsibility is also incorporated in our policy relating to Statnett’s fundamental values.
The enterprise has also established a separate functional policy for corporate social responsibility. The objective of this policy is to specify which principles Statnett will apply as a basis for safeguarding the company’s corporate social responsibility within the framework established for Statnett by the owner, legisla-tor and society in general.
In order to ensure clear and uniform corporate social responsibility reporting Statnett has prepared a set of instructions for data acquisition for corporate social responsibility reporting. The instructions provide definitions of indicators and associated data sources, as well as calculation methods.
Statnett and societySecurity of supply
Statnett is responsible for ensuring a stable and secure supply of electricity. Through proper maintenance, sound preparedness and significant investments in
Corporate social responsibility 2012

21
StatnettAnnual report 2012
sufficient grid capacity, Statnett secures a stable supply of electricity and enables the development of renewable energy. In this way, Statnett contributes to value creation for customers and society in general and to the realisation of Norway’s climate objectives.
In 2012, Statnett invested a total of NOK 3 152 million in grid facilities. Statnett’s largest investments are described in more detail in the Board of Directors’ report and on our website.
Statnett operates on the principle that there should normally be two alternatives for power supply into an area. This is referred to as N-1. Statnett measures unsa-tisfactory security of supply by registering periods with only one barrier against power outages in the main grid. The measurements show which areas are vulne-rable and therefore which areas should be prioritised in future grid developments.
Preparedness
A key element of securing a stable supply of electricity is sound preparedness measures. This involves preventing and handling extraordinary incidents. Stormy weather represents a particular challenge, but accidents, technical faults and deli-berate damage to property will also affect security of supply. Statnett will ensure that potential incidents are handled in the best possible man-ner, both in terms of operation and project execution. To meet this objective, three important measures have been implemented. A safety and preparedness policy has been established which stipulates responsibilities and guidelines on how to establish efficient preparedness. The Company has established a preparedness section which has the technical responsibility for the company’s preparedness operations and ensures efficient preparedness routines and guidelines in Statnett. Furthermore, Statnett has strengthened the operative preparedness in the indivi-dual units by hiring more employees and entering into supplier contracts. As part of the emergency preparedness work several preparedness drills were conducted at various levels of the organisation in 2012.
Statnett has a statutory duty to provide transport preparedness for the Norwegian power supply. Statnett’s wholly-owned subsidiary Statnett Transport AS is requi-red to ensure competitive implementation of this duty.
Distribution of value created
Statnett’s operations generate value creation both directly and indirectly. The direct value creation is presented in the company’s accounts and is allocated to the owner, authorities, employees and lenders.
Security of supply Unit 2012 2011 2010
Outages in Statnett’s power grid 1 Number 0 3 1
Frequency deviation 2 Minutes 11 574 12 216 11 286
Periods of unsatisfactory security of supply (N-0) 3 Hours 1 600 2 820 4 368
Table1 Incidents of Energy not Supplied
(EnS) more than 2 hours or > 1000
mWh as a result of a fault in power
gird owned by Statnett.
2 Standardised measuring conducted
by Svenske kraftnät measured by
sampling frequency per minute.
3 Registered number of n-0 hours
(period where there is only one barrier
against power outages).
Corporate social responsibility 2012

22
StatnettAnnual report 2012
Corporate social responsibility 2012
Indirectly, value creation is ensured through, for instance, the activities Statnett generates in other companies in the form of investments in infrastructure and purchase of goods and services. In 2012, investments of NOK 3 152 million were made and goods and services were purchased totalling NOK 981 million to support the company’s operations.
Procurement
Statnett sets requirements for safeguarding corporate social responsibility in our procurement activities. These requirements are laid down in our process descriptions and procurement policy, as well as in the company’s contracts. Furthermore, Statnett has established separate ethical guidelines for procure-ment both for our own organisation and our suppliers.
All company purchases must comply with our procurement policy. The central procurement unit is responsible for major purchases. In order to ensure an opti-mal procurement practice, Statnett employs Sellicha as its step 1 qualification system. This also ensures that the company’s corporate social responsibility is fulfilled. In addition, a step 2 qualification system has been adopted for selected products.
To promote healthy competition with regard to our acquisitions, Statnett works actively to ensure that international, national and local suppliers gain a competi-tive position. As part of this effort, Statnett participated in a cooperation forum in the north of Norway in 2011 and 2012 to promote exchange of information with local businesses and industry.
The responsibilities inherent in the company’s role as a Norwegian Eco-Lighthouse are reflected in the company’s own procurement processes, as well as in our purchasing agreements. We expect our suppliers to comply with our ethical requirements and our health, safety and environment (HSE) require-ments, and to take environmental concerns seriously.
Reputation, reputation-building and visibility
An important objective of Statnett’s communications strategy is to establish awareness and knowledge about the company. Given Statnett’s important role in the power supply, and the enterprise’s upcoming heavy investments in the main grid, it is imperative that people know who we are and what we do. This is particularly important for recruitment purposes.
Value creation distribution Unit 2012 2011 2010
Employees - wages and social benefits 1 NOK million 679 555 461
National and municipal taxes and fees 2 NOK million 589 592 1 079
Lenders - interests NOK million 430 374 343
Owner - dividend 3 NOK million 117 117 315
Company - retained equity NOK million 678 649 2 010
Table1 net wage costs excluding employer’s
contribution
2 Tax charge, property tax and
employer’s contribution
3 Proposed dividend 2012

23
StatnettAnnual report 2012
Corporate social responsibility 2012
Statnett’s general sponsorship of the Norwegian Skating Association (NSF) is, combined with market communication and Statnett’s general communication work, an important part of the efforts to raise awareness and knowledge about the company across the country. Statnett has entered into a dialogue with the NSF about terms to extend the cooperation sponsorship for the period leading up to the Olympic Games in 2014.
Statnett also wants to make a positive contribution to local communities where we are operating, and support local activities. Over the course of 2013 Statnett will introduce new guidelines for allocation of local funds to cultural activities and activities for children and young people.
A company’s reputation is partly determined by how the outside world evaluates
Reputation and customer satisfaction Enhet 2012 2011 2010
Reputation - Share of the Norwegian population
who have confidence in Statnett providing a secure supply of electricity 1 Percent 53 47 65
Prompted knowledge of who is responsible for the main powergrid 2 Percent 57 56 53
Unprompted knowledge of who is responsible for the main grid 2 Percent 33 37 38
Customer satisfaction 3 Score 69 71 64
Table1 Percentage with a very or fairly good
overall impression of Statnett among
professionals (including municipal
mayors and chief municipal executi-
ves, national political environments,
professional environments and
the media) and the general public.
Source: Synovate market research
2 Percentage with knowledge of Statnett
being responsible for the national
main grid for power supply in norway,
Source: youGov against their internet
panel on assignment from Statnett
using mindshare media agency.
3 Score on most recently conduc-
ted customer satisfaction sur-
vey. Source: TnS Gallup AS and
OPInIOn|PERDuCO
the company’s quality on the basis of its products and services, and partly by an emotional dimension, i.e. to what extent one likes and trusts the company. Statnett is responsible for projects that have inspired intense public debate in recent years. This presents challenges with regard to the company’s reputation and confidence in the Norwegian population. Today approximately half of all Norwegians are confident that Statnett will provide a secure supply of electricity. Statnett’s objective is 80 percent by 2016.
Customer satisfaction amongst main grid customers, which are the customers directly linked to the main grid, has decreased from a score of 71 in 2011 to 69 in 2012. Good collaboration with the customers is important to ensure effici-ent implementation of our core tasks, and we are aiming to improve main grid customer satisfaction.
With regard to reputation and company profile, we also emphasise that Statnett has a very high employee satisfaction rate and is regarded as one of the best companies to work for in Norway (see Recruitment and Employee Development for more details).

24
StatnettAnnual report 2012
Corporate social responsibility 2012
Innovation and R&D
Statnett is working in an innovative and forward-looking manner, using research and development (R&D) extensively as a strategic tool for creation of value and innovation. The R&D strategy for the period 2012-2014 was implemented in 2012. Statnett’s R&D strategy is linked directly to the overall Group strategy.
During the period 2012 – 2014, Statnett’s R&D efforts will focus on the following programme areas:• Smart Grid• New technology and solutions for the main grid of the future• Priorities - Environmental impact - Gaining society’s acceptance for Statnett social mandate
Statnett cooperates closely with external expertise environments both in Norway and in other countries. Examples of such environments are other transmis-sion system operators (TSOs) in the Nordic countries and Europe, the supplier industry, ENTSO-E (European Network of Transmission System Operators for Electricity) and the EU’s R&D Framework Programme (FP7).
Statnett also collaborates closely with educational establishments and rese-arch communities, both in Norway and internationally, including the Norwegian University of Science and Technology (NTNU) in Trondheim, Narvik University College, the Norwegian University of Life Sciences (UMB) in Ås, Imperial College in London, Alto University in Finland, the Royal Institute of Technology (KTH) in Sweden and the Technical University of Denmark (DTU). In addition to univer-sities and university colleges being important collaboration partners in terms of implementation of R&D work, the collaboration is also important for recruitment, access to expertise and for finding PhD studies which the enterprise wants to support. Moreover, it will contribute to raising Statnett’s profile and help make Statnett more visible.
Statnett’s R&D expenses totalled NOK 37 million in 2012, NOK 2 million less than in the previous two years.
Smart Grid
The focus of the R&D programme is on developing new solutions for safe and efficient operations which will meet the operational challenges of the future in a period characterised by upgrades and developments, long-term integration of renewable energy sources, more interconnectors and increased future consump-tion. The challenges relate to maintaining security of supply in areas with N-0 ope-ration and keeping the frequency within set limit values.

25
StatnettAnnual report 2012
Corporate social responsibility 2012
The R&D programme consists of various projects, with a main focus on:
• Risk-based planning and execution of operations, as well as installing these in a pilot in Statnett. The objective is that operators will operate according to an agreed risk level in the future.
• Solutions which provide balancing flexibility, i.e. keep the frequencies within agreed limit values.
• New solutions for monitoring, management, and protection of the power sys-tem based on Wide Area technologies.
New technology and solutions for the main grid of the future
The programme has three focus areas relating to research on interconnector breakdowns, efficient pylon and power line solutions, as well as ensuring a stable supply of electricity in the event of solar storms.
In cooperation with National Grid, TenneT (respective owners of transmission grids in UK and Germanrespective owners of the UK and German transmission grids) and Sintef, new methods are being developed to efficiently spot detect any developing faults and take action before a cable breakdown occurs. Such methods will reduce the risk of unexpected interruptions with extended downtime and reduced revenues, as a result of limited time windows to repair cable faults.
In the Lean Line project Statnett is focusing on developing new pylons and power lines which will reduce construction times and costs by 20 per cent, whilst increasing the quality by 20 per cent for 80 per cent of new projects in the port-folio. R&D projects are looking at solutions that can be applied in a time frame of 1-3 years and solutions based on brand new pylon and power line materials in a long-term perspective (more than 10 years).
The project ”Geo Induced Current” deals with solar storms, and the effect of this phenomenon on the electricity supply. The R&D project is important as a strong solar storm may result in an outage of parts of, or the entire, power sys-tem, with serious consequences for society. Solar storms and space weather have received great international attention. In this project, Statnett is aiming to establish new knowledge and develop solutions to introduce preparedness measures which will prevent solar storms from causing unacceptable consequ-ences for security of supply.
Priorities
In 2012, the focus of the R&D programme has been on society’s acceptance and environmental impact of power lines.
The R&D program ”Social Acceptance” consists of projects which will provide Statnett with important knowledge on how the company should act to gain acceptance for its social mandate. These projects are executed through coope-ration with the FME (Centres for Environment-friendly Energy Research) and KMB projects (expertise projects with user participation), supported by the Research Council of Norway. The research takes place at Sintef, the University of Oslo, the

26
StatnettAnnual report 2012
Corporate social responsibility 2012
Institute for Energy Technology Centre (IFE), Strategic Challenges in International Climate and Energy Policy (CICEP), Oslo Centre for Research on Environmentally friendly Energy (CREE) and others.
Environmental impact is an important part of Statnett’s focus on research & development. Through this, the company aims to increase our knowledge of power lines’ impact on biodiversity, birds, reindeer, the landscape and general traffic. Much of this work takes place at the Norwegian University of Life Sciences (UMB) in Ås and other university communities in Norway.
Development aid
Long-term institutional cooperation with transmission
system operators in East Africa and southern Africa
Over several years, Statnett has helped develop long-term expertise in transmis-sion system operator companies (TSOs) in Uganda and Tanzania. These projects will continue for several more years. In the second half of 2012, Statnett also entered into cooperation with the TSO of Mozambique. Initially, the collaboration will focus on identifying which disciplines will be included in a future long-term institutional cooperation. In addition, the formal start-up of a three-year institutio-nal cooperation with the TSO of Kenya is expected in the second quarter of 2013. A key objective of this project is to help establish a regional TSO collaboration bet-ween Kenya, Tanzania and Uganda.
Statnett’s cooperation project with the transmission system operator in Nepal was completed in 2012 with good results.
The institutional cooperation which Statnett is engaged in, also referred to as twinning projects, is part of the Norwegian authorities’ effort to increase access to clean energy at a reasonable price, based on long-term management of natu-ral resources and efficient energy consumption in developing countries. Twinning is a well-established project form defined by the EU and the World Bank as a ”process that pairs an organisational entity in a developing country with a similar but more mature entity in another country”.
The principal objective of Statnett’s twinning projects is to help increase exper-tise and efficiency in core areas for our twinning partners, both at an individual and institutional level. The figure below illustrates the disciplines often included in Statnett’s twinning projects.

27
StatnettAnnual report 2012
Corporate social responsibility 2012
For Statnett it is important to help develop the power supply in the countries where we operate and by doing so supporting the Norwegian government’s initiative to develop the energy sector in selected partner countries. By contributing our own experience and knowledge of how to develop and operate a transmission system operator company, we have seen that we contribute to securing a more stable power supply in our partner countries. This is important for combating poverty, pro-moting industrial development and strengthening the role of women.
Such projects also provide our own technical experts with exciting challen-ges and opportunities. The projects are financed by the Norwegian Agency for Development Cooperation (Norad) or the Norwegian embassies in the partner countries.
Electromagnetic fields
Statnett keeps continuously updated on research into any adverse health effects cau-sed by electromagnetic fields from high-voltage power lines. Furthermore, the enter-prise wishes to make its own contribution to increase our knowledge in this area.
In 2005, a work group appointed by the Norwegian Radiation Protection Authority published the report ”Forvaltningsstrategi om magnetfelt og helse ved høyspen-tanlegg” (Management strategy for magnetic fields and health near high-voltage facilities). The report concluded the following:“We have currently more knowledge about the situation than previously. The sum-mary of extensive research has shown that there is a potential risk of developing leukaemia in children in cases where the magnetic field in the home is above 0.4 microtesla. However, the absolute risk is still considered to be very low.”
The group recommends that a study be implemented when new houses or high-voltage facilities are constructed as a basis for assessing measures which may reduce magnetic fields. The assessment level has been set at 0.4 microtesla for potential measures and calculations to identify additional costs and other dis-advantages. Please see the full report for more information about the working group’s work and conclusions.
The assessment requirements and guidelines comprise homes, schools and nur-sery schools where people spend much of their day. Holiday homes do not fall into this category.
If the average current intensity throughout the year results in a magnetic field of
Grid operation andmaintenance
System operation Grid planning anddevelopment
Strategy / Corporate Business Plans
Human Resources
Information Communication Technology
Grid develompent andproject implementation
TSOs Key function areas

28
StatnettAnnual report 2012
Corporate social responsibility 2012
more than 0.4 microtesla in private homes, potential measures should be asses-sed to reduce the fields to levels below 0.4. However, this does not mean that measures necessarily must be implemented. Field levels, costs and potential health effects must be considered before any remedial measures are considered.
When planning new power lines, we aim to keep them at sufficient distance from residential housing to ensure that the average magnetic fields from the lines do not exceed 0.4microtesla in the buildings.
Climate and the environmentDeveloping the main grid is an important tool for achieving national climate goals by facilitating the phase-in of renewable energy. Climate and environmental con-siderations represent one of our three strategic focus areas and are an integrated part of our Group strategy.
At the same time it is important to respect our natural environment during planning and operation of our facilities. Statnett’s environmental strategy sets a framework for how to minimise the environmental impact of the company’s operations.
Environmental impact of Statnett’s operations
Statnett has established an HSE policy which also comprises the external envi-ronment. The company has a zero tolerance philosophy and the policy describes principles and procedures for avoiding any unnecessary environmental impact.
Any environmental incidents that do occur are recorded and followed up in the Statnett deviation system. In 2012, 67 incidents occurred. None of the inci-dents were registered as permanent damage or serious discharges/emissi-ons. One of the most serious external environment incidents involved pollution of the Tveitenbekken stream, where drilling mud from the drilling of foundations was released into the stream. In connection with forest clearing in a bird habitat in Granvin, a scheduled power line resulted in trees being felled in a restricted area. Statnett’s contractors reported 11 incidents in connection with work on the company’s development projects. One of these involved run-off from a depo-sit area for excess material, which resulted in siltation of Nakkeelva and Vieelva rivers. These rivers are home to a viable population of the red-listed freshwater pearl mussel which is particularly vulnerable to increased particle density.
Statnett is continually working to improve our environmental performance. Statnett has an Environmental Management System which is certified in accor-dance with ISO 14001:2004. Our head offices in Oslo and administrative offices in Alta and Sunndalsøra have been certified as Eco-Lighthouses. This means that activities conducted at these offices comply with defined requirements for envi-ronmental management and performance. The office in Trondheim started the Eco Lighthouse certification process in the autumn of 2012.
Energy optimisation and proximity to public transport were important and decisive factors in the choice of new head offices in Nydalen. Both factors are important elements in the enterprise’s own climate initiatives. Like Statnett’s new adminis-

29
StatnettAnnual report 2012
Corporate social responsibility 2012
tration offices in Trondheim, the new head offices will be an energy class A office building.
Climate
The most important contribution Statnett can make with regard to climate is to develop the next-generation main grid, facilitate connection of new renewa-ble energy, reorganise existing power grids and update the voltage in existing power grids to maximise capacity and minimise environmental impact. In addi-tion, Statnett is working to establish new interconnectors which will help reduce carbon emissions through facilitation of new renewable energy.
Emissions from Statnett’s operations
Statnett’s emissions of greenhouse gases include, for instance, operation of back-up gas-fired power plants, SF6 treatment plants and travel in connection with work. The emissions have been accounted for in Statnett’s climate report, and the company is working continuously to reduce them.
Greenhouse gas emissions
(CO2-equivalents) Unit 2012 2011 2010
From back-up gas-fired power plants tonnes 1 747 2 898 1 982
From SF6 emissions tonnes 8 461 5 030 7 300
From fuel consumption and heating oil/paraffin tonnes 1 360 728 646
From company air travel tonnes 1 179 1 175 1 053
Emissions from the back-up gas-fired power plants in Nyhamna and Tjeldbergodden.
Statnett’s back-up gas-fired power plants at Nyhamna at Aukra and Tjelbergodden in Aure have not been granted climate quotas in the Norwegian system. However the facilities are subject to quota obligations. Statnett reports emissions to the Climate and Pollution Agency (Klif) every year, so that our emis-sion quotas can be balanced. Klif has granted Statnett permission to operate the facilities for up to eight days per year for inspection and maintenance purposes. The facilities are primarily intended for use in an emergency situation, as carbon emissions from one operative back-up power plant total 2 450 tonnes a day (0.68 tonnes/MWh). Preliminary figures show that emissions from Statnett’s back-up gas-fired power plants totalled 1 747 tonnes of CO2 equivalents in 2012. The reduction from 2011 was mainly due to infrequent operation of Tjeldbergodden. The final figures for 2012 will be available after 1. April 2013, when the reported data have been approved by Klif.
Emissions of SF6 from Statnett’s SF6 facilities increased by 69 percent last year, from 210 kg in 2011 to 354 kg in 2012. The 2012 emissions correspond to an environ-mental impact of 8 461 tonnes of CO2 equivalents, up from 5 030 in 2011. The increase may be due to maintenance and refilling of several SF6 facilities. The dischar-ges for 2012 amounted to 0.3 percent of the total 113 tonnes of SF6 in Statnett’s faci-lities. This is below the normal level of leakages from facilities of this type.

30
StatnettAnnual report 2012
Corporate social responsibility 2012
Air travel in Statnett totalled 8 790 410 km, corresponding to total carbon emis-sions of 1 179 tonnes.
Statnett is working to reduce its own emissions of greenhouse gases by mini-mising the company’s climate contributions with regard to own consumption, such as heating, cooling and operation of Statnett’s offices and other buildings. Statnett purchases climate quotas for all company air travel.
Inventory and emissions of SF6 Unit 2012 2011 2010
Inventory as at 31. Dec kg 112 576 111 239 107 447
Emissions SF6 kg 354 210 306
Energy consumption and grid losses Unit 2012 2011 2010
Electricity (excluding energy losses in
transformer stations and grid) GWh 18 17 17
Natural gas for back-up gas-fired
power stations tonnes 641 1 040 708
Fuel consumption m3 516 468 437
Grid losses GWh 2 465 2 322 2 241
Climate adaptation
Climate change also affects Statnett’s operations. In 2008, Statnett prepared a report in cooperation with the Norwegian Meteorological Institute (DNMI) and the Norwegian Geotechnical Institute (NGI) on the physical impact of climate change on Statnett’s transmission facilities. The report evaluates the impact of climate change such as changes in wind conditions, increased precipitation and floo-ding, icing, landslides and avalanches, changes in the groundwater level, etc. The results from the report are used to monitor, maintain and improve Statnett’s trans-mission facilities.
Biodiversity and disruptions to the landscape
As part of its environmental strategy, Statnett aims to be a responsible grid developer. This entails incorporating environmental concerns in the company’s planning process, choice of solutions, construction and operations.
Statnett recognises that the company’s facilities cause interventions in the lands-cape which will have an impact on biodiversity. It is our responsibility to minimise the negative impact of such interventions and weigh them against the demand for a reliable supply of electricity and socio-economic profitability.
New power lines and transformer stations have a long planning horizon. Statnett is subject to stringent requirements and has to submit a detailed report on the scope of interventions and their impact on biodiversity during the construction and operational phase.

31
StatnettAnnual report 2012
Corporate social responsibility 2012
When constructing new power lines, Statnett uses advanced techniques such as laser scanning and 3D terrain modelling in the early stages of the planning phase. This means we can see what the power lines will look like in the lands-cape. Furthermore, we can adapt our construction plans and choose alternatives that take into account the shape and character of the landscape.
In the planning stage, we conduct thorough studies of the impact on biodiversity, often running over several seasons. The studies comprise habitats and species, focusing on endangered and vulnerable species in particular. Whenever neces-sary, we will monitor or implement measures to protect endangered and vulnera-ble species.
Grid and cables1 Unit 2012 2011 2010
High voltage overhead section km 9 839 9839 9808
Earth cable and subsea cable km 703 703 703
Overhead lines in protected areas km 259 259 259
Environmental R&D focus
Several of Statnett’s R&D programmes focus on challenges relating to climate and the environment. The company has for several years helped fund indepen-dent research on power lines’ impact on biodiversity. This includes long-term research projects on birds, as well as wild and domesticated reindeer. The R&D programme ”Environmental Impact” has a special focus on increasing the aware-ness of how power lines affect the flora and fauna. One of the projects in this pro-gramme involves collaboration with the Norwegian University of Life Sciences in Ås to study what effect various management methods in cleared ROWs will have on biodiversity.
Many of the R&D programmes comprise several disciplines, including climate and the environment. The R&D project related to the Smart Grid has a clear climate dimension. The Smart Grid technology enables two-way communication bet-ween appliances and applications in, for instance, households. The objective is to develop applications that will contribute to a cost-efficient and environmentally sound utilisation of the entire power system.
Our employeesStatnett is an attractive employer offering its employees challenging tasks. To meet our objectives, we need to have the right expertise at the right place at the right time. Statnett is committed to promoting a good and close community across the organisation and ensuring a safe and secure working environment.
A safe place to work
Statnett has a zero tolerance policy with regard to accidents and injuries to our own personnel and others who work for us. There were no serious incidents in
Table1 measured in km of transmission
routes and cable routes

32
StatnettAnnual report 2012
Corporate social responsibility 2012
Statnett in 2012. However, on 3 January 2013, a tragic accident occurred in one of Statnett development projects. A subcontractor employee lost his life. The accident is being investigated by the Police and the Norwegian Labour Inspection Authority. Statnett has also instigated its own investigation of the accident.
Statnett maintains a constant focus on health, safety and the environment (HSE) to reduce risks and prevent injuries and accidents. All Statnett units must comply with Statnett’s HSE policy and associated procedures and instructions. Statnett works systematically to further develop our HSE efforts, and in 2011 a separate action plan was introduced for HSE. This action plan was continued in 2012 and for the rest of 2013. HSE is always the first item on the agenda in all manage-ment meetings. The status of our HSE work and any incidents are reported to the Board of Directors on a regular basis.
Safety, health and working environment plans (SHA) are drawn up for all develop-ment projects and Safe Job Analyses (SJA) are prepared before all risk-exposed work operations. Statnett sets the same HSE requirements for suppliers as for its own employees.
Every year, we organise safety courses and first aid courses for all employees who will carry out work on electrical installations. In addition, we conduct HSE training of safety delegates, managers and HSE personnel in accordance with regulations. I 2012 several preparedness drills were carried out at various levels of the organisation.
We have entered into agreements with various approved occupational health ser-vice providers who together cover the company’s total need for such services. All employees are entitled to make active use of the services comprised by the health scheme.
Reporting of undesirable HSE incidents and nonconformities increased in 2012, which is a continuation of the trends from 2010 and 2011. Statnett registers unde-sirable HSE incidents and deviations occurring in its own organisation, as well as in contractor/supplier organisations. In 2012, eight internal lost-time injuries were reported, whereas our suppliers/contractors reported 18 lost-time injuries.
Although the absence due to illness rate was generally low throughout 2012, we are continuously working to reduce absence. Various measures have been imple-mented to do so. However, we continue to identify new methods of preventing absence due to illness.

33
StatnettAnnual report 2012
Corporate social responsibility 2012
Recruitment and employee development
Statnett is planning major development projects in the years ahead. In order to realise these projects, we will need to have sufficient expertise of the right kind. To cover our staffing needs, we are investing in development, training and recruit-ment of employees in accordance with Statnett’s strategy and values.
Statnett emphasises a good working environment with motivated and committed employees. The strategic competence development process (SKUP) is well establis-hed in the enterprise. The process will contribute to a systematic and uniform follow-up of objectives, conduct, performance, strengthened development opportunities, as well as ensuring that Statnett retains and develops strategically important expertise. As a part of SKUP, performance appraisals are conducted with all employees on an annual basis, and assessment meetings are held in all management groups. In 2012, the roll-out of a career model was initiated in Statnett. This will put more focus on the individual professional development of Statnett employees.
Absence due to illness Unit 2012 2011 2010
Total Percent 3,6 3,8 3,8
Short-term (1 - 16 days) Percent 1,7 1,6 1,6
Long term (> 16 days) Percent 2,0 2,2 2,1
Women Percent 5,7 6,5 7,2
Men Percent 3,0 3,0 2,9
Lost-time injuries1 Unit 2012 2011 2010
Lost-time injuries, own employees Number 8 11 3
Injury frequency (H1 value) 2, own employees Frequency 3,9 6,4 2,0
Lost-time injuries, contractors Number 18 12 5
Injuries Unit 2012 2011 2010
Injuries, own employees Number 17 18 12
Injury frequency (H2 value) 2, own employees Frequency 8,3 10,3 6,0
Fatalities Unit 2012 2011 2010
Fatalities, own employees Number 0 0 0
Fatalities, contractors Number 0 1 0
Fatalities, third parties1 Number 0 0 0
Table1 Work-related injury which resulted
in absence beyond the day of the
incident2 number of lost-time injuries per mil-
lion hours worked
Table1 Total work-related injuries2 number of injuries per million hours
worked
Table1 Registered fatalities among third-
parties, occurred on or in connection
with Statnett’s facilities.

34
StatnettAnnual report 2012
Corporate social responsibility 2012
For the third year running, Statnett has been ranked among the ten best com-panies to work for, according to the Great Place to Work survey. In 2012, the company has switched to a more adapted organisation survey from Ennova. In addition to focusing on areas that are important for Statnett’s working environ-ment, the survey has benchmarking opportunities against Norwegian companies inside and outside the energy industry. The 2012 results showed that Statnett is a good place to work. Compared with the industry and other Norwegian compa-nies, Statnett has a higher average for most of the measured factors. Job satis-faction is high in Statnett. Statnett did particularly well in terms of leadership. All units will establish relevant improvement measures.
Internal mobility and recruitment
Statnett invests broadly in the development and dissemination of expertise across the entire company. In 2012, 57 employees changed jobs internally in Statnett, compared with 49 in 2011. The SKUP process helps us increase internal mobility. The enterprise has a long-term goal of directing 100 full-time equivalents towards strategically important project execution or operation tasks. 50 of these full-time equivalents were realised in 2012.
Statnett recruited 132 new employees in 2012, compared with 74 in 2011. In 2012, Statnett had an overall staff turnover, excluding retirement, of 3.3 percent, compared with 3.7 percent in 2011. The increase in staff, combined with mode-rate retirement figures, means that the company has had a net increase of 319 full-time equivalents over the last four years.
In order to attract talented graduates from universities and university colleges, Statnett has established a permanent trainee programme. In 2012, eight trai-nees participated in Statnett’s own trainee programme. In addition, Statnett had one trainee from a trainee collaboration between SINTEF, the Norwegian Water Resources and Energy Directorate (NVE) and grid companies in the industry. The trainee was offered permanent employment with Statnett after completion of the programme. Two Statnett trainees participated in an exchange programme working at Svenska Kraftnät and Statnett’s Brussels office. Statnett will continue its collaboration with universities and university colleges in the coming years to increase its employer attractiveness among relevant students. Job fairs, company presentations and sponsoring activities organised by students are the most com-mon measures. Statnett also provides opportunities for students to work in sum-mer jobs, and to write project papers and master’s theses. Statnett received a number of highly qualified applicants for its trainee programme in 2012.

35
StatnettAnnual report 2012
Corporate social responsibility 2012
Employer attractiveness among
graduates, Universum ranking1 Unit 2012 2011 2010
Graduates, technical education Rank 32 39 49
Professionals, technical education Rank 31 34 34
Graduates, finance/economics education Rank 95 76 -
Professionals, finance/economics education Rank 74 62 -
Graduates ICT education Rank - - -
Professionals, ICT education Rank 25 37 98
Gender equality and diversity
Statnett wants a diverse and varied organisation. Our job advertisements explicitly encourage people to apply for a position in Statnett, regardless of gender, ethni-city or age. In 2012, 5.3 percent of new recruits were from non-Norwegian ethical backgrounds. In total at the end of 2012, Statnett had 58 employees from non-Norwegian ethical backgrounds, compared with 52 in 2011.
Statnett has for many years worked systematically to recruit more women into management and technical positions. During the period 2005-2011, the percen-tage of women in management positions increased from approximately 20 to 25 percent. For 2012, this decreased to 22.4 percent. Although the number of female leaders increased also in 2012, the percentage of women has decreased as the number of male managers has increased more. The total percentage of women has increased from 23 percent in 2011, to 24.1 percent in 2012. Although achieving a more equal gender distribution remains a significant challenge, the figures prove that we have succeeded in establishing a development towards a relatively higher share of women in managerial positions. Statnett will continue the effort to recruit more women to management and technical positions. As part of this effort we have introduced a mentor programme. We wish to promote the par-ticipation of women in the boardroom across the entire Statnett Group, and take a positive view of female employees being elected to the boards of other compa-nies. In 2012, the percentage of women in the Group management was 14 per-cent. On the Board of Directors the percentage of women among representatives elected by our owners was 50 percent.
Women and men in comparable positions receive equal pay, while staff surveys show that both genders believe that women and men have equal opportunities in Statnett.
We have set up practical schemes designed to allow women and men to com-bine work and family life successfully. Statnett runs its own day-care facilities in Oslo, has a scheme of extended parental leave for employees with young chil-dren, and practises flexible working hours.
Table1 Employer attractiveness among gra-
duates and employees with 5 years of
experience, respectively. universum
ranking (The norwegian Professional
Survey). Rank only up to 100 (50 for
ICT graduates).

36
StatnettAnnual report 2012
Corporate social responsibility 2012
Ethics Ombudsperson
Statnett manages large communal natural resources. As a result and due to the role Statnett plays in the electricity system, we must demand absolute integrity of ourselves and never waver from our ethical principles. As one of the first com-panies in Norway to do so, Statnett appointed its own Ethics Ombudsperson in 2006. The Ethics Ombudsperson is an officer of the company whose duty it is to strengthen the legal protection of employees and to help uncover censurable conditions and shortcomings within the company. In Statnett, the office of Ethics Ombudsperson is held by a lawyer in our Legal Department.
The job of the Ethics Ombudsperson is to ensure that undesirable work cul-tures and attitudes do not develop and proliferate. Furthermore, the Ethics Ombudsperson has a duty to comply with the Working Environment Act with regard to reporting any censurable conditions in the workplace. The Ethics Ombudsperson is charged with undertaking investigations in response to issues raised by employees or employees’ unions, to provide guidance for employees on ethical matters, and to raise matters on the Ethics Ombudsperson’s own initiative. A very important principle observed by the Ombudsperson is the principle of ano-nymity. This principle encourages staff to report matters that would not otherwise have been addressed.
The Ethics Ombudsperson scheme has helped put ethics higher on Statnett’s agenda and make staff far more aware of ethical issues. Statnett continues to note considerable commitment and interest among staff in the ombudsperson scheme and in ethical matters in general. The Ethics Ombudsperson reports annually to the Group management and to the Board concerning the number of notifications and the number of cases dealt with. In 2012, the Ombudsperson handled 15 cases, down somewhat from the previous year. The Ombudsperson also handled a number of minor matters. Although they may have been unsettling to the persons involved, none of the reported matters have had serious consequ-ences for Statnett as a company.
Education Unit 2012 2011 2010
Total number of employees Number 994 928 913
Full-time equivalents Number 981 911 892
Position, percentage of full-time position, men Percent 99,4 98,8 98,5
Position, percentage of full-time position, women Percent 96,5 96,0 95,6
Temporary employees Number 71 43 38
Trainees Number 8 10 9
Apprentices Number 27 23 24

37
StatnettAnnual report 2012
Corporate social responsibility 2012
Other GRI indicators
Age profile1 Unit 2012 2011 2010
Employees < 30 years old Number 96 75 84
Employees 30-39 years old Number 182 170 158
Employees 40-49 years old Number 336 311 309
Employees 50-59 years old Number 261 249 238
Employees > 60 years old Number 120 124 110
Average age Years 45,8 46,4 46,0
Average retirement age Years 65,5 65,1 65,0
Average seniority Years 10,1 11,1 11,0
Education1 Unit 2012 2011 2010
Civil engineers Number 296 261 263
Engineers Number 196 179 176
Technical education/certificate of apprenticeship Number 237 226 218
Master of Science and Economics/Economist Number 78 74 73
Other university/university college degree Number 104 92 89
Commercial Number 36 38 38
Other Number 48 59 42
Table1 Excluding Statnett Transport AS
Table1 Excluding Statnett Transport AS

38
StatnettAnnual report 2012
Corporate social responsibility 2012GRI
GRI
Statnett’s CSR reporting for 2012 has been integrated in Statnett’s 2012 annual report. We believe that in all material respects our reporting is consistent with GRI’s reporting principles and that it satisfies level B pursuant to the guidelines.
The table below shows where in Statnett’s 2012 annual report information about each issue and the main GRI indicators may be found, irrespective of whether this is fully or partly described. Indicators marked with an asterisk * are additional indi-cators which we have reported on. ”
Statnett aims to develop its CSR in
accordance with the Global Repor-
ting Initiative (GRI) guidelines for
the electricity industry (GRI Sustai-
nability Reporting Guidelines &
Electric Utility Sector Supplement).
GRI code Title Reference to Statnett - 2012 annual report
PROFILE
Strategy and analysis
1.1 Statement from the President and CEO President and CEO summary
1.2 Description of key impacts, risks and opportunities Highlights
Corporate social responsibility (CSR)
Board of directors’ report 2012
Organisation
2.1 Name of the organisation Statnett SF
2.2 Primary brands, products and / or services Highlights
Board of directors’ report 2012
President and CEO summary
2.3 Operational structure of the organisation Corporate governance
2.4 Location of organisation’s headquarters Note 1 General
2.5 Countries where the company operates Board of directors’ report 2012: Employees and organisation
2.6 Nature of ownership and legal form Corporate governance: 1. Corporate governance
2.7 Markets served Not covered
2.8 Scale of the reporting organisation Board of directors’ report 2012: Employees and organisation
CSR: Our employees
2.9 Significant changes regarding size, structure or ownership Board of directors’ report 2012: Employees and organisation
CSR: Our employees
2.10 Awards received CSR: Recruitment and employee development

39
StatnettAnnual report 2012
Corporate social responsibility 2012GRI
GRI code Title Reference to Statnett - 2012 annual report
EU1 Installed capacity Not relevant for Statnett
EU2 Net energy output Not relevant for Statnett
EU3 Number of customer accounts Not covered
EU4 Length of transmission and distribution lines CSR: Climate ande the enviroment: Biodiversity and disruptions to the
landscape
EU5 Allocation of CO2 emissions allowances or equivalent CSR: Climate ande the enviroment: Climate
Reporting parameters
3.1 Reporting period 2012
3.2 Date of most recent previous report Annual report 2011
3.3 Reporting cycle Annual
3.4 Contact point for questions regarding the report Knut Hundhammer
3.5 Process for defining report content CSR: CSR organisation
3.6 Boundary of the report (organisational) CSR: Statnett’s CSR reporting
3.7 Limitations on the scope or boundary of the report (issue) CSR: Statnett’s CSR reporting
3.8 Basis for reporting on joint ventures, subsidiaries etc. CSR: Statnett’s CSR reporting: What is CSR in Statnett?
3.9 Data measurement techniques and the basis of calculations CSR: Statnett’s CSR reporting
3.10 Explanation of the effect of any re-statements CSR: Statnett’s CSR reporting
3.11 Significant changes regarding scope or boundaries CSR: Statnett’s CSR reporting
3.12 Overview of reported indicators Statnett’s GRI table
3.13 Practice for external assurance for the report CSR: Statnett’s CSR reporting: What is CSR in Statnett?
Governance, commitments and engagement
4.1 Governance structure of the organisation Corporate governance: 1. Corporate governance
4.2 Whether the Chair of the Board also is an executive officer Presentation of the Board of Directors
Corporate governance: 8.Corporate assembly and Board of Directors,
composition and independence
4.3 Independent and/or non-executive members of the board Presentation of the Board of Directors
4.4 Mechanisms for shareholders and employees to provide
recommendations or direction to the board Corporate governance: 7. Election committee
Corporate governance: 8. Corporate assembly, Board of Directors, c
omposition and independence
4.5 Compensation for members of the board and senior
executives and performance Note 14
4.6 Board processes to ensure that conflicts
of interest are avoided Corporate governance

40
StatnettAnnual report 2012
Corporate social responsibility 2012GRI
GRI code Title Reference to Statnett - 2012 annual report
4.7 Process for determining the qualifications
of the board members Corporate governance
4.8 Internally developed missions or values etc. CSR
Corporate governance
4. 9 Board procedures for overseeing the organisation Corporate governance
4.10 Processes for evaluating the board’s own performance Corporate governance
4.11 Precautionary approach CSR
4.12 Externally developed principles or initiatives to which
the organisation subscribes CSR
Corporate governance
4.13 Membership of associations CSR
4.14 List of stakeholder groups engaged by the organisation CSR
4.15 Identification and selection of stakeholder groups Not included in the 2012 annual report
iNDICATORS AND MANAGEMENT APPROACH
Economy
EU6 Short and long-term electricity availability and reliability CSR: Statnett and society: Security of supply
EU7 Demand-side management programmes for
reduced energy consumption Not relevant for Statnett
EU8 Research and development activity and expenditure CSR: Innovation and R&D work
EU9 Provisions for decommissioning of nuclear power sites Not relevant for Statnett
EC1 Economic value generated and distributed CSR: Statnett and society: Distribution of value created
EC2 Financial implications, risks and opportunities due
to climate change CSR: Statnett and society: Innovation and R&D
CSR: Climate and the enviroment
EC3 Coverage of the organisation’s defined benefit plan obligations Note 1
EC4 Financial assistance received from government Note 1
EC5 * Range of ratios of standard entry level wage
compared to local minimum wage Pursuant to regulations
EU10 Planlegging av produksjonskapasitet i forhold til forventet behov Not relevant for Statnett
EU11 Average generation efficiency of plants based on fossil fuel Not relevant for Statnett
EU12 Transmission and distribution losses CSR: Climate and the enviroment: Emissions from Statnett’s operations:
Energy use and grid losses

41
StatnettAnnual report 2012
Corporate social responsibility 2012GRI
GRI code Title Reference to Statnett - 2012 annual report
Environment
EN3 Direct energy consumption CSR: Climate and the enviroment: Emissions from Statnett’s operations:
Energy use and grid losses
EN11 Protected areas and areas of high biodiversity value CSR: Climate and the enviroment: Power grid and cables
CSR: Climate ande the enviroment: Biodiversity and disruptions
to the landscape
EN12 Significant biodiversity impacts and areas of
high biodiversity value CSR: Climate and the enviroment: Power grid and cables
EN14 * Strategies, current actions, and future plans for managing CSR: Climate ande the enviroment: Biodiversity and disruptions
impacts on biodiversity to the landscape
EN16 Direct and indirect greenhouse gas emissions CSR: Climate ande the enviroment: Climate
EN22 Total weight of waste and disposal method CSR: Climate and the enviroment: Emissions from Statnett’s operations
EN23 Significant spills CSR: Climate and the enviroment: Emissions from Statnett’s operations
EN26 Mitigation of environmental impacts of products and services CSR: Climate and the enviroment: Emissions from Statnett’s operations
EN27 Products and packaging materials that are reclaimed CSR: Climate and the enviroment: Emissions from Statnett’s operations
EN28 Fines and sanctions related to environmental issues CSR: Our employees: A safe place to work
Employee follow-up
EU14 Programmes and processes to ensure availability
of a skilled workforce CSR: Our employees: Recruitment and employee development
EU15 Percentage of employees eligible to retire in the
next 5 to 10 years CSR: Our employees: Age profile
EU16 Policies and requirements regarding health and safety training CSR: Our employees: A safe place to work
LA1 Workforce CSR: Our employees: Employees
LA2 Turnover CSR: Our employees: Internal mobility and recruitment
EU18 Percentage of contractor/subcontractor employees that
have undergone relevant health and safety training CSR: Our employees: A safe place to work
LA4 Employees covered by collective bargaining agreements Regulated by Norwegian law
LA5 Minimum notice period(s) regarding significant
operational changes/restructuring Regulated by Norwegian law
LA7 Injuries and occupational illness, lost days and absenteeism CSR: Our employees: A safe place to work
LA11 * Skills management and lifelong learning CSR: Our employees: Recruitment and employee development
CSR: Our employees: Internal mobility and recruitment

42
StatnettAnnual report 2012
Corporate social responsibility 2012GRI
GRI code Title Reference to Statnett - 2012 annual report
LA12 * Percentage of employees with performance and career
development reviews CSR: Our employees: Recruitment and employee development
LA13 Composition of governance bodies and breakdown of
employees per category CSR: Our employees: Gender equality and diversity
LA14 Ratio of basic salary of men to women CSR: Our employees: Gender equality and diversity
Human rights
HR2 Suppliers and contractors assessed as regards
respect of human rights Pursuant to regulations
HR4 Incidents of discrimination No cases registered
HR5 Risk identification on freedom of association and collective bargaining No cases registered
HR6 Risk identification on child labour No cases registered
HR7 Risk identification on forced or compulsory labour No cases registered
HR9 * Violations involving rights of aboriginal people No cases registered
Society
Disclosure on management approach
EU19 Stakeholder participation in development plans and projects CSR: Statnett’s CSR reporting: Stakeholder dialogues
EU21 Contingency planning measures and training programmes CSR: Statnett and society: Preparedness
SO4 Actions taken in response to incidents of corruption No corruption cases
SO6 * Financial and in-kind contributions to political parties,
politicians and other related institutions No cases registered
SO7 * Actions for anti-competitive behaviour No cases registered
SO8 Fines and sanctions for non-compliance with laws and
regulations related to corruption, discrimination,
accounting fraud etc. No cases registered
Product responsibility
Disclosure on management approach
PR1 Health and safety impact assessments in the lifecycle
of product and services CSR: Statnett and society: Electromagnetic fields
EU25 Injuries and fatalities to third parties CSR: Our employees: A safe place to work
PR5 * Customer satisfaction CSR: Statnett and society: Reputation, sponsoring and visibility
EU28 Power outage frequency CSR: Statnett and society: Security of supply
EU29 Power outage duration CSR: Statnett and society: Security of supply
EU30 Average plant availability Not relevant for Statnett

43
StatnettAnnual report 2012
Corporate governance
Corporate governance
The aim of corporate governance
is to ensure that Statnett fulfils its
social responsibilities by cle-
arly defining the distribution of
roles between the owner, Board of
Directors and the administration,
and set the framework for desired
conduct in the company. Below
follows the Board of Directors’
annual report on compliance with
the Norwegian Code of Practice for
Corporate Governance (www.nues.
no). Deviations from the Code of
Practice are explained.
Level 1: Guidelines adopted by the Board
of Directors, referred to as manage-
ment policies. These relate to our value
base, ethical guidelines, governance,
management and control as well as asset
management.
Level 2: Function policies stipulate com-
mon principles including guidelines for
decisions and conduct.
Level 3: Description of Statnett’s main
processes, their sequence, deliveries,
roles and responsibilities, taking into
account common function policy princi-
ples and instructions requirements.
Level 4: Guidelines of an operational
nature such as procedures, instructions,
checklists and manuals.
Managementpolicies
Function policies
Operative management
Procedures and manuals
ManageMenT PrOceSSeS
cOre PrOceSSeS
SuPPOrT PrOceSSeS
1. Corporate governanceStatnett is a state enterprise, established under the Act relating to state-owned enterprises and owned by the Norwegian state through the Ministry of Petroleum and Energy (MPE). The Minister’s administration of ownership is exercised under constitutional and parliamentary responsibility. The enterprise is independent and is wholly responsible for its obligations.
Good corporate governance is a precondition for stable value creation over time. The enterprise’s fundamental governing principles help us meet the requirements and expectations laid down by our owner, employees, customers, suppliers, len-ders and others stakeholders.
Corporate management
Statnett’s governing bodies establish the framework for the enterprise’s activi-ties. These comprise constitutional principles related to the public ownership, the Norwegian State’s corporate governance principles, as well as articles of associa-tion and decisions adopted by the Enterprise General Meeting.
Along with the instructions to the Board of Directors, instructions to the President and CEO, this framework constitutes the key governing documentation in Statnett. The Board of Directors and the President and CEO establish the fram-ework for the enterprise’s activities in order to meet the adopted objectives.
Statnett’s corporate management framework consists of four levels of documen-ted guidelines:

44
StatnettAnnual report 2012
Corporate governance
Statnett focusses on quality management and continuous improvement, and is certified according to PAS 55 (quality standard for asset management) and ISO 9001 (quality management) and 14001 (environmental management).
2. BusinessStatnett has a function in the government’s sector policy. Section 2 of Statnett’s articles of association stipulates that ”Statnett SF is the Transmission System Operator in the Norwegian power system.” As System Operator, Statnett is responsible for ensuring that there is an instantaneous balance at all times bet-ween production and consumption of electric power in Norway. Our System Operator role is described in more detail in the Regulations relating to system operation.
Furthermore, Statnett’s objects clause stipulates that ”the enterprise is respon-sible for ensuring efficient operations in a social economy perspective and for developing the main power grid. Statnett SF shall, alone or together with others, plan and design, build, own and operate transmission facilities. Statnett SF will execute the tasks assigned to the company pursuant to applicable laws, regu-lations and licences. Moreover, Statnett SF will adhere to commercial principles.” Statnett’s articles of association are available on our web site.
Statnett has established the company’s mission, values and main objectives:
Statnett’s mission
Statnett will build the next generation main grid by 2030.
Statnett’s values
Statnett’s values are a long-term perspective, respect and community. These values provide the basis for everything we do, and set the standard for the daily conduct of our employees and the management.
Statnett’s main objectives
Our main objectives describe what we wish to deliver:
• Security of supply Statnett shall maintain security of supply through a grid with satisfactory quality and capacity.
• Value creation
Statnett’s services shall create value for customers and for Norwegian society at large.
•Climate
Statnett shall facilitate the realisation of Norway’s climate objectives. Statnett has also formulated objectives for how we want to achieve our objectives:

45
StatnettAnnual report 2012
Corporate governance
• Statnett shall carry out its operations without personal injuries and with respect for our natural environment.
• Statnett shall be recognised as a customer-oriented organisation.• The enterprise’s deliveries shall bear the mark of our values. Statnett’s strategy focusses on our core activities. To realise Statnett’s objectives the following five target areas are important:
• Ensure safe and efficient operations• Build a robust and environmentally-adapted main grid• Secure a stable supply of electricity and promote value creation through inte-
raction with the other Nordic countries and Europe• Develop the next generation Statnett• Secure acceptance and understanding for Statnett’s social mandate
3. Share capital and dividendAt 31 December 2012, Statnett’s equity was appropriately aligned with the company’s current activities and risk profile. Statnett’s strategy entails substantial investments. These are described in more detail in the 2011 Grid Development Plan and in the updated 2012 Investment Plan. In Proposition to the Storting No. 1 (2011-2012), the Norwegian state has, as the owner, stated that Statnett should have a financial position which enables the enterprise to carry out all socio-econ-omically profitable grid investments. In order to realise the planned investments, Statnett needs to raise more equity in the next five years. The decision to increase the capital can only be made by the Enterprise General Meeting.
The Group’s dividend policy is stipulated in the government budget. In Proposition to the Storting No. 1 (2011-2012), the Norwegian government has established a long-term dividend policy of 50 percent of the defined dividend basis up to and including the fiscal year 2015. The basis for the dividend is defined as the Group’s net profit after tax, adjusted for changes in the balance for higher/lower revenue for the year after tax.
4. Equal treatment of owners and transactions with closely related partiesStatnett SF is wholly-owned by the Norwegian State through the Ministry of Petroleum and Energy (MPE). Consequently, the enterprise has no need for guid-elines for equal treatment of owners.
For major transactions between the enterprise and related parties, Statnett per-forms value assessments prepared by independent third parties in accordance with national regulatory requirements.
Statnett’s ethical guidelines stipulate that employees should report any doubt regarding competence or qualifications. The Ethics Ombudsperson function has been established as a whistle-blowing channel.

46
StatnettAnnual report 2012
Corporate governance
5. Freely negotiableStatnett is a state enterprise without transferable ownership interests.
Figure: Overview of Statnett’s management structure at the end of 2012. The for-mal reporting lines are shown as solid lines.
6. The Enterprise General meetingThe Ministry of Petroleum and Energy is the enterprise’s supreme decision-making body through the Enterprise General Meeting.
The following issues are discussed and settled at the Enterprise General Meeting: Adoption of the enterprise’s profit and loss account and balance sheet, inclu-ding application of profit or coverage of loss for the year, adoption of the Group’s consolidated profit and loss account and balance sheet. In addition, any other matters are discussed pertaining to the General Meeting according to Norwegian laws and regulations, including election of the Statnett Board of Directors and stipulation of remuneration levels for board members and the board committee. The Board of Directors and the company’s auditor attend the Enterprise General Meeting.
The Ministry’s authority in the enterprise may not be exercised outside the Enterprise General Meeting. The General Meeting adopts Statnett’s articles of association, including Statnett’s objects clause which provides the framework for the operations that Statnett may undertake. An ordinary general meeting is held every year by the end of June.
7. Election committeeStatnett has no election committee. The MPE designate the enterprise’s board members at the Enterprise General Meeting.
8. Corporate Assembly and Board of Directors: composition and independenceStatnett has no corporate assembly. The enterprise’s Board of Directors shall con-
Owner (MPE)
The EnterpriseGeneral Meeting
External auditor
The Board
President and CEO
EiermøtetThe User Council
The Audit Committee The RenumerationCommittee
Internal audit

47
StatnettAnnual report 2012
Corporate governance
sist of seven to nine members, in addition to any deputy members. Two, or pos-sibly three members, and their deputy members are appointed by and from the enterprise’s employees according to the relevant rules laid down in Section 20 of the Act relating to state-owned enterprises and associated regulations. Pursuant to Section 21 of the Act relating to state-owned enterprises, board members are elected for a period of two years, but will remain in office until a new member has been elected even though the term of office has expired.
See the annual report for more information about each board member.
The Board of Directors had an attendance of 92.2 percent in 2012.
Pursuant to the Act relating to state-owned enterprises, the President and CEO cannot be a member of the board. With the exception of employee representa-tives, members of the Board of Directors are independent of the enterprise and the owner.
9. The work of the board of directorsThe Board of Directors has overall responsibility for ensuring that Statnett’s ope-rations are prudently managed. Instructions to the Board of Directors have been established stipulating that the Board must prepare an annual plan for its work which establishes the distribution of roles and responsibilities between the Board of Directors and the President and CEO and ensures that there is sufficient com-petency to handle issues discussed by the Board. The Board of Directors shall determine Statnett’s strategy and ensure that Statnett is organised in a satisfac-tory manner. Furthermore, the Board of Directors adopts budgets and ensures satisfactory asset management, a good working environment and compliance with regulatory requirements, laws and regulations. Statnett’s ethical guidelines stipulate that board members should report any issues that may affect their com-petence on their own initiative. The Board conducts an annual evaluation of its work and competence in order to ensure effective quality control of its work.
The Audit Committee
The Board of Directors has established an Audit Committee which will function as a preparatory body to the Board of Directors. The Board has approved instruc-tions for the Audit Committee. The responsibilities of the Audit Committee include making preparations for the Board of Director’s follow-up of the financial reporting process, monitoring the systems for internal control and risk management and the enterprise’s internal audit process. Furthermore, the Audit Committee shall maintain continuous contact with the enterprise’s appointed auditor with regard to the audit of the enterprise, and assess and monitor the auditor’s independence according to the Audit and Auditors Act. See Note 14 in the annual financial sta-tement for information about the auditor’s fees.
Remuneration Committee
The Board of Directors has appointed a Remuneration Committee to assist the Board of Directors with stipulating the President and CEO’s terms and conditions

48
StatnettAnnual report 2012
Corporate governance
of employment and help establish the main principles and framework for remune-ration of the Statnett Group management. The Board has approved instructions for the Remuneration Committee. In accordance with Section 9 of the articles of association, the Board of Directors prepares a statement concerning remu-neration to the President and CEO and the Group management in accordance with the provisions in the Public Limited Liability Companies Act, the Norwegian Accounting Act, and the Guidelines relating to state-owned companies. See also Note 14 in the financial statement.
Project committee
The Board of Directors has appointed a project committee as of 1 January 2013. The project committee is to function as a preparatory body for the Board of Directors with regard to follow-up of Statnett’s development projects based on a defined mandate. In particular, the project committee shall ensure sound gover-nance of the development projects approved by the Board of Directors and follow up projects from when an investment decision in principle (BP2) has been made in Statnett’s project model. The project committee will present its considerations to the Board of Directors, but will not make decisions on behalf of the Board. The committee will review the mandate annually and propose updates if necessary.
Main Grid User Council
In connection with the 2013 national budget negotiations, the Norwegian Parliament decided to disband the Main Grid User Council. On this background, it was decided at an extraordinary general meeting, held on 11 January 2013, to delete Section 8 of Statnett’s articles of association. The Main Grid User Council was operative throughout 2012 and consisted of six members who were appoin-ted by the Enterprise General Meeting and represented special interest organi-sations. The Main Grid User Council discussed matters pertaining to Statnett’s regulated monopoly and administrative tasks
10. Risk management and internal controlStatnett works systematically to review any risks associated with our activities. The Board of Directors receives a complete overview of the enterprise’s risk pro-file twice a year. All development projects approved by the Board of Directors are reported to the Board meetings and include an updated risk profile for the indivi-dual project.
Internal control is an integral part of corporate governance. Statnett conducts business reviews every six months covering all areas of operation. The reviews include reviews of HSE results, score cards, finance and risk exposure. The Board of Directors reviews and assesses the enterprise’s internal control procedures on an annual basis.
Statnett publishes quarterly financial reports. The external and internal reporting is reviewed by the Group management, the Audit Committee and the Board of Directors.

49
StatnettAnnual report 2012
Corporate governance
Internal control and financial reporting
Combined with the enterprise’s organisation, management forums and reporting lines, Statnett’s ethical guidelines and value base lay the foundation for a good internal control environment. A separate policy has been developed for accoun-ting and financial reporting. Risk assessments of the most important processes related to financial reporting will be conducted as and when required. The Audit Committee, internal auditor and the Board monitor the enterprise’s internal control systems.
Ethical guidelines
Statnett’s ethical guidelines cover areas that are important to ensure good busi-ness ethics in all aspects of our activities. The guidelines lay down specific and practical rules, and set standards for the conduct of all employees. Statnett has appointed an Ethics Ombudsperson who is responsible for ensuring compliance with the Norwegian Working Environment Act with respect to facilitating reporting of censurable conditions. Failure to comply with the ethical guidelines may result in sanctions, depending on the nature and scope of the breach. The ethical guid-elines apply to board members, managers, employees, contractor personnel and any other party who acts on behalf of Statnett.
Ethical guidelines for contractors
Statnett puts particular emphasis on ensuring that our suppliers and part-ners comply with our ethical guidelines for suppliers. The suppliers’ obligation to comply with the ethical requirements is stipulated in the contracts we enter into with our suppliers. Inspections and audits are conducted in order to make sure that the requirements are fulfilled during execution of the contracts. The ethical guidelines for employees and contractors are available in their entirety on Statnett’s web site.
11. Remuneration of the Board of DirectorsSee Note 14 in the financial statement for a detailed overview of Board remune-rations.
12. Remuneration of executive employeesStatnett follows the guidelines that apply for executive pay in state enterprises. See Note 14 in the financial statement for a detailed overview of remuneration of executive employees.
13. Information and communicationTransparency
Statnett is governed by the Public Enterprises Act (with a few exemptions), regu-lations relating to dissemination of information to the power market and safety and preparedness legislation. Statnett distributes financial and operational infor-mation in accordance with the regulatory requirements and practises transpa-rency and openness.

50
StatnettAnnual report 2012
Corporate governance
Financial and operational information as well as the enterprise’s financial calendar are available on Statnett’s web site.
Owner’s Meeting
In addition to the dialogue with the owners which takes place at the Enterprise General Meeting, the owner also promotes communication between the Board of Directors and the owner outside the General Meeting. The purpose of the Owner’s Meeting is to provide an informal forum where the Board of Directors and the owner can exchange opinions and discuss issues of great financial or stra-tegic importance to Statnett. The views expressed by the owner at the Owner’s Meeting provide input for Statnett’s administration and Board of Directors. Issues requiring owner approval must be discussed at the Enterprise’s General Meeting.
14. Company takeoverStatnett SF is a state enterprise. The sale of assets would entail a restructuring of the business organisation and a legal amendment which requires the consent of the Norwegian Parliament.
15. AuditorExternal auditors are appointed by the General Meeting and are independent of Statnett. The enterprise’s external auditor for 2012 was Ernst & Young. The exter-nal auditor presents an annual work schedule to the Audit Committee. The exter-nal auditor attends meetings in the Audit Committee to discuss relevant issues. The auditor participates in the Board’s consideration of the annual accounts. The external auditor must attend one annual Board meeting where the management is not present. The Audit Committee evaluates and proposes an external auditor and is responsible for monitoring the auditor’s independence. As an important part of the process of ensuring the auditor’s independence, the Board of Directors has established guidelines relating to the enterprise’s access to use the external auditor for assignments other than audits. Each year, the external auditor reviews the company’s internal control together with the Audit Committee.
See Note 18 of the financial statement for information about the auditor’s fees, divided between auditing and other consulting services.

51
StatnettAnnual report 2012
Board of Director’s report
Board of Director’s report
Statnett’s main objective is to ensure a stable supply of electricity and facilitate a well-functioning power market. 2012 has been a year with stable operations, and the power situation in Norway has been good throughout the year. The overall energy production increased by 17 percent compared with 2011, both produc-tion and export records were set and net imports were only necessary for two weeks.
The Nordic frequency quality, measured as the number of minutes outside the 49.9 - 50.1 Hz frequency band, has deteriorated in recent years. Together with the other Nordic transmission system operators (TSOs), Statnett has drawn up an action plan to improve the quality. The Frequency Restoration Reserves (FRR), a new market for automatic reserves, was activated in December. The reserves will help bring the frequency back to 50 Hz and reduce the impact of any incidents in the system.
To maintain and improve security of supply, facilitate value creation and reduce emissions of greenhouse gases, Statnett is in the initial phase of its mission to build the next generation main grid by 2030. Statnett’s plans, which are described in the 2011 Grid Development Plan and the updated 2012 Investment Plan, are consistent with the Norwegian government’s Grid Report presented on 2 March 2012. The mission imposes substantial demands on Statnett’s organisation and on the interaction with stakeholders. This requires efficient licensing processes, a strengthening of Statnett’s implementation strategy as well as increased use of the supplier industry through extended contract models. Statnett investments in the main grid in the next decade will be within an estimated cost range of NOK 50 and 70 billion. This will result in increased financing needs and hence also consi-dered the need for additional equity. The increased activity affects the risk situa-tion for Statnett. Statnett practises unified risk management. The risk profile has been assessed, and extensive improvements and measures have been imple-mented to meet this challenge.
In 2012 there has been an increase in investments, and extensive planning has been undertaken which shows that the investment level is expected to increase in the years ahead. Statnett currently has major power line projects under con-struction. The main projects are Ørskog - Sogndal and Sima - Samnanger, which are both important power lines for security of supply to central Norway and the Bergen area respectively. Other major important projects under construction are the Skagerrak 4 interconnector to Denmark and the Ytre Oslofjord cable. The increased investment levels also include significant reinvestments in existing plants and facilities.

52
StatnettAnnual report 2012
Director’s report
Statnett’s future investments in the main grid will result in increased grid tariffs and will thus represent higher costs for the users. In as far as possible, Statnett tries to balance phase-in of investment initiatives necessitated by the need to ensure security of supply, with a cost-efficient overall development plan. Furthermore, Statnett prioritises coordination of contract solutions across projects to ensure efficient use of the supplier market. At the end of 2012, Statnett held licences for 17 percent of the estimated investment portfolio of NOK 50 - 70 billion. The figures in the investment plan may be affected by, for instance, reassignment of priorities in the portfolio, new licensing terms and cost developments in the sup-plier market. Each individual project goes through several decision stages before a final investment decision is made. The largest projects will also be subject to external quality assurance. Since 2003, about 80 percent of Statnett’s projects have been implemented within budget.
The Nordic and north European energy system is undergoing structural changes. This places new demands on the future Norwegian main grid to ensure a robust grid and a flexible supply of energy. To facilitate new renewable energy and an expected Nordic power surplus, and in order to ensure security of supply in dry years, it is necessary to increase the power exchange capacity to the system out-side the Nordic region. In 2012, Statnett has entered into agreements with key parties in Germany and the UK for the construction of international interconnec-tors. These interconnectors are scheduled to be completed by 2018 and 2020 respectively. These projects are important for the development of the Northern European power grid and have top priority for all parties involved.
In 2012, Statnett was certified according to the quality standard PAS 55 (Publicly Available Specification 55). PAS 55 sets requirements to the enterprise’s asset management in a lifetime perspective. The standard assumes a clear connec-tion between the enterprise’s strategy and plans and the implementation of acti-vities and risk-based decisions. The PAS 55 requirements are stringent; they assume continuous asset management improvement and, furthermore, underpin Statnett’s focus on cost-efficient operations during a strong growth phase.
Statnett has focus on Health, Safety and the Environment (HSE) directed at both regular operations and the increasing construction activities. Several measures were introduced in 2012 and Statnett is working systematically to facilitate the zero tolerance philosophy for HSE. There were no serious incidents in Statnett in 2012. However, on 3 January 2013, a tragic accident occurred on one of Statnett’s development projects. A subcontractor employee lost his life. The acci-dent is being investigated by the Police and the Norwegian Labour Inspection Authority. Statnett has also initiated its own investigation of the accident.
Security of supplyThe power situation in Norway was good throughout 2012. The hydrological balance was 12 TWh entering 2012, which is above normal, and the balance remai-ned at this level through most of the year. Cold and dry weather towards the end of the year reduced the hydrological balance to 3 TWh below normal at year-end.

53
StatnettAnnual report 2012
Director’s report
Reservoir levels varied greatly in 2012. At the beginning of 2012 reservoir levels were 80 percent, 35 percentage points higher than in 2011, 10 percentage points above the median, and on par with the maximum level for the period 1993 - 2011. In March the temperature was 4.3 degrees above normal, the warmest March ever recorded nationwide since the year 1900. Precipitation levels in March were 155 percent of normal, resulting in high inflow for this time of year.
In the second quarter, precipitation levels were higher than normal. However, tem-peratures were lower than normal which resulted in late spring culmination, and thus reduced reservoir levels compared to the median. Due to heavy precipitation in July, reservoir levels increased. The average temperature in December was 2.6 degrees below normal and precipitation averaged 70 percent of normal precipita-tion, which reduced reservoir levels. At the end of 2012, reservoir levels were 70 percent, at median level.
The average temperature in 2012 was normal and precipitation was 105 percent of normal. This corresponds to 129 TWh of precipitation energy, 1 TWh above normal. Inflow in 2012 was 134 TWh, 5 TWh higher than normal (based on the period 1981 - 2010), but 15 TWh less than in 2011. The main reason for the changes in reservoir levels, from 10 percentage points above the median at the beginning of the year to median levels at year-end, was high exports throughout the year.
The overall power consumption in 2012 was 130 TWh, compared to 123 TWh last year. Overall power generation was 148 TWh in 2012, an increase of 17 percent from 2011. This resulted in net exports of 18 TWh, which is the highest since 2000.
Net imports were only necessary for two weeks in 2012. High production set new records for production and exports: On 2 February, production for one hour reached 25 910 MWh/h, on 3 April the registered exchange per hour was 5 195 MWh/h and for the week 13-19 August power exchange measured 655 GWh.
On 27 June, a new power line between Sauda and Saurdal was put into opera-tion. This is a 420 kV line, but is operated at 300 kV. The power line has efficiently relieved the other power lines in the area and improved the operating and supply situation in western Norway.
90100Percent
Week
80706050403020100
1 84 12 16 20 24 28 32 36 40 44 48 52
Max-Min 1993-2011 2011 Median 1993-2011 2012

54
StatnettAnnual report 2012
Director’s report
The Nordic frequency quality has been somewhat reduced in certain periods, and Statnett has, together with the other Nordic TSOs, drawn up an action plan to improve the quality. On 3 December, a new market for automatic reserves was launched, the Frequency Restoration Reserves (FRR). The reserves will help bring the frequency back to 50 Hz and reduce the impact of any incidents in the sys-tem. From January 2013 Sweden and Denmark have also contributed FRR to the Nordic system.
There were several operational interruptions in 2012 that affected operations for shorter or longer periods:
• Security of supply to Troms and Finnmark counties was affected following a transformer breakdown in Kvandal in the autumn of 2011. On 2 February, a pylon broke down on the connection between Varangerbotn and Finland, which further deteriorated the situation. The connection to Finland was restored on 10 February. On 15 February, a back-up transformer was put into operation in Kvandal and security of supply was close to normal.
• On 26 January, a transformer outage occurred in Vang (Hamar) causing a con-sumption outage of 100 MW which lasted for about three hours.
• On 4 April, two pylons on the Aura - Viklandet power line broke down due to an avalanche. This affected security of supply to the Møre area. The situation improved throughout spring due to lower consumption and higher production. The power line returned to operation on 4 November.
• On 19 November, an operational interruption occurred in connection with work at Rød transformer station. The manufacturing industry at Herøya, Rafnes and Esso Slagentangen was affected and approx. 500 MW of production was inter-rupted. Industrial consumption and production was resumed after approx. 35 minutes. Rød T4 was back in operation on 25 January 2013.
• A storm in south-western Norway on 14 and 15 December broke pylons on the power lines between Saurdal - Sauda and Førre - Lyse. The power lines retur-ned to operation in January 2013.

55
StatnettAnnual report 2012
Director’s report
InvestmentsStatnett has major development projects under planning and implementation. The plans are presented in Statnett’s grid development plan from 2011 and the updated 2012 investment plan. The plans are in line with the white paper No. 14 (2011-2012), the Grid Report. Statnett invested NOK 3 152 million in 2012, inclu-ding both commissioned and ongoing investment projects. This is an increase from NOK 2 384 million in 2011.
Development investment
Commissioned projects totalled NOK 1 339 million in 2012.
At year-end, the value of plants under construction was NOK 4 277 million, a net increase of NOK 1 840 million in 2012. This was mainly related to the power lines Ørskog - Sogndal and Sima - Samnanger, as well as the Skagerrak 4 intercon-nector to Denmark.
The most important projects are listed in the table below. Planning proposal sub-mitted means that Statnett has notified the Norwegian Water Resources and Energy Directorate (NVE) that a licence will be applied for, but a licence application has not yet been submitted. Projects for which licence applications are pending or licences have been appealed are being considered by the Norwegian authorities
Back-up power Investments
3500MNOK
30002500200015001000500
0
2004 2005 2006 2007 2008 2009 2010 2011 2012
Development investmentFigureInvestments in norned in 2005-2008 was
nOk 2 446 million

56
StatnettAnnual report 2012
Director’s report
Overview of major investment projectsSee www.statnett.no for more information about the projects. Expected investment
Project Location NOK million
Commissioned projects
Hasle transformatorstasjon 400
Sauda - Liastølen Rogaland 200
Modernisation of ICT infrastructure in Statnett’s stations 87
Ongoing major investment projects
Ørskog - Sogndal Møre og Romsdal/Sogn og Fjordane 4 600 - 5 600
Voltage upgrade eastern corridor (Kristiansand - Rød) Vest-Agder/Telemark 1 350 - 1 950 1)
Station investments (Frogner, Mestervik back-up transformers
and reactors for voltage reduction) 1 400 - 1 750
Skagerrak 4 Norge/Danmark 1 400 - 1 700 2)
Ytre Oslofjord Vestfold/Østfold 1 200 - 1 400
Sima - Samnanger Hordaland 900 - 1 100
Varangerbotn - Skogfoss Finnmark 480 - 580
Licences pending or appealed
Ofoten - Balsfjord - Hammerfest Nordland/Troms/Finnmark 8 000 - 12 000
Voltage upgrade Western corridor Vest-Agder/Rogaland 6 000 - 9 000
Station investments (Hamang, Lakselv, transformer capacity Eastern Norway) 2 900 - 4 100
Storheia - Snillfjord - Trollheim Sør-Trøndelag/Møre og Romsdal 2 600 - 3 900
Namsos - Roan - Storheia Trøndelag 1 400 - 2 100
Voltage upgrade Midt-Norge Klæbu - Namsos Trøndelag 700 - 1 000
Reinvestments Indre Oslofjord - interconnectors 670 - 870
Planning proposal submitted
The South-West Link Norway/Sweden 3 300 - 5 000
”Arctic Circle” Skaidi - Varangerbotn Finnmark 2 250 - 3 500

57
StatnettAnnual report 2012
Director’s report
Important project events in 2012Major investment projects - completed
• Hasle Transformer Station: A new upgraded station assumed operation in November.
• Sauda-Liastølen: A new 420 kV and 29 km long power line came online in June. The power line is operated at 300 kV.
• Modernisationof ICT infrastructure inStatnettstations: The project will improve capacity, availability, security, safety and functionality of ICT services at Statnett stations. The project has been completed below budget.
Ongoing major investment projects
• Ørskog-Sogndal: There is a high level of activity related to construction of power lines and substations. Work is ongoing to gain land access after a final licence was granted in December 2011.
• Voltage upgrades EasternCorridorKristiansand -Rød: Construction work has started on the Kristiansand - Bamble section. Statnett received a final licence for the Bamble - Rød section on 1 March 2013.
• Skagerrak4: Progress is according to plan and completion is scheduled at year-end 2014.
• YtreOslofjord: Due to technical irregularities on the oil cables, the cables must be remanufactured. The production of a prototype oil cable has been completed and preparations for type testing are ongoing. The production of the PEX cables has been delayed. A back-up cable has been deployed to handle a potential outage situation. The back-up cable can be put into operation 1 – 2 weeks after a deci-sion to do so has been made.
• Sima-Samnanger: Progress is somewhat behind schedule. However, comple-tion is expected in 2013 as planned.
• Varangerbotn - Skogfoss: Progress is somewhat behind schedule. However, commissioning is expected in 2013 as planned.
Expected investment
Project Location NOK million
Interconnectors
Cable to England 6 000 - 8 000 2)
Cable to Germany 6 000 - 8 000 2)
ICT projects
Renewal of Statnett’s central operations system 400 - 500
New Regulation and Market System 200 - 250
Computer network for power system management 200 - 250
1) Sections are under licensing
2) Statnett share

58
StatnettAnnual report 2012
Director’s report
Other projects under development:
• Ofoten -Balsfjord -Hammerfest: In 2012, the NVE granted Statnett a licence for the construction and operation of a 420 kV power line from Ofoten through Balsfjord to Hammerfest. The decision has been appealed. This is the longest power line project in Norway (513 km). In January 2013, the Statnett Board of Directors made an investment decision in principle for the Ofoten - Balsfjord sec-tion.
• Interconnector to Germany: The project is under development and scheduled for commissioning in 2018. Statnett has signed a partnership agreement with TenneT and the German state-owned financial institution KfW and is, together with these partners, developing the interconnector project towards a final invest-ment decision in 2014.
• Interconnector toEngland: The project is under development and scheduled for commissioning in 2020. Statnett and National Grid International Limited have sig-ned a collaboration agreement for the construction of the interconnector.
Research, development and competence buildingResearch and development (R&D) in Statnett is a strategic tool to promote value creation, innovation and environment friendly solutions. Statnett invested NOK 37 million in R&D in 2012, two million less than in 2011. In the first quarter of 2012, a new R&D strategy was developed for the period 2012 - 2014, linked to Statnett’s Group strategy. The following R&D programmes were initiated:
• SmartGrid: Developing and testing new solutions for safe and efficient operations which will meet future challenges.
• Solutionsandtechnologyforthenextgenerationmaingrid: Developing and imple-menting a pilot facility to support the development of a robust main grid adapted to the environment.
• Priorities:
- Environmentalchallenges: Impact of new infrastructure on the environment - Social acceptance: Ensure acceptance and understanding for Statnett’s social mandate, ensure security of supply and promote value creation through interaction with the other Nordic countries and Europe.
In addition to its own R&D activities, Statnett cooperates closely with external exper-tise both in Norway and abroad. Furthermore, Statnett is committed to developing an R&D strategy through ENTSO-E, which will give the enterprise the opportunity to participate in jointly financed R&D projects together with other transmission system operators, as well as universities in Europe with financial support from the EU. See Corporate Social Responsibility for more information about Statnett’s R&D work.
Financial resultsThe annual financial statements for Statnett SF and the Statnett Group have been prepared in compliance with the International Financial Reporting Standards (IFRS) and interpretations established by the International Accounting Standards Board (IASB) which have been approved by the EU. Comments to the accounting items

59
StatnettAnnual report 2012
Director’s report
are in relation to the Group’s financial statement. Developments described for the Group also apply to the parent company.
Operating revenues
Statnett’s operating revenues for 2012 totalled NOK 5 334 million (NOK 5 497 mil-lion). The reduction in operating revenues was due to lower tariff revenues in 2012, due to planned downward adjustment of tariffs for 2012 as well as lower electricity prices in 2012, somewhat offset by increased congestion revenues.
Statnett’s operating revenues mainly derive from regulated grid operations. Operating revenues from regulated activities in Statnett’s financial reporting consist primarily of fixed grid tariffs from the customers as well as congestion revenues (price differen-ces between areas in the Nordic region and towards the Netherlands). Statnett’s grid operations are regulated by the NVE which stipulates a cap for Statnett’s reve-nues (permitted revenue). If the total revenues from grid operations for one year diverge from the permitted revenue, so-called higher or lower revenue will occur. Higher/lower revenue will even out over time through adjustment of future grid tariffs. In 2012, Statnett’s higher revenue amounted to NOK 1 065 million (NOK 1 020 mil-lion). Accumulated higher revenue including interest was NOK 3 455 million at the end of 2012.
Operating costs
The Group’s operating costs in 2012 totalled NOK 3 901 million (NOK 3 869 million).
System services costs were reduced by NOK 70 million due to reduced costs of reserves. 2012 was characterised by high reservoir water levels and high produc-tion. All generators supplied reserves. Consequently, the need to purchase further reserves was low. In 2011, on the other hand, reservoir water levels were low as was production. This was combined with extraordinary high inflow in some peri-ods, and in some parts of the country, production exceeded grid capacity in 2011. Production had to be regulated downwards despite water loss at some power plants. This was particularly costly during the revision period.
Transmission losses were NOK 263 million lower in 2012 compared to 2011. This was due to lower energy prices in 2012.
7000MNOK
600050004000300020001000
0
2006 2007 2008 2009 2010 2011 2012
Operating revenue
Congestion revenue Tariff revenue (grid tariffs) Permitted revenue

60
StatnettAnnual report 2012
Director’s report
Wage costs increased by NOK 142 million in 2012 compared to 2011. This was due to an increase in pension costs attributable to changes in actuarial assumptions applied to pension calculations as well as an increase in staff throughout 2012 as a result of increased activity in development, operations and maintenance.
Depreciation and write-downs increased by NOK 29 million in 2012 compared with 2011. This was due to a net increase in the value of commissioned facilities.
Other operating costs were NOK 194 million higher in 2012 than in 2011. This was primarily due to increased interconnector activity, preparedness measures for Ytre Oslofjord, as well as reversal of provisions in 2011 related to the cost-sharing agre-ement for NorNed’s first two operating years.
Net profit
The Group’s operating profit for 2012 amounted to NOK 1 433 million (NOK 1 628 million).
Revenues from associates totalled NOK 9 million in 2012 (NOK 5 million).
The Group’s net financial items for 2012 amounted to net cost of NOK 280 million (net cost of NOK 276 million). Interest costs were higher in 2012 due to an increase in loans in 2012. This was offset by an increase in capitalized contruction interest as a result of significantly higher project activities in 2012.
Profit for the year after tax in 2012 was NOK 837 million (NOK 1 000 million). Lower tariff revenue is the main reason for the reduction in profit. The adjusted profit after tax for the year amounted to NOK 234 million, and is adjusted for changes in higher/lower revenue, including decisions relating to earlier years of NOK 272 million and estimated interest costs. Dividend is based on the adjusted profit.
Cash flow and balance sheet
The Group’s operating activities generated an accumulated cash flow of NOK 1 426 million in 2012. The net cash flow from investment activities totalled NOK -3 085 million. In total, loans were redeemed by NOK 4 439 million, and new loans of NOK 5 903 million were raised. At year-end 2012, the Group’s liquid assets and market-based securities amounted to NOK 1 302 million (NOK 1 602 million).
At the end of 2012, the Group had total assets of NOK 25 794 million (NOK 23 881 million), and interest-bearing debt amounted to NOK 14 390 million. The market value of recognised interest swap and currency swap agreements (fair value hed-ges) related to interest-bearing debt was NOK 932 million. Interest-bearing debt, corrected for this, totalled NOK 13 458 million.
At year-end 2012, the Group’s equity totalled NOK 8 955 million (NOK 8 277 million). The company’s distributable equity was NOK 5 979 million at year-end (NOK 5 289 million). Adjusted for net higher/lower revenue, the equity ratio was 25.1 percent.

61
StatnettAnnual report 2012
Director’s report
Subsidiaries and associated companies
Statnett SF is required to provide heavy transport preparedness for the Norwegian power supply. The wholly owned subsidiary Statnett Transport AS shall ensure effi-cient and competitive execution of these obligations. In 2012, operating revenues for Statnett Transport amounted to NOK 137 million (NOK 104 million) and the profit before tax was NOK 18 million (NOK 1 million).
At the beginning of 2012, Statnett SF had an ownership interest of 30 percent in Nord Pool Spot AS. On 1 August 2012 there was an increase in capital in Nord Pool Spot AS, where Elering AS and Litgrid AB, systems operators in Estonia and Lithuania, purchased a shareholding of two percent each. Statnett’s share-holding was consequently reduced to 28.8 percent The Latvian system operator Augstsprieguma has issued a letter of intent to purchase two percent of the sha-res in Nord Pool Spot and will effectuate this agreement when the power market opens in Latvia. Statnett’s shareholding after the three Baltic system operators have become co-owners in Nord Pool Spot AS, will be 28.2 percent. Statnett’s share of the profit in Nord Pool ASA contributed NOK 9 million (NOK 5 million) to the Statnett Group’s profit in 2012.
RiskStatnett practises unified risk management which reflects that the enterprise mana-ges a critical infrastructure in a vulnerable society, and that the enterprise is in a growth phase with a significant project volume. Statnett’s tolerance for risks with a potential impact on HSE and supply of electrical power is very low. A secure power supply in general forms the basis for stable supply of electricity to the end-users specifically, value creation and realisation of climate-friendly solutions. Important activities for managing risk in connection with power supply include:
• Asset management including new investments and reinvestments, main-tenance and security measures
• Exercising Statnett’s system responsibility• Preparedness
Statnett’s risk management covers the enterprise’s entire perspective, including strategic, commercial, operational and financial aspects. Statnett’s risk manage-ment is an integrated part of the company’s activities, coordinated across divisions by means of a common methodical foundation and framework. There is focus on risks with a potential impact on HSE, power supply, financial aspects, reputation and compliance. Consequences at enterprise level will take priority.
Market risks are centally managed in Statnett, and checks are conducted to ensure that exposure does not exceed mandates. Assets, responsibility and personnel are insured at Group level. A coordinated mapping of exposure is conducted and an insurance portfolio has been established through Statnett Forsikring AS and the open insurance market.
Statnett’s risk areas are, to a large extent, of an operational and financial nature.
62
StatnettAnnual report 2012
Director’s report
Operational risk
• HSE risk. Statnett’s work relating to development, operations and maintenance, involves operations where there is a risk of serious personal injury. Statnett’s activity level will increase in the time ahead and there will be focus on health, safety and environment risks. This HSE risk is reduced by focussing on sound, documented work processes, safe job analyses, management focus on HSE, as well as the reporting of incidents and near misses in a learning perspective. An extensive HSE network across the Group is an important contributor to a uniform work method and for efficient learning and development.
• • Project and portfolio risk. Statnett is implementing several major projects, and
is planning to launch a number of new projects. This entails increased project risk. The projects are relatively uniform and take place mainly in Norway. This means that the projects are exposed to many common risk factors in addi-tion to the project-specific factors. In 2012, Statnett conducted comprehen-sive analyses to look into the possibility of establishing a project portfolio with a more favourable risk profile and an ambitious, but acceptable schedule for goal realisation. The portfolio was adopted in the autumn of 2012. The project exe-cution risk still remains, even after this replanning.
•• Significant common risk factors in the project portfolio include HSE risks, dis-
connection needs in the existing grid, capacity challenges relating to certain expertise groups, awarding of licences and authority permits as well as insuffici-ent quality in deliveries. Risk is managed by focusing on quality in work proces-ses, various implementation models and internal allocation of expertise and capacity.
•• In order to increase the company’s implementation capacity new contract
models are introduced where a greater share of the work is performed by external contractors. It is important to take into account the various risks ari-sing from the chosen contract model, including how risk is shared between Statnett and suppliers. Furthermore, there are various risks associated with the contractor’s ability to meet Statnett’s quality requirements, the ability to operate under Norwegian conditions, meeting Statnett’s safety requirements and com-pliance with statutory and contractual tariff wages and working conditions for foreign workers. Efficient management of these risk factors sets strict require-ments for Statnett as a construction client. Statnett will also be more exposed to non-deliveries should any of the company’s suppliers run into financial dif-ficulties. There is focus on assessment and continuous follow-up of suppliers.
•• To ensure good governance of the projects approved by the Board of Directors,
the Statnett Board has appointed a project committee. The project committee will follow up to ensure that Statnett’s management of the projects is satisfac-tory and that the projects have sound HSE practice, supply good technical quality, follow schedules, comply with budgets and are cost-efficient.
• • Risks relating to systems and operation. The frequency quality in the Nordic
region, measured as the number of minutes outside the 49.9 - 50.1 Hz frequ-

63
StatnettAnnual report 2012
Director’s report
ency band, has deteriorated in recent years. Frequency deviation is an indicator of the risk in the system. If an incident should occur in the Nordic power system during a situation which cannot be covered by available reserves, the frequency may fall to a level where consumption is disconnected (automatic frequency control). The Nordic TSOs have implemented measures to improve the frequ-ency quality, most recently in December 2012 when a market for secondary reserves was launched.
• Risk of grid facility faults. Interruptions in the electricity supply may occur as
a result of a fault in a single component during N-0 operation or as a result of concurrent faults in situations with normal operational reliability. Some geograp-hical areas have N-0 supply for parts of the year; such as Bergen, Stavanger, northern Norway north of Ofoten, Lofoten/Vesterålen, Sunnmøre and parts of eastern Norway. The number of hours with N-0 operation depends on the level of consumption as well as the extent of any grid outages due to faults, main-tenance and reconstructions. An increase in N-0 operation hours increases the risk of supply interruptions. Some of the consumption is constantly supplied by N-0, such as the process facility for Ormen Lange in Nyhamna. In 2012, few incidents have resulted in outages for end-users. Preliminary estimated outage costs for connected end-users (under the KILE scheme) amounted to NOK 31 million in 2012, compared with NOK 270 million in 2011.
•• For areas supplied by N-1 operation, at least two faults must occur before sup-
ply is interrupted. The main reasons for concurrent faults are extreme weather, operational incidents during grid work as well as other extreme incidents. Concurrent faults are less likely to occur than single faults. However, these may last longer and be more extensive.
•• Many different measures are applied for managing the risk of faults in grid facili-
ties. Completed new investments reduce the risk of N-0 operation in the event of a fault. However, the risk may increase during the construction period as existing facilities need to be disconnected. Reinvestment and maintenance will improve the condition of a facility and reduce the risk of faults in the existing grid structure. Safety measures reduce the risk of externally generated faults as well as injuries. Emergency preparedness measures reduce the impact of faults and other incidents, should they occur.
•• In the medium term, many of the ongoing risk-adjustment measures, in particu-
lar development projects, will be completed, and some of the areas which cur-rently have N-0 operation for parts of the year will have a more reliable power supply. Developments in production and consumption, ageing of existing grid facilities and weather changes are some factors that will result in some areas still being exposed to faults in grid facilities. Statnett is continuously conducting analyses to identify areas that are exposed to risks in the medium term.
• • Energy access. Risk related to energy access for the system as a whole is
considered to be normal based on a regular hydrological balance, combined with the fact that Swedish nuclear power is expected to produce with a high

64
StatnettAnnual report 2012
Director’s report
load factor. Other measures that will reduce the risk include purchase of energy options in consumption and earlier investments in back-up power facilities.
• Operating control systems. A fault in the operating control system may lead to
disruptions in the power system, power failures, physical damage to facilities or may pose a risk to human life and health. Such incidents will also complicate fault correction in the power grid. There were no incidents with major consequ-ences in 2012. Measures that are implemented to reduce the risk include sys-tematic risk management, duplication of technical solutions, improved access control and establishment of a more robust data communications network.
• • Regulation. The energy sector is strongly regulated and the development
trend points towards even more regulation to achieve political objectives. Furthermore, power lines historically represent controversial disruptions to the landscape and Statnett’s facility upgrades will affect many of the country’s municipalities in the coming decades. Statnett is dependent on society’s acceptance of any disruptions to the landscape as a consequence of our acti-vities. A majority of the Storting supports the main aspects of the Grid Report, which to a large extent embraces Statnett’s activities.
Financial risk
Statnett has established a financial policy and framework for financial management, including limits in connection with credit risk, settlement risk and counterparty risk, as well as instructions for implementation of financial transactions. Control procedu-res have been established which are carried out independently.
• Financial risk. Statnett has access to multiple credit markets and has a diver-sified maturity structure on its debt. This reduces the risk of Statnett not being able to refinance the company’s loans during periods with limited captial availa-bility. The enterprise has a credit facility totalling NOK 3.5 billion with a five-year term to support an ability to fund at least 12 months’ operation and invest-ments without incurring any new debt. Statnett has long-term credit ratings of A+ and A2 from Standard & Poor’s and Moody’s Investor Service, respectively.
• Interest rate risk. Statnett’s permitted revenues are partly based on the return on the enterprise’s grid capital, calculated on the basis of the NVE interest rate. The model used to calculate the NVE interest rate has been changed with effect from 1 January 2013. The change will reduce Statnett’s interest rate risk, as the new model is better adapted to the actual financing costs of the grid companies, including Statnett.
• Credit risk. Statnett assumes credit risk through placing surplus liquidity with securities issuers. Statnett has limits which set credit rating requirements for counterparties and maximum exposure limits for each individual investment of surplus liquidity. Statnett is also exposed to credit risk related to the company’s collection of main grid tariffs, and as responsible for balance settlement in the regulating power market. Routines have been established for provision of secu-rity relating to trade on the regulating power market.

65
StatnettAnnual report 2012
Director’s report
• Currency risk. Statnett’s revenues are mainly in Norwegian Kroner (NOK), whe-reas some of the Group’s expenses are in foreign currencies. Currency risk is minimised through several measures, including using currency swap agree-ments to hedge risk in connection with purchases in investment projects. All Statnett loans in foreign currency are converted to NOK through currency swap agreements.
Employees and organisationStatnett’s head office is in Oslo, with administrative offices in Alta, Sunndalsøra and Strinda in Trondheim and in Brussels. In addition, Statnett employees work at facili-ties all over Norway.
Employees
Statnett has an ambitious assignment and must ensure that the right expertise is in place for the right jobs. The enterprise had significant growth in 2012 with 132 new employees. Statnett has a low staff turnover. However, many of our employees will retire in the next few years. Consequently, Statnett makes a targeted effort to be an attractive employer in order to attract new employees, as well as to retain and develop the expertise of existing employees. This includes summer job programmes, trainee programmes and apprentices in electrical power engineering. Statnett has introduced a career model which focuses on individual professional development of Statnett’s employees. Furthermore, Statnett has a senior policy with flexible working arrange-ments to retain valuable employees and expertise until retirement age.
Project management skills are important for Statnett’s ability to carry out the sche-duled project portfolio. Consequently, we provide training for project managers and project employees internally at a project academy developed for Statnett. In 2012, 256 course modules were held and 57 examinations were held at various levels.
At the turn of the year, Statnett SF had 994 employees, compared to 928 the year before. The increase in staff is mainly owing to an increasing number of tasks in con-nection with planning and implementation of investment projects, as well as increa-sed requirements related to preparedness and new expertise regulations.
Statnett conducts annual organisation surveys. In 2012, Statnett implemented a more suitable tool. In several areas, Statnett’s results are better than the com-parative basis for Norway and the energy sector, including job satisfaction, moti-vation and loyalty. Statnett’s employees also report that they are familiar with the company’s objectives and strategies, that there is ample opportunity for professional and personal development in the company and that safety is very well maintained.
Gender equality and diversity
Statnett has a zero tolerance policy regarding discrimination and harassment in the workplace. The enterprise follows this up with local safety delegates, appraisal inter-views and opinion polls. For Statnett it is important to ensure a diverse organisation in terms of gender, ethnicity and age. In 2012, 5.3 percent of new employees came from non-Norwegian backgrounds, down from 9.5 percent in 2011.

66
StatnettAnnual report 2012
Director’s report
The percentage of female employees has increased by one percentage point since 2011, to 24.1 percent. The percentage of female employees in the energy sector in general was approximatley 20 percent. At the end of 2012, four of the nine mem-bers of Statnett’s Board of Directors were women and one of the seven members of the Group management. Women filled 22 percent of all managerial positions in the Group and two of Statnett’s eight trainees in 2012 are female. Statnett aims to increase the number of women in technical and managerial positions.
Employment conditions for women and men are monitored using a variety of methods, including wage reviews and staff surveys. Women and men with approxi-mately the same educational background and experience, and employed in compa-rable positions receive equal pay. The average percentage of personnel in full-time positions is increasing, with 96.5 percent for women in 2012, compared with 96 percent in 2011 and 99.4 percent for men in 2012, compared with 98.8 percent in 2011. See also Notes 4 and 14 for more information about wage costs and remune-ration to the Group management.
Health, safety and the working environment
Statnett has a zero tolerance policy with regard to accidents, injuries and unneces-sary environmental impact. The Group maintains strong focus on health, safety and the environment (HSE) and implemented an HSE action plan in 2011. This was con-tinued in 2012 with new focus areas. Reporting of undesirable HSE incidents and nonconformities increased in 2012, which is a continuation of the trends from 2010 and 2011. This is a result of strong encouragement to report such incidents as well as better reporting systems. Statnett registers undesirable HSE incidents and devia-tions occurring in its own organisation, as well as in contractor/supplier organisa-tions. HSE plans are drawn up for every project, and Safe Job Analyses are prepa-red before all risk-exposed work operations.
There were no serious incidents in Statnett in 2012. However, on 3 January 2013, a tragic accident occurred on one of Statnett development projects. A subcontrac-tor employee lost his life. The accident is being investigated by the Police and the Norwegian Labour Inspection Authority. Statnett has also initiated its own investiga-tion of the accident.
Eight internal lost-time injuries were reported in 2012, whereas our contractors/sup-pliers reported 18 lost-time injuries. The Lost Time Injury Frequency Rate (H value) in Statnett was 4.4 in 2012, down from the 2011 rate of 6.3. The F value in Statnett was 63.4 in 2012, down from 209.4 in 2011.
The Group’s overall absence due to illness was 3.6 percent in 2012, compared with 3.8 percent in 2011. Statnett is working to reduce absence due to illness. This invol-ves adaptation of individual workplaces and various health-promoting and illness-reducing measures, including use of safety inspections and physical therapy treat-ment.
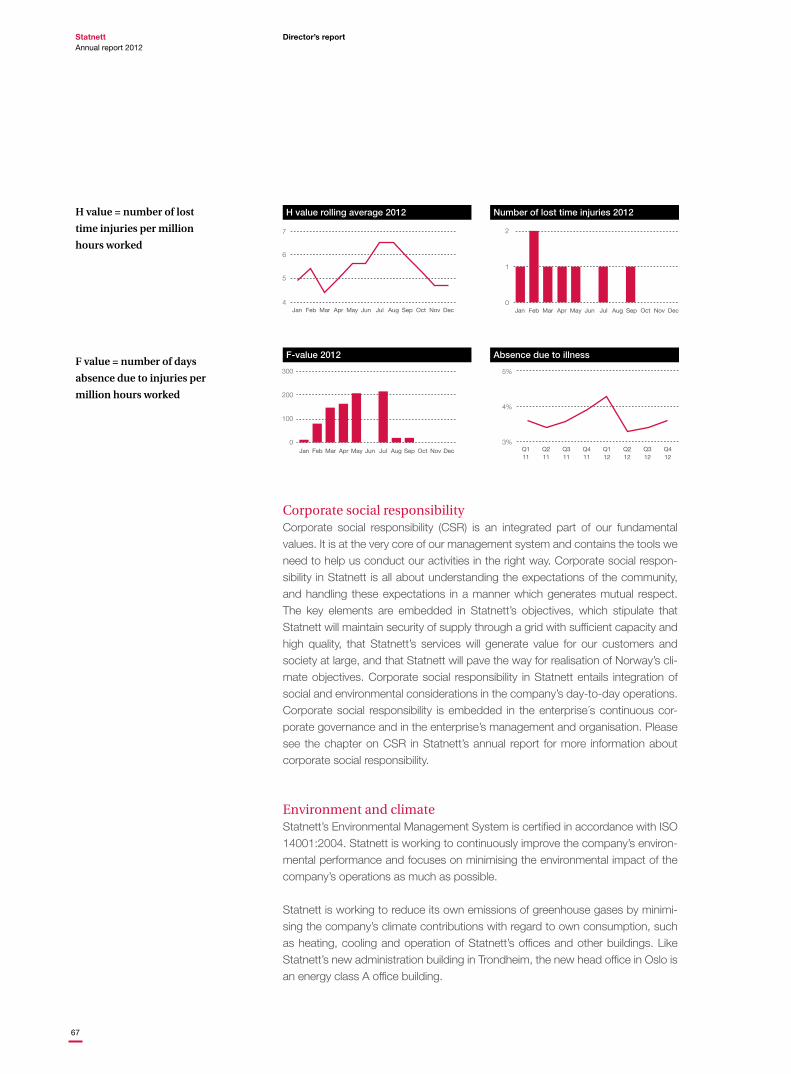
67
StatnettAnnual report 2012
Director’s report
Jan Feb Mar Apr May Jun Jul Aug Sep Oct Nov Dec
7
6
5
4
H value rolling average 2012
F-value 2012
Number of lost time injuries 2012
Absence due to illness
Jan Feb Mar Apr May Jun Jul Aug Sep Oct Nov Dec
300
200
100
0
H value = number of lost
time injuries per million
hours worked
F value = number of days
absence due to injuries per
million hours worked
2
1
0Jan Feb Mar Apr May Jun Jul Aug Sep Oct Nov Dec
Q111
Q211
Q311
Q411
Q112
Q212
Q312
Q412
5%
4%
3%
Corporate social responsibilityCorporate social responsibility (CSR) is an integrated part of our fundamental values. It is at the very core of our management system and contains the tools we need to help us conduct our activities in the right way. Corporate social respon-sibility in Statnett is all about understanding the expectations of the community, and handling these expectations in a manner which generates mutual respect. The key elements are embedded in Statnett’s objectives, which stipulate that Statnett will maintain security of supply through a grid with sufficient capacity and high quality, that Statnett’s services will generate value for our customers and society at large, and that Statnett will pave the way for realisation of Norway’s cli-mate objectives. Corporate social responsibility in Statnett entails integration of social and environmental considerations in the company’s day-to-day operations. Corporate social responsibility is embedded in the enterprise´s continuous cor-porate governance and in the enterprise’s management and organisation. Please see the chapter on CSR in Statnett’s annual report for more information about corporate social responsibility.
Environment and climateStatnett’s Environmental Management System is certified in accordance with ISO 14001:2004. Statnett is working to continuously improve the company’s environ-mental performance and focuses on minimising the environmental impact of the company’s operations as much as possible.
Statnett is working to reduce its own emissions of greenhouse gases by minimi-sing the company’s climate contributions with regard to own consumption, such as heating, cooling and operation of Statnett’s offices and other buildings. Like Statnett’s new administration building in Trondheim, the new head office in Oslo is an energy class A office building.

68
StatnettAnnual report 2012
Director’s report
The largest sources of greenhouse gas emissions from Statnett’s activities are leaks from the SF6 facilities, emissions from mobile reserve power plants and pas-senger transport. In addition, emissions occur in connection with construction activities.
Emissions of SF6 gas from Statnett’s facilities increased by 69 percent, from 210 kg in 2011 to 354 kg in 2012. This corresponds to an environmental impact of 8 256 tonnes of CO2-equivalents in 2012. The increase was due to maintenance and refilling of several SF6 facilities. The emissions for 2012 amounted to 0.3 per-cent of the total 113 tonnes of SF6 gas in Statnett’s facilities. This is below the normal level of leakages from facilities of this type.
Statnett owns two mobile reserve power plants, located at Tjeldbergodden and Nyhamna in Møre og Romsdal. They have been part of Statnett’s preparedness plans since 2009 in case of a risk of rationing in central Norway. One reserve power plant in operation will have carbon emissions of 2 450 tonnes per day (0.68 tonnes/MWh), and are only put into operation in very strained power situa-tions.
Air travel in Statnett totalled 8 790 410 km, corresponding to total carbon emis-sions of 1 179 tonnes. In addition, the use of private cars for work-related travel (excluding rental cars) totalled 1 278 249 km. Based on average carbon emis-sions of 134 g/km (for newer cars, the Norwegian Public Roads Administration), this corresponds to carbon emissions of 171 tonnes.
Corporate governanceStatnett is a state enterprise wholly owned by the Norwegian State through the Ministry of Petroleum and Energy.
Statnett’s corporate governance principles clarify the distribution of roles among the owner, the Board of Directors and the general management. Statnett adheres to the Norwegian State’s Principles for Good Corporate Governance and follows the recommendations laid down by the Norwegian Corporate Governance Board (NUES) to the extent permitted by the company’s organisation. For more informa-tion about Statnett’s compliance with NUES recommendations, please see the chapter on Corporate Governance.
Changes in the Board of Directors
At the Enterprise General Meeting on 27 June, Egil Gjesteland and Kristin Lian were elected to the board of Statnett SF. Gjesteland and Lian replaced Thor Håkstad and Grethe Høiland. At same meeting, Per Hjort was elected deputy chairman.
In connection with the Main Grid User Council being disbanded, the practice of appointing one representative from the users among the members of the board was discontinued. Maria Sandsmark was elected to the Board of Statnett SF at an extraordinary enterprise meeting on 11 January 2013. She replaced Kristin Lian who represented the users.

69
StatnettAnnual report 2012
Director’s report
OutlookStatnett’s 2011 Grid Development Plan and updated investment plan for 2012 form the basis for the next generation main grid which will be completed by 2030. Consequently, Statnett will make grid investments of between NOK 50 and 70 bil-lion in the next decade. Statnett currently holds a final licence for 17 percent of this portfolio. Statnett has a large project volume in the implementation phase. The coming period will be characterised by development and implementation. This will involve both new and upgrades of existing power lines and facilities. There will be intense construction activity in this period. This places great demands on Statnett when it comes to coordinating a number of projects in existing facilities while operating the power system. Statnett is strengthening operative prepared-ness to improve the ability to handle any unforeseen and critical incidents.
Statnett has several important projects under construction. There is currently par-ticular focus on progress in the Sima - Samnanger project, as well as Ørskog - Sogndal, which are important power lines to secure supply to the Bergen area and central Norway, respectively. Statnett also has focus on completing the cable projects Ytre Oslofjord and Skagerak 4 to Denmark.
Statnett is working to realize the construction of interconnectors to Germany and the UK, which are scheduled for completion in 2018 and 2020 respectively. These projects are important for the development of the Northern European power grid and are a top priority for all parties involved. The projects will help ensure secu-rity of supply during cold and dry periods and contribute to balance variations in German and British renewable power production throughout the day. Power exchange capacity generates value in Norway. Moreover, the projects will support the ambition to increase generation of renewable energy throughout the region and the EU’s climate and energy targets. Furthermore, the new interconnectors will contribute to the further integration of the Northern European power market.
To be able to implement the planned development projects according to sche-dule, Statnett is dependent on an efficient licensing process and an external sup-plier market that can offer sufficient capacity in the years to come. Statnett is eager to further improve collaboration with all involved parties to secure important input to the planning and realisation of new power lines. In this regard, initiatives have been taken in relation to local and regional authorities as well as other stake-holders. Among other initiatives, Statnett has strengthened cooperation with regi-onal grid companies to ensure the best possible knowledge of local conditions.
Due to an increase in the enterprise’s investment activities in new and existing grid facilities, Statnett’s asset base will increase significantly. New facilities will be com-missioned and some of the old facilities will be phased out. Statnett is concerned with managing the company’s facilities in a uniform and prudent manner. PAS 55, which is a quality standard representing best practice for optimum asset mana-gement, will be one of several measures to ensure that Statnett maintains high cost efficiency in its operations and during the development of the next genera-tion main grid.

70
StatnettAnnual report 2012
Director’s report
In the autumn of 2012, the NVE submitted several regulations for consultation. The regulations relate to Statnett’s responsibility for the system, for emergency preparedness, for operation and maintenance, as well as for planning and repor-ting, and will entail more tasks.
Statnett is involved in international cooperation both at a European and Nordic level. This work is important as many of the framework conditions are stipulated by the EU and are relevant for Norway through the EEA agreement. The establish-ment of a common European power market makes it necessary to harmonise the framework for the electricity market, as well as for system and grid operations. As the Norwegian hydropower system differs from the European system it is essen-tial that the framework conditions are formulated to secure Norwegian security of supply and help promote value creation. The Nordic TSOs cooperate on many key issues at the European level.
ENTSO-E, of which Statnett is a member, has been assigned the task of prepa-ring a proposal for European network codes for the power market. Statnett also cooperates with other grid companies and power exchanges in north-western Europe on the establishment of a common market algorithm which will calculate the price and flow of electricity for Norway, the Nordic region and Europe. This is expected to be launched in November 2013.
Statnett has experienced strong growth in recent years. Statnett is currently imple-menting a necessary restructuring of its organisation to increase the company’s implementation ability. Most of this work is expected to be completed in 2013. Concurrently, Statnett is faced with a demand from customers and the autho-rities for a high degree of cost efficiency. In order to realise the benefits of our resource development, ongoing improvement work and improved use of the sup-plier market, the Group management and the Board of Directors have established a necessary goal which involves increasing productivity in the enterprise before the end of 2016.
The increased investments will result in higher tariffs in the years to come. Statnett has a balance for higher revenue at year-end 2012 which will be partly returned to Statnett’s customers through reduced tariffs in 2013. This will also curb the increase in tariffs somewhat in the coming years.
The Storting has decided to disband the Main Grid User Council. To ensure con-tinued good dialogue between users and customers, Statnett has established a Markets and Operation Forum. The representatives hold leading positions in com-panies and associates in the energy industry. Otherwise, Statnett is concerned to have a constructive dialouge with all stakeholders through the licensing process.
In accordance with Section 3-3a of the Norwegian Accounting Act, the Board of Directors confirms that conditions exist for continued operation of the enter-prise on a going concern basis and that the annual accounts have been prepared under this assumption.

71
StatnettAnnual report 2012
Director’s report
Allocation of profit
Its deliberations on Parlamentary bill to the Storting No.1 (2011-2012), the fiscal budget for 2012, the Norwegian government established a long-term dividend policy of 50 percent of the defined dividend basis up to and including the fiscal year 2015. The basis for the dividend is defined as the Group’s net profit after tax, adjusted for changes in the balance for higher/lower revenue for the year after tax.
On the basis of the above, the Board of Directors therefore recommends that the annual profit from Statnett SF be allocated as follows:
Amounts in NOK million:
Dividend to owner 117
To other equity 690
Total 807
Declaration from the Board of Directors and President and CEOWe confirm that the financial statements for the period 1 January to 31 December 2012 have, to the best of our knowledge, been prepared in compliance with IFRS and that the disclosures in the financial statements give a true and fair picture of the enterprise’s and the Group’s assets, liabilities, financial position and results as a whole, and that the disclosures in the annual report give a true and fair over-view of the development, results and position of the enterprise and the Group, together with a description of the most significant risk and uncertainty factors faced by the enterprises.
Oslo, 21 March 2013The Board of Directors, Statnett SF
Kolbjørn Almlid Chairman of the Board
Per HjorthStyrets nestleder
Heidi Ekrem
Kirsten Indgjerd Værdal
Egil Gjesteland
Maria Sandsmark
Pål Erland Opgård
Kjerstin Bakke
Steinar Jøråndstad
Auke LontPresident and CEO

72
StatnettAnnual report 2012
The Board of Directors
The Board of Directors
kolbjørn AlmlidChairman of the Board
Elected in 2011
Kolbjørn Almlid is a qualified teacher. He ended his career in education as chief municipal education officer of Verran Municipality in 1991. During the period 1996-2005 he was a senior adviser in Innovation Norway and later on Division Director and Chief Executive Officer. Almlid was appointed state secretary of the Ministry of Petroleum and Energy during the Syse government (1989–1990). He was deputy Member of Parliament for Nord-Trøndelag county during the period 1989–1993 and chairman of Nord-Trøndelag county council from 1991 to 1995. He has also been the leader of the Norwegian Centre party in Nord-Trøndelag and a member of the party’s central board. Furthermore, he was a member of the municipal council and county council for 12 and 14 years, respectively.
In recent years, Almlid has also served on a number of boards such as Nord-Trøndelag electricity company, ENFO and Mid-Gas. He was elected Chair of the Board in Statnett in June 2011.
Per HjorthDeputy Chairman
Elected in 2008
Hjorth is Managing Director of Newsec AS, a commercial real estate brokerage and consultancy firm. Hjorth also serves on a number of boards, and has held a number of senior executive posts in industry, finance and the energy sector. He was President and CEO of Nord Pool ASA until 2000.
Hjorth holds a degree in Economics and Business Administration from BI Norwegian School of Management and has been a member of Statnett’s Board of Directors since 2008. He was elected Deputy Chairman of the Board in Statnett in 2012.

73
StatnettAnnual report 2012
The Board of Directors
maria SandsmarkBoard member
Elected in 2013
Maria Sandsmark holds a doctorate in social sciences. She is a researcher for Møreforskning Molde AS where she is responsible for conducting socio-econ-omic analyses. Sandsmark has been a consultant for ECON Analyse where she was responsible for assessing socio-economic issues relating to deregulated power markets for national and international power market players. Sandsmark has been a member of an expert committee appointed by the government to review the framework for socio-economic analyses.
Egil GjestelandBoard member
Elected in 2012
Egil Gjesteland is currently Project Director for the Gassco Emden project. In addition, he runs his own oil and gas consulting company, Gjesteland Consulting AS. He holds an MSc in Chemical Engineering from the Norwegian Institute of Technology (NTH) and has worked for Statoil in Abu Dhabi. He has also been IT and Project Manager for a number of Statoil’s oil and gas projects and was Project Director for the Snøhvit development on the Tromsø Patch for four years. Gjesteland has also been a lecturer at the BI MBA programme and UC Berkeley.
Heidi EkremBoard member
Elected in 2006
Ekrem is a partner in the law firm Advokatfirmaet Mageli ANS where she is invol-ved in corporate law issues for large companies, including companies in the energy sector.
kirsten Indgjerd værdalBoard member
Elected in 2009
Værdal has been Director of Agriculture with the County Governor of Nord- Trøndelag since 2007. She has held several senior executive posts in the food and agriculture industry. Værdal has served on several boards in the private and public sector. She is an agronomist and also holds degrees in finance and corpo-rate management.

74
StatnettAnnual report 2012
The Board of Directors
kjerstin BakkeBoard member, employee representative
Elected in 2010
Kjerstin Bakke has been employed by Statnett since 1994 and is currently Head of the department responsible for operation of substations in Southern Norway, a part of the Operations Divisions. Bakke has extensive experience from different areas in Statnett. She holds a Master of Science in Electrical Engineering from the Norwegian University of Science and Technology (NTNU).
Steinar JøråndstadBoard member, employee representative
Elected in 2004
Jøråndstad is an Energy Technician with Statnett and is leader of the Norwegian Electrician and IT Workers’ Union (EL&IT) and a member of the Working Environment Committee. Jøråndstad, who began his career as an apprentice in 1981, has also served as main safety delegate in Statnett. Jøråndstad is also a Municipal Councillor in Vågå and a member of Vågå Municipal Executive Board.
Pål Erland OpgårdBoard member, employee representative
Elected in 2010
Pål Erland Opgård was employed by Statnett in 1995. Since then he has been employed in the Regional Central North in Alta. Opgård holds a degree in engi-neering from Narvik University College. In 2010 Opgård was elected leader of the Norwegian Society of Engineers and Technologists (NITO) in Statnett. He has been a member of Statnett NITO Board since 1999.

75
StatnettAnnual report 2012
Statement of comprehensive income
Parent company Group 2011 2012 (Amounts in NOK million) NOTE 2012 2011
Operating revenue 5 316 5 090 Operating revenue regulated operations 2 5 090 5 316 173 208 Other operating revenue 2 244 181 5 489 5 298 Total operating revenues 5 334 5 497
Operating costs 575 505 System services 3 505 575 854 591 Transmission losses 3 591 854 659 795 Salaries and personnel costs 14, 5, 4 802 660 786 814 Depreciation & write-downs tangible fixed assets 7, 6 827 798 1 068 1 145 Other operating costs 18 1 176 982 3 942 3 850 Total operating costs 3 901 3 869
1 547 1 448 Operating profit 1 433 1 628
- - Income from joint ventures and associates 13, 12 9 5 71 105 Financial income 8 95 80 412 376 Financial costs 8 375 356 1 206 1 177 Profit before tax 1 162 1 357
353 328 Tax 11 325 357 853 849 Profit for the year 837 1 000
Other comprehensive income -51 -58 Changes in fair value, cash flow hedges 9 -58 -51 14 16 Tax related to other comprehensive income 11 16 15 -37 -42 Other comprehensive income -42 -36
816 807 Total comprehensive income 795 964
Disclosure of dispositions 117 117 Proposed dividend
Statement of comprehensive income

76
StatnettAnnual report 2012
Balance sheet
Balance sheet Parent company Group 31.12.2011 31.12.2012 (Amounts in NOK million) NOTE 31.12.2012 31.12.2011
ASSETS
Intangible fixed assets - - Goodwill 53 53 - - Other intangible fixed assets 13 13 - - Total intangible fixed assets 66 66
Fixed assets 17 152 17 621 Tangible fixed assets 6 17 877 17 396 2 437 4 277 Plants under construction 7 4 277 2 437 267 272 Investment in subsidiaries 12 - - 36 36 Investment in associates 12 54 54 1 390 1 417 Financial fixed assets 10, 9 1 242 1 188 21 282 23 623 Total fixed assets 23 450 21 075
Current assets 1 186 1 064 Trade accounts and other short-term receivables 13, 10, 9 976 1 138 272 327 Market-based securities 10,9 668 600 917 561 Liquid assets 9 634 1 002 2 375 1 952 Total current assets 2 278 2 740
23 657 25 575 Total assets 25 794 23 881
EQUITY AND LIABILITIES
Equity 2 700 2 700 Contributed capital 2 700 2 700 5 289 5 979 Other equity accrued 6 255 5 577 7 989 8 679 Total equity 8 955 8 277
Long-term liabilities 343 443 Deferred tax 11 506 406 352 406 Pension liabilities 5 407 353 66 74 Other liabilities 75 66 11 110 12 623 Long-term interest-bearing debt 16, 10, 9 12 484 10 974 11 871 13 546 Total long-term liabilities 13 472 11 799
Current liabilities 2 302 1 906 Short-term interest-bearing debt 10, 9 1 906 2 302 1 224 1 234 Trade accounts payable and other short-term debt 10, 9 1 251 1 232 271 210 Tax payable 11 210 271 3 797 3 350 Total current liabilities 3 367 3 805
23 657 25 575 Total equity and liabilities 25 794 23 881
Kolbjørn AlmlidChairman of the Board
Kirsten Indgjerd VærdalBoard Member
Per HjorthDeputy Chairman
Pål Erland OpgårdEmployee representative
Maria SandsmarkBoard Member
Steinar JørandstadEmployee representative
Egil GjestelandBoard Member
Kjerstin BakkeEmployee representative
Heidi EkremBoard Member
Auke LontPresident and CEO
Oslo, 21 March 2013, Board of Directors Statnett SF

77
StatnettAnnual report 2012
Statement of changes in equity
Parent company Group Total equity allocated to owner Other Non con- of Other Contri- Contributed Other equity Total Total trolling Statnett equity Other buted equity items accrued equity (AmountsinNOKmillion) equity interest SF accrued items capital
2 700 -3 4 791 7 488 01.01.2011 7 628 -22 7 650 4 953 -3 2 700 - - 853 853 Profit/loss for the year 1 000 -21 1 021 1 021 - - - -37 - -37 Other comprehensive income -36 - -36 - -36 - - - -315 -315 Dividend declared -315 - -315 -315 - - - - - - Acquisition subsidiary - 43 -43 -43 - - 2 700 -40 5 329 7 989 31.12.2011 8 277 - 8 277 5 616 -39 2 700
2 700 -40 5 329 7 989 01.01.2012 8 277 - 8 277 5 616 -39 2 700 - - 849 849 Profit for the year 837 - 837 837 - - - -42 - -42 Other comprehensive income -42 - -42 - -42 - - - -117 -117 Dividend declared -117 - -117 -117 - - 2 700 -82 6 061 8 679 31.12.2012 8 955 - 8 955 6 336 -81 2 700
Statement of changes in equity

78
StatnettAnnual report 2012
Cash flow statement
Cash flow statement
Restricted bank deposit amounting to NOK 83 million for the parent company and for the Group are included in cash and cash equivalents as at 31 December 2012.
Unused credit facilities of NOK 3 500 million are not included in cash and cash equivalents above.
Parent company Group 2011 2012 (Amounts in NOK million) NOTE 2012 2011
Cash flow from operating activities 1 206 1 177 Profit before tax 1 162 1 357 -3 3 Loss/ gain (-) on sale of fixed assets 6 3 -3 786 814 Ordinary depreciation and write-downs 7, 6 827 798 -566 -271 Tax paid for the period 11 -271 -566 326 382 Interest for the period recognised in income statement 8 376 320 35 34 Interest received for the period 8 43 43 -332 -432 Interest paid for the period 8 -432 -332 595 47 Changes in trade accounts receivable/payable 9 65 503 -498 -366 Changes in other accruals 9 -338 -592 - - Result from companies consolidated using equity method 12 -9 -5 1 549 1 388 Net cash flow from operating activities 1 426 1 523
Cash flow from investing activities 12 52 Proceeds from sale of tangible fixed assets 6 52 12 Purchase of tangible fixed assets and -2 348 -3 130 plants under construction 7,6 -3 152 -2 384 Change in investments in subsidiaries, -61 - associates and joint ventures 12 - - -30 - Change in long-term loan receivables 9 - - - 15 Change in short-term loan receivables 9 - - 8 35 Dividend received 12, 8 15 2 -2 419 -3 028 Net cash flow from investing activities -3 085 -2 370
Cash flow from financing activities 2 782 5 903 Proceeds from new interest-bearing borrowings 9 5 903 2 781 -1 738 -4 439 Repayment of interest-bearing debt 9 -4 439 -1 738 88 112 Proceeds from sale of market-based securities 9 220 367 -50 -169 Purchase of market-based securities 9 -276 -375 -315 -123 Dividend paid and group contributions -117 -315 767 1 284 Net cash flow from financing activities 1 291 720
-103 -356 Net cash flow for the period -368 -127
1 020 917 Cash and cash equivalents at the start of the period 9 1 002 1 129 917 561 Cash and cash-equivalents at the close of the period 9 634 1 002

79
StatnettAnnual report 2012
Notes
notesnOTE 1 ACCOunTInG PRInCIPlES
GeneralStatnett SF (the parent company) is a Norwegian state-owned enterprise that was formed on 20 December 1991. The sole owner of Statnett SF is the Norwegian State, represented by the Ministry of Petroleum and Energy (MPE). Statnett has issued bond loans listed on the Oslo Stock Exchange. Statnett’s registered head office from 11 march 2013 is at Nydalen allé 33, 0423 Oslo.
Basis for preparation of the finacial statementsThe consolidated financial statements for the Statnett Group and the financial state-ments for the parent company, Statnett SF, have been prepared in compliance with the current International Financial Reporting Standards (IFRS), as approved by the EU.
All subsequent references to “IFRS” imply references to IFRS as approved by the EU.
The financial statements have been prepared on the basis of the historical cost prin-ciple, with the following exceptions:• All derivatives, and all financial assets and liabilities classified as “fair value car-
ried through profit or loss” or “available for sale”, are carried at fair value.• The book value of hedged assets and liabilities is adjusted in order to register
changes in fair value as a result of the hedging.• Assets are measured at each reporting date with a view to impairment. If the
recoverable amount of the asset is less than the book value, the asset is written down to the recoverable amount.
New accounting standardsBelow follows a list of new, revised and additional standards and interpretations that had been announced as at 31 Dec. 2012, but that had not come into effect for the fiscal year 1 January - 31 December 2012. Only matters assumed to be relevant for Statnett have been included.
The Group management has established that all the compulsory and relevant inter-pretations and standards adopted by the EU will be implemented in the consolidated financial statements from the date they become effective, unless decided otherwise.
Below is a review of the implications these standards are expected to have for the consolidated financial statements of the Statnett Group:
Amendments to IAS 19 employee benefits - pensions
Following the amendments to IAS 19 Employee Benefits (June 2011) (“IAS 19R”) the use of the corridor method is no longer permitted for recognition of actuarial gains and losses. Actuarial gains and losses must now be recognised in their entirety in other revenues and costs (OCI) in the period they arise. This also entails that pen-sion costs are split between ordinary result before tax and other revenues and costs (OCI). Projected yield on pension fund assets must be calculated using the disco-unt rate calculated based on gross pension liability. Accrued pension rights and net interest charges for the period are presented in ordinary result before tax, whereas remeasurements such as actuarial gains and losses are presented under other reve-nues and costs (OCI) in the statement of comprehensive income. Furthermore, the

80
StatnettAnnual report 2012
Notes
amendments to the information requirements relating to defined-benefit pension plans have been amended. The amendments will apply for fiscal years starting on 1 January 2013. The Group will implement the amended standard as of 1 January 2013.
Following implementation of the amendment of IAS 19R, as of 1 January 2013, actuarial gains and losses as at 31 December 2012 will be recognised directly in equity (72 per cent) and in deferred tax (28 per cent). Unrecognised actuarial gains and losses as at 31 December 2012 total NOK 145 million (NOK 771 million as at 31 December 2011), see Note 5.
For amendments that are not considered to have any significant impact on the Group’s application of accounting principles or notes to the accounts, cf. Note 20.
Important accounting esitmates and assumtionsThe preparation of the financial statements in compliance with IFRS requires that the management carries out assessments and prepares estimates and assumptions that affect the application of accounting principles. This affects recognised amounts for assets and liabilities on the balance sheet date, reporting of contingent assets and liabilities, as well as the reported revenues and costs for the period.
Accounting estimates are used to determine some amounts that have an impact on Statnett’s financial statements. This requires that Statnett prepares assumptions relating to values or uncertain conditions at the time of preparation. Key accoun-ting estimates are estimates that are important to the Group’s financial performance and results, requiring the management’s subjective and complex assessment, often based on a need to prepare estimates on factors encumbered by uncertainty. Statnett assesses such estimates continuously on the basis of previous results and experiences, consultations with experts, trends, prognoses and other methods which Statnett deems appropriate in the individual case.
Provisions for liabilities relating to disputes and legal claims are recognised in the income statement when the Group has an existing liability, legal or self-imposed, as a result of an event that has taken place. Furthermore, it must be possible to mea-sure the amount reliably and it must be demonstrated as probable that the liability will be settled. The provisions are measured to the best of the management’s ability on the balance sheet date.
Insurance claims are considered a contingent asset and are not recognised as income until the income is all but certain. In connection with development projects where additional costs relating to the repair of damage constitute part of the facility’s cost price, and there is no basis for write-down, insurance claims are recognised as a reduction of the project’s acquisition costs. Such a reduction is contingent on the insurance company having acknowledged the damage and that the amount can be reliably estimated.

81
StatnettAnnual report 2012
Notes
AmountsinNOKmillion Group
Item Note Estimate/assumptions Book value
Property, plant Recoverable amount and estimate of
and equipment 6 correct remaining useful life 17 887
Pension liabilities 5 Financial and demographic assumptions 407
Significant items relating to Statnett’s use of estimates:
Depreciation/amortisationTangiblefixedassets
Depreciation is based on the management’s assessment of the useful life of tan-gible fixed assets. The assessments may change owing, for example, to techno-logical developments and historical experience. This may entail changes in the estimated useful life of the asset and thus the depreciation. It is difficult to pre-dict technological developments, and Statnett’s view of how quickly changes will come may change over time. If expectations change significantly, the depreciation will be adjusted with effect for future periods. Please refer to the more detailed discussion under “Tangible fixed assets” below.
Goodwillandotherintangibleassets
Goodwill arising in a business combination is not amortised. Intangible assets with a fixed useful life are amortised over the asset’s useful life which is assessed at least once a year. Intangible assets are amortised in a straight line as this best reflects the use of the asset.
Write-downsTangiblefixedassets
Statnett has made significant investments in tangible fixed assets. The value of these assets is assessed when there is an indication of impairment in value. Tangible fixed assets in the parent company are regarded as one cash-generating unit and are assessed collectively since Statnett SF has one collective revenue cap. In subsidiaries, each fixed asset is assessed individually.
Statnett expects to make substantial investments in the future. These will largely take place in the form of projects under the company’s own direction which are recorded in the balance sheet as plants under construction until the fixed asset is ready to be put into operation. Projects under execution are valued individually on indications of impairment in value.
Estimates of the recoverable amounts for assets must be based in part on the management’s assessments, including the calculation of the assets’ revenue-generating capacity and the probability of licences being granted for development projects. Changes in circumstances and the management’s assumptions may result in write-downs for the relevant periods.

82
StatnettAnnual report 2012
Notes
Goodwill
Goodwill is evaluated for write-down annually or more frequently if there are any indications of impairment in value, based on the cash-generating unit to which goodwill is allocated. If the recoverable amount (the higher of net sales and uti-lity value) for the cash-generating unit is lower than the carrying value, the write-downs will first reduce the carrying value of any goodwill and then the carrying value of the unit’s other assets, proportionally based on the carrying value of the individual assets in the unit. The carrying value of individual assets is not reduced below the recoverable amount or zero. Write-downs of goodwill cannot be rever-sed in a subsequent period if the fair value of the cash-generating unit increases. Impairment of value is included in the income statement as a part of write-downs.
Otherintangibleassets
On each reporting date, the Group considers whether there are any indications of impairment in value for intangible assets. If there are any indications of impairment in value, the Group will estimate the recoverable amount for the assets and eva-luate potential write-down.
Pension costs, pension liabilities and pension assetsThe calculation of pension costs and net pension liabilities (the difference bet-ween pension liabilities and pension assets) is performed on the basis of a num-ber of estimates and assumptions. Changes in and deviations from estimates and assumptions (estimate deviations) affect the fair value of the net pension liabilities, but are not recognised in the income statement until the cumulative estimated deviation exceeds 10 per cent of the higher of the pension liabilities or pension assets at the start of the fiscal year.
Consolidation policiesConsolidatedcompanies
The consolidated financial statements comprise Statnett SF and subsidiaries in which Statnett SF has a controlling influence. These will normally be companies where Statnett SF owns more than 50 per cent of the voting shares, either directly or indirectly through subsidiaries.
The consolidated financial statements have been prepared using uniform accoun-ting principles for equivalent transactions and other events under otherwise equal circumstances. The classification of items in the income statement and balance sheet has taken place in accordance with uniform definitions. The consolidated financial statements are prepared in accordance with the acquisition method of accounting and show the Group as if it was a single entity. Balances and internal transactions between companies within the Group are eliminated in the consoli-dated financial statements.
The cost price of shares in subsidiaries is offset against equity at the time of acquisition. Any excess value beyond the underlying equity of the subsidiaries is allocated to the asset and liability items to which the excess value can be attri-buted. The portion of the cost price that cannot be attributed to specific assets represents goodwill.

83
StatnettAnnual report 2012
Notes
Statnett SF’s Pension Fund is not part of the Statnett Group. Contributed equity in the pension fund is measured at fair value and classified as financial fixed assets.
Investmentsinjointventures
Joint ventures are defined as entities in which there are contractual agreements that give joint control together with one or more parties. Result, assets and liabi-lities of joint ventures are recorded in the financial statements in accordance with the equity method. This means that the Group’s share of the result for the year after tax and amortisation of any excess value is reported on a separate line in the income statement between operating profit/loss and financial items. The acco-unts of joint ventures are restated in accordance with IFRS. Ownership interests in joint ventures are presented as fixed asset investments at original cost plus accu-mulated profit shares and less dividends in the consolidated balance sheet.
Investmentinassociates
Associates are entities where the Group has a significant, but not controlling influ-ence over the financial and operational management. Normally these will be com-panies where the Group owns between 20 and 50 per cent of the voting shares. Earnings, assets and liabilities of associates are recorded in the financial state-ments in accordance with the equity method. This means that the Group’s share of the result for the year after tax and amortisation of any excess value is repor-ted on a separate line in the income statement between operating profit/loss and financial items. The accounts of associates are restated in accordance with IFRS. Ownership interests in associates are carried as financial fixed assets at origi-nal cost plus accumulated profit shares and less dividends in the consolidated balance sheet.
Purchase/saleofsubsidiaries,jointventuresandassociates
In the case of acquisition or sale of subsidiaries, joint ventures and associates, they are included in the consolidated financial statements for the portion of the year they have been a part of or associated with the Group.
Investmentsinothercompanies
Investments in companies in which the Group owns less than 20 per cent of the voting capital are classified as “available for sale” and are carried at fair value in the balance sheet if they can be reliably measured. Value changes are recognised under other comprehensive income in the statement of comprehensive income.
Investmentsinsubsidiaries, jointventuresandassociatesinStatnettSF(parent
companyaccounts)
Investments in subsidiaries, joint ventures and associates are accounted for in accordance with the cost method in the parent company accounts. The group contribution paid (net after tax) is added to the cost price of investments in sub-sidiaries. Group contributions and dividends received are recorded in the income statement as financial income as long as the dividends and group contributions are within the earnings accrued during the period of ownership. Dividends in excess of earnings during the ownership period are accounted for as a reduction in the share investment.

84
StatnettAnnual report 2012
Notes
Business combinationsBusiness combinations are recognised according to the acquisition method. Acquisition costs are the total of the fair value on the acquisition date of assets acquired, liabilities incurred or taken over as compensation for control of the acquired enterprise, plus costs which can be directly attributed to business com-binations.
The acquired enterprise’s identifiable assets, liabilities and contingent liabilities which satisfy the conditions for accounting according to IFRS 3, are recognised at fair value on the acquisition date. Goodwill arising as a result of acquisitions is recognised as an asset measured as the excess of the total consideration trans-ferred and the value of the minority interests in the acquired company beyond the net value of acquired identifiable assets and assumed liabilities. If the Group’s share of the net fair value of the acquired enterprise’s identifiable assets, liabilities and contingent liabilities exceeds the total consideration after re-assessment, the surplus amount is immediately recognised in the income statement.
Segment reportingThe company has identified its reporting segment based on the risk and rate of return that affect the operations. Based on IFRS’ definition, there is, according to the company’s assessment, only one segment. The business is followed up as a single geographical segment. Subsidiaries do not qualify as separate business segments subject to reporting based on IFRS criteria. The parent company and the Group are reported as a single business segment.
Cash flow statementThe cash flow statement has been prepared based on the indirect method. Cash includes cash in hand and bank deposits. Cash equivalents are short-term liquid investments that can be converted immediately to a known amount of cash, and with a maximum term of three months.
Revenue recognition principlesOperating revenues are measured at fair value and recognised when they are accrued on a net basis after government taxes. Operating revenues are reported on a gross basis, except in cases where Statnett acts primarily as a settlement function in connection with common grids and power trading.
Interest income is recognised over time as it is accrued. Dividends from invest-ments are recorded as income when the dividends are adopted.
Permitted revenue, tariffs and higher/lower revenue
General
Statnett is the operator of the main national grid and two common regional grids. As the operator, Statnett is responsible for setting the annual tariffs for each com-mon grid. The main national grid is a common grid. In a fiscal year, the actual revenues will deviate from the regulated revenues.

85
StatnettAnnual report 2012
Notes
Permittedrevenue-monopoly-regulatedoperations
Statnett owns transmission grids and is the Norwegian Transmission System Operator. These are monopoly-regulated operations. This means that the Norwegian Water Resources and Energy Directorate (NVE) sets an annual limit – permitted revenue – for Statnett’s maximum revenues.
The basis for Statnett’s permitted revenue is the revenue cap. The revenue cap is based on expenditure, including capital expenditure, for a retrospective period of two years. Operating costs for the system are also included. Statnett’s revenue cap is regulated to ensure that Statnett has an incentive for efficient operations. In addition to the revenue cap, Statnett’s permitted revenue consists of the fol-lowing: Actual property tax, transit costs and a supplement for investments. The supplement for investments shall ensure that the year’s investments are reflec-ted in the permitted revenue for the year the investment is put into operation. Furthermore, Statnett’s revenues are also adjusted for interruptions through qua-lity-adjusted revenue cap for energy not supplied.
There can be uncertainty attached to measuring the individual amounts included in the permitted revenue. Increased revenue as a result of conditions that require an application for adjustment of the revenue caps or interpretation of the regula-tions on the part of the NVE, is only included in the accounts if it is considered all but certain that the revenue will be realised.
The revenue cap is recognised in the accounts at 1/12 per month.
Revenue cap transmission losses
Revenues
Transmission losses in the regional and main grid are a part of Statnett’s reve-nue cap. The reported revenue cap for transmission losses during the fiscal year consists of the actual measured loss in MWh for a retrospective period of two years valued at a regulated reference price based on the electricity spot market price in the fiscal year. The revenue cap has been included in the accounting line ”Operating revenues regulated operations”.
Discrepancies between the revenue cap for transmission losses and actual costs of purchases of transmission losses in the fiscal year are, in accordance with the guidelines, apportioned among the grid owners in each common grid where Statnett is the operator.
Transmissionlosses
Transmission losses occur as a result of measured discrepancies between the input and outtake of power in the grid. The size of the loss will vary with the tem-perature, the load in the grid and the electricity price. Actual loss in the fiscal year is purchased externally at spot market price. Losses arising during transmission of power in the main national grid and the common regional grids are covered by the grid’s operator and are reported under ”transmission losses”.

86
StatnettAnnual report 2012
Notes
Tariff-setting and higher/lower revenue for the year
Tariffrevenues
As the operator of the main national grid and two common regional grids, Statnett is responsible for invoicing the users for the services they receive. The invoicing takes place on the basis of a tariff model, in accordance with guidelines provided by the NVE. The price system consists of fixed elements and variable elements; energy elements. Fixed elements are invoiced evenly throughout the year, while the energy element is invoiced concurrently with the customers’ measured input or outtake of power from the grid.
Higher/lowerrevenue
The tariff for the year is set with a view to ensuring that the higher/ lower revenue is offset over time. Tariffs are set in September preceding the fiscal year. Statnett has established a strategy for adjustment of the tariff basis including offsetting of the accumulated higher/lower revenue. Some quantities and parameters, inclu-ding the price of energy which is included in the calculation basis for the year’s revenue cap, are based on estimates. Discrepancies will occur between tariff revenues and the permitted revenue. This is indicated in Note 2.
Higher/lowerrevenueinterestcalculations
Interest is calculated on accumulated higher/lower revenue in accordance with the rules stipulated by the NVE, based on the site deposit rate set by the Central Bank of Norway. The amount of interest is included in the balance for higher/lower revenue and is expressed in the financial reporting through regulation of future tariffs. This is shown in Note 2.
Power purchases and sales
Statnett is the Transmission System Operator (TSO) and is responsible for the regulating power market system and balance settlement system. Responsibility for the balance settlement system means that Statnett subsequently compares the measured and agreed energy volumes, calculates any discrepancies, and car-ries out the financial settlement between the market participants. The settlement is based on the prices in the regulating power market. The purchase and sale of regulating power must be balanced. Statnett receives a fee covering Statnett’s costs as responsible for the balance settlement. If the settlement is across natio-nal borders in the Nordic region, a marginal price difference will arise based on the average of the Norwegian and foreign regulating power price, which is passed on to or charged to Statnett as the TSO.
Statnett has a separate licence as responsible for the balance settlement. This activity is recorded in the financial statement through fee revenues and costs rela-ting to the execution of the balance settlement responsibility. Power purchases and sales are recognised as net and are therefore not expressed in the statement of comprehensive income. Power sales/purchases are recorded in the income statement when they are accrued/incurred, i.e. at the time of delivery.

87
StatnettAnnual report 2012
Notes
Customer projectsProject revenue is recognised on a current basis based on the measurement of the estimated fair value. This means that revenue is recognised as the work is per-formed based on the degree of completion. The degree of completion is determi-ned on the basis of the accrued costs of the executed work and estimated total project expenditure. Revenue is included in other operating revenues. Invoiced and accrued project revenues are included in trade accounts receivable.
Where projects are expected to make a loss, the entire expected loss is recogni-sed as an expense.
TaxesTax costs in the income statement encompass both the tax payable for the period and changes in the deferred tax liabilities/assets. Taxes payable are calculated on the basis of the taxable income for the year. Net deferred tax assets/liabilities are calculated on the basis of temporary differences between the accounting and tax values, and the tax loss carried forward.
Tax-increasing or tax-reducing temporary differences that are reversed or may be reversed are offset. Deferred tax assets are recorded when it is probable that the company will have a sufficient taxable profit to benefit from the tax asset. Deferred tax liabilities/assets that can be recorded in the balance sheet are carried at their nominal value on a net basis.
Property taxes are recorded in the income statement and paid during the fiscal year. They are classified as other operating expenses.
Classification of items in the balance sheetAn asset is classified as short-term (current asset) when it is related to the flow of goods, receivables paid within one year, and “assets that are not intended for per-manent ownership or use in the operations”. Other assets are fixed assets. The dis-tinction between short-term and long-term loans is drawn one year before maturity. The first year’s instalments on long-term loans are reclassified as current liabilities.
Plants under constructionPlants under construction are recognised in the balance sheet at acquisition cost less any accumulated losses from impairments. Plants under construction are not depreciated.
Development projects start off with a feasibility and alternative study. The project is recognised in the balance sheet when the conclusion from the study is availa-ble, and the main development concept has been selected. At this point, a licence has not been granted and no final investment decision has been made. Statnett’s experience is that once a main concept has been selected for the development, it is highly likely that the project will be implemented.
Ongoing assessments are made of whether licensing conditions or other causes necessitate a full or partial write-down of the project expenses incurred. Write-downs are reversed when there is no longer any basis for the write-down.

88
StatnettAnnual report 2012
Notes
Interest during the construction periodConstruction loan costs related to the company’s own plants under construction are capitalised in the balance sheet. The interest is calculated based on the av-erage borrowing interest rate and scope of the investment, as the funding is not identified specifically for individual projects. Interest is recorded in the income sta-tement through depreciation based on the associated asset’s anticipated econo-mic life.
Tangible fixed assetsTangible fixed assets are carried at cost price less accumulated depreciation and write-downs. The depreciation reduces the carrying value of tangible fixed assets, excluding building lots, to the estimated residual value at the end of the expected useful life. Ordinary straight-line depreciation is implemented from the point in time when the asset was ready for operation, and is calculated based on the expected useful life of the asset. This applies correspondingly to fixed assets acquired from other grid owners. The cost price is decomposed when the fixed asset consists of components with differing useful lives.
The estimated useful life, depreciation method and residual value are assessed once a year. The value is assessed when there is an indication of impairment in value. Tangible fixed assets in the parent company are regarded as one cash-generating unit and are assessed collectively since Statnett SF has a collective revenue cap. In subsidiaries, each fixed asset is assessed individually. For most assets, the residual value is estimated at zero at the end of the useful life.
Gains or losses on the divestment or scrapping of tangible fixed assets are calcu-lated as the difference between the sales proceeds and the fixed assets’ carrying value. Gains/losses on divestment are recorded in the income statement as other operating revenues/expenses. Losses on scrapping are recognised in the income statement as depreciation/write-downs.
CompensationLump sum payments in connection with the acquisition of land, etc. are included in the cost price of the fixed asset. Ongoing payments are minor amounts and are recognised in the income statement in the year in which the payment is disbur-sed.
Maintenance/upgradesMaintenance expenses are recognised in the income statement when they are incurred. No provisions are made for the periodic maintenance of the grid (trans-former stations or power lines/cables). Even though maintenance is periodic for the individual transformer station or power lines/cables, it is not considered to be periodic for the entire grid as the grid as a whole is regarded as a single cash-generating unit. If the fixed asset is replaced, any residual financial value will be recorded in the income statement as a loss on scrapping.
Expenses that significantly extend the life of the fixed asset and/or increase its capacity are capitalised.

89
StatnettAnnual report 2012
Notes
Intangible assetIntangible assets bought separately are measured at acquisition cost on initial recognition. For intangible assets included in a business combination, acquisi-tion cost is measured at fair value on the transaction date. In later periods, intan-gible assets are recognised at acquisition cost less accumulated amortisations and write-downs. Intangible assets with a fixed useful life are amortised over the asset’s useful life which is assessed at least once a year. Intangible assets are amortised in a straight line as this best reflects the use of the asset.
GoodwillGoodwill is not amortised. Goodwill does not generate cash flows independently of other assets or groups of assets, and is allocated to the cash-generating units expected to benefit from the synergy effects of the business combination that generated the goodwill. Cash-generating units allocated to goodwill are evaluated for write-down annually or more often if there are any indications of impairment in value. If the recoverable amount (the higher of the net sales and utility value) for the cash-generating unit is lower than the carrying value, the write-downs will first reduce the carrying value of any goodwill and then the carrying value of the unit’s other assets, proportionally based on the carrying value of the individual assets in the unit. The carrying value of individual assets is not reduced below the reco-verable amount or zero. Write-downs of goodwill cannot be reversed in a subse-quent period if the fair value of the cash-generating unit increases. Impairment of value is included in the income statement as a part of write-downs.
Write-down of tangible fixed assets and intangible assets other than goodwillOn each reporting date, the Group considers whether there are any indications of impairment in value for tangible fixed assets and intangible assets. If there are any indications of impairment in value, the Group will estimate the recoverable amount for the assets and evaluate potential write-down.
The recoverable amount is the higher of the net sales and utility value. To assess the utility value, estimated future cash flows are discounted to present value using a pre-tax discount rate that reflects the current market assessments of the time value of money and risks specific to the asset.
If the recoverable amount for a fixed asset (or cash-generating unit) is estimated to be lower than the carrying value, the carrying value of the fixed asset (or cash-generating unit) will be reduced to the recoverable amount. If an impairment in value is subsequently reversed, the carrying value of the fixed asset (cash-gene-rating unit) will be increased to the revised estimate of the recoverable amount, but limited to the value that would be the carrying value if the fixed asset (or cash-generating unit) had not been written down in a prior year.
90
StatnettAnnual report 2012
Notes
Financial leasingThe Group as lessor
Financialleaseagreements
Financial lease agreements are lease agreements where the lessee takes over the major part of the risk and return associated with the ownership of the asset. The Group presents leased assets as receivables equal to the net investment in the lease agreements. The Group’s financial income is determined so that a con-stant rate of return is achieved on the outstanding receivables over the agreement period. Direct expenses incurred in connection with the establishment of the lease agreement are included in the receivable.
Operatingleases
The Group presents leased assets as fixed assets in the balance sheet. The lease revenue is recognised in a straight line over the lease period. Direct expen-ses incurred to establish the operating lease agreement are added to the leased asset’s carrying value and recognised as expenses during the term of the lease on the same basis as the lease revenue.
The Group as lessee
Financialleaseagreements
Financial lease agreements are lease agreements where the Group takes over the major part of the risk and return associated with the ownership of the asset. At the beginning of the lease term, financial lease agreements are capitalised at an amount corresponding to the lower of fair value and the present value of the minimum rent, less accumulated depreciation and write-downs. When calculating the lease agreement’s present value, the implicit interest charge in the lease agre-ement is used if this can be estimated. Otherwise the company’s marginal borro-wing rate is used. Direct expenses related to establishing the lease agreement are included in the asset’s cost price.
The same depreciation period is used as for the company’s other depreciable assets. If it is not reasonably certain that the company will acquire ownership at the end of the lease period, the asset will be depreciated over the shorter of the lease agreement’s duration and the asset’s useful life.
Operatingleases
Operating leases where the major part of the risk and return associated with ownership of the asset is not transferred to the Group, are classified as operating leases. The rent payments are classified as operating expenses and are recorded in a straight line in the income statement over the duration of the agreement.
Research & developmentResearch expenses are recognised on a current basis. Research is an internal process that does not give rise to independent intangible assets that generate future economic benefits.
Expenses related to development activities are capitalised in the balance sheet if the product or process is technically and commercially feasible and the Group has ade-

91
StatnettAnnual report 2012
Notes
quate resources to complete the development. Expenses capitalised in the balance sheet include material expenses, direct wage costs and a percentage of directly attributable overhead expenses. Capitalised development expenses are recorded at acquisition cost, less any accumulated depreciation and write-downs.
Capitalised development expenses are depreciated in a straight line over the esti-mated useful life of the asset.
Trade receivablesTrade accounts are recorded in the accounts at nominal value less any losses from impairment in value.
Contingent assets and liabilitiesContingent liabilities are not recorded in the annual financial statements. Significant contingent liabilities are disclosed unless the probability of the liability is low.
Contingent assets will not be recorded in the annual financial statements, but will be disclosed if there is a certain degree of probability that it will benefit the Group.
Higher/lower revenues are contingent liabilities/assets in accordance with IFRS and are not recorded in the balance sheet.
Dividend (from the parent company)Dividends paid are recorded in the Group’s financial statements during the period in which they are approved by the General Meeting. If the approval and payment occur in different periods, the amount will be allocated to current liabilities until payment is made.
Pensions and pension liabilitesThe Group’s liability relating to pension schemes, defined as defined-benefit pen-sion schemes, is recognised at the present value of the future retirement benefits accrued at the end of the reporting period. Pension assets are evaluated at fair value. The accumulated effect of estimate changes and changes in financial and actuarial assumptions, actuarial gains and losses, less than 10 per cent of the higher of the defined pension liabilities and pension assets at the start of the year, is not included. When the accumulated effect exceeds 10 per cent, the excess is included in the income statement over the estimated average remaining ser-vice period for the employees covered by the scheme. Net pension costs for the period are presented as salaries and personell cost.
The contributions to contribution-based pension plans are recognised as costs as they occur.

92
StatnettAnnual report 2012
Notes
LoansInterest-bearing loans are recorded in the income statement as the proceeds that are received, net of any transaction costs. Loans are subsequently accounted for at amortised cost using the effective interest rate method, where the difference between net proceeds and redemption value is recognised in the income state-ment over the term of the loan.
Financial instrumentsIn accordance with IAS 39 (Financial Instruments: Recognition and Measurement), financial instruments are classified in the following categories: fair value through profit or loss, available for sale, amortised cost and loans and receivables. The initial measurement of financial instruments is at fair value on the settlement date, normally at the transaction price.• Financial assets and liabilities held for the purpose of profiting from short-term
price fluctuations (held for trading purposes) or accounted for according to the fair value option are classified at fair value through profit or loss.
• All other financial assets with the exception of loans and receivables issued by the company are classified as available for sale.
• All other financial liabilities are classified as other liabilities and accounted for at amortised cost.
Gains or losses attributed to changes in fair value of financial instruments classi-fied as available for sale are recognised as other comprehensive income until the disposal of the investment. The cumulative gain or loss on the financial instrument previously recognised in other comprehensive income will be reversed, and the gain or loss will be recognised in the income statement.
Changes in the fair value of financial instruments classified at fair value through profit or loss (held for trading purposes or fair value option) are recognised in the income statement and presented as financial income/expenses.
Financial instruments are included in the balance sheet when the Group becomes a party to the instrument’s contractual terms. Financial instruments are elimina-ted from the balance sheet when the contractual rights or obligations have been fulfilled, cancelled, transferred or expired. Financial instruments are classified as long-term when they are expected to be realised more than 12 months after the balance sheet date. Other financial instruments are classified as short-term.
Derivatives and hedgingThe Group utilises derivatives such as future interest rate swaps and currency swaps to hedge its interest rate and currency risks. Such derivatives are initially recognised at fair value on the date when the contract is entered into and then measured at fair value on a current basis. Derivatives are accounted for as assets when the fair value is positive and as liabilities when the fair value is negative, pro-vided that Statnett has no right or intention to settle the contracts net. Gains and losses resulting from changes in the fair value of derivatives that do not meet the conditions for hedge accounting are recorded in the income statement.

93
StatnettAnnual report 2012
Notes
Derivatives that are embedded in other financial instruments or non-financial con-tracts are treated as free-standing derivatives when their risk and properties are not closely related to the contracts, and the contracts are not recorded at fair value with the change in value carried through profit or loss.
When entering into a hedging contract, the Group will formally identify and docu-ment the hedging contract that the Group will use hedge accounting for, as well as the risk that is hedged and the strategy for the hedge. Documentation includes identification of the hedging instrument, the item or transaction that is hedged, the type of risk that is hedged, and how the Group will assess the effectiveness of the hedging instrument to counteract the exposure to changes in the hedged item’s fair value or cash flows that can be attributed to the hedged risk. Such hed-ges are expected to be highly effective in counteracting changes in fair value or cash flows, and are assessed on a current basis to determine whether they actu-ally have been highly effective throughout the entire accounting period they are intended to cover.
Hedges that fulfil the strict conditions for hedge accounting are accounted for as follows:
Fairvaluehedging
Fair value hedging is hedging of the Group’s exposure to changes in the fair value of a recorded asset or liability or an unrecognised liability, or an identified portion of such, that can be attributed to a specific risk and can affect the financial result. For fair value hedging, the carrying value of the hedged item is adjusted for gains or losses from the risk that is hedged. Derivatives are re-measured at fair value, and gains or losses from both are recorded in the income statement.
For fair value hedging of items that are accounted for at amortised cost, the change in value is amortised in the income statement over the remaining period until maturity.
The Group discontinues fair value hedging if the hedging instrument expires or is sold, or is terminated or exercised, and the hedging no longer fulfils the conditions for hedge accounting or the Group cancels the hedging.
The Group uses fair value hedging primarily to hedge the interest rate risk for fixed interest rate loans and the currency risk for interest-bearing liabilities. Fair value hedging is also performed for specific acquisitions in foreign currencies for investment projects. Unrealised hedging gains/losses (currency futures) reduce/increase the cost price of the investments upon realisation.
Cashflowhedging
Cash flow hedging is hedging of the exposure to the variations in cash flow that are attributable to a particular risk associated with a recognised asset or liability, or a highly probable future transaction that could affect profit or loss. The effective portion of the gain or loss on the hedging instrument is recognised as other comprehensive income, while the ineffective portion is recognised as financial income or cost.

94
StatnettAnnual report 2012
Notes
Amounts that are initially recognised as other comprehensive income are reclassi-fied and recognised in the income statement as financial income or cost when the hedged transaction affects the profit or loss.
If the expected future transaction is no longer expected to take place, amounts recognised earlier as other comprehensive income will be recognised in the income statement as financial income or cost. If the hedging instrument expires, or is sold, terminated or used, without being replaced or continued, or when the hedging is cancelled, the amount recognised previously as other comprehensive income is retained until the future transaction is executed. If it is not expected that the related transaction will be executed, the amount will be recognised in the income statement as financial income or cost.
The Group uses cash flow hedging primarily to hedge the interest rate risk for loans with floating interest rates.
Financial risk managementFinancial risk management is performed by the central finance department in accordance with guidelines approved by the Board of Directors. The Board of Directors lays down guidelines for general financial risk management in addition to guidelines that cover specific financial risks.
CurrencyThe consolidated financial statements are presented in Norwegian Kroner (NOK), which is also Statnett SF’s functional currency. All Group companies use NOK as their functional currency.
As all the companies in the Group have the same functional currency, no transla-tion differences arise upon consolidation of the group companies.
Transactions in foreign currency are translated at the rate in effect on the trans-action date. Monetary items in foreign currencies are translated into NOK at the exchange rate in effect on the balance sheet date. Non-monetary items that are measured at historical cost expressed in foreign currency are translated into NOK using the exchange rate in effect on the transaction date. Non-monetary items that are measured at fair value expressed in foreign currency are translated at the exchange rate in effect on the balance sheet date. Changes in exchange rates are recorded on a current basis in the income statement during the reporting period.
Long-term interest-bearing debt in foreign currency is related to interest rate and currency swaps and treated as borrowings in NOK.
ProvisionsProvisions for liabilities are recognised in the income statement when the Group has an existing liability (legal or assumed) as a result of an event that has taken place and it can be demonstrated as probable (more likely than not) that a finan-cial settlement will be made as a result of the liability, and the amount can be relia-

95
StatnettAnnual report 2012
Notes
bly measured. Provisions are reviewed on each balance sheet date and the level reflects the best estimate of the liability. If there is a substantial time effect, the lia-bility will be accounted for at the present value of future liabilities.
Goverment grantsGovernment grants are not recorded in the accounts until it is reasonably certain that the group will meet the conditions stipulated for receipt of the grants and that the grants will be received. Grants are recorded as a deduction in the expenses that they are meant to cover. Grants that are received for investment projects are recorded in the balance sheet as a reduction of the cost price.
Events since the balance sheet dateNew information on the group’s positions on the balance sheet date is incorpora-ted into the annual financial statements. Events after the balance sheet date that do not affect the position on the balance sheet date, but will affect the group’s position in the future, are disclosed if they are material.
nOTE 2 OPERATInG REvEnuESOperating revenues regulated operations
Statnett’s revenues are mainly derive from activities regulated by the NVE. Statnett’s actual operating revenues from regulated operations come from fixed and variable tariff revenues in the main grid and regional grid, as well as conges-tion revenues.
Each year the NVE set an upper limit, or cap, for Statnett’s permitted revenue. This item corresponds to Statnett’s revenue cap including amendment in the revenue cap for each year.
A discrepancy arises annually between Statnett’s actual operating revenues from regulated operations (the total of the tariff and congestion revenues) and Statnett’s permitted revenue determined by the NVE. This discrepancy is called higher or lower revenue. Higher revenue means that Statnett has had higher actual ope-rating revenues than the revenue cap set by the NVE for a particular year. Lower revenue means that Statnett’s actual operating revenues have been lower than the permitted revenue cap.
Pursuant to NVE regulations any higher revenues, including interest, must be returned to the customers in the form of lower prices in subsequent years. Correspondingly lower revenues, including interest, can be recouped by charging higher prices in subsequent years. The obligation to reduce future tariffs and the opportunity to col-lect increased tariffs do not qualify for capitalisation according to IFRS, consequen-tly representing a latent obligation (in the event of accumulated higher revenue) and a latent receivable (in the event of accumulated lower revenue). Consequently, an annual change in these items will not be included in the income statement.
Statnett’s actual operating revenues from regulated operations equal the total of Statnett’s permitted revenue set by the NVE and the higher/lower revenue the

96
StatnettAnnual report 2012
Notes
(AmountsinNOKmillion)
Total TotalOperating revenues R Grid M Grid 2011 R Grid M Grid 2012
Tariff revenues fixed element generation 29 964 993 28 940 968
Tariff revenues fixed element consumption 33 2 852 2 885 42 2 720 2 762
Other rental income 78 75 153 84 46 130
Tariff revenues energy element -7 784 777 - 586 586
Congestion revenues - 768 768 - 877 877
Income from other owners in shared grids -38 -222 -260 -47 -186 -233
Total operating revenues regulated activities 95 5 221 5 316 107 4 983 5 090
Permitted revenue
Revenue cap without grid losses 88 2 604 2 692 91 2 902 2 993
Revenue cap, grid losses 21 867 888 12 555 567
Supplement to revenue cap 4 712 716 1 465 465
Total permitted revenue 113 4 183 4 296 104 3 921 4 025
This year’s provision for interest
higher/lower (-/+) revenue - -44 -44 - -45 -45
This year’s higher/lower (-/+) revenue 18 -1 038 -1 020 -6 -1 058 -1 065
Higher/lower (-/+) revenue decision
as at 31 December 2011 - - - 40 232 272
This year’s changed balance for
higher/lower (-/+) revenue 18 -1 082 -1 064 34 -872 -838
Balance higher/lower (-/+) revenue,
incl. interest as at 1 Jan. -18 -1 535 -1 553 - -2 617 -2 617
Changed balance for higher/lower (-/+)
revenue, incl. interest 18 -1 082 -1 064 34 -872 -838
Balance higher/lower (-/+) revenue,
incl. interest as at 31 Dec. - -2 617 -2 617 34 -3 489 -3 455
Specification of income by regional grid (R Grid) and the main grid (M Grid)
Total operating revenues from regulated operations fell by NOK 226 million from 2011 to 2012, mainly due to lower tariff revenues as a result of lower stipulated tariffs for 2012 compared with 2011.
Statnett has received the decision from the NVE for the higher/lower revenue balance as at 31 December 2011. This reduced the main grid higher revenue

97
StatnettAnnual report 2012
Notes
balance by NOK 232 million. For the regional grid the decision entails a reduction in higher revenue of NOK 40 million, resulting in a lower revenue balance of NOK 34 million as at 31 December 2012. The adjustment of the regional main grid lower revenue was mainly related to the fact that tariffs for previous years did not include quality-adjustment revenue of the cap for energy not supplied.
Other operating revenues
Other operating revenues are revenues outside of the regulated operations and consist of mainly external consultancy commissions and rental income.
External assignments within the rest of the Group are carried out by Statnett Transport AS.
Balance settlement
Statnett SF has a special licence to manage the regulating power settlement sys-tem in Norway. This involves effectuating a financial settlement of the difference the market participant have between planned electricity consumption and actu-ally measured values. This market is referred to as the regulating power market. Participant in the regulating power market must have:
1. A trading licence from the NVE2. A balance agreement between the customer and Statnett (or be part of another regulating power operator)3. Access to power, either generation, bilaterally or at Nord Pool Spot. Most regu- lating power participants are also participants at Nord Pool Spot, in which case the member agreement is used (between Nord Pool Spot and the customer).
In 2012, the revenues for this service totalled NOK 87 million, including fee reve-nues of NOK 24 million. Outstanding trade account receivables relating to the balance settlement totalled NOK 41 million as at 31 December 2012 and are dis-closed as trade accounts and other short-term receivables.
By accepting the Balance Agreement, approved members (regulating power mem-bers) undertake to furnish satisfactory security for financial settlement of power tra-ding in the regulating power market. The security requirement is calculated weekly under the rules in the Balance Agreement. The calculation is based on trading volume and market prices and reflects the regulating power members’ settlement risk. Statnett also assesses the security on an ongoing basis and may demand more security at any time if necessary. The minimum security requirement for tra-ding is NOK 200 000, which must be registered with Statnett before trading starts.
Security is posted as a guarantee on demand or as a cash deposit in a pledged bank account, or in any other manner approved by Statnett in accordance with the applicable rules. The rules for posting security can be amended at one week’s notice. The amount of security posted totalled NOK 1 254 million at year-end. The security posting requirement for regulating power members on the same date was NOK 788 million. All regulating power members had posted satisfactory security under the Balance Agreement.

98
StatnettAnnual report 2012
Notes
Parent company Group
2011 2012 (AmountsinNOKmillion) 2012 2011
5 22 Net regulating and peak power 22 5
199 98 Primary reserves 98 199
0 12 Secondary reserves 12 0
31 65 Tertiary reserves 65 31
98 126 Transit costs 126 98
173 124 Special adjustments 124 173
69 58 Other system services 58 69
575 505 Total system services 505 575
nOTE 3 SySTEm SERvICES AnD TRAnSmISSIOn lOSSES
System services
System services are costs relating to the exercise of Statnett’s system responsibi-lity as defined in the Regulations relating to the system responsibility in the power system (FoS). The frequency in the power grid must be 50Hz. Statnett, as Transmission System Operator (TSO), is responsible for ensuring that this frequency remains stable. The requirement to maintain a reserve capacity for regulating purposes imposes limitations on the producers as they are unable to generate and sell the full gene-rator capacity. We distinguish between three different forms of reserve capacity.
Primaryregulation
The primary regulation is automatic and is activated immediately if any changes occur in the power grid frequency. This takes place by using a pre-agreed reserve capacity. The requirement to maintain a reserve capacity for regulating purpo-ses imposes limitations on the producers as they are unable to generate and sell the full generator capacity. Primary reserves are costs Statnett incurs by buying reserve capacity from the producers. Secondaryreserves
Automatic secondary reserves are activated to release the primary reserves so that they in turn can quickly handle any new faults or imbalances. Automatic secondary reserves function by the TSO sending a signal to a market player/power plant, which will then change the plant’s generation. Secondary reserves are also referred to as Load Frequency Control (LFC) and in the Nordic countries they are mainly used to handle frequency deviations. The extent of secondary reserves is determined by agreements on a Nordic level and the costs by a mar-ket solution. Tertiaryregulation
In Norway there is an options market for regulating power. This is used to ensure that we have sufficient regulating resources available in the Norwegian section of

99
StatnettAnnual report 2012
Notes
Parent company Group
2011 2012 2012 2011
2 322 2 465 Volume (GWh) 2 465 2 322
367 241 Price (NOK/MWh) 241 367
(AmountsinNOKmillion)
852 593 Transmission losses 593 852
2 -2 Transmission losses result other -2 2
854 591 Total transmission losses 591 854
the regulating power market, also during periods of demand for increased output, such as in the winter months. In the winter, the TSO sets up a market where they purchase a guarantee ensuring that market members submit bids for the regula-ting power lists for the subsequent week. The guarantees can apply for both con-sumption and production. Transitcosts
Transit costs are compensation for the use of grids abroad. The power system in Europe is connected through transmission lines/cables crossing international borders. Specialadjustments
In some cases there are restrictions in the transmission capacity (bottlenecks) which make it impossible to utilise the bids in the regulating power market in the ”correct” price order. These adjustments are categorised as special adjustments and are compensated for by the associated price of the bid without this affecting the stipulation of the regulating power price. Thus, Statnett will incur a cost equal to the difference between the price of activated bids used for special adjustments and the current hourly price mainly aimed at the regulating power market multi-plied by the especially adjusted volume. Transmission losses
Statnett buys transmission losses (volume) from external suppliers at spot price (market price) for the hour the transmission loss applies.The main grid transmission loss result is distributed between the grid owners in accordance with their proportionate shareholding in the main grid. 6.7 per cent of the facilities are owned by other companies than Statnett SF.

100
StatnettAnnual report 2012
Notes
Parent company Group
2011 2012 (AmountsinNOKmillion) 2012 2011
633 684 Salariies 692 641
104 122 Employer’s national insurance contributions (NICs) 124 105
130 211 Pension costs (Note 5) 212 131
75 78 Other benefits 74 66
942 1 095 Total salaries costs 1 102 943
-283 -300 Of which own investment projects -300 -283
659 795 Net salaries costs 802 660
900 973 Number of full-time equivalents 986 913
nOTE 4 SAlARIES AnD PERSOnnEl COSTS
Loans to employees
Employees had loans in the company totalling NOK 1 million as at 31 December 2012. The loans are repaid by wage deductions over a period of up to two years. The loans are interest-free for the employee. The interest gain of loans exceeding 3/5 of the basic amount is taxed in relation to the current standard interest rate set by the authorities.
nOTE 5 PEnSIOnS AnD PEnSIOn lIABIlITIESThe parent company and subsidiaries have pension schemes entitling the employees to future pension benefits in the form of defined benefit schemes. The Group’s pension schemes meet the requirements in the Norwegian Mandatory Occupational Pension Act.
The pension benefits are based on the number of service years and final wage at retirement age. The full retirement is 70 per cent of pensionable income less calculated disbursements under the Norwegian National Insurance Scheme. The pensionable income is limited upward to 12 times the basic amount under the National Insurance Scheme. The full contribution period is 30 years and the nor-mal retirement age is 67. The pension scheme also includes disability pensions, spouse pensions and children’s pensions.
Accrued pension rights are secured chiefly through pension schemes in Statnett SF’s Group Pension Fund (Statnett SF´s pensjonskasse). In addition, the parent company has early retirement pension obligations that are funded through ope-rations.
Contributions to the pension fund are made in accordance with actuarial calcu-lations. The pension assets in Statnett SF´s pensjonskasse are invested primarily in securities. See the table relating to percentage distribution of pension assets in investment categories.

101
StatnettAnnual report 2012
Notes
The Group management has separate additional agreements under which the normal retirement age is 65, but with the possibility of retirement after reaching the age of 62. The retirement pension is 66 per cent of the pensionable income. The pensionable income also includes incomes that exceeds 12 times the basic amount under the National Insurance Scheme. For personnel employed after 1 March 2011, additional agreements will be ente-red into exceeding 12 times the Norwegian national insurance scheme’s basic amount within the framework of the Guidelines relating to terms of employment for senior executives in state-owned enterprises and companies, stipulated on 31 March 2011.For more information, cf. Note 14 Remuneration/benefits to the Group mana-gement. Annual premium payments will be limited to 30 per cent of the salary exceeding 12 G.
The Group is a member of the private contractual early retirement scheme (AFP scheme) that came into force in 2011. The scheme entails that employees will receive a lifelong supplement to the national insurance retirement pension. The pension can be drawn from age 62, also if an employee decides to keep working. The AFP scheme is a defined-benefit multi-company scheme organised through a general office and financed through premiums stipulated as a percentage of the salaries. There is no reliable way of measuring and allocating liabilities and assets under the scheme. Consequently, the scheme is treated as a defined contribution scheme, according to the accounting rules, and premium payments are recogni-sed on a current basis, and no provisions are made in the accounts. The premium for 2012 is 1.75 per cent of overall wage payments between 1G and 7.1G to the company’s employees, estimated at NOK 8 million. There is currently no accu-mulation of funds under the scheme, and premiums are therefore expected to increase in the time ahead.
The old AFP scheme will be discontinued from 1 January 2011. Spekter will remain the Group’s contracting party under the scheme which now only applies to personnel born before 1 December 1948 who drew a pension from the scheme on 1 December 2010 at the latest.
Pension liabilities are calculated in accordance with IAS 19 ”Employee Benefits”. The mortality risk table K2005, based on the best estimates for the populations in Norway, is applied.
The net pension liabilities in the balance sheet are determined after adjustment for deferred recognition in the income statement of the effect of changes in estimates and pension schemes, as well as discrepancies between the actual and expected return on pension assets that have not yet been realised in the income statement. The net pension liabilities are reported as provisions for liabilities.
Employees who leave the enterprise before retirement age receive a paid-up policy. The paid-up policies are managed by the life insurance company Storebrand Livsforsikring AS. From the date the paid-up policy is issued, Statnett

102
StatnettAnnual report 2012
is exempt from any obligation to employees to which the paid-up policies apply. Assets and liabilities are measured at the date of issue of the paid-up policies, and are separated from pension assets and liabilities.
An independent actuary calculated the pension liabilities in January 2013 as en estimate of the situation at 31 December 2012.
When calculating the pension liabilities, the National Insurance contributions that the enterprise is required to pay on the payment of direct pensions or the pay-ment of premiums for fund-based schemes are taken into account. The National Insurance contribution is a component of the enterprise’s benefit and is recorded as part of the pension liabilities.
Notes
Parent company Group
2011 2012 Members of the pension scheme 2012 2011
1 328 1 419 Members of the pension fund 1441 1 347
338 364 Of which pensioners 368 341
990 1 055 No. of active pension scheme members 1073 1 006
Financial/actuarial assumptions, parent company and Group 2012 2011
Discount rate corporate covered bonds (OMF) 3,90% -
Discount rate - 2,60%
Expected return on pension assets 4,00% 4,10%
Expected wage adjustments 3,50% 3,50%
Expected pension adjustments 3,25% 3,25%
Expected adjustment of basic amount (G) under NIS 3,25% 3,25%
Remaining service period 19 years 16 years
Percentual breakdown of pension assets into investment
categories, parent company and Group as at 31 December. 2012 2011
Property 5% 4%
Held-to-maturity bonds 30% 32%
Norwegian bonds 22% 26%
Foreign bonds 5% 4%
High-interest bonds 4% 0%
Norwegian money market 12% 13%
Foreign shares 15% 15%
Norwegian shares 4% 4%
Bank deposits 3% 2%
Total 100% 100%

103
StatnettAnnual report 2012
Notes
Parent company Group
2011 2012 Defined benefit schemes (AmountsinNOKmillion) 2012 2011
125 181 Present value of this year’s pension contributions 182 126
56 49 Interest cost of pension liability 49 57
-51 -51 Expected return on pension assets -51 -51
-23 32 Actuarial gains/losses in income statement 32 -1
130 211 Net pension costs 212 131
18 30 Employer’s contributions 30 18
148 241 Net pension costs, incl. employer’s cont. 242 149
Pension costs
The expected pension premium for 2013 is NOK 150 million for the parent com-pany and NOK 151 million for the Group.

104
StatnettAnnual report 2012
Notes
Parent company Group
2011 2012 Defined-benefit schemes (AmountsinNOKmillion) 2012 2011
Change in gross pension liability
1 685 2 293 Gross pension liability at 1 Jan. 2 310 1 699
139 198 Present value of the year’s pension contributions 200 140
64 57 Interest costs of pension liability 57 65
447 -626 Actuarial gains and losses -631 450
-16 -22 Employer’s contribution on premium paid -22 -17
-26 -30 Disbursed pension/paid-up policies -30 -27
2 293 1 870 Gross pension liabilities as at 31 Dec. 1 884 2 310
Change in gross pension assets
1 028 1 177 Fair value of pension assets at 1 Jan. 1 187 1 038
58 51 Actual return on pension assets 51 58
-4 -38 Actuarial gains and losses -37 -4
116 155 Premium paid 156 117
-21 -25 Pension/paid-up policies disbursed -25 -22
1 177 1 320 Actual value of pension assets as at 31 Dec. 1 332 1 187
1 116 550 Net pension liabilities as at 31 Dec. 552 1 123
-765 -144 Estimate variances not rec. in income statement -145 -771
Net capitalised pension liability incl.
351 406 employer’s contribution at 31 Dec. 407 352
344 352 Net pension liabilities as at 1 Jan. 353 345
145 235 Pension costs recognised in income statement 236 147
-138 -181 Premium payments (excl. adm. expenses) -182 -140
Net capitalised pension liabilities
351 406 incl. employer’s contr. at 31 Dec. 407 352
- - Capitalised pension assets at 31 Dec. - -
344 406 Capitalised pension liabilities at 31 Dec. 407 352
2 149 1 764 Gross secured pension liabilities at 31 Dec. 1 778 2 166
144 106 Gross unsec. pension liabilities at 31 Dec. 106 144
Secured and unsecured pension liabilities and pension assets

105
StatnettAnnual report 2012
Notes
Total liabilities, assets and estimate variances for the last five years
Parent company 2012 2011 2010 2009 2008
Gross defined-benefit pension liabilities at 31 Dec. 1 870 2 294 1 685 1 657 1 595
Fair value of pension assets at 31 Dec. 1 320 1 177 1 028 877 762
Net defined-benefit pension liabilities 550 1 117 657 780 833
Net defined-benefit pension liabilities
in income statement -144 -765 -313 -411 -491
Book pension liabilities 406 352 344 369 342
Changes in estimate variances for the year
Discount rate -625 530
Rate of return assets 37 4
Salaries growth - -82
Adjustments to G - 22
Pension adjustments -34 -105
Member movements - 83
Total changes in estimate variances for the year -622 452
Group 2012 2011 2010 2009 2008
Gross defined-benefit pension liability at 31 Dec. 1 884 2 311 1 699 1 670 1 608
Fair value of pension assets at 31 Dec. 1 332 1 184 1 038 886 770
Net defined-benefit pension liabilities 552 1 124 661 784 838
Estimate variances not recognised in
income statement -145 -771 -316 -415 -496
Book pension liability 407 353 345 369 342
Changes in estimate variances for the year
Discount rate -626 533
Rate of return assets 37 4
Salaries growth - -82
Adjustments to G -33 22
Pension adjustments - -106
Member movements - 84
Total changes in estimate variances for the year -622 455

106
StatnettAnnual report 2012
Notes
Sensitivity analysis
The figures below give an estimate of the potential effect of a change in certain assumptions for defined-benefit pension schemes in Norway for Statnett. The following estimates and estimated pension costs for 2012 are based on the facts and circumstances at 31 December 2012. Actual results may differ signifi-cantly from these estimates.
Annual salaries growht and change Annual Current Discount in basic adjustmentPension liabilities and costs assumptions rate amount (G) of pensions
Change in percentage points -1% +1% -1% +1% -1% +1%
Parent company
Pension cost before adjustment for interest costs and return on pension assets (SC) 156 203 121 138 178 137 181
Defined-benefit pension liabilities - minimum pension liability (ABO) 1 433 1 719 1 213 1 433 1 433 1 273 1 626
Defined-benefit pension liabilities - present value of pension liability (PBO) 1 798 2 200 1 493 1 677 1 938 1 597 2 039
Group
Pension cost before adjustment for interest costs and return on pension assets (SC) 158 205 123 139 180 138 182
Defined-benefit pension liabilities - minimum pension liability (ABO) 1 444 1 732 1 222 1 444 1 444 1 283 1 626
Defined-benefit pension liabilities - present value of pension liability (PBO) 1 812 2 216 1 505 1 690 1 953 1 609 2 057
(AmountsinNOKmillion)
Risk tables for mortality and disability are based on tables in general use in Norway updated with historical data from the life companies’ population. These data entail an adjustment of available tables in the form of increased life expec-tancy and increased disability probability. The average life expectancy for all age groups in the tables used is 80 years for men and 84 years for women. An extract from these tables is shown below. The table shows life expectancy and probabi-lity of disability and death within one year for different age groups.
Probability Probability Life of disability of death expectancy
Age Men Women Men Women Men Women
20 0,13% 0,16% 0,01% 0,01% 79 84
40 0,21% 0,35% 0,07% 0,04% 80 84
60 1,48% 1,94% 0,63% 0,36% 82 85
80 - - 5,91% 3,91% 87 89

107
StatnettAnnual report 2012
Notes
Pension disbursement flow Statnett SF
The average weighted maturity for pension liabilities, related to the main scheme in Statnett SF, is estimated at 21 years based on the pension assumptions at 31 Dec. 2012. Average weighted maturity has been taken into account when choo-sing discount rate.
Current value of future disbursements at 31 Dec. 2012
10
20
30
40
50
60
70
1 3 1 7 9 11 13 15 17 19 21 23 25 27 29 31 33 35 37 39 41 43 45 47 49 51 53 55 57 59 61 63 65
DisbursementMNOK
Year

108
StatnettAnnual report 2012
Notes
nOTE 6 TAnGIBlE FIxED ASSETS
Parent company
Electrotechnical ICT Buildings operating
equipment equipment and land equipment Total
Acquisition cost at 1 Jan. 2011 21 435 1 243 2 191 248 25 117
Additions, acquisition cost 1 193 217 307 58 1 775
Disposals, acquisition cost 158 132 9 11 310
Acquisition cost at 1 Jan. 2011 22 470 1 328 2 489 295 26 582
Additions, acquisition cost 544 261 435 76 1 316
Disposals, acquisition cost 110 105 6 13 234
Acquisition cost at 31 Dec. 2012 22 904 1 484 2 918 358 27 664
Ordinary depreciation at 1 Jan. 2011 7 512 853 438 139 8 942
Ordinary depreciation for the year 583 103 73 27 786
Disposals, ordinary depreciation 158 129 3 8 298
Ordinary depreciation at 1 Jan. 2012 7 937 827 508 158 9 430
Ordinary depreciation for the year 567 132 79 34 812
Disposals, ordinary depreciation 81 102 3 13 199
Ordinary depreciation at 31. Dec. 2012 8 423 857 584 179 10 043
Book value at 31 Dec. 2011 14 533 501 1 981 137 17 152
Book value at 31. Dec. 2012 14 481 627 2 334 179 17 621
Of which financial leasing:
31. Dec. 2011 225 99 204 - 528
31. Dec 2012 217 98 189 - 504
Acquisition cost for tangible fixed assets fully
depreciated, but still in use 1 046 526 50 80 1 702
Depreciation rate (straight-line) in percentage 2 - 7 5 - 33 0 - 2 10 - 33
(AmountsinNOKmillion)
Other

109
StatnettAnnual report 2012
Notes
Group
Electrotechnical ICT Buildings operating equipment equipment and land equipment Total
Acquisition cost at 1 Jan. 2011 21 435 1 243 2 191 508 25 377
Additions, acquisition cost 1 193 217 307 91 1 808
Disposals, acquisition cost 158 132 9 12 311
Acquisition cost at 1 Jan. 2012 22 470 1 328 2 489 587 26 874
Additions, acquisition cost 544 261 435 102 1 342
Disposals, acquisition cost 110 105 6 14 235
Acquisition cost at 31 Dec. 2012 22 904 1 484 2 918 675 27 981
Ordinary depreciation at 1 Jan. 2011 7 512 853 438 178 8 981
Ordinary depreciation for the year 583 103 73 37 796
Disposals, ordinary depreciation 158 129 3 9 299
Ordinary depreciation at 1 Jan. 2012 7 937 827 508 206 9 478
Ordinary depreciation for the year 567 132 79 47 825
Disposals, ordinary depreciation 81 102 3 13 199
Ordinary depreciation at 31. Dec. 2012 8 423 857 584 240 10 104
Book value at 31. Dec. 2011 14 533 501 1 981 381 17 396
Book value at 31. Dec. 2012 14 481 627 2 334 435 17 877
Of which financial leasing:
31 Dec. 2011 225 99 204 - 528
31 Dec. 2012 217 98 189 - 504
Acquisition cost for tangible fixed assets fully
depreciated, but still in use 1 046 526 50 80 1 702
Depreciation rate (straight-line) in percentage 2 - 7 5 - 33 0 - 2 10 - 33
(AmountsinNOKmillion)
Other
Thecategoryelectro-technicalequipmentmainlycomprisesinstallationsintransformerandswitchingstations,overheadlinesandearthandsubseacables.
Installationsintransformerandswitchingstationshavevaryingdepreciationperiods.Transformersandothermaincomponentshaveadepreciationperiodof30-50years.Controlsystemsnormallyhaveadepreciationperiodof15years.
Overheadlineshaveadepreciationperiodof55years.Earth/subseacableshavea40-55-yeardepreciationperiod.
Financialleasingispaidforinfullinadvance.Thismeansthattherearenofutureleaseobligationsrelatedtofinancialleasing.

110
StatnettAnnual report 2012
Notes
Parent company Group
2011 2012 (AmountsinNOKmillion) 2012 2011
1 857 2 429 Acquisition cost at 1 January 2 429 1 857
2 108 3 152 Additions during the year 3 152 2 108
-1 533 -1 339 Transferred to tangible fixed assets -1 339 -1 533
-3 -9 Write-offs -9 -3
2 429 4 233 Acquisition cost at 31 December 4 233 2 429
-8 -2 Accumulated write-downs -2 -8
16 46 Effect, hedged forward exchange contracts 46 16
2 437 4 277 Balance sheet value at 31 December 4 277 2 437
Specification of additions during the year:
Parent company Group
2011 2012 (AmountsinNOKmillion) 2012 2011
1 297 2 104 Materials and subcontractors 2 104 1 297
283 300 Salaries, social security costs 300 283
459 645 Other operating costs 645 459
2 039 3 049 Total operating costs 3 049 2 039
69 103 Construction interest 103 69
2 108 3 152 Total 3 152 2 108
2012 2011
Average capitalisation rate used to determine the loan expense amount that can be capitalised: 3,34% 3,41%
nOTE 7 PlAnTS unDER COnSTRuCTIOn

111
StatnettAnnual report 2012
Notes
Future contractual Accrued
Project obligations costs
Ørskog-Sogndal 1 637 1 143
Skagerrak 4 705 566
Ytre Oslofjord 373 187
Voltage upgrades Eastern Corridor 264 107
Upgrading of Statnett’s central operations system 107 196
Varangerbotn - Skogfoss 60 333
Total 3 146 2 532
Other 1 745
Total plants under construction 4 277
(AmountsinNOKmillion)
nOTE 8 FInAnCIAl ITEmS - PROFIT/lOSS
Parent company Group
2011 2012 (AmountsinNOKmillion) 2012 2011
Financial income
6 20 Income from investment in subsidiaries - -
2 15 Income from investment in associates - -
43 42 Interest income 48 55
-2 -2 Change in value of derivatives -2 -2
19 30 Gain on exchange 30 19
3 - Other financial income 19 8
71 105 Total financial income 95 80
Financial costs
374 435 Interest costs 430 374
-69 -103 Capitalised construction interest -103 -69
13 37 Loss on exchange 38 13
94 8 Other financial costs 10 38
412 377 Total financial costs 375 356
Major contractual obligations, projects as at 31 Dec. 2012
The selection only includes future contractual obligations exceeding NOK 50 million.

112
StatnettAnnual report 2012
Notes
nOTE 9 FInAnCIAl ITEmS - BAlAnCE SHEETFinancial assets and liabilities
The fair value of forward exchange contracts is determined by applying the for-ward exchange rate on the balance sheet date. The fair value of currency swap and interest rate swap is calculated as the present value of future cash flows. Fair value is mainly confirmed by the financial institution with which Statnett has entered into such contracts.
The fair value of financial assets and long-term liabilities accounted for at amorti-sed cost has been calculated:- using quoted market prices,- using interest rate terms for liabilities with a corresponding maturity and credit risk, or- using the present value of estimated cash flows discounted by the interest rate that applies to corresponding liabilities and assets on the balance sheet date.
In the case of financial instruments such as financial assets available for sale, trade account receivables and other short-term receivables, liquid assets, trade accounts payable and other current liabilities, it is assumed that the book value is a good estimate of fair value, due to the short-term nature of the items.
Included in liquid assets as at 31 December 2012 are reserved tax withholdings of NOK 50 million and securities to Nord Pool Spot AS of NOK 33 million in the parent company. Corresponding figures for the Group are NOK 50 million and NOK 33 million respectively.

113
StatnettAnnual report 2012
Notes
(AmountsinNOKmillion) 2012 2012 2011 2011 Book Fair Book FairParent company Category value value value value
Assets
Fixed assets
Long-term receivables Loans and receivables 300 300 199 199
Subord. capital in Statnett SFs pension fund Fair value through profit/loss 75 75 75 75
Financial assets available for sale Available for sale 5 5 5 5
Derivatives Fair value through profit/loss 1 037 1 037 1 111 1 111
Total fixed asset investments 1 417 1 417 1 390 1 390
Current assets
Trade accounts receivable Loans and receivables 199 199 137 137
Derivatives Fair value through profit/loss 3 3 364 364
Other short-term receivables Loans and receivables 862 862 685 685
Total trade accounts and other
short-term receivables 1 064 1 064 1 186 1 186
Investment in market-based securities Fair value through profit/loss 327 327 272 272
Liquid assets Fair value through profit/loss 561 561 917 917
Liabilities
Long-term interest-bearing debt Other liabilities 12 375 12 482 11 018 11 125
Derivatives Fair value through profit/loss 248 248 92 92
Total long-term interest-bearing debt 12 623 12 730 11 110 11 217
Short-term interest-bearing debt Other liabilities 1 884 1 885 2 298 2 305
Derivatives Fair value through profit/loss 22 22 4 4
Total short-term interest-bearing debt 1 906 1 907 2 302 2 309
Trade accounts payable and other
short-term debt Other liabilities 1 234 1 234 1 224 1 224

114
StatnettAnnual report 2012
Notes
(AmountsinNOKmillion) 2012 2012 2011 2011 Book Fair Book FairGroup Category value value value value
Assets
Fixed assets
Long-term receivables Loans and receivables 125 125 - -
Subord. capital in Statnett SF’s pension fund Fair value through profit/loss 75 75 75 75
Financial assets available for sale Available for sale 5 5 5 5
Derivatives Fair value through profit/loss 1 037 1 037 1 108 1 108
Total financial fixed assets 1 242 1 242 1 188 1 188
Current assets
Trade accounts receivable Loans and receivables 209 209 137 137
Derivatives Fair value through profit/loss 3 3 364 364
Other short-term receivables Loans and receivables 764 764 637 637
Total trade accounts and other
short-term receivables 976 976 1 138 1 138
Investment in market-based securities Fair value through profit/loss 668 668 600 600
Liquid assets Fair value through profit/loss 634 634 1 002 1 002
Liabilities
Long-term interest-bearing debt Other liabilities 12 236 12 343 10 882 10 989
Derivatives Fair value through profit/loss 248 248 92 92
Total long-term interest-bearing debt 12 484 12 591 10 974 11 081
Short-term interest-bearing debt Other liabilities 1 884 1 885 2 298 2 305
Derivatives Fair value through profit/loss 22 22 4 4
Total short-term interest-bearing debt 1 906 1 907 2 302 2 309
Trade accounts payable and other
short-term debt Other liabilities 1 251 1 251 1 232 1 232

115
StatnettAnnual report 2012
Notes
The table below shows financial instruments recognised at fair value according to the valuation method
(AmountsinNOKmillion)
As at 31 Dec. 2012
Parent company Level 1 Level 2 Level 3 Total
Assets
Subord. capital in Statnett SF’s pension fund - - 75 75
Financial assets available for sale - - 5 5
Derivatives - 1 039 - 1 039
Investment in market-based securities 327 - - 327
Liquid assets 561 - - 561
Total assets 888 1 039 80 2 007
Liabilities
Derivatives - 270 - 270
Total liabilities - 270 - 270
(AmountsinNOKmillion)
Group
Assets
Subord. capital in Statnett SF’s pension fund - - 75 75
Financial assets available for sale - - 5 5
Derivatives - 1 039 - 1 039
Investment in market-based securities 668 - - 668
Liquid assets 634 - - 634
Total assets 1 302 1 039 80 2 421
Liabilities
Derivatives - 270 - 270
Total liabilities - 270 - 270

116
StatnettAnnual report 2012
Reconciliation of level 3 in fair value measurements.
Level 1: Fair value is used for quoted prices from active markets for identical financial instruments. No adjustments are made with regard to these prices.
Level 2: Fair value is measured using other observable input than for Level 1, either direct (prices) or indirect (derived from prices).
Level 3: Fair value is measured using input based on non observable market data. Interest-bearing assets and liabilities
Repayment profile for interest-bearing debt for the parent company
The loans are measured at amortised cost adjusted for the effect of fair value hedging
Notes
Parent company Group
2011 2012 2012 2011
75 75 Subord. capital in Statnett SF’s pension fund 75 75
5 5 Financial assets available for sale 5 5
80 80 Total fair value level 3 80 80
(AmountsinNOKmillion) Upon
Maturity date 2013 2014 2015 2016 2017- demand* Sum
Fixed rate loans
Certificate issues 1 700 - - - - - 1 700
Bond issues - 637 561 595 6 865 - 8 658
Total fixed rate loans 1 700 637 561 595 6 865 - 10 358
Floating rate loans
Other interest-bearing debt 114 36 15 22 175 139 501
Bond issues - 400 - - 170 - 570
Loans from financial institutions 92 92 92 92 2 732 - 3 100
Total floating rate loans 206 528 107 114 3 077 139 4 171
Total short-term debt 1 906 1 906
Total long-term debt 1 165 668 709 9 942 139 12 623
Total interest-bearing debt 1 906 1 165 668 709 9 942 139 14 529
*StatnettSFintra-grouploansofNOK139million,payableondemand.

117
StatnettAnnual report 2012
Notes
(Amountsinmillions)
Information about interest Loans in Loans in
interest-bearing debt rate 1) currency NOK
Valuta
NOK 3,24% 10 314 10 314
JPY 2,11% 9 000 613
CHF 2,82% 400 2 771
SEK 2,42% 200 170
USD 3,10% 100 568
EUR* ** 13 93
Total 14 529
Loans by currency as at 31 Dec. 2012
* AmountsinEURarelinkedtocollateralunderCSA(CreditSupportAnnex)agreements,whichreflect higher/lowervalueofderivatives.** EONIAovernight-dailyinterestratesannouncedbytheEuropeanBankingFederation(EBF)*** TheamountinUSDrelatestothreeswapswithaforwardstartinJanuary2013,butwithamarket valueasat31Dec.2012
1) AllloansinforeigncurrencyareconvertedintoNOKusingcrosscurrencyinterestswapagreements. Theaverageinterestratefortheloansincludesinterestswapagreements.Theaverageinterestrate istheaveragerateasat31Dec.2012.
Maturity of fixed interest
of the loan portifolio 2013 2014 2015 2016 2017- Total
(AmountsinNOKmillion) 10 630 491 599 686 2123 14 529
Market-based securities
Parent company Group
Acquisition Book Acquisition Book cost value cost value
74 74 Government 74 74
63 64 Municipality/municipal operations 71 73
97 98 Financial institutions, including banks 325 331
90 91 Private/industry 133 135
324 327 Total bonds 603 613
- - Norwegian equity funds 27 28
- - Foreign equity funds 27 27
- - Total equity funds 54 55
324 327 Total market-based securities 657 668
AmountsinNOKmillion)
Average

118
StatnettAnnual report 2012
Notes
All purchased bonds are issued in NOK. Unrealised interest gain/loss changed from NOK 4,5 million to 2,7 million during the period.Unrealised interest gain/loss changed from NOK 4.5 million to 2.7 million during the period.Which resulted in a loss of NOK 1.8 million, recognised in Other financial income.
Age distribution trade receivable
Total trade
Not due 1-30 days 31-60 days 61-90 days Over 90 days acc. rcvb.
Parent company 182 10 4 2 1 199
Group 186 16 4 2 1 209
Derivatives
Interestrateandcurrencyswaps
These are agreements where the contracting parties exchange currency and/or interest rate terms for an agreed amount over a defined future period.
All interest rate and currency swaps are related to underlying loans. Any loss/gain on the swap will therefore correspond to the gain/loss on the loan.
(AmountsinNOKmillion) Intr. rate Intr. Rate Market Cash Market terms terms Principal Principal value* flow value* Change in Statnett Statnett Maturity lending borrowing 2011 2012 2012 value*** receives pays
Free-standing derivatives**
2015 NOK 200 NOK 200 14 5 14 5 Fixed Nibor 6 months
2015 NOK 200 NOK 200 -8 -3 -9 -4 Nibor 6 months Fixed
2028 USD 80 NOK 456,8 -7 -7 Fixed USD Nibor 6 months
2028 USD 80 7 7 Fixed USD
2033 USD 220 NOK 1256,2 -33 -33 Fixed USD Nibor 6 months
2033 USD 220 33 33 Fast USD
2043 USD 30 NOK 171,3 -7 -7 Fixed USD Nibor 6 months
2043 USD 30 7 7 Fixed USD
Total 6 2 5 1
Derivatives, cash flow hedges
2014 NOK 200 NOK 200 -7 -3 -6 -2 Nibor 6 months Fixed
2014 NOK 200 NOK 200 -6 -2 -5 -2 Nibor 6 months Fixed
2016 NOK 400 NOK 400 -12 -3 -20 -11 Nibor 6 months Fixed
2021 NOK 400 NOK 400 -11 -11 Nibor 6 months Fixed
2021 NOK 500 NOK 500 -14 -14 Nibor 6 months Fixed
2021 NOK 400 NOK 400 -12 -12 Nibor 6 months Fixed
2022 NOK 393,25 NOK 393,25 -34 -6 -49 -21 Nibor 6 months Fixed
Total -59 -14 -117 -73

119
StatnettAnnual report 2012
Notes
(AmountsinNOKmillion)
Fair value hedging**** intr. rate intr. rate Market Market terms terms Principal Principal value* value* Statnett Statnett
Maturity: lending borrowing 2011 2012 receives pays
2014 NOK 300 NOK 300 6 6 Fixed Nibor 6 months
2014 JPY 5000 NOK 295,8 111 35 Fixed JPY Nibor 6 months
2015 NOK 50 NOK 50 3 3 Fixed Nibor 6 months
2017 CHF 250 NOK 1290 506 445 Fixed CHF Nibor 6 months
2019 JPY 4000 NOK 201 138 81 Fixed JPY Nibor 6 months
2020 NOK 300 NOK 300 41 50 Fixed Nibor 6 months
2020 NOK 60 NOK 60 2 5 Fixed Nibor 6 months
SEK Stibor
2021 SEK 200 NOK 180 -11 -10 3 months Nibor 6 months
2021 CHF 150 NOK 923,25 139 114 Fixed CHF Nibor 6 months
2023 NOK 600 NOK 600 72 94 Fixed Nibor 6 months
2024 USD 100 NOK 602,9 -33 Fixed USD Nibor 6 months
2025 NOK 600 NOK 600 80 102 Fixed Nibor 6 months
2027 NOK 1000 NOK 1000 40 Fixed Nibor 6 months
Total 1 087 932
* Accruedinterestisnotincludedinthemarketvalue.Inthecaseofcombinedinterestrateandcurrencyswaps,theunrealisedcurrencyeffectisincludedin themarketvalue.** Free-standingderivativesofNOK200millionarerelatedtounderlyingloans,buthedgeaccountingisnotused. Asat31Dec.2012,StatnetthadenteredintoloanagreementstotallingUSD330millionwithassociatedinterestrate/currencyswapswithdisbursementon 22January2013. Boththeloansandswapsareclassifiedasfree-standingderivativesfromthedateofentryuntilthedateofdisbursement.Changesinvalueofloancontracts areoffsetchangesinvalueoftheassociatedswaps.*** Changesinmarketvalueincludescashflowfor2012.**** Changesinvalueinfairvaluehedgeshavenoeffectontheresult.
Interestrateoptions:
Statnett had no interest rate options as at 31 December 2012. Forwardexchangeoptions:
Statnett makes use of forward exchange contracts in order to the currency risk on transactions in currencies other than NOK.

120
StatnettAnnual report 2012
Notes
Nominal Nominal amount amount Average Market
Market
(AmountsinNOKmillion) in currency in NOK hedge rate rate* value
SEK 323 291 0,90 0,85 -11
EUR 105 826 7,89 7,34 -39
Total forward exchange contracts 1117 -50
Commoditycontracts:
Statnett had no commodity contracts at 31 December 2012.
nOTE 10 FInAnCIAl RISk mAnAGEmEnTFinancial risk
The object of Statnett SF’s financial policy is to ensure that the enterprise achie-ves the necessary financing of planned operational and investment programmes at the lowest possible cost, risk included. Statnett SF’s financial policy also com-prises aims and frameworks for minimising the enterprise’s credit, interest rate and foreign exchange risks. Statnett SF uses financial derivatives to manage the financial risk. Capital management
The enterprise has liabilities and equity as specified in the balance sheet. The loan agreements do not impose any capital requirements on the enterprise which are expected to restrict the capital structure of the enterprise. There are no explicit equity requirements other than those stipulated in applicable laws and regula-tions. The main objective of Statnett’s capital management is to ensure that the enterprise has a sound financial position which enables the enterprise to carry out all socio-economically profitable grid investments. This is in line with state-ments from the owner. Specific target figures for the enterprise’s financial posi-tion have not been determined. However, it is a priority with the Statnett’s Board of Directors to maintain a robust A rating. Statnett may request more equity from the owner, if necessary. The need for more equity is assessed continuously on the basis of Statnett’s objectives. The owner has established a long-term dividend policy of 50 per cent of the Group’s annual profit after tax, adjusted for the chan-ged balance for higher/lower revenues after tax up to and including the fiscal year 2015. Moreover, the capital structure is managed by raising and paying off short-term and long-term debt, as well as through changes in liquid assets. There have been no changes to capital management objectives or guidelines in 2012.
*Averageforwardrate.Allcontractsarerelatedtocapitalexpenditureonplantsinforeigncurrency.Unrealisedgains/lossesonforwardexchangecontractsreduce/increasethecostpriceoftheinvestmentsupondisposal.
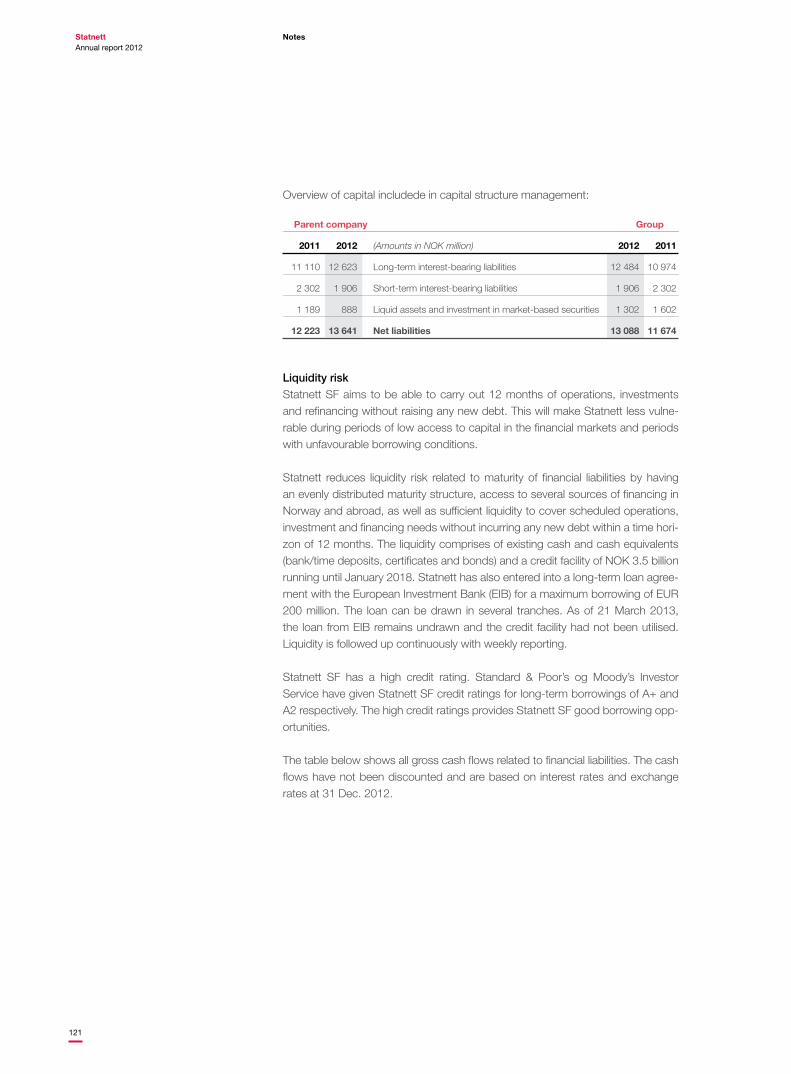
121
StatnettAnnual report 2012
Notes
Overview of capital includede in capital structure management:
Liquidity risk
Statnett SF aims to be able to carry out 12 months of operations, investments and refinancing without raising any new debt. This will make Statnett less vulne-rable during periods of low access to capital in the financial markets and periods with unfavourable borrowing conditions.
Statnett reduces liquidity risk related to maturity of financial liabilities by having an evenly distributed maturity structure, access to several sources of financing in Norway and abroad, as well as sufficient liquidity to cover scheduled operations, investment and financing needs without incurring any new debt within a time hori-zon of 12 months. The liquidity comprises of existing cash and cash equivalents (bank/time deposits, certificates and bonds) and a credit facility of NOK 3.5 billion running until January 2018. Statnett has also entered into a long-term loan agree-ment with the European Investment Bank (EIB) for a maximum borrowing of EUR 200 million. The loan can be drawn in several tranches. As of 21 March 2013, the loan from EIB remains undrawn and the credit facility had not been utilised. Liquidity is followed up continuously with weekly reporting.
Statnett SF has a high credit rating. Standard & Poor’s og Moody’s Investor Service have given Statnett SF credit ratings for long-term borrowings of A+ and A2 respectively. The high credit ratings provides Statnett SF good borrowing opp-ortunities. The table below shows all gross cash flows related to financial liabilities. The cash flows have not been discounted and are based on interest rates and exchange rates at 31 Dec. 2012.
Parent company Group
2011 2012 (AmountsinNOKmillion) 2012 2011
11 110 12 623 Long-term interest-bearing liabilities 12 484 10 974
2 302 1 906 Short-term interest-bearing liabilities 1 906 2 302
1 189 888 Liquid assets and investment in market-based securities 1 302 1 602
12 223 13 641 Net liabilities 13 088 11 674

122
StatnettAnnual report 2012
Notes
Parent company Under 1 to 3 3 to 6 6 to 10 10
As at 31 Dec. 2012 1 year years years years years+ Total
Interest-bearing debt and interest payments 2 306 2 755 3 465 4 702 6 815 20 043
Other liabilities 1 39 1 33 74
Trade acc.payable and other short-term debt 1 234 1 234
Derivatives 2 693 2 416 2 076 1 113 2 327 10 625
Total 6 233 5 172 5 580 5 816 9 175 31 976
Under 1 to 3 3 to 6 6 to 10 10Derivates 1 year years years years years+ Total
Received 2 760 2 528 2 499 1 444 2 887 12 118
Disbursed -2 693 -2 416 -2 076 -1 113 -2 327 -10 625
Net derivatives 67 112 423 331 560 1 493
Group Under 1 to 3 3 to 6 6 to 10 10
As at 31 Dec. 2012 1 year years years years years+ Total
Interest-bearing debt and interest payments 2 306 2 616 3 465 4 702 6 815 19 904
Other liabilities 1 39 1 33 74
Trade acc.payable and other short-term debt 1 251 1 251
Derivatives 2 693 2 416 2 076 1 113 2 327 10 625
Total 6 250 5 033 5 580 5 816 9 175 31 854
Under 1 to 3 3 to 6 6 to 10 10
Derivates 1 year years years years years+ Total
Received 2 760 2 528 2 499 1 444 2 887 12 118
Disbursed -2 693 -2 416 -2 076 -1 113 -2 327 -10 625
Net derivatives 67 112 423 331 560 1 493
Credit risk
Statnett SF is exposed to credit risk through the investment of surplus liquidity with issuers of securities and through the use of various interest rate and currency derivatives. In order to limit this risk, Statnett has set credit limits based on the creditworthiness of counterparties and the maximum exposure for each counter-party. Creditworthiness is assessed at least once a year, and the counterparty risk is continuously monitored to ensure that Statnett’s exposure does not exceed the set credit limits and complies with internal rules.
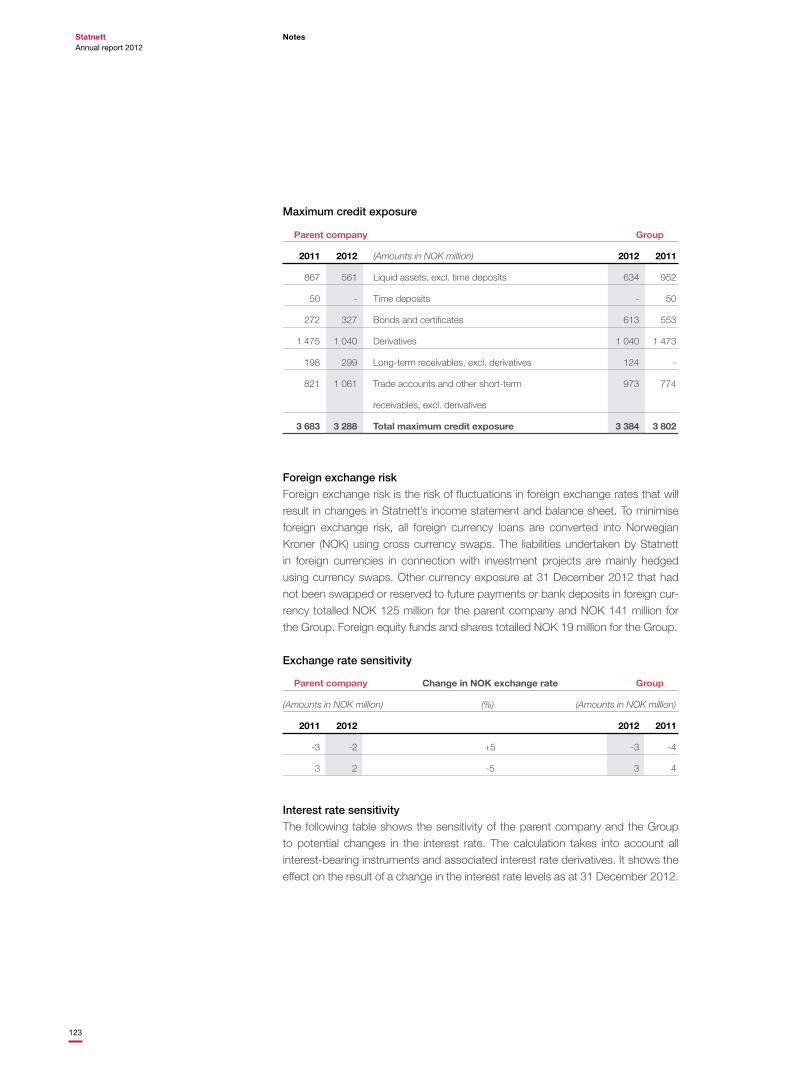
123
StatnettAnnual report 2012
Notes
Maximum credit exposure
Parent company Change in NOK exchange rate Group
(AmountsinNOKmillion) (%) (AmountsinNOKmillion)
2011 2012 2012 2011
-3 -2 +5 -3 -4
3 2 -5 3 4
Parent company Group
2011 2012 (AmountsinNOKmillion) 2012 2011
867 561 Liquid assets, excl. time deposits 634 952
50 - Time deposits - 50
272 327 Bonds and certificates 613 553
1 475 1 040 Derivatives 1 040 1 473
198 299 Long-term receivables, excl. derivatives 124 -
821 1 061 Trade accounts and other short-term 973 774
receivables, excl. derivatives
3 683 3 288 Total maximum credit exposure 3 384 3 802
Foreign exchange risk
Foreign exchange risk is the risk of fluctuations in foreign exchange rates that will result in changes in Statnett’s income statement and balance sheet. To minimise foreign exchange risk, all foreign currency loans are converted into Norwegian Kroner (NOK) using cross currency swaps. The liabilities undertaken by Statnett in foreign currencies in connection with investment projects are mainly hedged using currency swaps. Other currency exposure at 31 December 2012 that had not been swapped or reserved to future payments or bank deposits in foreign cur-rency totalled NOK 125 million for the parent company and NOK 141 million for the Group. Foreign equity funds and shares totalled NOK 19 million for the Group.
Exchange rate sensitivity
Interest rate sensitivity
The following table shows the sensitivity of the parent company and the Group to potential changes in the interest rate. The calculation takes into account all interest-bearing instruments and associated interest rate derivatives. It shows the effect on the result of a change in the interest rate levels as at 31 December 2012.

124
StatnettAnnual report 2012
Notes
Parent company Group
2011 2012 2012 2011
4,33% 4,02% Bonds and certificates 4,77% 4,69%
3,05% 2,39% Deposits 2,39% 3,05%
- - Shares and equity funds 12,42% -8,10%
3,38% 3,43% Loans 3,43% 3,38%
Effect on Effect on result result Parent company Change in interest rate level Group
(AmountsinNOKmillion) (%) (AmountsinNOKmillion)
2011 2012 2012 2011
-5 -5 +1 -11 -11
5 5 -1 11 11
It has been assumed that a change of one percentage point in the short-term interest rate level will result in a change in the Group’s average borrowing rate of approx.0.35 percentage points over a six-month period. Net borrowing costs will then change approx. NOK 92 million, annualy.
Average effective interest rate
The table below shows the average effective interest rate for the individual finan-cial instruments for the full years 2011 and 2012. Throughout 2012, Statnett had a higher share of bank deposits in foreign currency, which resulted in lower inter-est yield on deposits.

125
StatnettAnnual report 2012
Notes
nOTE 11 TAxES
Parent company Group
2011 2012 (AmountsinNOKmillion) 2012 2011
Tax on result
273 221 Tax payable 220 273
80 107 Change in deferred tax/tax benefit 105 84
353 328 Tax 325 357
273 221 Tax payable for the year 221 273
-2 -11 Tax payable in conn. with group contribution -11 -2
271 210 Tax payable balance sheet 210 271
80 107 Deferred tax/tax benefit as a result of changes in temporary differences 105 84
29% 28% Effective tax rate 28% 26%
Reconciliation of effective tax rate with Norwegian tax rate
1 206 1 177 Profit before tax 1 162 1 357
337 329 28 % tax 326 380
18 -7 Permanent differences 28% -2 -21
-2 6 Share of profit/loss in KS, FKV and TS 1 -2
353 328 Tax 325 357
Deferred tax(-)/tax asset in the balance sheet
- - Other intangible assets -4 -4
-515 -640 Fixed assets -666 -537
42 50 Profit and loss account 50 42
- -19 Receivables -3 10
- - Technical provisions insurance -61 -63
99 114 Pensions 114 99
- 9 Securities and financial instruments (excl. cash flow hedges) 7 -1
16 33 Cash flow hedges 33 16
17 21 Other tax-related provisions 21 17
-2 -11 Tax effect of Group contribution -11 -2
- - Tax loss carried forward 14 17
-343 -443 Total deferred tax(-)/tax assets (net) -506 -406

126
StatnettAnnual report 2012
Notes
Changes in temporary differences Other com- prehensive GroupParent company (AmountsinNOKmillion) 31/12/2011 Recognized income contribution 31/12/2012
Fixed assets 1 840 446 - - 2 286
Profit and loss account -149 -31 - - -180
Receivables - 66 - - 66
Pensions -352 -54 - - -406
Securities and financial instruments (excl. cash flow hedges) - -34 - - -34
Cash flow hedges -59 - -58 - -117
Other provisions -62 -13 - - -75
Group contribution 6 - - 34 40
Total 1 224 380 -58 34 1 580
Other com- prehensive GroupGroup 31/12/2011 Recognized income contribution 31/12/2012
Other intangible assets 13 - - - 13
Fixed assets 1 918 462 - - 2 380
Profit and loss account -147 -31 - - -178
Receivables -37 45 - - 8
Technical provisions insurance 226 -6 - - 220
Pensions -352 -55 - - -407
Securities and financial instruments (excl. cash flow hedges) 3 -30 - - -27
Cash flow hedges -59 - -58 - -117
Other provisions -63 -13 - - -76
Tax loss carried forward -52 9 - 34 -9
Total 1 450 381 -58 34 1 807
In2012aGroupcontributionofNOK40millionwasmadetoStatnettTransportAS.Thisreducedtaxlosscarriedforwardinthelimitedcompany.

127
StatnettAnnual report 2012
Notes
nOTE 12 InvESTmEnTS In SuBSIDIARIES, JOInT vEnTuRES AnD ASSOCIATES
year of Registered Ownership Voting Book Company Type acquisition office interest rights value
Subsidiaries
Statnett Transport AS Subsidiary 1996 Oslo 100% 100% 79 221
Statnett Forsikring AS Subsidiary 1998 Oslo 100% 100% 30 200
Nord.Link AS Subsidiary 2010 Oslo 100% 100% 500
Noreveien 26 AS Subsidiary 2010 Oslo 100% 100% 100
NorGer AS Subsidiary 2010/2011 Oslo 100% 100% 25 265
NorGer KS Subsidiary 2010/2011 Oslo 100% 100% 136 617
Total subsidiaries 271 903
Associates
Nord Pool Spot AS Associate 2002/2008 Bærum 28,8% 28,8% 36 320
Total book value subsidiaries, joint ventures and associates 308 223
Group value of companies recorded according to the equity method
Group value Result for Group value 2012 at 1 Jan. the year Dividend at 31 Dec.
Nord Pool Spot AS, 28,8 % 1) 53 667 15 430 -15 000 54 097
Total associates 53 667 15 430 -15 000 54 097
Group value Result for Group value 2011 at 1 Jan. the year Dividend at 31 Dec.
Nord Pool Spot AS, 30 % 51 080 4 987 -2 400 53 667
Total associates 51 080 4 987 -2 400 53 667
Changes in investments in subsidiaries, joint ventures and associates
There were no activities in Nord.Link AS in 2012.There were no activities in Noreveien 26 AS in 2012. Transactions in 2011
In August 2011, Statnett purchased another 50 per cent of NorGer AS and 45 prosent in NorGer KS. NorGer AS had a direct ownership interest of 10 per cent in NorGer KS. Directly and indirectly, Statnett SF owns 100 per cent of NorGer KS. Both NorGer AS and NorGer KS are accounted for as subsidiaries.
(AmountsinNOKthousand)
Statnett SF has the following investments at 31 December 2012:
1)InconnectionwithaprivateplacementinNordPoolSpotASasat31July,Statnett’sownershipinterestwasreducedfrom30%to28.8%.TheprofitfortheyearincludestheGroup’sgainduetothereducedownershipinterestthroughaprivateplacing.

128
StatnettAnnual report 2012
Notes
nOTE 13 RElATED PARTIESAs at 31 December 2012, Statnett SF was wholly-owned by the Norwegian State through the Ministry of Petroleum and Energy (MPE). Statnett has the following relations with MPE both as owner and regulatory authority: Regulatory authority
The Norwegian parliament (Storting) is the legislative authority that passes legis-lation based on bills put forward by the government. Regulations are adopted by the King in Council. The MPE administers its areas of responsibilities and delega-tes the administration of the greater part of the Energy Act to the NVE. Pursuant to the Norwegian Public Administration Act, any administrative decision made by the NVE can be appealed to the MPE as the superior authority.
Other related parties:
The subsidiaries are all wholly-owned by Statnett SF, though so that Statnett owns 100 per cent of the shares in NorGer AS and 90 per cent of the shares in NorGer KS. In addition, NorGer AS owns 10 per cent of the shares in NorGer KS. This entails that Statnett SF, including indirect ownership, also controls 100 per cent of the shares in NorGer KS.
Statnett SF has an ownership interest in Nord Pool Spot AS of 28.8 per cent. The ownership interest was reduced from 30 per cent following a private placement in July 2012.
Related party transaction
Statnett SF and its subsidiaries have entered into loan agreements and agree-ments relating to the purchase and sale of services. All transactions are made as part of the normal commercial operations and at current market prices. The most important transactions were:
Statnett Forsikring AS is licensed to provide cover for risks associated with com-panies in the Statnett Group, and operates both as a direct personal insurance company and a non-life insurance company. The company is also a reinsurer of Statnett’s risks covered by other insurers.
Statnett Transport AS operates a heavy transport business on land and sea and
Parent company Subsidiary Associate
Statnett SF Statnett Transport AS Nord Pool Spot AS
Statnett Forsikring AS
Noreveien 26 AS
Nord.Link AS
NorGer KS
NorGer AS

129
StatnettAnnual report 2012
Notes
supplies transport services to Statnett SF, including preparedness services rela-ting to cables. These services are valued by an external party.
Statnett SF purchases transmission losses on Nord Pool Spot AS on a daily basis. The purchase and sale of energy is settled at the power exchange’s mar-ket prices.
Statnett SF performs administrative services for its subsidiaries. Agreements have been entered into which specify these services, and they are priced at market terms.
In 2012, Statnett SF received dividends totalling NOK 35 million from subsidiaries and associates. Joint venture parties
TenneT TSO BV and Statnett SF have constructed a subsea cable to transport energy between Norway and the Netherlands, known as the NorNed cable. Each party owns its physical half of the cable, with Statnett owning the northern part and TenneT the southern part. The NorNed cable became operational in May 2008. Costs and revenues from the operation of the NorNed cable are shared equally between TenneT and Statnett.
Statnett SF owns Skagerrak cables 1-3 whereas the Danish system operator Energinet.dk holds a long-term lease agreement for half of the cable capacity. Operating costs and revenues related to the operation of the cable are shared equally between Energinet.dk and Statnett. Energinet.dk and Statnett have also been granted a licence to install another cable for transmission of energy between Norway and Denmark, called Skagerrak 4. Each party will own its physical half of the cable, with Statnett owning the northern part and Energinet the southern part. The cable is currently being constructed and is scheduled to come online towards the end of 2014.
Statnett SF, KfW and TenneT TSO GmbH have entered into a joint venture agre-ement for development, construction and operation of a 1400 MW subsea cable between Norway and Germany.
Long-term Long-term Trade acc. Trade accounts lending borrowing Payable
(AmountsinNOKmillion) 2012 2011 2012 2011 2012 2011 2012 2011
Subsidiaries 3 5 187 198 138 137 5 29
Interest rates
Interest rates on long-term borrowing and lending have been agreed at six months’ NIBOR with a mark-up in the interval 1% - 1.75%
Statnett SF inter-company accounts

130
StatnettAnnual report 2012
Notes
nOTE 14 REnumERATIOn/BEnEFITS TO THE GROuP mAnAGEmEnTThe Board’s declaration on determination of salary and other remuneration
for the Group management.
The statement concerning remuneration to the President and CEO and the Group management has been prepared in accordance with the provisions in the Public Limited Liability Companies Act, the Norwegian Accounting Act, the Norwegian Code of Practice for Corporate Governance and the Guidelines relating to state-owned companies, which include an approach to executive pay, as well as the Norwegian Ministry of Petroleum and Energy’s compliance expectations stipulated in its letter of 29 November 2011.
The Board of Directors has established a remuneration committee, consisting of two owner-appointed board members and one employee representative. Unless otherwise agreed, the HR Director will act as committee secretary. The remunera-tion committee is an advisory and preparatory body for the Board of Directors, and will put forward proposals for salary adjustments in accordance with the guidelines specified below.
In addition to a fixed salary the Group management is entitled to a company car and pension benefits. There is no bonus scheme for senior employees. The retire-ment age for the President and CEO and the Group senior management is 65. The President and CEO is entitled to 12 months’ severance pay in the event of dismissal from the company. No other senior employees have agreements for salaries after the termination of employment.
The Group’s guiding principle for 2011 and 2012 has been to keep remuneration and other benefits for the Group management at a competitive level to ensure that the Group attracts and retains high-quality senior executives. The fixed salary does not need to be at the top of the pay scale. However, it must be competitive for our industry and compared to other companies recruiting in the same market as Statnett SF. At the same time, the salary must reflect individual experience, area of responsibility and achieved results.
Statnett SFs intra-group trading
Financial Sales revenues Operating costs revenues
(AmountsinNOKmillion) 2012 2011 2012 2011 2012 2011
Subsidiaries 5 4 120 238 7 7
Dividend Financial cost received
(AmountsinNOKmillion) 2012 2011 2012 2011
Subsidiaries 5 - 20 8

131
StatnettAnnual report 2012
Notes
The Board of Directors approves the annual salary adjustment for the company’s president/CEO, and adopts a framework which the president/CEO uses to adjust the salaries for the rest of the Group management team.
The same guidelines specified above will be used as a basis for the next fiscal year.
Board Board
Group management remuneration/benefits (AmountsinNOK) remuneration remuneration
Board of Directors 2012 2011
Kolbjørn Almlid (from June 2011) Chair 363 000 174 000
Bjarne Aamodt (until June 2011) Chair - 181 600
Per Hjorth Vice Chair 276 000 245 000
Thor Håkstad (until June 2012) Vice Chair 126 300 239 000
Kirsten Indgjerd Værdal Board member 198 000 185 000
Egil R Gjesteland (from June 2012) Board member 96 500 -
Kristin Lian (from June 2012) Board member 127 567 -
Grethe Høiland (until June 2012) Board member 118 300 225 000
Heidi Ekrem Board member 198 000 190 000
Steinar Jøråndstad Board member *) 233 000 225 000
Per Erland Opgård Board member *) 198 000 190 000
Kjerstin Bakke Board member *) 193 000 185 000
Total remuneration 2 127 667 2 039 600
Allfiguresareexclusiveofemployer’sNICs.Deputyboardmembersandobserversdonotreceiveremuneration.Someboardmembersreceivecompensationfortheirparticipationintheauditcommitteeorremunerationcommittee.Boardremunerationsmaythereforevary.*)Inthecaseofemployeerepresentatives,onlyboardmembers’feesarestated.

132
StatnettAnnual report 2012
Notes
Other Pension Total
Group management renumeration/benefits 2012 (AmountsinNOK) Salary renumeration cost renumeration
Group management
President and CEO
Auke Lont 2 391 762 184 735 2 908 851 5 485 348
Executive Vice Presidents
Gunnar G. Løvås Strategy and Public Affairs 1 510 869 137 719 998 547 2 647 135
Håkon Borgen Projects Division 1 640 618 102 769 1 091 041 2 834 428
Øivind Kristian Rue Grid Operations Division 1 769 371 102 363 1 637 291 3 509 025
Bente Hagem Commercial Development 1 550 897 139 068 1 349 690 3 039 655
Knut Hundhammer Corporate Staff, CFO 1 937 613 159 572 712 824 2 810 009
Peer Olav Østli ICT 1 474 289 149 462 995 325 2 619 076
Total remuneration 12 275 419 975 688 9 693 569 22 944 676
Allfiguresareexclusiveofemployer’sNICs.
Other Pension Total
Renumeration/benefits to Group management/board2011 (AmountsinNOK) Salary renumeration cost renumeration
Group management
President and CEO
Auke Lont 2 275 892 181 083 2 229 640 4 686 615
Executive Vice Presidents
Gunnar G. Løvås Strategy and Public Affairs 1 440 860 137 788 679 236 2 257 884
Håkon Borgen Projects Division 1 555 835 102 949 694 968 2 353 752
Øivind Kristian Rue Grid Operations Division 1 687 016 130 323 1 228 155 3 045 494
Bente Hagem Commercial Development 1 471 466 140 515 1 053 644 2 665 625
Knut Hundhammer (from 23 May) Corporate Staff, CFO 1 108 515 91 764 531 636 1 731 915
Marie Jore Ritterberg (until 23 May) Finance 594 033 64 440 397 515 1 055 989
Peer Olav Østli ICT 1 403 809 140 021 726 481 2 270 311
Kirsten Berg (until 23 May) Corporate Staff 533 313 49 775 251 590 834 678
Total remuneration 12 070 739 1 038 658 7 792 865 20 902 263
Allfiguresareexclusiveofemployer’sNICs.TherewasachangeinStatnett’sGroupManagementasof23May2011duetoreorganisationofthecompany.AfterthereorganisationtheGroupManagementconsistsofExecutiveVPsforStrategyandPublicAffairs,ProjectsDivision,GridOperationsDivision,CommercialDevelopment,ICTandCorporateStaff.AtthesametimeamanagementgroupforGroupdevelopmentwasdiscontinuedwhichinadditiontotheGroupManagementincludedExecutiveVPsofCorpo-rateStaff,FinanceandICT.

133
StatnettAnnual report 2012
Notes
Terms and conditions, senior executives
Title/name Terms and conditions for retirement age/early retirement pension/retirement pension
From the age of 65, the full annual retirement pension is 66 per cent of the pen-sion base, i.e. of the fixed, normal annual salary at retirement. The pension base is adjusted annually by the same percentage increase as in the basic amount under the National Insurance Scheme. From the age of 67, the annual retirement pen-sion of 66 per cent will be co-ordinated with the retirement pension disbursed from Statnett SF’s Group Pension Fund and the Norwegian National Insurance Scheme.
Upon death, any surviving spouse and children under the age of 21 will receive a pension.
Should the President become disabled before the age of 65, he or she will receive a disability pension. The full disability pension equals the retirement pension awar-ded at the age of 65. The disability pension disbursement will be reduced accor-ding to disability.
The retirement age is 65, but with the right to retire with an early retirement pen-sion at any time after the age of 62. In the event of retirement between 62 and 65 an annual payment of 66 per cent of the pension base will be disbursed. The pension base is the fixed, normal annual salary at retirement. The pension base is adjusted annually by the same percentage increase as in the basic amount under the National Insurance Scheme. In the event that income is received from others and this, together with the early retirement pension disbursed by Statnett, exceeds the final salary the early retirement pension will be reduced by 50 per cent of the amount that exceeds the final salary.
From the age of 65, the full annual retirement pension is 66 per cent of the pen-sion base, i.e. of the fixed, normal annual salary at retirement. The pension base is adjusted annually by the same percentage increase as in the basic amount under the National Insurance Scheme. From the age of 67, the annual retirement pen-sion will be coordinated with the retirement pension disbursed from Statnett SF’s Pension Fund and the Norwegian National Insurance Scheme.
Upon death, any surviving spouse and children under the age of 21 will receive a pension.
The above persons’ entitlements to pension benefits over and above paid-up policies from Statnett SF’s Group Pension Fund from the age of 62 will lapse if they are no longer employed by Statnett SF on their 62nd birthday.
Should any of the above persons become disabled before reaching the age of 65, he or she will receive a disability pension. The full disability pension equals the retirement pension awarded at the age of 65. The disability pension disbursement will be reduced according to disability.
President and CEO:Auke Lont
Executive vice presidents: Håkon BorgenBente HagemØivind Kristian Rue

134
StatnettAnnual report 2012
Notes
The retirement age is 65, with the right to retire with an early retirement pension at any time after 62. The full contribution period is 30 years. In the event of reti-rement between ages 62 and 65, an annual payment shall be disbursed of 66 per cent of the pension base, less one percentage point for each year between 62 and 65. The pension base is the fixed, normal annual salary at retirement. The pension base is adjusted annually by the same percentage increase as in the basic amount under the National Insurance Scheme. Pension disbursement may be reduced if the member receives any salary, pension or remuneration from other companies in the Statnett Group.
From the age of 65, the full annual retirement is 66 per cent of the pension base. The pension base is the fixed, normal annual salary at retirement. The pension base is adjusted annually by the same percentage increase as in the basic amount under the National Insurance Scheme. From the age of 67, the annual retirement pension is covered through the National Insurance Scheme and Statnett’s group pension scheme, plus 66 per cent of the part of the pension base that exceeds 12 times the basic amount, provided that there is a full contribution period (30 years).
Upon death, any children under the age of 21 will receive a children’s pension.
If the member leaves the company before retirement age, a pension rights certi-ficate will be issued, which will secure retirement pension benefits from age 65. The pension rights certificate will be adjusted by 75 per cent of the increase in the basic amount for each year until retirement.
Should any of the above persons become disabled before reaching the age of 65, he or she will receive a disability pension. The full disability pension equals the reti-rement pension awarded at the age of 67, based on the pension base at the time the disability occurred. The disability pension will be reduced according to disability.
The retirement age for executive positions is 65. A pension agreement has been entered into in addition to the ordinary membership in the enterprise’s group pen-sion scheme. The pension is secured through the accrued savings balance, inclu-ding interest, disbursed to Hundhammer as taxable income. Statnett holds the rights to the Guarantee Account up to the moment of disbursement. The guarantee account will be disbursed to Statnett SF at retirement at the latest. The guarantee account, including interest, is used to finance the benefits which will be disbursed to Hundhammer at retirement. The pension base is the permanent ordinary salary. Statnett will, each year until retirement or resignation, pay up to 30 per cent of the difference between the ordinary salary and 12 times the Norwegian national insu-rance scheme basic amount to the pension fund scheme. For 2012, payments of NOK 295 260 were made. For subsequent years, this amount will be adjusted with a corresponding salary increase, with a minimum increase corresponding to the increase in G. Upon death, the surviving spouse or spouse equivalent will receive an amount corresponding to the remaining savings balance including interest from Statnett SF. This lump sum will be taxable for the spouse/spouse equivalent.
Executive vice president:Knut Hundhammer
The normal notice period for resignation is three months, whereas for dismissals the notice period is six months after an employment period of two years.
No loans have been guaranteed or granted to members of the Group management or the Board of Directors.
Executive vice presidents:Gunnar G LøvåsPeer Olav Østli
Title/name Terms and conditions for retirement age/early retirement pension/retirement pension

135
StatnettAnnual report 2012
Notes
nOTE 16 SECuRED DEBT, GuARAnTEESThe parent company may not pledge the enterprise’s assets or provide other security, apart from providing security to financial institutions in connection with day-to-day banking transactions, and providing the customary security as part of the day-to-day operations.
nOTE 17 DISPuTESFrom time to time Statnett is involved in minor disputes with landowners, custo-mers and others with regard to the interpretation of signed contracts, statutory obligations, including property tax, discretionary assessments and disagreements related to ordinary operations and building of power lines and cable connections. Disputes of this nature are regarded as part of regular operations.
nOTE 18 OTHER OPERATInG COSTS
Parent company Group
2011 2012 (AmountsinNOKmillion) 2012 2011
36 51 Lease rental payable 54 38
245 308 Contracted personnel/consultants 338 307
53 59 Insurance 78 57
359 261 Materials and subcontractors 269 255
130 141 Property tax 141 130
66 83 IT costs 83 66
179 242 Miscellaneous 213 129
1 068 1 145 Total other operating costs 1 176 982
On Saturday 2 March, an outage occurred on the 420 kV interconnector between Viklandet and Fræna. This resulted in a 120 MW loss of load to Ormen Lange. General consumption was not affected. Due to adverse weather in Nordmøre the Sunndalsøra power line crew could not access the mountain to repair the fault until Tuesday 5 March. Statnett entered into a dialogue with the NVE prior to the incident to ascertain how to deal with outages in Nyhamna in terms of the quality-adjustment revenue cap for energy not supplied scheme and system operation costs. The financial consequences for Statnett as a result of the outage have the-refore not yet been clarified.
We are not aware of any other circumstances occurring after the balance sheet date that may be of significance for the evaluation of the financial statements.
nOTE 15 EvEnTS AFTER THE BAlAnCE SHEET DATE
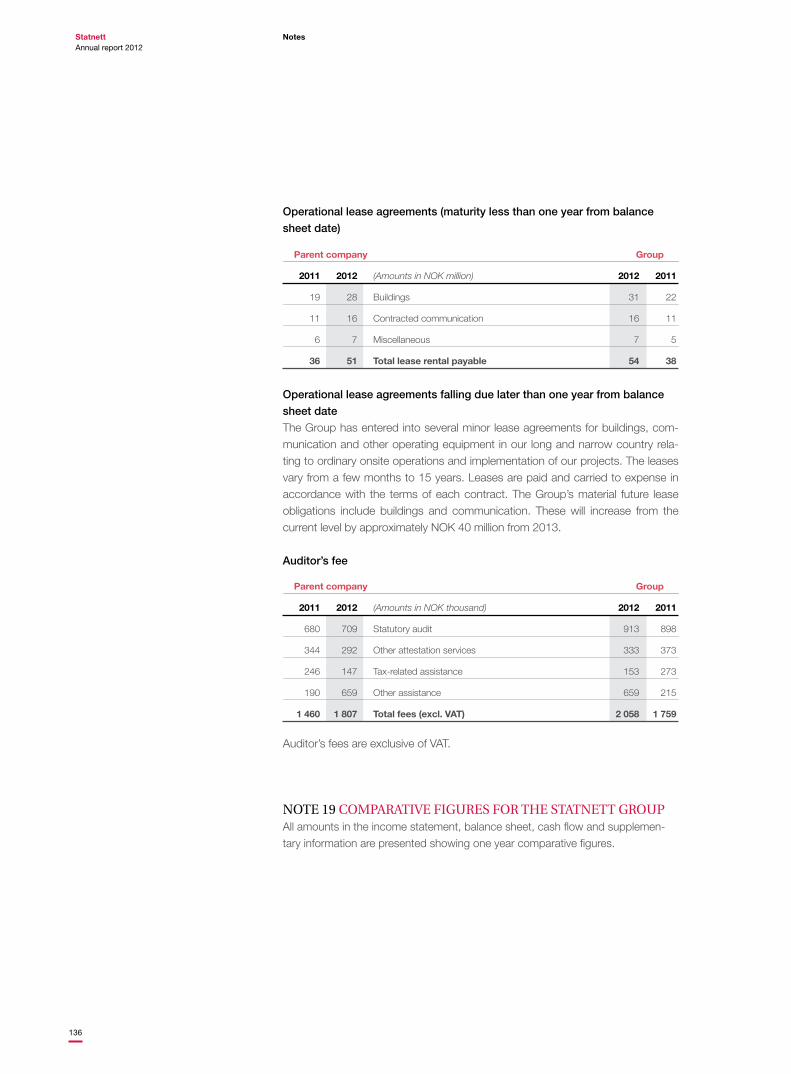
136
StatnettAnnual report 2012
Notes
Operational lease agreements falling due later than one year from balance
sheet date
The Group has entered into several minor lease agreements for buildings, com-munication and other operating equipment in our long and narrow country rela-ting to ordinary onsite operations and implementation of our projects. The leases vary from a few months to 15 years. Leases are paid and carried to expense in accordance with the terms of each contract. The Group’s material future lease obligations include buildings and communication. These will increase from the current level by approximately NOK 40 million from 2013.
Auditor’s fee
Parent company Group
2011 2012 (AmountsinNOKthousand) 2012 2011
680 709 Statutory audit 913 898
344 292 Other attestation services 333 373
246 147 Tax-related assistance 153 273
190 659 Other assistance 659 215
1 460 1 807 Total fees (excl. VAT) 2 058 1 759
Auditor’s fees are exclusive of VAT.
nOTE 19 COmPARATIvE FIGuRES FOR THE STATnETT GROuPAll amounts in the income statement, balance sheet, cash flow and supplemen-tary information are presented showing one year comparative figures.
Operational lease agreements (maturity less than one year from balance
sheet date)
Parent company Group
2011 2012 (AmountsinNOKmillion) 2012 2011
19 28 Buildings 31 22
11 16 Contracted communication 16 11
6 7 Miscellaneous 7 5
36 51 Total lease rental payable 54 38

137
StatnettAnnual report 2012
Notes
From the statement of comprehensive income, not including higher/lower revenue
Statnett Group (AmountsinNOKmillion) 2012 2011 2010 2009 2008
Permitted revenue 4 025 4 296 4 803 3 722 3 355
Other operating revenue 244 181 267 199 180
Total operating revenue 4 269 4 477 5 070 3 921 3 535
Operating costs 3 901 3 869 3 968 3 265 3 062
Operating profit/loss excl. higher/lower revenue 368 608 1 102 656 473
Income from joint ventures and associates 9 5 11 24 962
Net financial items -280 -276 -232 -289 -414
Profit/loss before tax excl. higher/lower revenue 97 337 881 391 1 021
From the balance sheet
Statnett Group (AmountsinNOKmillion) 2012 2011 2010 2009 2008
Intangible assets 66 66 66 - -
Fixed assets 23 450 21 075 19 413 17 858 19 349
Current assets 2 278 2 740 2 591 1 484 1 570
Total assets 25 794 23 881 22 070 19 342 20 919
Equity 8 955 8 277 7 628 5 618 6 585
Interest-bearing liabilities 14 390 13 276 11 757 12 340 12 340
Other liability items 2 449 2 328 2 685 1 384 1 994
Total equity and liabilities 25 794 23 881 22 070 19 342 20 919
Statnett Group (AmountsinNOKmillion) 2012 2011 2010 2009 2008
Permitted revenue 4 025 4 296 4 803 3 722 3 355
Higher/lower revenue for the period 1 065 1 020 2 177 -1 059 721
Other operating revenue 244 181 267 199 180
Total operating revenue 5 334 5 497 7 247 2 862 4 256
Operating costs 3 901 3 869 3 968 3 265 3 062
Operating profit/loss 1 433 1 628 3 279 -403 1 194
Income from joint ventures and associates 9 5 11 24 962
Net financial items -280 -276 -232 -289 -414
Profit/loss before tax 1 162 1 357 3 058 -668 1 742
Profit/loss for the year 837 1 000 2 198 -480 1 517
From the statement of comprehensive income
Below, comparative figures for selected amounts have been cited for four years.

138
StatnettAnnual report 2012
Notes
From cash flow
Statnett Group (AmountsinNOKmillion) 2012 2011 2010 2009 2008
Net cash flow from operating activities 1 426 1 523 3 804 -466 1 529
Net cash flow from investing activities -3 085 -2 370 -1 740 -140 -2 670
Net cash flow from financing activities 1 291 720 -1 277 388 1 221
Net cash flow for the period -368 -127 787 -218 80
Liquid assets 634 1 002 1 129 342 556
Dividend for the year to owner 117 315 132 499 318
2008 2009 2010 2011 2012
350030002500200015001000500
0-500
-1000
Operating profit
Profit/loss before tax
2008 2009 2010 2011 2012
Operating profit/loss Operating profit/loss exluding higher/lower revenue
5000
2500
0
-2500
Profit/loss before tax Profit/loss before tax excluding higher/lower revenue
MNOK
MNOK

139
StatnettAnnual report 2012
Notes
nOTE 20 nEW AnD AmEnDED ACCOunTInG STAnDARD
nEW AnD AmEnDED IAS, IFRS AnD IFRIC STAnDARDS WITH FuTuRE ImPlEmEnTATIOn DATESThe standards and interpretations that were adopted before submission of the consolidated accounts, but where the effective date is in the future, are stated below. The Group intends to implement the relevant amendments at the effective date, provided that the EU approves the amendments before the group acco-unts are presented. Only matters assumed to be relevant for Statnett have been included. However, none of the amendments below are considered to imply sub-stantial changes in the Group’s application of accounting principles or notes. For amendments that are considered to have a significant impact on the Group’s application of accounting principles or notes to the accounts, cf. Note 1.
Amendment to IFRS 7 Financial Instruments – informationThe amendments entail that enterprises have a duty to provide several quantita-tive details relating to set-off of financial assets and financial liabilities. The infor-mation requirements apply to all recognised financial instruments set off pursuant to IAS 32. The amendments will be effective for fiscal years starting on 1 January 2013 or later.
IFRS 9 – Financial InstrumentsIFRS 9, as it is currently published, reflects the first phase of IASBs work on repla-cing the current IAS 39, and pertains to classification and measuring of financial assets and liabilities as defined in IAS 39. Initially, the standard was to become effective for the fiscal year starting on 1 January 2013 or later. However, the effec-tive date was postponed to 1 January 2015, due to the amendments to IFRS 9 adopted in December 2011. The later phases of this project relate to hedge accounting and write-down of financial assets. The Group will evaluate potential effects of IFRS 9 in keeping with the other phases, as soon as the final standard, including all phases, is published.
IFRS 10 Consolidated Financial StatementsThe new the consolidation standard – IFRS 10 – replaces the consolidated financial statements of IAS 27 Consolidated Financial Statements and Separate Financial Statements and SIC 12 Consolidation – Special Purpose Entities. The actual consolidation method will not change as a result of the introduction of IFRS 10. However, the new standard may change the assessment of whether an entity should be consolidated or not. This is due to a change in the definition of “control”. The new definition of “control” applies to investment in all entities, also structured entities (formerly referred to as special purpose entities). The following criteria must be fulfilled before an investor is considered to have control over an entity:
• Power over the entity (“investee” in IFRS terminology),• Exposure, or right to, variable returns from its involvement with the entity, and• The ability to use its power over the entity to affect the amount of the investor’s
returns.

140
StatnettAnnual report 2012
Notes
The changes in the regulations will increase the use of discretionary assessment when determining whether the entity should be consolidated. The standard has been approved by the EU, with effect from the fiscal year starting on 1 January 2014 or later.
IFRS 11 Joint ArrangementsThis standard replaces IAS 31 Interests in Joint Ventures, as well as SIC-13 Jointly Controlled Entities - Non-monetary Contributions by Venturers. IFRS 11 removes the option to account for joint ventures using the proportional consolida-tion method. Instead all entities that meet the definition of joint ventures must be accounted for using the equity method. In the EU/EEA area, IFRS 11 will apply for the fiscal year starting on 1 January 2014 or later.
IFRS 12 Disclosure of Interests in Other EntitiesIFRS 12 applies to any entity that has an interest in subsidiaries, joint arrange-ments, associates and/or structured entities. Many of the IFRS 12 note require-ments were previously found in IAS 27, IAS 28 and IAS 31, whereas others are new requirements. The purpose of the new note requirements is to ensure that users of financial statements understand the effect on the balance sheet, profit or loss and cash flows as a result of the enterprise’s interests in other entities, as well as the nature of, and risk related to, the enterprise’s interests in other entities. The changes will not have any impact on the financial standing of the Group or on profit or loss. The standard has been approved by the EU, with effect from the fiscal year starting on 1 January 2014 or later.
IFRS 13 Fair value measurementThe standard defines principles and guidelines for measuring the fair value of assets and liabilities which other standards require or permit to be measured at fair value. IFRS 13 will be effective for fiscal years starting on 1 January 2013 or later.
Amendments to IAS 1 Presentation of Financial StatementsThe amendment to IAS 1 is a requirement to group revenues and costs in the sta-tement of ”Other revenues and costs” based on their potential to be reclassified to profit or loss, or not. The changes will only affect the presentation, and will have no impact on the Group’s financial standing or on profit or loss. The amendments to IAS 1 will be effective for fiscal years starting on 1 July 2012 or later.
IAS 28 Investment in Associates and Joint venturesThe scope of IAS 28 has been expanded to include investments in joint ventures. The standard describes principles for accounting of investments in affiliated com-panies and joint ventures, and specifies how the equity method should be applied. The amendments will be effective for fiscal years starting on 1 January 2013 or later.
IAS 32 Financial Instruments - presentationIAS 32 has been amended to clarify the phrase ”currently has a legal enforceable right to set-off” and to clarify the application of IAS 32’s set-off criteria for sett-lement systems. The amendments will be effective for fiscal years starting on 1 January 2014 or later.

141
StatnettAnnual report 2012
Notes
AnnuAl ImPROvEmEnT PROJECT 2009-2011 IAS 16 – Property, plants and equipmentThe amendment makes it clearer that major spare parts and servicing equipment that meet the definition of property, plant and equipment are not inventory. The amendments will be effective for fiscal years starting on 1 January 2013 or later. However, the amendments have still not been approved by the EU.
IAS 32 Financial Instruments, PresentationThe amendment clarifies that income tax deriving from distributions to holders of an equity instrument shall be recognised in accordance with IAS 12. The amendments will be effective for fiscal years starting on 1 January 2013 or later. However, the amendments have still not been approved by the EU.

142
StatnettAnnual report 2012
Auditors report
Auditors report

143
StatnettAnnual report 2012
Auditors report


