Completion Report Project Number: 37530-013 Loan Number: 2313 Grant Numbers: 0072 and 0111 September 2015 Tajikistan: Rural Development Project This document is being disclosed to the public in accordance with ADB’s Public Communications Policy 2011.
Transcript
Completion Report
Project Number: 37530-013 Loan Number: 2313 Grant Numbers: 0072 and 0111 September 2015
Tajikistan: Rural Development Project
This document is being disclosed to the public in accordance with ADB’s Public Communications Policy 2011.
CURRENCY EQUIVALENTS
Currency Unit – somoni (TJS)
At Appraisal At Project Completion (6 Dec 2006) (30 September 2014)
bid evaluation report country strategy and program
DMF – design and monitoring framework EIRR – economic internal rate of return GAP
GEF – –
gender action plan Global Environment Facility
MFI MIU
– –
microfinance institution market intelligence unit
MOA – Ministry of Agriculture MOF – Ministry of Finance NCB
NPV O&M
– – –
national competitive bidding net present value operation and maintenance
OCSLF PCR PMU
– – –
opportunity cost of surplus labor factor project completion report project management unit
PPMS – project performance and monitoring system PUS – pasture user society SCLM – State Committee for Land Management SDR
SERF SLA TA
– – – –
special drawing right shadow exchange rate factor subsidiary loan agreement technical assistance
GLOSSARY
dekhan – farmer (literally, “peasant”) dekhan farm – private or cooperative farm hukumat – government official jamoat – administrative unit below raion, comprising a
group of villages, also the lowest level of local government
mahalla – neighborhood or locality raion – district
NOTES
(i) The fiscal year (FY) of the Government of Tajikistan ends on 31 December.
(ii) In this report, "$" refers to US dollars.
Vice-President W. Zhang, Operations 1 Director General S. O’Sullivan, Central and West Asia Department (CWRD) Director A. Siddiq, Environment, Natural Resources and Agriculture Division,
CWRD Team leader B. Tambunan, Lead Portfolio Management Specialist, CWRD Team members E. de Castro, Project Officer, CWRD G. Farosatshoeva, Senior Project Assistant, CWRD R. Jones, Senior Natural Resources and Agriculture Economist, South
Asia Department R. Rebollido, Operations Assistant, CWRD
In preparing any country program or strategy, financing any project, or by making any designation of or reference to a particular territory or geographic area in this document, the Asian Development Bank does not intend to make any judgments as to the legal or other status of any territory or area.
CONTENTS
Page
BASIC DATA i
I. PROJECT DESCRIPTION 1
II. EVALUATION OF DESIGN AND IMPLEMENTATION 1
A. Relevance of Design and Formulation 1 B. Project Outputs 3 C. Project Costs 7 D. Disbursements 7 E. Project Schedule 8 F. Implementation Arrangements 8 G. Conditions and Covenants 8 H. Related Technical Assistance 9 I. Consultant Recruitment and Procurement 9 J. Performance of Consultants, Contractors, and Suppliers 10 K. Performance of the Borrower and the Executing Agency 10 L. Performance of the Asian Development Bank 10
III. EVALUATION OF PERFORMANCE 11
A. Relevance 11 B. Effectiveness in Achieving Outcome 11 C. Efficiency in Achieving Outcome and Outputs 11 D. Preliminary Assessment of Sustainability 12 E. Impact 12
IV. OVERALL ASSESSMENT AND RECOMMENDATIONS 13
A. Overall Assessment 13 B. Lessons 13 C. Recommendations 14
APPENDIXES
1. Project Design and Monitoring Framework 16 2. Gender Action Plan 20 3. Credit Line 23 4. Project Costs 24 5. Annual Disbursement 27 6. Project Implementation Schedule 28 7. Status of Compliance with Loan Covenants 29 8. List of Completed Civil Works and Consultancy Contracts 38 9. Non-Compliance with ADB’s Procurement Guidelines 40 10. Economic and Financial Analysis 42 11. Contribution to the ADB Results Framework 60
BASIC DATA A. Loan Identification 1. Country 2. Loan Number Grant Numbers 3. Project Title 4. Borrower 5. Executing Agency 6. Amount of Loan 7. Asian Development Bank (ADB) Grant 8. GEF Grant 9. Project Completion Report Number
Tajikistan 2313(SF) 0072 and 0111 (Global Environment Facility [GEF]) Rural Development Project Republic of Tajikistan Ministry of Agriculture SDR5,920,000 $8,300,000 $3,500,000 PCR: TAJ-1552
B. Loan Data 1. Appraisal – Date Started – Date Completed 2. Loan Negotiations – Date Started – Date Completed 3. Date of Board Approval 4. Date of Agreement 5. Date of Effectiveness – In Agreement – Actual – Number of Extensions 6. Closing Date – In Agreement – Actual – Number of Extensions 7. Terms of Loan – Interest Rate – Maturity (number of years) – Grace Period (number of years)
ADB Loan ADB Grant GEF Grant 10 Jul 2006 3 Aug 2006 16 Nov 2006 16 Nov 2006 29 Jan 2007 29 Jan 2007 15 May 2008 16 Apr 2007 16 Apr 2007 8 May 2009 15 Jul 2007 15 Jul 2007 14 Sep 2007 14 Sep 2007 8 May 2009 None 30 Sep 2014 30 Sep 2014 12 Feb 2015 12 Feb 2015 12 Feb 2015 None 1.0% per annum for the first 8 years and 1.5% per annum thereafter 32 8
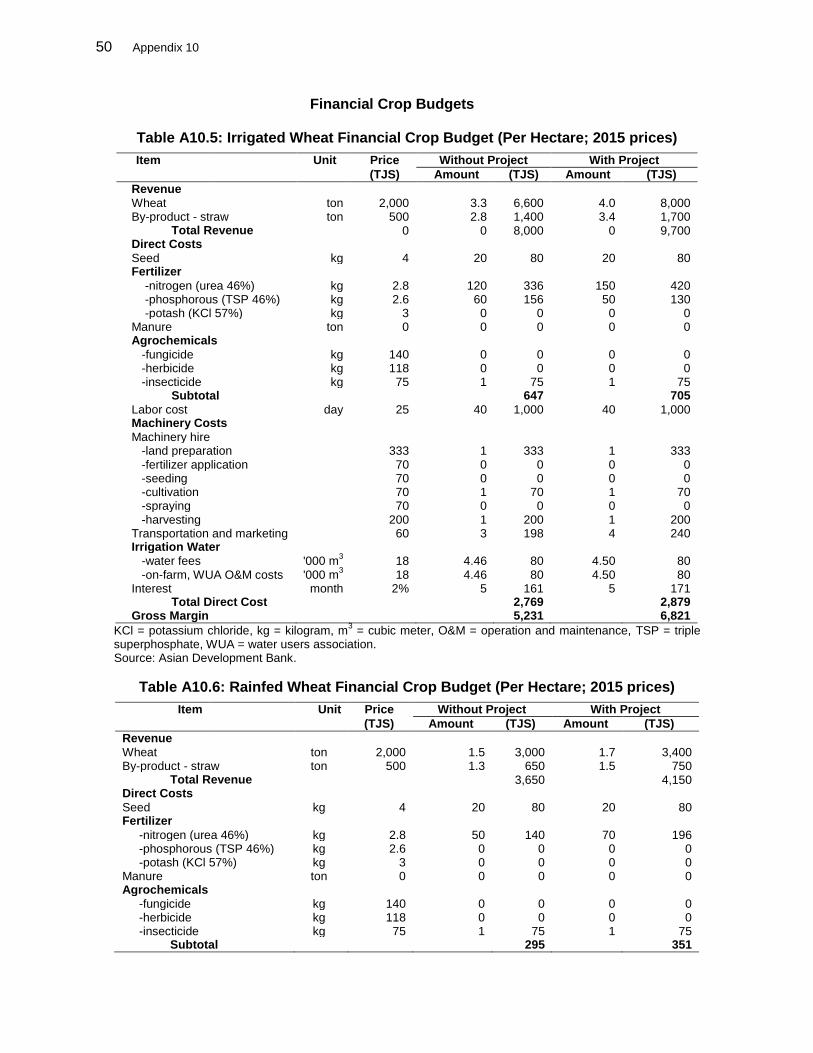
ii
8. Disbursements a. Dates Initial Disbursement Final Disbursement Time Interval
ADB Loan 4 May 2009 21 Nov 2014 5 yrs. 6 mos. 12 days ADB Grant 8 Sep 2008 21 Nov 2014 6 yrs. 2 mos. 17 days GEF Grant 24 Nov 2010 18 Nov 2014 3 yrs. 11 mos. 18 days Effective Date Original Closing Date Time Interval
ADB Loan 14 Sep 2007 30 Sep 2014 7 yrs. 16 days ADB Grant 14 Sep 2007 30 Sep 2014 7 yrs. 16 days GEF Grant 8 May 2009 30 Sep 2014 5 yrs. 4 mos. 24 days
ADB = Asian Development Bank, GEF = Global Environment Facility.
Other External Financing Beneficiaries 1.05 0.44 GEF 3.50 2.36
Total 22.93 15.24
IDC Costs Borrower Financed 0.00 0.00 ADB Financed 0.37 0.04 Other External Financing 0.00 0.00 Total 23.30 15.28
ADB = Asian Development Bank, GEF = Global Environment Facility, IDC = interest during construction.
3. Cost Breakdown by Project Component ($ million)
Component Appraisal Estimate Actual
Base Cost
1. Policy and Institutional Development and Reform 2.10 2.15 2. Sustainable Land Management 4.17 2.45 3. Agriculture and Rural Business Support 6.27 0.63 4. Rural Infrastructure Improvement 6.18 4.79 5. Project Management 3.05 5.22
Date of Contract with Consultants Project Implementation November 2006 11 March 2009 Sustainable Pasture, Arable, and Forestland Management July 2007 26 July 2010 Agriculture and Rural Business Advisory Services and Market Information System July 2007 6 Jan 2012 Design Services (5 contracts with local design institutes) 1 August 2011 Training for the Rural Population and Local Officials to Provide Public Information and Legal Consultation 7 December 2010
iv
Item Appraisal Estimate Actual
Civil Works Contract Contract NCB/01-10
Date of Award Completion
15 December 2010
15 June 2011 Contract NCB/02-12 Date of Award Completion
11 January 2011
13 July 2012 Contract NCB/03-12
Date of Award Completion
13 January 2011
13 July 2011 Contract NCB/04-12
Date of Award Completion
11 November 2011
11 May 2012 Contract NCB/05-12
Date of Award Completion
22 September 2011
26 February 13 Contract NCB/06-12
Date of Award Completion
9 May 2012
10 November 2012 Contract NCB/07-12
Date of Award Completion
9 May 2012
10 November 2012 Contract NCB/08-12
Date of Award Completion
11 June 2012
11 December 2012 Contract NCB/09-12
Date of Award Completion
9 May 2012
10 November 2012 Contract NCB/10-12
Date of Award Completion
9 May 2012
10 November 2012 Contract NCB/11-12
Date of Award Completion
9 May 2012
10 November 2012 Contract NCB/12-12
Date of Award Completion
19 September 2012
20 March 2013 Contract NCB/13-12
Date of Award Completion
14 September 2012
20 March 2013 Contract NCB/14-12
Date of Award Completion
19 September 2012
20 March 2013 Contract NCB/15-12
Date of Award Completion
18 January 2013
24 July 2013 Contract NCB/16-12
Date of Award Completion
18 January 2013
26 July 2013 Contract NCB/17-12
Date of Award Completion
18 January 2013
25 July 2013 Contract NCB/18-12
Date of Award Completion
5 June 2013
5 December 2013 Contract NCB/19-12
Date of Award Completion
15 July 2013
21 December 2013 Contract NCB/20-12
Date of Award Completion
5 June 2013
5 December 2013
v
Item Appraisal Estimate Actual
Contract NCB/21-12 Date of Award Completion
6 June 2013
6 December 2013 Contract NCB/22-12
Date of Award Completion
5 June 2013
5 December 2013 Contract NCB/23-12
Date of Award Completion
8 August 2013
26 December 2014 Contract NCB/24-12
Date of Award Completion
7 June 2013
7 December 2013 Contract NCB/26-12
Date of Award Completion
25 June 2013
25 December 2014 Contract NCB/27-12
Date of Award Completion
22 June 2013
31 December 2014 Contract NCB/30-12
Date of Award Completion
27 June 2013
22 December 2014 Equipment and Supplies First Procurement 8 September 2008 Last Procurement 28 February 2014 Other Milestones Minor Change in Implementation Arrangements Minor Change in Implementation Arrangements Minor Change to a Project Change in Consultant Selection Method Minor Change to a Project and Partial Cancellation Partial Cancellation of Loan and Grant Proceeds Reallocation of Loan and Grant Proceeds
(1) First
(2) Second (3) Third
29 April 2011 16 May 2011
24 October 2012 7 July 2011
5 June 2014 18 November 2014
19 April 2012
24 October 2012 5 June 2014
NCB = national competitive bidding. Note: Contracts NCB/23-12, NCB/26-12, NCB/27-12 and NCB/30-12 were funded solely by the government and the
beneficiaries.
5. Project Performance Report Ratings
Implementation Period
Ratings
Development Objectives Implementation Progress
From 28 February 2007 to 31 December 2010 Satisfactory Satisfactory Overall Project Rating
a
From 1 April 2011 to 30 September 2012 On Track From 1 October 2012 to 30 September 2013 Potential Problem From 1 October 2013 to 31 December 2013 Actual Problem From 1 January 2014 to 30 June 2014 On Track From 1 July 2014 to 30 September 2014 Potential Problem From 1 October 2014 to 31 December 2014 On Track a
In 2011, e-Operations replaced the project performance rating. The indicators used in performance rating are technical, contract awards, disbursement, financial management, and safeguards. A single rating applies to projects.
vi
D. Data on Asian Development Bank Missions
Name of Mission Date No. of
Persons No. of
Person-Days Specialization of
Members
Fact-finding 7 Jul–3 Aug 2006 4 52 a, b, c, d Appraisal 1–7 & 14–18 Oct
2006 5 60 a, b, e, f, g
Special Administration 1 8–10 Feb 2007 1 3 a Inception 15 Oct–5 Nov 2007 2 28 a, h Special Administration 2 2–11 March 2009 1 10 a Special Administration 3
a 14 May–3 Jun 2009 1 14 a
Review 1 24 Nov–2 Dec 2009 2 20 a, i Review 2 18–28 Nov 2010 2 22 a, j Midterm Review 14–29 Mar 2011 5 55 k, l, m, n, i Review 3 26 Mar–1 Apr 2012 4 28 k, n, i, w Review 4 7–13 Apr 2013 3 21 k, o, p Special Administration 4 18–20 Nov 2013 3 9 k, q, r Review 5 22–28 June 2014 1 7 k Project Completion Review 16–28 Feb 2015 4 47 s, t, u, v
a = Principal Project Economist, b = Senior Natural Resources Management Specialist, c = Natural Resources Economist, d = Social Development Specialist, e = Senior Counsel, f = Institutional Specialist (Staff Consultant), g = Rangeland Specialist (Staff Consultant), h = Assistant Project Analyst, i = Project Implementation Officer, j = Associate Project Analyst, k = Natural Resources and Agricultural Economist, l = Principal Natural Resources Agricultural Economist, m = Water Resources Specialist, n = Project Analyst, Advisor to Board Director, o = Project Analyst, p = Project Implementation Officer, q = Senior Portfolio Management Specialist (Integrity), r = Senior Project Assistant, s = Senior Natural Resources and Agriculture Economist, t = Project Economist (Staff Consultant), u = Lead Portfolio Management Specialist, v = Project Officer, w = Advisor to the Board of Directors. a Includes mission to Loan 2271-TAJ: Sustainable Cotton Subsector Project (21–27 May 2009).
I. PROJECT DESCRIPTION 1. Tajikistan is a small, mountainous and landlocked country, whose geographic area and location presents formidable barriers to achieving sustainable economic growth and development. Tajikistan has a narrow economic base, with agriculture a major livelihood source for more than 64% of the population, contributing 27% of the gross domestic product in 2012.1 The main cash crops are cotton and wheat, cultivated on nearly 70% of the cropped area (30% under cotton, 36% under wheat, and 9% under other cereals).2 2. Poverty increased dramatically in Tajikistan following the collapse of the Soviet Union in 1991. The World Bank’s poverty assessment estimated that in 1999 over 80% of the population lived below the poverty line, and poverty was more pronounced in rural than urban areas, with an estimated 81% of the poor living there.3 Rural poverty remained a problem in 2009 (latest World Bank data), with 49% of the rural population living below the national poverty line. 3. Extensive land degradation is evident. Soil erosion in rain-fed farming systems stems largely from wheat cultivation on sloping lands. Seriously degraded pasture and forest land is the result of livestock overgrazing near settlements, abandonment of pastures at higher elevations, and unmanaged collection of fuelwood. 4. While agriculture has contributed significantly to economic growth and poverty reduction since 1991, it was still underperforming. In Tajikistan’s transition to a market-oriented economy, and as farmers emerge from primarily subsistence-based farming, agriculture still has a fundamental role in fostering rural economic growth and in diversifying and developing the rural nonfarm economy. Constraints on Tajikistan’s rural development are: the limited freedom to farm and conduct business, severe land degradation, limited availability of support services, poor infrastructure, and weak institutions. 5. The project took a holistic and coordinated approach to rural development to address constraints, enhance opportunities, and integrate agriculture more effectively into the rural economy. The stated impact was to increase farm and nonfarm incomes of rural households.4 The outcome was to increase productivity of farms and rural enterprises in Faizabad, Rudaki, Rogun, Vahdat, and Varzob raions (districts) within an environmentally sustainable management framework. The project had 12 outputs aggregated under five components: (i) policy and institutional development and reform; (ii) sustainable land management (pasture, arable, and forest); (iii) agriculture and rural business support; (iv) rural infrastructure development; and (v) project management.
II. EVALUATION OF DESIGN AND IMPLEMENTATION A. Relevance of Design and Formulation 6. The project was consistent at appraisal with Tajikistan’s Poverty Reduction Strategy, which recognized the importance of agriculture in poverty alleviation through widespread
1 World Bank. 2013. World Development Indicator Database. http://data.worldbank.org/indicator.
2 State Statistical Committee of the Republic of Tajikistan. 2007. Agriculture in Tajikistan, statistical yearbook.
Dushanbe (in Russian). 3 Asian Development Bank (ADB). 2003. Country Strategy and Program, 2004–2008: Tajikistan. Manila.
4 ADB. 2006. Report and Recommendation of the President to the Board of Directors: Proposed Loan and Asian
Development Fund Grant to the Republic of Tajikistan for the Rural Development Project. Manila.
increase in farm incomes and creation of opportunities for rural services and industry growth.5 The strategy identified that the agriculture sector should address: (i) efficient use of, and the poor’s access to, key resources, particularly land and water; (ii) creation of a favorable framework for developing private sector activity; and (iii) reform of the existing management system, including the practice of intervening in decision making by the private sector. 7. The project was consistent with the Government of Tajikistan’s National Development Strategy, 2007–2015, which aimed to provide for a long-term development process following the Millennium Development Goals.6 The strategy was organized into: (i) the “functional block,” which provides for the institutional and functional environment; (ii) the “production block,” the physical environment to support economic growth; and (iii) the “social block,” for expansion of access to basic social services and resolution of social development issues. Problems identified in the production block include the limited opportunities open to agriculture due to high transportation and irrigation costs, and poor development of service structures contributing to serious problems with food security and the availability and affordability of high-quality foodstuffs. A priority was to raise agricultural productivity by (i) improving the production efficiency of cotton and resolving the cotton debts problem, (ii) developing entrepreneurial activity and ensuring equal rights and guarantees for land use, and (iii) rebuilding and developing irrigation systems. 8. The project was consistent with the Asian Development Bank’s (ADB’s) country strategy and program (CSP) at formulation. The CSP’s main objectives were to: (i) strengthen rural development through institution building to support policy implementation and the private sector and (ii) invest in rural infrastructure destroyed by civil war and years of neglect.7 To improve economic growth, the CSP focused on rural development and regional cooperation. To improve rural development, it identified three tasks: (i) creating an environment for more inclusive growth, (ii) increasing rural sector productivity and profitability, and (iii) improving irrigation and transport infrastructure. The project was specifically identified in the CSP update, justified on the basis that the non-cotton sector was severely constrained by lack of access to credit and by limited market opportunities, as well as by poor rural infrastructure, inadequate extension services, and weak institutional capacity at local government and community levels.8 9. ADB’s investment priorities changed during the project’s latter part. The Country Partnership Strategy, 2010–2014 identified three sectors for investment: energy, transport, and private sector development and public services. 9 Although agriculture was considered an important sector in Tajikistan, the strategy stated ADB would withdraw support from agriculture because (i) ADB should be selective and focus the use of Asian Development Fund resources in a few areas, and (ii) the World Bank would continue to invest in agriculture. Accordingly, ADB would focus on infrastructure investment, with rehabilitation of irrigation systems, and private sector development. 10. The formulation process included project preparatory technical assistance (TA), which guided the project design and implementation arrangements. The TA was well detailed in terms of addressing the main development issues and provided guidance on the project components to achieve the outcome and impact.
5 Republic of Tajikistan. 2002. Poverty Reduction Strategy Paper. Dushanbe.
6 Republic of Tajikistan. 2007. National Development Strategy of the Republic of Tajikistan for the period to 2015.
Dushanbe. 7 ADB. 2003. Country Strategy and Program: Tajikistan, 2004–2008. Manila
8 ADB. 2004. Country Strategy and Program Update: Tajikistan (2005–2006). Manila.
9 ADB. 2010. Country Partnership Strategy: Tajikistan, 2010–2014. Manila.
3
B. Project Outputs 11. The project had five components with 12 associated outputs. Achieving some outputs was constrained by delayed consultant contracting, particularly related to (i) implementation support, (ii) improvement of livestock and pasture land, and (iii) the establishment of agricultural advisory centers and market intelligence units (MIUs). This, in turn, delayed most activities. Output achievements and indicators are presented in Appendix 1 against the design and monitoring framework (DMF). Specific gender achievements are presented in Appendix 2.
1. Policy and Institutional Development and Reform 12. The policy and institutional development component was to improve land use security, policies and instructions for pasture land management, and the administration and institutional aspects of business development. Outputs included (i) land use rights secured, (ii) policies and institutions for pasture lands improved, and (iii) administration and institutional aspects of the business development improved. 13. Under the first output, raion officials were to better understand the limits of their powers under the Land Code and related legislation, and farmers were to become more aware of their rights and available support services for arbitration and legal redress. This output was partly achieved, and all activities were implemented. Although an awareness program targeted 2,470 beneficiaries, the project could not adequately measure whether raion administrations had improved operations. The target of 100% of dekhan farms with land certificates was almost met, at 97% for the project area. In total, 11,543 dekhan farms have certificates, of which 923 were represented by women. About 77% of land disputes were resolved against a target of 100%. For the final indicator on farmers reporting compulsory land use, the project completion survey found 6.4% of respondents stated hukumats (government officials) were responsible for farm-planting decisions, while the remainder stated it was farmers (60.6%), farm foreman (19.8%), and shareholders of dekhan farms (13.2%). Other government interference was also reported, through utility cuts (19%), increased tax inspections (30%), forced reporting to and meetings at hukumat offices (27%), and threats to withdraw land certificates (23%). 14. Under the second output, the project aimed to identify relevant international pasture land management practices, raise awareness of management problems, and provide support to develop strategies and legislation for sustainable management. This output was achieved despite a limited timeline because of delayed consultant mobilization. Most activities were implemented, including (i) 30 participatory rural assessments, (ii) an international conference, (iii) preparation of a sector assessment, and (iv) preparation of improved pasture laws. Most targets were met, albeit late. A national pasture land policy and strategy (part of the sector assessment) was completed in 2012. An improved pasture law was passed in March 2013 that provided equitable access to all pasture categories. The indicator on restructured institutions for pasture land management was considered inappropriate, as it required restructuring of institutions outside the project area. The indicator on equitable access to pastures could not be measured due to the reduced timeframe. However, the legislation processes are in place for future achievement. 14. The third output was to determine the costs, in reduced investment and lost productivity, of administrative interference in farm and business decision making. This was partly achieved. The economic study of these costs was cancelled, as this was addressed in the International Finance Corporation’s business environment survey conducted in 2008 and 2009. Trainings and seminars were conducted for raion officials on the impacts of administration burdens and
4
benefits of regulatory reform. The government established a unified registration system in 2009, with a network of one-stop shops operating across the project area and nationally. This helped streamline processes and reduce time for business registration. Nine raion seminars on the new business procedures were attended by 229 beneficiaries, 71 of whom were women. The development of mechanisms to monitor business environment performance of raion and jamoat authorities was only partly achieved, because the project management unit (PMU) did not provide a consultant contract addendum specifying this task. As a result, the indicators for reduced inspection frequency and incidence of business interference were not measured.
2. Sustainable Land Management (Pasture, Arable, and Forest) 15. This component was to strengthen land management by improving integrated pasture land and livestock techniques, enhancing capacity, and reversing land degradation. Outputs included (i) pasture and livestock planning and management skills demonstrated, (ii) capacity for effective land management improved; and (iii) degraded lands rehabilitated. Performance of this component was affected by delayed consultant recruitment, reducing implementation to only two years. 16. The first output, to improve pasture land conditions within an economically, socially, and environmentally sustainable framework, was achieved. Ten pasture user societies (PUSs) were established and were the focus of most participatory rural assessments. The PUSs created annual grazing plans and longer-term management plans. They also received demonstrations to improve pasture productivity, forage production, livestock management, erosion control and agroforestry, irrigation and stock watering points, and re-vegetation of degraded lands. To address the identified problems of poor animal health and the lack of access to veterinary services, the project established five veterinary centers to serve the needs of villages and livestock producers. Erosion is a major problem on steep and over-grazed lands and although positive progress was achieved, demonstrated by better land management, the two-year implementation was insufficient to demonstrate full benefits of erosion control and agroforestry. This made it difficult to measure three indicators: (i) improved land condition, (ii) improved winter feeding, and (iii) new techniques for monitoring livestock and pastures. 17. Under the second output, improved institutional capacity to provide advice and further training to meet the country’s needs was anticipated. This output was partly achieved. Only one proposal for consultancy services was received, and the firm withdrew its offer during contract negotiations in October 2010. The services were subsequently included in the terms of reference for the Sustainable Pasture, Arable and Forestland Management consultant at a much-reduced scope. The main achievements were: (i) developing a curriculum for a full-time pasture management course, and providing seminars on sustainable pasture arable land and forestry management for 100 participants (70 men and 30 women) and restoration and greenery planting of pasture land for 60 participants (50 men and 10 women); (ii) delivering short training courses; and (iii) providing new facilities (training room, teaching herbarium, library, and teaching and field demonstration facilities) and equipment for the Tajikistan Agrarian University. A memorandum of understanding was made with Gansu Agricultural University, China. 18. The third output was to improve the status of degradation on arable, cultivated marginal lands and forestry-pasture lands. The project was to assess the degradation of these lands at the raion level to identify the causes, status, and impact to improve land management decision making. The output was partly achieved. A database for each raion was produced that mapped pasture plans. Measuring the degradation impact was to be carried out in coordination with the Central Asian Countries Initiative for Land Management, which was to conduct an assessment.
5
But with the initiative’s withdrawal from Tajikistan, the assessment could not be undertaken. Demonstrations were used to identify best options for (i) re-vegetation of degraded lands, (ii) irrigation technologies and stock watering (9 sites), and (iii) agroforestry (11 sites). Only the indicator for community forest groups (10 compared to target 5) was measureable. The remaining indicators were overly optimistic, claimed by the consultant to be non-measurable and beyond the project to influence at a raion level, particularly given the reduced time for implementation.
3. Agriculture and Rural Business Support 19. This component focused on establishing farm and rural business advisory services and a market information system. The outputs were (i) demand-driven farm and rural business advisory services established and sustainably operated, and (ii) market information system operational. Substantial delays occurred in recruiting the consultant, which reduced implementation to 27 months and limited this component’s performance. In addition, after March 2014, the government significantly curtailed the services provided, by requesting that project procured vehicles and equipment be handed over to the government for its use. 20. The first output was to improve farmer and rural business decision-making capacity by establishing rural business advisory centers and providing microcredit. The advisory centers were to provide farmers with training and services, while the microcredit was to address the limited availability and access to rural finance, which impeded adoption of improved technologies. The output was partly achieved. Four business advisory centers (Rudaki, Vahdat, Varzob, and a combined Faizabad and Rogun) were established and registered in February 2012. In the centers, there are 31 staff, eight of whom are women. The centers were not privatized, as designed. However, to facilitate financial autonomy, each center established business plans, bank accounts, and boards of directors. Despite the implementation delay, the centers performed largely as intended, developing staff capacity, delivering training programs and materials for farmers, and conducting field demonstrations and farmer field days. 21. The $4.1 million credit line was not implemented, and the government was informed on 14 February 2014 of a minor change in project that cancelled this activity. After loan approval, the government reversed its agreement to act as the financial intermediary. There were further difficulties, as the government’s initially proposed financial intermediaries did not meet ADB’s financial and integrity due diligence requirements (see Appendix 3). Further delays on the integrity due diligence and selection process meant there was inadequate time for the activity. The lack of credit access may have limited the uptake of technologies and improved management strategies envisaged at appraisal. 22. The second output was to establish an MIU to collect reliable and statistically valid market information in the project area. The output was partly achieved. An MIU was created, staffed, and registered in Dushanbe. The MIU conducted 18 train-the-trainer sessions, disseminated market information, provided training to project beneficiaries, and conducted domestic and international rapid market assessment for select products. In total, 132 trainings were conducted in four districts (39 in Faizabad, 46 in Rudaki, 7 in Varzob, and 40 in Vahdat), with 2,482 participants, 706 of whom were women. Only about 15% (out of a target of 50%) of farmers received market information. In the future, few farmers are likely to request and pay for services. Hence, the sustainability of this output is unlikely.
6
4. Rural Infrastructure Development 23. This component was intended to strengthen the capacity of raions, jamoats, and communities, and to support investments in small-scale construction and rehabilitation of local public infrastructure. The outputs were (i) raion and jamoat infrastructure planning and maintenance capacity improved; and (ii) raion and community infrastructure improved with sustainable operation and maintenance (O&M) arrangements. Performance of this component was reduced due to (i) delays in implementing PMU activities and (ii) non-compliance with ADB’s Procurement Guidelines (2010, as amended from time to time), resulting in the cancellation of four civil works contracts and non-approval of another five contracts. 24. The first output was to strengthen the capacity of raions and communities to plan, implement, and maintain infrastructure. Raion working groups were to be established and engaged with the community to identify, prioritize, and plan infrastructure subprojects for rehabilitation or construction. This output was achieved. A community mobilization process was launched in the last quarter of 2009, and focus group meetings were conducted across all raions in early 2010. A total of 547 rural mahalla community organizations were formed with 23,479 participants, 12,209 of whom were women. During discussions with raion authorities on subsector planning, the need was identified for infrastructure planning specialists to plan activities in each raion. Community groups were established in each raion and developed potential subprojects. More than 100 sites were investigated during the planning process, and 32 subprojects were selected. 25. The second output was to improve selected infrastructures by providing funding limited to $500,000 for raions and $50,000 for jamoats. Improvements targeted (i) irrigation and drainage systems, (ii) road and bridge access, (iii) drinking water supply, and (iv) small-scale electricity generation and distribution. To ensure sustainability, communities were required to demonstrate adequate willingness to pay for O&M of the rehabilitated or newly built infrastructure, establish annual maintenance plans, and contribute financial support (10% of the total value of labor and materials). This output was achieved. 26. Of the 32 ADB-approved subprojects, 11 were roads and bridges ($1.98 million), 5 were rehabilitated irrigation systems ($0.65 million), 15 were rural water systems ($2.39 million), and 1 was a hydropower station ($0.24 million). A total of 23 subprojects ($3.806 million) were completed.10 The component was successful in ensuring user associations were formed to manage and maintain community infrastructure, and that raion authorities assumed responsibility to manage road and bridge infrastructure.
5. Project Management 27. This component’s outputs were (i) project managed effectively; and (ii) project monitored and evaluated effectively. The PMU was established within the Ministry of Agriculture (MOA) on 13 July 2007. ADB advanced $0.17 million from the ADB grant to finance PMU operations. A project steering committee was established on 14 December 2007 to provide policy guidance and facilitate inter-ministerial coordination.
10
ADB declared misprocurement and cancelled financing for four contracts ($0.62 million) for non-compliance with ADB’s Procurement Guidelines. A further five contract awards ($0.84 million) were not approved. These nine contracts were about 23% of the component’s total financing. These matters were referred to ADB’s Office of Anticorruption and Integrity for its review. The government subsequently provided $0.56 million to complete the four contracts that were cancelled.
7
28. The PMU was fully staffed, including an international social and gender consultant and a national gender specialist. While financial systems were established promptly, recruitment of international consultants and preparation of procurement documents were substantially delayed. The project performance management system was established only in 2009, and quarterly and annual reports were submitted regularly thereafter. The two outputs were partly achieved, as the work schedule and delivery of inputs were not conducted in a timely manner, resulting in delayed contract awards and limited monitoring and evaluation. Project management performance was constrained by staff capacity, high turnover of PMU staff, and difficulty in attracting competent staff due to low government salary rates. In addition, there was significant turnover of project directors. The first project director resigned in February 2013 and was replaced only in June 2013 by a second project director, who also resigned in February 2014. A third project director was appointed in May 2014, towards the project end. C. Project Costs 29. The total project cost was $15.28 million, against $23.30 million at appraisal. Costs comprised (i) $2.95 million from the loan, (ii) $7.63 million from the ADB grant, (iii) $2.36 million from the Global Environment Facility (GEF) grant, (iv) $1.90 million from government (including an additional $0.56 million for four civil works contracts), and (v) $0.44 million contribution from beneficiaries. Overall, ADB paid 85% of costs, the government paid 12%, and beneficiaries provided 3%. Details of project costs are in Appendix 4. 30. The principal reasons for reduced costs were (i) the cancellation of the credit line SDR2,691,000 ($4.1 million) on 5 June 2014; (ii) the cancellation and non-approval of several civil works contracts SDR815,532 ($1.20 million) on 19 November 2014, following two minor changes for partial cancellation of loan proceeds; and (iii) delays in consultant recruitment that shortened expenditure duration. While cost savings have a positive impact, more significantly the project’s benefits were reduced, bringing down its expected economic rate of return. 31. The revised loan balance was SDR1,930,827 ($2.95 million) after cancellation of the unutilized loan balance of SDR482,640 ($0.68 million) at loan closing of 12 February 2015. The balance of the GEF grant was reduced through a minor change for partial cancellation of $0.82 million due to non-award of a consultancy contract, resulting in a final balance of $2.68 million. The undisbursed balance of $0.67 million in the ADB grant was cancelled at grant closing. D. Disbursements 32. Loan disbursements totaled $2.95 million (including interest during construction of $0.04 million). This was 34% of the approved amount ($8.80 million equivalent or SDR5.92 million) due to cancellation of the credit line and some civil works contracts. ADB grant disbursements totaled $7.63 million (92% of the approved grant amount of $8.30 million). GEF grant disbursements totaled $2.36 million (88% of the revised grant amount of $2.68 million). 33. Delays in implementation of the loan and GEF grant caused delayed disbursement. Loan disbursements started only in 2011 (four years after effectiveness), following the award of three civil works contracts in 2010. The first GEF grant disbursement was made one and a half years after grant effectiveness, following the award of the implementation consultant contract. A breakdown of annual disbursement is in Appendix 5. 34. Imprest accounts were established in Agroinvest Bank with initial advances of $50,000 from the loan, $170,570 from the ADB grant, and $50,000 from the GEF grant for payments to
8
consultants, suppliers, and contractors. Starting October 2012, ADB applied direct payment procedure in local currency for payments to local contractors. At the same time, a minor change in implementation arrangements for the loan was approved to create two more imprest accounts within the Ministry of Finance (MOF), one for administration of the credit line and the other for the credit line itself. Only the imprest account for credit line administration was established on 14 January 2014, with an initial advance of $101,000. After cancelation of the credit line, the remaining balance of $91,130 was returned to ADB on 6 January 2015. The loan and grant accounts were closed on 12 February 2015. E. Project Schedule 35. The project was to be implemented over seven years, from March 2007. Implementation was negatively impacted by three significant issues: (i) a substantial delay in awarding the contracts and mobilizing international consultants; (ii) non-compliance with ADB’s Procurement Guidelines, followed by an investigation into potential fraud and collusion by the executing agency; and (iii) cancelation of the $4.1 million credit line. There were no extensions, however, to the loan and grants closing dates, as all activities were completed by 30 September 2014. 36. Recruitment of international consultants—for (i) implementation support, (ii) pasture land and sector assessments, and (iii) establishment and operation of agriculture and rural business advisory services and market intelligence system—was substantially delayed because of a government decision after project approval to impose income tax on international consultants. This was resolved on 24 November 2010, when Parliament ratified the loan and grant financing agreements. Slow mobilization of the implementation consultants further delayed the selection, design, approval, and construction of civil works. The implementation schedule is in Appendix 6. F. Implementation Arrangements 37. MOA was the executing agency, and the State Committee for Land Management was the implementing agency for outputs relating to pasture management. A PMU, led by a government-appointed, full-time director, was established in August 2007 within MOA to manage project activities and liaise with ADB. A high-level project steering committee was established on 14 December 2007 and initially met 10 to 12 times a year.11 It provided policy guidance and facilitated inter-ministerial coordination. 38. The implementation arrangements are considered adequate, and there were no major implementation changes. Quarterly and annual implementation progress reports were submitted on time to ADB and relevant government agencies. G. Conditions and Covenants 39. The project covenants were generally relevant and mostly complied with. Six covenants were associated with the credit line activity cancelled in February 2014 and were no longer applicable. One covenant, requiring semi-annual review missions during the initial implementation period, was not complied with, as only annual review missions occurred, with no missions in 2008. One covenant, on curricula for pasture land management, was partly
11
The project steering committee comprised MOA (chair) and representatives of the Office of the President, MOF, Agency for Land Management Geodesy and Cartography, State Committee on Investments and State Property Management, Ministry of Water Resources and Land Reclamation, State Committee for Environmental Protection and Forestry, Tajikistan Agricultural Academy of Sciences, raion administrations, farmers, private sector, nongovernment organizations, development partners, ADB, and the project director.
9
complied with due to the reduced scope of consultant activities. Three covenants were complied with late due to (i) the late awarding of consultancy services that delayed preparation of a sector assessment and legislation for sustainable pasture management; and (ii) delay in the baseline survey, which was not undertaken until 2010. 40. All ADB-funded projects in Tajikistan are subjected to a block audit. Except for the 2010 audit report, which was submitted more than a month late, audit reports were timely. The reports were found acceptable. The auditors provided unqualified opinion on (i) all audited project financial statements (fiscal years 2009 to 2014), and (ii) use of loan proceeds, compliance with imprest account, statement of expenditure procedures, and financial covenants. Implementation delays reflected in late covenant achievement reduced meeting some outputs. There were no modifications or cancellation of covenants. The status of compliance is shown in Appendix 7. H. Related Technical Assistance 41. A piggy-backed technical assistance (TA) grant for $0.60 million was approved on 29 January 2007. The TA, funded from ADB’s Technical Assistance Special Fund, was for three years, to be completed by 31 January 2010. The expected impact was improved economic and social development in the five project raions. The intended outcome was improved capacity in economic and social planning. The TA was to finance 12 person-months of international consultants and 108 person-months of national consultants. 42. The TA was designed to support the raions in developing appropriate approaches, systems, and procedures for planning and managing their development, and was to be implemented simultaneously with the infrastructure activities. However, due to (i) the substantial delay in infrastructure activities at community and raion levels; (ii) capacity-building activities already conducted by other agencies in some raions; and (iii) the availability of grant funds under the project’s grant-funded activities, no additional capacity building was deemed needed. The TA funds were cancelled and the account closed in February 2010 without any activity conducted or disbursement made. I. Consultant Recruitment and Procurement 43. Nine contracts were awarded: two with consulting firms to provide implementation support and capacity development; two with non-governmental organizations to establish agriculture extension and business advisory services and provide training; and five with local design institutes for design services. Recruitment followed ADB’s Guidelines on the Use of Consultants (2013, as amended from time to time). Three contracts were awarded through quality- and cost- based selection, and six contracts (each valuing up to $60,000) through single-source selection. The project contracted 170 person-months of international and 1,531 person-months of national consultant inputs, compared to 184 person-months of international and 2,076 person-months of national consultants envisaged at appraisal. 44. There were considerable delays in recruiting consultants. Only one proposal was received for the Capacity for Effective Land Management output, and the firm withdrew its offer during contract negotiations in October 2010. The scope of services was subsequently reduced and included in the terms of reference for the Sustainable Pasture, Arable, and Forestland Management consultant. Given the complementary nature of activities, Support for Agriculture and Rural Business Advisory Services and Market was combined into a single contract with Establishment and Operation of a Market Information System, to strengthen interest in this contract by increasing its value.
10
45. All civil works were procured through national competitive bidding, while goods were procured through shopping following ADB’s Procurement Guidelines. Procurement of civil works, however, was affected by non-compliance with the Procurement Guidelines. ADB advised the executing agency on 7 November 2013 that ADB would not support recommendations on five civil works contract awards, as the bid evaluation reports (BERs) did not accurately reflect information provided in the bids. ADB declared misprocurement on four previously awarded civil works contracts on 8 January 2014.12 The status of civil works and consultancy contracts is in Appendix 8, and the non-compliance with Procurement Guidelines is in Appendix 9. J. Performance of Consultants, Contractors, and Suppliers 46. Performance of the consultants, contractors, and suppliers was mostly satisfactory. Local civil works contractors performed satisfactorily, with most contracts being completed to an acceptable standard and on schedule. K. Performance of the Borrower and the Executing Agency 47. The project had three project directors. ADB raised concern about poor project management during several ADB missions. These concerns were raised with the Deputy Prime Minister in 2009 and MOF in 2010, and during the midterm review in 2011. There was improved leadership in the project’s closing stages. 48. The credit line’s delayed implementation and eventual cancellation resulted from the inability of government and ADB to agree on implementation arrangements after MOF rejected the role of financial intermediary. Implementation of the rural infrastructure development component was substantially affected by non-compliance with ADB’s Procurement Guidelines. The executing agency’s performance was less than satisfactory. L. Performance of the Asian Development Bank 49. Two project officers and two project analysts were responsible for administering the project. ADB initially focused on ensuring the PMU understood the intended objectives, scope, and process, and maintained effective support for daily matters and significant implementation issues through the Tajikistan resident mission and during project review missions. Overall, there was sufficient continuity in staffing and effectiveness to resolve issues and guide the PMU. 50. ADB assessed bid documents and approved the many civil works contracts generally within an acceptable time period. The PMU expressed concern about ADB’s slow response in approving BERs and reimbursing withdrawal applications. These delays resulted from inaccuracies and inconsistencies in the PMU’s BERs, and errors in the presented withdrawal applications, which required clarifications and resubmissions. Complications from contracts payable in Euro, currency exchange computation, and grant funding shortfalls following currency appreciation also delayed invoicing. ADB’s diligent review of bid proposals was instrumental in identifying non-compliance with Procurement Guidelines. ADB also undertook a special project administration mission, which worked collaboratively with the executing agency to examine and clarify procurement issues.
12
The bid reviews identified irregularities that were referred to ADB’s Office of Anticorruption and Integrity for further investigation.
11
51. ADB was initially slow to resolve the credit line implementation issue. ADB subsequently devoted considerable staff and consultant resources to resolve implementation problems and meet financial and integrity due diligence requirements for financial intermediaries and potential micro-finance institutions. Overall, ADB’s performance was generally satisfactory.
III. EVALUATION OF PERFORMANCE A. Relevance 52. The project is rated as relevant, as it was consistent at appraisal with the government’s development priorities as well as ADB’s country and sector strategies. Despite a change in ADB’s investment priorities in Tajikistan, rural development and agricultural infrastructure remain priorities in the Tajikistan National Development Strategy. Rural development is a high priority in all project raions, where more than 70% of the population is involved in agriculture-related activities. B. Effectiveness in Achieving Outcome 53. The project is rated less effective. Farm productivity for both irrigated and rainfed crops increased, with achievements of indicators higher than projected for rainfed crops. The delayed consultant recruitment shortened the duration of activities resulting in indicators on increased turnover of rural enterprise and farms reaching commercial production levels (25%) not being measured. Achievement of outputs was also affected by the shortened implementation timeframe, including cancellation of the credit line and some civil works contracts. C. Efficiency in Achieving Outcome and Outputs 54. The use of project resources is rated as efficient based on a combination of the measured economic internal rate of return (EIRR) and inclusion of non-quantified benefits. An analysis of benefits from improved returns from cropping and livestock farming brought about by the project and the project costs yields a base case EIRR of 12.9%. This assumes only 80% of full potential project benefits are achieved by 2020, 2 years later than was assumed at appraisal. This reflects delays in implementation, reductions in scope—including the cancellation of the microcredit activity—and the uncertainty of the future operations of the agricultural advisory centers and MIUs. 55. If the extremely conservative assumption is taken of no growth in crop and livestock benefits beyond the end of 2015, the EIRR would be 5.9% (see Appendix 10). Given the non-quantified benefits generated by much of the project costs (see paras. 57 and 58) and the likelihood that the strongest advisory agencies established under the project will continue to operate, the 12.9% EIRR is appropriate for the base case. 56. The base case analysis does not take into account the economic and social benefits of component 4 (rural infrastructure rehabilitation) subprojects. One approach to evaluating these benefits is to exclude component 4 costs from the economic analysis. This assumes the economic and social benefits are at least equal to their costs. An analysis of the subprojects’ costs per beneficiary suggests this is a conservative assumption, especially given the health-related benefits from improved water quality in village-level potable water schemes. Excluding component 4 subproject costs, the EIRR is 15.5%. This is comparable to an EIRR estimated at appraisal of 18.0%. At appraisal, the project’s EIRR calculation also excluded component 4 costs. If there is no increase in economic benefits beyond 2015, the EIRR will be only 8.9%,
12
significantly below 12.0%, even with component 4 costs excluded. However, this is unnecessarily conservative, as some growth in future benefits is expected, even given the difficulties faced by the agricultural advisory centers and MIUs. 57. The economic analysis is conservative in that it does not consider project benefits outside the project area. Component 1 (policy and institutional development) and component 2 (improved pasture, arable, and forest land management) in particular are expected to have benefits for crop and livestock farming beyond the project area. D. Preliminary Assessment of Sustainability 58. The project is rated less likely sustainable. The outputs of component 1 (policy and institutional development and reform), component 2 (sustainable land management), and component 4 (rural infrastructure development) are likely to be sustainable, with land tenure reform enacted, land certificates issued, a pasture law in place, and rural development committees and PUSs established and self-funded. The rural infrastructure O&M requirements are met by local government agency funding for roads and bridges, while local water users associations collect fees and maintain the irrigation and village potable water schemes. There appears to be strong community ownership of these facilities. However, the outputs of component 3 (agriculture and rural business support), such as the agricultural advisory centers and MIUs, are less likely to be sustainable. These agencies, while having some ongoing contracts with farms and rural credit institutions to fund future operations, have had to hand over their project vehicles and equipment to the government, under Order #92 by the President of the Republic of Tajikistan, 2013. Only the strongest of these organizations are likely to be sustainable. E. Impact 59. Farm level. At the farm level by 2020, the project will result in improvements in annual farm income for irrigated dekhan farms (TJS8,117–TJS8,768), rainfed dekhan farms (TJS5,030–TJS1,364), and collective dekhan farms (TJS489,760–TJS580,774) (see Appendix 10). However, these increases are in part dependent upon services provided by agricultural advisory centers being sustainable. 60. Poverty impact. At appraisal, the project aimed to reduce the number of poor households in the project area by 25%. The baseline and project completion surveys show that in the project area the percentage of “poor” households (defined as an average monthly income per person within the household of TJS61-100 [$11–$17]) reduced from 41% in 2010 to 36% in 2014, or a 12% reduction rate. The percentage of “very poor” households (defined as an average monthly income per person within the household of below TJS6 [$11]) reduced from 26% in 2010 to 22% in 2014, or a 15% reduction rate.13 However, it should be noted that:
(i) Inflation of about 30% occurred in Tajikistan between 2010 and 2014; therefore the “poor” and “very poor” thresholds should have been increased by 30% to maintain constant purchasing parity; and
(ii) Household income in the project area is a function of both on-farm and off-farm income. The project completion surveys identified an increase in off-farm annual income per household between 2010 and 2014 of 92%, from TJS3,601 ($630) to TJS6,908 ($1,208). Much of this near doubling of off-farm income is a result of non-project-related factors (e.g., increased remittances from household members
13
See impact evaluation results for the “Rural Development Project”; Znaniya, 2014.
13
working in Dushanbe or overseas). The slowdown of the Russian economy in 2014 and 2015 is likely to have reduced the level of remittances to the project area and elsewhere in Tajikistan, and will continue to do so until the Russian economy recovers.
61. While it is unlikely the appraisal target to reduce the number of poor households by 25% had been achieved by 2014, with the full impacts not expected to be felt until 2020, the project is likely to eventually have a significant positive impact in reducing poverty levels. This is borne out by the potential for significant increases in farm incomes expected from the project. 62. Environmental and social impacts. The project was classified under environmental category B and involuntary resettlement and indigenous peoples’ category C, and had no adverse environmental and social impacts. Semi-annual environmental monitoring reports were submitted and disclosed on the ADB website. The rural infrastructure subprojects were assessed for environmental compliance before approval and funding, reviewed during ADB’s country safeguards review missions, and found compliant. There was no resettlement, and no complaints were received. Positive impacts are expected in reduced land erosion from component 2 activities.
IV. OVERALL ASSESSMENT AND RECOMMENDATIONS A. Overall Assessment 63. The project was implemented within budget and completed on time. The project is considered relevant to the needs of farming communities and country strategies. Although delayed, most project activities occurred, with the exception of the credit line, and many performance targets were achieved or partially achieved. Outputs that were less effective and efficient were a result of delayed implementation. However, despite the successful development of community associations to manage systems and collect fees, the project is less likely sustainable. Overall, the project is assessed as less than successful.
B. Lessons 64. Effective implementation is strongly linked to the quality of project management. Implementation suffered from poor leadership and a lack of focus on activities and outcomes by the first two project directors. This was reflected in the non-compliance with ADB’s Guidelines on the use of Consultants and Procurement Guidelines, and the non-implementation of ADB-approved activity changes. These resulted in delays and reductions in project scope. 65. The large number of civil works contracts was an administrative burden on both the Ministry of Agriculture (MOA) and ADB. Given the similarity of some rural infrastructure subprojects (e.g., the village potable water supply schemes), it should have been possible to group subprojects into fewer contracts to be more manageable, allowing MOA to focus more on implementing the other components more directly related to enhancing agricultural performance. 66. The project had too many DMF indicators, some of which were poorly defined and hence not properly measured, set too high for the activities to achieve, without clearly defined targets.14 Component 3 could only pilot technologies within the implementation period, hence
14
The report and recommendation of the President stated that indicators without targets would be identified during the baseline survey, to be conducted within the first 6 months of implementation. However, the baseline was not
14
the large-scale raion impacts could only be achieved many years after adoption. Project management did not have the capacity to prioritize the DMF indicators. 67. Some payment delays occurred as a result of mistakes in withdrawal applications because of the complexities of cost sharing between the Global Environment Facility and Asian Development Fund grants. Simplified consistent arrangements should have been established. 68. The project benefited from involving women in the planning process of infrastructure projects. There was strong community ownership; the structures targeted community needs; and in many cases women led the operation and maintenance of structures. This contributes strongly to the investment’s long-term sustainability. 69. Implementation of the credit line would have been more successful if (i) financial and integrity due diligence was conducted of financial intermediary and microfinance institutions at appraisal, and (ii) necessary project and subsidiary loan agreements were signed. Having signed agreements between MOF, microfinance institutions, and ADB may have prevented MOF relinquishing its role as financial intermediary after project approval. 70. The project showed commendable flexibility in implementing new activities (e.g., establishing veterinary centers) in response to beneficiary needs. As a result, the project has strong community support and ownership (e.g., infrastructure, veterinary centers, PUSs). This should ensure sustainability. 71. At appraisal and during implementation, establishing demand-driven agricultural advisory centers and MIUs that were autonomous from government was seen as an essential project component. There was a desire for the organizations to be on a secure financial footing with farmers contracted to pay for advice they received. However, the transfer of project vehicles and equipment procured for them to government agencies, including MOA, risks the centers’ sustainability. At design or during implementation, steps need to be taken to clarify the future ownership of such assets. Alternatively, no attempt should be made to establish these types of organizations if it is possible they will operate only during implementation. C. Recommendations 72. The following recommendations apply as follow-up actions, and for future project design and implementation.
1. Project Related
(i) It is recommended that MOA (a) extend PUSs to new regions and expand component 3 activities to new areas within the five raions; and (b) monitor the performance of water users associations and community water associations in fee collection and O&M to ensure sustainability of the project structures.
conducted until August 2010 and did not identify all indicators. The missing DMF targets were not updated. Moreover, it is not clear how the baseline survey could set target numbers for master farmers trained, farmers adopting improved practices, and entrepreneurs trained.
15
2. General
(i) Commitment to effective implementation performance of ADB-financed projects should be confirmed at the highest levels of government during country-programming exercises. Executing agencies should have training in ADB’s anticorruption policies and be aware of the requirements to comply with the Procurement Guidelines.
(ii) The project had too many components and activities. The design of rural development projects should be kept as simple as possible with two or three major components and fewer main activities to allow more focus on implementation by the executing agency as well as ADB.
(iii) The project design was appropriate. However, when the executing agency has
limited experience implementing ADB projects or has identified capacity weaknesses, and the project has leadership difficulties, greater supervision from ADB and its resident mission is required.
(iv) There needs to be a more effective review mechanism to ensure the appointment of project directors with appropriate capacity and interest in achieving outcomes and impacts.
(v) PMU staff should be permanent staff of the executing agency, particularly the project director and other staff in charge of strategic areas, such as procurement and financial management. This would improve the executing agency’s institutional capacity.
(vi) The DMF indicators need to be adequately defined, measurable, and specific to the project area, and be limited to those that are needed.
(vii) It is necessary to clarify the tax liability status of consultants at appraisal to avoid unnecessary delays in contract award and implementation.
(viii) Proper due diligence and selection of financial institutions should be completed before project approval. This would avoid delays and activity cancellation during implementation.
16 Appendix 1
PROJECT DESIGN AND MONITORING FRAMEWORK
Design Summary Performance Targets/Indicators Achievements at Project Completion
Impact
Farm and nonfarm incomes of rural households increased
Farm incomes of rural households increased from TJS200 to TJS580 (rainfed farms) and TJS800 (irrigated farms). Nonfarm incomes of rural households increased by 35%. Number of poor households reduced by 25%.
Farm income of rural households in 2014 (rainfed and irrigated): TJS9,545 (real term TJS5,250) - crop farming – TJS3,952 (real term
TJS2,174) - livestock farming – TJS2,685 (real term
TJS1,477) - fisheries – TJS1,191 (real term TJS655) - other sources – TJS1,716 (real term
Percentage households (less than TJS60/person/month): 2010–26%; 2014–22%
Outcome
Productivity of farms and rural enterprises in five project raions
increased within an environmentally sustainable management framework
Yields (t/ha) increased by 2014: Rainfed: Wheat – 1.4 to 1.7 Potato – 10 to 12.5 Orchards – 1 to 1.5 Fodder – 20 to 24 Irrigated: Wheat – 3.0 to 3.8 Potato – 22.5 to 29.5 Orchard – 2.2 to 4.2 Fodder – 40.0 to 48.0 25% of participating farms reach a commercial level of production (more than 50% of produce sold for cash). Rural enterprise turnover increased.
Survey yields (t/ha): Rainfed (achieved): Wheat – 2.2 Potato – 25.3 Orchards – 2.6 Fodder – 26.4 Irrigated (partly achieved): Wheat – 3.4 Potato – 25.6 Orchards – 2.8 Fodder – 26.0 Not measured by baseline and project completion surveys. Not measured by baseline and project completion surveys.
Outputs
1. Policy and Institutional Development and Reform
1.1 Land use rights secured
Raion administrators operate efficient, transparent, fair, and effective land registration systems by end year 3. 100% of dekhan farms have land certificates (30% owned by women). Incidents of land disputes identified and resolved.
Not measured by baseline and project completion surveys. 97% land certificates distributed (15% owned by women). Estimate of 77% resolved.
Appendix 1 17
Design Summary Performance Targets/Indicators Achievements at Project Completion
1.2 Policies and institutions for pasture lands improved
National policy and strategy for pasture land and livestock management by year 2. Institutions for pasture and land management restructured by year 6. Legislation approved by year 4. Equitable access to all categories of pastures.
Yes, late. Sector assessment completed April 2012, endorsed by Government of Tajikistan on September 2012. No. Restructuring of institutions was outside the project capacity to influence. Approved late. Legislation was passed 19 March 2013. Not measurable, although this is part of new pasture law.
1.3 Administration and institutional aspects of business development improved
Streamlined business registration process installed in all raions by year 3. Reduced registration time. Reduced inspection frequency. Incidence of business interference by raion authorities eliminated by 2014.
Yes. Achieved by "one-stop shop" process (outside of project activities). Yes. Achieved by "one-stop shop" process (outside of project activities). Not achieved. Activity not included in a contract addendum as expected. Not achieved. Activity not included in a contract addendum as expected.
2. Sustainable Land Management (Pasture, Arable, and Forest)
2.1 Pasture and livestock planning and management skills demonstrated
At least 5 pasture user groups established by year 3. At least 4 pilot sites established, based on at least 2 different livestock production systems and reformed pasture land and management systems by year 2. Methodologies for reorganization of pasture land administration and tenure extended by raion authorities to all areas by year 4. Land condition and associated biodiversity status improved by year 6. Winter feeding and economic performance improved by year 6. New approaches and techniques for monitoring livestock and pastures adopted by raion authorities by year 4.
Established late. 10 groups established by 2012. Yes, late. 10 sites established. 26 livestock demonstrations conducted in 6 villages. Yes, late. 8 pasture plans developed in 8 villages in 4 raions. Delayed implementation. Not measured. Delayed implementation. Not measured. Delayed implementation. Not measured.
2.2 Capacity for effective land management improved
Pasture land planning and management graduates trained by year 5. Trainers demonstrate competency in new approaches and techniques.
Yes, completed late. Short training course for 25 postgraduates and 20 government officials completed (reduced project contract 2). Teaching techniques improved, new facilities were utilized, and a pasture manual was produced. Trainers were provided with
18 Appendix 1
Design Summary Performance Targets/Indicators Achievements at Project Completion
Institutional link established between foreign and local training institutions by year 4.
lectures for 3 training courses. Yes, late. Links were established with a Chinese institution in 2013 and US institutions.
2.3 Degraded lands rehabilitated
35% of farmers practice appropriate land management techniques. Farming on sloping land above 30 degrees eliminated. 25% of pasture and sloping agriculture land managed sustainably. 20% of degraded arable land rehabilitated. At least 5 community forest groups established by year 2.
Was not able to measure, and beyond project scope to influence. Was not able to measure, and beyond project scope to influence. Was not able to measure, and beyond project scope to influence. Was not able to measure, and beyond project scope to influence. Achieved (10 groups established). PUCs also involved in agroforestry activities.
3. Agriculture and Rural Business Support
3.1 Demand-driven farm and rural business advisory services established and operated
Advisory centers established. _ master farmers trained and competent to deliver required training (40% women).
a
_ farmers adopt improved farming practices.
a
Service centers privatized by year 5. Staff of appropriate agriculture training institutions competent to deliver farm management, extension, and farm business development courses. Enterprises supported and established or expanded. Diversity of enterprises increased. Contracts developed with marketing outlets and agribusiness. Export links established and maintained. Up to _ entrepreneurs trained in organizational, management, and financial arrangements for business enterprises.
a
Yes. 4 centers established. Undetermined. 2,000 farmers received inputs and support (40% women). Undetermined. 1,658 farmers adopted improved practices. Partial. Financially independent but not privatized. Yes. TAU staff involved in NGO training program. Yes. 57 enterprises supported and established or expanded. Undetermined: (i) farmers or entrepreneurs learned to plan and manage businesses, (ii) access to marketing information system to determine profitable marketing channels established; (iii) capacity to obtain and use agricultural loans increased; (iv) capacity to develop contracts with dealers and processors for supply and sale of agricultural products improved. Undetermined. 24 contracts developed. Not measured. Undetermined. 60 entrepreneurs trained.
Appendix 1 19
Design Summary Performance Targets/Indicators Achievements at Project Completion
3.2 Market information system operationalized
Market information regularly reaches 50% of farmers. Number of farmers requesting services and willing to pay
Not achieved. Estimated 15% achievement. (2,000 dekhan farmers received weekly bulletins out of 13,300 dekhan farms in 5 raions.)
Not achieved. Delay in implementation limited time to create demand for services.
4. Rural Infrastructure Development
4.1 Raion and jamoat infrastructure planning and maintenance capacity improved
Infrastructure plans developed for sectors with projects being submitted for project financing. Each project proposal includes realistic physical and financial maintenance plan.
Yes. Subprojects sourced from raion infrastructure plans submitted after 2011. Yes. Physical and financial maintenance plans included in subproject proposals.
4.2 Raion and community infrastructure improved with sustainable O&M arrangements
Raion and community infrastructure projects completed with 100% O&M funding. User associations formed and responsibilities for O&M agreed on for each relevant project site. Raion administrations establish effective systems for maintenance. Infrastructure effectively maintained.
Undetermined. 23 contracts completed with ADB financing; 4 contacts completed using government financing. Yes: (i) 11 roads and bridges maintained by public road maintenance department; (ii) 12 water supply, irrigation, small hydropower managed by communities through user associations. Yes. Raions accepted road and bridges for maintenance responsibility. Delay in implementation meant not effectively measured. Processes in place for effective maintenance.
5. Project Management
5.1 Project managed effectively
Work schedule and delivery of inputs and outputs for the project implemented in a timely manner. Project progress reported accurately and comprehensively to government and ADB in a timely manner.
No. Contracts awards were substantially delayed during early project stages. Yes. Project reporting was on time from 2009.
5.2 Project monitored and evaluated effectively
Effective project management and monitoring systems, including project performance management system, operationalized.
Yes. M&E systems established.
ADB = Asian Development Bank, ha = hectare, M&E = monitoring and evaluation, NGO = nongovernment organization, O&M = operation and maintenance, PUC = pasture users committee, t = ton, TAU = Tajikistan Agrarian University. a
The report and recommendation of the President stated that indicators without targets would be identified during the baseline survey, to be conducted within the first 6 months of implementation. However, the baseline was not conducted until August 2010 and did not identify all indicators. The missing DMF targets were not updated. Moreover, it is not clear how the baseline survey could set target numbers for master farmers trained, farmers adopting improved practices, and entrepreneurs trained.
Source: Asian Development Bank.
20 Appendix 2
GENDER ACTION PLAN
1. A gender action plan (GAP) was formulated, and achievements against the GAP activities and design and monitoring framework indicators are reported in the following tables. Most activities were completed, and the project from a gender perspective is rated successful. The project design was highly relevant in addressing the needs of women in the project raions, with targets for participating in user committees and trainings largely met. Only two GAP activities (3e and 3f) were not addressed or measured.
Table A2.1: GAP Activities and Achievements
GAP activities Achievements at Project Completion
1. Policy and Institutional Development and Reform
а. Gender and development issues will be pursued through the inclusion of gender-related aspects in dialogue with central government and local district authorities, stakeholder meetings, and other forums initiated during the project.
Seminars on explanation of one-stop shop system—229 participants (31% women)
Land certificates—1,264 issued (7% to women) Number of farm members: - Dekhan 1,820 (15% women) - Collective 289 (22% women)
b. All women with a land allocation will have land-use
rights certificate. Number of dekhan farms with certificates—11,543 (8% women representatives)
c. Legal awareness programs for district officials will explicitly recognize woman’s greater exposure and vulnerability to the unequal and non-transparent allocation of land during land reform.
Seminars on raising legal awareness on jamoat
level—952 participants (11% women)
d. Up to 50% of beneficiaries will participate in legal literacy and aid initiatives aimed at strengthening the knowledge of local communities on land code related rules, processes, and institutions at the district and jamoat levels.
Advisory centers formed 100 farmer groups in pilot districts on vegetable growing, livestock, and potato cultivation. Each group consists of 20 people, 40% of whom are women.
e. At least 15% of individuals identified for the survey of recent or current practices in land registration in the project areas will be women.
Women were involved in all training seminars on district and jamoat levels in pilot districts.
2. Sustainable Land Management (Pasture, Arable, and Forest)
a. Pro-gender approaches will be introduced into policy development associated with pasture, arable, and forest land improvement, and improvements in the rural business environment.
Seminars by pasture user community on “Law of the Republic of Tajikistan on pastures”—205 participants (38% women) PRA survey for the sector assessment—709 participants (34% women) Trainings on resource management—168 participants (41% women) International conference “Improvement of Pasturelands”—160 participants (16% women) Pasture user associations established—63 committee members (33% women)
Appendix 2 21
GAP activities Achievements at Project Completion
b. The gender and development approach will be incorporated into curricula on pasture land management.
Seminar on “Sustainable pasture, arable land, and forestry management”—100 participants (30% women) Seminar on “Restoration and planting of greenery of pasture lands—methods and development”—60 participants (17% women)
c. Up to 50% of the participants in training for farm-level planning and management of pasture land based livestock production systems will be women.
Training on community mobilization—264 participants (34% women) Training on resource management—182 participants (34% women)
3. Agricultural and Rural Business Support 138 practical trainings were conducted following the set plan on potato growing, planting of greenery, livestock breeding, gardening, bee-keeping, and poultry keeping. 1. Faizabad district—39 trainings, 635 participants
a. Agricultural and rural business advisory centers will be staffed with a social development and gender specialist to ensure outreach to rural women.
Advisory centers established in Q3 2013, staffed with specialists on gender development and social development for the inclusion of rural women.
b. The advisory centers will set a realistic annual target for outreach to women clients (dekhan farmers, households, and rural businesses), based on the situation in each district.
31 staff in four centers (26% women). 100 farmer groups, each consisting of 20 people (40% women). Focus group participants—1,245 people (35% women)
c. The advisory centers will target business planning for farm and non-farm enterprise development appropriate to women’s interests and needs.
132 trainings (potato production, livestock management, bee keeping, poultry production)—2,482 participants (28% women) Training seminar on “Dekhan farms management, making of business plan”—100 farmer groups consisting of 20 people each (25%–30% women)
d. Participatory technology development methodologies will be gender sensitive.
Organized groups of farmers in different areas of agriculture in each jamoat of the pilot districts involved the active participation of women. Educational trainings—721 participants (23% women)
e. Up to 50% of formal and informal trainings-of-trainer programs will be participated in and facilitated by women.
Train-the-trainer activities undertaken, but women’s participation not measured.
22 Appendix 2
GAP activities Achievements at Project Completion
f. Up to 50% of the certified holistic management will be women.
g. Field visits will be structured to accommodate the specific needs of women.
Field trainings undertaken—women’s needs not measured.
4. Rural Infrastructure Development
a. Up to 50% of participants in community-based groups and stakeholder consultations to identify local needs and prioritize possible investments will be women.
547 rural mahalla community organizations formed, 23,479 participants (52% women). 5 district working groups formed, 74 participants (47% women). 48 executive committees formed, 464 members (50% women).
b. Information for all public consultations will be made available to women at convenient times and locations.
Women actively participated in focus group meetings (40%–80% attendance).
c. Female community facilitators will be employed to support public consultations and development of local maintenance units and user groups.
Active women among the members of mahalla committee. Number of female facilitators not measured.
d. A 30% quota target will be adopted for women’s membership and leadership in local maintenance units or user groups.
There are 100 farmer groups, and each group consists of 20 people (40% women).
5. Project Management
a. A gender and social development specialist will be employed by the PMU.
International Social and Gender Consultant joined PMU in May 2009. Local Gender Specialist appointed from July 2009 to January 2014.
GAP = gender action plan, PMU = project management unit, PRA = participatory rural assessment. Source: Asian Development Bank.
Table A2.2: DMF Achievements
DMF Indicator Type Target Achievement
100% of dekhan farms with land certificates (30%
of farms owned by women)
% 100 97% land certificates distributed (15% owned by women)
xx master farmers trained and competent to deliver required training (__% of them women)
number imprecise 100 agriculture groups (2,000 farmers) received inputs and are supported for further dissemination (40% of members are women)
DMF = design and monitoring framework. Source: Asian Development Bank.
Appendix 3 23
CREDIT LINE
1. The designed implementation arrangements for the credit line (report and recommendation of the President para. 49) were subsidiary loan agreements (SLAs) between the Government of Tajikistan through the Ministry of Finance (MOF) and microfinance institutions (MFIs), and project agreements between the Asian Development Bank (ADB) and the MFIs. MOF was to act as the financial intermediary and lend funds directly to the MFIs. Following project approval, MOF notified ADB that it would not directly lend to MFIs, and that the National Bank of Tajikistan would act as the financial intermediary. On 23 October 2009, ADB advised MOF that based on international good practice the National Bank of Tajikistan should not act as the intermediary, and to identify a suitable commercial bank. In further discussions, MOF reconfirmed its unwillingness to be the intermediary. 2. During the November 2010 review mission, MOF confirmed its nomination of Agroinvestbank to act as financial intermediary. However, following ADB’s internal financial due diligence analysis, this bank was deemed ineligible. The MOF alternative nomination of Tajiksodirot bank was also deemed ineligible, following ADB’s integrity due diligence analysis. Following failure to identify an eligible commercial bank as financial intermediary, ADB, during the April 2012 annual review mission, informed the government of the possible need to cancel the credit line. 3. In June 2012, in a meeting with ADB missions for the Rural Development and Access to Green Finance projects, MOF agreed to act as the financial intermediary for both projects and to establish a project management office to implement the credit lines. The two project teams, joined by the Building Climate Resilience in the Pyanj River Basin project team, worked to implement credit lines. Financial due diligence began in August 2012, and integrity due diligence in March 2013. Upon completion of the due diligence, two MFIs, IMON and ARVAND, were determined eligible to participate. However, the integrity due diligence analysis identified some issues concerning lack of compliance with anti-money laundering and combating financing of terrorism (AMLCFT) requirements. Consequently, ADB established several compliance conditions prior to initial disbursement of credit line funds to the MFIs. 4. During the April 2013 review mission, ADB discussed some issues with MOF, including number of participating MFIs, terms and conditions of the loan, SLAs, and provision of collateral by MFIs. MOF continued discussions to change some conditions and to impose collateral on MFIs, which was rejected by ADB. Following this, in a letter dated 31 May 2013, MOF requested ADB to cancel the credit line and redirect the resources to other priority areas in Tajikistan. 5. On 19 July 2013, the government requested ADB to continue with credit line implementation. In ADB’s response (29 July 2013), it agreed: (i) MOF would on-lend to MFIs at an annual interest rate of 15% in TJS, for a period of five years without a bank guarantee; (ii) additional items on legal protection would be included in the SLAs; and (iii) MOF would propose a third MFI that meets ADB financial and integrity due diligence criteria. 6. MOF submitted draft SLAs on 23 August 2013, and ADB commented on these on 10 September 2013. Draft project agreements were prepared. On 14 February 2014, ADB advised the government of its decision to cancel the credit line activity due to limited anticipated impact by further continuation, with physical completion due on 31 March 2014. At this stage, the MFIs had not met compliance conditions regarding AMLCFT, the MOF project implementation unit was not fully staffed and operational, and project agreements and SLAs had not been signed.
24 Appendix 4
PROJECT COSTS
Table A4.1: Detailed Cost Estimate by Expenditure $ (million)
ADB = Asian Development Bank, GEF = Global Environment Facility. Note: (i) Includes project management, which was created under the loan, (ii) Figures may not add exactly due to rounding. Source: Asian Development Bank.
App
end
ix 4
25
26 Appendix 4
Table A4.3: Detailed Cost Estimate by Component $ (million)
Appraisal Actual
Local Currency Total Cost
A. Investment Cost 1. Policy and Institutional Development and
Reform 2.10 2.15 2. Sustainable Land Management (Pasture, Arable, and
Forest) 4.17 2.45 3. Agriculture and Rural Business Support 6.27 0.63 4. Rural Infrastructure Improvement 6.18 4.79 5. Project Management 3.05 5.22
Subtotal 21.77 15.24
B. Contingencies 1.16 0.00 C. Financing Charges During Implementation 0.37 0.04 Total Project Cost 23.30 15.28
Source: Asian Development Bank.
ANNUAL DISBURSEMENT ($’000)
Table A5.1: Grant 0111 Disbursement
Category Code 2010 2011 2012 2013 2014 Total
3101 Consulting Services 96,644 527,968 320,771 412,603 260,514 1,618,500 3301 Studies and Survey 165,162 22,321 3,186 13,537 204,206 3601 Equipment and Materials 40,057 33,703 22,958 49,825 146,543 3801 Extension and Training 56,509 110,361 225,509 392,379 Total 96,644 733,187 433,304 549,108 549,385 2,361,628
1: Policy and Institutional Development and Reform
1.1. Land use rights secured
1.2. Policies and institutions for pasture lands improved
1.3. Administration and institutional aspects of business development improved
2: Sustainable Land Management (Pasture, Arable, and Forest)
2.1. Pasture and livestock planning and management skills demonstrated
2.2. Capacity for effective land management improved
2.3. Degraded lands rehabilitated
3: Agriculture and Rural Business Support
3.1. Demand-driven farm and rural business advisory services established and operated
3.2. Market information system operational
4: Rural Infrastructure Development
4.1. Raion and jamoat infrastructure planning and maintenance capacity improved
4.2. Raion and community infrastructure improved with sustainable O&M arrangements
5: Project Management
5.1. Project managed effectively
5.2. Project monitored and evaluated effectively
O&M = operation and maintenance. Legend: = Planned, = Actual. Source: Asian Development Bank.
28 A
ppe
ndix
6
Appendix 7 29
STATUS OF COMPLIANCE WITH LOAN COVENANTS
Covenant
Reference in Loan
Agreement
Status of Compliance
Financials
The MFI shall furnish to ADB quarterly reports on the execution of the project and on the use of the Subsidiary Loan proceeds, including without limitation, information on loan disbursements disaggregated by gender. Such reports shall be submitted in such form and in such detail and within such a period as ADB shall reasonably request, and shall indicate, among other things, progress made and problems encountered during the quarter under review, steps taken or proposed to be taken to remedy these problems, and proposed program of activities and expected progress during the following quarter.
Project Agreement III, para. 3
Not applicable. Credit line cancelled.
The Beneficiary shall maintain or cause to be maintained, separate accounts for the Project, including separate accounts for the Loan and the Grant. [Financing Agreement, Article IV, Section 4.02 (a)]
Article IV, para. 4
Complied with.
The Beneficiary shall have such accounts and related financial statements audited annually, in accordance with appropriate auditing standards consistently applied, by independent auditors whose qualifications, experience and terms of reference are acceptable to ADB. [Financing Agreement, Article IV, Section 4.02 (a)]
Article IV, para. 4
Complied with. All ADB-funded projects in Tajikistan are subject to a block audit. Independent.auditors were recruited using QCBS.
The Beneficiary shall ensure that only MFIs meeting the following criteria shall be eligible to participate in the project: the MFI (i) is financially sound; (ii) has adequate credit and risk management policies, operating systems and procedures; (iii) is compliant with prudent regulations; (iv) has acceptable corporate and financial governance and management practices; (v) has sound business objectives and strategy and/or plan; (iv) has autonomy in lending and pricing decisions; (vii) has adequate policies, systems and procedures to assess and monitor impacts of Subprojects; and (viii) has environmental screening processes acceptable to ADB.
Schedule 5, para. 13
Complied with. Financial due diligence complete in 2012. Integrity due diligence completed in March 2013
The Beneficiary shall ensure that the MFIs on-lend the portion of the loan proceeds allocated for the purpose of establishing a Credit Line at qualified MFIs working capital and on-farm and business investments for the development of agricultural production by small rural borrowers, farmers and rural entrepreneurs in the project raions (a) only to eligible Sub-borrowers who have business plans, commercially viable subproject proposals, adequate collateral and financial rates of return, and demonstrated payment capacity and (b) pursuant to loan agreements denominated in TJS with such Sub-borrowers upon terms and conditions
Schedule 5, para. 14
Not applicable. Credit line cancelled.
30 Appendix 7
Covenant
Reference in Loan
Agreement
Status of Compliance
acceptable to ADB. Subject to the procedures agreed with ADB, the MFIs will have full authority to select Sub-borrowers, approve Sub-borrower loans, and determine lending terms.
ADB shall approve (a) the first Sub-borrower loans to be provided to Sub-borrowers by any MFI and (b) any individual Sub-borrower loan exceeding $10,000 equivalent. Thereafter, each such MFI shall approve all Sub-borrower loans to Sub-borrowers in the amount of $10,000 or less or in other amounts as may be agreed between the Beneficiary and ADB from time to time. The Beneficiary shall ensure that (a) each Sub-borrower loan proposal provides sufficient evidence of its eligibility under the agreed criteria and is prepared and in accordance with the detail and quality required to enable ADB or the MFI, as appropriate, to assess the viability and suitability of such Sub-borrower loan and related subproject and (b) all relevant documents forming the basis for the selection and inclusion of each Sub-borrower loan are made available to ADB upon request.
Schedule 5, para. 15
Not applicable. Credit line cancelled.
ADB and each MFI shall jointly review the on-lending arrangements from such MFI to the Sub-borrowers on a regular basis as required to ensure compliance with the terms and conditions of the applicable Subsidiary Loan Agreements and Project Agreements. Based on the results of these reviews, the on-lending arrangements may be adjusted as required.
Schedule 5, para. 16
Not applicable. Credit line cancelled.
Within six months of the Effective Date, the Beneficiary shall establish appropriate and adequate financial and accounting control systems that will support the PMU’s ability to apply international accounting standards in connection with the project. Thereafter, the Beneficiary shall ensure that the PMU applies international accounting standards to the project.
Schedule 5, para. 29
Complied with. According to the audit reports International Public Sector Accounting Standard for financial reporting under cash basis of accounting is used.
In the event the funding from the Global Environment Facility cannot be obtained (a) the support for pasture management field trials, demonstrations, and training and (b) the establishment of a pastures management program at a selected university or vocational level institution under Component 2 shall not be financed under the Project. Alternatively, the Beneficiary may make other arrangements necessary to cover the funding shortfall, resulting from the lack of the Global Environment Facility grant, acceptable to ADB.
Schedule 5, para. 36
Financing agreement with GEF signed.
Others
Project implementation shall be guided by the Project Steering Committee (PSC). The PSC shall meet monthly during the initial four months after the Effective Date, and on a semi-annual basis thereafter. The PSC shall be maintained until project completion.
Schedule 5, para. 2
Complied with. PSC met as required in initial stages and during implementation of project.
Appendix 7 31
Covenant
Reference in Loan
Agreement
Status of Compliance
SCLM shall implement the following outputs: (i) output 1.2 Component 1 and (ii) all outputs under Component 2. In relation to the foregoing activities, SCLM shall be responsible for (a) the direct day-to-day management, (b) participating in all committees for procurement and consulting services, and (c) preparing quarterly monitoring and evaluation reports for submission to the PMU, the Central Asia Countries Institute for Land Management, the Global Environment Facility and ADB. SCLM shall provide reports to the PMU.
Schedule 5, para. 3
Complied with. Project tasks are complete
Fielding of Consultants Established, Staffed, and Operating PMU or PIU
Schedule 5, para. 4
Complied as part of effectiveness condition.
The PMU shall be responsible for the day-to-day coordination and overall implementation of the project, including matters of procurement, accounting, monitoring, reporting, establishing processes for community participation, coordinating with NGOs, monitoring and reporting on project implementation, and coordinating with ADB on project-related matters. The PMU shall (a) ensure the project is implemented in accordance with the design specifications; (b) ensure effective interagency coordination; (c) ensure compliance with environmental and other social safeguard requirements; (d) maintain appropriate accounts, including detailed reports on withdrawal applications and disbursements; (e) manage the procurement process in accordance with ADB’;s requirements; and (f) prepare quarterly and other required progress reports in form and substance acceptable to ADB. Within (a) one month of the Effective Date, the PMU shall be staffed with (i) a procurement and consulting service specialist, and (ii) accounting and bookkeeping staff; and (b) four months of the effective date, the PMU shall be staffed with additional national and international consultants, in each case, to the extent required for effective implementation, as required by and acceptable to ADB. The PMU will serve as the secretariat for the tender committee. The beneficiary shall ensure that the PMU has adequate office space & facilities as required for project implementation. The PMU shall be maintained until project completion
Schedule 5, para. 4
Complied with.
Within three months of the Effective Date, the PMU shall recruit three local representatives: one representative to serve the Project Raion of Rudaki; one representative to serve the Project Raion of Vahdat; and one representative to serve the Project Raions of Faizabad and Rogun. The Project Raion of Varzob will be served from the PMU in Dushanbe. Each local PMU representative shall be located in the appropriate Project Raion administration office and shall be responsible for (a) monitoring Project implementation in their respective Project Raions; (b)
Schedule 5, para. 5
Complied with. Recruitment completed in December 2009. 4 coordinators were appointed including a separate one for Varzob.
32 Appendix 7
Covenant
Reference in Loan
Agreement
Status of Compliance
supporting Project Raion officials with Project implementation; (c) liaising with local communities on Project satisfaction; (d) coordinating with SCLM; and (e) providing statistical data to the PMUs.
The Beneficiary shall improve the land use rights of farmers in each of the project raions by (a) issuing the required land certificates in each of the dekhan farms in the project raions and (b) protecting farmers from (i) arbitrary cancellation of land use certificates, and (ii) eviction from farmland without due process. To this end, the Beneficiary shall ensure that (a) prior to the Second Tranche release, 50% of dekhan farms in the project raions have been issued the required land certificates, (b) prior to the Third Tranche release, 80% of dekhan farms in the project raions have been issued the required land certificates, and (c) prior to project completion, 100% of dekhan farms in the project raions have been issued the required land certificates.
Within three years of the Effective Date, the Beneficiary shall, within the existing legislative framework, implement a simplified registration procedure for business in each of the Project raions on a pilot basis. Depending on the results of the pilot activities, the Beneficiary shall prepare a plan to expand and implement the simplified registration procedures on a wider geographical basis.
Schedule 5, para. 8
Complied with. A simplified “one window” (unified) business registration procedure is implemented in the Project raions since July 2009 funded by other agency.
Within two years of the Effective Date, the Beneficiary shall adopt a national policy, strategy and investment plan for the management of pasture land and livestock (Sustainable Pasture Land Policy and Strategy). The Sustainable Land Policy and Strategy shall among others: (a) identify all relevant Beneficiary agencies and outline their respective responsibilities in respect of the Sustainable Pasture Land Policy and Strategy, (b) mandate a pasture land management process at raion and/or community level, (c) include procedures for ensuring community participation in the planning process, (d) establish systems and procedures for transhumance, (e) establish systems and procedures for allocating pasture land to farmers in an equitable and transparent manner, (f) provide procedures for reallocating, using and protecting the pastures, (g) establish plans for pasture rotation based on forage productivity, and (h) include investment plans for developing, improving and meeting the infrastructure needs of such pastures. The Beneficiary shall implement the Sustainable Pasture Land Policy and Strategy in accordance with its terms.
Schedule 5, para. 9
Complied late. Contract to support the policy strategy and investment plan commenced in August 2010.
Within four years of the Effective Date, the Beneficiary shall adopt appropriate legislation and regulations as required to effectively implement the Sustainable Pasture Land Policy and Strategy.
Schedule 5, para. 10
Complied late.
Appendix 7 33
Covenant
Reference in Loan
Agreement
Status of Compliance
Prior to project completion, the Beneficiary shall mainstream and fully integrate the curricula on pasture land management developed under the Project into the broader curricula and programs at a university or vocational educational institution agreed between the Beneficiary and ADB.
Schedule 5, para. 11
Partly complied.
To support the sustainability of rural advisory services under Component 3, the Beneficiary shall ensure that, within four years of the Effective Date, each rural advisory center established under the project is registered as an independent Public Association in accordance with the Public Associations Legislation (1998).
Schedule 5, para. 12
Complied with. Advisory centers are financially autonomous, but not privatized.
The Beneficiary shall comply with and shall cause MOA and each MFI to comply with ADB’s Anticorruption Policy. The Beneficiary agrees (a) that ADB reserves the right to investigate, directly or through its agents, any alleged corrupt, fraudulent, collusive or coercive practices relating to the project and (b) to cooperate fully with and to cause MOA and each MFI to cooperate fully with any such investigation and to extend all necessary assistance, including providing access to all relevant books and records, as may be necessary for the satisfactory completion of any such investigation. In particular, the Beneficiary shall (a) ensure that MOA conducts periodic inspections on the contractors’ activities related to fund withdrawals and settlements and (b) ensure that, and shall cause MOA and each MFI to ensure that all contracts financed by ADB in connection with the project include provisions specifying the right of ADB to audit and examine the records and accounts of MOA and each MFI, and all contractors, suppliers, consultants and other service providers as they relate to the project.
Schedule 5, para. 30
Not applicable. Credit line cancelled.
The Beneficiary shall ensure that all reports, drawings, maps, historical data on soil, water and land use characteristics, amelioration requirements, infrastructure design and construction records and related information and data relevant to the project are collected from the appropriate institutes and are made available to the PMU.
Schedule 5, para. 31
Complied with.
The Beneficiary shall provide and/or facilitate the obtaining of required permission and approval for the project to (i) acquire satellite imagery for the territory of the Republic of Tajikistan, in particular the project raions; (ii) collect geo-referenced data and store this data in a computerized geographical information system; (iii) create maps prepared from geo-referenced data collected by the project; and (iv) make such maps available to key agencies and stakeholders.
Schedule 5, para. 32
Complied with.
The Beneficiary shall ensure that the PMU, within six Schedule 5, Complied late.
34 Appendix 7
Covenant
Reference in Loan
Agreement
Status of Compliance
months of the Effective Date, (a) conducts a baseline survey; (b) submits to ADB a detailed implementation plan, acceptable to ADB, for monitoring the performance and impact of the project; and (c) finalizes and adopts a comprehensive PPMS, acceptable to ADB, based upon the PPMS indicators agreed upon between the Beneficiary and ADB. The PPMS shall track project implementation activities, target dates for outputs, expected project outcome and assigned responsibilities and shall include comprehensive procedures for generating data and methodologies for collecting and reporting the PPMS indicators. The Beneficiary shall ensure that the PMU, within four months of the Effective Date, develops a matrix of sub-indicators in a participatory manner to substantiate the core performance indicators and addresses poverty issues and the concerns of vulnerable groups. The Beneficiary shall ensure that, where feasible, community-based monitoring mechanisms will be developed to strengthen the participation of and decision making by communities in the project. The PMU shall (a) present the PPMS indicators, through the PPMS, to the Project Steering Committee for verification on a quarterly basis to determine the efficiency and effectiveness of the project and its outcome and (b) provide to ADB semi-annual PPMS monitoring reports, in form and substance acceptable to ADB, from the commencement of project implementation until project completion.
para. 33 Baseline survey was completed in 2010 and monitoring and performance plan set up in 2009.
The Beneficiary and ADB shall jointly undertake semi-annual reviews of the project throughout the project implementation period until such time as ADB is satisfied that annual reviews will be sufficient to ensure effective project administration and implementation. Thereafter, the Beneficiary and ADB shall jointly undertake annual reviews of the project. The semi-annual or annual reviews, as the case may be, will assess the project’s achievements and progress in implementing the project activities, producing outputs under different components and delivering the outcome against the PPMS indicators and the project implementation schedule in order to identify any difficulties or constraints being encountered in implementing the Project and to make adjustments, if necessary, for the remaining project implementation period.
Schedule 5, para. 34
Not complied. Apart from 2008, when no review was undertaken, only annual reviews were conducted.
Within 18 months of the project implementation and during the third year of Project implementation, the Beneficiary, MOA, SCLM and ADB shall jointly undertake a comprehensive review of the project. The comprehensive review will cover the items to be addressed during the semi-annual or annual reviews,
Schedule 5, para. 35
Complied late. Midterm review mission was conducted in March 2011
Appendix 7 35
Covenant
Reference in Loan
Agreement
Status of Compliance
as the case may be, as well as assess the need for making changes in the project design and/or implementation arrangements
Sector
The Beneficiary shall ensure that each rural infrastructure development subproject at the project raion level and at the community level under Component 4 (each, an infrastructure subproject) is in consultation with the community based organizations, endorsed by the raion working group in each project raion, and approved by the PMU in accordance with the following criteria: (a) the infrastructure subproject has assessed the level of potential benefits and number of beneficiaries; (b) the infrastructure subproject has been prioritized objectively in relation to its qualified benefits and number of beneficiaries; (c) affected communities have been involved in the consultative process for the identification of priority infrastructure; (d) the infrastructure subproject identifies clearly the associated operation and maintenance costs and funding arrangements required to meet such costs and includes an annual maintenance plan; (e) the infrastructure subproject is technically feasible, economically viable and represents the most cost effective alternative; (f) an environmental impact assessment shall have been conducted in accordance with the environmental assessment and review procedures set forth in the IEE; (g) communities commit to contribute 10% of the estimated infrastructure subproject costs in the form of cash or labor inputs and agree to meet operation and maintenance costs of the infrastructure; and (h) all required governmental approvals shall have been obtained. The Project Steering Committee shall endorse the prioritized infrastructure subprojects. No infrastructure subproject that would be categorized as category A in accordance with ADB’s Environment Policy shall be financed under the project.
Schedule 5, para. 17
Complied with.
ADB shall approve (a) the first two infrastructure subprojects proposed to be carried out in each project raion, at both the raion and community level (one in each category) and (b) all infrastructure subprojects in excess of $100,000 equivalent, in each case, in accordance with the procedures agreed between ADB and the Beneficiary. Thereafter, the PMU shall approve all infrastructure subprojects proposed to be carried out under Component 4 in accordance with the procedures to be agreed between the Beneficiary and ADB. The Beneficiary shall ensure that (a) each infrastructure subproject proposal provides sufficient evidence of its eligibility under the agreed criteria and is prepared and in accordance with the detail and quality required to enable Raion Working Groups and
Schedule 5, para. 18
Complied with.
36 Appendix 7
Covenant
Reference in Loan
Agreement
Status of Compliance
the PMU assess the viability and suitability of such subprojects and (b) all relevant documents forming the basis for the selection and processing of each infrastructure subproject is made available to ADB upon request. No raion infrastructure subproject exceeding $250,000 or community infrastructure subproject exceeding $50,000 for community infrastructure shall be financed under the project.
The Beneficiary shall ensure that (a) 50% of the funds from each Tranche Release are distributed equally among the project raions and (b) 50% of the funds from each Tranche Release are disbursed for infrastructure subprojects on a competitive basis in accordance with the criteria and prioritization assessment set forth in paragraphs 17 and 18 above.
Schedule 5, para. 19
Complied with.
Safeguards
The Beneficiary shall ensure that the project is carried out in accordance with and all project facilities are designed, constructed, operated, maintained and monitored in compliance with, (a) all applicable environmental laws and regulations, (b) ADB’s Environmental Policy, and (c) the IEE and the EMP, including the mitigation measures and monitoring requirements arising from the implementation of the environmental assessment and review procedures outlined in the IEE.
Schedule 5, para. 20
Complied with.
If any project activity causes land acquisition and/or resettlement impacts, the Beneficiary must inform ADB and justify the reasons for the related impacts. After concurrence from ADB, the Beneficiary shall prepare a Short Resettlement Plan in accordance with the Resettlement Framework. Each Short Resettlement Plan must be approved by ADB prior to the implementation of any land acquisition and/or resettlement activities under the project or the commencement of works on any affected project component.
Schedule 5, para. 21
Complied with.
The Beneficiary shall ensure that all affected persons (APs) under the project are (a) given adequate opportunity to participate in resettlement planning and implementation activities and (b) compensated in accordance with the terms of the Short Resettlement Plan such that, in each case, APs are at least as well as they would have been in the absence of the project,
Schedule 5, para. 22
Complied with.
The Beneficiary shall ensure that (a) civil works contractors’ specifications include requirements to comply with, and civil works contractors are supervised so as to ensure compliance with, the Short Resettlement Plan, and (b) in the event there are any substantial changes in resettlement impacts, the Short Resettlement Plan is updated and disclosed to the
Schedule 5, para. 23
Complied with.
Appendix 7 37
Covenant
Reference in Loan
Agreement
Status of Compliance
APs and provided to ADB for its concurrence prior to the commencement of related civil works.
The Beneficiary shall ensure that (a) adequate staff and resources are committed to supervising and monitoring the implementation of any Short Resettlement Plan, (b) quarterly reports on the progress of implementing each Short Resettlement Plan are provided to ADB, and (c) a resettlement completion report is provided to ADB within six months of project completion.
Schedule 5, para. 24
Complied with.
The Beneficiary shall ensure that the project is implemented in accordance with (a) all applicable laws and regulations, (b) the Resettlement Framework, (c) each Short Resettlement Plan, as applicable, and (d) ADB’s Involuntary Resettlement Policy.
Schedule 5, para. 25
Complied with.
The Beneficiary shall ensure that (a) the Gender Action Plan is implemented in accordance with its terms, (b) the Participation Plan is implemented in accordance with its terms, and (c) the action and activities specified in the Specific Actions for Ethnic Minorities are undertaken as specified therein.
Schedule 5, para. 28
Complied with.
Social
The Beneficiary shall ensure that (a) provisions are stipulated in all civil works contracts which require contractors employed under the Project to incorporate applicable workplace occupational safety norms, and (b) civil works contractors (i) comply with all applicable labor laws, (ii) do not employ child labor for construction and maintenance activities, and (iii) ensure that there is no differentiation in wages between men and women for work of equal value.
Schedule 5, para. 26
Complied with.
The Beneficiary shall ensure that Sub-borrowers do not employ child labor in their farming activities. To this end, the Beneficiary shall ensure that provisions are stipulated in all sub-borrower loan agreements entered into between a MFI and a sub-borrower that prohibit the use of contracted child labor.
Schedule 5, para. 27
Not applicable. Credit line cancelled.
Source: Asian Development Bank.
LIST OF COMPLETED CIVIL WORKS AND CONSULTANCY CONTRACTS
Table A8.1: CIVIL WORKS CONTRACTS
PMU/CW # Description Type Contract
Value ($) Signed Date Completion Date
ADB financed:
NCB/01-10 Restoration of in-farm canal Dashtibed in Navobod village of Abdulvosiev jamoat Irrigation 98,900 15-Dec-10 15-Jun-11
NCB/02-12 Restoration of transport bridge on 4 km road Chorbog-Chormagzakon of Chorbog jamoat, Varzob raion Bridge 47,670 11-Jan-11 13-Jul-12
NCB/03-12 Construction of water supply network in Takhti Alif village of Chashmasor jamoat Water 51,180 13-Jan-11 13-Jul-11
NCB/04-12 Drinking water supply in Lohur village of Lohur jamoat Water 37,980 11-Nov-11 11-May-12 NCB/05-12 Rehabilitation of a bridge in Shurmanka village of
Esanboy jamoat on the 32 km of Rudaki raion Bridge 225,820 26-Sep-11 26-Feb-13 NCB/06-12 Reconstruction of road Javonon-Safedoron, Rogun Road 233,910 10-May-12 10-Nov-12 NCB/07-12 Rehabilitation of a bridge in Dehmalik village of Dehmalik
jamoat, Varzob raion Road/bridge 205,810 10-May-12 10-Nov-12 NCB/08-12 Construction of water supply line in Kulobiyon-Sari Chinor
villages of Javonon jamoat, Faizabad raion Water 173,540 11-Jun-12 11-Dec-12 NCB/09-12 Rehabilitation of a bridge in Shaykhon village of Rohati
jamoat, Rudaki raion Road/bridge 167,930 10-May-12 10-Nov-12 NCB/10-12 Rehabilitation of a bridge in Tiloobod village of Lohur
jamoat, Rudaki raion Road/bridge 205,070 10-May-12 10-Nov-12 NCB/11-12 Rehabilitation of a bridge through Elok river in Dorob
village of Kalai Dasht jamoat, Faizabad raion Road/bridge 117,550 10-May-12 10-Nov-12 NCB/12-12 Restoration of a bridge through Kadi Ob river of Kadi Ob
jamoat Road/bridge 198,451 20-Sep-12 20-Mar-13 NCB/13-12 Construction of additional water supply line in Geshi
village Water 72,430 20-Sep-12 20-Mar-13 NCB/14-12 Rehabilitation of a bridge through Naydara river of Dusti
jamoat Road/bridge 299,430 20-Sep-12 20-Mar-13 NCB/15-12 Construction of small power plant in Kokhu village of
Romit jamoat Power 237,120 24-Jan-13 24-Jul-13 NCB/16-12 Rehabilitation of Mehrgon-Shirinchashma road of B.
Burunov jamoat Road/bridge 208,930 26-Jan-13 26-Jul-13 NCB/17-12 Rehabilitation of Zargar-Chaman road of Abdulvosiev
jamoat Road/bridge 221,150 25-Jan-13 25-Jul-13 NCB/18-12 Construction of irrigation system in Duoba village of
Chorbog jamoat Irrigation 56,580 05-Jun-13 05-Dec-13 NCB/19-12 Construction of water supply line in Kuliyo – Yumsurok
villages of Simiganch jamoat Water 101,120 21-Jun-13 21-Dec-13 NCB/20-12 Construction of water supply line in Chashmai Kulo village Water 232,825 05-Jun-13 05-Dec-13
38 A
ppe
ndix
8
PMU/CW # Description Type Contract
Value ($) Signed Date Completion Date
of Kadi Ob jamoat
NCB/21-12 Construction of water supply line in Kengeli village of Faizabad jamoat Water 199,961 06-Jun-13 06-Dec-13
NCB/22-12 Construction of water supply line in Chukurak village of Faizabad jamoat Water 214,188 05-Jun-13 05-Dec-13
NCB/24-12 Construction of water supply line in Zafar-2 village of Choryakkoron jamoat Water 198,050 07-Jun-13 07-Dec-13
Government financed:
NCB/23-12 Construction of water supply line in Sultonobod village of Sultonobod jamoat Water 186,560 20-Jun-13 08-Aug-13
NCB/26-12 Construction of water supply line in Fathobod village of Miskinobod jamoat Water 137,700 25-Jun-13 16-Aug-13
NCB/27-12 Construction of water supply line Kandak village, Obi Garm Jamoat Water 155,590 22-Jun-13 13-Sep-13
NCB/30-12 Rehabilitation of irrigation canal in Jamoat Tshoriakoron Irrigation 142,840 27-Jun-13 13-Sep-13
ADB = Asian Development Bank, CW = civil works , NCB = national competitive bidding, PMU = project management unit. Source: Asian Development Bank.
898,301 26-Jul-10 25-Feb-14 Agriculture and Rural Business Advisory Services and Market Information System 1,200,000 06-Jan-12 Mar-14 Design Services (five contracts with local design institutes)
a 332,752 01-Aug-11 Jul-14
Training for the Rural Population and Local Officials to Provide Public Information and Legal Consultation 63,150 07-Dec-10 Apr-12
a All five contracts were engaged between August 2011 and July 2014.
Source: Asian Development Bank.
Ap
pe
ndix
8 39
40 Appendix 9
NON-COMPLIANCE WITH ADB’S PROCUREMENT GUIDELINES 1. The rural infrastructure development component involved small-scale civil works contracts up to a maximum value of $250,000, procured through national competitive bidding. Eligible investments included road and bridge access, rehabilitation of irrigation and drainage system, drinking water supply, and small-scale electricity generation and distribution. The Asian Development Bank (ADB) approved 32 subproject proposals, of which 23 were completed; 4 subproject contracts were awarded but subsequently declared as misprocurements and ineligible for ADB financing, while 5 bid evaluation reports (BERs) were not supported and consequent contracts not awarded. A. Issues in Bid Evaluations 2. The Ministry of Agriculture (MOA) submitted five BERs (national competitive bidding (NCB)/25, NCB/28, NCB/29, NCB/31 and NCB/32) between 2 August and 2 September 2013. ADB’s financing of these contracts was $0.755 million. ADB found the BERs to be of poor quality, which necessitated considerable and lengthy correspondence for clarifications and further information. The poor quality of the BERs was communicated to MOA as causing approval delays. Also, some BERs were submitted late, beyond the expiration of bid validity periods in some cases. ADB requested MOA provide evidence to indicate notification requests to all bidders for bid-closing extensions, and subsequent response of all bidders. This information was not provided. 3. Due to the incompleteness of information in reviewing the BERs, on 18 September 2013 ADB requested MOA to provide copies of: (i) the full bids of each bidder for each contract; (ii) letters from the project management unit notifying of the need to extend bid validity and bid security validity periods from each bidder; and (iii) a letter of response from each bidder and explanation of those that did not respond. 4. ADB reviewed the full bids and found major non-compliances in each BER. On 7 November 2013, MOA was advised that the BERs were not in accordance with ADB’s Procurement Guidelines (2015, as amended from time to time) and did not accurately reflect the information provided in the bids. Consequently, the MOA’s recommendations to award contracts to the bidders were not supported. The review identified some irregularities, which suggested that fraud and/or collusion may have occurred in the procurement. The matter was referred to ADB’s Office of Anticorruption and Integrity on 10 October 2013. B. Issues in Awarded Contracts 5. MOA submitted BERs for NCB/23 (12 July 2013), NCB/26 (2 August 2013), NCB/27 (6 August 2013), and NCB/30 (2 August 2013). Clarification requests were sent on 8 August and 16 August 2013 and 2 September 2013. Following MOA responses, ADB gave its no-objection to the recommendations on contract awards. However, ADB advised MOA that the BERs were of poor quality, and contained inconsistencies and errors that necessitated clarification and delayed evaluation. ADB’s financing of these contracts was $0.46 million. 6. Given the subsequent findings for the five BERs (in Section A), on 17 October 2013, ADB requested MOA provide copies of each bidder’s full bids for the four approved contracts. The post-procurement review focused on the actual bid submitted by the first-ranked bidder, as per respective BERs. The general observation was that the BERs were poorly prepared, had contradicting statements regarding bidders’ qualification and experience, omitted detailed
Appendix 9 41
explanation of arithmetic corrections and their acceptance by bidders, and did not accurately present deficiencies in the bids. 7. ADB’s no-objection for contract award was based on the MOA evaluation and reporting in the BERs. During the post-procurement review, major non-compliances for each contract were observed. On 8 January 2014, the executing agency was advised of ADB’s declaration of misprocurement on the four contracts, that ADB funds were no longer available to finance the contracts activities, and that the funds allocated to these contracts would be cancelled from the loan amount. In addition, irregularities in the bid proposals were referred to ADB’s Office of Anticorruption and Integrity for investigation. C. Loan Partial Cancellation 8. On 19 November 2014, ADB approved partial cancellation of SDR815,532 ($1.21 million) under the loan associated with cancelled subprojects and contracts. The Ministry of Finance was advised of the partial cancellation on 25 November 2014. D. Completion of Misprocurement Contracts 9. Construction activities of the four civil works contracts previously declared as misprocurement stalled due to a lack of funding. During the June 2014 ADB review mission, the government agreed to a TJS742,535 contribution for these contracts. Only TJS78,560 had been dispersed. Not only did this impose hardship upon the communities who had provided financial contributions to project construction, but some contractors incurred financial difficulties, resulting in a complaint to ADB by one contractor regarding government non-payment for services. Following ADB’s request on 18 July 2014 to the Minister for Agriculture for additional government financing, the President of Tajikistan gave approval for additional resources to complete the contracts.
42 Appendix 10
ECONOMIC AND FINANCIAL ANALYSIS A. Introduction 1. The project was implemented in five contiguous raions near to the capital city Dushanbe: Faizabad, Rogun, Rudaki, Vahdat, and Varzob. It included five components: component 1: policy and institutional development; component 2: improved pasture, arable, and forest land management; component 3: agriculture and business support; component 4: rural infrastructure development; and component 5: project management. As at appraisal, the quantitative economic and financial re-analysis of the project has focused on the improvements to farm incomes within the project area. However, especially in relation to the first two components, the project is expected to result in benefits at a national as well as at a project-area level. Also, for the fourth component, the majority of rural infrastructures implemented provided significant social benefits, which have not been quantified in monetary terms. To this extent, the quantified economic and financial analysis is a conservative assessment of the project’s overall efficiency level.
2. There are several assumptions underlying the economic re-evaluation: (i) All costs and prices are expressed in February 2015 values. The Tajikistan and
world inflation rates and the somoni–dollar exchange rate series used to convert historic price data to February 2015 values are shown in Table A10.1.
(ii) Economic values are estimated based on the domestic price numeraire. (iii) A shadow exchange rate factor (SERF) of 1.11 was applied to the foreign
exchange content of costs and benefits, and an opportunity cost of surplus labor factor (OCSLF) of 0.85 was applied to unskilled labor.1 At appraisal, a SERF of 1.00 and an OCSLF of 0.80 were used.
(iv) The economic cost of capital was assumed to be 12%, as at appraisal.2 (v) The economic life is assumed to be 20 years after project completion, i.e., from
2007 to 2034. At appraisal, the economic life was assumed to be 20 years from project commencement. Given the initial implementation delays, 20 years after completion is more realistic. To the extent project benefits continue after 2034 (i.e., have a residual value at the end of the assumed project economic life), the analysis is conservative.
(vi) Full economic benefits are assumed to be achieved by 2020, two years later than assumed at appraisal, and only 80% of potential economic benefits are expected to be realized. This reflects the delays in implementation, reductions in scope, and uncertainty about the operations of the agricultural advisory centers and market intelligence units (MIUs). Growth in benefits is assumed to be linear from 2012 to 2020.
B. Project Costs 3. In the base case economic analysis, all project component costs have been included. This includes Asian Development Bank (ADB) loan and grant disbursements, the Global Environment Facility grant disbursements, and the contributions from government and beneficiaries. The costs of beneficiaries’ contributions have been multiplied by the OCSLF since
1 Asian Development Bank (ADB). 2012. Project Completion Report on Irrigation Rehabilitation Project. Manila
(L2124-TAJ). 2 Footnote 1.
Appendix 10 43
these were in-kind labor for the installation of rural infrastructure subprojects. For example, beneficiaries were involved in digging trenches for water supply scheme pipes. 4. The annual financial costs for the project were converted to economic values using the SERF applied to the tradable content of costs.3 Annual costs were also converted to February 2015 constant price terms. 5. Operation and maintenance (O&M) costs have been estimated at 2% of total capital costs. For rural infrastructures, local water users associations are involved in maintaining and operating water supply schemes and collect TJS0.5 per person (or about TJS4 per household) per month to cover ongoing costs. Other subprojects (roads and bridges, and the small hydropower scheme) are controlled by relevant raion-level government agencies, which meet ongoing costs from their budgets. The agricultural advisory centers and MIUs need to continue activities to encourage the uptake of new crops, improved farm inputs and practices, and better produce marketing. There is already some willingness by farmers to pay for these services, and this will be required to maintain these activities beyond the project end. C. Project Benefits 6. At appraisal, the project’s economic benefits were based on increases in net farm income from crops and livestock. Component 3 sought to also increase non-farm incomes by assisting the development of rural enterprises. The project impact survey, undertaken at project completion and compared with baseline survey results identified increases in non-farm income during 2010–2014.4 However, the extent to which this is due to project interventions is unclear, and it is likely that employment of project area residents in Dushanbe or overseas has been a more significant contributor to increases in non-farm incomes via remittances from these household members. To the extent the project has contributed to non-farm incomes, the economic analysis results are conservative. 7. For improvements in farm incomes from cropping, the areas and cropping patterns with and without the project as identified at appraisal have been used for irrigated and rainfed individual dekhan farms and collective farms in Vahdat and Rudaki and Varzob, Rogun and Faizabad (Tables A10.2 and A10.3). Budgets for the crops grown in the project area use updated data gathered during the project completion report (PCR) mission. Economic prices for wheat (Table A10.4), fertilizers, and farm labor (adjusted by the OCSLF) have been derived and used in the farm budgets. 5 Otherwise, financial prices have been used. The financial crop budgets for each of the crops with and without the project are summarized in Tables A10.5–A10.16. The main project impacts on crops are:
(i) a slight decrease in overall cropped area with the project, as compared to without the project (-0.4%);
(ii) a reduction in the areas of lower-returning crops (wheat and flax) in favor of higher-returning vegetable crops (potatoes, tomatoes, onions, and cabbage);
(iii) the same areas of orchards with and without the project; and (iv) higher yields for crops with the project, as compared to without the project—for
irrigated wheat +17%, for rainfed wheat +10%, for irrigated potatoes +21%, for
3 Taxes and duties on vehicles and equipment were excluded from the economic analysis since these are only
transfer payments—paid for by government, but also received by government. 4 See impact evaluation results for the “Rural Development Project”; Znaniya, 2014, and baseline survey for “Rural
Development Project”; Znaniya, August 2010. 5 Fertilizer prices based on financial-to-economic price ratios derived from ADB. 2012. Project Completion Report on
rainfed potatoes +18%, for irrigated tomatoes +14%, for irrigated onions +20%, for irrigated cabbages +15%, for rainfed flax +14%, for irrigated fodder +14%, for rainfed fodder +11%, for irrigated orchards +63%, and for rainfed orchards +44%.6
8. The cropped areas, cropping pattern, and yields are combined to give crop incremental economic benefits in 2020 of TJS18.9 million ($3.3 million). 9. For improvements in farm income from livestock and pasture improvements, estimates were made for improvements in returns from dairy cows, sheep, and goats.7 Without the project, milk production is estimated at 4 liters per cow, with 250 lactation days per annum. With the project (at full impact), milk production is estimated to increase to 6 liters per cow, with 280 lactation days per annum. Household consumption of milk is 3 liters without the project, growing to 4 liters with the project. The calving, lambing, and kidding rates are expected to increase from 60% to 80% with the project. Additional economic benefits per household from project livestock improvements after allowing for incremental costs are in Table A10.17. Again, it is assumed the project will only achieve 80% of potential economic benefits by 2020. The number of livestock benefitting from the project is based on an estimated average of two cows, two ewes, and two female goats per dekhan farm and 30 per collective dekhan farm in the project area.8 D. Economic Analysis Results and Sensitivity Testing 10. Table A10.18 combines the capital and O&M costs and crop and livestock benefits to calculate the project’s estimated economic internal rate of return (EIRR) and net present value (NPV). The base case EIRR is 12.9%, and the NPV at a 12% discount rate is TJS8.2 million. However, should the agricultural advisory centers and MIUs discontinue operating, project sustainability in terms of continued growth in crop and livestock economic benefits is substantially at risk. If there is no growth in crop and livestock benefits after 2015, the project EIRR is only 5.9%, and NPV at a 12% discount rate is TJS39.5 million. 11. The base case analysis includes all project costs and assumes only 80% of full potential benefits are achieved by 2020, two years later than assumed at appraisal. This compares with the 18.0% EIRR estimated at appraisal. However, at appraisal component 4 costs were excluded since no allowance was made for the benefits of the rural infrastructure subprojects, including irrigation rehabilitation, potable water supply schemes, road and bridge rehabilitation, and small power schemes. Excluding this component’s costs increases the re-evaluated EIRR to 15.5%, and the NPV at a 12% discount rate is TJS29.0 million. However, if economic benefits do not increase beyond 2015, the EIRR will be only 8.9%, significantly below 12.0%, even with component 4 costs excluded from the analysis.
6 Percentage increases are at full project impact, 80% of potential impacts assessed at appraisal, and assumed to
occur by 2020 (two years later than assumed at appraisal). 7 At appraisal, calving percentages were expected to increase by 100%, lambing percentages by 100%, and kidding
percentages by 150%. By 2014, the percentages had increased by an estimated 29% for calving, 20% for lambing, and 21% for kidding. See impact evaluation results for the “Rural Development Project”; Znaniya, 2014.
8 The estimated value of project-related livestock improvements is based on data from the report and
recommendation of the President, updated with information gathered during the PCR mission. The livestock improvements in the project area are confirmed by data in the impact evaluation results for the “Rural Development Project”; Znaniya, 2014.
Appendix 10 45
12. At appraisal, full economic benefits were assumed to be achieved by 2018. In the re-evaluation, this was delayed to 2020, with only 80% of full potential economic benefits, reflecting implementation delays and reduced scope—in particular, the cancelled microcredit activity. E. Non-Quantified Economic Benefits 13. The project’s re-evaluated EIRR has not taken account of improvements in crop and livestock farming returns beyond the project area. Components 1 and 2 in particular are expected to have benefits for crop and livestock farming beyond the project area. Only crop and livestock benefits within the project area have been included in the EIRR’s re-evaluation. Component 3 was also intended to encourage non-farm rural enterprises, and these benefits have not been included in the calculation. As discussed (para. 11), component 4’s benefits have not been considered. Excluding this component’s costs raised the EIRR by 2.6%. Excluding the component’s costs assumes the benefits have equal value to the costs. This is a conservative assumption (see discussion of rural infrastructure subproject costs and benefits. F. Rural Infrastructure Development Subprojects 14. Various infrastructure subprojects were completed. These included one small hydro-power plant, two rehabilitated irrigation systems, nine village-level potable water supply schemes, eight bridges, and three rehabilitated roads.9 These have several economic benefits:
(i) Hydro-power plant: savings in alternative fuel costs displaced by the electricity (e.g., savings in kerosene, diesel, and firewood costs), and the consumer surplus benefits from increased energy consumption as a consequence of electricity being a cheaper and more convenient energy source. 10
(ii) Irrigation rehabilitation: increased returns to farmers from improvement in crop yields and the adoption of a more profitable cropping pattern in the command areas. Irrigation rehabilitation generally has high rates of return since relatively small levels of expenditure are required to regenerate irrigation benefits.
(iii) Village-level potable water supply schemes: savings in water collection costs from rivers and other alternative sources of supply (i.e., value of time in walking and waiting to collect water based on average rural wage rates), and the consumer surplus benefits from increased water consumption.
(iv) Bridge and road rehabilitation: savings in travel time and vehicle operating costs, and the consumer surplus benefits of increased travel.
15. At appraisal some potential subprojects were evaluated and had very high EIRRs. During implementation, subprojects were identified at the community level and proposed for funding. Criteria for selecting projects for funding included the capital cost per beneficiary, which averaged $57.1 for village water supply schemes, $34.9 for bridge rehabilitation, $61.7 for road rehabilitation, $14.7 for irrigation rehabilitation, and $377.2 for the small hydro-power plant. In approximate terms when annualized, these costs were between $3 and $7 per beneficiary per annum, except for the small hydro-power scheme, which has an annualized cost of around $39 per beneficiary per annum.11 When the subprojects’ social and economic benefits are included, it is clear they represented an efficient use of resources. This is especially the case for the village-level potable water supply schemes, which represented 34.3% of funds spent under this
9 An additional four village-level potable water supply schemes were completed using government funding only.
10 Where data is available, it is possible to estimate these benefits as the midpoint between the cost of energy with the project (c2) and the cost of energy without the project (c1)—i.e., (c1+c2)/2.
11 Assumes annual O&M costs of $1 per beneficiary based on village potable water scheme cost recovery of TJS0.5 per beneficiary, for schemes visited during the PCR mission.
46 Appendix 10
component. 12 The hygiene and health benefits from the higher-quality water supply from mountain springs feeding the scheme, as compared to river water containing high levels of sediment, are likely to be significantly more important than water-collection cost savings. Reductions in waterborne diseases will reduce work and school absences, improve labor productivity, reduce health care costs and improve overall quality of life.
16. Therefore, it is concluded that the individual subprojects under component 4 were an efficient use of resources. G. Farm-Level Financial Analysis 17. Crop budgets using financial prices indicate increases in farm incomes as a result of the project. These increases in farm incomes have been estimated separately for irrigated and rainfed dekhan farms and collective dekhan farms in Vahdat and Rudaki and in Faizabad, Rogun, and Varzob. For Vahdat and Rudaki raions, the project-related increases in farm incomes per annum are TJS9,294 ($1,625) for irrigated dekhan farms, TJS7,280 ($1,273) for rainfed dekhan farms, and TJS665,071 ($116,271) for collective dekhan farms. For Faizabad, Rogun, and Varzob raions, the project-related increases in farm incomes per annum are TJS10,062 ($1,759) for irrigated dekhan farms, TJS5,760 ($1,007) for rainfed dekhan farms, and TJS560,849 ($98,050) for collective dekhan farms. These income increases exclude increased returns to labor. H. Reductions in Poverty in the Project Area
18. At appraisal, the project targeted reducing the number of poor households in the project area by 25%. The baseline and project completion surveys show that in the project area the percentage of “poor” households (defined as an average monthly income per person within the household of TJS61–100 ($11-$17)) reduced from 41% in 2010 to 36% in 2014—a 12% reduction rate.13 Also, the percentage of “very poor” households (defined as an average monthly income per person within the household of less than TJS6 ($11)) reduced from 26% in 2010 to 22% in 2014—a 15% reduction rate.14 However, in this regard, two factors should be noted:
(i) Inflation of about 30% occurred in Tajikistan between 2010 and 2014. The “poor” and “very poor” thresholds should have been increased by 30% to maintain constant purchasing parity.
(ii) The income of project area households is a function of both on-farm and off-farm income. The project completion survey identified an increase in off-farm income between 2010 and 2014 of 92% from TJS3,601 ($630) per household per annum to TJS6,908 ($1,208) per household per annum. Much of this near doubling of non-farm income will be because of non-project-related factors (e.g., increased remittances from household members working in Dushanbe or overseas).
19. While it is unlikely the appraisal target to reduce the number of poor households in the project area by 25% had been achieved by 2014, with the full impacts not expected to be felt until 2020, the project is likely to eventually have a significant positive impact in reducing
12
Bridge rehabilitation accounted for 37.5%, road rehabilitation for 14.7%, the small hydropower plant for 6.4%, and irrigation rehabilitation for 4.0%.
13 The appraisal target was to reduce the number of poor by 25%, not for the percentage of poor to reduce by 25%, thus the percentage reductions in poor and very poor are expressed as a percentage of the existing percentage of poor at the project start.
14 See impact evaluation results from the “Rural Development Project;” Znaniya, 2014.
Appendix 10 47
poverty levels. This is borne out by the significant increases in farm incomes expected from the project. I. Conclusion on Project Efficiency 20. The use of project resources is rated efficient based on a combination of the measured EIRR and inclusion of non-quantified benefits. An analysis of project-related benefits from improved returns from cropping and livestock farming and the whole of project costs yields a base case EIRR of 12.9%. This assumes only 80% of full potential project benefits are achieved by 2020, two years later than assumed at appraisal, reflecting delays in implementation, reductions in scope (including credit line cancellation), and uncertainty about the future operations of the agricultural advisory centers and MIUs. Should these centers be unable to continue operating, project sustainability in continued growth in crop and livestock economic benefits is at risk, and the project’s resource use efficiency would have to be downgraded. 21. The base case analysis does not take into account component 4’s economic and social benefits. One approach to evaluating these benefits is to exclude these costs from the economic analysis. This assumes the subprojects’ economic and social benefits are at least equal to their costs. An analysis of the costs per beneficiary for the subprojects suggests this is a conservative assumption, especially given the health-related benefits of improved water quality from the village-level potable water schemes. Excluding component 4 costs, the EIRR is 15.5%, comparable to an 18% EIRR estimated at appraisal. At appraisal, the project’s EIRR calculation also excluded component 4 costs. 22. The economic analysis of the project is conservative in that it takes no account of project-related benefits outside the project area. Components 1 and 2 in particular are expected to have benefits for crop and livestock farming beyond the project area. 23. At the farm level by 2020, the project will result in improvements in annual farm incomes for irrigated dekhan farms ($1,625–$1,759), rainfed dekhan farms ($1,007–$1,273), and collective dekhan farms ($98,050–$116,271). Table A10.1: Summary of Exchange Rate, Inflation, and International Commodity Prices
Source: Asian Development Bank. 1. Exchange rate–ADB. 2014. Asian Development Bank Key Indicators for Asia and the Pacific 2014. Manila, for
2006–2013; ADB. 2014. Asian Development Bank Outlook 2014. Manila, for 2014. For 2015, exchange rate is that applicable during February, 2015 PCR mission.
2. Tajikistan inflation–ADB. 2014. Asian Development Bank Key Indicators for Asia and the Pacific 2014. Manila, for 2006–2013; ADB. 2014. Asian Development Bank Outlook 2014. Manila, for 2014–2015.
3. International inflation–Manufacturers' Unit Value index; World Bank. 2014. Global Development Prospects Group Pink Sheets Data, 6 January 2014, for 2006–2013; World Bank. 2014. Global Economic Prospects, April 2014, for 2014–2015.
4. Wheat prices–US No. 1 hard red winter, Free On Board United States, Gulf port. Source: World Bank. 2014. Global Development Prospects Group Pink Sheets Data, 6 January 2014, for 2006–2013; World Bank. 2014. Global Economic Prospects, April 2014, for 2014–2015. (Constant 2015 prices.)
C.i.f = cost insurance and freight, FOB = free on board, SERF = shadow exchange rate factor. a US No. 1 hard red winter, FOB United States, Gulf port.
b American No. 1 grade, hard red winter wheat has an average price premium of 15% over Kazakhstan wheat.
Kazakhstan wheat competes with American wheat in the
Russian markets; export parity pricing of Kazakhstan wheat forms the basis of the Tajikistan–Kazakhstan's border price of wheat. c Includes trade commissions, export, and customs administrative and other charges.
Source: Table A10.1, plus data from Appendix 10, ADB. 2012. Project Completion Report on Irrigation Rehabilitation Project. Manila (L 2124-TAJ).
Interest month 2% 5 181 5 221 Total Direct Cost 4,236 4,680
Gross Margin (1,486) (430)
( ) = negative, KCl = potassium chloride, kg = kilogram, m3 = cubic meter, O&M = operation and maintenance,
TSP = triple superphosphate, WUA = water users association. Sources: Asian Development Bank; Based on Excel worksheets to Annex 14: Economic Analysis, ADB. 2006. Preparing the Rural Development Project. Consultant’s report. Manila (TA 4598-TAJ). Updated with data
58 Appendix 10
gathered from the field during PCR mission. In addition to revised prices for crop inputs and outputs, the expected yields for tomatoes, onions, and cabbages with and without the project have been revised downwards from those assumed at appraisal. The economic crop budgets are the same as the financial crop budgets, except that economic prices for wheat, fertilizers, and farm labor have been incorporated. Also, interest costs have been excluded since these are a transfer.
Table A10.17: Livestock Benefits
Item Unit Price Without Project Without Project (TJS) Amount (TJS) Amount (TJS)
Veterinary costs head 31 0 0 6 Net Benefits per Household 1,441
kg = kilogram. Note: Assumes that each household (i) has two cows, which benefits by additional milk and additional calving percentage, (ii) gets the same lift in lambing and kidding percentage and (iii) there are no incremental costs for lambs and calves except two additional vet visits for each. Source: Based on Excel worksheets to Annex 14: Economic Analysis, ADB. 2006. Preparing the Rural Development Project. Consultant’s report. Manila (TA 4598). Updated with data gathered from the field during PCR mission.
Appendix 10 59
Table A10.18: Economic Internal Rate of Return Calculation
(TJS '000; constant February 2015 prices)
Benefits Crop Livestock Total Capital O&M Total Total Growth Benefits Benefits Benefits Costs Costs Costs Net Benefits
1 Water supply pipes installed or upgraded (length of network)
km 117.10
2 Households with improved piped water supply number 9,331 Benefit was achieved through construction of water pipelines where water from the springs was channeled to households in the area. Springs are a clean, free source of water. Channeling of water to rural households does not require the use of electricity.
3 Land improved through irrigation services, drainage, and/or flood management, of which:
ha 625
(i) Land improved through irrigation (and drainage) services
ha 590 Benefit was achieved through construction of canals, and excavation of trenches. Proper drainage also allows crop diversification and the growth of high-yielding varieties.
(ii) Land improved through flood management ha 35
Energy
1 Installed energy generation capacity MW 0.08 2 Transmission lines installed or upgraded km 2.50 630 people (330 of whom were
women) benefitted from this subproject. The village is in a remote area where people are deprived of electricity, which caused lack of communication and essential living conditions.
3 Distribution lines installed or upgraded km 2.85 4 New households connected to electricity number 95
Transport
1 Rural roads built or upgraded km 11.60 Improved access.
ha = hectare, km = kilometer, MW = megawatt. Source: Asian Development Bank. 2006. Technical Assistance to Tajikistan for Khatlon Province Flood Risk Management Project.
Consultant’s report. Manila (TA 4811-TAJ). Number of households in the consultant final report updated with data gathered during project completion review mission.