Complexity of Information Systems Development Projects: Conceptualization and Measurement Development Weidong Xia Department of Information and Decision Sciences Carlson School of Management University of Minnesota 321 19th Avenue South Minneapolis, MN 55455 Phone: (612) 626-9766 Emails: [email protected]Gwanhoo Lee Department of Information Technology Kogod School of Business American University 4400 Massachusetts Avenue, NW Washington, DC 20016-8044 Phone: (202) 885-1991 Email: [email protected]Acknowledgments: This study was supported by research grants provided by the University of Minnesota and by the Juran Center for Leadership in Quality. The Information Systems Special Interest Group of the Project Management Institute sponsored the collection of the survey data. We thank Carl Adams, Shawn Curley, Gordon Davis, Paul Johnson, Rob Kauffman and research workshop participants at the University of Minnesota for helpful comments on earlier versions of the paper.
Transcript
Complexity of Information Systems Development Projects:
Conceptualization and Measurement Development
Weidong Xia Department of Information and Decision Sciences
Carlson School of Management University of Minnesota 321 19th Avenue South Minneapolis, MN 55455 Phone: (612) 626-9766 Emails: [email protected]
Gwanhoo Lee Department of Information Technology
Kogod School of Business American University
4400 Massachusetts Avenue, NW Washington, DC 20016-8044
Acknowledgments: This study was supported by research grants provided by the University of Minnesota and by the Juran Center for Leadership in Quality. The Information Systems Special Interest Group of the Project Management Institute sponsored the collection of the survey data. We thank Carl Adams, Shawn Curley, Gordon Davis, Paul Johnson, Rob Kauffman and research workshop participants at the University of Minnesota for helpful comments on earlier versions of the paper.
1
Complexity of Information Systems Development Projects:
Conceptualization and Measurement Development
Abstract
This paper conceptualizes and develops valid measurements of the key dimensions of
information systems development project (ISDP) complexity. A conceptual framework is
proposed to define four components of ISDP complexity: structural organizational complexity,
structural IT complexity, dynamic organizational complexity, and dynamic IT complexity.
Measures of ISDP complexity are generated based on literature review, field interviews, focus
group discussions and two pilot tests with 76 IS managers. The measures are then tested using
both exploratory and confirmatory data analyses with survey responses from managers of 541
ISDPs. Results from both the exploratory and confirmatory analyses support the four-
component conceptualization of ISDP complexity. The final 20-item measurements of ISDP
complexity are shown to adequately satisfy the criteria for unidimensionality, convergent
validity, discriminant validity, reliability, factorial invariance across different types of ISDPs,
and nomological validity. Implications of the study results to theory development and practice
as well as future research directions are discussed.
Keywords and phrases: Complexity; Information Systems Development Projects; Conceptual
Values of ρc in excess of .50 indicate that the variance captured by the measures is
greater than that captured by error components, thus suggesting satisfactory levels of reliability
[3]. The results in Table 8 show that the composite reliability estimates were .74 for SORG, .78
for SIT, .81 for DORG, and .87 for DIT, respectively, suggesting that all four latent variables
have adequate levels of reliability.
============================ Table 8 about here
============================
Discriminant validity
Discriminant validity assesses the degree to which measures of different components of
ISDP complexity are unique from each other. The results of the pair-wise tests are shown in
Table 9. The results suggest that all six pairs were statistically different; indicating that the four
components of ISDP complexity demonstrated adequate levels of discriminant validity.
============================ Table 9 about here
============================
Analysis of factorial invariance
Tests of factorial invariance examines if a measure operates equivalently across different
sub-populations [15]. Analysis of factorial invariance is important for establishing the
generalizability of a measurement. The value of a measurement model is greatly enhanced if the
same factorial structure and properties can be replicated across various subpopulations [55].
ISDPs were defined in this study to include three types of system development: in-house new
development, packaged software implementation, and major enhancement of existing software.
As such, it is important to examine if the factorial structure and properties of the measure is
invariant across the three types of ISDPs.
29
Tests of factorial invariance take a hierarchical approach. First, a baseline model (Model
A) was established and tested. This baseline model was essentially the second-order model as
specified in Figure 4. However, the difference was that the second-order model was established
separately for each group. This baseline model did not have any invariance constraints across
the three types of ISDPs.
Once the baseline model was established, invariance of first-order factor loadings was
tested (Model B). In this step, the second-order factor loadings were not constrained to be
invariant. The rationale behind this approach was that tests of higher order invariance would
make sense only when there was reasonable invariance among the first-order factors [55].
Model B was compared with Model A to examine if the first-order factor loadings were
invariant. Difference in the χ2 between the two models was tested. However, χ2 tests can be so
powerful that trivial difference may lead to significant χ2 values. Therefore, other criteria such as
the ratio of χ2 to degrees of freedom and the target coefficient (T) should be also considered. The
χ2 of the baseline model serves as a target for optimum fit.
If the first-order factor loadings turned out to be invariant, a more restricted model with
invariant first- and second-order factor loadings (Model C) was tested. Again, this model was
compared with the baseline model to examine if the second-order factor loadings were invariant.
If the χ2 tests and other criteria do not indicate invariant factorial structure, it suggests that the
second-order factor loadings cannot be invariant because the first-order factor loadings are
invariant.
The factorial invariance analysis results shown in Table 10 suggest that the first-order
factor loadings were invariant because the χ2 difference was not significant. In addition, the ratio
of χ2 to degrees of freedom was reasonable and the target coefficient was very high, suggesting
30
good overall model-data fit. Similarly, the second-order factor loadings appeared to be invariant
because the χ2 difference between Model C and the baseline model was not significant. The
target coefficient was also very high, indicating good fit. In sum, we concluded that the factorial
structure of the second-order measurement model of ISDP complexity was invariant across the
three types of ISDPs. Therefore, the results provide the initial empirical evidence of the
generalizability of the measurement model across the three types of ISDPs.
============================ Table 10 about here
============================
Nomological validity
Nomological (or predictive) validity assesses if a construct measured by the new
measures is associated with other constructs whose measures are known to be valid, as the theory
would predict. In this study, we attempted to analyze the predictive validity of the ISDP
complexity measures by testing a hypothesized positive relationship between ISDP complexity
and project duration. Since our purpose was not testing theory, we provided only the necessary
justification for the hypothesized relationship without considering other constructs.
Our proposed positive relationship between ISDP complexity and project duration is
justified by the argument that project complexity imposes more workload and thus causes longer
project duration [21, 33, 59]. For example, Meyer and Utterback [59] found that technological
complexity as measured by the number of technologies in the development effort was positively
associated with absolute the development time.
Table 11 shows the results of the path analyses of the impacts of (1) overall ISDP
complexity and (2) the four components of ISDP complexity on project duration, respectively.
The results indicate that all four factors of ISDP complexity as well as the overall ISDP
31
complexity positively affected project duration. Therefore, the prediction was supported by the
data. We concluded that the measurement of ISDP complexity demonstrated adequate
nomological validity in predicting project duration.
============================ Table 11 about here
============================
Discussions and Conclusions
The results of both the exploratory and confirmatory data analyses suggest that the 20-
item measure of ISDP complexity developed in this research exhibited adequate levels of
measurement properties. The exploratory factor analysis produced a factor structure as we
hypothesized, providing an initial empirical support to our conceptualization of ISDP complexity
as a four component construct. In addition, the confirmatory factor analysis results suggest that
the hypothesized measurement model had adequate levels of goodness of fit. It also suggested
the existence of a second-order factor, which can be interpreted as the overall ISDP complexity.
The measures were shown to satisfy criteria related to unidimensionality, convergent validity,
discriminant validity, internal consistency reliability, factorial invariance across three types of
projects, and nomological validity.
Contributions to theory development and methodology
This research makes significant contributions to theoretical development. We believe
that ISDP complexity will be an important construct in the vocabulary of IS researchers and
practitioners for the following two reasons. First, an increasing portion of IS activities in
organizations are organized around projects. Therefore, projects constitute an important context
32
and a unit of analysis for research. Second, the constantly changing information technology and
business environments coupled with the growing needs for IT application integrations will cause
the level of ISDP complexity to continue to increase. Therefore, managing complexity appears
to be critical to IS success. Given this increasing significance of ISDP complexity, it is timely
and important to develop a conceptual framework and a valid, reliable measure of the construct.
Although there are other related constructs such as software complexity, general project
complexity, and task complexity, they are not substitutes for ISDP complexity. Task complexity
and project complexity are too general to tap into the unique context of ISDPs. Software
complexity is too limited and narrow to assess the various aspects of ISDP complexity. The new
measure developed in this research overcomes these limitations and covers a wide range of the
domain of the ISDP complexity construct with enhanced specificity.
In addition, by defining four distinct components of ISDP complexity, this research
enables researchers to theorize the construct more precisely. As Baccarini [2] argues, since
complexity is multi-dimensional, when referring to project complexity, it is important to state
clearly the type of complexity being dealt with. The conceptual framework and the measure of
ISDP complexity developed in this research will enable researchers to use these measures to
build and test theories that explain the determinants and impacts of ISDP complexity.
Depending on their study purposes, researchers can select either the second-order factor or the
first-order factors of ISDP complexity as focal constructs to develop theories related to ISDP
complexity.
This research employed a combination of exploratory data analysis and confirmatory data
analysis in developing and testing the measure. Such a research lifecycle consisting of both
33
exploratory and confirmatory methods ensures both the relevance and the rigor of the instrument
development process, which in turn enhances the validity of the measurement.
Practical implications
The results of our study also have important practical implications. Although the
importance of assessing and managing complexity of ISDPs has been widely recognized,
organizations are not well equipped to cope with these challenges. As Kotter [50] suggests,
managing structural and dynamic complexities has become a key responsibility of managers and
executives. As such, this research provides a much needed language and measurement tool that
managers can use to describe and communicate ISDP complexity. First, the empirically
validated four-component framework of ISDP complexity serves as a useful language for
defining and communicating ISDP complexity. Using this framework, project managers can
clearly define the specific aspects and components of ISDP complexity that they must consider
and manage. Second, the measures developed in this study can be used to assess and manage the
complexity of ISDPs in the early planning stages and during implementation. Without such an
assessment tool, it would be difficult for project managers to identify areas of concerns and take
appropriate measures. It has been found that complexity influences the selection of project
inputs including project organizational form, budget, manpower, expertise, and experience
requirements of the project team [2, 47]. Therefore, being able to accurately assess ISDP
complexity enables organizations to better plan, coordinate, and control their projects.
In addition, a valid and reliable measurement tool would allow organizations to learn
from past experiences and establish a knowledge base of organizational techniques that have
been proven to be effective in dealing with different aspects of ISDP complexity. Used together,
34
the assessment tool and the knowledge base enable organizations to develop critical capabilities
that are needed for planning and controlling their ISDPs.
The second-order factor and the first-order factors (or the four components) can serve
different purposes in practice. The second-order factor is useful for communicating the overall
level of ISDP complexity with users and business unit managers. It is also useful for overall
project planning in the early stages of project lifecycle. In contrast, the four first-factors (or the
four components) of ISDP complexity can be used to facilitate detailed assessments and
communications within the project team. They are useful for identifying specific problem areas,
thus enable the managers to strategically manage and control the most important aspects or
components of ISDP complexity during project implementations.
Limitations of the study
Some cautions should be taken when interpreting the study findings and applying the
measure developed in this research. In testing the nomological or predictive validity of the
measurement, the same respondent provided information about both the independent and the
dependent variables, which might cause potential common source biases. Since the projects in
the sample were all recently completed projects, the performance measures such as delivery
time, cost, and functionality were known and thus might have been less subjective. Future
research is needed to further test the nomological validity of the measurement using different
sources for information about the independent and dependent variables.
If independent sample sources had been used for the exploratory factor analysis and the
confirmatory factor analysis, the value of cross-validation of the measure would have been even
greater. However, split-halves from the same sample source also have advantages in that they
35
eliminate sampling errors resulted from different sample sources. In addition, the random
assignment of the data cases to the two sub-samples minimizes potential biases that might be
caused by the differences between the two sub-samples. Nevertheless, future research using
different sample sources is needed to overcome the limitations caused by the use of the same
sample source.
Directions for future research
This research represents the first step toward building theories that provide insights about
the conceptualization and measurement of ISDP complexity. The framework and the measures
developed in this study can help organizations better understand ISDP complexity and can
provide the initial tools for assessing and managing the complexity of their ISDPs. Based on this
study, future research may investigate the organizational determinants of ISDP complexity.
Organizations can then minimize unnecessary complexity and effectively manage necessary
complexity to enhance the success rate of their ISDPs, by creating effective strategies, methods,
and coping mechanisms to control and manage those organizational factors that influence ISDP
complexity.
In addition, future research may investigate the patterns through which the four
components of ISDP complexity affect such dependant variables as project success and
organizational performance. Another promising future research direction is to conduct
longitudinal studies of ISDP complexity. The levels and the impacts of ISDP complexity may
vary between different stages of a project’s lifecycle. Understanding the dynamics of ISDP
complexity can help managers cope with complexity at different points in time during their
project implementation.
36
Finally, it would be important to examine project portfolio complexity. Organizations are
most likely to run more than one ISDP at a time. Optimizing one project may create global sub-
optimization that hinders the performance of the overall project portfolio. Therefore,
understanding complexity at the portfolio level enables IT organizations to achieve efficiency
and effectiveness at the portfolio level in addition to individual project level. Our hope is that
this research serves as a starting point for stimulating researchers to develop theories for
understanding and managing ISDP complexity, and ultimately stopping the dollar drain of ISDP
failures.
37
REFERENCES
1. Anderson, J.C., and Gerbing, D.W. Structural Equation Modeling in Practice: A Review and Recommened Two-Step Approach. Psychological Bulletin, 103, 3 (1988), 411-423.
2. Baccarini, D. The Concept of Project Complexity-A Review. International Journal of Project Management, 14, 4 (1996), 201-204.
3. Bagozzi, R.P. An Examination of the Validity of Two Models of Attitude. Multivariate Behavioral Research, 16, (1981), 323-359.
4. Baker, S. Where Danger Lurks: Spam, Complexity and Piracy Could Hinder Tech's Recovery. Business Week (August 25 2003), 114-118.
5. Balachandra, R., and Friar, J.H. Factors for Success in R&D Project and New Product Innovation: A Contextual Framework. IEEE Transactions on Engineering Management, 44, (1997), 276-287.
6. Banker, R.D., and Slaughter, S.A. The Moderating Effects of Structure on Volatility and Complexity in Software Enhancement. Information Systems Research, 11, 3 (2000), 219-240.
7. Barki, H.; Rivard, S.; and Talbot, J. Toward an Assessment of Software Development Risk. Journal of Management Information Systems, 10, 2 (1993), 203-225.
8. Barki, H.; Rivard, S.; and Talbot, J. An Integrative Contingency Model of Software Project Risk Management. Journal of Management Information Systems, 17, 4 (2001), 37-69.
9. Benamati, J., and Lederer, A.L. Coping With Rapid Changes in IT. Communication of the ACM, 44, 8 (2001), 83-88.
11. Boehm, B.W., and Ross, R. Theory-W Software Project Management: Principles and Examples. IEEE Transactions on Software Engineering, 15, 7 (1989), 902-916.
12. Briggs, R.O.; De Vreede, G.J.; Nunamaker Jr., J.F.; and Sprague Jr., R.H. Special Issue: Information Systems Success. Journal of Management Information Systems, 19, 4 (2003), 5-8.
13. Brooks, F., P., Jr. The Mythical Man-Month. Reading, MA: Addison-Wesley, 1995. 14. Byrd, T.A., and Turner, D.E. Measuring the Flexibility of Information Technology
Infrastructure: Exploratory Analysis of a Construct. Journal of Management Information Systems, 17, 1 (2000), 167-208.
15. Byrne, B.M. Structural Equation Modeling with LISREL, PRELIS, and SIMPLIS: Basic Concepts, Applications, and Programming. Mahwah, N.J.: Lawrence Erlbaum Associates, 1998.
16. Campbell, D.J. Task Complexity: A Review and Analysis. Academy of Management Review, 13, 1 (1988), 40-52.
17. Caron, J.R. Business Reengineering at CIGNA Corporation: Experiences and Lessons Learned from the First Five Years. MIS Quarterly, 18, 3 (1994), 233-250.
18. Charette, R.N. Software Engineering Risk Analysis and Management. New York: Inter-text, 1989.
19. Chin, W.W., and Todd, P.A. On the Use, Usefulness, and Ease of Use of Structural Equation Modeling in MIS Research: A Note of Caution. MIS Quarterly, 19, 2 (1995), 237-246.
20. Churchill, G.A., Jr. A Paradigm for Developing Better Measures of Marketing Constructs. Journal of Marketing Research, 16, 1 (1979), 64-73.
38
21. Clark, K.B. Project Scope and Project Performance: The Effect of Parts Strategy and Supplier Involvement on Product Development. Management Science, 35, 10 (1989), 1247-1263.
22. Cleland, D.I., and King, W.R. Systems Analysis and Project Management. New York: McGraw-Hill, 1983.
23. Davis, F.D. Perceived Usefulness, Perceived Ease of Use, and User Acceptance of Information Technology. MIS Quarterly, 13, 3 (1989), 319-339.
24. Dickson, G.W., and Wetherbe, J.C. The Management of Information Systems. New York, NY: McGraw-Hill, 1985.
25. Duncan, N.B. Capturing Flexibility of Information Technology Infrastructure: A Study of Resource Characteristics and Their Measure. Journal of Management Information Systems, 12, 2 (1995), 37-57.
26. Dvir, D.; Lipovetsky, S.; Shenhar, A.; and Tishler, A. In Search Of Project Classification: A Non-Universal Approach to Project Success Factors. Research Policy, 27, 915-935 (1998).
27. Eisenhardt, K.M., and Tabrizi, B.N. Accelerating Adaptive Processes: Product Innovation in the Global Computer Industry. Administrative Science Quarterly, 40, (1995), 84-110.
28. Ewusi-Mensah, K. Critical Issues in Abandoned Information Systems Development Projects. Communication of the ACM, 40, 9 (1997), 74-80.
29. Faraj, S., and Sproull, L. Coordinating Expertise in Software Development Teams. Management Science, 46, 12 (2000), 1554-1568.
30. Field, T. When Bad Thing Happen to Good Projects. CIO Magazine (Oct. 15 1997). 31. Garmus, D., and Herron, D. Function Point Analysis: Measurement Practices for Successful
Software Projects: Addison-Wesley, 2001. 32. Gefen, D. It is Not Enough to be Responsive: The Role of Cooperative Intentions in MRP II
Adoption. The DATA BASE for Advances in Information Systems, 31, 2 (2000), 65-79. 33. Griffin, A. The Effect of Project and Process Characteristics on Product Development Cycle
Time. Journal of Marketing Research, 34, (1997), 24-35. 34. Haimes, Y.Y. Total Risk Management. Risk Analysis, 11, 2 (1991), 167-171. 35. Hair, J.F.; Anderson, R.E.; Tatham, R.L.; and Black, W.C. Multivariate Data Analysis with
Readings. Sydney, Australia: Prentice Hall, 1995. 36. Halstead, M.H. Elements of Software Science. New York: Elsevier North-Holand, 1977. 37. Hartwick, J., and Barki, H. Communication as a Dimension of User Participation. IEEE
Transactions on Professional Communication, 44, 1 (2001), 21-36. 38. Hopper, M.D. Complexity: The Weed that Could Choke IS. Computerworld, 30, 28 (July 8
1996), 37. 39. Hu, L.T., and Bentler, P.M. Evaluating Model Fit, In Hoyle, R.H. (ed.), Structural Equation
Modeling: Concepts, Issues, and Applications, Thousand Oaks, CA: Sage Publications, 1995, pp. 76-99.
40. Huizing, A., and Koster, E. Balance in Business Reengineering: An Empirical Study of Fit and Performance. Journal of Management Information Systems, 14, 1 (1997), 93-118.
41. Ives, B., and Olson, M.H. User Involvement and MIS Success: A Review of Research. Management Science, 30, 5 (1984), 586-603.
42. Jesitus, J. Broken Promises? Foxmeyer's Project Was A Disaster. Was The Company Too Aggressive or Was It Misled? Industry Week (Nov. 3 1997), 31-37.
39
43. Jiang, J.J., and Klein, G. Information System Success as Impacted by Risks and Development Strategies. IEEE Transactions on Engineering Management, 48, 1 (2001), 46-55.
44. Johnson, J. Chaos: the dollar drain of IT project failures. Application Development Trends, 2, 1 (1995), 41-47.
45. Jöreskog, K.G., and Sörbom, D. LISREL7: A Guide to the Program and Applications. Chicago, IL: SPSS Inc., 1989.
46. Jöreskog, K.G., and Sörbom, D. LISREL VIII User's Guide. Mooresville, IN: Scientific Software, Inc., 1993.
47. Kearney, J.K.; Sedlmeyer, R.L.; Thompson, W.B.; Gray, M.A.; and Adler, M.A. Software Complexity Measurement. Communication of the ACM, 29, 11 (1986), 1044-1050.
48. Keil, M.; Cule, P.E.; Lyytinen, K.; and Schmidt, R.C. A Framework for Identifying Software Project Risks. Communication of the ACM, 41, 11 (1998), 76-83.
49. Keil, M.; Tiwana, A.; and Bush, A. Reconciling user and project manager perceptions of IT project risk: a Delphi study. Information Systems Journal, 12, 2 (2002), 103-119.
50. Kotter, J.P. What Leaders Really Do. Harvard Business Review, 68, 3 (1990), 103-111. 51. Leveson, N.G. Software Engineering: Stretching the Limits of Complexity. Communication
of the ACM, 40, 2 (1997), 129-131. 52. Lyytinen, K.; Mathiassen, L.; and Ropponen, J. Attention Shaping and Software Risk - A
Categorical Analysis of Four Classical Risk Management Approaches. Information Systems Research, 9, 3 (1998), 233-255.
53. Markus, M.L. Power, Politics, and MIS Implementation. Communication of the ACM, 26, 6 (1983), 430-444.
54. Markus, M.L., and Keil, M. If We Build It, They Will Come: Design Information Systems that People Want to Use. Sloan Management Review (1994), 11-25.
55. Marsh, H.W., and Hocevar, D. Application of Confirmatory Factor Analysis to the Study of Self-Concept: First and Higher Order Factor Models and Their Invariance Across Groups. Psychological Bulletin, 97, 3 (1985), 562-582.
56. McCabe, T.J. A Complexity Measure. IEEE Transactions on Software Engineering, SE-2, 4 (1976), 308-320.
57. McFarlan, F.W. Portfolio Approach to Information Systems. Harvard Business Review (September-October 1981), 142-150.
58. Meyer, M.H., and Curley, K.F. An Applied Framework for Classifying the Complexity of Knowledge-Based Systems. MIS Quarterly, 15, 4 (1991), 455-472.
59. Meyer, M.H., and Utterback, J.M. Product Development Cycle Time and Commercial Success. IEEE Transactions on Engineering Management, 42, November (1995), 297-304.
60. Moore, G.C., and Benbasat, I. Development of an Instrument to Measure the Perceptions of Adopting an Information Technology Innovation. Information Systems Research, 2, 3 (1991), 192-222.
61.Murray, J.P. Reducing IT Project Complexity. Information Strategy: The Executive's Journal, 16, 3 (2000), 30-38.
62. Nilsen, K. Adding Real-time Capabilities to Java. Communications of the ACM, 41, 6 (1998), 49-56.
63. Nunnally, J.C. Psychometric Theory. New York: McGraw Hill, 1967. 64. Orlikowski, W.J., and Robey, D. Information Technology and the Structuring of
Organizations. Information Systems Research, 2, 2 (1991), 143-169.
40
65. Rainer, R.K.; Snyder, C.A.; and Carr, H.H. Risk Analysis for Information Technology. Journal of Management Information Systems, 8, 1 (1991), 129-147.
66. Ravichandran, T., and Rai, A. Quality Management in Systems Development: An Organizational System Perspective. MIS Quarterly, 24, 3 (2000), 381-415.
67. Richardson, G.L., and Jackson, B.M. A Principles-Based Enterprise Architecture: Lessons from Texaco and Star Enterprise. MIS Quarterly, 14, 4 (1990), 385-403.
68. Ropponen, J., and Lyytinen, K. Components of Software Development Risk: How to Address Them? A Project Manager Survey. IEEE Transactions on Software Engineering, 26, 2 (2000), 98-112.
69. Schmidt, D.C. Middleware for Real-time and Embedded Systems. Communications of the ACM, 45, 6 (2002), 43-46.
70. Schmidt, R.; Lyytinen, K.; Keil, M.; and Cule, P. Identifying Software Project Risks: An International Delphi Study. Journal of Management Information Systems, 17, 4 (2001), 5-36.
71. Scott, J.E., and Vessey, I. Managing Risks in Enterprise Systems Implementations. Communication of the ACM, 45, 4 (2002), 74-81.
72. Scott, K. Battle Complexity to Add Profitability. InformationWeek 700 (September 14 1998), 18ER.
73. Senge, P.M. The Fifth Discipline. New York: NY: Doubleday, 1990. 74. Sethi, V., and King, W.R. Development of Measures to Assess the Extent to which an
75.Shenhar, A.J. One Size Does Not Fit All Projects: Exploring Classical Contingency Domains. Management Science, 47, 3 (2001), 394-414.
76. Sherer, S.A. Measuring the Risk of Software Failure: A Financial Application, In Proceedings of the Tenth International Conference on Information Systems, Boston, 1989, pp. 237-245.
77. Souder, W.E., and Song, X.M. Contingency Product Design and Marketing Strategies Influencing New Product Success and Failure in U.S. and Japanese Electronics Firms. Journal of Product Innovation Management, 14, (1997), 21-34.
78. Standish Group. The Chaos Report, 1994. 79. Standish Group. The Chaos Report, 2001. 80. Swanson, E.B., and Beath, C.M. Reconstructing the Systems Development Organization.
MIS Quarterly, 13, 3 (1989), 293-307. 81. Tait, P., and Vessey, I. The Effect of User Involvement on System Success: A Contingency
Approach. MIS Quarterly, 12, 1 (1988), 91-108. 82. Thong, J.Y.L.; Yap, C.S.; and Raman, K.S. Top Management Support, External Expertise
and Information Systems Implementation in Small Businesses. Information Systems Research, 7, 2 (1996), 248-266.
83. Truex, D.P.; Baskerville, R.; and Klein, H. Growing Systems in Emergent Organizations. Communication of the ACM, 42, 8 (1999), 117-123.
84. Turner, J.R., and Cochrane, R.A. Goals-and-Methods Matrix: Coping with Projects with ill Defined Goals and/or Methods of Achieving Them. International Journal of Project Management, 11, (1993), 93-102.
85. Venkatraman, N. Strategic Orientation of Business Enterprises: The Construct, Dimensionality, and Measurement. Management Science, 35, 8 (1989), 942-962.
41
86. Weill, P., and Broadbent, M. Leveraging the New Infrastructure: How Market Leaders Capitalize on Information Technology. Boston, MA: Harvard Business School Press, 1998.
87. Werts, C.E.; Linn, R.L.; and Joreskog, K.G. Intraclass Reliability Estimates: Testing Structural Assumptions. Educational and Psychological Measurement, 34, (1974), 25-33.
89. Wheaton, B.; Muthen, B.; Alwin, D.; and Summers, G. Assessing Reliability and Stability in Panel Models, In Heise, D. (ed.), Sociological Methodology, San Francisco, CA: Jossey-Bass, 1977, pp. 84-136.
90. Wideman, R.M. Risk Management. Project Management Journal, 14, 4 (1986), 20-26. 91. Williams, T.M. The Need for New Paradigms for Complex Projects. International Journal of
Project Management, 17, 5 (1999), 269-273. 92. Winklhofer, H. Information Systems Project Management During Organizational Changes.
Engineering Management Journal, 14, 2 (2002), 33-37. 93. Wood, R.E. Task Complexity: Definition of the Construct. Organizational Behavior and
Human Decision Processes, 37, 1 (1986), 60-82. 94. Wozniak, T.M. Significance vs. Capability: "Fit for Use" Project Controls, In American
Association of Cost Engineers International, Dearborn, MI, 1993, pp. A.2.1-8.
42
Tables and Figures
Table 1. Characteristics of the Overall Study Sample (n=541)
Characteristics of organizations Industry Consulting Finance/Insurance Government Healthcare Manufacturing Retail Software Telecom/network Transportation Utility Other Company annual sales Less than $100 million $100 million - $1 billion Over $1 billion Number of employees Less than 1,000 1,000 – 10,000 Over 10,000
6.3% 20.6%
9.2% 5.9%
13.7% 5.3% 9.7% 5.0% 4.0% 7.4%
12.9%
26.0% 31.2% 42.8%
26.6% 40.5% 32.9%
Characteristics of projects Type of project In-house new development Packaged software implementation Enhancement of existing software Number of project members Less than 10 10 – 50 Over 50 Project budget Less than $100,000 $100,000 – 1 million Over $1 million Project duration Less than 6 months 6 – 12 months Over 12 months
38.1% 33.9% 28.0%
25.0% 55.4% 19.6%
17.5% 41.8% 40.7%
24.8% 40.9% 34.3%
Table 2. Comparability Test of the Two Randomly-split Sub-samples (n1=270, n2=271)
t-test for Equality of Means Variable Sub-sample Mean t p
Note: 1. Items in the questionnaire were randomly ordered to avoid biases. The item labels in this table reflect the order in which they appeared in the questionnaire.
2. Factor loadings less than 0.30 are not shown. The results indicate that there were no items with cross-factor loadings greater than 0.30.
DIT a 3 33.16 19 1.75 0.97 0.94 0.041 0.98 Note: (a) This model is saturated because the number of indicators is 3. Therefore, the fit indexes are not available. Fit indexes for this factor were produced from a two-factor model including DIT and SORG. Table 8. Confirmatory Analysis - Composite Reliability ρc (n2 =271)
4.3. Exploratory analysis Test model-data fits of alternative models Parameter estimates of selected “best” model Convergent validity/unidimensionality Discriminant validity Reliability
4.4. Confirmatory analysis
Test invariance/equivalence of measurement model (factorial structure and loadings) across three types of ISDPs
4.5. Factorial invariance analysis
Phase 1 – Conceptual development and initial item generation
Assessment of non-response bias Screening for outliers
4.1 Data screening and descriptive analysis
Test relationships between ISDP size, complexity and performance measures
4.6. Test of nomological validity
Phase 2 – Conceptual refinement and item modification
Phase 3 – Survey data collection
Phase 4 – Data analysis and measurement validation
Note: Numbers in parentheses indicate number of project managers involved.
51
(a) Model 1: The Null Model
(b) Model 2: One First-Order Factor Model
(c) Model 3: Four First-Order Factor Model (uncorrelated)
(d) Model 4: Four First-Order Factor Model (correlated)
(e) Model 5: The Second-Order Factor Model
Figure 3. Alternative Models Tested in the Confirmatory Analysis
Item 1
ISDP Complexity
SORG
SIT
DORG
DIT
Item 2
Item 6 Item 7
Item 13 Item 14
Item 18 Item 19
......
......
Item 1 Factor1
Item 2
Item 3
Item 4
Item 5
Item 6 ….
ISDP Complexity
Factor2
Factor3
Factor4
Factor5
Factor6
Item 1
Item 2
Item 3
Item 4
Item 5
Item 6….
Item 1 SORG
SIT
DORG
DIT
Item 2
Item 6 Item 7
Item 13 Item 14
Item 18 Item 19
......
......
Item 1SORG
SIT
DORG
DIT
Item 2
Item 6Item 7
Item 13Item 14
Item 18Item 19
......
......
52
Figure 4. Parameter Estimates of the Second-Order Model (Model 5, n2 =271)
SORG
ISDPC29
ISDPC6
ISDPC21
ISDPC27
ISDPC9
ISDPC19
ISDPC11
ISDPC16
ISDPC23
ISDPC4
ISDPC25
ISDPC30
ISDPC14
ISDPC24
ISDPC12
ISDPC1
ISDPC26
ISDPC22
ISDPC7
ISDPC17
SIT
DORG
DIT
0.61
0.45 0.65 0.70 0.57
0.44 0.41 0.78 0.55 0.46 0.78 0.64
0.48
0.61 0.82 0.73 0.74
0.70 0.94 0.84
0.30
0.37
0.37
0.76
0.63
0.80
0.58
0.52
0.67
0.80
0.83
0.39
0.70
0.79
0.39
0.59
0.77
0.63
0.32
0.47
0.45
0.51
0.12
0.30
ISDP Complexity
53
Appendix A. Measures and their Reference Sources
ISDP Components Item Item description (reference)
ISDPC6 The project manager did not have direct control over project resources ISDPC9 Business users provided insufficient support and involvement [43, 48, 70] ISDPC21 There was no sufficient commitment/support from the top management [7, 43,
48, 52, 70] ISDPC27 There was no sufficient/appropriate staffing for the project [10, 48, 52, 68, 70]
SORG
ISDPC29 The project personnel did not have required knowledge/skills [7, 8, 43, 48, 52, 68, 70, 71]
ISDPC4 The project team was cross-functional [7, 8] ISDPC11 The system involved real-time data processing [31] ISDPC16 The project involved multiple software environments [58] ISDPC23 The project involved coordinating multiple user units [8, 43, 70] ISDPC25 The project involved multiple technology platforms [58] ISDPC30 The project involved a lot of integration with other systems [7, 8, 58]
SIT
ISDPC19 The project involved multiple external contractors and vendors [7, 43, 70, 94]
ISDPC1 The end-users' organizational structure changed rapidly ISDPC12 The end-users' business processes changed rapidly ISDPC14 Implementing the project caused changes in the users' business processes [8,
71] ISDPC24 Implementing the project caused changes in the users' organizational structure
[8, 71]
DORG
ISDPC26 The end-users' information needs changed rapidly [10, 68, 70]
ISDPC7 IT architecture that the project depended on changed rapidly [70] ISDPC17 IT infrastructure that the project depended on changed rapidly [71] DIT ISDPC22 Software development tools that the project depended on changed rapidly
Note: The items without references were obtained from field interviews and focus group discussions with IS project managers
54
Appendix B. Sorting Procedure and Results
A sorting procedure was used to qualitatively assess the face validity and the construct
validity of the initial 30 items that were generated in Phase 1 of the research process. Four IS
researchers with an average of eight years of IS work experience participated in the sorting
procedure. Each item in the initial pool was printed on a 3 5-inch index card. In the sorting
procedure, each judge was asked to carefully read the card and place it in one of the four
components of ISDP complexity. An additional category, “too ambiguous/unclear” was
included so that the judges could put a card into that category if they felt the card did not seem to
belong to any of the four pre-defined categories. Prior to actually sorting the cards, the judges
read a standard set of instructions. To make sure that the judges understood the sorting
procedure, they did a sorting exercise with the well-known 12-item ease of use and usefulness
instrument [23]. All judges completed this sorting exercise successfully, indicating they had
clear understanding of the sorting procedure and were able to do it appropriately. Each judge
then individually sorted the ISDP complexity item cards. After completing the sorting procedure,
they explained why they sorted cards into the “too ambiguous/unclear” category, if any.
Following Moore and Benbasat [60], we calculated the overall item placement ratio.
This ratio represents how well the judges were able to sort the items into the target constructs. In
total, the judges classified 98 items into the target categories and 22 items into other categories
(shown in Table B1), resulting in an overall placement ratio of 82%. This indicates that the
items were, in general, being placed as they were intended to be. Four items in the SORG
category were commonly placed in the “ambiguous/unclear” category and were dropped. As a
result, 26 items remained after the sorting procedure.
55
============================ Table B1 about here
============================
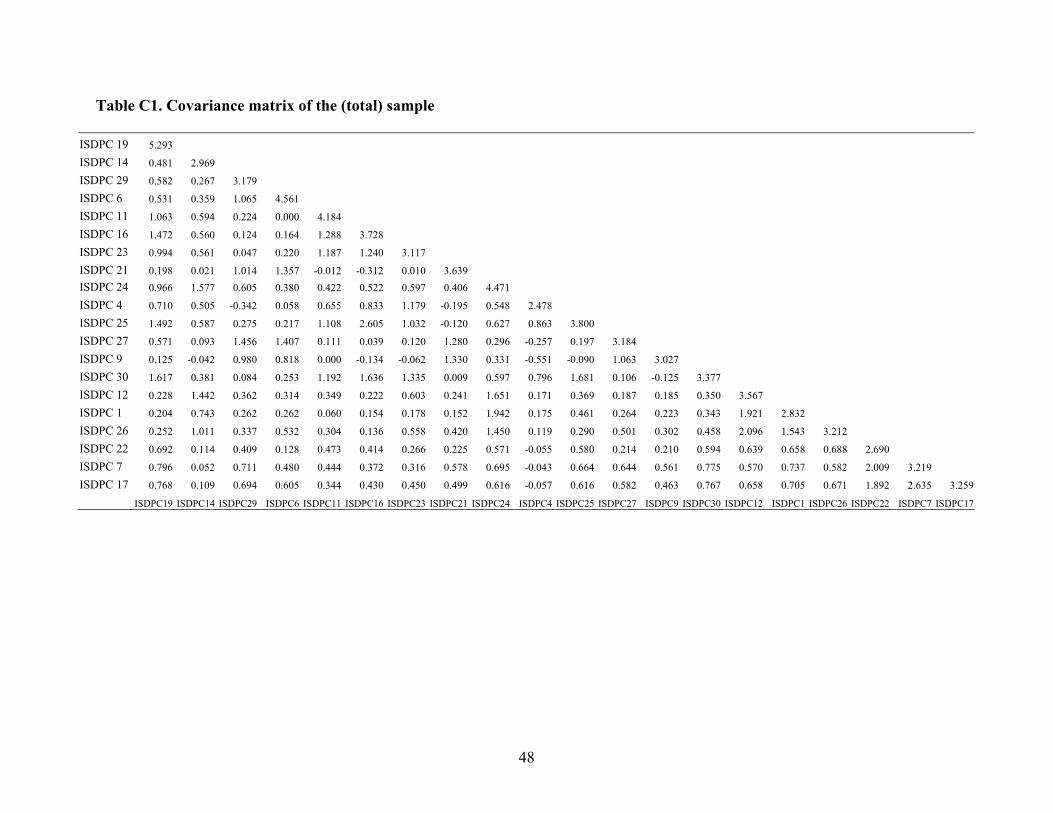
Appendix C. Covariance matrix of the (total) sample