GAP004 Issued: 25 June, 1999 Amended: 10 May, 2001 1 Centre for Tax Policy and Administration Tax guidance series General Administrative Principles - GAP004 Compliance Measurement Compliance Measurement – Practice Note Prepared by the OECD Committee of Fiscal Affairs Forum on Strategic Management Caveat Each Revenue authority faces a varied environment within which they administer their taxation system. Jurisdictions differ in respect of their policy and legislative environment and their administrative practices and culture. As such, a standard approach to tax administration may be neither practical nor desirable in a particular instance. The documents forming the OECD Tax guidance series need to be interpreted with this in mind. Care should always be taken when considering a Country’s practices to fully appreciate the complex factors that have shaped a particular approach.
Transcript
GAP004Issued: 25 June, 1999
Amended: 10 May, 2001
1
Centre for Tax Policy and Administration
Tax guidance series
General Administrative Principles - GAP004 Compliance Measurement
Compliance Measurement – Practice Note
Prepared by the OECD Committee of Fiscal Affairs Forum on Strategic Management
CaveatEach Revenue authority faces a varied environment within which they administer their taxation system.Jurisdictions differ in respect of their policy and legislative environment and their administrative practices andculture. As such, a standard approach to tax administration may be neither practical nor desirable in a particularinstance.
The documents forming the OECD Tax guidance series need to be interpreted with this in mind. Care shouldalways be taken when considering a Country’s practices to fully appreciate the complex factors that have shaped aparticular approach.
The Issues.................................................................................................................................................... 3
What is Compliance? .................................................................................................................................. 3Figure 1: Characteristics of tax authority and taxpayer attitudes to compliance ....................................... 4
Why Do We Need To Measure Compliance?............................................................................................. 5Figure 2: "Simplified" Risk Management Cycle....................................................................................... 6
Different Measurement Methods ................................................................................................................ 6
Evaluation Issues for Compliance Improvement Strategies ..................................................................... 11Figure 3: A Revenue Impact Matrix ....................................................................................................... 12
General Comment on the Future ............................................................................................................... 13
Available Writings and Research.............................................................................................................. 14
In Conclusion ............................................................................................................................................ 15
1. This paper is another in the Tax Guidance series of strategic management papers focussing on GeneralAdministrative Principles. It has been developed in consultation with a number of OECD members.
2. The purpose of this paper is to raise issues in defining compliance and to provide a synopsis of the work done todate on measuring taxpayer compliance. It seeks to encourage discussion and further research into the topic of measuring taxcompliance (or non-compliance) - especially compliance in the large corporate taxpayer sector. While there is a significantbody of published work on compliance measurement (mainly from the United States), such works are in great part limited toindividuals and occasionally small business. As Eric Rice (1992: 126) has noted in his paper on the Corporate Tax Gap, "...despite its real world importance, corporate income tax evasion has attracted essentially no scholarly analysis."
The Issues
3. Most tax authorities around the world undertake a mix of processing, service, enforcement, litigation and sometimeslegislative activities, many of which are aimed at improving taxpayer compliance. In carrying out these activities, it isimportant for a tax authority to be able to determine whether these activities are achieving the required outcomes, includingdetermining whether there are having any impact on compliance. How do tax authorities demonstrate whether taxpayerswithin their jurisdiction are more compliant today than they were say 5 to 10 years ago?!
4. Any examination of compliance measurement raises a number of issues, including -• definitions of compliance;
• methods by which tax authorities measure levels of compliance and hence identify areas of apparent low compliance; and
• methods by which tax authorities (and others?) measure the effect of an administration’s strategies (whether of anenforcement, legislative, litigious or service nature) which seek to improve compliance.
What is Compliance?
5. In attempting to measure compliance, it is important to know what is to be measured - evasion, avoidance,compliance or non-compliance. How is compliance defined - is it compliance according to the tax authority's or the taxpayer'sinterpretation of the law and its application to the facts? Is it from another more neutral perspective? Researchers havelamented over the lack of agreement to exactly what is being measured, noting that this has been a key obstacle to progress(see Henry, 1983).
6. In considering definitions of compliance, it is convenient to divide compliance into two key categories -• Administrative compliance (complying with the administrative rules of lodging and paying on time, what some would
include within their definitions of compliance with reporting requirements1, procedural compliance2 or regulatorycompliance3); and
• Technical compliance (i.e., taxes calculated in accordance with the technical requirements of the tax laws or taxpayers paytheir share of tax in accordance with the provisions of the tax laws.)
7. Obviously, measuring technical compliance must begin with determining the correct amount of tax payable. Giventhe not uncommon ambiguity in the interpretation and application of the tax laws, determining what is the correct amount oftax can differ widely, depending in part on the background, biases and skill levels of the person(s) endeavouring to do so.
8. Generally, income tax laws are not clear cut, especially those applying to large corporates. There are significantareas within these laws which are uncertain or ambiguous (or grey), where taxpayers and tax administrations (and others)might have reasonable but differing interpretations of what the tax laws require. According to Long and Swingen (1991: 646),ambiguity exists at three levels –• in the precise meaning of statutory language,
• in the application of how the law applies in a specific factual situation, and
• in the type of evidence sufficient to establish the facts.
9. Tax authorities and taxpayers often take different positions in defining compliance where the law is uncertain orgrey. Figure 1 below seeks to show the difference in positions which might be adopted by a tax authority, by an aggressivetax-minimising taxpayer and by a tax-conservative taxpayer. A taxpayer who aggressively seeks to exploit the law may take aposition at point X, say, in the range of possible interpretations of compliance with an uncertain law, whereas point Yrepresents the position which a quite conservative taxpayer might take. The tax authority's position will often lie somewherebetween these two extremes.
Figure 1: Characteristics of tax authority and taxpayer attitudes to compliance
CHARACTERISTICS OF TAX AUTHORITYAND TAXPAYER ATTITUDES TO
COMPLIANCE
Tax Authoritypositiongoverned by
- Perception offairness andequity
- Revenuecommitment toGovernment
- Need to protectits revenue base
Position ofconservativetaxpayerreflecting owninterpretation oflaw
Tax Authoritypositioncommunicatedby
- Rulings- Willingness to
litigate- Consistency of
case managerapproach
- Public statements, PR
Defensible positionof aggressivetaxpayer puttingcreation of wealthfor share holdersabove the notion of‘good corporatecitizenship”
Ultra Conservative Evasion
GREY AREA OF LAW
TaxPlanning
ArtificialCommercial
Tax Planning
Active tax planning
Y x
10. Though surveys of tax practitioners indicate ambiguity is a significant problem for taxpayers at all income levels,Long and Swingen assert any ambiguities which lead a taxpayer to a different interpretation from that of the taxadministration’s (assumedly inclusive of a tax administration’s interpretation developed and promulgated well after lodgementof the tax return) traditionally are considered by administrations as representing non compliance (op cit: 647). It is emphasisedthat what is being defined is compliance with the tax laws, not whether the tax laws are effective.
GAP004Issued: 25 June, 1999
Amended: 10 May, 2001
5
11. Interestingly, the authoritative and often referred to work commissioned by the US’s IRS and edited by Roth, Scholzand Witte (1989)4, generally treats taxpayers who take an ambiguous position as being compliant. They prefer to use the termtax reduction to mean compliant behaviour that reduces tax in a way perhaps unintended by legislators, but is permissibleunder statute. Therefore in figure 1, Roth et al would assert that taxpayers at all points between X and Y, inclusive, arecompliant.
12. Compliance with the tax laws as interpreted or confirmed by the judiciary may be a truer definition of compliance.Arguably, this removes the uncertainty or greyness; with both the taxpayer and tax authority’s interpretation merging at thatpoint. However, particularly with the more complex areas of the law often applicable to large corporates, Court interpretationsoften turn on the facts of that case. In addition, the time lags associated with litigation often mean the judiciary’s position isnot known at that earlier point in time. So in practical terms, in the absence of a pertinent judicial decision, the dilemmaremains, compliance according to whose perception - the taxpayer’s, the tax authority’s or someone else’s?
13. Kinsey’s assertion that most research tends to treat non-compliance as if it were a behaviour when it is actually asocial judgement5 may indeed be correct.
b) Motivation 6
14. Should “intention” be an important factor in determining non-compliance?
15. Until recently, most research7 assumed all non-compliance was intentional, but is that so? Logically, it would seemthe more complex the tax laws, the more the chance of a taxpayer reporting incorrectly. Given that large corporates operate inan environment of highly complex laws – tax and others, it is reasonable to assert that taxpayers in this large segment would bemore susceptible to unintentional, incorrect reporting. Interestingly, Long and Schwartz (1987) have shown that this does notnecessarily mean under-reporting. They found higher income earners and business taxpayers to be more likely to assessthemselves to tax at too high a level as well as at too low a level.
16. From a tax administrator's viewpoint, to be able to measure compliance in a practically feasible way, it seemspreferable to adopt an approach which removes any reference to motivation. Such an approach is supported by Smith (1988:22), " .... it is important we do not build intentionality into the definition of non-compliance", and Roth, Scholz, Witte (1989:22) who "..... excluded ..... judgements about the intentions and psychic state of the taxpayer from the definition ofcompliance."
17. Seemingly, more discussion needs to be undertaken on definitional issues, including ambiguity and motivation, andon varying country approaches to these issues. For the purposes of this paper, the issues around ambiguity are recognised andthe issue of motivation has been removed - so that the paper may move on and examine some of the possible ways available tomeasure compliance levels.
Why Do We Need To Measure Compliance?
18. It is reasonable to assume tax authorities seek to use their resources in an optimal way. It is also reasonable toassume administrations seek to collect the tax correctly payable in accordance with the tax laws. Therefore as part of theprocess in allocating scarce resources to achieve maximum effectiveness, it is appropriate to identify areas (issues and/ortaxpayers) of low or non-compliance, and then be able to rank them.
4 A panel consisting of eminent researchers was commissioned by the IRS. They published a 2 volume work on
taxpayer compliance in 1989, see "References" section.5 See Long and Swingen (1991: 657)6 Also referred to as 'intentionality' by Smith (1988: 22)7 For example - Allingham and Sandmo (1972), Cowell (1985)
GAP004Issued: 25 June, 1999
Amended: 10 May, 2001
6
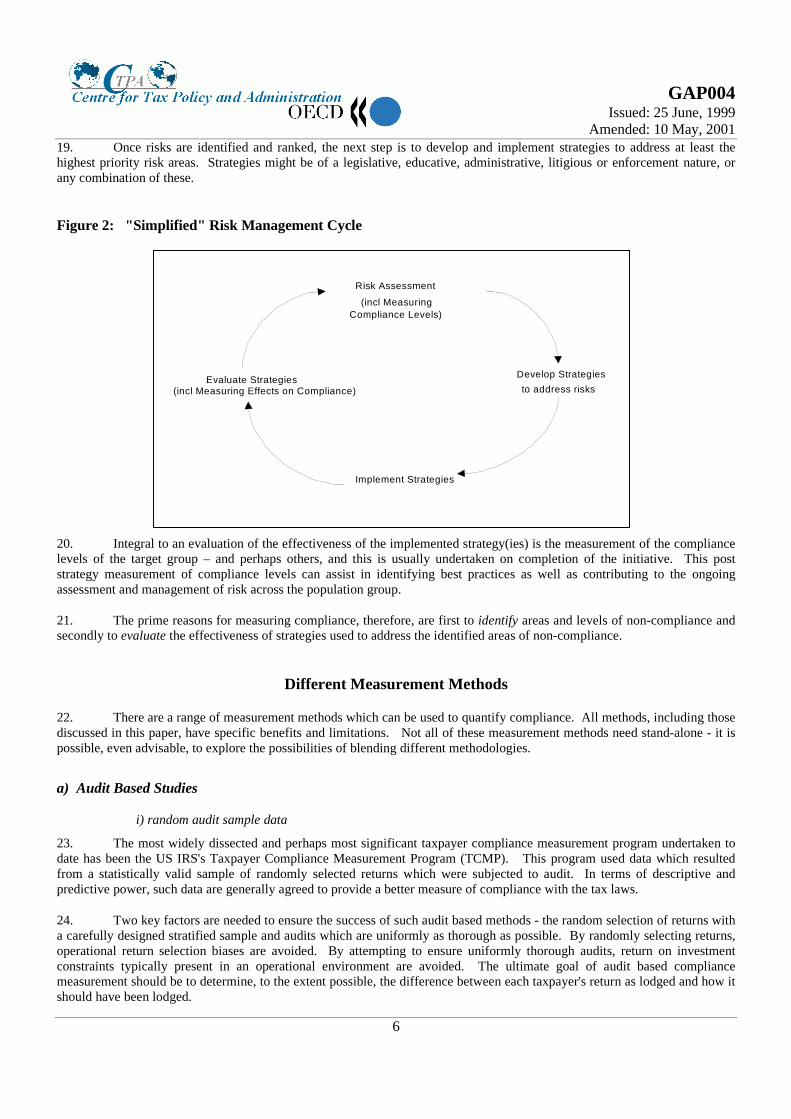
19. Once risks are identified and ranked, the next step is to develop and implement strategies to address at least thehighest priority risk areas. Strategies might be of a legislative, educative, administrative, litigious or enforcement nature, orany combination of these.
Figure 2: "Simplified" Risk Management Cycle
20. Integral to an evaluation of the effectiveness of the implemented strategy(ies) is the measurement of the compliancelevels of the target group – and perhaps others, and this is usually undertaken on completion of the initiative. This poststrategy measurement of compliance levels can assist in identifying best practices as well as contributing to the ongoingassessment and management of risk across the population group.
21. The prime reasons for measuring compliance, therefore, are first to identify areas and levels of non-compliance andsecondly to evaluate the effectiveness of strategies used to address the identified areas of non-compliance.
Different Measurement Methods
22. There are a range of measurement methods which can be used to quantify compliance. All methods, including thosediscussed in this paper, have specific benefits and limitations. Not all of these measurement methods need stand-alone - it ispossible, even advisable, to explore the possibilities of blending different methodologies.
a) Audit Based Studies
i) random audit sample data
23. The most widely dissected and perhaps most significant taxpayer compliance measurement program undertaken todate has been the US IRS's Taxpayer Compliance Measurement Program (TCMP). This program used data which resultedfrom a statistically valid sample of randomly selected returns which were subjected to audit. In terms of descriptive andpredictive power, such data are generally agreed to provide a better measure of compliance with the tax laws.
24. Two key factors are needed to ensure the success of such audit based methods - the random selection of returns witha carefully designed stratified sample and audits which are uniformly as thorough as possible. By randomly selecting returns,operational return selection biases are avoided. By attempting to ensure uniformly thorough audits, return on investmentconstraints typically present in an operational environment are avoided. The ultimate goal of audit based compliancemeasurement should be to determine, to the extent possible, the difference between each taxpayer's return as lodged and how itshould have been lodged.
Risk Assessment
Develop Strategies
to address risks
Implement Strategies
Evaluate Strategies (incl Measuring Effects on Compliance)
(incl Measuring Compliance Levels)
GAP004Issued: 25 June, 1999
Amended: 10 May, 2001
7
25. The taxpayer types included in the IRS’s TCMP have usually been individuals, though returns from smallcorporations, estates, partnerships, tax exempt organisations, and employee pension plans have been included in some surveys.The sample size in the first year was 100,000 taxpayers, in later years 50,000 and in proposals for even later years 26,000.
26. There are a number of potential detractions from audit based compliance measurement programs.
27. First, the cost of audit based compliance measurement is typically the opportunity cost - the cost of productiveauditor work foregone to perform the audits on a randomly selected cases without an unknown productivity expectation. Thesecosts and other more direct costs are not trivial and would appear to be the reason for this type of program not being adoptedmore widely.
28. The second potential detraction is the potential burden on the taxpayer population in auditing taxpayers at random.Assumedly, this burden could be observed by way of random audit selection processes resulting in more "no change" outcomesthan other audit cases selection processes would. If, however, the data from compliance measurement were used to developmore effective case selection techniques which resulted in a lower overall "no change" rate, the increase in short term burdenmight be offset by a decrease in long term burden.
29. Intrusiveness is an issue if audits in an audit based compliance measurement program are significantly morerigorous than more common operational audits. With the US’s TCMP, the increased intrusiveness takes the form of broader,not deeper audits. In TCMP, auditors are required to consider each line item on the tax return and determine whether there issufficient cause to investigate it. A justification for the increased intrusiveness or scope of compliance measurement auditsmight be that new or emerging tax compliance issues need to be addressed in the process. Often these issues may not appearcost effective to work in an operational environment, however, compliance measurement audits might better detect suchproblems, whether the eventual solution might involve refocusing enforcement activities or some other administrative orlegislative remedy. Another justification might be that issues too small to be reliably detected through normal operationalaudit activities might be detected as being so pervasive as to be fiscally significant.
ii) operational audit data
30. It is possible to reduce the burden, intrusiveness and opportunity costs of audit based compliance measurement byusing data from normal operational audit activity.
31. However, the compliance measures resulting from operational data have the potential to be inaccurate and notrepresentative of the taxpayer population. It is important to note that the goal of compliance measurement is to describe thelevel of compliance of the taxpayer population, not just that part selected for normal audit scrutiny. In using thismethodology, the tax authority’s tactical goal of attempting to ensure only sufficiently non compliant taxpayers8 are selectedfor audit can be diametrically opposed to its strategic goal of determining taxpayer compliance patterns.
32. Further, care must be exercised if anything other than a random9 sample is to be used as some researchers havefound taxpayers who are selected for regular audits do not tend to be representative of non-compliant taxpayers (Long &Swingen, 1991: 658, however note they cite researchers with different views).
33. Also with operational audit compliance measures, there are no verification processes to ensure assumed complianttaxpayers are, in fact, compliant. By using indicators of non-compliance to select audit cases, large portions of the compliancelandscape can go unexplored. In addition, new and emerging or difficult to audit issues may not surface as these may bethought to be unproductive areas for audit.
8 For example, salary and wage employees are often felt to represent low risk of non-compliance because income tax iswithheld at source. These types of taxpayers frequently represent a large percentage of the total number of taxpayers. If thesetaxpayers are not subject to audit in relative proportion to their numbers, compared with other types of taxpayers representinghigher compliance risks, the measurement of taxpayer compliance may become skewed.
9 Interestingly but perhaps not surprisingly, Peereboom (1995: 15) has noted a practical problem with the randomallocation of taxpayers to different treatments in that tax auditors prefer to audit taxpayers at high risk instead of taxpayersbelieved to be compliant.
GAP004Issued: 25 June, 1999
Amended: 10 May, 2001
8
iii) other issues in audit based methods
34. Another detraction with audit based methods is the inability of an auditor to fully detect the extent of non-compliance in every case. Reasonably arguable differences as well as inadvertent non-compliance are probably more likely tobe detected in an audit, than would be deliberate and perhaps exploitative attempts to conceal an issue from an auditor.
35. Account also needs to be taken of the biases that an auditor from a tax administration brings to an audit. Feinstein(1991), has used IRS audit data and econometric techniques to estimate the extent and some of the causes of variationsoccasioned by auditor bias (including auditor experience). One of his conclusions was that ".... variations in detection rates areat least as important a source of variation in detected evasion across cases as variations in .... (taxpayer) characteristics. Toexplore the variation in detection, individual effects .... (were specified).... for .... (auditors). .... Collectively, these effects arehighly significant, and they indicate considerable heterogeneity among (auditors)" (op cit: 15). Elffers, Robben and Hessing(1989, 1991) and Elffers (1991) work within the Netherlands has suggested that variations dependent on the auditor can besignificant.
b) Changes in Tax Return Items
36. Another, perhaps more straightforward method for measuring compliance is to compare changes in items ontaxpayer return forms from period to period10 to deduce changes in compliance levels.
37. The applicability of this ’simple’ methodology is questionable in a real world environment where there are numerousfactors that impact on a taxpayer’s performance over time. At the large end of the market, these factors are often from globalinfluences on income and expenditure, influences often beyond the researcher’s ability to readily identify and measure.Examples of these factors may include corporate restructuring (e.g. mergers and acquisitions), costs associated withestablishing new markets, and new legislative and administrative policies at home and offshore both of a tax and non-tax kind.
38. Long and Swingen (1991: 662) undertook a comparison of data from return based measures and data about changesin compliance from TCMP. They found changes within the two sets of data moved entirely independently of each other. Theyrecommended that such measures should not be relied upon until their reliability and validity can be established via furtherresearch.
39. While the quantity of return form data is significant and permits better trend information than trends using auditresults, support for this methodology may be limited because of the inability to take into account many impacts of the realworld environment. It would seem that further research using this methodology should be limited to relatively homogenous,non-complex taxpayer populations, and ideally where suitable control groups can be found.
c) Financial Data - Comparisons, Ratios, etc
40. This includes methods which seek to predict the likelihood of a taxpayer or a group of taxpayers being noncompliant by using comparisons over time or across a population (e.g. across an industry) of a number of key financialperformance trends and indicators. Some of these trends and indicators can include the following, which are explained in moredetail in appendix A:-
• Capital Structure Ratios (including gearing, net debt cover, net interest cover)
41. Generally, differences between accounting or book profits and taxable income will usually occur because of thebasic differences in accounting and tax concepts and because there are usually some legal preferences available to taxpayersunder applicable tax laws. It has been contended that levels of technical compliance may be effectively measured by
10 In jurisdictions where several different taxes (e.g. income tax, consumption tax, payroll tax) are administered by oneorganisation, it is also possible to conduct comparisons between return form data for different types of tax in a single period.
GAP004Issued: 25 June, 1999
Amended: 10 May, 2001
9
examining the gap between accounting profits and taxable income. Some relevant indicators in this regard might be effectivetax rates, taxable income to accounting profits, and taxable income to total income.
42. The most appropriate set of ratios will vary, depending on the type of taxpayer population being examined (e.g. thetype of industry) and the area-of-risk being focussed upon. For example, performance/profitability type ratios are arguablymore appropriate when focussing on offshore profit shifting.
43. A typical approach to establishing performance benchmarks for a taxpayer population is to calculate the mean, orsome other appropriate statistic such as the trimmed mean, median or mode, for each of the corresponding attributes of the dataset. The statistics to be preferred will depend on a number of factors, which include the reliability of the underlying data, thevariability of the corresponding attributes across the members of the population, the degree to which the members of the dataset represent a homogeneous population, and the theories underlying the uses of the attributes as performance benchmarks.11
44. These statistics can then be used as benchmarks for comparing the performance and compliance behaviour ofindividual members of groups of the taxpayer population.
45. A good reason for undertaking analysis of compliance by using data external to the tax administration is that dataare not limited to tax return data, and therefore measurement may not be subjected to the time lags associated with thelodgement and processing of tax returns. At the larger end of the market, typical sources for the basket of information thatmay be used in ratio and other compliance analyses include the taxpayer’s published accounts, external commercial databases,newspaper and other media reports, other law enforcement agencies’ reports and databases, and of course the tax returnsthemselves.
46. It is axiomatic in compliance research that multiple measures of data points allow better estimates both of dataprecision and data reliability. Therefore, comparisons of internal and external data should prove useful.
47. As with other methods, there are problems in the application of this methodology with identifying, isolating andquantifying the effects of a range of global and domestic factors which may influence the taxpayer’s performance.
48. Further, data is often only available in aggregate form. The only feasible way to use such data is to conductcategorical matching rather than case by case matching. Further, with aggregated financial data, tensions may exist whereinformation provides two or more opposing interpretations, e.g. one ratio set indicates a remarkable improvement over timeand another shows a small, or even no improvement. It may, therefore, be preferable to limit the outcomes from thismethodology to a more qualitative assessment of compliance levels (rather than quantitative). Some experiences frompreliminary use of this methodology have indicated that it is best used in a mix of qualitative and quantitative ways to measurea single taxpayer’s (which may be a corporate group) performance longitudinally over time.
49. With a well segmented market approach to tax administration, the effects of some of the limitations may beminimised by the practical knowledge held by frontline operatives and their understanding of their segment participants.
d) Other Methods
i) Surveys
50. Roth, Scholz and Witte (1989: 210) and Long and Swingen (1991: 660) refer to the works of other researchers12
with surveys of, or self reports by, taxpayers. These studies used responses from samples of taxpayers (ranging from 500 to2,000) on failures to report non compliance. Roth et al (op cit: 211) list the strengths of surveys as their ability to capture a
11 A major project in Australia, currently in its development stages, seeks to develop a series of models usingstandardised data (from within, and external to, the ATO) which can be applied to measure taxpayer profitability and taxperformance compared to economic activity. An outcome should be the development of a number of indices including aprofitability index, a taxation index and an effective tax index that could be used to measure trends in compliance. The projectis a collaborative effort between a prestigious business school and the tax administration in Australia.12 e.g. Mason, Calvin and Faulkenberry (1975); Aitken and Bonneville (1980), Yankelovich et al (1984); Hessing,Elffers and Weigel (1988).
GAP004Issued: 25 June, 1999
Amended: 10 May, 2001
10
broad range of explanatory variables known only to taxpayers, notably their understandings of compliance requirements,relevant values and attitudes, expectations of risks and benefits of non compliance, and other events etc which affect ataxpayer’s willingness to comply or not.
51. Disadvantages noted by Roth et al (1989: 212) and Long and Swingen (1991: 660) include the accuracy and henceconfidence in the data through variations in definitions of issues such as non compliance, the integrity of the answers13 fordeliberate or inadvertent reasons (e.g. memory lapses, or taxpayers may have little involvement in return preparation leaving itto their tax agents) and the inability to report on inadvertent omissions. Interestingly, Hessing et al (1988) found nocorrelation between self disclosed non-compliance and auditor findings.
ii) Direct Observation
52. Long and Swingen (1991: 657) note that this technique is used extensively in tax evasion experiments (e.g. seeWebley et al 1991; Alm 1991). Here the researcher knows and perhaps controls the subject’s correct tax liability, comparingthat with what the subject reports. The effectiveness of this is affected by the ‘realism' of the experiment to the subject.However, it is suggested that the methodology can be used more widely. Whether it is appropriate for large corporatecompliance measurement is arguable, given the number of decision makers etc (e.g. tax manager, tax agent, legal department,board of directors, CEO) which have an impact on the corporate's tax behaviour.
(iii) Analytical Modelling
53. The value of compliance measurement data can be potentially enhanced or extended by descriptive and/or predictivemodelling. Various statistical and mathematical methodologies may be used for extrapolating raw compliance measures, eachof which holds the potential to provide varying degrees of descriptive and predictive power. However, all of these methodspresume there is some representative, stable basis from which to extrapolate. Practically, this usually presumes theavailability of audit based compliance measurement data.
54. The benefit of analytical modelling is that less data should be needed to describe compliance issues. The potentialcost of such modelling is around error estimates for models based on small data sets, which can be expected to be greater thanthe error estimates on direct analysis of larger, raw data sets.
55. In the US, the IRS has developed the Compliance Research Information System (CRIS), which uses a regressionbased modelling technique to extend TCMP data into compliance estimates for individual market segments. Although this hasenhanced the utility of the TCMP data for compliance measurement purposes, it is emphasised that the availability of suchaudit type data was a precursor to the development of CRIS.
56. In scaling up data, care needs to be taken in the choice of an appropriate estimator. Not surprisingly, widelydiffering population estimates of non-compliance can be obtained depending on which estimator is used. Whatever type ofestimator is used, specific attention needs to be given to ensuring careful consideration of the wide range of accompanyingstatistical caveats; the underlying (perhaps only implicit) theory utilised about the determinants of non-compliance; and themain uses to which the various estimates are to be put. (Wickerson 1993: 22)
iv) Laboratory/Field Experiments
57. Wallschutzky (1993:9) refers to a Dutch study by Webley, Robben and Morris14 and suggests a number ofpossibilities for using experiments. For example, field experiments would allow researchers to determine which variables aremore likely to affect reporting behaviour. Participants could report under a scenario of help/assistance, others could be told
13 Spicer and Lundstedt assert their mail survey (conducted in 1974) used a survey design and a pre test which assuredthem of a fairly high degree of face validity. Further, on the issue of respondent honesty, Spicer and Lundstedt felt thatresponses which guaranteed complete confidentiality and which related directly to an individual’s own propensity to evadecould produce reliable results.14 Reportedly, one of the first field experiments to use the general public in a computer simulation concerning incomereporting for a shop which was managed by the participants over a three year period. Different information was given toparticipants and participants were advised they could expect an audit.
GAP004Issued: 25 June, 1999
Amended: 10 May, 2001
11
about penalties and yet others about the possibilities of an audit. The most influential variables could then be determined.Problems with laboratory experiments, he observes, include ethical issues, the representativeness of participants (often studentsare used), the small scale and ability to generalise, as the disposition of participants to treat the experiment as a game and not areal life situation.
58. Roth et al (1989: 229) recommended to the IRS that the use of field and laboratory experiments be expanded toanalyse the compliance effects of innovations in tax administration. They do recognise the limits imposed by theadministrative burdens and opportunity costs and the law itself. An area considered to be ‘fruitful' for experimentation includethe functions of tax administration. (op cit: 230)
e) Which Method Should Be Used?
59. There is no correct answer. Though tax compliance research may have come a long way since the theoreticaleconomic analysis of Allingham and Sandmo in 1972, today there are still no simple or off-the-rack models for preciselymeasuring the level of taxpayer compliance. Not surprisingly, given the varying definitions and perspectives, the outcomesfrom one method are not reinforced by other measures of compliance. Long and Swingen (1991: 664) observe that it seemslikely that different methods prove advantageous for measuring different types of behaviour or when obtaining perspectivesfrom different parties in the process by which compliance becomes defined. However no one method can address all needsand perspectives.
60. Perhaps, as Long & Swingen (op cit: 664) suggest, the answer lies in focusing on specific types of non compliance,not presuming to measure all things for all people in a single item or on a one dimensional scale. As there is not oneuniversally applicable solution, methods may need to be tailored to different groupings. Also, it may be that no one singleindicator is applicable, with progress being assessed in relation to a number of different indicators, derived from a number ofdifferent methodologies, which taken together provide a measure of the compliance level.15
Evaluation Issues for Compliance Improvement Strategies 16
a) Generic Problems In Measuring Changes In Taxpayer Compliance
61. Logically, the problems associated with measuring taxpayer compliance at both the individual taxpayer and group orpopulation level need to be taken into account when assessing the extent to which taxpayer compliance may have changed overa period of time. As a general rule, it cannot be assumed that the magnitude and incidence of these measurement problems willbe constant over time and hence can be safely ignored. These problems, therefore, are of central importance when evaluatingthe compliance impact of tax administration programs.
62. This is particularly so where the tax base and hence the true level of reportable taxable income has changed over theevaluation period. This can result from changes in the tax laws, economic conditions or in the tax-related structure of thetaxpayer. In addition, the extent and nature of the taxpayers' underlying propensity to comply may have changed over theperiod. If so, whether or not this is due to the program treatment is in itself a moot point, especially where this was the desiredoutcome.17
63. The measurement of changes in tax compliance is confronted by a number of potentially complex ‘index number'type problems. In many areas of the social sciences, ‘index numbers' are constructed so as to remove or at least reduce thedegree of ambiguity that would otherwise adversely affect the monitoring of changes in key economic and social indicators.
15 An analogy is with the tools of economic management. No one indicator provides a definitive measure of a country'sperformance, rather an overall assessment is made on the basis of a range of different indicators.16 The majority of this part of the paper is from a paper presented at an ATO Research Conference by J Wickerson - see"References".17 Importantly, not all components of a compliance improvement program will necessarily improve taxpayers'underlying propensities to comply. For example, deterrence based programs arguably do not have this effect, whereas, bycontrast, initiatives which successfully enhance taxpayers' sense of public duty arguably do have such an effect.
GAP004Issued: 25 June, 1999
Amended: 10 May, 2001
12
64. Once compliance is defined (see paragraphs 5 to 17 above), the further challenge is then to take into account allother types of economic, social and legal changes which would otherwise prevent an unambiguous interpretation of the dataavailable for a change in taxpayer compliance per se. These challenges arise at both the individual taxpayer and correspondingpopulation levels of analysis. To date, little or no research has focussed on the nature and extent of these and similar ‘indexnumber' problems. Yet these problems can be critical, especially where the measure of compliance is the percentage of taxableincome which is correctly reported. Of course, this is the natural measure of compliance to take when taxable income has itselfchanged over time. However, as Long (1991: 189) has pointed out, quite feasible variations in profit margins can fully accountfor observed changes in the ‘compliance rate' for businesses. Taking such variations into account, Long suggests, can bringinto question the widely held view that the rate of compliance by small businesses has been declining in the United States.18
65. It is reasonable to argue that such ‘index number' problems are more likely to be tractable where the focus is onreasonably homogeneous groups of taxpayers who are affected in much the same way by changes in the tax laws, economicconditions, etc.
66. In turn, the problems in measuring or estimating the impact on taxpayer compliance of narrowly-focussedcompliance initiatives are likely to be less than in the case of broadly-based ones.19 However, the general point is that even ifit is possible to utilise (say) suitable ‘control' and ‘experimental' populations of taxpayers to demonstrate that a programinitiative had some beneficial overall revenue impact, it may not be possible to demonstrate convincingly that compliance bythe latter population has unambiguously improved compared to that prior to the program 'treatment'.
67. This point applies to each of the following four main components which can constitute an observed program-induced change in compliance by a targeted population of taxpayers.
b) Four Main Components Of Changes In Taxpayer Compliance20
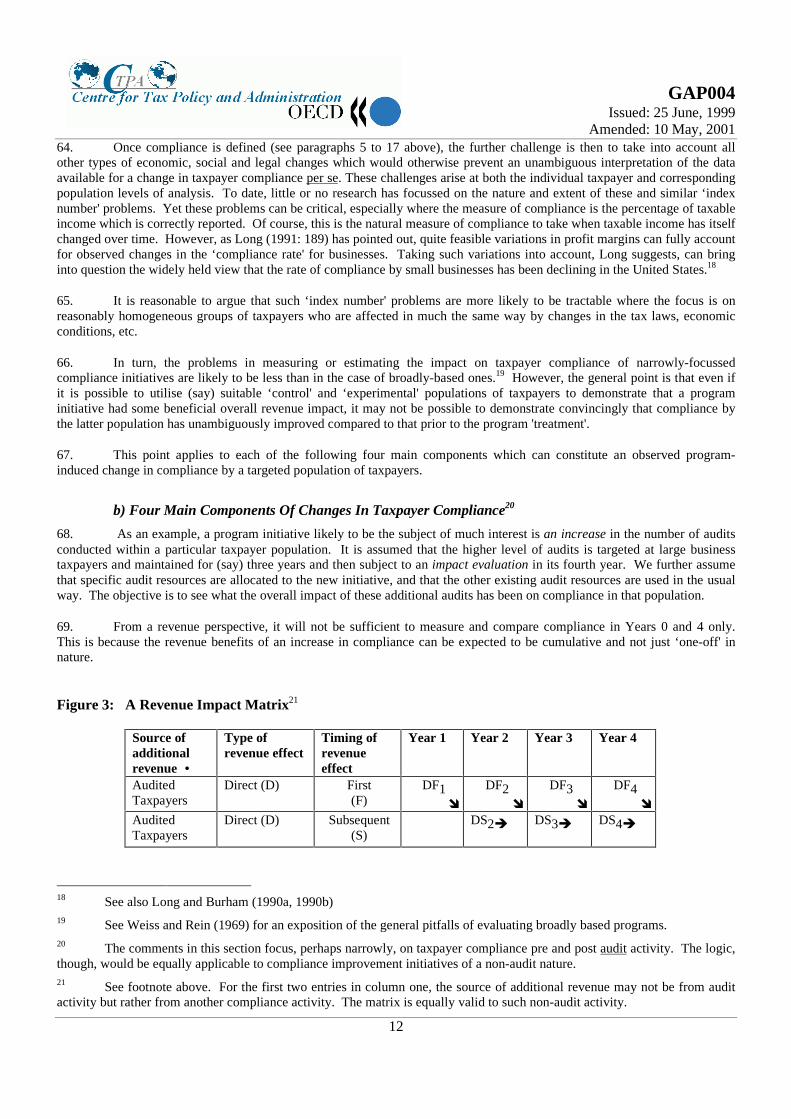
68. As an example, a program initiative likely to be the subject of much interest is an increase in the number of auditsconducted within a particular taxpayer population. It is assumed that the higher level of audits is targeted at large businesstaxpayers and maintained for (say) three years and then subject to an impact evaluation in its fourth year. We further assumethat specific audit resources are allocated to the new initiative, and that the other existing audit resources are used in the usualway. The objective is to see what the overall impact of these additional audits has been on compliance in that population.
69. From a revenue perspective, it will not be sufficient to measure and compare compliance in Years 0 and 4 only.This is because the revenue benefits of an increase in compliance can be expected to be cumulative and not just ‘one-off' innature.
Figure 3: A Revenue Impact Matrix21
Source ofadditionalrevenue •
Type ofrevenue effect
Timing ofrevenueeffect
Year 1 Year 2 Year 3 Year 4
AuditedTaxpayers
Direct (D) First(F)
DF1�
DF2�
DF3�
DF4�
AuditedTaxpayers
Direct (D) Subsequent(S)
DS2� DS3� DS4�
18 See also Long and Burham (1990a, 1990b)19 See Weiss and Rein (1969) for an exposition of the general pitfalls of evaluating broadly based programs.20 The comments in this section focus, perhaps narrowly, on taxpayer compliance pre and post audit activity. The logic,though, would be equally applicable to compliance improvement initiatives of a non-audit nature.21 See footnote above. For the first two entries in column one, the source of additional revenue may not be from auditactivity but rather from another compliance activity. The matrix is equally valid to such non-audit activity.
GAP004Issued: 25 June, 1999
Amended: 10 May, 2001
13
OtherTaxpayers
Indirect (I) First(F)
IF1 �
IF2 �
IF3 �
IF4 �
OtherTaxpayers
Indirect (I) Subsequent(S)
IS2� IS3� IS4�
70. There are four main possible sources of the additional revenue.
71. First, there is the initial or first (F) amount of additional revenue raised directly (D) from those additional non-compliant taxpayers brought to account by the compliance improvement strategy. The main measurement challengeconfronting the tax administration here is being able to identify the extent to which the debit raised is actually converted intoadditional tax collected. In practice, given the nature and complexity of the various tax administration data bases that need tobe interrogated, this is by no means a trivial challenge. This additional revenue is identified in Figure 1 as DF1,...4 (the
subscripts refer to the years involved).
72. Secondly, account needs to be taken of the expected subsequent sustained (S) improvement in compliance by theseaudited22 taxpayers. As already indicated, even if these taxpayers were to be reaudited, account would need to be taken of anumber of ‘index number' problems when measuring any increase in compliance. Clearly, the difficulty of obtaining a reliablemeasure here is compounded if it has to be based only on unaudited tax return data. This additional subsequent revenue isidentified in figure 1 as DS2,...4.
73. One of the major roles conventionally expected of taxpayer audit programs is the deterrence of non-compliance bypotentially non-compliant taxpayers. This deterrence based additional source of revenue, usually described as enhanced'voluntary' compliance, also needs to be taken into account. A further program of random audits conducted on an annual basisor an appropriate analysis of tax returns over the relevant time period is required to obtain statistically based estimates of thisrevenue effect. The first amounts of this indirect source of additional revenue are identified as IF1,...4.
74. It should be noted here that one of the implications of the conventional deterrence literature is that a positive IF orfirst indirect revenue effect will be obtained only when there is an increase in the rate of auditing. However, the literature isgenerally silent on the issue of the likely lag between when the audit rate is increased and when the IF effect is likely to beobserved. For example, one possible factor here would be the timing of any additional publicity given to the prosecution of taxevaders (there may be a significant elapse of time before these cases come to court). For simplicity, in Figure 1 the assumed IFeffect is spread over the full four-year period.
75. Finally, following on from the first indirect (IF) revenue effect, allowance has to be made for the expectedsubsequent sustained improvement in compliance by these unaudited taxpayers. This additional revenue can be identified asIS2,...4.
76. To date, several attempts have been made to estimate the DS, IF or IS effects but these have almost all focussed onindividual income tax. The latest such study23, conducted by the IRS, has found that audits and certain other activities have asignificant, positive impact on the lodging and reporting compliance behaviour of the general population. However, for mostother tax administrations, even obtaining reliable estimates for the revenue raised directly from audits (the DF effect) hasproved a major hurdle.
General Comment on the Future
77. While this paper endeavours to cover the writings and the major research done to date, it also strives to highlight theneed for more research in the future - especially in the area of large corporate behaviour, and to encourage both theundertaking and sharing of such research.
22 See two preceding footnotes23 Refer to IRS Publication 1916 (Rev 11-96) "The Determinants of Individual Income Tax Compliance"
GAP004Issued: 25 June, 1999
Amended: 10 May, 2001
14
Available Writings and Research
78. In the area of compliance measurement, a significant amount of work is from researchers outside of the taxationadministrations. The commissioning of pertinent research to date is limited to a relatively few administrations, though theissues are significant for many. Further there may be increasing need for multilateral studies to measure the behaviour ofmultinational entities or those which operate via global networks such as the Internet. Seemingly, there are greateropportunities for closer co-operation between academia and tax administrations, and, of course, amongst national taxadministrations via forums such as the OECD.
Key Corporate Objective: Improving Compliance
79. Today, many tax administrations have within their corporate objectives or goals the improvement of taxpayercompliance. Potentially, these administrations may have difficulty in establishing their performance against this objective -especially so if there is no effective way of measuring any move in compliance levels over time. It is expected that manyadministrations currently measure the effectiveness of their compliance improvement strategies solely on revenue return,which is, of course, not synonymous with compliance improvement. For the future, such administrations need to developways to measure trends in taxpayer compliance to measure their overall effectiveness.
Reworking Old Models & Other Problems
80. In the main, ongoing research into measuring taxpayer compliance has focused on reworking old models, arguablywith a disposition to audit based studies. We need to consider whether it is appropriate to continue with this reworking, or is itas Long and Swingen suggest (1991: 664), that "(w)e need to search for new innovative approaches and identify strategicsituations where better measures could be developed or found, building in comparisons among methods and measures alongthe way."?
81. Currently, research on compliance measurement seems to have a number of weak spots which present opportunitiesfor more or different research work, notably, research -• on measuring compliance for large corporate entities or groups, especially those operating on a global basis; and
• into international comparisons as nearly all researchers to date have focussed on single country tax regimes24.
(International collaboration in assessing the risks attributable to specific multinational entities, and measuring their levels ofcompliance may be essential in minimising the potential for these entities to exploit jurisdictional differences.)
82. Further, greater general improvement in both data availability and data quality are needed.
Sharing Experiences
83. OECD Members need to continue to explore ways of sharing experiences and of contributing to ongoing researchinto compliance measurement. Recommended possibilities include -• the establishment of a forum within the OECD (utilising, for example, the EDG facility) for exchanges;
• the sharing of data and information on developments through existing treaty based channels;
• active networking and sponsorship to promote research activity; and
• the presentation of papers looking further at the issues, problems, successes and areas for further research.
84. To paraphrase a relevant report25, our base factual knowledge about taxpayers’ compliance with the tax laws is smallcompared with the importance of the phenomenon. Given this gap, we should be able to improve our understanding of
24 The sole exception to this seems to be a study by Schmolders (1970) whose study was based on large samples(>1,000) in the UK, France, Spain and Italy and was conducted to find out more about taxpayer mentality, tension, feelings,and morale. Results were compared to earlier studies carried out in Germany.
GAP004Issued: 25 June, 1999
Amended: 10 May, 2001
15
taxpayer compliance (and hence be better able to design appropriate responses) in a very cost-effective manner. It seems thismay be best advanced through broadly based research across an intellectually exciting community of researchers extendingacross tax administrations, academia and other interested parties.
In Conclusion
85. To conclude, there is a real operational and policy need now and into the future for a greater focus on the importantstrategic issue of Compliance Measurement. This can be especially so given many administrations’ corporate objectives andthe fact that many administrations exist in an environment of needing to constantly improve compliance and maximiseadministrative efficiencies.
Guidance
1. Revenue authorities are encouraged to conduct and report on research on Compliance Measurement
2. Revenue authorities are encouraged to share the results of research on Compliance Measurement with otherRevenue authorities.
25 Roth, Scholz and Witte (1989: 247)
GAP004Issued: 25 June, 1999
Amended: 10 May, 2001
16
REFERENCES
Aitken, Sherie S and Bonneville, Laura (1980) A General Taxpayer Opinion Survey. A report prepared by CSR Incunder contract to IRS, March 1980.
Allingham, Michael G, and Sandmo, Agnar (1972) "Income Tax Evasion: A Theoretical Analysis" Journal ofPublic Economics 1
Alm, James (1991) "Did TRA86 Simplify Tax Matters?" Paper at the American Economic Association meeting,Washington, DC, December 28-30 1991
Brassil, Frank (1995) "Guidelines for Managing Risk in the Australian Public Service". Paper presented at theATO 1995 Compliance Research Conference, Canberra, Australia
Cowell, Frank (1985) "The Economic Analysis of Tax Evasion," Bulletin of Economic Research, Vol 37, p 163
Elffers, Henk (1991) Income Tax Evasion: Theory and Measurement Deventer: Kluwer
Elffers, Henk; Robbens, Henry SJ; Hessing, Dick J (1989) "Reliability and Validity of Tax Audits: Can We HaveConfidence in the Opinion of the Dutch IRS on Noncompliance?" Working Paper, Erasmus Centre forSociolegal Tax Research
_______(1991) "Under-reporting Income: Who Is the Best Judge - Taxpayer or Tax Inspector?", Journal of theRoyal Statistical Society, Vol 154, Ser A, Part 1, p 125
Feinstein, J S (1991) "An Econometric Analysis of Income Tax Evasion and Its Detection", Rand Journal ofEconomics, Vol 22, No. 1, pp 14-35.
Flynn, Colin (1995) "Managing Risk: The Approach of the Private Sector" Paper presented at ATO 1995Compliance Research Conference, Canberra, Australia, December, 1995
General Accounting Office "Tax Systems Modernization: Management and Technical Weaknesses Must BeCorrected If Modernization Is To Succeed", (GAO/AIMD-95-157), Report to the Commissioner ofInternal Revenue, July, 1995.
Henry, James S (1983) "Noncompliance with US Tax Law - Evidence of Size, Growth and Composition" in"Income Tax Compliance: A Report of the ABA Section of the Taxation Invitational Conference onIncome Tax Compliance", Phillip Sawicki (ed.), American Bar Association, Washington, USA
Hessing, Dick J, Elffers Henk and Weigel, Russell H (1988) "Exploring the Limits of Self-Reports and ReasonedAction: An Investigation of the Psychology of Tax Evasion Behavior" Journal of Personality and SocialPsychology, Vol 54 pp 405 - 419
Internal Revenue Service (1990), Evaluation of the IRS System of Projecting Enforcement Revenue (1990 Update),US Department of Treasury, IRS Research Division Publication 1501 (Rev. 10-90)
Kidder, Robert and McEwen, Craig (1989) "Taxpaying Behaviour in Social Context: A Tentative Typology of TaxCompliance and Noncompliance" in "Taxpayer Compliance Vol 2", Roth, Jeffrey A and Scholz, John T(eds.), University of Pennsylvania Press, Philadelphia, pp 47-75
GAP004Issued: 25 June, 1999
Amended: 10 May, 2001
17
Long, Susan B (1995) "Lessons from the US Experience: Are Large-Scale Compliance Measurement ProgramsDead?", Paper presented at the Australian Taxation Office Compliance Research Conference, Canberra,Australia.
___________ (1991) "Assessing Taxpayer Compliance by Small Businesses: Lessons From TCMP", Paperpresented at the IRS 1991 Research Conference, 14-15 November, Washington, DC, USA
Long, Susan B and Burham, David (1990a) "The Numbers Game Changes in Tax Compliance During the Last 25Years?" 46(10) Tax Notes 1177
__________ (1990b) "Solving the Nation’s Budget Deficit with a Bigger, Tougher IRS: What are the Realities?"48(6) Tax Notes 741
Long, Susan B and Schwartz, Richard D (1987) "The Impact of IRS Audits on Taxpayer Compliance: A FieldExperiment in Specific Deterrence", 1987 Annual Law and Society Association meeting, Washington,DC.
Long, Susan B and Swingen, Judyth A (1987) "An Approach to the Measurement of Tax Law Complexity"Journal of the American Taxation Association, Spring, p 22
________ (1991) "Taxpayer Compliance: Setting New Agendas For Research." Law & Society Review, Volume25, Number 3 (1991), pp 637-683
MAB/MIAC Joint Publication "Managing Risk: Guidelines for Managing Risk in the Australian Public Service",Exposure Draft, July 1995, Canberra, Australia
Mason, Robert, Calvin Lyle D, and Faulkenberry G David (1975), Knowledge, Evasion, and Public Support forOregon’s Tax System, Corvallis, Oregon Survey Research Centre, Oregon State University, 12/84
Peereboom, Sjoerd (1995) "Research and Development at the Dutch Tax and Customs Administration:Organization, Topics and Trends", Paper presented at the ATO Compliance and Research Conference,1995, Canberra, Australia.
Rice, Eric M (1992) "The Corporate Tax Gap: Evidence on Tax Compliance by Small Corporations" in "WhyPeople Pay Taxes", Joe Slemrod (ed.), University of Michigan Press, p126
Roth, Jeffrey A, Schloz, John T and Witte, Anne D (eds.) (1989) "Taxpayer Compliance: Volume 1: An Agendafor Research", University of Pennsylvania Press, Philadelphia.
Roth, Jeffrey A and Scholz, John T (eds.) (1989) "Taxpayer Compliance: Volume 2: Social Science Perspectives",University of Pennsylvania Press, Philadelphia.
Schmolders, G "Survey Research in Public Finance: A Behavioural Approach to Fiscal Policy", Public Finance,1970, pp 300-306.
Smith, Kent (1988) "Will the Real Noncompliance Please Stand Up? The Problems of Definition in Tax Research"in "Change and Complexity as Barriers to Taxpayer Compliance", Frank M Malanga Memorial ResearchConference Report, Washington DC USA, Internal Revenue Service Document 7302 (6-89), pp 21 - 26
Spicer, MW and Lundstedt, GB "Understanding Tax Evasion", Public Finance,No. 2, 1976
Wallschutzky, Ian (1993) "Taxpayer Compliance: Issues in Research Methods" Paper presented at "TaxpayerCompliance Research in Australia: ’The State of Play’ ", The 1993 Australian Taxation Office ResearchConference, Canberra, Australia.
GAP004Issued: 25 June, 1999
Amended: 10 May, 2001
18
Webley, Paul Robben, Henry SJ Elffers, Henk and Hessing, Dick J (1991) "Tax Evasion: An ExperimentalApproach, Cambridge University Press, Cambridge
Webley, P Robben, M and Morris, I "Social Comparison and Tax Evasion in a Shop Simulation" in S Maital (ed.)"Applied Behavioural Economics", Amsterdam, 1987.
Weiss, R S and Rein, M (1969) "The Evaluation of Broad-Aim Programs: A Cautionary Tale and A Moral", Annalsof the American Academy of Political and Social Sciences, Vol 385, pp 133-142.
Wickerson, John (1993) "Measuring Taxpayer Compliance: Issues and Challenges Facing Tax Administrations".Paper presented at "Taxpayer Compliance Research in Australia: ’The State of Play’ ", 1993 AustralianTaxation Office Research Conference, Canberra, Australia.
Yankelovich, Skelly and White Inc (1984), Taxpayer Attitudes Study: Final Report, Internal Revenue Service,Washington, DC.
GAP004Issued: 25 June, 1999
Amended: 10 May, 2001
19
Appendix A: Financial Statement Analysis
Horizontal Analysis
Horizontal Analysis is the study of changes in comparative financial statements from year to year. It highlightspercentage changes in an item over time. The percentage change is calculated by dividing the dollar amount of thechange by the base year amount. Percentage changes must be evaluated in terms of the item’s relative importance tothe company as a whole. Percentage changes are not calculated where the base year amount is either zero ornegative.
A comparative profit and loss statement shows changes in sales, investment income, selling & administrativeexpenses, gross & net profits, etc. A comparative balance sheet will show changes in assets, investments,borrowings (long and short term), inventories, creditors, capital, etc.
Trend percentages are an important form of horizontal analysis. They are important indicators of the direction abusiness is taking. To gain a realistic view of the company, it is often necessary to examine more than just a 2 or 3year period (5 years is usual). The item in the base year assumes 100%, and each subsequent year item is expressedas a percentage of that base amount.
Vertical Analysis
Vertical Analysis of a financial statement reveals the relationship of each statement item to the total (usually netsales & total assets), which is the 100% figure. Again, percentage changes must be evaluated in terms of the item’srelative importance to the company as a whole.
Percentages on the profit and loss statement are computed by dividing all amounts by net sales. The gross profitpercentage is one of the most important pieces of information in financial analysis because it shows the relationshipbetween net sales and cost of goods sold. A company that can steadily increase its gross profit percentage over along period is more likely to succeed than a business whose gross profit percentage is steadily declining.
The vertical analysis of the balance sheet shows all amounts as a percentage of total assets or the sum of liabilitiesand shareholder’s equity. A decrease in current assets may make it difficult for the company to pay its bills.
Ratio Analysis
Ratios are important tools for financial analysis. Ratios provide a means of converting raw figures into figures thatcan be compared for the one entity over a period of years and compared with ratios calculated for the industry(often readily provided by external information services).
Some type of ratio comparative analysis could be developed on the population of a particular industry. Traditionalaccounting ratios can be calculated and obtained from Annual reports, External industry surveys, Analytical reportsand usually external and internal databases. The ratio analysis process can:
• Develop an understanding of performance of an industry.• Compare operations/performance of corporate groups against industry benchmarks.• Be used to make a comparative analysis over a period of time.• Confirm or assist in the risk assessment process.
GAP004Issued: 25 June, 1999
Amended: 10 May, 2001
20
One method is to use "Profitability Ratios" to allow for comparison against industry averages. In respect tocorporate groups that can be aligned to an industry use Annual reports, or other financial data to calculate thefollowing ratios:-
Gross Profit Margin [gross profit/sales] x 100%
This ratio is from the vertical analysis of the profit and loss statement. This measures the level of profit being madeon sales. Those businesses depending on high volume will have low gross margins and those depending on marginshould have higher gross margins. The higher the rate of return, the more net sales dollars are providing profit tothe business and the fewer net sales dollars are absorbed by expenses. Gross profit is net sales less COGS. Thisratio does not include selling, administrative or financial expenses.
Analysis of the profit margin depends on the industry involved. For example, it is expected that a supermarketchain would have a low profit margin as the turnover of goods is very large and sales volumes are high, whereas anaircraft manufacturer would have a higher profit margin with lower turnover of sales.
Net Profit Margin [net profit/sales] x 100%
This ratio is also from the vertical analysis of the profit and loss statement. Net profit is gross profit less selling,administrative and financial expenses. It calculates the proportion of each dollar of sales that represents net profit.The rate should be compared with other companies or an industry average to be more useful.
Berry Ratio [(sales - cost of sales)/operating expenses] x 100%
The Berry Ratio gives an indication of the profitability of a company. It tells you the proportion of gross profit thatis available to cover operating expenses. A ratio lower than 100% is poor as it means the company is unable tocover its expenses. It may mean a market penetration strategy is in place. Berry ratios below 100% are notsustainable in the long term and these companies would need to be closely examined, particularly their pricing andmarketing strategies.
EBIT Margin [operating profit before tax + interest]/sales x 100%
EBIT is a commonly used profit measurement. It measures the profit earned independently of how an entity isfinanced and so makes profit more comparable between entities with different financing structures. Again, lossesare not sustainable in the long term. A careful examination of pricing and marketing strategies would be warrantedif the company is returning EBIT lower than the industry average.
Return on Assets [(net profit + interest)/average total assets] x 100%
This ratio measures the success a company has in using its assets to earn a profit. A rule of thumb comparison is tocompare it with the rate of interest which could be earned if all the assets were converted into cash and placed ondeposit. Acceptable levels of ROA will vary between industries. Some industries require significant in assets togenerate profit (i.e. mining), while others probably do not need to acquire many assets. The reasonability of theROA should be compared with industry averages.
The use of both net profit and EBIT ratios, reflecting results before and after financing costs, may help to explainthe differences caused by their respective debt levels.
GAP004Issued: 25 June, 1999
Amended: 10 May, 2001
21
All or some of these ratios would be calculated on the population of the particular industry or group of similarindustries. This population would be ranked and grouped into quartiles for that industry or comparable industries.The industry average of the above ratios should come from the 25% to 75% range.
The comparison of the bottom 25% to the industry average would give us the first cut of high to low riskcompanies. Judgement must be used to ascertain why a corporate ranks in the lowest quartile of a particularindustry and/or lowly compared to the industry average. Some explanations could include:
• The corporate has a history of bad management• The corporate has a market penetration strategy.• The corporate is new to a particular industry.• The corporate is heavily involved in R&D, capital expansion and/or promotion.
Further ratio analysis could include "Capital Structure Ratios."
• Gearing % Debt / Debt + Equity x 100%
• Net Debt / equity x 100%
• Net Interest Cover EBIT / Net Interest and Finance Lease Charges
Other ratios more directly related to taxable incomes include:-
• Taxable Income / Shareholder’s Funds
• Effective Tax Rate (NB: care must be taken as there is many variations of effective tax rates. Current yeartax provisions should not be used. Where tax is paid in a subsequent period, but is not readily available throughinternal accounting systems, a reasonable estimate may be made by using the tax paid figure from the sources andapplications section of a corporate’s published accounts in year X + 1, and compare that to accounting profitsbefore tax in year X.)
• Operating Net Profit / Shareholder’s Funds less taxable income / Shareholder’s Funds
• Net Profit less taxable income / Net Profit x 100%
Other possible ratios include :-
Gross Profit/Total Operating Income
Earning before Tax / Total Operating Income ( excluding proceeds from non-current assets)
Net Profit / Total Turnover of Domestic company compared to Net Profit / Total Turnover of offshorecompanies within the same group.
Taxable Income* / Total Income
(Net Profit - Taxable income) / Net Profit
(Net Profit / TOI**) - (Taxable Income / TOI)
* Excludes carried forward losses and intra group dividends ** Total Operating Income
GAP004Issued: 25 June, 1999
Amended: 10 May, 2001
22
The most appropriate type of ratio will vary depending on the type of industry and the area of risk that needs to beconfirmed.
Limitations
Ratios need to be evaluated in the light of other information about the company and its business (i.e. increasedcompetition, slowdown in economy, etc). Ratios may indicate that something is unusual, but will not be able toprovide any detail of what it may be or how to address it. Ratios can be misleading because of many mitigatingfactors, therefore a full analysis of the ratio result is necessary if it is relied upon to validate, confirm or indicate arisk assessment finding.
GAP004Issued: 25 June, 1999
Amended: 10 May, 2001
23 Ptd: May-01
History
June 1999: Initially released in June 1999 for comment as a Secretariat note, “Compliance Measurement”[DAFF/CFA(99)51] is one of the tax administration papers prepared for the CFAs Forum on Strategic Management(FSM).
At its meeting in December 2000 the FSM Steering group agreed to the tax administration papers series being madeavailable as public documents. This was endorsed by the CFA at their meeting in January 2001.
May 2001: The paper is published as part of the “Tax Guidance Series” from the Centre for Tax Policy andAdministration.
Compatibility
The principles in this document are compatible with those contained in:
• GAP001 Principles of Good Tax AdministrationCentre for Tax Policy and Administration, OECD 2001
• Minimum necessary attributes for a sound and effective tax administrationA charter-document approved by the Inter-American Center of Tax Administrations/ Centro Interamericano deAdministraciones Tributarias (CIAT) General Assembly held in the Dominican Republic on March 19, 1996http://www.oecd.org/DAF/FSM/minimumatributesta_ciat.html
Contact
For further information please contact Mr Stuart Hamilton, Centre for Tax Policy and Administration,Tel 33 1 45 24 94 32, Fax 33 1 44 30 63 51