11. CURRENTS NEAR DEEP SEA DRILLING PROJECT HOLE 395A AND EFFECTS ON COMPONENTS OF THE MARINE SEISMIC SYSTEM PROJECT 1 Janice Dinegar Boyd, Naval Ocean Research and Development Activity 2 ABSTRACT Upper-level and near-bottom current measurements were made near Deep Sea Drilling Project Hole 395A (22°45 'N, 46°05'W) in March and April 1981 in support of the at-sea test of the Marine Seismic System Project. Four upper- ocean current profiles were made during initial deployment of the borehole seismometer. Readings were noticeably con- taminated by ship motion, but indicated a variable yet generally slow current regime that posed minimal threat of cable entanglement. Current measurements made 5 m off bottom during seismometer testing showed marked spectral peaks at semidiurnal and inertial frequencies. Mean speed of 4.4 cm/s and maximum speed of 9 cm/s were low but possibly of sufficient magnitude to cause contamination of concurrently deployed ocean bottom seismometer (OBS) records by hydrodynamically generated noise. Other studies have suggested noise contamination of OBS records by near-bottom currents, with a possible 10 cm/s threshold for its importance. Although methods to detect and eliminate the noise might be developed, instrument testing and redesign to reduce sensitivity to contamination is probably more feasible. INTRODUCTION The first at-sea test of the Marine Seismic System (MSS) Project occurred in March and April 1981, dur- ing Leg 78B of the Deep Sea Drilling Project. Two types of physical oceanographic measurements were made at this time by NORDA (Naval Ocean Research and Devel- opment Activity) Code 331. Four profiles of ocean cur- rents in the upper 1000 m were taken from the Lynch with a Neil Brown Instrument Systems (NBIS) Direct Reading Current Meter (DRCM) prior to and during de- ployment of the borehole seismometer. Completed pro- files were transmitted immediately to the Challenger, where the data were used to orient the ship so as to avoid entanglement of the seismometer cable with the drill string. In addition, two Sea Link Systems' Vector Averaging Current Meters (VACM) were deployed ap- proximately 5 m off bottom to help estimate hydrody- namic noise contamination of the records of concur- rently deployed ocean bottom seismometers (OBS). De- tails of the VACM deployment are given in Table 1; po- sitions of the VACMs, the operational OBS, and DSDP Hole 395A are shown in Figure 1. Positions of DRCM casts were within about 0.5 n. mi. of Hole 395A. This chapter summarizes the results of the DRCM casts and the two VACM deployments, comments on the DRCM results, and discusses the possibility of contamination of seismometer signals by hydrodynamic noise. BACKGROUND Upper-Level Current Profiles The possibility of entanglement of the borehole seis- mometer cable with the drill string was a major concern during deployment of the seismometer package. Upper- Table 1. Details of MSS current meter moorings near DSDP Hole 395A (Cruise Number: Lynch 070581). Position Dates a From To Water depth (m) Meter depth (m) Sampling rate (s) Meter number Performance Mooring 000901 22°46.35'N 46°04.59'W 001001 22°46.10'N 46°05.49'W 1526Z 1814Z 28 March 1981 28 March 1981 0837Z 0837Z 1 April 1981 1 April 1981 4483 4478 56 289 Very good 4483 4478 56 300 Satisfactory Hyndman, R. D., Salisbury, M. H., et al., Init. Repts. DSDP, 78B: Washington (U.S. Govt. Printing Office). 2 Address: Naval Ocean Research and Development Activity, NSTL Station, MS 39529. a Dates are conservatively estimated times that moorings were in position. level current measurements were needed during the de- ployment in order to orient the Challenger so as to keep the cable downstream of the drill string and thus reduce the risk of entanglement. Equipment suitable for making accurate real-time current measurements deeper than a few hundred meters was (and is) limited. The NBIS Di- rect Reading Current Meter selected (underwater unit Model DRCM-1, deck unit CMDT-1) was a new, readily available but relatively untested instrument; however, it did use previously developed and proven technology. Hydrodynamically Generated Noise Some results have shown near-bottom currents can produce noise contamination in ocean-bottom seismome- ter (OBS) records (Sutton et al., 1981, Duennebier et al., 1981). One aspect of the Lopez Island OBS intercom- parison experiment (Sutton et al., 1981) was to examine sensitivity of different OBS systems to contamination from hydrodynamically generated noise. Results were incon- 759
Transcript
11. CURRENTS NEAR DEEP SEA DRILLING PROJECT HOLE 395A AND EFFECTS ONCOMPONENTS OF THE MARINE SEISMIC SYSTEM PROJECT1
Janice Dinegar Boyd, Naval Ocean Research and Development Activity2
ABSTRACT
Upper-level and near-bottom current measurements were made near Deep Sea Drilling Project Hole 395A (22°45 'N,46°05'W) in March and April 1981 in support of the at-sea test of the Marine Seismic System Project. Four upper-ocean current profiles were made during initial deployment of the borehole seismometer. Readings were noticeably con-taminated by ship motion, but indicated a variable yet generally slow current regime that posed minimal threat of cableentanglement. Current measurements made 5 m off bottom during seismometer testing showed marked spectral peaksat semidiurnal and inertial frequencies. Mean speed of 4.4 cm/s and maximum speed of 9 cm/s were low but possiblyof sufficient magnitude to cause contamination of concurrently deployed ocean bottom seismometer (OBS) records byhydrodynamically generated noise. Other studies have suggested noise contamination of OBS records by near-bottomcurrents, with a possible 10 cm/s threshold for its importance. Although methods to detect and eliminate the noisemight be developed, instrument testing and redesign to reduce sensitivity to contamination is probably more feasible.
INTRODUCTION
The first at-sea test of the Marine Seismic System(MSS) Project occurred in March and April 1981, dur-ing Leg 78B of the Deep Sea Drilling Project. Two typesof physical oceanographic measurements were made atthis time by NORDA (Naval Ocean Research and Devel-opment Activity) Code 331. Four profiles of ocean cur-rents in the upper 1000 m were taken from the Lynchwith a Neil Brown Instrument Systems (NBIS) DirectReading Current Meter (DRCM) prior to and during de-ployment of the borehole seismometer. Completed pro-files were transmitted immediately to the Challenger,where the data were used to orient the ship so as toavoid entanglement of the seismometer cable with thedrill string. In addition, two Sea Link Systems' VectorAveraging Current Meters (VACM) were deployed ap-proximately 5 m off bottom to help estimate hydrody-namic noise contamination of the records of concur-rently deployed ocean bottom seismometers (OBS). De-tails of the VACM deployment are given in Table 1; po-sitions of the VACMs, the operational OBS, and DSDPHole 395A are shown in Figure 1. Positions of DRCMcasts were within about 0.5 n. mi. of Hole 395A. Thischapter summarizes the results of the DRCM casts andthe two VACM deployments, comments on the DRCMresults, and discusses the possibility of contaminationof seismometer signals by hydrodynamic noise.
BACKGROUND
Upper-Level Current ProfilesThe possibility of entanglement of the borehole seis-
mometer cable with the drill string was a major concernduring deployment of the seismometer package. Upper-
Table 1. Details of MSS current meter moorings near DSDPHole 395A (Cruise Number: Lynch 070581).
Position
Datesa From
To
Water depth (m)Meter depth (m)Sampling rate (s)Meter numberPerformance
Mooring
000901
22°46.35'N46°04.59'W
001001
22°46.10'N46°05.49'W
1526Z 1814Z28 March 1981 28 March 1981
0837Z 0837Z1 April 1981 1 April 1981
44834478
56289
Very good
44834478
56300
Satisfactory
Hyndman, R. D., Salisbury, M. H., et al., Init. Repts. DSDP, 78B: Washington (U.S.Govt. Printing Office).
2 Address: Naval Ocean Research and Development Activity, NSTL Station, MS 39529.
a Dates are conservatively estimated times that mooringswere in position.
level current measurements were needed during the de-ployment in order to orient the Challenger so as to keepthe cable downstream of the drill string and thus reducethe risk of entanglement. Equipment suitable for makingaccurate real-time current measurements deeper than afew hundred meters was (and is) limited. The NBIS Di-rect Reading Current Meter selected (underwater unitModel DRCM-1, deck unit CMDT-1) was a new, readilyavailable but relatively untested instrument; however, itdid use previously developed and proven technology.
Hydrodynamically Generated NoiseSome results have shown near-bottom currents can
produce noise contamination in ocean-bottom seismome-ter (OBS) records (Sutton et al., 1981, Duennebier et al.,1981). One aspect of the Lopez Island OBS intercom-parison experiment (Sutton et al., 1981) was to examinesensitivity of different OBS systems to contamination fromhydrodynamically generated noise. Results were incon-
759
J. DINEGAR BOYD
22° 50' -
22° 40' -
46° 15' 46° 00'
Figure 1. Locations of Current Meters 289 and 300, of Hole 395A, and of the operational OBS during March and April 1981MSS at-sea test (from Hussong et al., 1979; depth is in meters).
elusive, but current speeds were low, a maximum of 6cm/s. Mean currents near DSDP Hole 395A were antic-ipated to be low (Wilcox, 1978), but there were no directobservations from the site. Because hydrodynamicallyinduced noise is generally recognized as a possible prob-lem with OBSs, a knowledge of currents near the sitecould be valuable in identifying the sources of anoma-lous signals should they show up in the seismic recordsof the OBSs or borehole seismometer.
Currents can generate noise in seismic records in threeways. The first occurs when the fluid motion is highlyturbulent. (The drag and lift forces exerted on an instru-ment by the fluctuating flow may cause small motionsor vibrations of the object that are recorded as noise.)The second occurs when current-generated noise is trans-mitted through the bottom and picked up by the instru-ment. (The noise may occur when random pressure fluc-tuations of the turbulent boundary layer actually dis-turb the bottom sediments or nearby equipment may bedisturbed by the turbulent flow, with the motion beingtransmitted through the bottom.) Under the low currentspeeds expected near Hole 395A, these sources of noiseare unlikely to be as important as the third mechanism:vortex shedding from objects in the flow.
The character of fluid flow past an object is largelydetermined by the Reynolds number, Re, defined as
where U is a characteristic speed of the flow; d, a char-acteristic dimension of the object; and v the kinematicviscosity. At low Re the fluid flow closely follows thecontours of the body, but above a critical Re the bound-ary layer separates from the body and forms a turbulentwake. Up to a certain maximum Re the separation forsome body shapes occurs nearly periodically in the formof shedding of pairs of alternate-sense vortices. Separa-tion and wake formation causes a reduced pressure gra-dient in the lee of the object, particularly on the sidefrom which a vortex is shed. The shedding of opposite-sense vortices in a wake produces nearly periodic forceson the body at the shedding frequency fs. This is thesource of aeolian tones caused by wind over wires undertension and the "strumming" of hydrographic cables dur-ing CTD (conductivity, temperature, and depth) casts.For cylindrical bodies normal to the flow and for 40 <Re < 4 × 10⁵ this frequency is given by
fs =U - S
Re = U d
where S is the Strouhal number (Batchelor, 1967). (There issome dependence on geometry and turbulence level ofthe free stream, but this gives fs well within an order ofmagnitude.) For Re > 200, the Strouhal number is near-ly a constant 0.2 (Every et al., 1982).
The sensitive range of many contemporary seismom-eters—0.01-30.0 Hz (R. Jacobson, personal communi-
760
CURRENTS NEAR HOLE 395A AND EFFECTS ON MSS COMPONENTS
cation, 1981)—includes the range of shedding frequen-cies due to currents that one would expect to encounterin the deep ocean. In his summary of deep ocean cur-rent speeds, Wilcox (1978) found a mean deep currentspeed in the eastern Atlantic of about 5 cm/s. For a1-in. cable this translates into a shedding frequency ofabout 0.4 Hz. Thus there is the potential for the con-tamination of seismometer readings by noise from tur-bulent eddy shedding.
MEASUREMENTS
The NBIS Direct Reading Current Meter selected forthe upper-level current profiles had a specified speed ac-curacy of ± 1 cm/s or 5% (whichever is greater). Direc-tion accuracy was ±5° for speeds greater than 10 cm/s.Pressure was accurate to ±1.0 decibar and precise to± 0.05 decibar (A. W. Green, personal communication,1981). One-minute vector averages of speed and direc-tion were recorded, and pressure was periodically checkedto provide depth values.
Near-bottom measurements were taken with Sea LinkSystems' Vector Averaging Current Meters (Model 610),which recorded average speed, east and north velocitycomponents, direction and temperature every 0.9375min. Speed was accurate to ± 1 cm/s or better, and thethreshold of the Savonious rotor was 3 cm/s or lower.Direction was accurate to ±3°. The installed thermis-tors were accurate to ±0.1°C and precise to ±0.01°C.The manufacturer^ manual (AMF, 1976) gives furtherdetails on instrument construction, and Woodward andAppel (1973) and McCullough (1975) describe calibra-tion of the instrument. The mechanical rotor of theVACM tends to stall at low current speeds and to behavein a nonlinear manner, so the VACM was not the opti-mal instrument for the low currents anticipated. How-ever, it was the only meter type available with a pressurecasing suitable for the 4500-m depth. In spite of currentspeeds near rotor-stall speed, the two instruments per-formed adequately.
PRESENTATION OF DATA
Upper-Level Current Profiles
Four velocity profiles taken with the DRCM duringthe seismometer deployment are shown in Figure 2. Pro-filing was terminated by a seal failure at the end of Cast4 or beginning of Cast 5. With the exception of currentsin the upper 100 m during the first cast, current speedswere low (below 20 cm/s) and directions variable.
The unknown time of failure precludes a strict evalu-ation of the quality of the profile data. There are con-siderable differences between profiles. In particular, thefirst cast showed substantially higher current speeds thansucceeding casts. However, ship's radar fixes on theChallenger taken by Lynch personnel every 20 min. dur-ing the profiling indicated a drift of Vi-Vi knots ( 20cm/s) to the northeast during the first cast, a largerdrift than at any other time during the profiling. (A con-siderable wire angle was also noted at this time.) Thehigher observed values for this profile may indeed becorrect, due to wind- or surface-current-induced ship mo-tion or to a transient, highly energetic current regime.
w •
N (magnetic)
2150 - 0151Z 3/26-27/81
0.0
-15.0
kj—t
1421 - 1652Z 3/27/81
1 1 1 1 1 1 1 1 1 —1
0 100 200 300 400 500 600 700 800 900 1000
Depth (m)
S (magnetic)
Figure 2. Currents (cm/s) in upper 1000 m near Hole 395A during de-ployment of borehole seismometer. Length and direction of eacharrow corresponds to speed and direction of the current at the indi-cated depth.
Ship motion affected the DRCM readings at othertimes. During periods of swell when the Lynch rolledsubstantially, the pressure values commonly indicated ver-tical excursions of more than ± 5 decibar (equivalent to± 5 m). When the wire from the hydrographic winch ro-tated about a vertical axis (making a circle in a horizon-tal plane), instantaneous direction measurements oftenchanged rapidly and monotonically.
The purpose of the DRCM was to furnish approxi-mate (±20 cm/s) upper bounds for the currents, and itappears that the DRCM and deck unit satisfied these re-quirements until the end of Cast 4 or the beginning ofCast 5. However, the measurements were contaminatedby ship motion. It was known from the beginning thatship motion would affect the DRCM data, but neithertime nor resources were available to compensate for themotion.
Near-Bottom Current and Temperature-Time Seriesand Data Editing
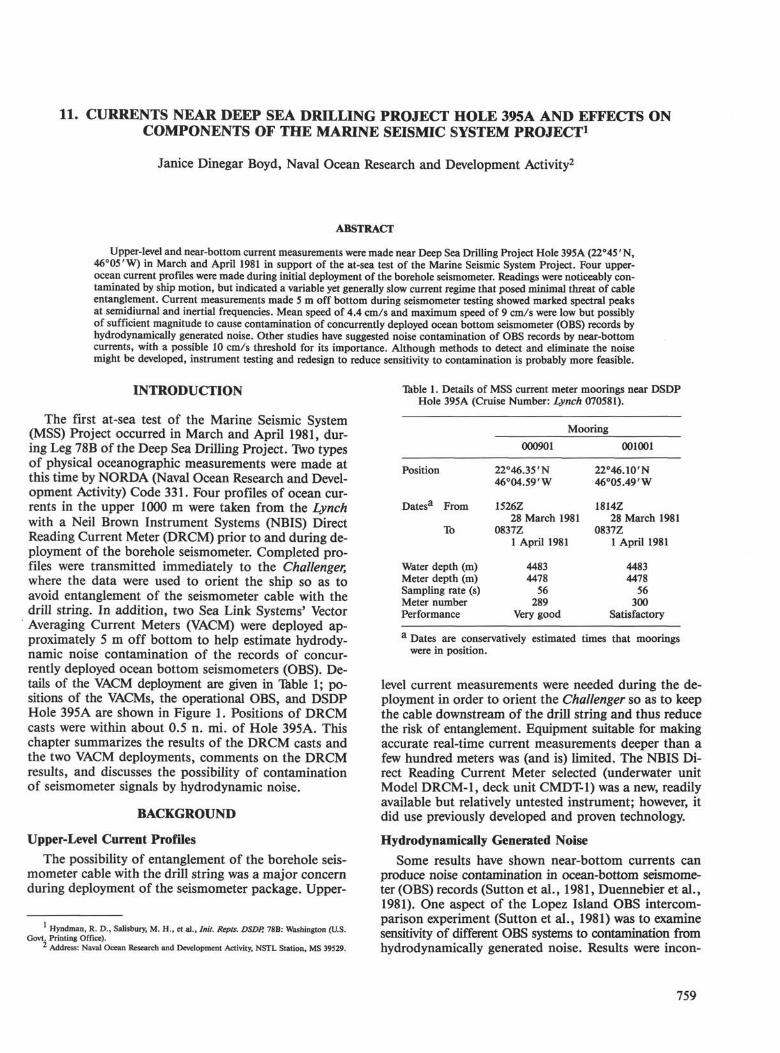
The near-bottom velocities were first plotted as timeseries. Each record was examined for anomalous data.Records were discarded for those times the meters werenot in position near the bottom. Meter 289 performedwell. Occasional isolated spikes were replaced with lin-early interpolated values. The corrected series for Meter289 is given in Figure 3. Meter 300 performed satisfacto-
Figure 3. Meter 289 current time series. Direction is from magneticnorth.
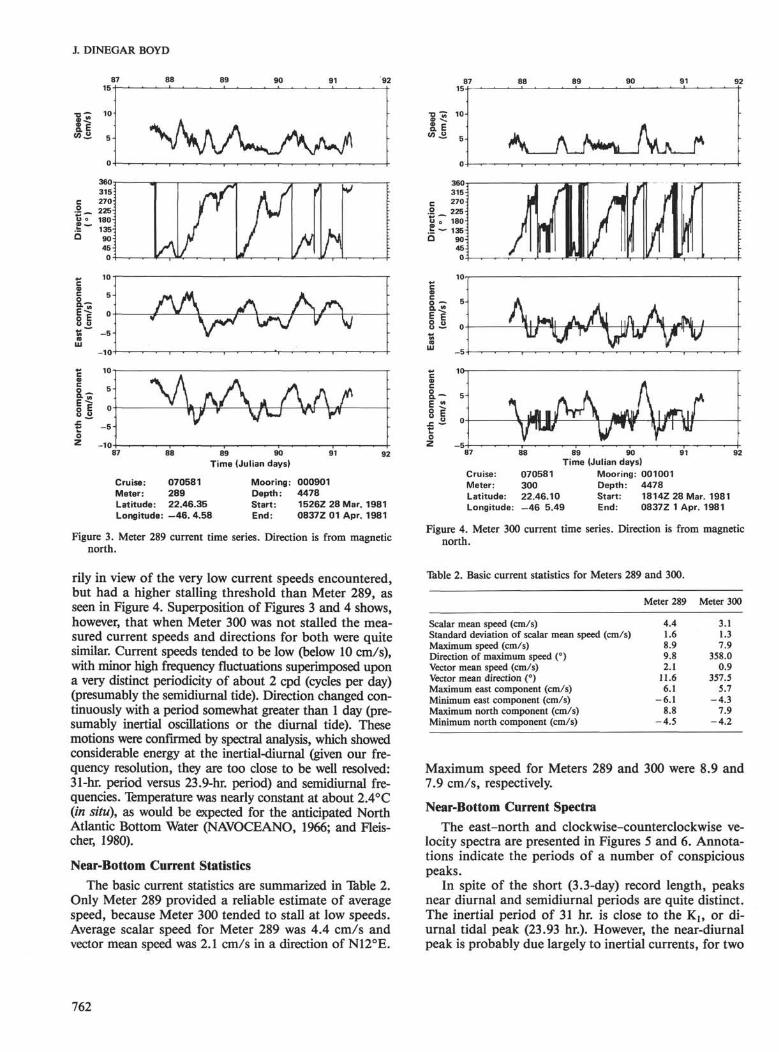
rily in view of the very low current speeds encountered,but had a higher stalling threshold than Meter 289, asseen in Figure 4. Superposition of Figures 3 and 4 shows,however, that when Meter 300 was not stalled the mea-sured current speeds and directions for both were quitesimilar. Current speeds tended to be low (below 10 cm/s),with minor high frequency fluctuations superimposed upona very distinct periodicity of about 2 cpd (cycles per day)(presumably the semidiurnal tide). Direction changed con-tinuously with a period somewhat greater than 1 day (pre-sumably inertial oscillations or the diurnal tide). Thesemotions were confirmed by spectral analysis, which showedconsiderable energy at the inertial-diurnal (given our fre-quency resolution, they are too close to be well resolved:31-hr, period versus 23.9-hr, period) and semidiurnal fre-quencies. Temperature was nearly constant at about 2.4°C(in situ), as would be expected for the anticipated NorthAtlantic Bottom Water (NAVOCEANO, 1966; and Fleis-cher, 1980).
Near-Bottom Current Statistics
The basic current statistics are summarized in Table 2.Only Meter 289 provided a reliable estimate of averagespeed, because Meter 300 tended to stall at low speeds.Average scalar speed for Meter 289 was 4.4 cm/s andvector mean speed was 2.1 cm/s in a direction of N12°E.
Figure 4. Meter 300 current time series. Direction is from magneticnorth.
Table 2. Basic current statistics for Meters 289 and 300.
Meter 289 Meter 300
4.41.68.99.82.1
11.66.1
-6.18.8
-4.5
3.11.37.9
358.00.9
357.55.7
-4.37.9
-4.2
Scalar mean speed (cm/s)Standard deviation of scalar mean speed (cm/s)Maximum speed (cm/s)Direction of maximum speed (°)Vector mean speed (cm/s)Vector mean direction (°)Maximum east component (cm/s)Minimum east component (cm/s)Maximum north component (cm/s)Minimum north component (cm/s)
Maximum speed for Meters 289 and 300 were 8.9 and7.9 cm/s, respectively.
Near-Bottom Current SpectraThe east-north and clockwise-counterclockwise ve-
locity spectra are presented in Figures 5 and 6. Annota-tions indicate the periods of a number of conspiciouspeaks.
In spite of the short (3.3-day) record length, peaksnear diurnal and semidiurnal periods are quite distinct.The inertial period of 31 hr. is close to the Kb or di-urnal tidal peak (23.93 hr.). However, the near-diurnalpeak is probably due largely to inertial currents, for two
762
CURRENTS NEAR HOLE 395A AND EFFECTS ON MSS COMPONENTS
B
I 1<«"•3
I
26.7
11.4
10° 10' 10' 10" 10'Cycles/hour
26.7
10' 10° 10° 10" 10"' 10" 10'Cycles/hour
r.2-
26.7
-CW
CCW
10"3 10'2 101 10° 101 102
Cycles/hour
Figure 5. Meter 289 current spectra. A. East component. B. North component. C. Rotary components. (CW = clockwise; CCW = counterclock-wise; cph = cycles per hour. See text for explanations of Kx and M2.)
763
J. DINEGAR BOYD
B
26.7 n.4
l—i i i nil 1—r f ml i|—
10'3 10* 10'1
I I I M l l | 1 1 I I I Ml]
10° no1
Cycles/hour
1 0 2 :
10 1 :
102 _
•πη 1 0
1 0 3 1O": 10-2 10-1 10° 101
Cycles/hour
10°
, 3 -
CW
ccw
10"J 1 0 " 1 0 " 10" 10' 10' 10°
Cycles/hour
Figure 6. Meter 300 current spectra. A. East component. B. North component. C. Rotary components. (CW = clockwise; CCW = counterclock-wise; cph = cycles per hour. See text for explanation of K, and M2.)
764
CURRENTS NEAR HOLE 395A AND EFFECTS ON MSS COMPONENTS
reasons. First, near the diurnal peak the clockwise rota-ry spectral components are much larger than the coun-terclockwise. Second, the east and north velocity spec-tra at that frequency are of nearly equal magnitude. Al-though these criteria are not sufficient to unequivocallyidentify inertial oscillations, they are necessary charac-teristics that northern hemisphere inertial oscillations mustpossess. If the motions are indeed primarily inertial os-cillations, they may be episodic, their occurrence in agiven record depending upon the presence of a forcingphenomenon.
A second prominent spectral peak occurs near the semi-diurnal tidal period of 12.42 hr. and is probably the M2tide. Tidal signals in the open ocean are frequently notthis energetic relative to the rest of the spectrum, andthis peak may reflect the influence of the nearby topog-raphy and the absence of other forcing phenomena aswell.
Temperature spectra (not plotted) show virtually novariation, and in particular there is no evidence of anydiurnal or semidiurnal periodicity.
SUMMARY AND CONCLUSIONSReal-time current profiles were taken near DSDP Hole
395A on 26 to 27 March 1981 from the Lynch with anNBIS Direct Reading Current Meter. The profiling wasdone during the initial deployment of the Marine Seis-mic System Projects borehole seismometer from the Glo-mar Challenger. Readings indicated a variable but gen-erally slow current regime (below 20 cm/s) during theprofiling period. Sea-state conditions 0 or 1 prevailedduring the profiling. Nevertheless, significant contami-nation of the records by ship motion was apparent, anddeployment from the Challenger would have been pref-erable. Unless techniques are applied to decouple theprofiler from the ship's motion, it appears inadvisableto deploy the DRCM from a platform as unstable asmany research vessels above sea state 1 or 2. For highersea state, satisfactory results could be expected onlywhen the current regime is sufficiently energetic thatnoise induced by ship motion does not mask the back-ground current measurements, although the accuracy ofthe measurements would still be reduced. In spite of theship-motion contamination, however, observed currentspeeds in the upper 1000 m were shown to be generallylow and to pose minimal threat of cable entanglement.It should be noted, though, that mesoscale features suchas eddies or inertial oscillations could cause a radicallydifferent regime at other times.
Sea Link Vector Averaging Current Meters deployednear the bottom in 4483 m of water for 3.5 days in Marchand April 1981 performed satisfactorily under condi-tions of very low current speeds. Average (scalar) speedwas 4.4 cm/s, and maximum speed was under 9 cm/s.The mean direction of flow was slightly east of north,with a steady clockwise rotating component of periodsomewhat greater than one day superimposed on themean flow. The rotating component is attributed to in-ertial oscillations. The semidiurnal tide was also appar-ent and at a sufficiently energetic level that topographic
forcing may be important. Temperature was constant at2.4°C (in situ).
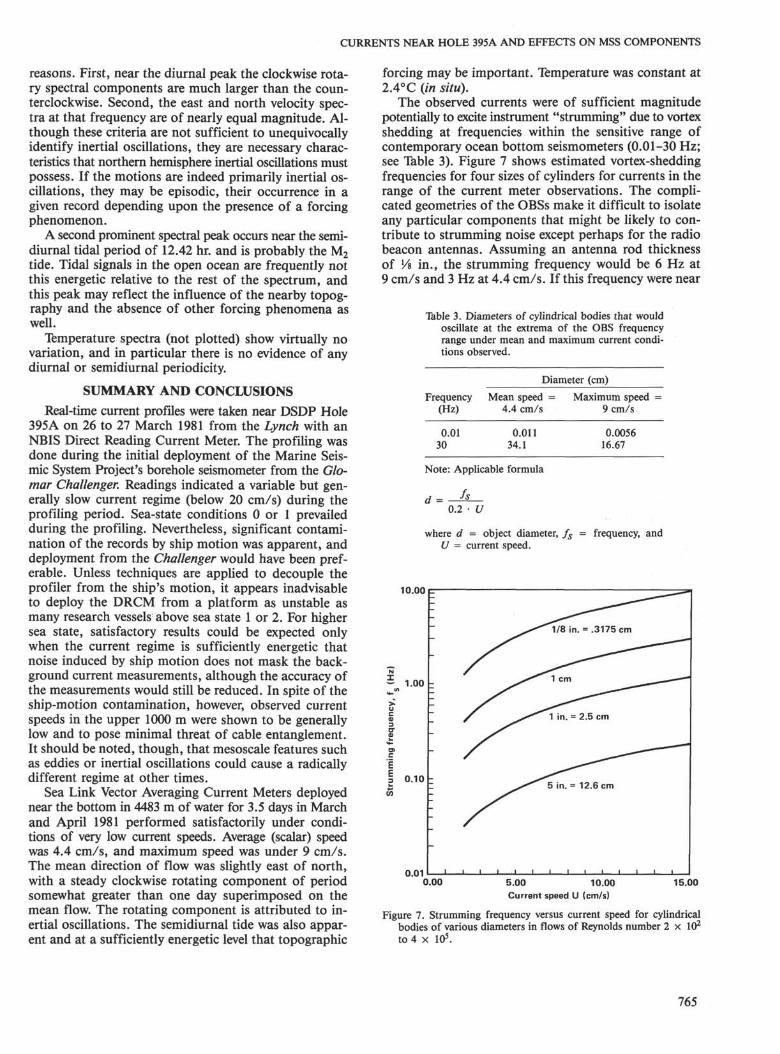
The observed currents were of sufficient magnitudepotentially to excite instrument "strumming" due to vortexshedding at frequencies within the sensitive range ofcontemporary ocean bottom seismometers (0.01-30 Hz;see Table 3). Figure 7 shows estimated vortex-sheddingfrequencies for four sizes of cylinders for currents in therange of the current meter observations. The compli-cated geometries of the OBSs make it difficult to isolateany particular components that might be likely to con-tribute to strumming noise except perhaps for the radiobeacon antennas. Assuming an antenna rod thicknessof Vs in., the strumming frequency would be 6 Hz at9 cm/s and 3 Hz at 4.4 cm/s. If this frequency were near
Table 3. Diameters of cylindrical bodies that wouldoscillate at the extrema of the OBS frequencyrange under mean and maximum current condi-tions observed.
Frequency(Hz)
0.0130
Diameter (cm)
Mean speed =4.4 cm/s
0.01134.1
Maximum speed =9 cm/s
0.005616.67
Note: Applicable formula
d - fs0.2 U
where d = object diameter, fs = frequency, andU = current speed.
10.00 p
~ 1.00
0.10
0.010.00 5.00 10.00
Current speed U (cm/s)15.00
Figure 7. Strumming frequency versus current speed for cylindricalbodies of various diameters in flows of Reynolds number 2 × 10²
to 4 × 10⁵.
765
J. DINEGAR BOYD
a resonant frequency of the rod or of the attached flag,strumming amplitude could be substantial. Duennebieret al. (1981) did report noise signals in OBS recordingsthat could be attributed to vortex shedding from variousantenna configurations.
As reported by Duennebier et al. (1981), Japanese re-searchers found 10 cm/s to be a lower threshold for noisecontamination by vortex shedding. Maximum currents inthis study were 9 cm/s, suggesting that contaminationof these OBS records is likely to be small and intermit-tent. But Figures 2 and 3 illustrate that deep-water, near-bottom current regimes are characterized by consider-able variability in speed and direction. Internal tides,inertial oscillations, and other phenomena make it amistake to assume that the operating environment of adeep-water OBS will be characterized by steady, slowcurrents. The variable and possibly episodic nature ofthese current features can make it difficult to detect andremove noise contamination. The development of meth-ods of evaluating noise contamination of seismometerrecords is recommended. Also, OBSs should be testedfor sensitivity to current-generated noise and redesignedto eliminate this sensitivity as much as possible.
One approach to evaluating noise contributions fromvortex shedding would be to compute for each externalOBS component a time series of shedding frequency fromthe observed current time series. Coherence betweenOBS signal level and the shedding frequency time seriescould give an indication of the currents influence. Sucha technique could also be applied to the borehole seis-mometer and related hardware if it were felt that the in-strument might be influenced by vortex shedding offcomponents on the bottom.
A better approach, particularly in view of the com-plicated geometry of OBS systems and the difficulty andexpense of making current measurements, is noise sensi-tivity evaluation and instrument redesign. To evaluate theresponse at different fluid speeds the instrument could beplaced in a tank or wind tunnel, and the equipment ei-ther moved through the fluid or the fluid moved past itand the pure noise signal recorded. A very importantpoint is that the fluid could be air rather than water, ifproper Reynolds* scaling were observed.
This study, as well as others, shows there is potentialfor OBS observational data to be contaminated by hy-drodynamicalry generated noise. Up to now investigationof the importance of the problem has been neglected,
but methods of evaluating the magnitude of the prob-lem for various OBS designs and of solving it, should itprove significant, should be addressed in the future.
ACKNOWLEDGMENTSThis work was possible only with the fine assistance of the officers
and crew of the Lynch, E. Maier commanding. Special thanks goes toLou Banchero and Steve Sova who repaired, checked out, deployed, recov-ered, and otherwise cared for the equipment used. Program managersAl Ballard and Mike Harris fulfilled their responsibilities with tact,understanding, and, in several cases, great creativity and persistence. Iam indebted to Dr. Albert Green for valuable discussions and guid-ance, to Mike Stirgus for much computing assistance, and to JoyceFord for secretarial services. The work was partially funded by NOR-DA Code 543 contract D3311A00. Most of these findings are also pre-sented in the final report for that contract, NORDA Technical Note132. This chapter is NORDA Contribution 331:035:82.
REFERENCESAMF, 1976. Vector Averaging Current Meter, Model 610C. AMF Elec-
trical Products Development Division of AMF Incorporated, Hern-don, Virginia.
Batchelor, G. K., 1967. An Introduction to Fluid Dynamics: Cam-bridge, England (Cambridge University Press), p. 216.
Duennebier, F. K., Blackinton, G., and Sutton, G. H., 1981. Current-generated noise recorded on ocean bottom seismometers. Mar. Geo-phys. Res., 5(1): 109-115.
Every, M. J., King, R., and Weaver, D. S., 1982. Vortex-excited vibra-tions of cylinders and cables and their suppression. Ocean Engng.,9(2): 135-157.
Fleischer, P., 1980. Weather and currents in the vicinity of 23°N, 46°W,North Atlantic Ocean. NORDA Tech. Note 74, NORDA, NSTLStation, Mississippi.
Hussong, D. M., Fryer, P. B., lüthill, J. D., and Wipperman, L. K.,1979. The geological and geophysical setting near DSDP Site 395,North Atlantic Ocean. In Melson, W. G., Rabinowitz, P. D., et al.,Init. Repts. DSDP, 45: Washington (U.S. Govt. Printing Office),23-37.
McCullough, J. R., 1975. Vector Averaging Current Meter speed cali-bration and recording procedure. Woods Hole Oceanographic In-stitution Tech. Rept., WHOI-75-44.
Sutton, G. H., Lewis, B. T. R., Ewing, J., Duennebier, F. K., Iwatake,B., and lüthill, J. D., 1981. An overview and general results of theLopez Island OBS experiment. Mar. Geophys. Res., 5(l):3-34.
Wilcox, J. D., 1978. A survey of current speed measurements in thedeep ocean. NUSC Tech. Mem. 781176: Newport, R. I., and NewLondon, Conn. (Naval Underwater Systems Center).
Woodward, W. E., and Appell, G. F., 1973. Report on the evaluationof a Vector Averaging Current Meter. NOAA Tech. Memo. NOAA-TM-NOS-NOIC-1.
Date of Initial Receipt: August 11, 1982Date of Acceptance: April 26, 1983