5-i Composite Frames under both Vertical and Horizontal Loading Author: Guanghe YU Supervisor: Prof. Jakub Dolejs University: Czech Technical University University: Czech Technical University Date: Jan.2014
Transcript
5-i
Composite Frames under both Vertical and Horizontal Loading
Author: Guanghe YU
Supervisor: Prof. Jakub Dolejs
University: Czech Technical University
University: Czech Technical University Date: Jan.2014
I
European Erasmus Mundus Master Sustainable Constructions under natural hazards and catastrophic events 520121-1-2011-1-CZ-ERA MUNDUS-EMMC
II
Declaration
I confirm that this assignment is my own work, is not copied from any other person's work
(published or unpublished), and has not previously submitted for assessment either at Czech Technical
University in Prague or elsewhere. I confirm that I have understood the Department and University
regulations on plagiarism.
Prague, 14 Jan. 2014 Guanghe YU
European Erasmus Mundus Master Sustainable Constructions under natural hazards and catastrophic events 520121-1-2011-1-CZ-ERA MUNDUS-EMMC
III
INDEX
DECLARATION ........................................................................................................................ II
INDEX .......................................................................................................................................III
ABSTRACT .............................................................................................................................. V
FIGURES ................................................................................................................................. VI
TABLES .................................................................................................................................. VII
1.1. JOINTS CLASSIFICATION ................................................................................................ 1 1.2. SEMI-RIGID JOINTS IN COMPOSITE FRAMES .................................................................... 2 1.3. FRAMES AND JOINTS STUDIED ....................................................................................... 3
2. COMPOSTIE BEAMS UNDER VERTICAL LOADINGS .................................................. 4
2.1. QUASI-PLASTIC APPROACH ........................................................................................... 4 2.2. CRACKED REGION OF COMPOSITE BEAMS ....................................................................... 6 2.3. STIFFNESS REDUCTION OF CRACKED BEAMS .................................................................. 8
2.3.1. Effects of Shear deflection .................................................................................... 8 2.3.2. Stiffness of cracked beam ..................................................................................... 9
3. COMPOSITE FRAMES WITH RIGID JOINTS ................................................................. 9
3.1. CRACKED REGION OF COMPOSITE BEAMS ......................................................................10 3.1.1. Composite beam in frame under vertical loading .................................................10
3.1.2. Composite beam in a frame under horizontal loading ..........................................12 3.1.3. Composite beam in a frame under vertical and horizontal loading .......................13
3.2. EFFECTS OF CRACKED LENGTH RATIO OF BEAM .............................................................14
3.2.1. Stiffness of cracked beam ....................................................................................14 3.2.2. End moments of cracked beam ...........................................................................15
4. COMPOSITE FRAMES WITH SEMI-RIGID JOINTS ......................................................16
4.1. RESEARCH ON SEMI-RIGID FRAMES ..............................................................................16 4.2. BENDING STIFFNESS OF JOINTS ....................................................................................17
4.3. INTERNAL FORCES AND MOMENTS OF BEAMS IN SEMI-RIGID FRAMES ................................21
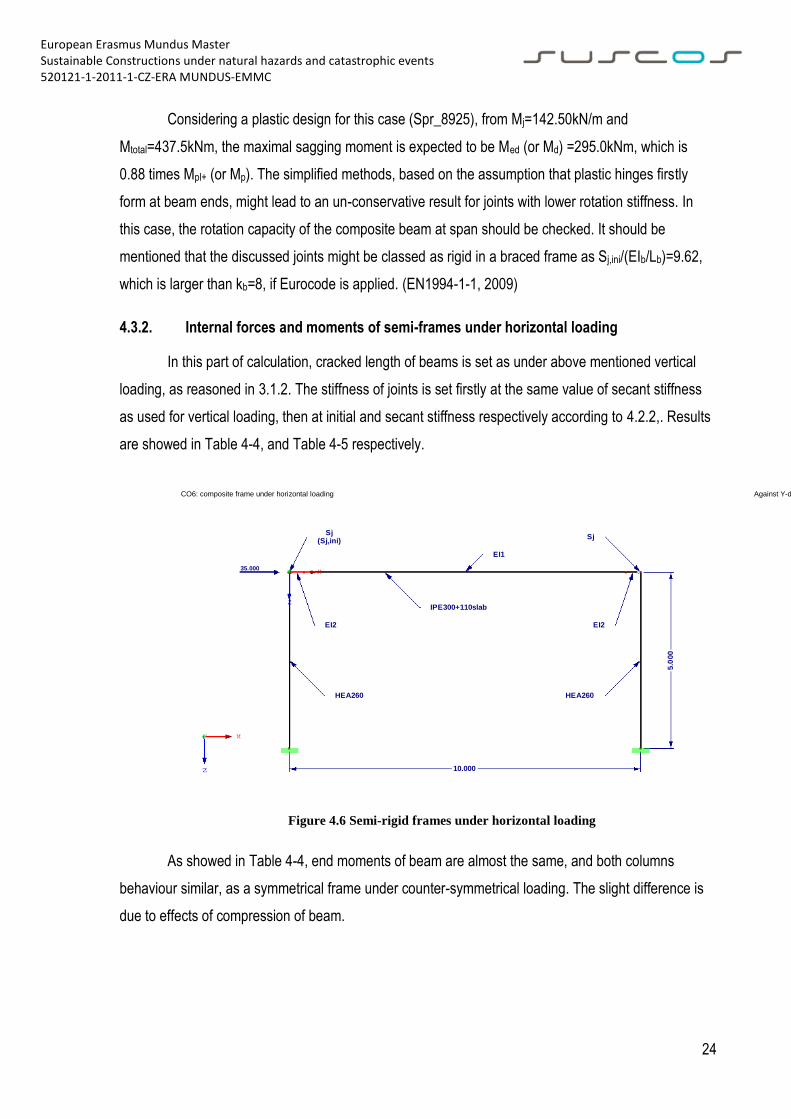
4.3.1. Moments of semi-rigid frames under vertical loading ...........................................22 4.3.2. Internal forces and moments of semi-frames under horizontal loading ................24
5.1.2 Moments at joints ..................................................................................................37 5.1.3 Stiffness of beam ..................................................................................................41 5.1.4 Rotation of joints ...................................................................................................41 5.1.5 Stiffness of frame ..................................................................................................43
Composite frames with semi-rigid joints are studied using numerical analysis methods, in order
that effects of semi-rigidity of connections are introduced into global analysis. Differing from plastic
approach and non-linear collapse analysis, characteristics of joints are employed into linear elastic
analysis, by introducing elastic element end releases.
Semi-rigidity of joints is possible to be employed for moment redistribution of composite
frames, leading to a suitable coherence between hogging and sagging bending capacity of composite
beams, while effects of concrete cracking is limited but unneglectable. Critical load factor, together with
moment redistribution and deflection are analysed within this paper. Suggestion on joint stiffness
selection and using of FEM programme are provided.
Keywords: Semi-rigid composite joints, composite frame, critical load factor, moment
redistribution, cracking analysis
European Erasmus Mundus Master Sustainable Constructions under natural hazards and catastrophic events 520121-1-2011-1-CZ-ERA MUNDUS-EMMC
VI
FIGURES
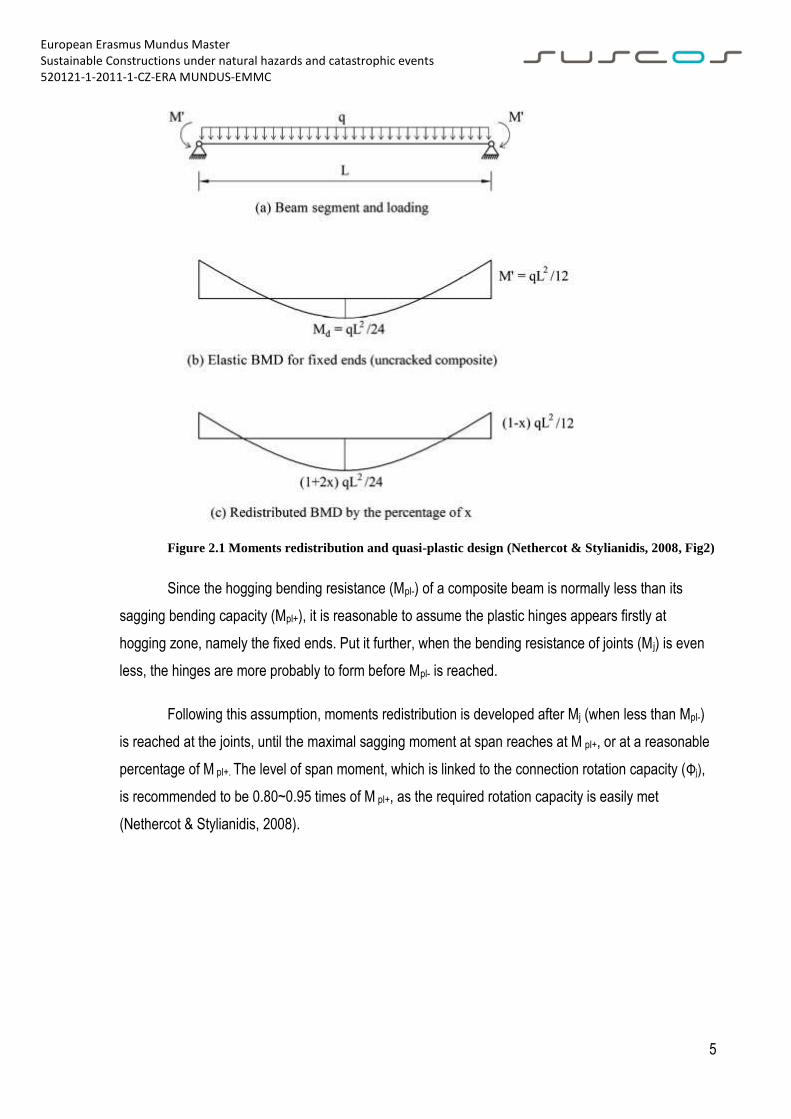
Figure 1.1: Classification of joints by stiffness (Figure 5.4 in EN1993-1-8) ............................... 2 Figure 2.1 Moments redistribution and quasi-plastic design (Nethercot & Stylianidis, 2008,
Fig2) ....................................................................................................................................................... 5 Figure 2.2 Quasi-plastic design methods (Nethercot & Stylianidis, 2008, Fig3) ........................ 6 Figure 2.3 Model of Beam with End Releases .......................................................................... 7 Figure 3.1 Frame under Vertical Loading .................................................................................11
Figure 3.2 Frame under Horizontal Loading (LC2) ...................................................................12 Figure 3.3 Frame under vertical and horizontal loading ...........................................................13 Figure 4.1 Most general form of moment-rotation characteristic (Nethercot D. , 1995) ............17 Figure 4.2 Example of a spring model for a composite end-plate connection (Demonceau,
Figure 4.3 Characteristic of joints when loading or unloading ..................................................20 Figure 4.4 Detailing of composite joints ...................................................................................21 Figure 4.5 Composite frame with semi-rigid connection ...........................................................22
Figure 4.6 Semi-rigid frames under horizontal loading .............................................................24 Figure 4.7 Schematic comparison of load-deflection behaviour ( (Ziemian, 2010) Figure 16.1)
..............................................................................................................................................................27 Figure 4.8 Load case for critical load factor calculation ............................................................28 Figure 5.1 Steel frames studied ...............................................................................................32
Figure 5.2 αcr Value according to different approaches ............................................................33 Figure 5.3 Critical Load factors vs. Span .................................................................................35 Figure 5.4 Critical load factors (Semi-rigid steel frames) ..........................................................35 Figure 5.5 Critical load factors (Semi-rigid steel frames) ..........................................................36 Figure 5.6 Critical load factor vs. Joints stiffness .....................................................................36
Figure 5.7 Critical load factor vs. column height .......................................................................36 Figure 5.8 Moment at joint and Joint rotation ...........................................................................38
Figure 5.9 Moment reduction with Semi-rigid joints ..................................................................38 Figure 5.10 Moment Redistribution with semi-rigid joints .........................................................39
Figure 5.11 Moment of joint in frames ......................................................................................39 Figure 5.12 Moment percentage comparing with rigid frames..................................................40 Figure 5.13 Deflection of beams (mm) .....................................................................................41 Figure 5.14 Rotation of joints (h=5m, unit: mrad) .....................................................................42
Figure 5.15 αcr and Rotation angle of Column .........................................................................43 Figure 5.16 Horizontal displacement of frame (h=5m unit: mm) ..............................................44
Figure 5.24 Moment of beam ends under vertical loading (h=5m) ...........................................49 Figure 5.25 Moment redistribution as result of joints stiffness (h=5m) .....................................49 Figure 5.26 Moment redistribution (Span=10m) .......................................................................50 Figure 5.27 Cracking length of composite beam (h=5m) ..........................................................50 Figure 5.28 Cracking length vs. span .......................................................................................51 Figure 5.29 cracking ratio of composite beams ........................................................................51
European Erasmus Mundus Master Sustainable Constructions under natural hazards and catastrophic events 520121-1-2011-1-CZ-ERA MUNDUS-EMMC
VII
Figure 5.30 Cracking length of composite beam (span=10m) ..................................................52 Figure 5.31 displacement of beam at mid-span (h=5m) ...........................................................52
Figure 5.32 Displacement ratio vs. rotation stiffness of joint ....................................................53 Figure 5.33 Lose of beam rigidity with soft joint (h=5m, span=7m) ..........................................53 Figure 5.34 Rotation angle of joints (h=5m) .............................................................................55 Figure 5.35 Rotation angle of joints vs. span (h=5m) ...............................................................55 Figure 5.36 Rotation angle of joints (span=10m)......................................................................56
Figure 5.37 Joint moment and joint rotation (span=10m, h=5m, q=35kN/m) ............................57 Figure 5.38 Critical load factors of steel and composite frames ...............................................58
TABLES
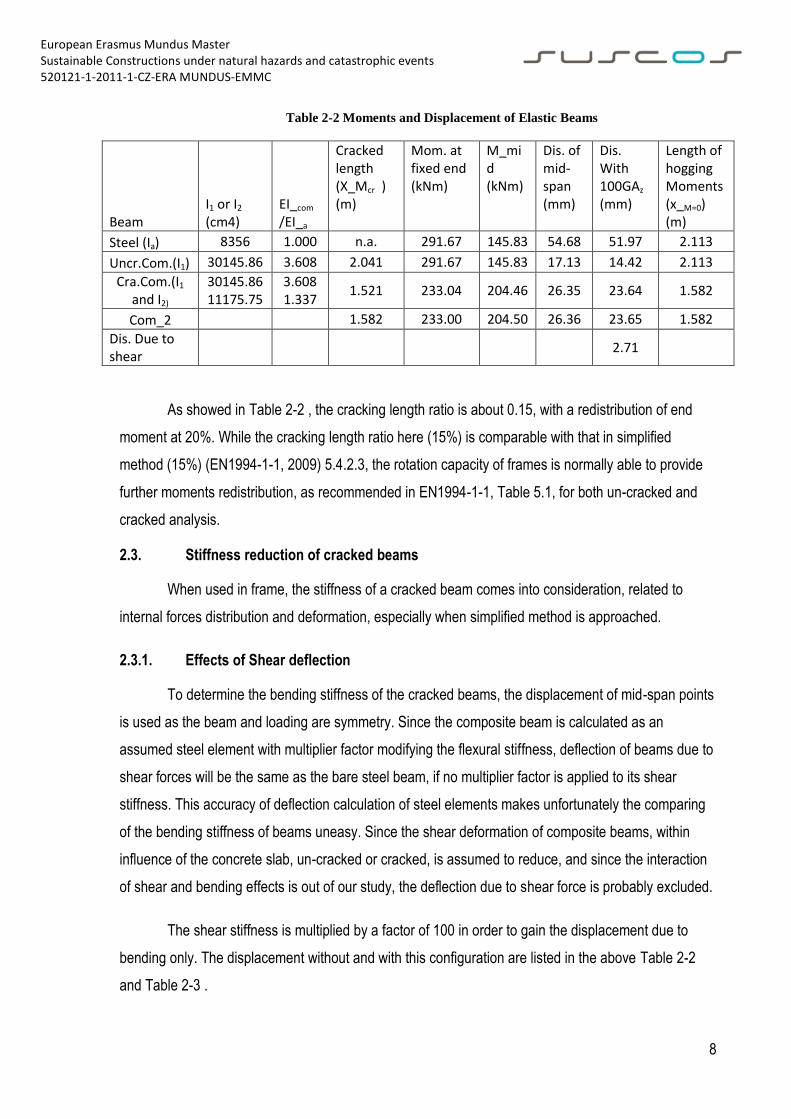
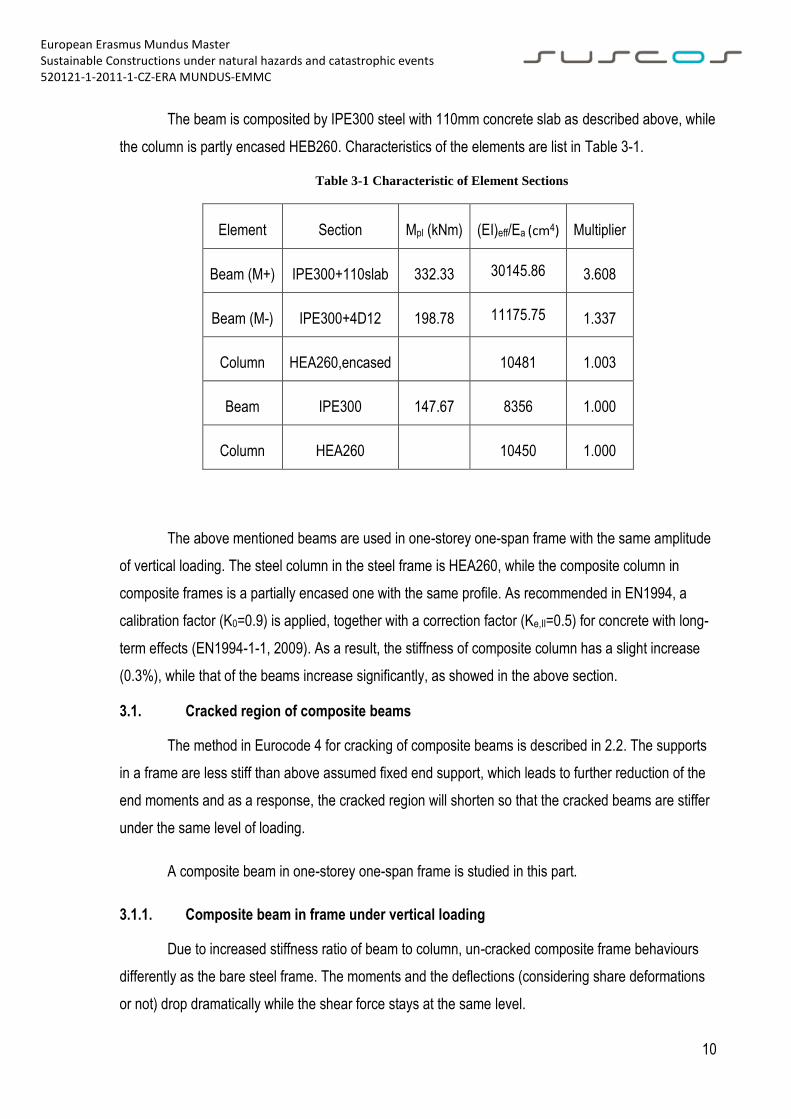
Table 2-1 Plastic Moments of Beam Section............................................................................. 7 Table 2-2 Moments and Displacement of Elastic Beams .......................................................... 8 Table 2-3 Equivalent Stiffness of Cracked Composite Beam .................................................... 9 Table 3-1 Characteristic of Element Sections ..........................................................................10
Table 3-2 Moments of Composite Beam in Rigid Frame (Span L=10m) ..................................11 Table 3-3 Moments of beam due to horizontal loading ............................................................12 Table 3-4 Moments of beam due to vertical and horizontal loading .........................................13
Table 3-5 Effects of length of cracked regions (I2/I1=0.371) .....................................................14 Table 4-1 Components to be considered for end-plate connection under hogging moments
(Demonceau, 2008) ..............................................................................................................................18 Table 4-2 Characteristic of composite joints.............................................................................21
Table 4-3 Moments of beams in semi-rigid frames ..................................................................23 Table 4-4 Internal forces of semi-rigid frames (Sj) ....................................................................25 Table 4-5 Internal forces of semi-rigid frames (Sj,ini &Sj) ..........................................................25 Table 4-6 Critical load factors of semi-rigid frames (Sj) ............................................................28
Table 4-7 Critical load factor of steel frames (L=10m) ..............................................................31 Table 4-8 Critical load factor of steel frames (L=7m) ................................................................31 Table 5-1 Critical load factor of steel frames (variable span) ...................................................34 Table 5-2 Moment of joint in a 1-spam 1-storey frame .............................................................37 Table 5-3 End Moment and Percentage ..................................................................................40
Table 5-4 Joint Rotation Requirement under vertical loading ...................................................42 Table 5-5 Example of divergent iteration ..................................................................................45
Table 5-6 Required Joint rotation (mrad) .................................................................................54 Table 5-7 Moment and Rotation of joint in frame .....................................................................56
Table 5-8 Critical load factor of steel and composite frames ....................................................57
1
Composite Frames under both Vertical and Horizontal
Loading
1. INTRODUCTION
Moment connections are widely used in steel and composite frames. The semi-rigidity of steel
connections has been acknowledged since steel was used as structure materials, and research on its
effects on frames have been widely reported in the last decades. As for composite frames, full-rigid full-
strength connections seem to be impossible due to their complexity, or to be unnecessary due to their
high expense.
This paper, starting from simplified plastic analysis methods by Nethercot (Nethercot &
Stylianidis, 2008) and frame instability research by Demonceau (Demonceau, 2008), tries to introduce
semi-rigidity joints into global analysis of composite frames, based on numerical analysis using a
commercial software package. The study highlights the possibility of global analysis of semi-rigid
frames, by means of application of end elastic releases on beam ends. Limitations of finite element
analysis programmes are also introduced.
1.1. Joints classification
As recognised, steel and/or composite joints have some degree of rigidity or deformability,
which varies in accordance with the applied loading (Simões da Silva, 2008). Composite joints, as well
as steel joints, are classified, in Eurocode4 (EN1994-1-1, 2009) and in Eurocode3-1-8 (EN1993-1-8,
2005), into three categories either by rotational stiffness or by resistance to bending moments. The
categories are:
for stiffness: rigid, semi-rigid, and nominally pinned;
for strength: full-strength, partial-strength, and nominally pinned.
The three stiffness classes, which are relevant to elastic global analysis, are shown in Figure
1.1. Comparing with a „rigid‟ joint, the flexibility of a connection leads to probably significant
redistribution of elastic moments in a frame (Johnson, 2004), related with the stiffness of the joints.
European Erasmus Mundus Master Sustainable Constructions under natural hazards and catastrophic events 520121-1-2011-1-CZ-ERA MUNDUS-EMMC
2
Figure 1.1: Classification of joints by stiffness (Figure 5.4 in EN1993-1-8)
When the rotational behaviour is considered, the structural properties of a joint assumed in
design include bending resistance, rotational stiffness and rotation capacity, noted by Mj,Rd, Sj (or initial
stiffness Sj,ini) and ΦCd respectively.
1.2. Semi-rigid joints in Composite frames
Semi-rigid joints are almost unavoidable in composite frames due to the composite effects of
steel and concrete. Pinned joints might be recommended for braced frame, but the longitudinal
reinforcement in the slab, responsible for control of cracking, will lead to partly resistance for composite
beams connected to an internal column. As for rigid, full-strength connections, extended end plates
with stiffeners will probably needed, as for steel joints. Even through the joints and beam sections are
strengthened by additional haunches, the column web zone may yield some degree of flexibility, not
considering the expense caused by complexity.
Under this criterion, semi-rigid joints or semi-rigid frames are widely studied during the last
With reduction of the rotation stiffness, critical load of frames reduced. It is mentioned that αcr
might reduce 15%~25%, when Sj/Sbeam is equal to 25, which is considered as rigid joints to EN 1994
and EN1993.
Figure 5.6 Critical load factor vs. Joints stiffness
Figure 5.7 Critical load factor vs. column height
Sj (kNm/rad)
European Erasmus Mundus Master Sustainable Constructions under natural hazards and catastrophic events 520121-1-2011-1-CZ-ERA MUNDUS-EMMC
37
5.1.2 Moments at joints
5.1.2.1 Effects of Joint stiffness
The frames studied are the same as for critical load analysis. Vertical loading is employed. Some results are listed in Table 5-2.
Table 5-2 Moment of joint in a 1-spam 1-storey frame
Span (m)
Sj spring
(kNm/rad) joint
classification
Hight (m)
M2 M3 (kNm)
M5 (Load_V+H)
(kNm) a
lfa_ RSBUCK
Alfa_2order
Angle
φ_3-
φ_2
(mrad) 1
0 pi
nned pinn
ed 5 0 0 1
3.38 12.3 8
3.1
10
438
pinned 5
31.66
35.47
13.33 13.3
72.3
10
875
semi-rigid 5
55.96
62.74
14.16 14.1
64
10
1710
semi-rigid 5
89.64
100.60
15.52 15.4
52.5
10
3420
semi-rigid 5
130.94
147.10
17.56 16.5
38.3
10
6840
semi-rigid 5
170.13
191.33
20.02 15.4
24.8
10
15425
semi-rigid 5
204.13
229.78
22.63 15.5
13.2
10
32500 rigid 5
222.77
250.89
24.24 16
6.8
10
rigid rigid 5
242.79
273.59
26.08 16.8 0
The results are curved below, where M2 is end moment of beam under vertical loading, and
M5 is the maximum end moment of beam under vertical and horizontal loading. Rotation angle of joints
are computed from rotation deformation of column and beam at joint.
For a joint stiffness at 0.25Sbeam (where Sj,ini/Sbeam=0.5) , which could be considered as pinned,
the joint moment is 31.66kNm and 35.47kNm, about 8% of mid-span moment of pinned beams.
European Erasmus Mundus Master Sustainable Constructions under natural hazards and catastrophic events 520121-1-2011-1-CZ-ERA MUNDUS-EMMC
38
Figure 5.8 Moment at joint and Joint rotation
5.1.2.2 Effects of joints stiffness with varied spans
End moments of beam reduce when end releases are employed, as showed in the following
figures. With certain components arrangement of connections, the characteristics of joint might be
considered similar. When used in frames with different spans, moment reduction induced seems to be
larger in smaller span frames.
Figure 5.9 Moment reduction with Semi-rigid joints
European Erasmus Mundus Master Sustainable Constructions under natural hazards and catastrophic events 520121-1-2011-1-CZ-ERA MUNDUS-EMMC
39
Figure 5.10 Moment Redistribution with semi-rigid joints
Moment redistribution will be proportionally, if the stiffness ratio is constant, as showed for
0.25Sj/Sbeam in the below Figure 5.10 and Table 5-3.
Figure 5.11 Moment of joint in frames
European Erasmus Mundus Master Sustainable Constructions under natural hazards and catastrophic events 520121-1-2011-1-CZ-ERA MUNDUS-EMMC
40
Figure 5.12 Moment percentage comparing with rigid frames
Table 5-3 End Moment and Percentage
Span (m)
7 9 10 12
Stiffness (kNm)
M (kNm)
M%
M (kNm)
M%
M (kNm)
M%
M (kNm)
M%
pinned 0
.00 0
.00 0
.00 0
.00 0
.00 0
.00 0
.00 0
.00
365
45.75
0.127
438
31.66
0.130
487
25.59
0.133
626 1
5.37 0
.138
875
55.96
0.231
1710
89.64
0.369
3420
130.94
0.539
6840 7
0.75 0
.637 1
31.72 0
.682 1
70.13 0
.701 2
63.23 0
.732
15425 8
8.66 0
.798 1
60.03 0
.829 2
04.13 0
.841 3
09.37 0
.860
32500
222.77
0.918
European Erasmus Mundus Master Sustainable Constructions under natural hazards and catastrophic events 520121-1-2011-1-CZ-ERA MUNDUS-EMMC
41
rigid 1
11.05 1
.000 1
93.09 1
.000 2
42.79 1
.000 3
59.60 1
.000
5.1.3 Stiffness of beam
Figure 5.13 Deflection of beams (mm)
5.1.4 Rotation of joints
Rotation capacity of joints is less important for rigid frames, as ductility is provided most by
respective beams. For pinned frame the joints are normally designed for free rotation, which might be
unreal for most case. For a beam at 12m span under studied loading, the required rotation of joints is
larger than 140 mrad, which should be properly provided with sufficient shear capacity.
The rotation angle at stiffness of 365kNm/rad is calculated with 0.25Sbeanm, representing joint
classification boundary in Eurocode. The used spring values are set according to beam span, namely
365, 438, 487, and 626, for frame with span at 12m, 10m, 9m, and 7m respectively. It should be
mentioned that required joint rotation of semi-rigid frame might be less than 40mrad, if respective
stiffness is provided.
European Erasmus Mundus Master Sustainable Constructions under natural hazards and catastrophic events 520121-1-2011-1-CZ-ERA MUNDUS-EMMC
42
Figure 5.14 Rotation of joints (h=5m, unit: mrad)
Following this consideration, stiffness ratio (Sj/Sbeam) might not less than 4 for span up to 10m,
and 10 for larger span. Further research should be introduced for more complicated frames.
Table 5-4 Joint Rotation Requirement under vertical loading
Span (m)
Sj spring
(kNm/rad) Sj
/Sbeam joint
classification
Angle
φ_3-φ_2 (mrad)
10
3420
3.897969
semi-rigid
38.3
7 68
40 5.
457157 semi
-rigid 1
0.4
9 68
40 7.
016344 semi
-rigid 1
9.3
10
6840
7.795938
semi-rigid
24.8
12
6840
9.355125
semi-rigid
38.5
7 15
425 1
2.30653 semi
-rigid 5.
7
9 15
425 1
5.82268 semi
-rigid 1
0.3
European Erasmus Mundus Master Sustainable Constructions under natural hazards and catastrophic events 520121-1-2011-1-CZ-ERA MUNDUS-EMMC
43
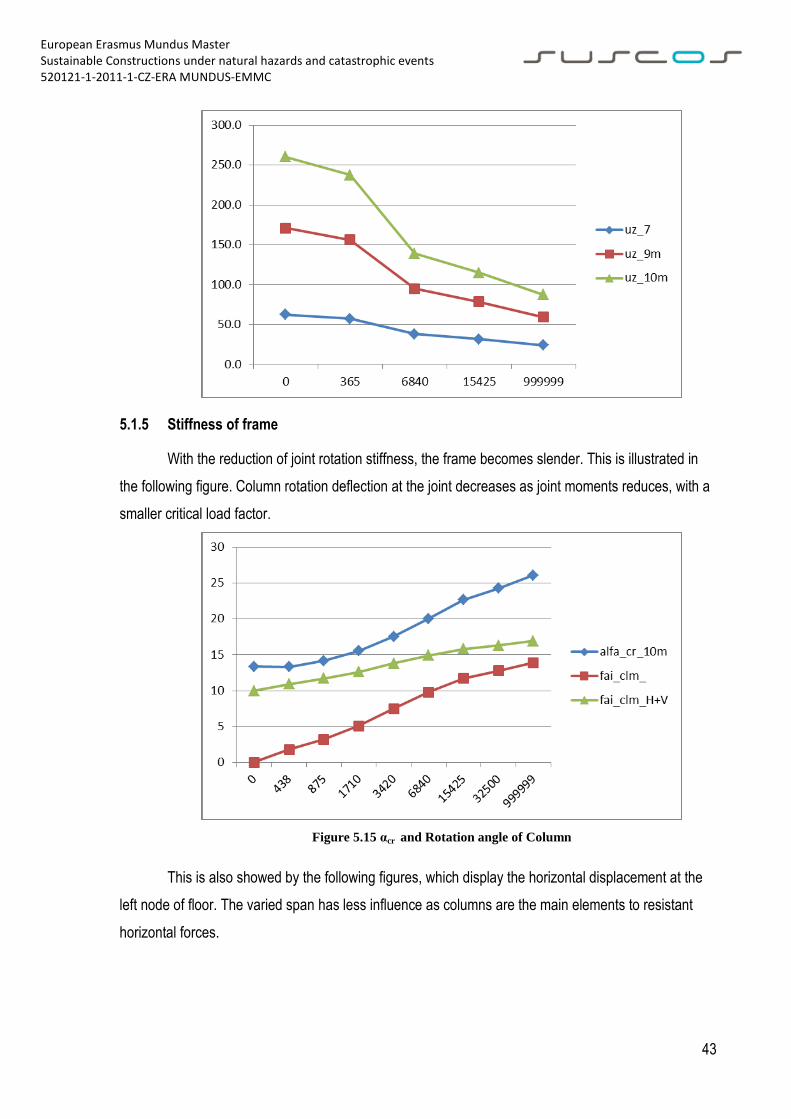
5.1.5 Stiffness of frame
With the reduction of joint rotation stiffness, the frame becomes slender. This is illustrated in
the following figure. Column rotation deflection at the joint decreases as joint moments reduces, with a
smaller critical load factor.
Figure 5.15 αcr and Rotation angle of Column
This is also showed by the following figures, which display the horizontal displacement at the
left node of floor. The varied span has less influence as columns are the main elements to resistant
horizontal forces.
European Erasmus Mundus Master Sustainable Constructions under natural hazards and catastrophic events 520121-1-2011-1-CZ-ERA MUNDUS-EMMC
44
Figure 5.16 Horizontal displacement of frame (h=5m unit: mm)
Figure 5.17 Horizontal displacement of frame (h=5m, unit: mm)
5.2 Composite frames
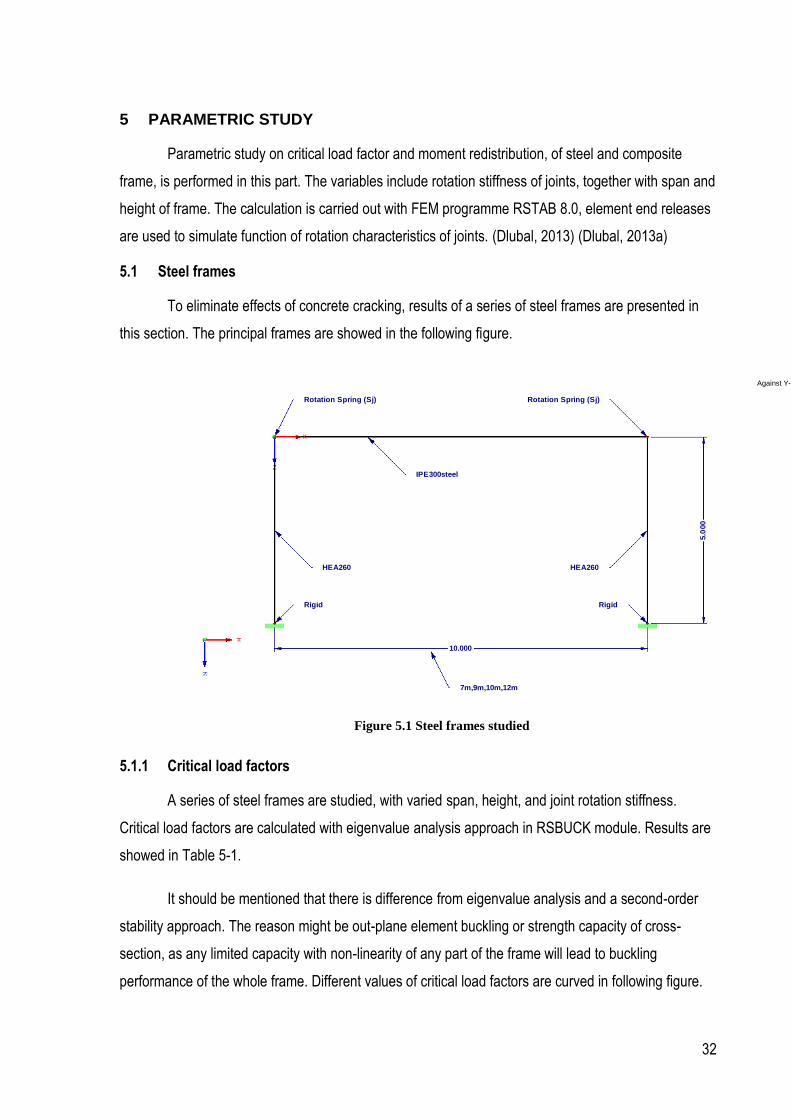
A series of one-span one-storey frames are studied, using RSTAB8.0 programme. The setting
of spans and heights is showed as in Figure 5.18 . A load case with only vertical loading is used, for
study of cracking length, moment distribution, beam stiffness, joint rotation, and critical load analysis.
Additional load case is set when horizontal node force is combined with the above vertical loading.
Cracking lengths of beams are set as result of vertical loading, as proposed in Part 2. The loading is
showed in Figure 5.19.
European Erasmus Mundus Master Sustainable Constructions under natural hazards and catastrophic events 520121-1-2011-1-CZ-ERA MUNDUS-EMMC
45
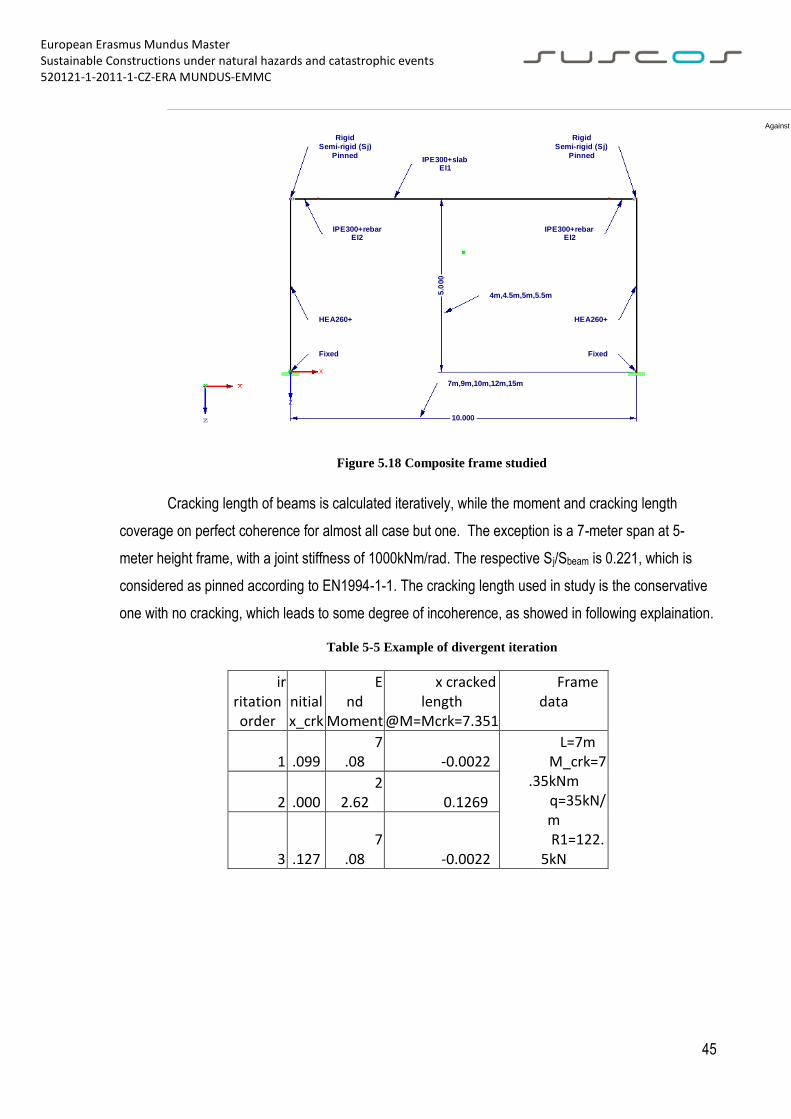
Figure 5.18 Composite frame studied
Cracking length of beams is calculated iteratively, while the moment and cracking length
coverage on perfect coherence for almost all case but one. The exception is a 7-meter span at 5-
meter height frame, with a joint stiffness of 1000kNm/rad. The respective Sj/Sbeam is 0.221, which is
considered as pinned according to EN1994-1-1. The cracking length used in study is the conservative
one with no cracking, which leads to some degree of incoherence, as showed in following explaination.
Table 5-5 Example of divergent iteration
irritation order
initial x_crk
End
Moment
x cracked length
@M=Mcrk=7.351
Frame data
1 0
.099 7
.08 -0.0022 L=7m
M_crk=7.35kNm
q=35kN/m R1=122.
5kN
2 0
.000 2
2.62 0.1269
3 0
.127 7
.08 -0.0022
4m,4.5m,5m,5.5m
IPE300+slabEI1
Rigid
Semi-rigid (Sj)
Pinned
7m,9m,10m,12m,15m
10.000
5.0
00
Rigid
Semi-rigid (Sj)
Pinned
IPE300+rebarEI2
X
Fixed
Z
Y
HEA260+ HEA260+
Fixed
IPE300+rebarEI2
Against Y-direction
European Erasmus Mundus Master Sustainable Constructions under natural hazards and catastrophic events 520121-1-2011-1-CZ-ERA MUNDUS-EMMC
46
Figure 5.19 Load case: Horizontal and vertical Loading
The moments at critical sections are collected, while rotations of joints at the column end and
beam end are provided to account for joint rotation angle under respective loading case. Vertical
displacements of mid-span or maximal at span are recorded, as well as the horizontal displacement of
floor (loaded node) for respective loads.
Figure 5.20 Critical Sections and reference displacements
10.000
Rigid
Semi-rigid (Sj)
Pinned
IPE300+rebarEI2
4m,4.5m,5m,5.5m
IPE300+slabEI1
35.000
35.000 35.000
5.0
00
35.000
Fixed
X
Fixed
Z
Y
7m,9m,10m,12m,15m
HEA260+
Rigid
Semi-rigid (Sj)
Pinned
IPE300+rebarEI2
HEA260+
Against Y-directionCO1: LC1 + LC2
M6E6
M2E2
HEA260+
M1
M3E3
M7
M5E5
X
M4uz
Z
Y
HEA260+
Fixed Fixed
Against Y-direction
European Erasmus Mundus Master Sustainable Constructions under natural hazards and catastrophic events 520121-1-2011-1-CZ-ERA MUNDUS-EMMC
47
5.2.1 Critical load factors
As showed in following figures, the critical load factor will reduce toward that of a pinned frame
when the stiffness of joints decreases. Rotation stiffness at value of 999999 is the result of idealized
rigid frame, if not further explained in the following parts.
Figure 5.21 αcr-Sj curve 1 (Span =10m)
Figure 5.22 αcr-Sj curve 2 (h=5m)
The curves are not parallel at spans, especially whit a large span, where the beam stiffness is
more sensitive to the joint stiffness.
European Erasmus Mundus Master Sustainable Constructions under natural hazards and catastrophic events 520121-1-2011-1-CZ-ERA MUNDUS-EMMC
48
Critical load decrease whit increased height of frame, as influence of slender frame, especially
impact of slenderer columns.
Figure 5.23 αcr-hi curve
5.2.2 Moments at joints
Moments of beam end are equal to that of respective end of column, which is determined by
balance of moments, no matter stiffness of joints. Apart from rigid joints, rigidity of joints leads to
moment redistribution of respective beams. The percentage is related with the joint and beam stiffness
ratio, but not linearly.
The increased value of moment within 7m-span frame is results of zero cracking, as
mentioned at the beginning of this part. If value of beam with cracking length used, curve will be
coherent with that of other spans.
European Erasmus Mundus Master Sustainable Constructions under natural hazards and catastrophic events 520121-1-2011-1-CZ-ERA MUNDUS-EMMC
49
Figure 5.24 Moment of beam ends under vertical loading (h=5m)
Figure 5.25 Moment redistribution as result of joints stiffness (h=5m)
Varity of frame height effects slightly the moments at joints, as bending stiffness of column
changes slightly.
European Erasmus Mundus Master Sustainable Constructions under natural hazards and catastrophic events 520121-1-2011-1-CZ-ERA MUNDUS-EMMC
50
Figure 5.26 Moment redistribution (Span=10m)
5.2.3 Cracking length of beam
Cracking length extends with increasing rigidity of joints up to rigid joints. Cracking length
seems might to be proportion to beam span with other constant condition. This is more obvious when
the cracking ratio, namely the ratio of cracking length to span, is curved with joint stiffness, considering
relative stiffness is not applied.
Figure 5.27 Cracking length of composite beam (h=5m)
European Erasmus Mundus Master Sustainable Constructions under natural hazards and catastrophic events 520121-1-2011-1-CZ-ERA MUNDUS-EMMC
51
Figure 5.28 Cracking length vs. span
Figure 5.29 cracking ratio of composite beams
As showed in the following figure, cracking length is less effected by column height as the
column bending stiffness varies slightly in this study.
European Erasmus Mundus Master Sustainable Constructions under natural hazards and catastrophic events 520121-1-2011-1-CZ-ERA MUNDUS-EMMC
52
Figure 5.30 Cracking length of composite beam (span=10m)
5.2.4 Stiffness of beam
Stiffness of beam decreases when respective joints lose their rigidity. The displacement
increases largely within slender beams, as a result of large span. If relative displacement is applied,
that is, the ratio of displacement within semi-rigid beam to that of rigid beam, the curve seems to
converge. The relation seems to be controllable unless the joint is dominantly pinned, as indicated in a
7-span beam, or the beam is too slender to perform service limit situation, which is not presented here.
The beams with span of 12m and 15m have produced unfavourable displacements here, as a result of
overloading, comparing to real design.
Figure 5.31 displacement of beam at mid-span (h=5m)
European Erasmus Mundus Master Sustainable Constructions under natural hazards and catastrophic events 520121-1-2011-1-CZ-ERA MUNDUS-EMMC
53
Figure 5.32 Displacement ratio vs. rotation stiffness of joint
Figure 5.33 Lose of beam rigidity with soft joint (h=5m, span=7m)
5.2.5 Rotation of joints
To perform moment redistribution as discussed above, available joint rotation should not be
less than value from elastic analysis. As showed in above parts, most joints are possible to have a
rotation capacity of 31mrad, which extends to 100mrad when the joint stiffness reduced to
8425kNm/rad (initial stiffness of joint will be 17850kNm/rad) (Bitar, et al., 2006).
European Erasmus Mundus Master Sustainable Constructions under natural hazards and catastrophic events 520121-1-2011-1-CZ-ERA MUNDUS-EMMC
54
Table 5-6 Required Joint rotation (mrad)
Span (m)
EI/L (kNm)
Sj spring
(kNm/rad) Sj
/Sbeam joint
classification
Angle
φ_3-
φ_2
(mrad) 1
0 6
331.174 34
20 1.
08 semi
-rigid 1
5.8
12
5275.978
6840
2.593
semi-rigid
18.7
15
4220.783
15425
7.309
semi-rigid
19.4
10
6331.174
1000
0.316
pinned
20.4
7 9
044.534 10
00 0.
221 pinn
ed 2
2.6
12
5275.978
3420
1.296
semi-rigid
25.7
15
4220.783
8925
4.229
semi-rigid
28.5
15
4220.783
6840
3.241
semi-rigid
33.6
12
5275.978
1000
0.379
pinned
34.4
15
4220.783
3420
1.621
semi-rigid
47.4
15
4220.783
1000
0.474
pinned
65.7
For span up to 12m, the required joint rotation will be less than 35mrad, with a secant stiffness
of 1000kNm/rad, which is considered as pinned as stiffness ratio (0.38) is less than 0.5. Larger span
requires an increased rotation capacity of joints. A 15m-span frame demands joint rotation at
65.7mrad, which is not presented in the following figure. The required bending moment in span is
beyond section bending capacity, which involves a larger height of section, normally a larger steel
profile. Fortunately such a span is not common for multi-storey buildings.
The incoherence of 7m-span frame is caused by divergence of cracking length, as discussed
above. Pinned frames require a relatively large rotation capacity, as effect of cracking is not valid for
moment redistribution. The un-cracked stiffness of composite beams is applied in such case.
European Erasmus Mundus Master Sustainable Constructions under natural hazards and catastrophic events 520121-1-2011-1-CZ-ERA MUNDUS-EMMC
55
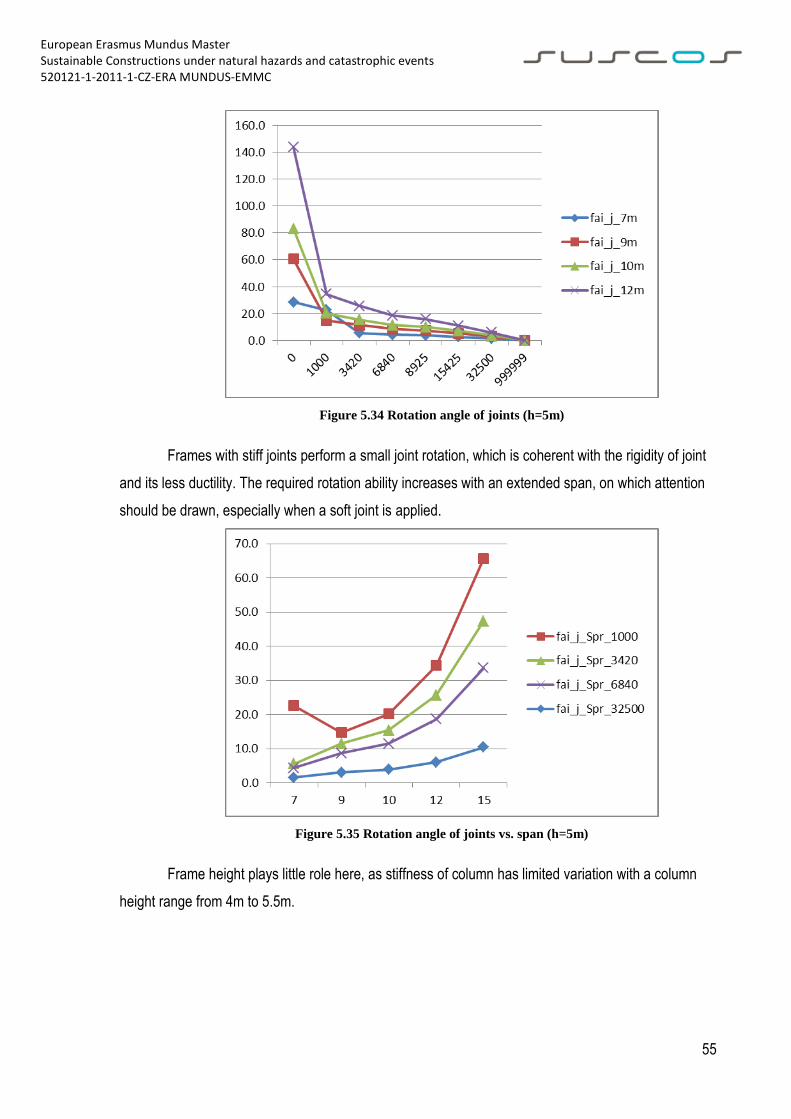
Figure 5.34 Rotation angle of joints (h=5m)
Frames with stiff joints perform a small joint rotation, which is coherent with the rigidity of joint
and its less ductility. The required rotation ability increases with an extended span, on which attention
should be drawn, especially when a soft joint is applied.
Figure 5.35 Rotation angle of joints vs. span (h=5m)
Frame height plays little role here, as stiffness of column has limited variation with a column
height range from 4m to 5.5m.
European Erasmus Mundus Master Sustainable Constructions under natural hazards and catastrophic events 520121-1-2011-1-CZ-ERA MUNDUS-EMMC
56
Figure 5.36 Rotation angle of joints (span=10m)
Reduction of joint stiffness is possible to be used for moment redistribution, which fits the
bending capacity of composite beams. Even within reduced joint moments, rotation of joints will tend to
increase, which requires a larger joint rotation capacity. As showed in Table 5-7 and Figure 5.37, when
stiffness ratio approaches 10, required joint rotation is about 3.9mrad. Even when a practical pinned
connection with stiffness ratio at 0.3, required rotation of beam is about 20, less than available value
from test.
It should be mentioned that, required rotation capacity might increase significantly with large
span. Nethercot (Nethercot & Stylianidis, 2008) deduced a value large than 120mrad for a 16m span
beam, using quasi-plastic design approach.
Table 5-7 Moment and Rotation of joint in frame
Span
L (m)
Sj spring
(kNm/rad)
S
j/Sbeam (SjL/EI1)
joint classification
Hight (m)
cracked length
(m)
Moment _joint (kNm)
requiredφ_j
(mrad) 1
0 rig
id ∞ rigid 5 0
.907 1
51.71 0.0
10
32500
10.27
semi-rigid 5
0.742
127.61 3.9
10
15425
4.873
semi-rigid 5
0.614
108.19 7.1
10
8925
2.819
semi-rigid 5
0.491
89.10 10.0
1 68 2 semi 5 0 7 11.5
European Erasmus Mundus Master Sustainable Constructions under natural hazards and catastrophic events 520121-1-2011-1-CZ-ERA MUNDUS-EMMC
57
0 40 .161 -rigid .427 8.93
10
3420
1.08
semi-rigid 5
0.267
52.84 15.4
10
1000
0.316
pinned 5
0.074
20.19 20.2
10
pinned 0
pinned 5
0.000
0.00 83.1
Figure 5.37 Joint moment and joint rotation (span=10m, h=5m, q=35kN/m)
5.3 Comparison of steel and composite frames
Critical load factors are employed here, to obtain ideas about global stability of composite
structures. The specimen studied here are some of before discussed frames, with varied span and 5m
height. Results are listed in Table 5-8.
Table 5-8 Critical load factor of steel and composite frames
Type
Sj \span 7 9
10
12
steel
pinned
17.69
13.76
13.38
10.32
steel
0.25S_beam
19.60
14.92
14.92
10.98
steel 6840
30.09
22.63
20.02
16.06
steel
15425
35.42
25.94
22.63
17.64
ste rigid 4 3 2 1
European Erasmus Mundus Master Sustainable Constructions under natural hazards and catastrophic events 520121-1-2011-1-CZ-ERA MUNDUS-EMMC
58
el 4.14 0.68 6.08 9.27
composite
pinned
17.41
13.54
12.19
10.16
composite 1000
20.24
15.71
14.12
11.90
composite 6840
31.64
22.02
19.49
17.68
composite
15425
39.04
25.12
21.95
20.88
composite
32500
44.71
27.13
23.46
23.03
composite rigid
52.49
29.54
25.19
25.63
Part of the result is curved in Figure 5.38. Simple frames perform similarity considering
buckling load, as a result of similar strength capacity of column. Stiffness strengthening from composite
beams leads to an increase of critical load factor for rigid frames.
Results of joints with a rotation stiffness of 15425kNm/rad are performed as those of semi-rigid
frames. Composite frames seem to have a slight higher buckling load if same stiffness ratio are
applied.
Figure 5.38 Critical load factors of steel and composite frames
European Erasmus Mundus Master Sustainable Constructions under natural hazards and catastrophic events 520121-1-2011-1-CZ-ERA MUNDUS-EMMC
59
6. COCLUSION
When semi-rigid joints are introduced into frames, the principle consideration might be how to
set an appropriate degree of rotation stiffness and bending capacity of joints. As discussed above,
effects of joints on frames may be significant, which should be included within global analysis.
6.1. Concrete cracking
Effects of cracking region should be considered in global analysis by iterative method, where
convergence is reached in most case. Divergence is encountered during this study, which happens
with a tiny stiffness of joint and a large one of beam. Cracking length is recommended to count for its
effects, differing from un-cracking stiffness used for pinned beam, even when the joints are almost
similar as a simple one.
Exactness of cracking length makes slight difference of moment distribution in frame, as the
stiffness of beam varies slightly. It is recommended that the cracked length under characteristic
combination of vertical loading be used for modelling; as a result, a determined structure is set for
further analysis. With this simplification, modification factors and analysis methods are possible to be
defined for each load case, and results combination is available considering load history.
Considering effects of concrete cracking, end moments of beams is expected to reduce about
10% in rigid frames. This moment redistribution is limited within semi-rigid frame, without consiferation
of plastic characteristics of composite beams.
6.2. Semi-rigid joints
By introducing end releases at beam ends, effects of rotation stiffness of joints are possible to
be simulated. Suitable moment redistribution, which will benefit usage of composite beams, is possible
to be obtained by employing certain rigidity of joints, while the critical load of frame is expected to
reduce.
Stiffness ratio of joints and beams is used for joint classification, but stiffness of composite
beam in frame is hard to determined, as cracking length is related with level and distribution of loading.
Un-cracked stiffness of composite beams is used in this study, as calculation, based on value of joint
rigidity, is not influenced by stiffness ratio. With introducing of joint elements into modelling,
European Erasmus Mundus Master Sustainable Constructions under natural hazards and catastrophic events 520121-1-2011-1-CZ-ERA MUNDUS-EMMC
60
classification of joints is less important, comparing traditional extreme setting as either rigid or simple
joints.
Critical load analysis is possibly processed using either eigenvalue analysis or step-by-step
nonlinear second-order approach. Eigenvalue analysis method is recommended as buckling shapes
are provided to further determine buckling length for element verification. Second order approach might
be used when nonlinearity of components should be activated for consideration. Programme used in
this study might provide a lower value, especially within long span frames, when the later method is
employed. Furthermore, results from that show discontinuity with varied parameters. In this situation,
eigenvalue analysis is recommended in practice.
End moments of beams slide from results of rigid frame to those of simple one, when reduction
of rigidity of joints performs. This desirable moment redistribution might benefit composite structures if
coherence of rigidity and strength capacity of joints is proofed to be provided. Complicity of analysis
process hinders practical application of semi-rigid semi-strength connection in building industry, thus it
is expected that combination of software package of joint design and global analysis will bring semi-
rigid frame into practice. A high degree of joint rigidity is recommended in sway frame, considering
global stability and required joint rotation.
European Erasmus Mundus Master Sustainable Constructions under natural hazards and catastrophic events 520121-1-2011-1-CZ-ERA MUNDUS-EMMC
61
REFERENCES
Bitar, D., Ryan, Y., Caramelli, S., Salvatore, W., Taucer, F., Jaspart, J., et al. (2006). Applicability of composite structures to sway frames. Final report, Report EUR21913 en, Science Research Development,European Communities.
Chen, W. (1999). Stability design of steel frame (tr.in Chinese). (N. Zhou, Trad.) China: Shanghai World Book Publishing Company.
Chen, W., & Atsuta, T. (1997). Theory of beam-columns I: In-plane behavior and design (tr.in Chenise). (N. Zhou, Q. Lu, D. Han, & H. Wu, Trads.) China Communication Press.
Demonceau, J.-F. (2008). Steel and composite building frames: sway response under conventional loading and development of membrane effects in beams further to an exceptional action. Liège University: PhD. dessertation.
Dlubal. (2013). RSBUCK: Program sescription. Dlubal Engineering Software. Dlubal. (2013a). RSTAB 8: Structural analysis of general frameworks, program description (a ed.).
Dlubal Engineering Software. Drozd, M. (2012). Composite steel-concrete frame structures. Eldemerdash, M., Abu-Lebdeh, T., & Al Nasra, M. (2012). Finite element analysis of large capacity
endplate steel connections. Journal of computer science, 8(4), pp. 482-493. EN1993-1-1. (2005). Eurocode 3:Design of steel structures, Part 1-1: General rules and rules for
buildings. CEN, Brussels: European Standard. EN1993-1-8. (2005). Eurocode 3: design of steel structures, Part 1-8: design of joints. CEN, Brussels:
European Standard. EN1994-1-1. (2009). Eurocode 4:Design of composite steel and concrete structures, Part 1-1: General
rules and rules for buildings. CEN, Brussels: European Standard. Gardne,r L and Nethercot, D. A. (2005). Designers´guide to EN1993-1-1 Eurocode 3: Design of steel
structures. Thomas Telford Ltd. Johnson, R. (2004). Composite structures of steel and concrete (3rd Ed). Blackwell Publishing. Johnson, R.P. and Anderson,D. (2004). Designers’ Guide to EN 1994-1-1, Eurocode 4: design of
composite steel and concrete structures, Part 1.1: General Rules and Rules for Buildings. Thomas Telford.
Leon, R., Hoffman, J., & Staeger, T. (1996). Partially Restrained Composite Connections. American Institute of Steel Construction.
Nethercot, D. (1995). Semi-rigid joint action and the design of non-sway composite frames. Engineering Structures 17, 554-567.
Nethercot, D., & Stylianidis, P. (2008). The basis for semi-continuous composite construction. Steel Construction, 24-33.
Simões da Silva, L. (2008). Towards a constent design approach for steel joints under generalized loading. Journal of constructional steel research, 64(9), 1059-1075.
Simões da Silva, L., Simões, R., and Gervásio, H. (2010). Design of steel structures. ECCS and Ernst & Sohn.
Tamboli, A. (Ed.). (1999). Handbook of structural steel connection design ad details. McGraw-Hill. Wang, J.F and Li, G.Q. (2008). A practical design method for semi-rigid composite frames under
vertical loads. Journal of constructional steel research, 176-189. Wang, Y., Li, H., & Li, J. (2003). Initial stiffness of semi-rigid beam-to-column connections and
structural internal force analysis (in Chinese), Vol20 No.6. Engineering Mechanics. WangJ.F., & LiG.Q. (2008a). Simplified beam design for semi-rigid composite frames at the
serviceability limit state. Tsinghua Science and Technology(13), 681-688. Ziemian, R. (Ed.). (2010). Guide to stability design criteria for metal structures (6 ed.). John Wiley &


![[E-book] Composite Structures of Steel and Concrete- Volume 1-Beams, Slabs, Columns and Frames for Buildings (R.P.johnson)](https://static.documents.pub/doc/80x56/55cf9778550346d03391c60c/e-book-composite-structures-of-steel-and-concrete-volume-1-beams-slabs.jpg)


![Characterisation of beam-to-column steel-concrete composite ......when considering (i) the behaviour of composite sway frames ([2] and [3]) in which sagging moments at the extremities](https://static.documents.pub/doc/80x56/60a2b2c703736721cc288913/characterisation-of-beam-to-column-steel-concrete-composite-when-considering.jpg)