Composite Materials: Mechanical and Fracture Characterization Dr Rajesh Kitey School on Mechanics of Reinforced Polymer Composites Knowledge Incubation for TEQIP Indian Institute of Technology Kanpur January 22-25, 2017
Transcript
Composite Materials: Mechanical and Fracture Characterization
Dr Rajesh Kitey
School on Mechanics of Reinforced Polymer Composites Knowledge Incubation for TEQIP
Indian Institute of Technology Kanpur January 22-25, 2017
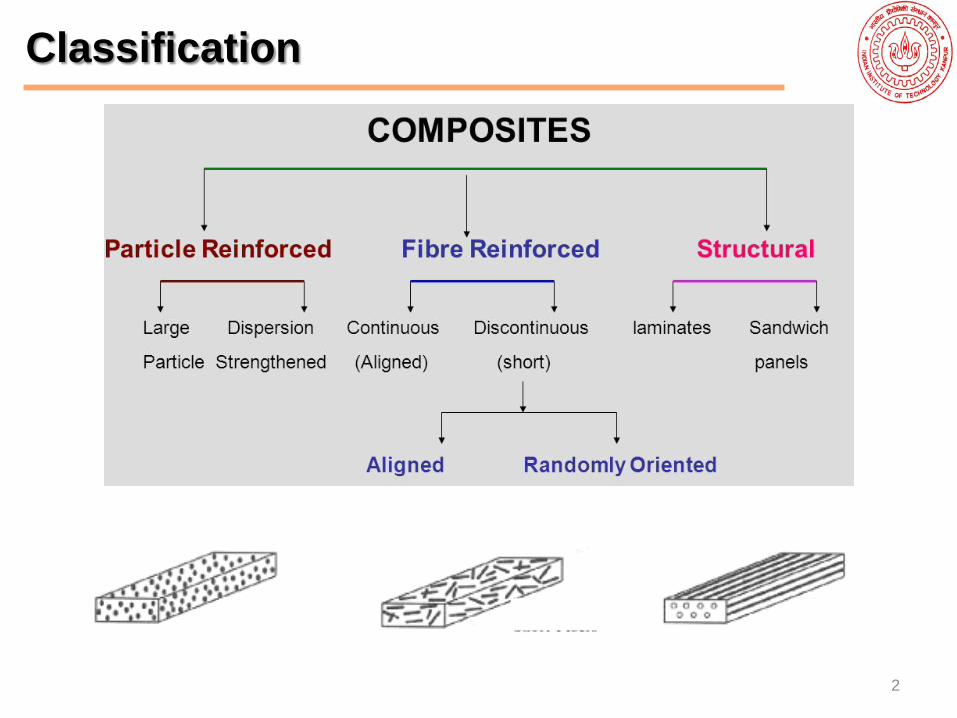
Classification
2
3
10% spherical particle 10% Milled fibers
45% continuous fibers
Distribution uniformity
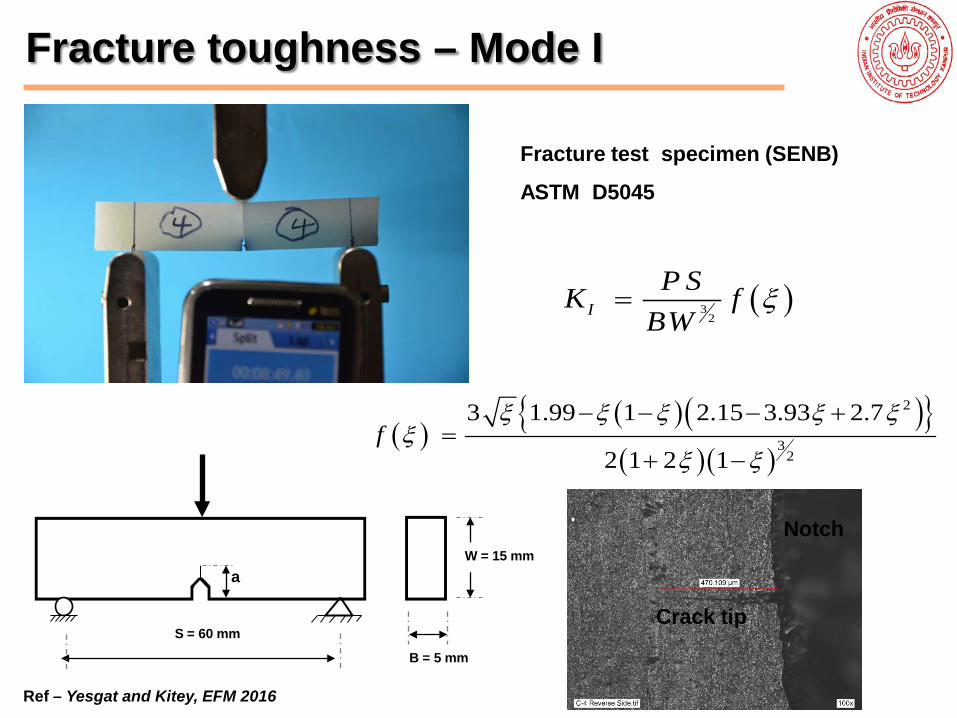
Ref – Yesgat and Kitey, EFM 2016
4
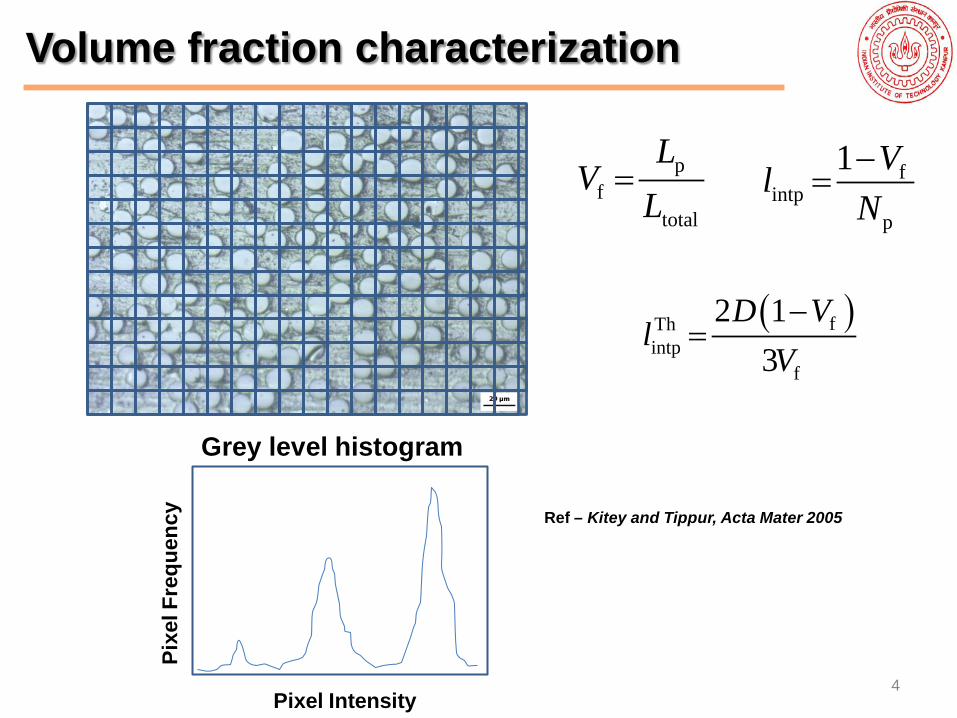
Volume fraction characterization
pf
total
LV
L= f
intpp
1 VlN−
=
( )fThintp
f
2 13
D Vl
V−
=
Grey level histogram
Pixe
l Fre
quen
cy
Pixel Intensity
Ref – Kitey and Tippur, Acta Mater 2005
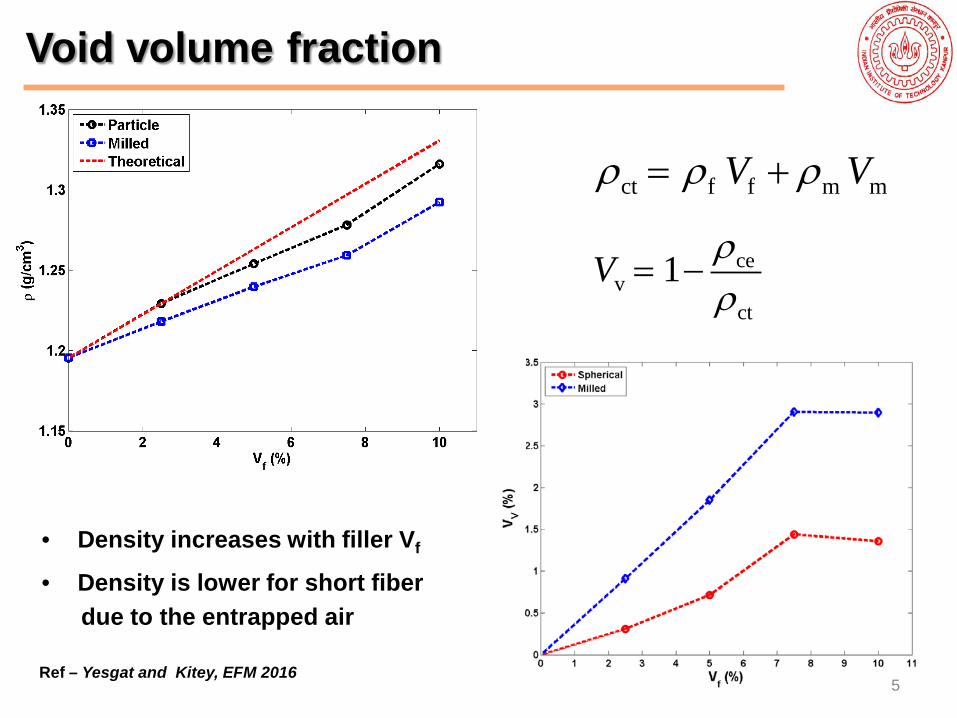
cev
ct
1V ρρ
= −
ct f f m mV Vρ ρ ρ= +
• Density increases with filler Vf
• Density is lower for short fiber due to the entrapped air
5
Void volume fraction
Ref – Yesgat and Kitey, EFM 2016
6
Mechanical Characteristics
7
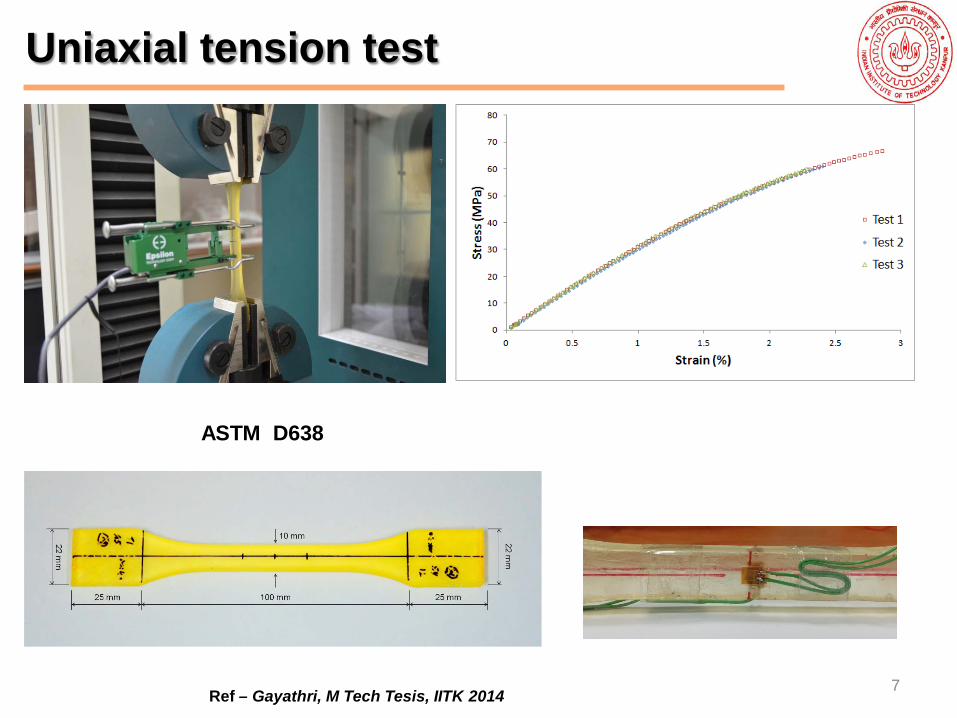
Uniaxial tension test
ASTM D638
Ref – Gayathri, M Tech Tesis, IITK 2014
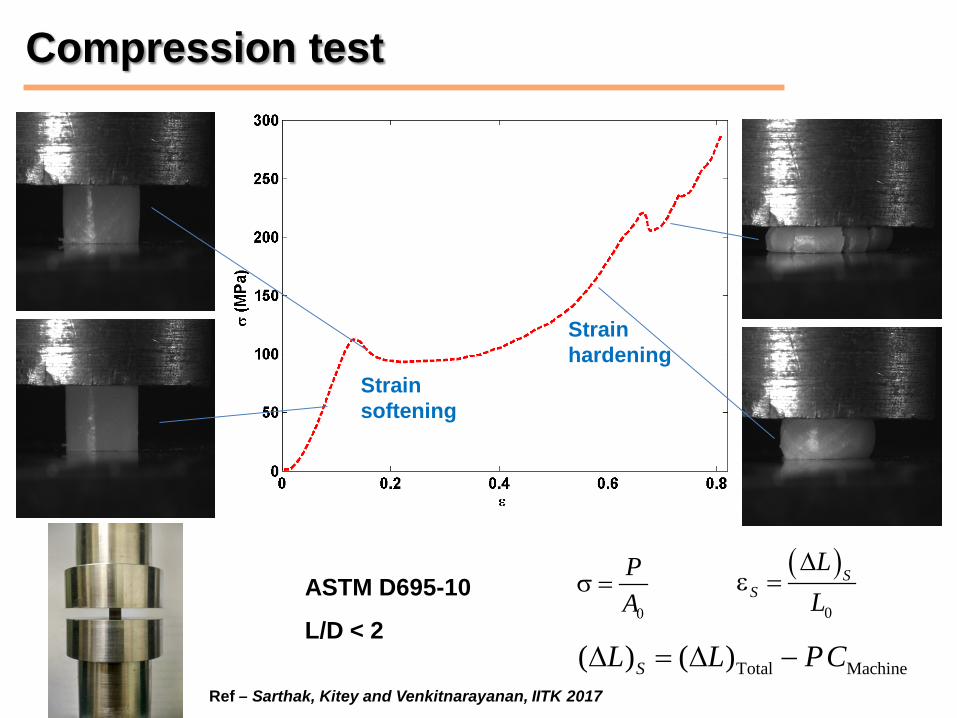
Strain softening
Strain hardening
Compression test
0
PA
σ =( )
0
SS
LL
∆ε =
Total Machine( ) ( )SL L PC∆ = ∆ −
ASTM D695-10
L/D < 2
Ref – Sarthak, Kitey and Venkitnarayanan, IITK 2017
9
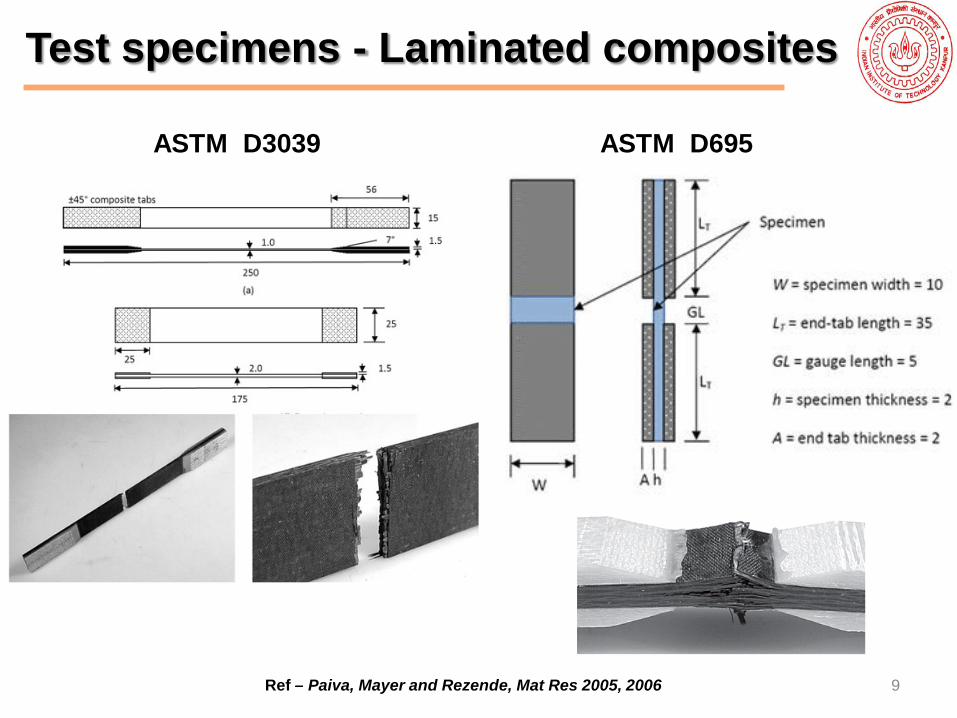
Test specimens - Laminated composites
ASTM D3039 ASTM D695
Ref – Paiva, Mayer and Rezende, Mat Res 2005, 2006
0 2 4 6 80
50
100
150
200
δ(mm)
Load
(N)
250C450C550C
Spherical
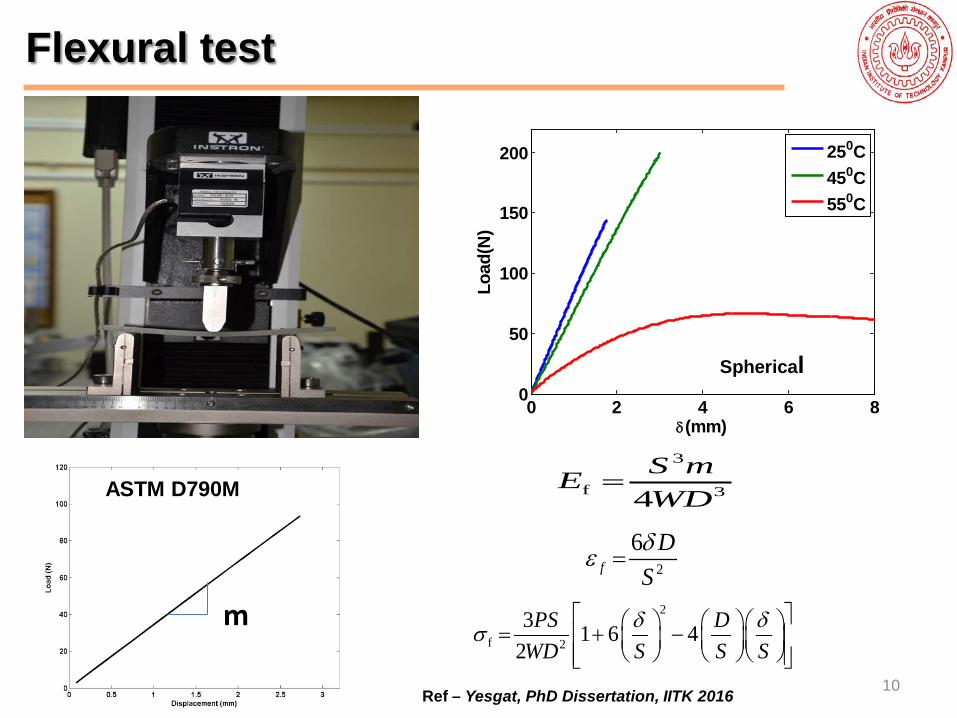
m
ASTM D790M 3
f 34S mEWD
=
2
f 2
3 1 6 42
PS DWD S S S
δ δσ = + −
10
2
6f
DSδε =
Flexural test
Ref – Yesgat, PhD Dissertation, IITK 2016
11
Shear test
Arcan test ASTM D 5379 (Ioscipescu test)
Three rail shear test Uniaxially loading [ ]2
45S
±
12
12
2xx
xx yy
σσ =
γ = ε − ε
Ref – Mohite, nptel
Ref – Hasan PhD 2015
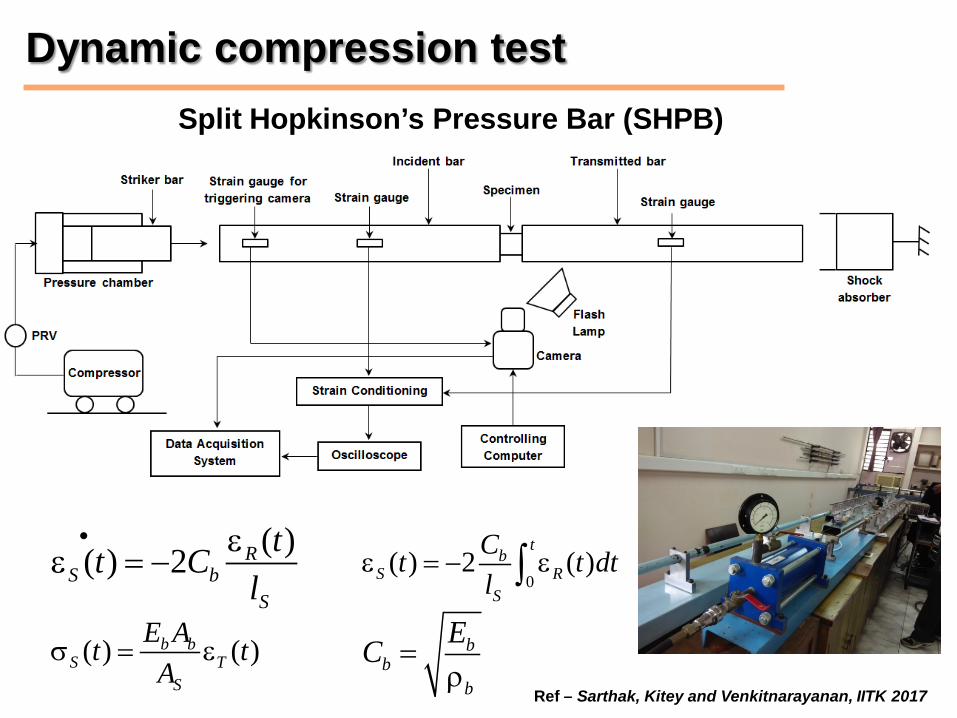
Split Hopkinson’s Pressure Bar (SHPB)
Dynamic compression test
( )( ) 2• ε
ε = − RS b
S
tt Cl 0
( ) 2 ( )ε = − ε∫t
bS R
S
Ct t dtl
( ) ( )σ = εb bS T
S
E At tA
=ρ
bb
b
ECRef – Sarthak, Kitey and Venkitnarayanan, IITK 2017
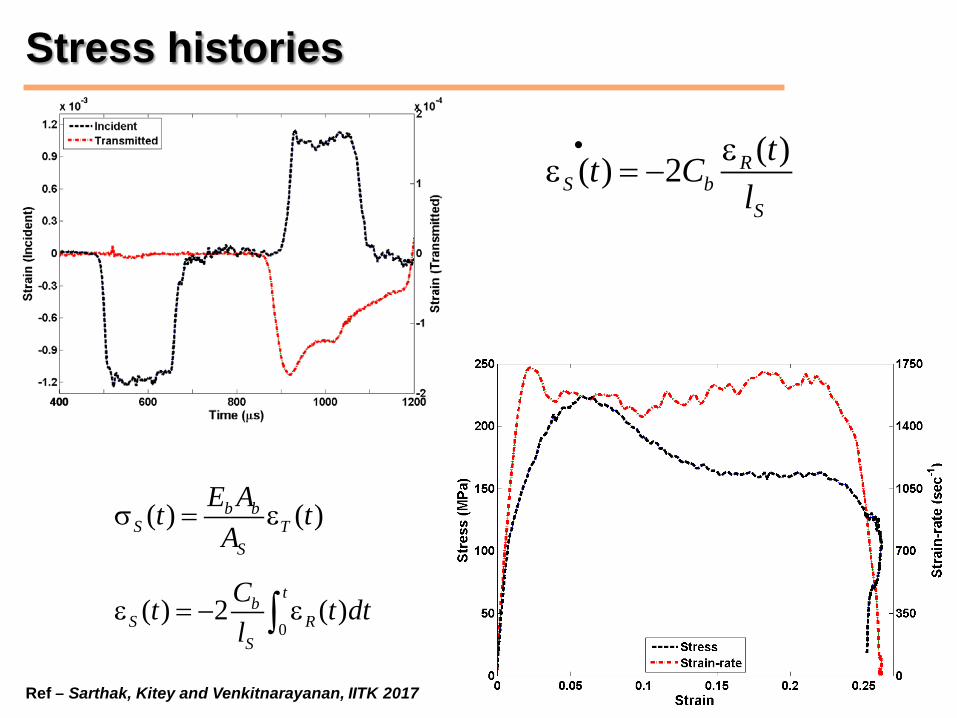
Stress histories
( )( ) 2• ε
ε = − RS b
S
tt Cl
0( ) 2 ( )ε = − ε∫
tb
S RS
Ct t dtl
( ) ( )σ = εb bS T
S
E At tA
Ref – Sarthak, Kitey and Venkitnarayanan, IITK 2017