74
Composite Pavement Technology Timothy R. Clyne, P.E. Minnesota Department of Transportation January 13, 2011 Presented to the Transportation Learning Network and the NDLTAP
Composite Pavement
Technology
Timothy R. Clyne, P.E.
Minnesota Department of Transportation
January 13, 2011
Presented to the
Transportation Learning Network and the NDLTAP

Presentation Outline
Background & Introduction
MnROAD Test Section Construction
Instrumentation, Material Properties, and
Performance
Performance Predictions Using MEPDG
Cost Estimating Scenario (Contractor)
TICP Pooled Fund Study
Acknowledgements
• Shreenath Rao, Applied Research
Associates
• Mark Watson, Mn/DOT
• Tony Johnson, C.S. McCrossan
• Derek Tompkins, University of Minnesota
• Mike Darter, Applied Research Associates
• Luke Johanneck, University of Minnesota

What is a Composite Pavement?
– AC/PCC or PCC/PCC
pavement constructed
as an integrated
system
– Provides strong,
durable, safe, smooth,
and quiet surface
– Requires minimal
maintenance

Strategic Highway Research Program
Established by Congress in 2006
Short term program of focused research
– Safety
– Renewal
– Reliability
– Capacity
R21 Composite Pavement Systems
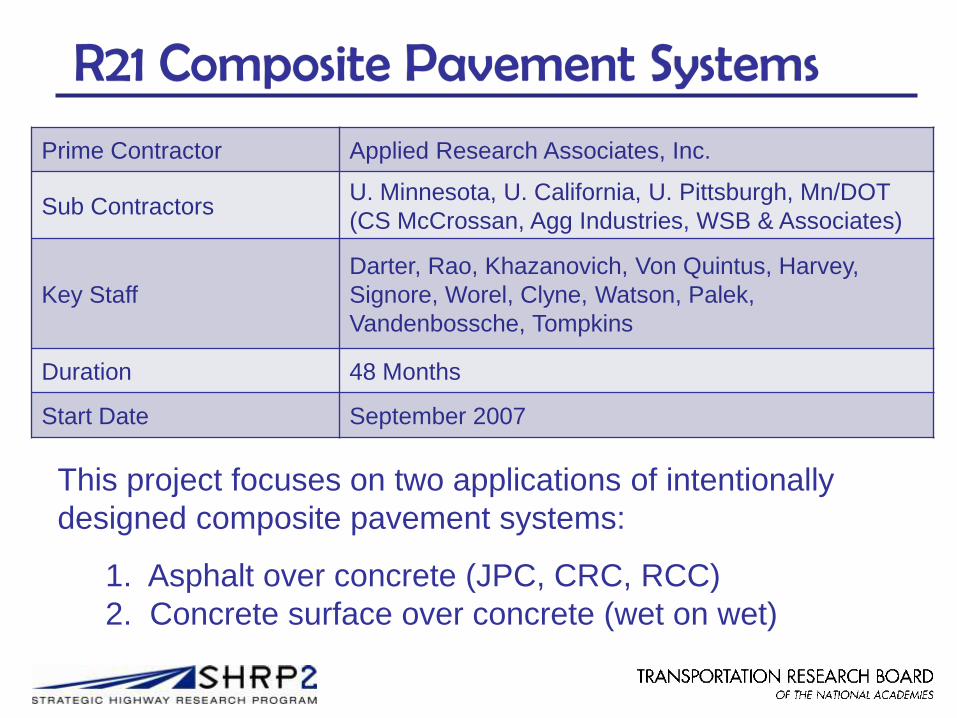
This project focuses on two applications of intentionally
designed composite pavement systems:
1. Asphalt over concrete (JPC, CRC, RCC)
2. Concrete surface over concrete (wet on wet)
Prime Contractor Applied Research Associates, Inc.
Sub ContractorsU. Minnesota, U. California, U. Pittsburgh, Mn/DOT
(CS McCrossan, Agg Industries, WSB & Associates)
Key Staff
Darter, Rao, Khazanovich, Von Quintus, Harvey,
Signore, Worel, Clyne, Watson, Palek,
Vandenbossche, Tompkins
Duration 48 Months
Start Date September 2007
R21 Objectives
– Determine the behavior and identify critical
material and performance parameters
– Develop and validate mechanistic-empirical
performance models and design procedures
consistent with the Mechanistic-Empirical
Pavement Design Guide (MEPDG)
– Recommend specifications, construction
techniques and quality management procedures
and guidelines
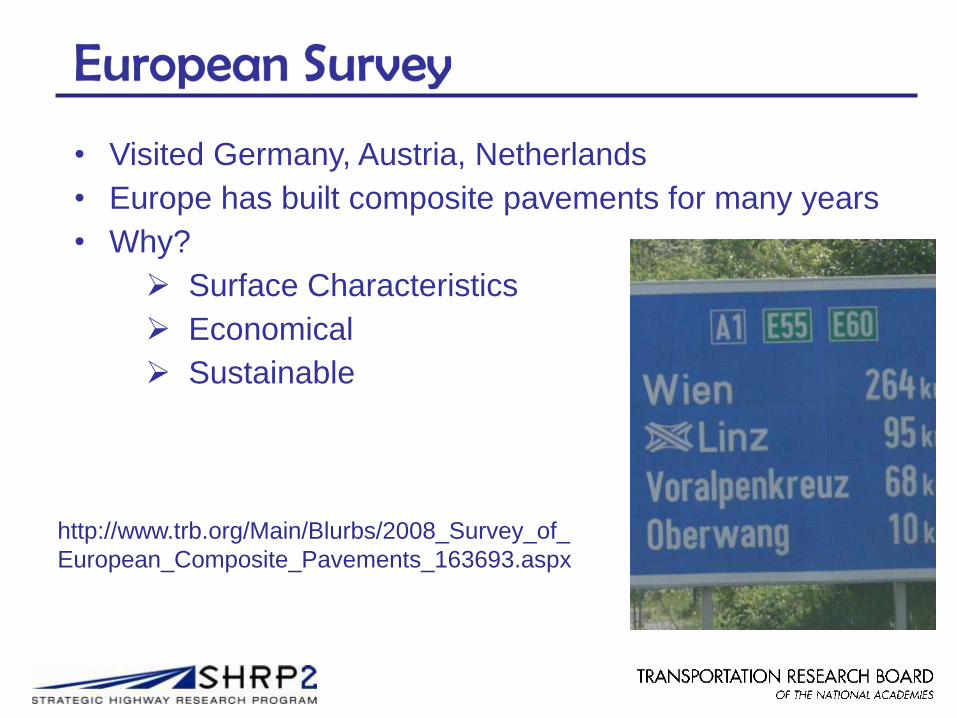
European Survey
• Visited Germany, Austria, Netherlands
• Europe has built composite pavements for many years
• Why?
Surface Characteristics
Economical
Sustainable
http://www.trb.org/Main/Blurbs/2008_Survey_of_
European_Composite_Pavements_163693.aspx

Construction of Composite Test Sections at UCPRC for HVS Testing
– Several Test Sections
– HMA/PCC Only
– Instrumentation
– Rutting & Cracking Behavior

Test Section Construction at MnROAD

Experimental Plan for MnROAD
474 ft
Clay Subgrade
6-in PCC, 15-ft joints
1.25-in dia. dowels driving
lane, nondoweled passing lane.
Recycled PCC
1421 ft
3-in HMA
S & S joints (except for a few)
3-in Granite
475 ft diamond grind; 475 ft exposed aggregate
8-in Class 7 (Recycled) Granular Base
947 ft
6-in PCC, 15-ft joints,
1.25-in dia. dowels.
Recycled PCC
(275 ft)
6-in PCC, 15-ft joints, 1.25-in dia. dowels.
Low-cost (high fly ash content) PCC
(672 ft)

RCA Salvage Operations
RCA Percent Absorption 2.93%
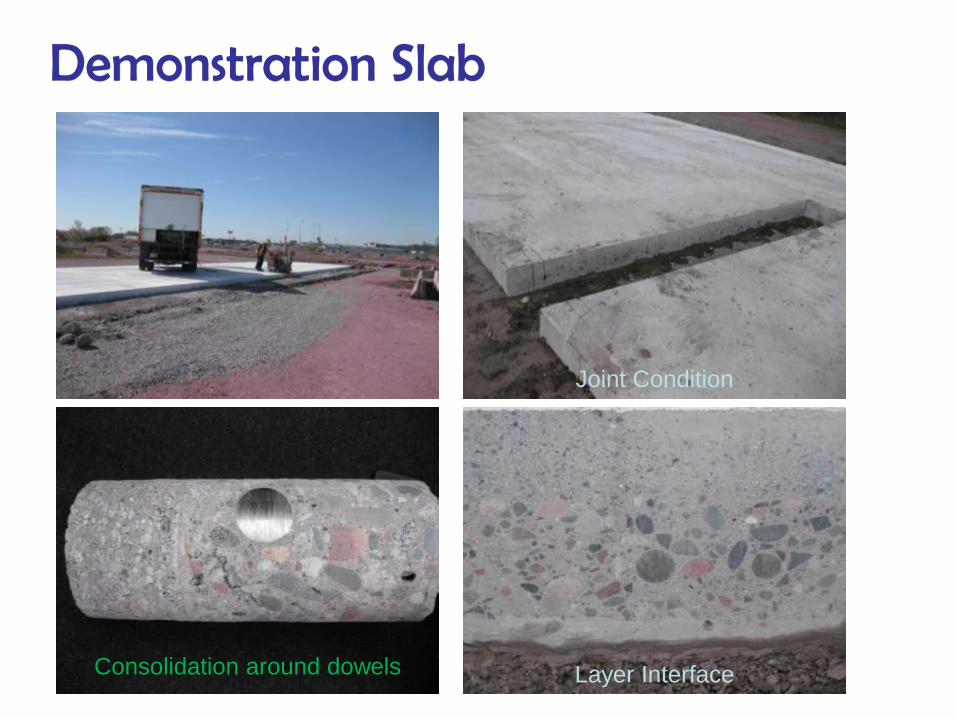
Demonstration Slab
Consolidation around dowels Layer Interface
Joint Condition
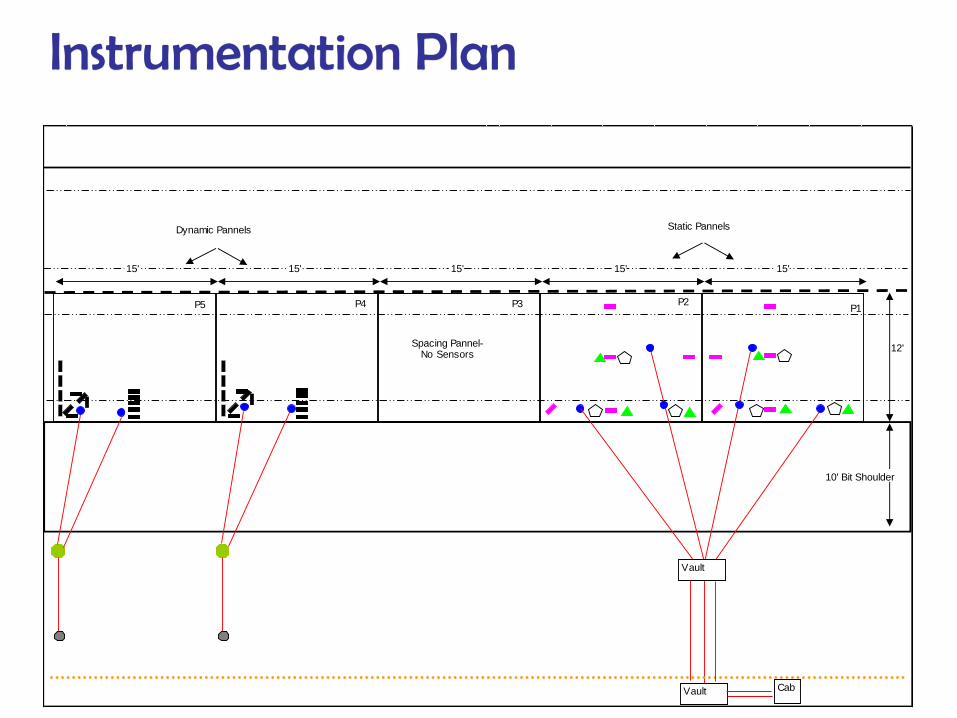
Instrumentation Plan
12'
10' Bit Shoulder
15' 15' 15' 15' 15'
Static PannelsDynamic Pannels
Spacing Pannel-No Sensors
P1P2P3P4P5
Cab
Vault
Vault
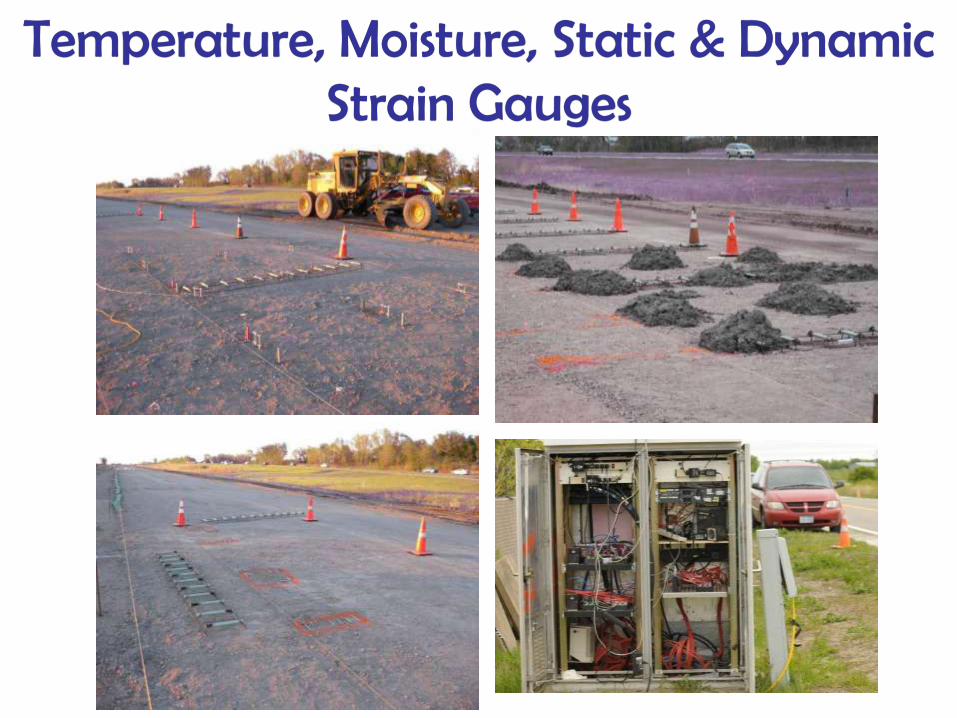
Temperature, Moisture, Static & Dynamic Strain Gauges
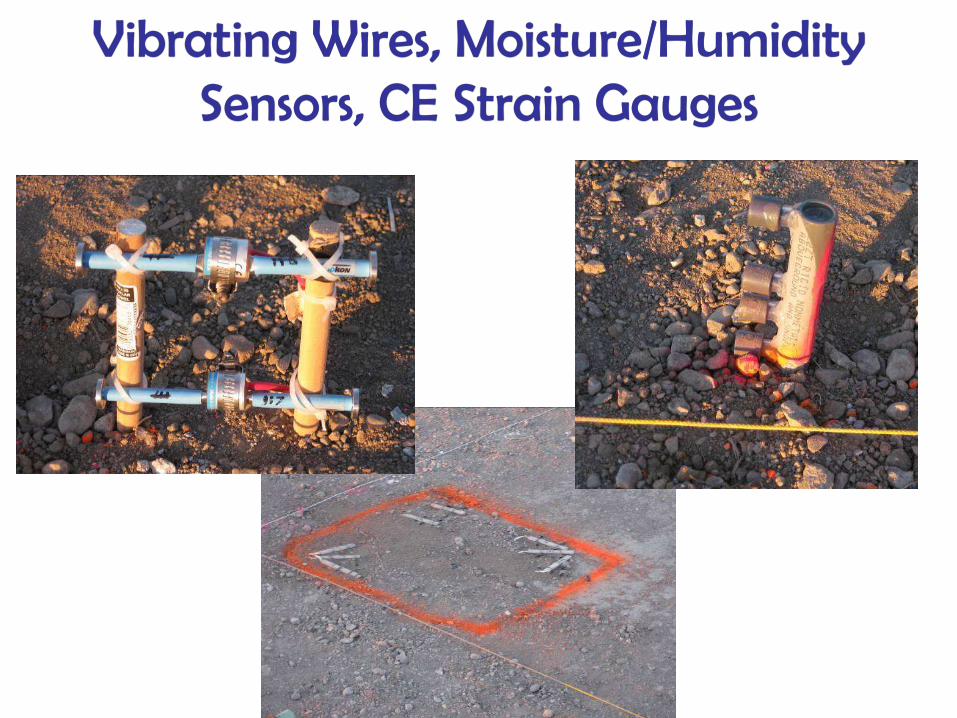
Vibrating Wires, Moisture/Humidity Sensors, CE Strain Gauges
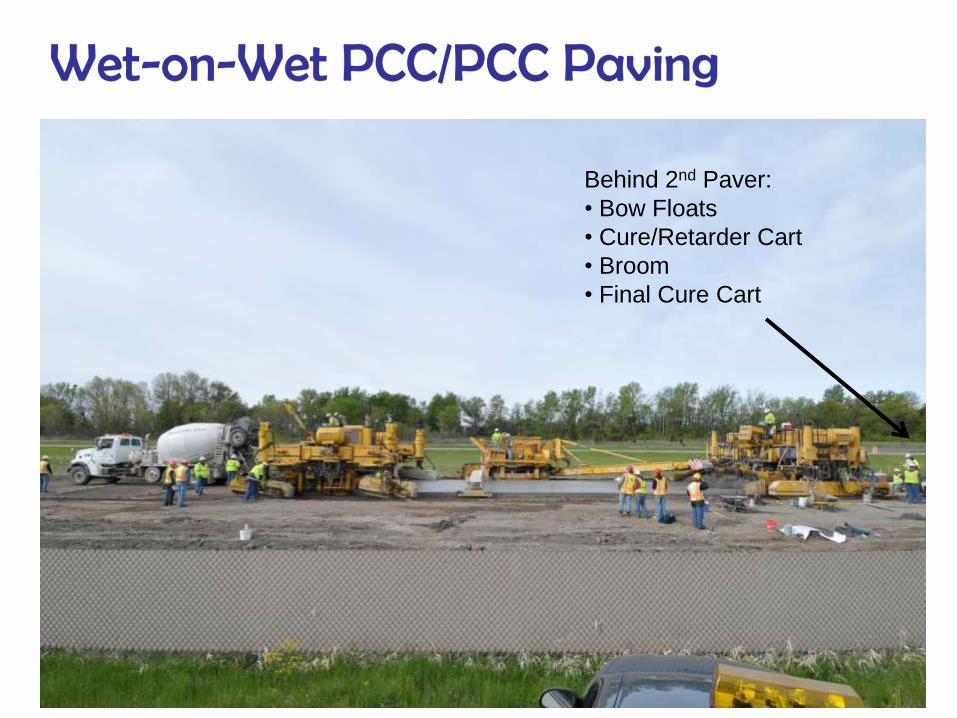
Wet-on-Wet PCC/PCC Paving
Behind 2nd Paver:
• Bow Floats
• Cure/Retarder Cart
• Broom
• Final Cure Cart
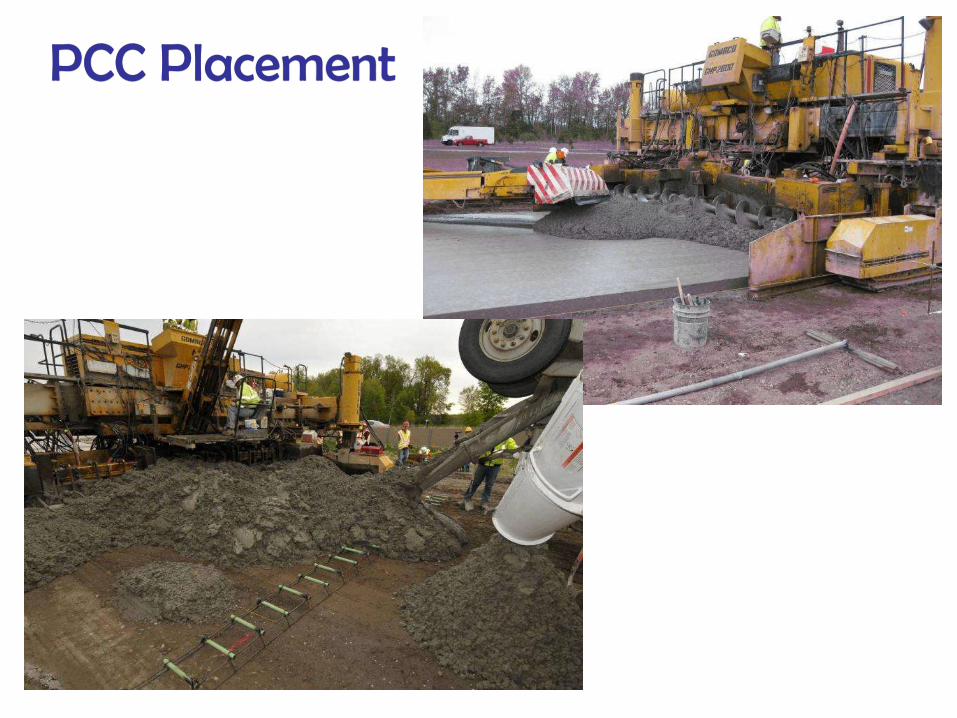
PCC Placement

Exposed Aggregate Concrete Texture

HMA/PCC ConstructionLongitudinal Tine Cure
Tack Coat
HMA Paving & Rolling

Sawing and Sealing
– 100 ft: no seal
– 375 ft: saw & seal
1 ft into shoulder
1 ft away from edge of shoulder
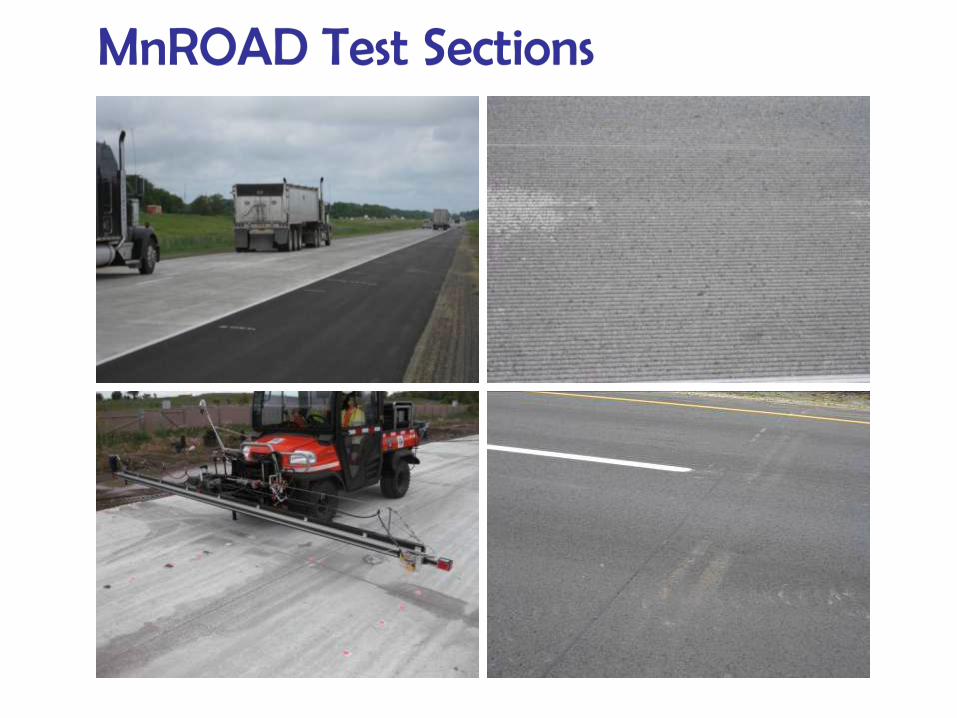
MnROAD Test Sections

Challenges: Mix Consistency
• Short Test Cells
• Stiff Mix
• Sensitive to Adjustments

Challenges: Mix Delivery
• Deliver PCC to top layer
• Keep mixes straight
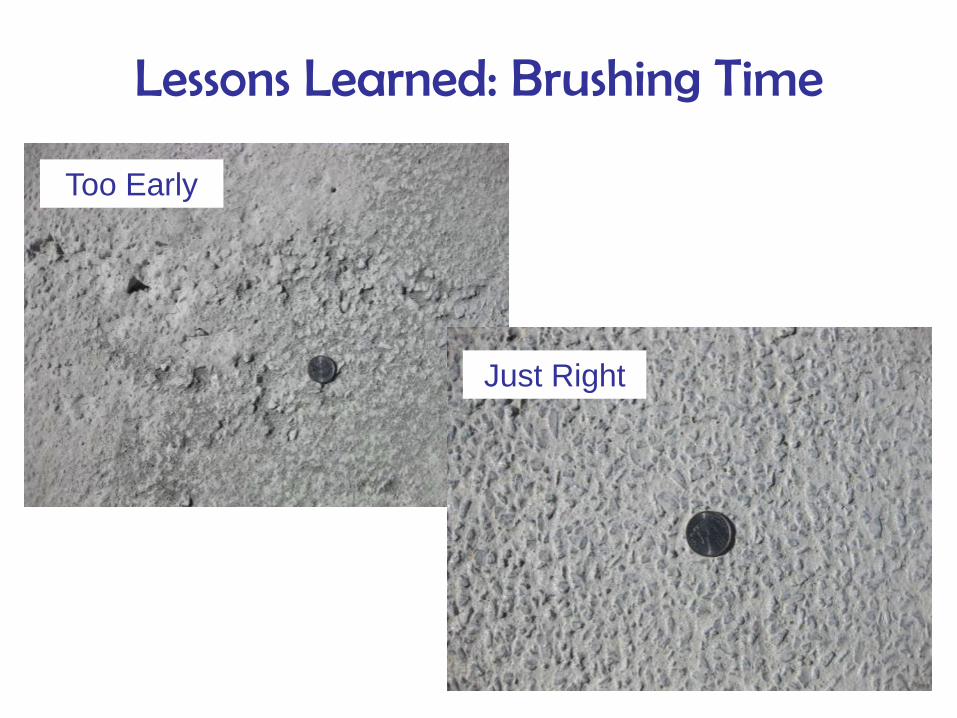
Lessons Learned: Brushing Time
Too Early
Just Right
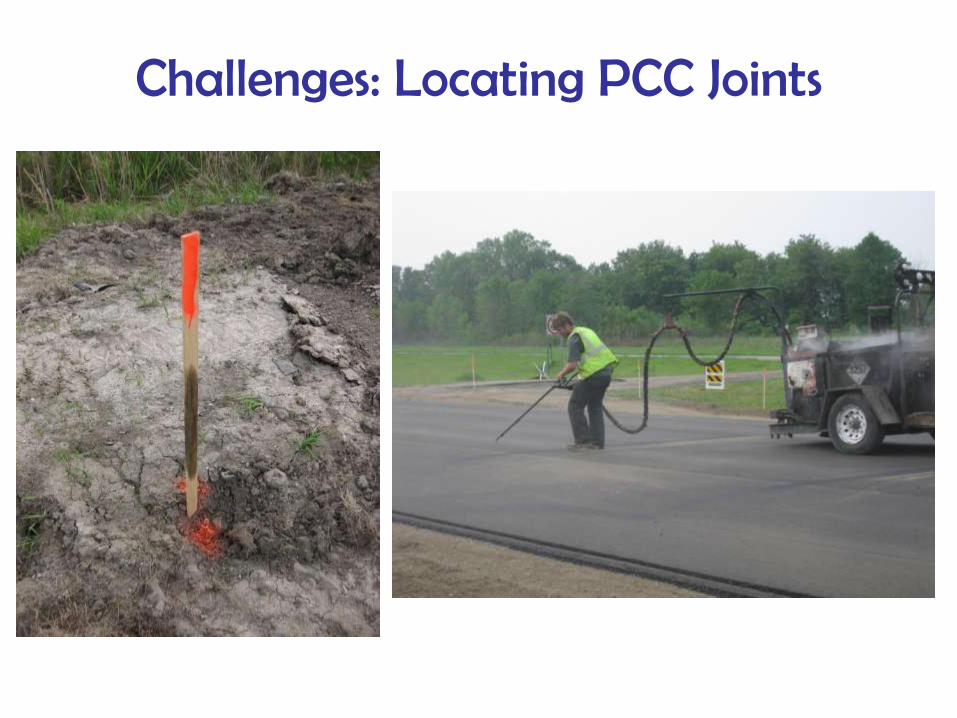
Challenges: Locating PCC Joints

What Worked Well: Demonstration Slab
• Dress Rehearsal
• Value as Research and Preparation
• Sensor Installation Techniques
• Construction Techniques
• Materials Sampling and Testing
• Video, Photographer

What Worked Well: Sensors
• Live as Concrete was Placed
• More than 500 Sensors!
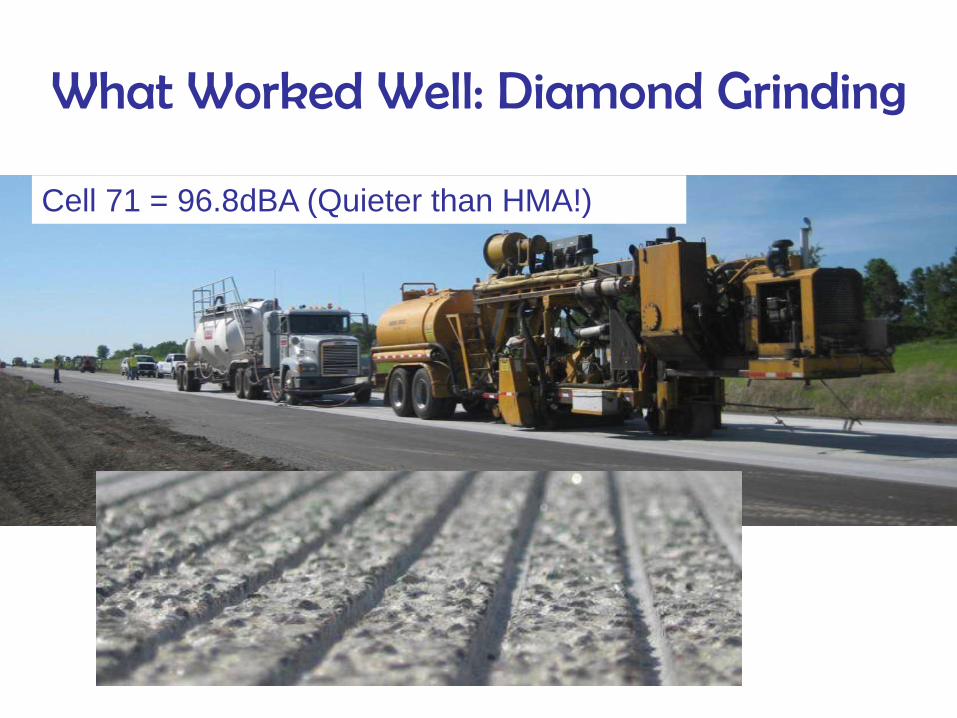
What Worked Well: Diamond Grinding
Cell 71 = 96.8dBA (Quieter than HMA!)

Material Properties, Instrumentation, and Performance

EAC-RCC Material Properties
PCC mixCompressive strength (psi)
Modulus of rupture
(psi)
7 day 14 day 28 day 7 day 28 day
EAC 5044 5315 5601 739 846
RCA 3599 4117 4509 578 658
Low-cost 3773 4364 5003 468 575
• Above are average values for tests conducted on 80+
specimens
• Overall compressive and flexural strengths for all 3
concretes are more than adequate
• Thanks to the FHWA Mobile Concrete Lab
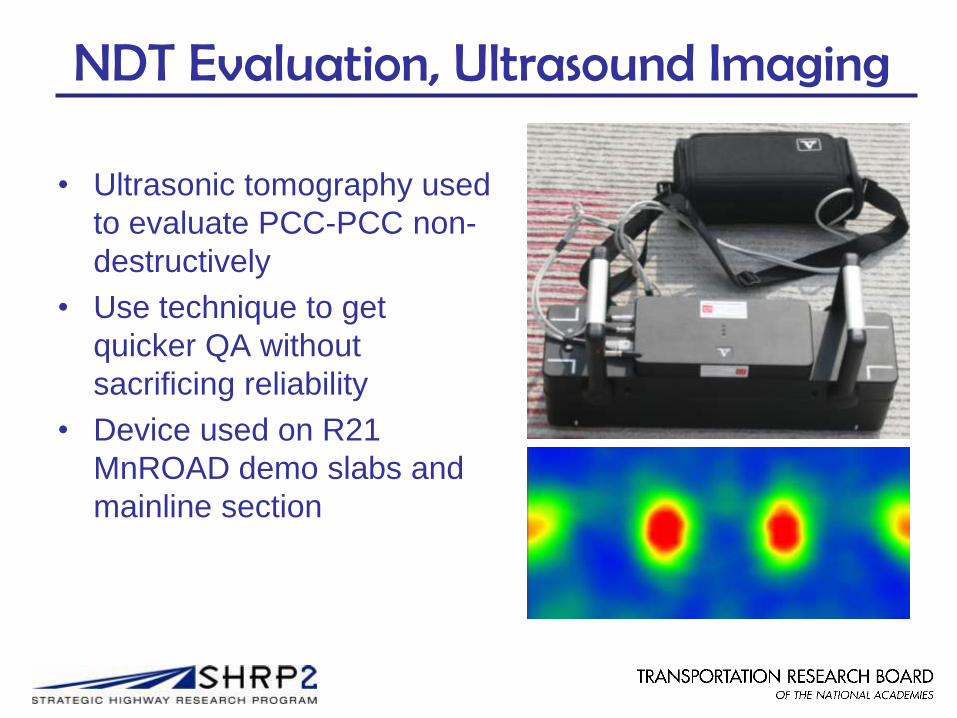
NDT Evaluation, Ultrasound Imaging
• Ultrasonic tomography used
to evaluate PCC-PCC non-
destructively
• Use technique to get
quicker QA without
sacrificing reliability
• Device used on R21
MnROAD demo slabs and
mainline section
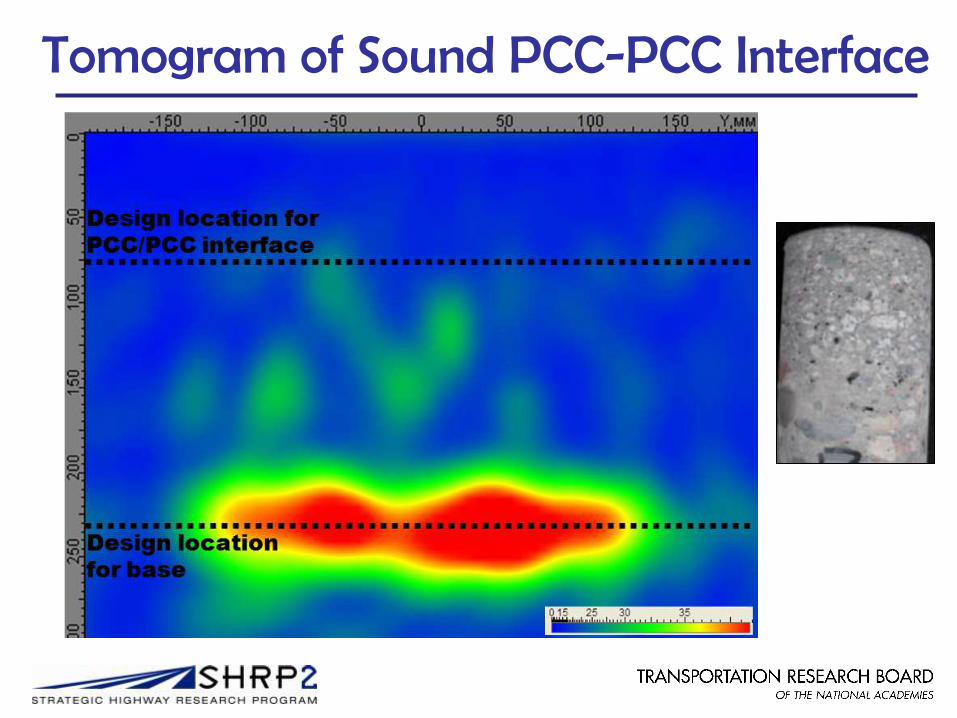
Tomogram of Sound PCC-PCC Interface
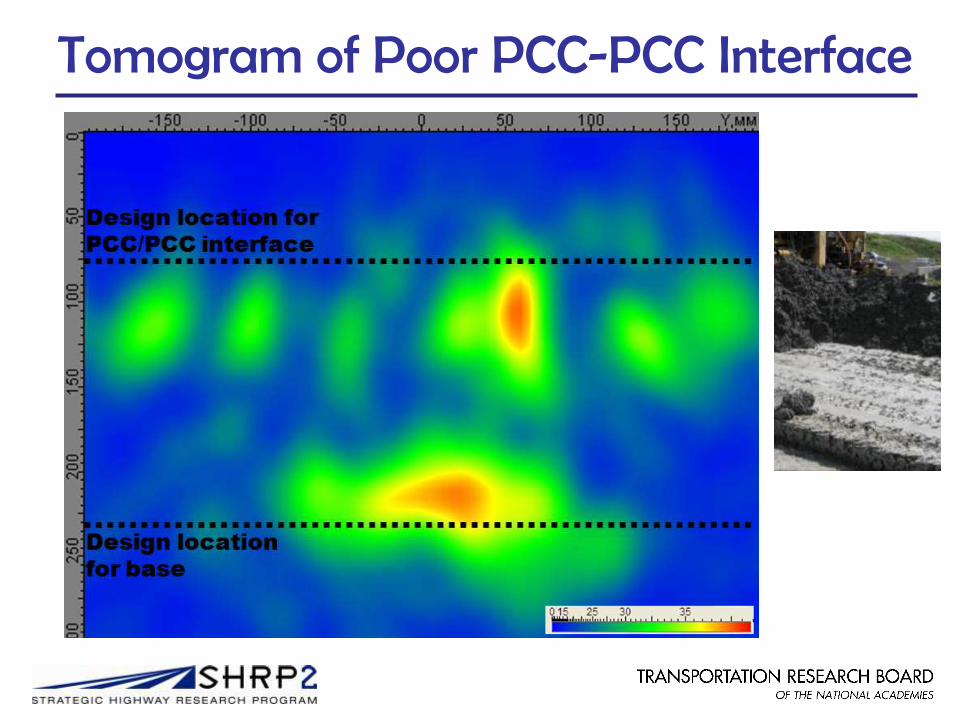
Tomogram of Poor PCC-PCC Interface

Instrumentation
• 6.5% failure rate overall
• Strains, joint opening,
temperature, moisture data
• Will use this response data to
validate MEPDG models

Performance Predictions Using the MEPDG

Performance Measures
• HMA Surface on RCA: Initial & Over Time
– Smoothness, IRI
– Texture Depth
– Noise
– Friction
– Fatigue Cracking (transverse, longitudinal)
– Rutting
– Joint Reflection Cracking (HMA)
• No treatment
• Saw & Sealed joints cut in HMA

Performance Measures
• EAC Surface of RCA & Low Cost Concrete:
Initial & Over Time
– Smoothness, IRI
– Texture Depth
– Noise
– Friction
– Fatigue Cracking (transverse, longitudinal)
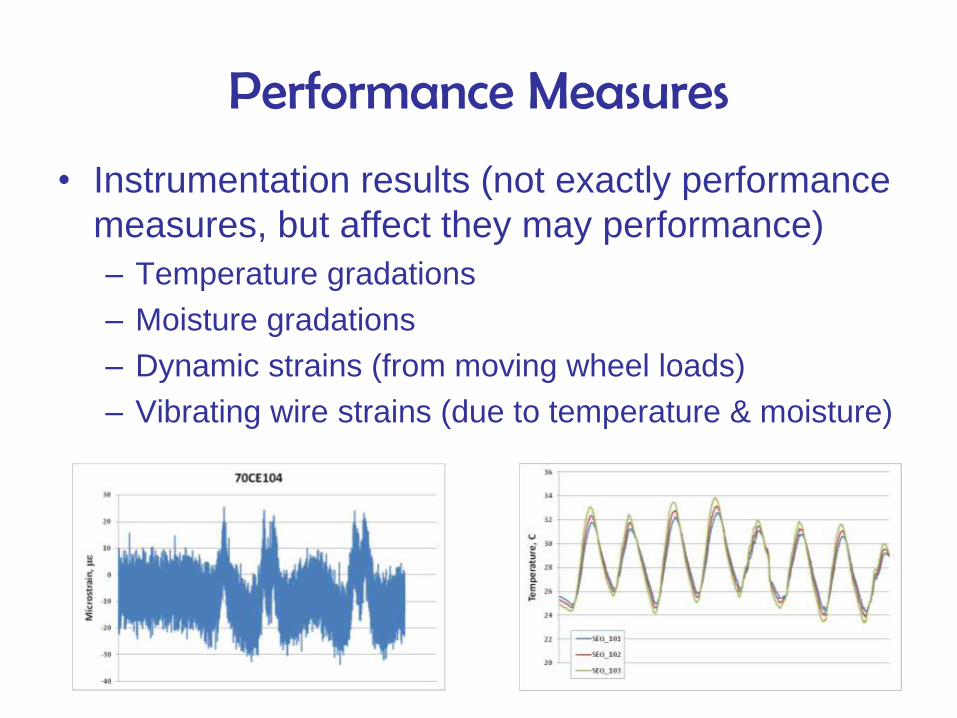
Performance Measures
• Instrumentation results (not exactly performance
measures, but affect they may performance)
– Temperature gradations
– Moisture gradations
– Dynamic strains (from moving wheel loads)
– Vibrating wire strains (due to temperature & moisture)
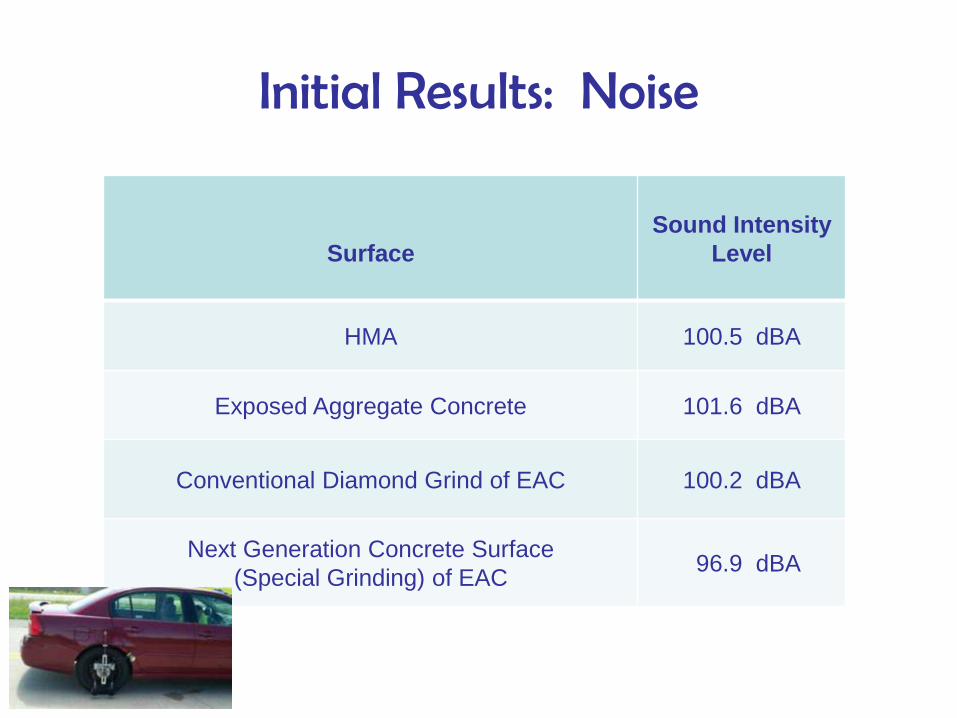
Initial Results: Noise
Surface
Sound Intensity
Level
HMA 100.5 dBA
Exposed Aggregate Concrete 101.6 dBA
Conventional Diamond Grind of EAC 100.2 dBA
Next Generation Concrete Surface
(Special Grinding) of EAC96.9 dBA
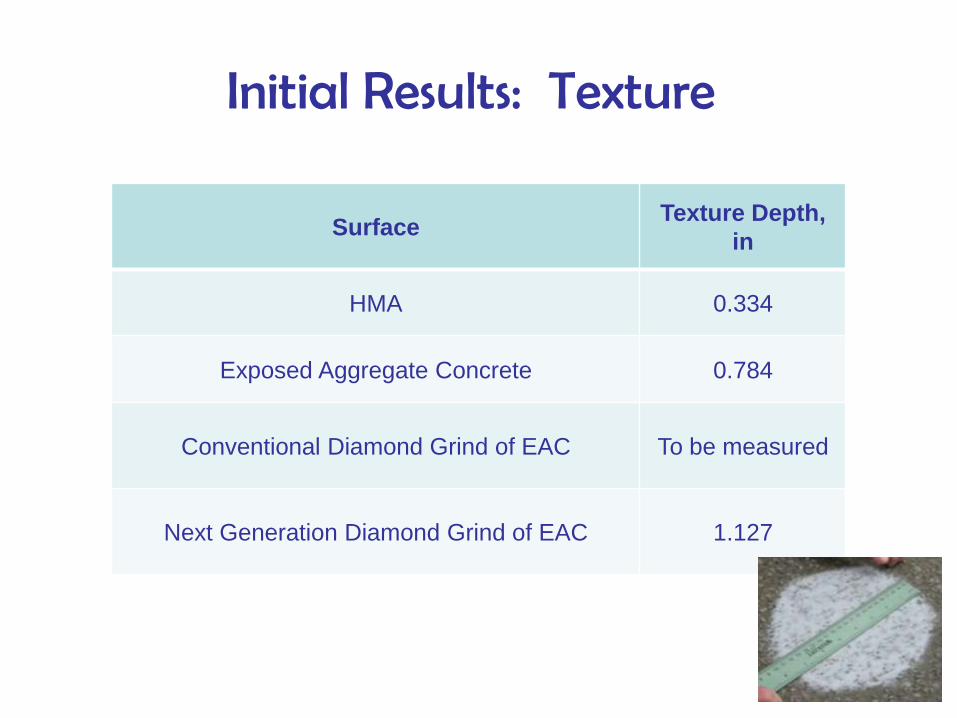
Initial Results: Texture
SurfaceTexture Depth,
in
HMA 0.334
Exposed Aggregate Concrete 0.784
Conventional Diamond Grind of EAC To be measured
Next Generation Diamond Grind of EAC 1.127

Initial Results: Friction
Surface
Dynamic
Friction
Tester
Skid
Trailer
HMA 0.66 53.2
Exposed Aggregate Concrete 0.62 46.5
Conventional Diamond Grind of EAC 0.72 49.2
Next Generation Diamond Grind of
EAC0.55 44.9
Prediction of Future Performance
• AASHTO Mechanistic-Empirical Pavement
Design Guide
– Overlay design procedure for HMA OL of JPCP &
Bonded Concrete OL of JPCP
– Use for new composite pavements?
• Some limitations, but with proper inputs can be used.
– Inputs for new composite pavements for 3 MnRoad
sections
• Thickness designs were intended for practicality
of two layer constructability. They are not
intended for long life.

MEPDG Inputs
• Traffic: I-94 WIM data
• Climate: Nearest weather stations
• HMA: Test data from Mn/DOT
• Concrete: EAC, RCA, LCC test data from
FHWA mobile trailer
• Subgrade: test data from Mn/DOT &
backcalculation of modulus
• Design: joints, dowels, joint spacing, thickness of
layers, shoulders

Layer Thickness(from cores)
Section HMA / RCA EAC / RCA EAC / LCC
Top Layer 3.0 in 3.5 in 2.9 in
Bottom Layer 6.3 in 5.6 in 6.7 in
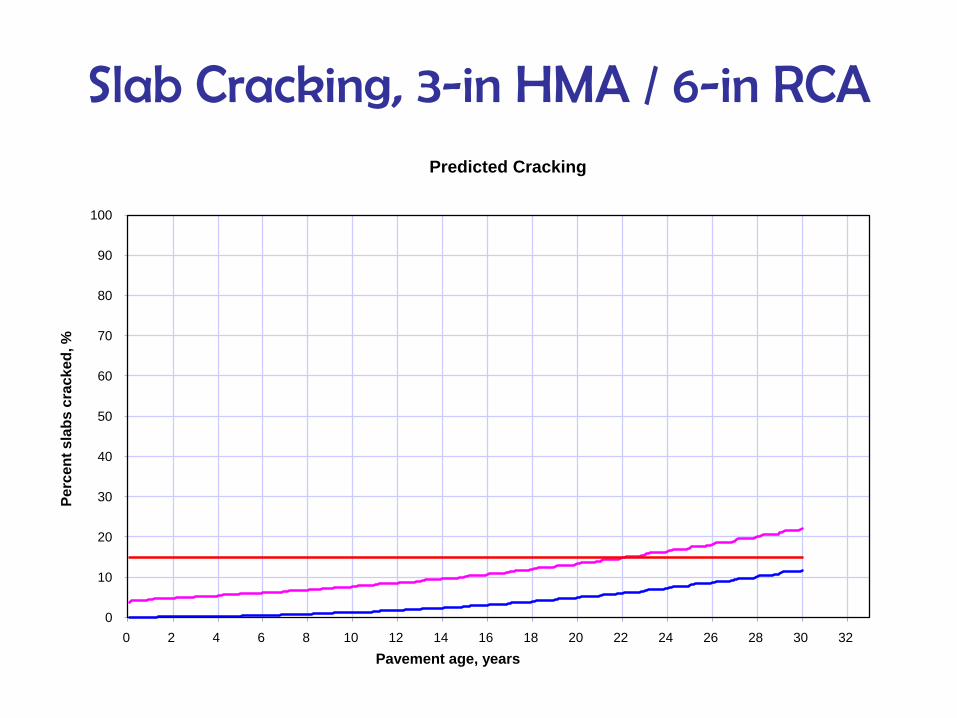
Slab Cracking, 3-in HMA / 6-in RCA
0
10
20
30
40
50
60
70
80
90
100
0 2 4 6 8 10 12 14 16 18 20 22 24 26 28 30 32
Pe
rce
nt
sla
bs
cra
cke
d, %
Pavement age, years
Predicted Cracking

Rutting, 3-in HMA / 6-in RCA
0.00
0.10
0.20
0.30
0.40
0.50
0.60
0 36 72 108 144 180 216 252 288 324 360 396
Ru
ttin
g D
ep
th (
in)
Pavement Age (month)
Permanent Deformation: Rutting
AC Rutting Design Value = 0.5
Total Rutting Design Limit = 0.5

HMA / RCA Composite after 10 years and 6 million trucks
• Transverse Cracking < 5 % slabs
• Rutting < 0.10 in. mean
• IRI < 125 in/mile
• Two layer HMA over RCA composite pavement
should be in good condition
– Major question: will saw and seal of transverse joints
hold up?
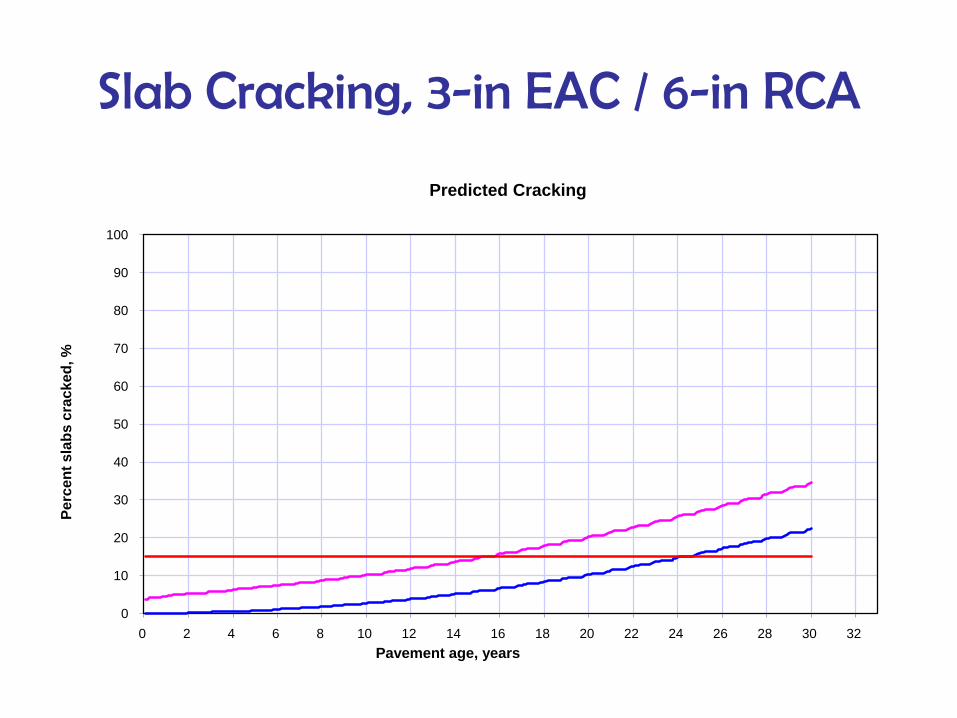
Slab Cracking, 3-in EAC / 6-in RCA
0
10
20
30
40
50
60
70
80
90
100
0 2 4 6 8 10 12 14 16 18 20 22 24 26 28 30 32
Pe
rce
nt
sla
bs
cra
cke
d, %
Pavement age, years
Predicted Cracking

Joint Faulting, 3-in EAC / 6-in RCA
0.00
0.02
0.04
0.06
0.08
0.10
0.12
0.14
0.16
0.18
0.20
0 2 4 6 8 10 12 14 16 18 20 22 24 26 28 30 32
Fau
ltin
g, in
Pavement age, years
Predicted Faulting

IRI, 3-in EAC / 6-in RCA
0
50
100
150
200
250
300
350
400
450
500
0 2 4 6 8 10 12 14 16 18 20 22 24 26 28 30 32
IRI,
in
/mil
e
Pavement age, years
Predicted IRI
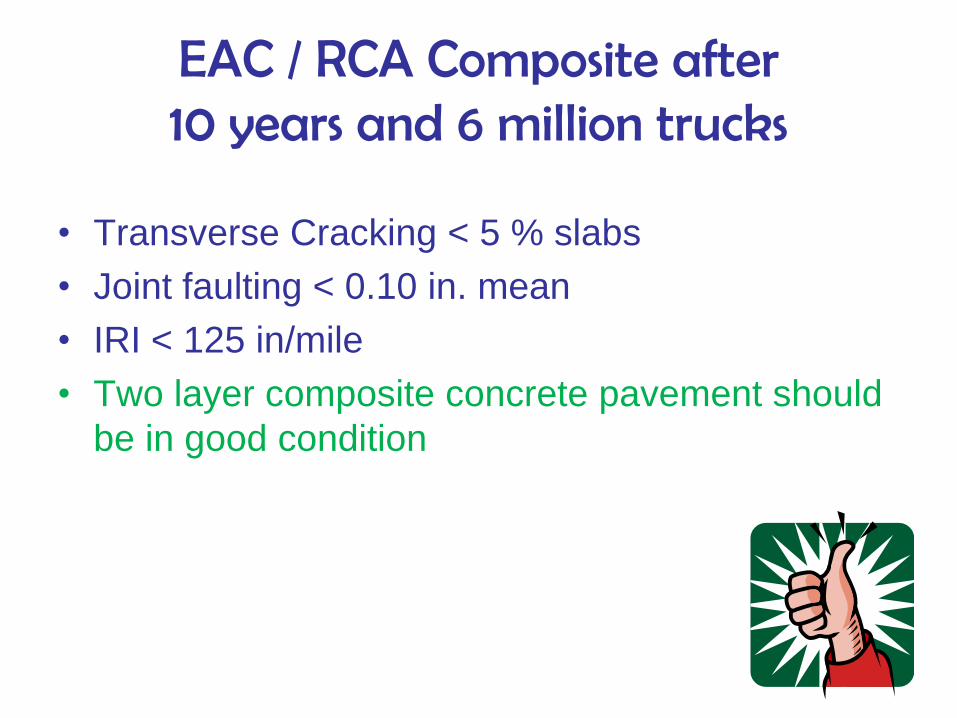
EAC / RCA Composite after 10 years and 6 million trucks
• Transverse Cracking < 5 % slabs
• Joint faulting < 0.10 in. mean
• IRI < 125 in/mile
• Two layer composite concrete pavement should
be in good condition

Cracking, EAC / LCC Predictions
0
10
20
30
40
50
60
70
80
90
100
0 2 4 6 8 10 12 14 16 18 20 22 24 26 28 30 32
Pe
rce
nt
sla
bs
cra
cke
d, %
Pavement age, years

Faulting, EAC / LCC Predictions
0.00
0.02
0.04
0.06
0.08
0.10
0.12
0.14
0.16
0 2 4 6 8 10 12 14 16 18 20 22 24 26 28 30 32
Fau
ltin
g, in
Pavement age, years
Predicted Faulting
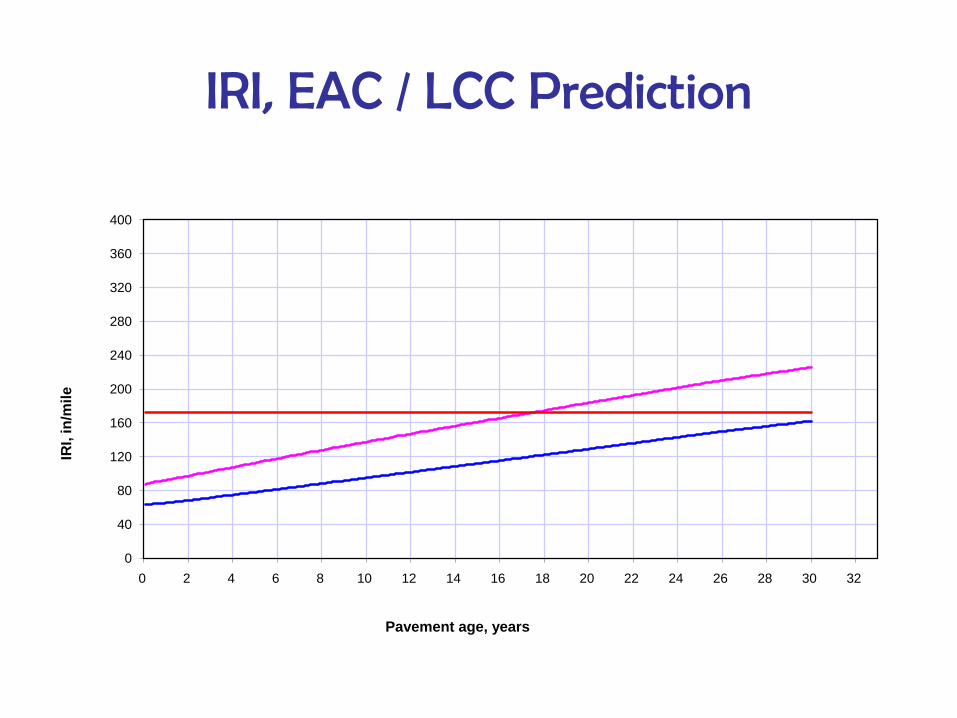
IRI, EAC / LCC Prediction
0
40
80
120
160
200
240
280
320
360
400
0 2 4 6 8 10 12 14 16 18 20 22 24 26 28 30 32
IRI,
in
/mil
e
Pavement age, years

EAC / LCC Composite after 10 years and 6 million trucks
• Transverse Cracking < 5 % slabs
• Joint faulting < 0.10 in. mean
• IRI < 125 in/mile
• Two layer composite concrete pavement with
“cheap” concrete lower layer should be in good
condition
Summary
• Construction quality of each section appears to
be good
• Material properties as expected
• Initial performance measures reasonable
• Future performance predictions show longer
than expected life for HMA/RCA and EAC/RCA
and less for EAC/LCC
• Actual monitoring over time will provide proof of
concept
Conventional vs. Composite Paving
Case StudyBy C.S. McCrossan
Paving Division

Objective
• Find a project located in an area that has
poor availability of Class A aggregates.
– Take paving costs from project bid as
Conventional Paving and compare to
expected costs of Composite Paving.
• Under these circumstances is Composite
Paving an economical alternative?

Case Study
• Project– U.S. Highway 14 Concrete Paving
• Location– Near Waseca, MN
• General Stats– 90,000 Cubic Yards of Concrete
• 80,000 CY Mainline, 310,000 SY
• 10,000 CY Crossroads and Ramps
– 19.5 Miles paving
– 22 total days paving scheduled
– Closest Class A aggregate source was New Ulm Quartzite (2 hour round haul)

Comparison
• Conventional– 1 Boom Truck
– 1 Paver
– 1 Belt Placer
– 1 Cure/Texture
– 1 Skidsteer
– 1 Pickup
– 1 Service Truck
– 1 Water Truck
– 13 Crew Members
• Composite– 1 Boom Truck
– 2 Pavers
– 2 Belt Placers
– 2 Cure/Texture
– 1 Skidsteer
– 1 Pickup
– 1 Service Truck
– 1 Water Truck
– 1 Steel Bristle Broom
– 18 Crew Members
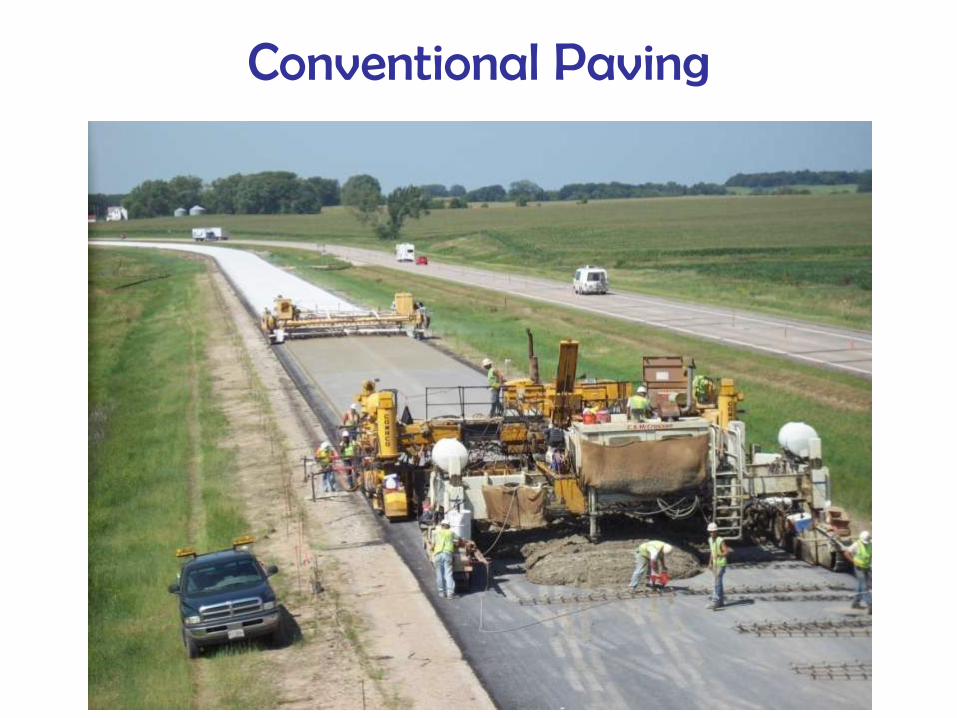
Conventional Paving
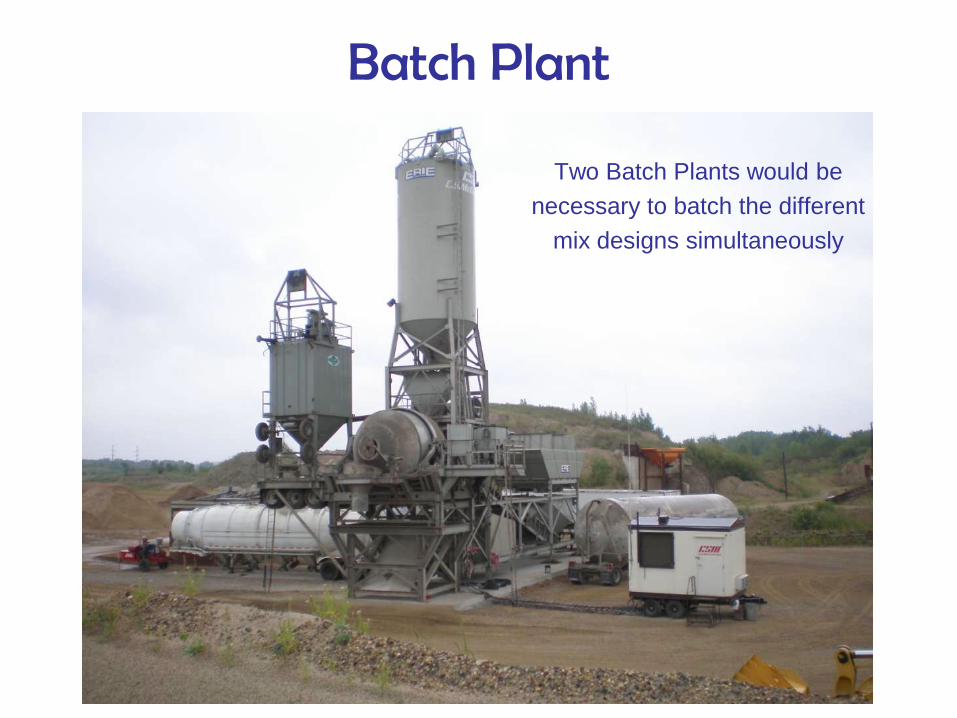
Batch Plant
Two Batch Plants would be
necessary to batch the different
mix designs simultaneously
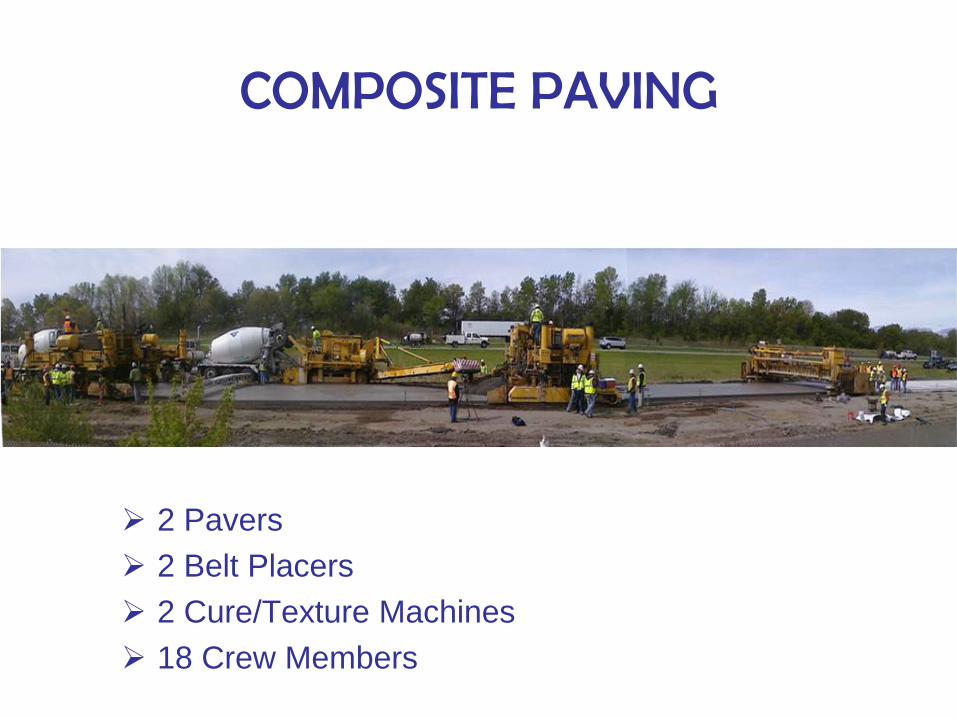
COMPOSITE PAVING
2 Pavers
2 Belt Placers
2 Cure/Texture Machines
18 Crew Members
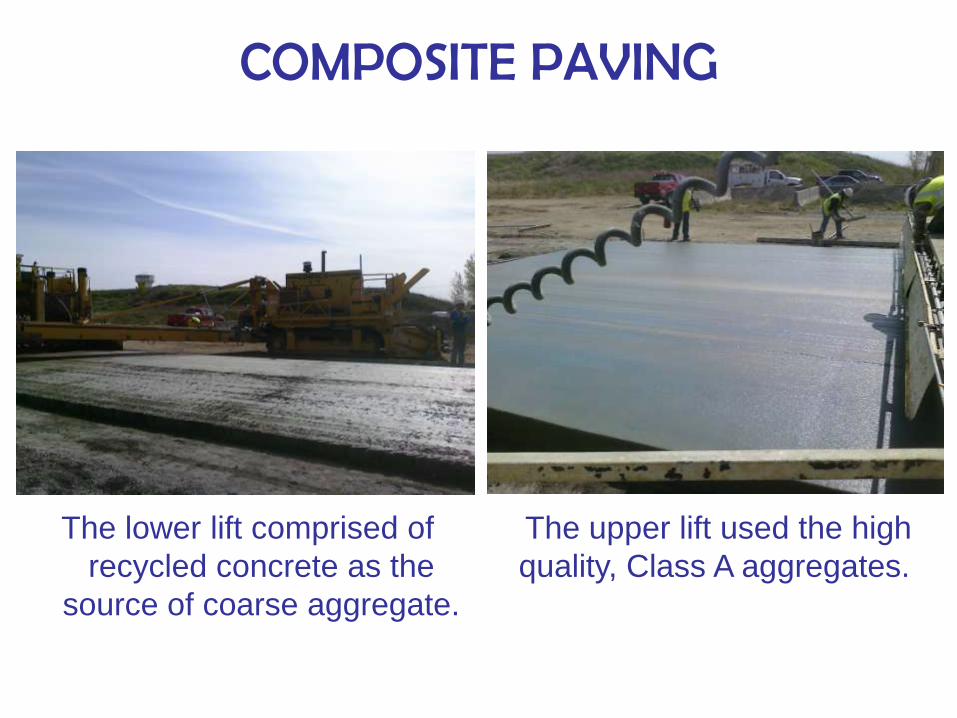
COMPOSITE PAVING
The lower lift comprised of
recycled concrete as the
source of coarse aggregate.
The upper lift used the high
quality, Class A aggregates.

Conventional vs. Composite
Pave, Tie, Green Saw
Sq. Yds. 310,000
$ per Sq. Yd. $2.98
Total Cost $923,800.00
Structural Concrete
Cubic Yards 80,000
$ per CY $71.54
Total Cost $5,723,200.00
Conventional Cost $6,647,000.00
Pave, Tie, Green Saw
Sq. Yds. 310,000
$ per Sq. Yd. $3.70
Total Cost $1,147,000.00
Structural Concrete
Cubic Yards 80,000
$ per CY $69.31
Total Cost $5,544,800.00
Composite Cost $6,691,800.00
0.7% Difference in Construction Costs

Aggregates
Conventional Aggregates
Type Tons
¾” Class A 34,270
1 ½” Class A 37,213
Total Tons 71,483
Class A
Material $/Ton $12.78
Trucking (2 Hour) $7.46
Total $ Per Ton $20.24
Composite Aggregates
Type Tons
¾” Class A 11,310
1 ½” Class A 12,280
Recycled Agg. 47,893
Total Tons 71,483
Recycled
Material $/Ton $7.00
Trucking (2 Hour) $1.45
Total $ Per Ton $8.45

Conclusion
• Implementation of a Composite Paving process
would be a viable and competitive alternative to
Conventional Paving, if:
– Class A aggregates aren’t readily available• Long haul times drive the price of the aggregate too high
– Recycled Concrete could be produced on or near the
site• Haul times would have to be cut to minimal levels
• Would have to produce Recycle at about 50% the cost of Class A
– You were capable of producing and paving at an
equal rate to conventional paving
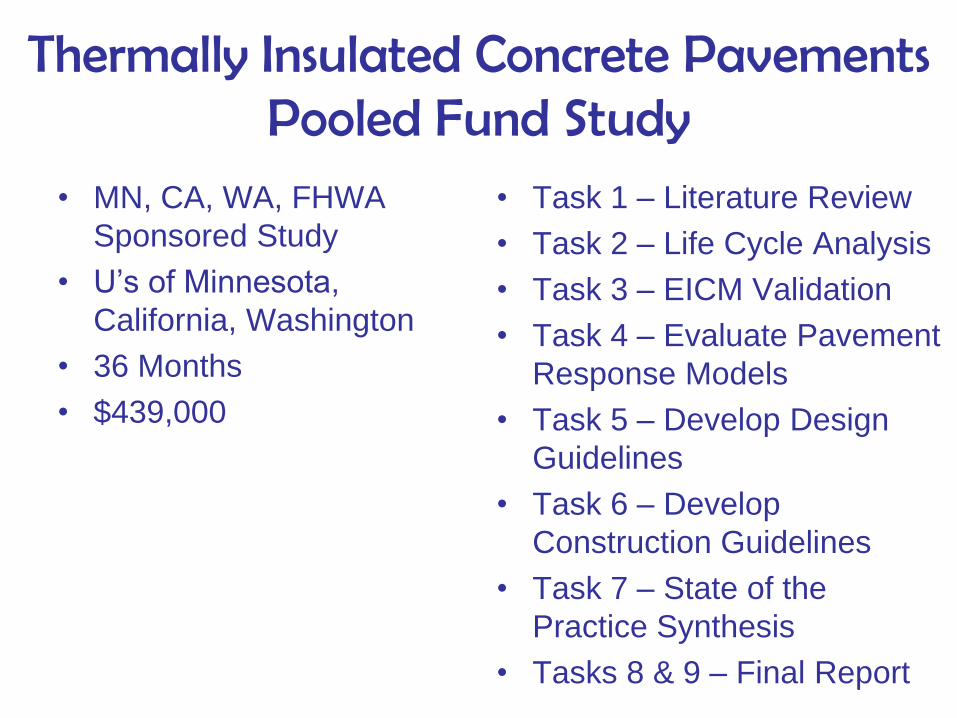
Thermally Insulated Concrete Pavements Pooled Fund Study
• MN, CA, WA, FHWA
Sponsored Study
• U’s of Minnesota,
California, Washington
• 36 Months
• $439,000
• Task 1 – Literature Review
• Task 2 – Life Cycle Analysis
• Task 3 – EICM Validation
• Task 4 – Evaluate Pavement
Response Models
• Task 5 – Develop Design
Guidelines
• Task 6 – Develop
Construction Guidelines
• Task 7 – State of the
Practice Synthesis
• Tasks 8 & 9 – Final Report

Issues with Weather Station Data
Blue < 16% Green 16-25% Yellow 26-40% Red > 40%

Thermocouple Flags

Thermal Gradients

Next Steps Continue Data Collection at MnROAD and
other sites
– Pavement performance monitoring
– Surface characteristics
– Instrumentation
MEPDG and EICM Modeling and Calibration
Write Design Procedures and Construction
Guidelines
Life Cycle Analysis (Costs, Performance)
Training Materials to Aid in Implementation

Thank You!


