Summary • This IVBN paper examines the composition and returns of the real estate portfolios of Dutch institutional real estate investors. • An analysis was made of the portfolios of 32 pension funds and 6 insurers, with real estate investments of minimally €250m each. At the end of 2011, the real estate investments of these investors together were worth €83.3 bn. • Over the period 2000–2012, investors achieved an un- weighted average return on their real estate portfolio of 7.5% and a weighted average return of 9.2%. • There are large differences between investors; returns ranged between 5.1% and 12.3%. • At the end of 2011, portfolios on average consisted of 28% direct real estate investments, 44% participations in non-listed real estate funds, and 28% listed real estate shares. • This concerned 37% real estate in the Netherlands, 23% real estate in other European countries, 26% real estate in North America and 14% real estate in Asia. • By sector, the real estate portfolios consisted of 26% residen- tial real estate, 27% retail, 15% offices, 5% industrial and logistics, and 27% mixed real estate funds and other real estate (e.g., parking facilities, hotels and day care centres). • Returns on indirect real estate investments were significantly higher than returns on direct real estate investments, but the risks were also much higher; European and Asian real estate investments led to higher returns – but were also riskier – than investments in Dutch real estate; investments in retail led to higher returns and also entailed lower risks than investments in other sectors. • Larger institutional investors achieved higher returns than smaller investors, but that difference is directly related to the higher risks taken by larger investors. • Four different kinds of real estate portfolios can be distinguished, each with its own composition and return/risk profile: - Strongly diversified investors; they spread their real estate investments across all investment methods, regions and sectors. These are mainly the larger pension funds. Using this strategy, they achieved the highest average return in the period 2000–2011 (11.5%); - Real estate specialists with a ‘home bias’; they mainly invest in Dutch real estate and prefer the residential sector. Using this strategy, they achieved a weighted average total return of 7.1%; - Diversified fund investors; they divide their real estate invest- ments 50/50 between participations in private funds and real estate shares. Using this strategy, they achieved a weighted average total return of 8.0%; and - Private fund investors; they mainly participate in non-listed real estate funds. Using this strategy, they achieved a weighted average total return of 6.5%. october 2013 Composition and returns of Dutch institutional real estate portfolios Marco Mosselman, MSRE
Transcript
Summary
• This IVBN paper examines the composition and returns of thereal estate portfolios of Dutch institutional real estate investors.
• An analysis was made of the portfolios of 32 pension fundsand 6 insurers, with real estate investments of minimally€250m each. At the end of 2011, the real estate investmentsof these investors together were worth €83.3 bn.
• Over the period 2000–2012, investors achieved an un-weighted average return on their real estate portfolio of 7.5%and a weighted average return of 9.2%.
• There are large differences between investors; returns rangedbetween 5.1% and 12.3%.
• At the end of 2011, portfolios on average consisted of 28%direct real estate investments, 44% participations in non-listedreal estate funds, and 28% listed real estate shares.
• This concerned 37% real estate in the Netherlands, 23% realestate in other European countries, 26% real estate in NorthAmerica and 14% real estate in Asia.
• By sector, the real estate portfolios consisted of 26% residen-tial real estate, 27% retail, 15% offices, 5% industrial and logistics, and 27% mixed real estate funds and other realestate (e.g., parking facilities, hotels and day care centres).
• Returns on indirect real estate investments were significantlyhigher than returns on direct real estate investments, but therisks were also much higher; European and Asian real estateinvestments led to higher returns – but were also riskier – thaninvestments in Dutch real estate; investments in retail led tohigher returns and also entailed lower risks than investments inother sectors.
• Larger institutional investors achieved higher returns thansmaller investors, but that difference is directly related to the higher risks taken by larger investors.
• Four different kinds of real estate portfolios can be distinguished, each with its own composition and return/riskprofile: - Strongly diversified investors; they spread their real estate investments across all investment methods, regions and sectors. These are mainly the larger pension funds. Using thisstrategy, they achieved the highest average return in the period 2000–2011 (11.5%);
- Real estate specialists with a ‘home bias’; they mainly investin Dutch real estate and prefer the residential sector. Usingthis strategy, they achieved a weighted average total returnof 7.1%;
- Diversified fund investors; they divide their real estate invest-ments 50/50 between participations in private funds and realestate shares. Using this strategy, they achieved a weightedaverage total return of 8.0%; and
- Private fund investors; they mainly participate in non-listedreal estate funds. Using this strategy, they achieved aweighted average total return of 6.5%.
october 2013
Composition and returns of Dutch institutional
real estate portfolios
Marco Mosselman, MSRE
1. Introduction
Since the 1960s, Dutch pension funds and insurers have included real estate in their investment portfolios. On 31 December 2011, the total real estate investments of these institutional investors together amounted to € 92.8 billion, or7.5% of total invested capital. The risks run and the returnsachieved with this public capital are regular topics of public debate. At the same time, little is known from public sourcesabout the composition and returns of these real estate portfolios.
With this paper, IVBN aims to provide new insights into thecomposition, risks and returns of institutional real estate portfolios. The underlying research differs from other studies bybeing based not on index data, but on data from the investmentportfolios themselves. Of course, this may give rise to the criticism that this paper compares apples and oranges. However,we are convinced that the rich data set on which this paper isbased is a correct reflection of the investors’ portfolios and thechoices they make every day.
This paper is a shortened version of Marco Mosselman’s MSREthesis. He carried out research for IVBN into the real estate portfolios of institutional investors. The full version of the thesis(in Dutch) can be downloaded from the IVBN website(www.ivbn.nl).
This paper is structured as follows: Section 2 discusses the realestate portfolios of institutional investors; in section 3, we propose a typology of real estate investment strategies; and insection 4, we sum up the main conclusions.
2. Composition, returns and risks of institutional real estate portfolios
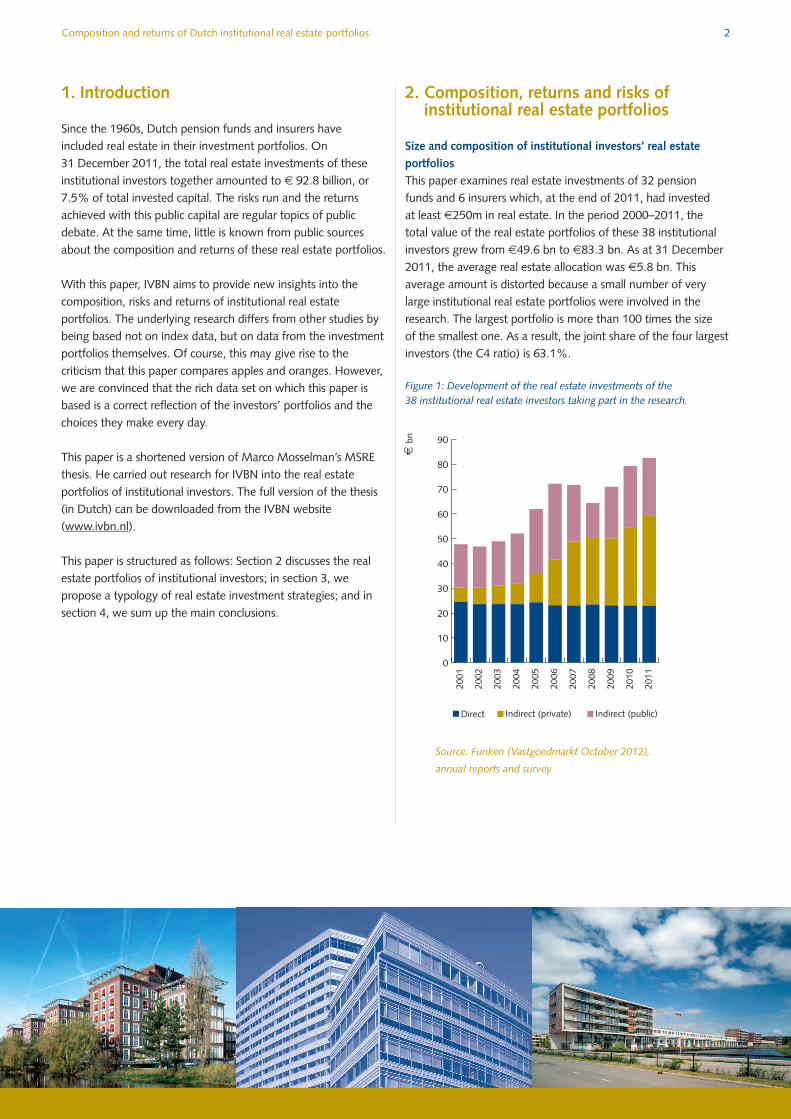
Size and composition of institutional investors’ real estate portfolios This paper examines real estate investments of 32 pension funds and 6 insurers which, at the end of 2011, had invested at least €250m in real estate. In the period 2000–2011, the total value of the real estate portfolios of these 38 institutionalinvestors grew from €49.6 bn to €83.3 bn. As at 31 December2011, the average real estate allocation was €5.8 bn. This average amount is distorted because a small number of verylarge institutional real estate portfolios were involved in the research. The largest portfolio is more than 100 times the size of the smallest one. As a result, the joint share of the four largestinvestors (the C4 ratio) is 63.1%.
Figure 1: Development of the real estate investments of the 38 institutional real estate investors taking part in the research.
Composition and returns of Dutch institutional real estate portfolios 2
0
10
20
30
40
50
60
70
80
90
Source: Funken (Vastgoedmarkt October 2012),
annual reports and survey.
Direct Indirect (private) Indirect (public)
2001
2002
2003
2004
2005
2006
2007
2008
2009
2010
2011
€ bn
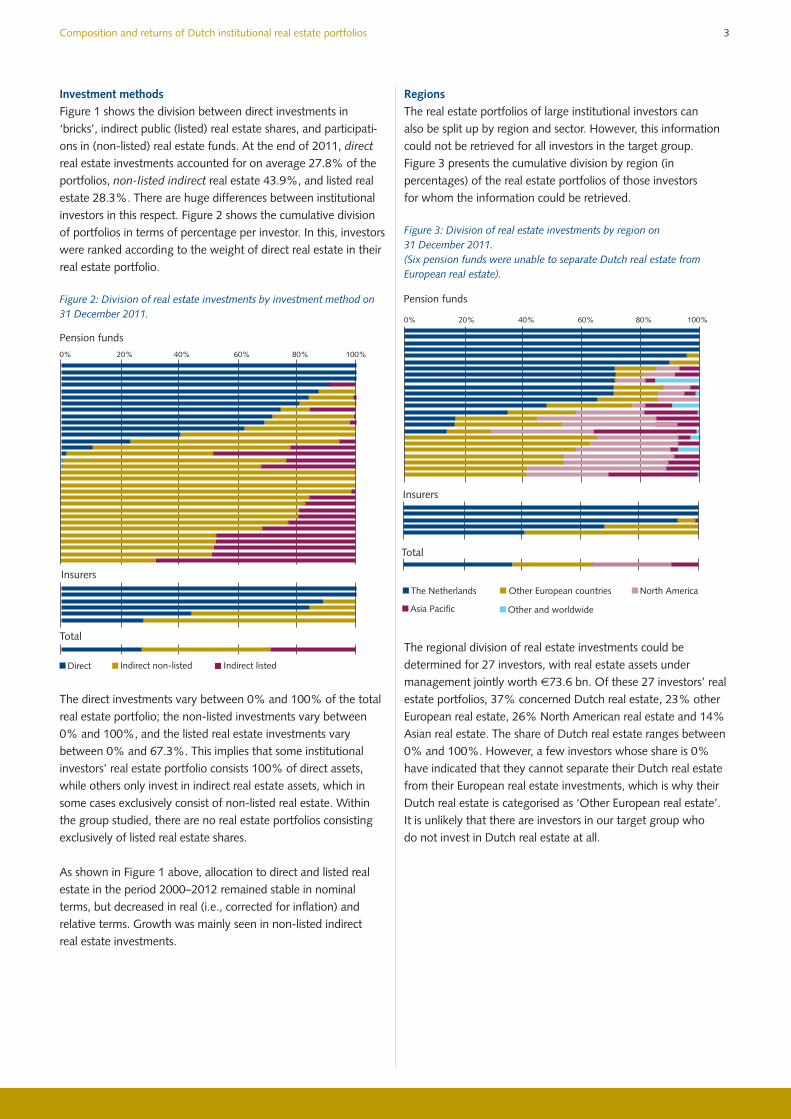
Investment methodsFigure 1 shows the division between direct investments in‘bricks’, indirect public (listed) real estate shares, and participati-ons in (non-listed) real estate funds. At the end of 2011, directreal estate investments accounted for on average 27.8% of theportfolios, non-listed indirect real estate 43.9%, and listed realestate 28.3%. There are huge differences between institutionalinvestors in this respect. Figure 2 shows the cumulative divisionof portfolios in terms of percentage per investor. In this, investorswere ranked according to the weight of direct real estate in theirreal estate portfolio.
Figure 2: Division of real estate investments by investment method on31 December 2011.
The direct investments vary between 0% and 100% of the totalreal estate portfolio; the non-listed investments vary between0% and 100%, and the listed real estate investments vary between 0% and 67.3%. This implies that some institutional investors’ real estate portfolio consists 100% of direct assets,while others only invest in indirect real estate assets, which insome cases exclusively consist of non-listed real estate. Withinthe group studied, there are no real estate portfolios consistingexclusively of listed real estate shares.
As shown in Figure 1 above, allocation to direct and listed realestate in the period 2000–2012 remained stable in nominalterms, but decreased in real (i.e., corrected for inflation) and relative terms. Growth was mainly seen in non-listed indirect real estate investments.
RegionsThe real estate portfolios of large institutional investors canalso be split up by region and sector. However, this informationcould not be retrieved for all investors in the target group. Figure 3 presents the cumulative division by region (in percentages) of the real estate portfolios of those investors for whom the information could be retrieved.
Figure 3: Division of real estate investments by region on 31 December 2011.(Six pension funds were unable to separate Dutch real estate from European real estate).
The regional division of real estate investments could be determined for 27 investors, with real estate assets under management jointly worth €73.6 bn. Of these 27 investors’ realestate portfolios, 37% concerned Dutch real estate, 23% otherEuropean real estate, 26% North American real estate and 14%Asian real estate. The share of Dutch real estate ranges between0% and 100%. However, a few investors whose share is 0%have indicated that they cannot separate their Dutch real estatefrom their European real estate investments, which is why theirDutch real estate is categorised as ‘Other European real estate’.It is unlikely that there are investors in our target group who do not invest in Dutch real estate at all.
Composition and returns of Dutch institutional real estate portfolios 3
Direct Indirect non-listed Indirect listed
0% 20% 40% 60% 80% 100%
Pension funds
Total
InsurersThe Netherlands
Other and worldwide
Other European countries North America
Asia Pacific
0% 20% 40% 60% 80% 100%
Total
Insurers
Pension funds
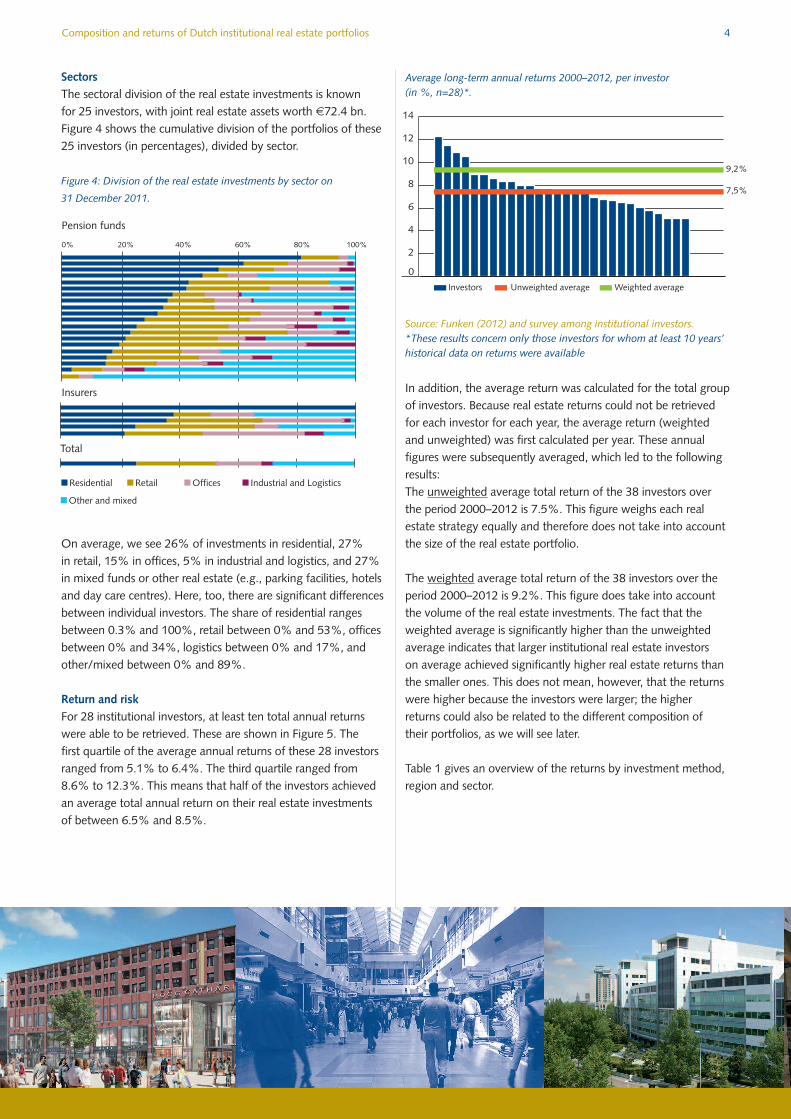
SectorsThe sectoral division of the real estate investments is known for 25 investors, with joint real estate assets worth €72.4 bn. Figure 4 shows the cumulative division of the portfolios of these25 investors (in percentages), divided by sector.
Figure 4: Division of the real estate investments by sector on
31 December 2011.
On average, we see 26% of investments in residential, 27% in retail, 15% in offices, 5% in industrial and logistics, and 27%in mixed funds or other real estate (e.g., parking facilities, hotelsand day care centres). Here, too, there are significant differencesbetween individual investors. The share of residential ranges between 0.3% and 100%, retail between 0% and 53%, officesbetween 0% and 34%, logistics between 0% and 17%, andother/mixed between 0% and 89%.
Return and riskFor 28 institutional investors, at least ten total annual returnswere able to be retrieved. These are shown in Figure 5. The first quartile of the average annual returns of these 28 investorsranged from 5.1% to 6.4%. The third quartile ranged from8.6% to 12.3%. This means that half of the investors achievedan average total annual return on their real estate investments of between 6.5% and 8.5%.
Average long-term annual returns 2000–2012, per investor (in %, n=28)*.
Source: Funken (2012) and survey among institutional investors.*These results concern only those investors for whom at least 10 years’historical data on returns were available
In addition, the average return was calculated for the total groupof investors. Because real estate returns could not be retrievedfor each investor for each year, the average return (weightedand unweighted) was first calculated per year. These annual figures were subsequently averaged, which led to the followingresults:The unweighted average total return of the 38 investors overthe period 2000–2012 is 7.5%. This figure weighs each realestate strategy equally and therefore does not take into accountthe size of the real estate portfolio.
The weighted average total return of the 38 investors over theperiod 2000–2012 is 9.2%. This figure does take into accountthe volume of the real estate investments. The fact that theweighted average is significantly higher than the unweightedaverage indicates that larger institutional real estate investors on average achieved significantly higher real estate returns thanthe smaller ones. This does not mean, however, that the returnswere higher because the investors were larger; the higher returns could also be related to the different composition of their portfolios, as we will see later.
Table 1 gives an overview of the returns by investment method,region and sector.
Composition and returns of Dutch institutional real estate portfolios 4
0% 20% 40% 60% 80% 100%
Pension funds
Total
Insurers
Residential Retail Offices
Other and mixed
Industrial and Logistics
0
2
4
6
8
10
12
14
Investors Unweighted average Weighted average
9,2%
7,5%
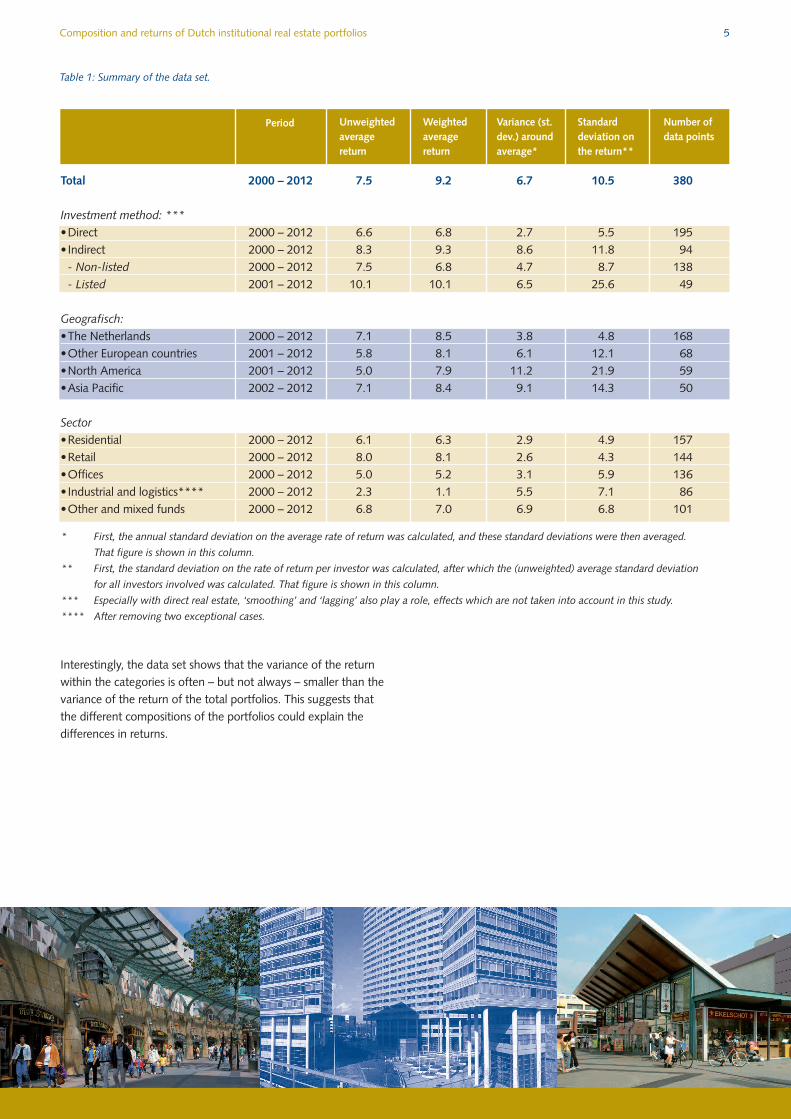
Table 1: Summary of the data set.
Composition and returns of Dutch institutional real estate portfolios 5
* First, the annual standard deviation on the average rate of return was calculated, and these standard deviations were then averaged.
That figure is shown in this column.
** First, the standard deviation on the rate of return per investor was calculated, after which the (unweighted) average standard deviation
for all investors involved was calculated. That figure is shown in this column.
*** Especially with direct real estate, ‘smoothing’ and ‘lagging’ also play a role, effects which are not taken into account in this study.
**** After removing two exceptional cases.
Interestingly, the data set shows that the variance of the returnwithin the categories is often – but not always – smaller than thevariance of the return of the total portfolios. This suggests thatthe different compositions of the portfolios could explain the differences in returns.
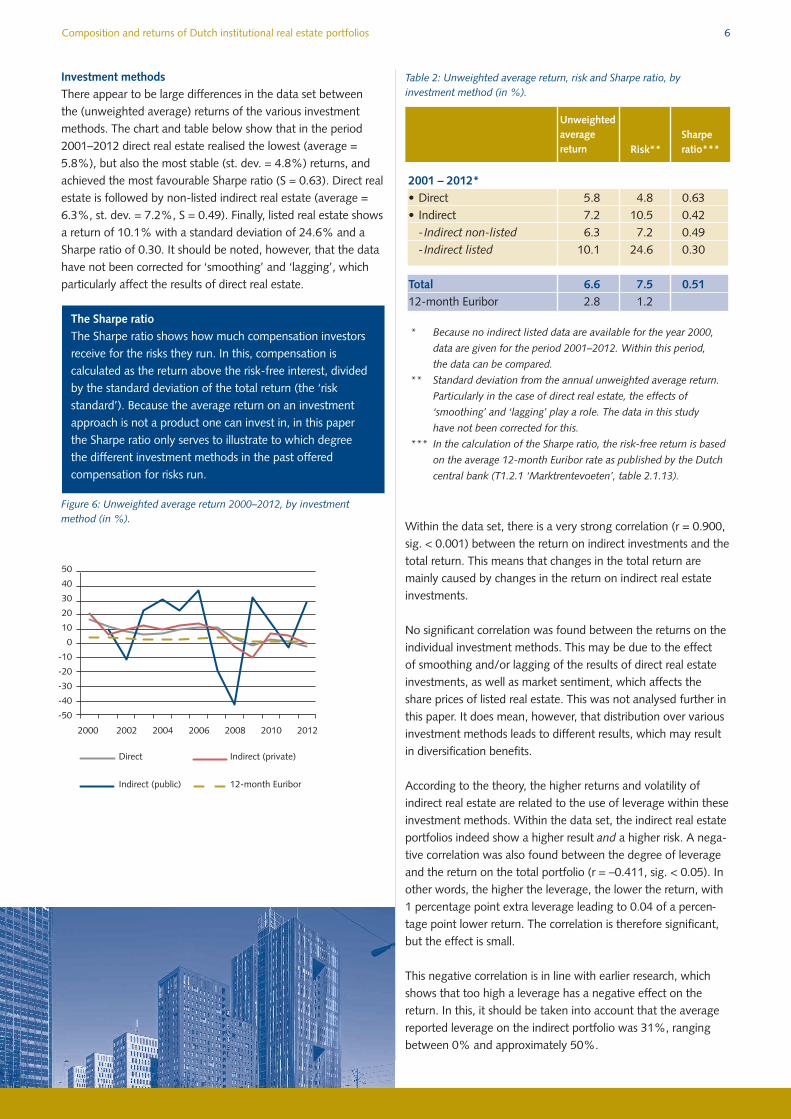
Investment methodsThere appear to be large differences in the data set between the (unweighted average) returns of the various investment methods. The chart and table below show that in the period2001–2012 direct real estate realised the lowest (average =5.8%), but also the most stable (st. dev. = 4.8%) returns, andachieved the most favourable Sharpe ratio (S = 0.63). Direct realestate is followed by non-listed indirect real estate (average =6.3%, st. dev. = 7.2%, S = 0.49). Finally, listed real estate showsa return of 10.1% with a standard deviation of 24.6% and aSharpe ratio of 0.30. It should be noted, however, that the datahave not been corrected for ‘smoothing’ and ‘lagging’, whichparticularly affect the results of direct real estate.
Figure 6: Unweighted average return 2000–2012, by investment method (in %).
Tabel 2: Ongewogen gemiddeld rendement, risico en Sharpe-ratio, naar
beleggingswijze (in %).
Table 2: Unweighted average return, risk and Sharpe ratio, by investment method (in %).
Within the data set, there is a very strong correlation (r = 0.900,sig. < 0.001) between the return on indirect investments and thetotal return. This means that changes in the total return aremainly caused by changes in the return on indirect real estate investments.
No significant correlation was found between the returns on theindividual investment methods. This may be due to the effect of smoothing and/or lagging of the results of direct real estateinvestments, as well as market sentiment, which affects theshare prices of listed real estate. This was not analysed further inthis paper. It does mean, however, that distribution over variousinvestment methods leads to different results, which may resultin diversification benefits.
According to the theory, the higher returns and volatility of indirect real estate are related to the use of leverage within theseinvestment methods. Within the data set, the indirect real estateportfolios indeed show a higher result and a higher risk. A nega-tive correlation was also found between the degree of leverageand the return on the total portfolio (r = –0.411, sig. < 0.05). Inother words, the higher the leverage, the lower the return, with1 percentage point extra leverage leading to 0.04 of a percen-tage point lower return. The correlation is therefore significant,but the effect is small.
This negative correlation is in line with earlier research, whichshows that too high a leverage has a negative effect on the return. In this, it should be taken into account that the averagereported leverage on the indirect portfolio was 31%, rangingbetween 0% and approximately 50%.
Composition and returns of Dutch institutional real estate portfolios 6
The Sharpe ratioThe Sharpe ratio shows how much compensation investorsreceive for the risks they run. In this, compensation is calculated as the return above the risk-free interest, dividedby the standard deviation of the total return (the ‘risk standard’). Because the average return on an investment approach is not a product one can invest in, in this paper the Sharpe ratio only serves to illustrate to which degree the different investment methods in the past offered compensation for risks run.
* Because no indirect listed data are available for the year 2000,
data are given for the period 2001–2012. Within this period,
the data can be compared.
** Standard deviation from the annual unweighted average return.
Particularly in the case of direct real estate, the effects of
‘smoothing’ and ‘lagging’ play a role. The data in this study
have not been corrected for this.
*** In the calculation of the Sharpe ratio, the risk-free return is based
on the average 12-month Euribor rate as published by the Dutch
central bank (T1.2.1 ‘Marktrentevoeten’, table 2.1.13).
50
40
30
20
10
0
-10
-20
-30
-40
-50
2000 2002 2004 2006 2008 2010 2012
Direct Indirect (private)
Indirect (public) 12-month Euribor
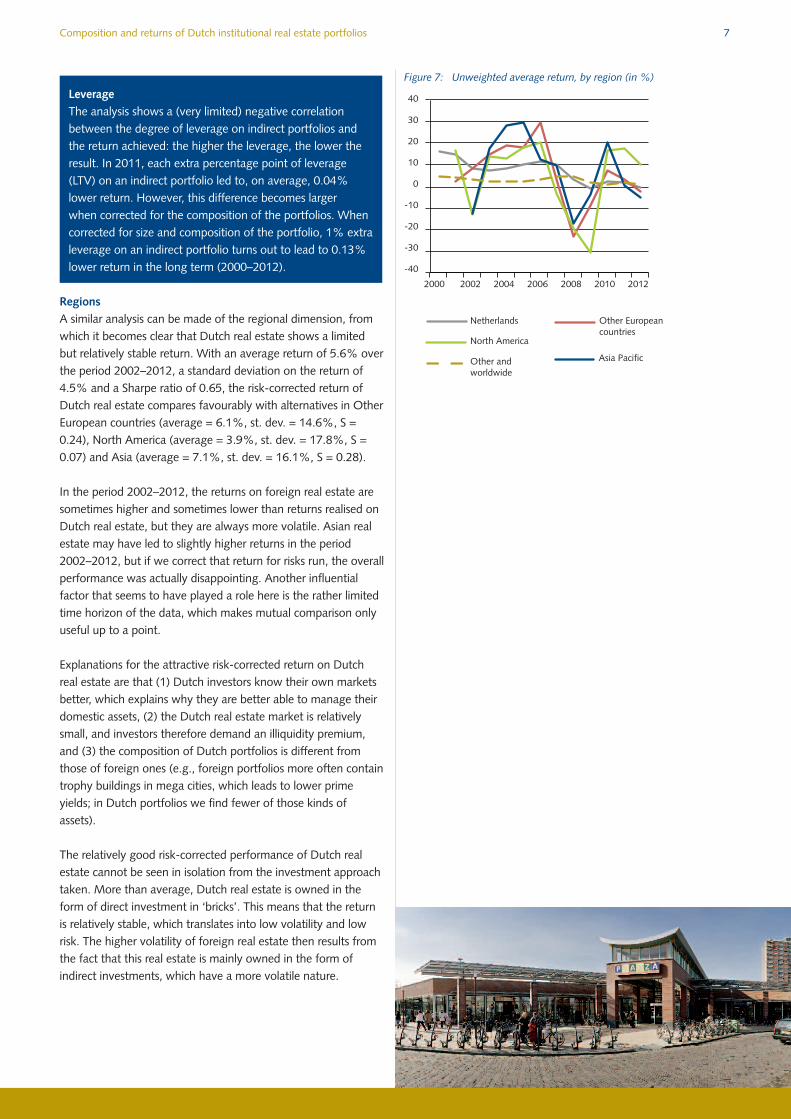
RegionsA similar analysis can be made of the regional dimension, fromwhich it becomes clear that Dutch real estate shows a limitedbut relatively stable return. With an average return of 5.6% overthe period 2002–2012, a standard deviation on the return of4.5% and a Sharpe ratio of 0.65, the risk-corrected return ofDutch real estate compares favourably with alternatives in OtherEuropean countries (average = 6.1%, st. dev. = 14.6%, S =0.24), North America (average = 3.9%, st. dev. = 17.8%, S =0.07) and Asia (average = 7.1%, st. dev. = 16.1%, S = 0.28).
In the period 2002–2012, the returns on foreign real estate aresometimes higher and sometimes lower than returns realised onDutch real estate, but they are always more volatile. Asian realestate may have led to slightly higher returns in the period2002–2012, but if we correct that return for risks run, the overallperformance was actually disappointing. Another influential factor that seems to have played a role here is the rather limitedtime horizon of the data, which makes mutual comparison onlyuseful up to a point.
Explanations for the attractive risk-corrected return on Dutchreal estate are that (1) Dutch investors know their own marketsbetter, which explains why they are better able to manage theirdomestic assets, (2) the Dutch real estate market is relativelysmall, and investors therefore demand an illiquidity premium,and (3) the composition of Dutch portfolios is different fromthose of foreign ones (e.g., foreign portfolios more often containtrophy buildings in mega cities, which leads to lower primeyields; in Dutch portfolios we find fewer of those kinds of assets).
The relatively good risk-corrected performance of Dutch realestate cannot be seen in isolation from the investment approachtaken. More than average, Dutch real estate is owned in theform of direct investment in ‘bricks’. This means that the returnis relatively stable, which translates into low volatility and lowrisk. The higher volatility of foreign real estate then results fromthe fact that this real estate is mainly owned in the form of indirect investments, which have a more volatile nature.
Figure 7: Unweighted average return, by region (in %)
Composition and returns of Dutch institutional real estate portfolios 7
LeverageThe analysis shows a (very limited) negative correlation between the degree of leverage on indirect portfolios and the return achieved: the higher the leverage, the lower theresult. In 2011, each extra percentage point of leverage (LTV) on an indirect portfolio led to, on average, 0.04%lower return. However, this difference becomes larger when corrected for the composition of the portfolios. Whencorrected for size and composition of the portfolio, 1% extraleverage on an indirect portfolio turns out to lead to 0.13%lower return in the long term (2000–2012).
40
30
20
10
0
-10
-20
-30
-40
2000 2002 2004 2006 2008 2010 2012
Netherlands Other Europeancountries
North America
Other and worldwide
Asia Pacific
Table 3: Unweighted average return, risk and Sharpe ratio, by region
(in %).
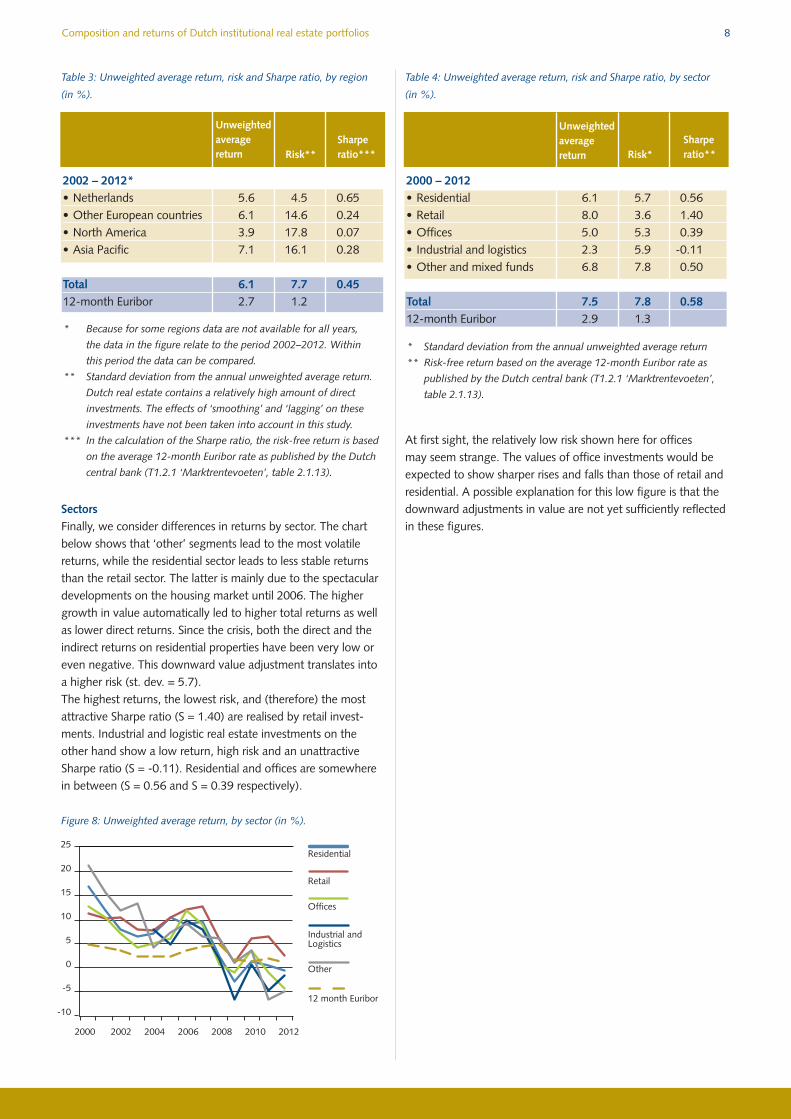
SectorsFinally, we consider differences in returns by sector. The chartbelow shows that ‘other’ segments lead to the most volatile returns, while the residential sector leads to less stable returnsthan the retail sector. The latter is mainly due to the spectaculardevelopments on the housing market until 2006. The highergrowth in value automatically led to higher total returns as wellas lower direct returns. Since the crisis, both the direct and theindirect returns on residential properties have been very low oreven negative. This downward value adjustment translates intoa higher risk (st. dev. = 5.7).The highest returns, the lowest risk, and (therefore) the most attractive Sharpe ratio (S = 1.40) are realised by retail invest-ments. Industrial and logistic real estate investments on theother hand show a low return, high risk and an unattractiveSharpe ratio (S = -0.11). Residential and offices are somewherein between (S = 0.56 and S = 0.39 respectively).
Figure 8: Unweighted average return, by sector (in %).
Table 4: Unweighted average return, risk and Sharpe ratio, by sector
(in %).
At first sight, the relatively low risk shown here for offices may seem strange. The values of office investments would beexpected to show sharper rises and falls than those of retail andresidential. A possible explanation for this low figure is that thedownward adjustments in value are not yet sufficiently reflectedin these figures.
Composition and returns of Dutch institutional real estate portfolios 8
Unweightedaverage return Risk**
Sharperatio***
2002 – 2012*• Netherlands 5.6 4.5 0.65• Other European countries 6.1 14.6 0.24• North America 3.9 17.8 0.07• Asia Pacific 7.1 16.1 0.28
Total 6.1 7.7 0.4512-month Euribor 2.7 1.2
* Because for some regions data are not available for all years,
the data in the figure relate to the period 2002–2012. Within
this period the data can be compared.
** Standard deviation from the annual unweighted average return.
Dutch real estate contains a relatively high amount of direct
investments. The effects of ‘smoothing’ and ‘lagging’ on these
investments have not been taken into account in this study.
*** In the calculation of the Sharpe ratio, the risk-free return is based
on the average 12-month Euribor rate as published by the Dutch
central bank (T1.2.1 ‘Marktrentevoeten’, table 2.1.13).
* Standard deviation from the annual unweighted average return
** Risk-free return based on the average 12-month Euribor rate as
published by the Dutch central bank (T1.2.1 ‘Marktrentevoeten’,
table 2.1.13).
Risk*Sharperatio**
25
20
15
10
5
0
-5
-10
2000 2002 2004 2006 2008 2010 2012
Residential
Retail
Offices
Industrial and Logistics
Other
12 month Euribor
3. A typology of institutional real estateportfolios
Tables 2, 3 and 4 show that the composition of large institutionalreal estate portfolios differs substantially. These differences are due to the fact that each investor follows his own uniquestrategy, based on, amongst other things, future obligations, risk preference and investment beliefs. However, the tables also show a number of similarities between the portfolios. Forexample, one group of investors mainly invests in direct realestate. In addition, there are several investors who have a relatively large proportion of residential investments in their real estate portfolios.
By means of a statistical cluster analysis, four archetypes of realestate strategies can be distinguished in the real estate portfolios:1. Strongly diversified investors with large mandates and diversi-
fication across all dimensions.2. Real estate specialists with a home bias, who particularly own
direct Dutch real estate.
3. Diversified fund investors, who invest in real estate funds and divide their investments 50/50 between private and public funds.
4. Private fund investors, who mainly invest in non-listed realestate funds.
Over the past years, these strategies have led to different returns. With hindsight, it turns out that Strategy 1 resulted in the highest returns, mainly due to the high returns on listedindirect investments and investments in Asia. Since the returns of these listed and Asian real estate investments also come withrelatively high volatility, the funds using this strategy also ranhigher risks.
Composition and returns of Dutch institutional real estate portfolios 9
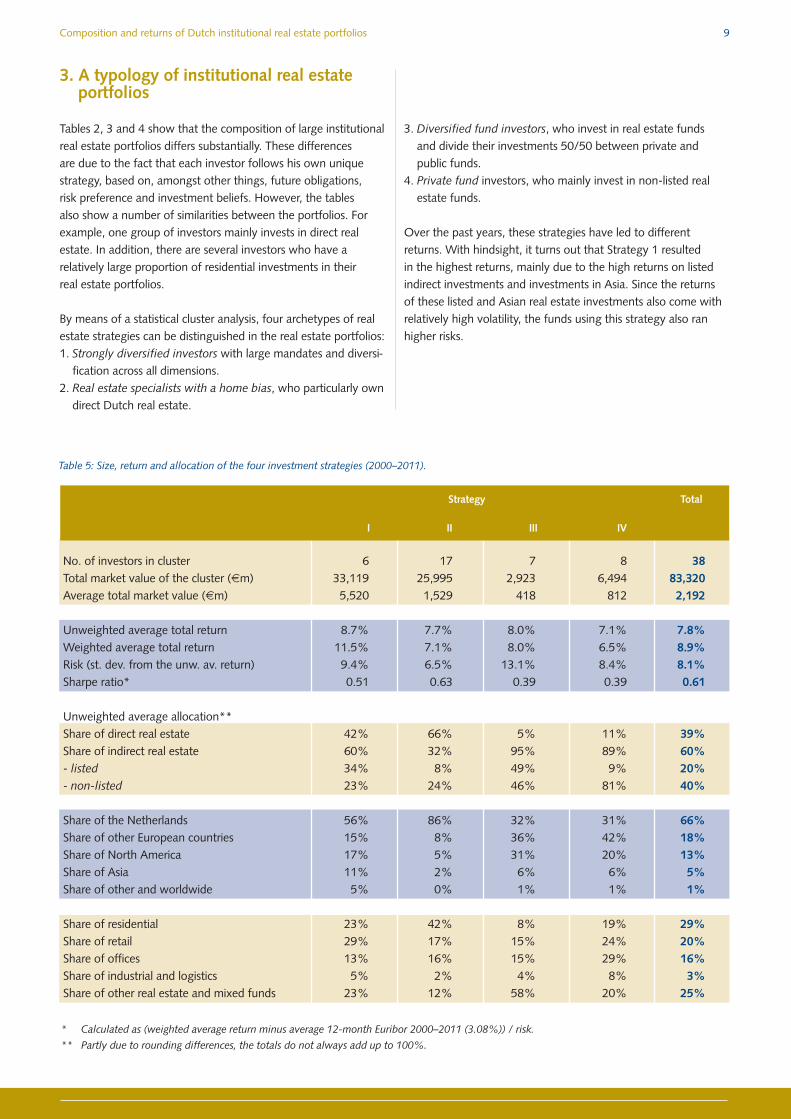
No. of investors in cluster 6 17 7 8 38Total market value of the cluster (€m) 33,119 25,995 2,923 6,494 83,320 Average total market value (€m) 5,520 1,529 418 812 2,192
Unweighted average total return 8.7% 7.7% 8.0% 7.1% 7.8%Weighted average total return 11.5% 7.1% 8.0% 6.5% 8.9%Risk (st. dev. from the unw. av. return) 9.4% 6.5% 13.1% 8.4% 8.1%Sharpe ratio* 0.51 0.63 0.39 0.39 0.61
Unweighted average allocation**Share of direct real estate 42% 66% 5% 11% 39%Share of indirect real estate 60% 32% 95% 89% 60%- listed 34% 8% 49% 9% 20%- non-listed 23% 24% 46% 81% 40%
Share of the Netherlands 56% 86% 32% 31% 66%Share of other European countries 15% 8% 36% 42% 18%Share of North America 17% 5% 31% 20% 13%Share of Asia 11% 2% 6% 6% 5%Share of other and worldwide 5% 0% 1% 1% 1%
Share of residential 23% 42% 8% 19% 29%Share of retail 29% 17% 15% 24% 20%Share of offices 13% 16% 15% 29% 16%Share of industrial and logistics 5% 2% 4% 8% 3%Share of other real estate and mixed funds 23% 12% 58% 20% 25%
* Calculated as (weighted average return minus average 12-month Euribor 2000–2011 (3.08%)) / risk.
** Partly due to rounding differences, the totals do not always add up to 100%.
Table 5: Size, return and allocation of the four investment strategies (2000–2011).
Strategy Total
I II III IV
Strategy I: Strongly diversified investors This strategy assumes that optimal diversification can beobtained by spreading investments well over the different investment methods, regions and sectors. On average, in theperiod 2000–2011, just over 40% of the investments based onthis strategy concerned direct real estate investments (althoughthis group also includes investors who have now phased outtheir direct real estate portfolios). In addition, investors followingthis strategy invested on average slightly more in listed realestate and slightly less in non-listed indirect real estate thanthe total group. Although investors adopting this strategy onaverage have more than half of their real estate assets in the Netherlands, this group is also most active in faraway marketssuch as Asia. In addition, they have a relatively low share of offices in their portfolio, and more retail than average. This deviation from the benchmark weights indicates that these areactive investors, who also have their own vision of the market. It is clearly a successful approach, as shown by the fact that, inthe period 2000–2011, this strategy led to the highest return of 11.5%, accompanied by an also higher-than-average risk.This strategy of diversification is mainly adopted by very largepension funds. In this study, six pension funds following this strategy were involved, including ABP, Zorg & Welzijn, Rabobank, and ING Pension Fund.
Strategy II: Real estate specialists with a home biasThis strategy is based on specialisation in direct Dutch real estate.On average, 86% of the real estate of these institutional inves-tors is located in the Netherlands. In this group, two-thirds of theinvestments concerns direct real estate, which means that thisstrategy also leads to a relatively stable return. At 6.5%, thestandard deviation of the return is the lowest of all strategies. Investors adopting this strategy also have a relatively large share of residential investments, which points at portfolios with a relatively low total return. They mainly complement their directreal estate investments with private funds (also predominantlyDutch). Listed real estate plays only a minor role and may be invested in to keep some liquidity in the portfolio. Although at7.1% the total return on these portfolios is slightly below aver-age, the stability of the return leads to a good Sharpe ratio. Thisstrategy is mainly followed by medium-sized and large pensionfunds and insurers. Within the group researched, 17 investorstook this approach. Examples are the Dutch pension funds forthe construction industry, national railways, agriculture, themetal and electrical engineering industry and transport, the Philips Pension Fund, ASR, Dela and Achmea.
Strategy III: Diversified fund investorsDiversification can also be achieved by investing in varied fundsin mature real estate markets. That is the third strategy that canbe distinguished. Investors adopting this strategy have a mix ofapproximately 50% listed and 50% non-listed. The relativelyhigh percentage of listed real estate also means that these investors run a lot more risk. At 13.1%, the standard deviation of the return is twice that of Strategy II. This makes it the riskieststrategy. These portfolios contain relatively little residential andtherefore particularly commercial real estate. This seems to suggest that the investments comprise a relatively large propor-tion of multi-sector funds. This strategy also enables smaller pension funds to keep a well-diversified real estate portfolio,both in terms of regions and sectors. The management of theseportfolios is often outsourced to specialised administration agencies. With an average market value of €418m, this targetgroup mainly concerns the smaller pension funds. Nevertheless,these seven pension funds still have more than €250m in realestate on their balance sheet. Examples of investors adopting thisstrategy are the KLM pension fund, the pension fund for housingcorporations, the pension fund for the hospitality sector, and theAkzoNobel pension fund.
Strategy IV: Private fund investorsThe fourth strategy concerns specialisation in private real estate funds. This strategy is employed by investors who, dueto their size or strategy, cannot or do not want to invest in direct real estate, and wish to avoid the volatility and limited diversification of listed real estate shares. The choice of private(i.e., non-listed) real estate funds also enables these investors tospread their investments across regions and sectors. In contrastwith Strategy III, however, this diversification does not focus onmulti-sector funds, but rather on single-sector funds. That implies that the investors are more directly involved with their investment strategy. The regional diversification depresses thevolatility due to the limited correlation between Dutch and otherEuropean real estate (0.64) and that between Dutch and NorthAmerican real estate (0.47). The relative high proportion of offices has also depressed the average return (5%) due to thelow long-term returns achieved in this real estate category. In the context of this study, this strategy was adopted by the eightmedium-sized and large pension funds and insurers, i.e., thepension funds for general practitioners, medical specialists, TNT, KPN, the painting sector, Hoogovens, ABN-AMRO, and the ING Group (insurer).
Composition and returns of Dutch institutional real estate portfolios 10
4. Conclusions
• The 38 large pension funds and insurers in this study representthe lion’s share of the institutional investments in real estate in the Netherlands. At the end of 2011, they together represented €83.3 bn in real estate investments.
• Within this group of institutional investors, the degree of concentration is very high, with the four largest investors together owning 63% of this real estate.
• In the period 2000–2011, the share of non-listed real estatefunds in these portfolios rose substantially, at the cost of directreal estate investments in bricks and listed real estate shares. At the end of 2011, 28% was invested in direct real estate,44% in non-listed real estate funds and 28% in listed realestate shares.
• Direct investments achieved a relatively low return (6.8%), butthe compensation for risks taken was the highest (Sharpe ratio0.68). Listed real estate shares achieved the highest returns(11.8%) but were also the riskiest.
• At the end of 2011, 37% of the real estate investments inves-tigated concerned Dutch real estate. In the period 2000–2012,with a weighted average return of 8.5%, these domestic in-vestments may not have achieved higher returns than foreignreal estate investments, but the returns were more stable.
• Retail investments, which comprised 27% of the portfolios,yielded the highest returns in the period under investigation,and they also came with the lowest risk. Of the real estateportfolios under investigation, logistic real estate achieved thelowest return in the period 2000–2012.
• Larger real estate portfolios performed better in the period2000–2011 than smaller ones. Each €1 bn in size yielded onaverage 0.2% extra return. However, this difference is entirelydue to the fact that the composition of larger portfolios differsfrom that of the smaller ones. Larger investors take higher risksby investing a larger part of their real estate portfolios in listedreal estate shares and in Asian real estate. If the figures are corrected for this fact, the larger portfolios turn out not to perform any better than the smaller ones.
• In the period 2000–2011, leverage had a negative effect onthe average results achieved by real estate investments. In2011, each extra percentage point of leverage (LTV) on theindirect portfolio led to an average of 0.04% less return.
• On the basis of the data, 4 different portfolio strategies can be distinguished:I Strongly diversified investors, who strive for optimal diversification by spreading their real estate portfolios acrossinvestment methods, regions and sectors.
II Real estate specialists with a home bias, who mainly have direct Dutch real estate in their portfolio and prefer residentialinvestments.
III Diversified fund investors, who invest half their portfolio inprivate and the other half in public real estate funds.
IV Private fund investors, who mainly participate in non-listedreal estate funds.
• Over the years, these strategies have yielded different returns.With hindsight it turns out that Strategy I yielded the highestreturn, which is mainly due to the high returns on foreign listedreal estate. Because the returns of these listed investments alsocome with a relatively high volatility, the funds adopting thisstrategy also ran the highest risks.
Composition and returns of Dutch institutional real estate portfolios 11
‘Huize Middenburg’Westeinde 28Postbus 6202270 AP Voorburg