PO-CON1528E Comprehensive analysis of primary & secondary metabolites in citrus using an automated method changeover UHPLC system coupled to LC/MS/MS ASMS 2015 MP 397 Yuka Fujito, Kiyomi Arakawa, Yoshihiro Hayakawa Shimadzu Corporation Kyoto, Japan, 1, Kuwabaracho Nishinokyo Nakagyo-ku Kyoto, 604-8511, Japan
Transcript
PO-CON1528E
Comprehensive analysis of primary &secondary metabolites in citrus usingan automated method changeover UHPLC system coupled to LC/MS/MS
ASMS 2015 MP 397
Yuka Fujito, Kiyomi Arakawa, Yoshihiro Hayakawa
Shimadzu Corporation Kyoto, Japan,
1, Kuwabaracho Nishinokyo Nakagyo-ku Kyoto,
604-8511, Japan
2
Comprehensive analysis of primary & secondary metabolites in citrus using an automated method changeover UHPLC system coupled to LC/MS/MS
IntroductionThere is a demand for better tasting, healthier and safer food-stuffs which better meet the needs of both industry and the consumer. New technology has been required to monitor and improve the quality of food, metabolomics has become an important tool for food processing, plant breeding and so on. In-food science, comprehensive analysis of primary metabolites through to secondary
metabolites is very important. However, there is no application which can analyze them at the same time.In this study, we developed the analytical methods using LC/MS/MS for monitoring the primary and secondary metabolites in foods, focus on the major compound’s categories such as organic acids, amino acids, sugars, carotenoids and �avonoids.
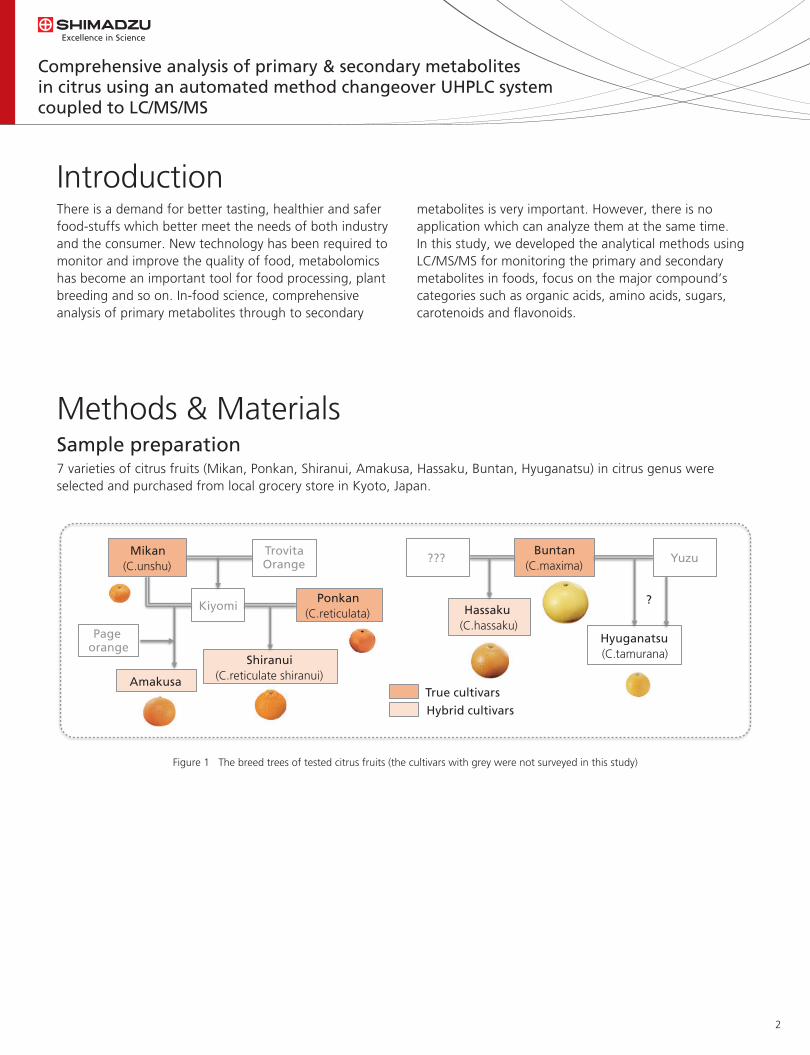
7 varieties of citrus fruits (Mikan, Ponkan, Shiranui, Amakusa, Hassaku, Buntan, Hyuganatsu) in citrus genus were selected and purchased from local grocery store in Kyoto, Japan.
Sample preparation
Methods & Materials
Figure 1 The breed trees of tested citrus fruits (the cultivars with grey were not surveyed in this study)
Mikan(C.unshu)
Ponkan(C.reticulata)
Buntan(C.maxima)
Shiranui(C.reticulate shiranui)Amakusa
Hassaku(C.hassaku)
Hyuganatsu(C.tamurana)
Kiyomi
TrovitaOrange
Page orange
??? Yuzu
?
True cultivars
Hybrid cultivars
3
Comprehensive analysis of primary & secondary metabolites in citrus using an automated method changeover UHPLC system coupled to LC/MS/MS
Figure 3 System con�guration
Figure 2 Protocol of sample preparation
We developed 3 analytical conditions for separation of target compounds. These 3 analytical conditions, comprising combinations of 4 mobile phases and 3 columns, were automatically performed using UHPLC
multi-method system in 40 minutes. This system enables multiple separations based on the combination of up to 8 different mobile phases and 6 different columns.
LC/MS/MS analysis
Homogenizing fruit or peel of each citrus
Weighing 5 g of fruit or peel
Centrifugation
Filtration
Dilution (1/1000)
Adding 20 mL of water / methanol
Adding 20 mL of Hexene
Dilution (1/5)
Dilution (1/10000)
Organic acidsAmino acidsFlavonoids
Sugars Carotenoids
* Each citrus was divided into fruit and peel in advance.
* The same solvent as the extract solvent was used for dilution.
Comprehensive analysis of primary & secondary metabolites in citrus using an automated method changeover UHPLC system coupled to LC/MS/MS
Table 1 Analytical conditions
Figure 4 LCMS-8050 triple quadrupole mass spectrometer
High Speed Mass Spectrometer Ultra Fast Scanning - 30,000 u / sec. Ultra Fast Polarity Switching - 5 msec. Ultra Fast MRM - Max. 555 transitions /sec
Conditions
HPLC
UHPLC Nexera system (Shimadzu)
40ºC
Organic acids
Amino acids
Flavonoids
A: Discovery HS F5-3
(2.1×150mm, 3μm)
Sigma-aldrich
0%B (0-2min.) → 95% (10-13min.)
→ 0% (13.01-16min.)
2: 0.1% formic acid-water
1: Acetonitrile
0.25 mL/min.
16 min.
Carotenoids
B: Inertsil ODS-4
(2.1×50mm, 2μm)
GL-science
60%B (0min.) → 100% (5-8min.)
→ 60% (8.01-10min.)
1: water
2: Acetonitrile / 2-propanol =2/1
0.4 mL/min.
10 min.
Sugars
C: Asahipak NH2P-50 2D
(2.0×150mm, 5μm)
Shodex
65%B (0-8min.) → 30% (8-11min.)
→ 65% (11.01-15min.)
1: water
1: Acetonitrile
0.4 mL/min.
15 min.
MS
Condition 1 Condition 2 Condition 3
41 min.
2 μL
LCMS-8050
ESI (+ / -)
MRM
Instrument
Target compounds
Column
Column oven temp.
Mobile phase A
Mobile phase B
Flow rate
Time program
Measurement time
Total run time
Injection volume
Instrument
Ionization
Mode
5
Comprehensive analysis of primary & secondary metabolites in citrus using an automated method changeover UHPLC system coupled to LC/MS/MS
Table 2 Calibration range of tested compounds
Figure 5 MRM chromatograms in each analytical conditions
All tested compounds (10 organic acids, 24 amino acids, 5 sugars, 5 �avonoids and 9 carotenoids) were successfully separated using 3 analytical conditions (Fig. 5). Calibration range and LOQs of all compounds were showed in Table 2.
Standards of primary & secondary metabolites
Result
0.0 2.5 5.0 7.5 10.0 12.5 min
0.0
0.5
1.0
1.5
2.0
2.5
(x100,000)
-organic acid-amino acid-Flavonoid
Naringin
Quercetin
Kaempherol
Nobiletin
TangeretinConditions 1
Lycopene
β-carotene
Fucoxanthin
Lutein
Canthaxanthin
0.0 1.0 2.0 3.0 4.0 5.0 6.0 7.0 8.0 9.0 min
0.00
0.25
0.50
0.75
1.00
1.25
1.50
(x1,000,000)
Conditions 2
Zeaxanthin
Violaxanthin
Astaxanthin
β-cryptxanthin Rhamnose
Glucose
Fructose
Mannose
Sucrose
Maltose, Lactose
2.5 5.0 7.5 10.0 12.5 min
0.00
0.25
0.50
0.75
1.00
1.25
(x1,000,000)
Conditions 3
Cystine
Aspartic acid
Asparagine
Serine
4-Hydroxyproline
Glycine
Lysine
Cysteine
Threonine
Glutamic acid
Alanine
Proline
Ornitine
Glutamine
Histidine
Arginine
GABA
Valine
Methionine
Tyrosine
Isoleucine
Leucine
Phenylalanine
Tryptophan
Amino acids
1-100
5-100
5-100
5-100
1-100
5-100
1-100
50-100
5-100
1-100
5-100
1-100
5-1000
5-100
5-100
5-100
5-100
1-100
5-100
5-100
5-100
10-100
1-100
5-500
CAL of range
(μg/L)
(μg/L)
(μg/L)
(μg/L)
(μg/L)
Tartaric acid
2-Ketoglutaric acid
Isocitric acid
Malic acid
Lactic acid
Citric acid
Pyroglutamic acid
Succinic acid
Fumaric acid
Maleic acid
Organic acids
50-10000
10-1000
50-10000
10-5000
50-10000
50-10000
10-10000
10-1000
500-1000
50-10000
CAL of range
Fucoxanthin
Violaxanthin
Astaxanthin
Lutein
Zeaxanthin
Canthaxanthin
β-Cryptxanthin
Lycopene
β-carotene
Carotenoids
0.1-100
1-100
0.5-100
0.1-100
0.5-100
0.05-100
0.05-100
50-100
0.1-100
CAL of range
Naringin
Quercetin
Kaempferol
Nobiletin
Tangeretin
Flavonoids
10-1000
5-1000
5-1000
0.1-1000
0.1-1000
CAL of range
Rhamnose
Fluctose
Glucose
Sucrose
Maltose, Lactose
Sugars
50-1000
50-5000
50-5000
100-5000
200-2000
CAL of range
6
Comprehensive analysis of primary & secondary metabolites in citrus using an automated method changeover UHPLC system coupled to LC/MS/MS
Principal component analysis (PCA) was performed to compare fruit with peel in all tested citrus cultivars. Fruit and peel samples were tend to be separated into 2 groups in the score plot. Analysis of the loading plot
reveals some compounds responsible of the separation between fruit and peel samples (sugars, �avonoids and carotenoids).
■ Comparison between fruit and peel
Sample analysis
Figure 7 Comparison of amount (mean) and composition between fruit and peel
Figure 8 Comparison of amount (mean) in secondary metabolites
Result of the quanti�cation, there is no difference in total amount of sugars between fruit and peel samples. However, composition of them was obviously different.
In secondary metabolites, total amount was signi�cantly different between fruit and peel. We con�rmed that fruit is more rich in carotenoids than peel but poor in �avonoids.
Amount (mean)
0
20
40
60
80
100
120
140
Fruit Peel Fruit Peel
Composition
FructoseGlucose
Sucrose
Fructose
Glucose
Sucrose
no difference
(mg/g)
0
500
1000
1500
Fruit Peel
(ng/g)
0102030405060
Fruit Peel
(mg/g)Carotenoids Flavonoids
5 timesover 30 times
• Primary metabolites (sugars)
• Secondary metabolites
FruitPeel
Score plot
R2 (PC1) : 30%R2 (PC2) : 17%Scaling : Unit variance
Carotenoids
Flavonoids
Sugars
Sugars
Loading plot
Figure 6 Result of PCA in both fruit and peel samples (SIMCA-P)
For Research Use Only. Not for use in diagnostic procedures.The content of this publication shall not be reproduced, altered or sold for any commercial purpose without the written approval of Shimadzu. The information contained herein is provided to you "as is" without warranty of any kind including without limitation warranties as to its accuracy or completeness. Shimadzu does not assume any responsibility or liability for any damage, whether direct or indirect, relating to the use of this publication. This publication is based upon the information available to Shimadzu on or before the date of publication, and subject to change without notice.
Comprehensive analysis of primary & secondary metabolites in citrus using an automated method changeover UHPLC system coupled to LC/MS/MS
Conclusions• Primary & secondary metabolites were successfully separated using 3 analytical conditions, and UHPLC multi-method
system enables contentious analysis without replacement of the columns or mobile phases.• We con�rmed that the cultivars in mandarin group showed high level of carotenoids.
Figure 10 Comparison of amount of carotenoids between 7 citrus
The cultivars in mandarin and hybrid of mandarin, their plots tend to be located in the upper right in the score plot. The loading plot showed that carotenoids are characteristic of these cultivars. Result of the quanti�cation, the cultivars in mandarin and hybrid of mandarin showed a high revel of carotenoids, especially β-cryptxanthin and β-carotene.0
1000
2000
3000
4000
5000VIO
LUT
ZEA
BCA
BCR
β-cryptxanthin
β-carotene
(ng/g)
MandarinHybrid of mandarin
Score plot
R2 (PC1) : 30%R2 (PC2) : 23%Scaling : Unit variance


![BIOACTIVE SECONDARY METABOLITES: AN … SECONDARY METABOLITES: AN OVERVIEW ... biochemical activities include the tubulin microtubule] ... microorganisms present in our environment](https://static.documents.pub/doc/80x56/5aafa36b7f8b9aa8438d8df2/bioactive-secondary-metabolites-an-secondary-metabolites-an-overview-biochemical.jpg)


