82
Comprehensive Annual Financial Report For the Fiscal Year Ended 2015

Comprehensive Annual Financial Report
For the Fiscal Year Ended 2015

SACRAMENTO METROPOLITAN AIR QUALITY MANAGEMENT DISTRICT
Comprehensive Annual Financial Report
For the Fiscal Year Ended 2015
Prepared by the Administrative Services Division
Jamille Moens, Division ManagerNicholas Lange, Controller
SACRAMENTO, CALIFORNIA

TABLE OF CONTENTS
INTRODUCTORY SECTION
LETTER OF TRANSMITTAL i
CERTIFICATE OF ACHIEVEMENT
FOR EXCELLENCE IN FINANCIAL REPORTING vii
GOVERNING BOARD viii
ORGANIZATIONAL CHART ix
FINANCIAL SECTION
INDEPENDENDENT AUDITOR’S REPORT 1
MANAGEMENT’S DISCUSSION & ANALYSIS 4
BASIC FINANCIAL STATEMENTS
Government-wide Financial Statements
Statement of Net Position 12
Statement of Activities 13
Fund Financial Statements
Balance Sheet – Governmental Funds 14
Reconciliation of the Governmental Funds Balance Sheet
to the Statement of Net Position 15
Statement of Revenues, Expenditures and Changes
in Fund Balance – Governmental Funds 16
Reconciliation of the Governmental Funds Statement of Revenues, Expenditures
and Changes in Fund Balances to the Statement of Activities 17
Statement of Net Position – Proprietary Fund 18
Statement of Revenues, Expenses and Changes in Net Position – Proprietary Fund 19
Statement of Cash Flows – Proprietary Fund 20
Notes to the Financial Statements 21
REQUIRED SUPPLEMENTARY INFORMATION
Schedule of Revenues, Expenditures and Changes in Fund Balances
General Fund – Budget and Actual 44
Schedule of Revenues, Expenditures and Changes in Fund Balances
Emissions Technology Fund – Budget and Actual 45
Schedule of Funding Progress for Other Postemployment Benefits 46
Schedule of Proportionate Share of the Net Pension Liability 47
Schedule of Contributions 48

TABLE OF CONTENTS
Notes to Required Supplementary Information 49
OTHER SUPPLEMENTARY INFORMATION
Schedule of Expenditures of Federal Awards 51
STATISTICAL SECTION (UNAUDITED)
STATISTICAL SECTION OVERVIEW 53
SCHEDULE 1 – Net Position by Component – Last Ten Fiscal Years
(accrual basis of accounting) 54
SCHEDULE 2 – Changes in Net Position – Last Ten Fiscal Years
(accrual basis of accounting) 55
SCHEDULE 3 – Fund Balances of Government Funds – Last Ten Fiscal Years
(modified accrual basis of accounting) 56
SCHEDULE 4 – Changes in Fund Balances of Government Funds – Last Ten Fiscal Years
(modified accrual basis of accounting) 57
SCHEDULE 5 – General Government Expenditures by Major Object – Last Ten Fiscal Year
(budgetary basis of accounting) 58
SCHEDULE 6 – General Government Expenditures by Function – Last Ten Fiscal Years 59
SCHEDULE 7 – General Government Revenues by Source – Last Ten Fiscal Years 60
SCHEDULE 8 – Own Source Government Revenue Base – Last Ten Fiscal Years 61
SCHEDULE 9 – Demographic Information – Last Ten Years 62
SCHEDULE 10 – DMV Registrations (Autos & Trucks) – Last Ten Years 63
SCHEDULE 11 – Principal Employers – Current Year and Ten Years Ago 64
SCHEDULE 12 – District Staff Position List – Last Ten Fiscal Years 65
SCHEDULE 13 – Ratios of Outstanding Debt by Type – Last Ten Years 66
SCHEDULE 14 – Capital Assets by Function/Program – Last Seven Fiscal Years 67

INTRODUCTORY SECTION

Larry GreeneAIR POLLUTION CONTROL OFFICER
i
LETTER OF TRANSMITTAL
December 29, 2015
Chairman, Governing Board and Citizensof the Sacramento Metropolitan Air Quality Management District
State law requires local governments to publish a complete set of audited financial statements presented in conformity with generally accepted accounting principles (GAAP) and audited in accordance with generally accepted auditing standards by a firm of licensed certified public accountants. This report is published to fulfill that requirement for the fiscal year ended June 30, 2015.
This report consists of management’s representations concerning the finances of the Sacramento Metropolitan Air Quality Management District (District), Sacramento, California. Management assumes full responsibility for the completeness and reliability of all of the information presented in this report, based upon a comprehensive internal control framework that was established for this purpose. Since the cost of internal control should not exceed anticipated benefits, the objective is to provide reasonable, rather than absolute, assurance thatthe financial statements are free of any material misstatements. As management, we assert to the best of our knowledge and belief, this financial report is complete and reliable in all material respects.
The District’s financial statements have been audited by James Marta & Company LLP, Certified Public Accountants. The goal of the independent audit is to provide reasonable assurance that the financial statements of the District for the fiscal year ended June 30, 2015are free of material misstatements. The independent auditors concluded, based upon the audit,there was a reasonable basis for rendering an unmodified (clean) opinion that the District financial statements for the fiscal year ended June 30, 2015 are fairly presented in conformity with accounting principles generally accepted in the United States of America. The independent auditor’s report is located at the front of the financial section of this report.
The District’s independent financial statements audit was part of a broader, federally mandated “Single Audit” designed to meet the Federal grantor agencies special needs. The standards governing Single Audit engagements require the independent auditor to report not only on the financial statements fair presentation, but also on the audited government’s internal controls and compliance with legal requirements, plus special emphasis on internal controls and legal requirements involving the Federal awards administration. The information required by the Single Audit that is outside the scope of the financial statements is available in a separately issued report on the District’s website.

ii
Management’s Discussion and Analysis (MD&A) immediately follows the independent auditor’s report and provides a narrative introduction, overview, and analysis of the basic financial statements. The transmittal letter should be read in conjunction with the MD&A.
Profile of the Sacramento Metropolitan Air Quality Management District
The Sacramento Air Pollution Control District was formed by the Sacramento County Board of Supervisors in December of 1959. In July of 1996, the Sacramento Metropolitan Air Quality Management District was created under Health and Safety Code Sections 40960 et. seq. to monitor, promote and improve air quality in the County of Sacramento. It is one of 35 local or regional air quality districts in California. It has been designated by the Environmental Protection Agency (EPA) as part of the Sacramento Federal Ozone Nonattainment Area (SFNA), which is comprised of all of Sacramento and Yolo Counties, the eastern portion of Solano County, the southern portion of Sutter County and the western slopes of El Dorado and Placer Counties up to the Sierra crest and includes four other local air districts. Roughly 63% of the SFNA’s population falls within the District’s boundaries.
The District Governing Board is composed of 14 members, including all five Sacramento County Supervisors, four members of the Sacramento City Council, one member each from the Cities ofCitrus Heights, Elk Grove, Folsom and Rancho Cordova, and one member representing the cities of Galt and Isleton. The Board appoints the agency’s Executive Officer and District Counsel.
In spite of a significant increase in population over the last two decades, the Sacramento region’s air quality has continued to improve. Although the District is still home to some of the worst air quality in the nation, progress has been made even as standards have tightened. Air quality in the SFNA is currently designated non-attainment for ozone and PM2.5 as well as the more stringent California standards for ozone and particulate matter (PM10 and PM2.5).
A combination of poor atmospheric ventilation, a capping temperature inversion, bordering mountains and sunny days act to enhance smog formation and effectively trap pollutants in the Basin. The Sacramento region has relatively few “smokestack” industries compared to the Bay Area and Southern California. Even if the District were to shut down all of these stationary sources, it’s unlikely that the District could meet air quality standards, particularly the tougher state standards. In addition, mobile sources are a significant contributor to air pollution.
iii
Mobile sources include motor vehicles, airplanes, locomotives, and other engines and portable equipment. It also includes “off-road” sources, such as construction, mining, and agricultural equipment. In 2015, these mobile sources are projected to contribute about 40% of our Volatile Organic Compounds (VOC) and 84% of our Oxides of Nitrogen (NOx) emissions, while stationary (industrial) sources contribute about 22% of our VOC emissions and 10% of our NOx emissions. State and federal regulations will help to reduce the impact of motor vehicle fuel and engine emissions on our air quality in the future, but as growth in our region brings more vehicles in, mobile sources will continue to be a major factor in our air quality problem.
The District is responsible for monitoring air pollution within the Basin and for developing and administering programs to reduce air pollution levels below the health-based standards established by the state and federal governments.
The annual budget serves as the foundation for the District’s financial planning and control. The Governing Board is required to adopt an annual budget by July 1 of each fiscal year. Budgets are adopted on a budgetary basis that includes encumbrances and expenditures. All annual appropriations lapse at fiscal year end to the extent they have not been expended or encumbered. Amendments to increase the budget must be approved by the Governing Board.
The District maintains budgetary controls through both signature authority and automated budget verification. The objective of these controls is to ensure compliance with the annual appropriated budget approved by the Governing Board. The District maintains an accounting system of purchase requests and contracts at the fund level as a means to accomplishing budgetary control.
Open requests and contracts are reported as a reservation of fund balance at the end of the fiscal year. Purchase requests and contracts are reviewed to ensure that funds are available and that requests are properly authorized prior to being released or executed.
As reflected in the statements and schedules included in the financial section of this report, the District continues to meet its responsibility for sound financial management.
Factors Affecting Financial Condition
The District’s General Fund receives revenue from a variety of sources. Approximately 43% of its funding is derived from fees paid by stationary sources that emit air pollution; 28% from auto registration fees collected by the Department of Motor Vehicles (DMV) and distributed to air districts throughout the state in support of motor vehicle emission reduction programs; 20% from federal, local government and state subventions; and 9% from sales tax and other earnings.The General Fund does not receive property tax support.
To meet its program commitments, despite increased workload complexity, the District has successfully streamlined many of its operations, reducing the cost of its programs. While the District does not fully recover its activity costs from fees, support in the form of state subvention, federal grants, and other revenues mentioned above offset much of the shortfall.
In fiscal year 2014-15, the employer contribution rates to the Districts pension system increased slightly due primarily to a smoothing of losses and gains introduced by CalPERS. The stock market downturn will cause District contributions in the CalPERS Retirement program to be increased over the next several years.

iv
Long-term Financial Planning
Management annually reviews a five-year financial projection that evaluates the potential internal, external and programmatic changes that can be implemented over the next fiscal year and beyond. This five year plan is reviewed and updated annually.
Notable projections related to revenues are as follows: as of October 2015 the unemployment rate in Sacramento County is 5.7%, down from a high of 13% in January 2010; as business activity and employment increases, revenues from permits and fees are expected to increase; the Sacramento Transportation Authority anticipates sales tax revenues from Measure A to increase 5% annually over the next five years; and DMV and Moyer funding would have sunset in 2015, but with the passage of AB8 these funding sources are reauthorized until 2024.
The District Board approved a multi-year fee increase as part of the fiscal year 2013-14 budget. These increases were applied to applicable fees in the fiscal year 2014-15 and 2015-16 approved budgets. District staff will continue to closely evaluate the need to increase fees for the remaining years approved by the Board. Subsequently, permit fees may be adjusted for the consumer price index (CPI) to help keep pace with rising costs.
Federal funding is increasing for Ambient Air Monitoring and is otherwise expected to remain consistent through fiscal year 2015-16 and transportation reauthorization is a high priority. This is important to ensure that Congestion Mitigation and Air Quality (CMAQ) program remains and continues to be authorized for the District’s truck and engine (SECAT) incentive and the Spare the Air programs.
Expenditures for the General Fund are expected to gradually increase to address major improvements, most notably nonrecurring capital expenditures to improve the District’s technology resources and for rehabilitation and replacement of several aging air monitoring stations. The District’s revenues are projected to be sufficient to meet the additional expenditures.
The Covell Building Fund is expected to be fairly stable in the next five years as the primary asset in the Fund, the District’s headquarters building, is relatively new and annual maintenance is anticipated to be consistent. Moving forward, major rehabilitation and replacement projects will be identified along with expected funding sources. The main funding source for capital expenditures in the Covell Fund is rental income.
There are no capital expenditures associated with the Emission Technology Fund as it serves as a pass-through for various emission technology incentive grants. While the next couple of years are expected to be stable with respect to grant funding, there is growing uncertainty into the future as some of the grants are scheduled to sunset, and may not be extended or replaced with other funding.
Currently, the District does not have a budgeted multi-year Capital Improvement Program, rather it budgets annually the amount required each fiscal year for identified projects. The District is developing a long-term Asset Management Program and exploring financial software applications capable of budgeting multiyear projects to allow for improved financial planning of its larger assets.

v
Major Initiatives
During the next year, the District will continue to work toward meeting non-attainment goals for ozone. Since mid-2012, EPA has recognized that Sacramento has met three federal air quality standards, the federal 1 hour ozone standard (October 2012), PM2.5 (July 2013), and PM10
(September 2013). Sacramento must continue to make progress and look for additional opportunities to meet the 2008 ozone health standard. Reducing ozone pollution will remain an important and core program of the District and region for many years. Moreover, the District recently completed the plan to be re-designated to attainment for the federal NAAQS for PM2.5.
While this was a significant challenge, controlling pollution from wood smoke on key days in the fall and winter is expected to continue to be a key strategy and essential to continuing to meet the PM2.5 standard. A public opinion survey was recently conducted, and one of the key findings was that, although the community has very good awareness and compliance with the “Check Before You Burn” program, the public (even many who comply with the program) do not believe that wood smoke is dangerous to their health. This led the District to focus on this fact in last season’s campaign, introducing scientists, doctors and public health experts talking about the dangers of exposure to wood smoke.
If U.S. EPA approves the re-designation and the District continues to attain the health standards, some federal permitting restrictions will no longer apply to local businesses.
The District, in cooperation with other local partners, supports the Sacramento Regional Bike Share Project administered by the Sacramento Area Council of Governments (SACOG) by providing funding and participating in the program’s executive and policy committees. Bike share systems provide users point-to-point transportation for short distances. Bikes can be rented from a kiosk, ridden to another location, and returned to any other bike share kiosk in the network. Currently, the project proposes to install and operate a pilot system of 88 stations and 616 bikes serving the cities of Sacramento, West Sacramento, and Davis. The District will provide on-going financial support for the project.
The District has numerous regional, state and federal partnerships that assist the District in achieving its mission. Continuing this important collaboration and leveraging these partnerships are key to meeting the District’s regional air quality goals as many of the reduction strategies are in areas outside of traditional stationary source regulation. One such effort is continuing to work with our local partners (cities, counties, SACOG) in responding to climate change as an issue, within the context of regulatory and legislative responsibilities and future changes that impact district operations. The District is also working in partnership with other Air Districts through California Air Pollution Control Officers Association, with the Air Resources Board, and nationally with the National Association of Clean Air Agencies to ensure that local communities have the ability to shape their local response to climate change within the context of their local economic, structural and political framework. Moreover, it is important that state and federal agencies provide resources to local communities to help with inventories and planning to respond to this critical issue. The District must also ensure that climate change regulatory and incentive efforts are supportive of our long-term criteria pollutant mission and that public health is not adversely impacted by otherwise well-meaning global warming initiatives.

vi
Awards and Acknowledgements
The Government Finance Officers Association of the United States and Canada (GFOA) awarded a Certificate of Achievement for Excellence in Financial Reporting to the District for its Comprehensive Annual Financial Report (CAFR) for the fiscal year ended June 30, 2014. The Certificate of Achievement is a prestigious national award recognizing conformance with the highest standards for preparation of state and local government financial reports. In order to be awarded a Certificate of Achievement, a government unit must publish an easily readable and efficiently organized CAFR, whose contents conform to program standards. The CAFR must satisfy both generally accepted accounting principles and applicable legal requirements. The Certificate of Achievement is valid for a period of one year only. The District believes the current report continues to meet the Certificate of Achievement program requirements, and is submitting it to GFOA to determine its eligibility for another certificate. The preparation of the CAFR was made possible by the dedicated services of the accounting and management staff of the District’s Administration Division. These members have our sincere appreciation for the contribution made in the preparation of this report. Recognition is also given to the Governing Board for their leadership and support and to all employees of the District who continue to encourage technology and improve operations to accomplish the District’s mission of protecting public health from air pollution with sensitivity to the impacts of its actions on the community and businesses. Respectfully submitted,
Larry Greene Jamille Moens Executive Director Administrative Services Manager

vii

Sacramento Metropolitan Air Quality Management DistrictGoverning BoardJune 30, 2015
viii
GOVERNING BOARD
BOARD OF DIRECTORS
Steve Hansen, ChairCouncil Member, City of Sacramento
Donald Terry, Vice ChairCouncil Member, City of Rancho Cordova
Patrick KennedySacramento County Board of Supervisors
Roberta MacGlashan Sacramento County Board of Supervisors
Don NottoliSacramento County Board of Supervisors
Susan PetersSacramento County Board of Supervisors
Phil SernaSacramento County Board of Supervisors
Larry CarrCouncil Member, City of Sacramento
Mark CrewsCouncil Member, Cities of Galt /Isleton
Sue FrostCouncil Member, City of Citrus Heights
Eric GuerraCouncil Member, City of Sacramento
Jeff HarrisCouncil Member, City of Sacramento
Steve LyCouncil Member, City of Elk Grove
Jeff StarskyCouncil Member, City of Folsom
Executive Director / Air Pollution Control Officer
Larry Greene
District Counsel
Kathrine Pittard
Sacramento Metropolitan Air Quality Management DistrictOrganization ChartJune 30, 2015
ix
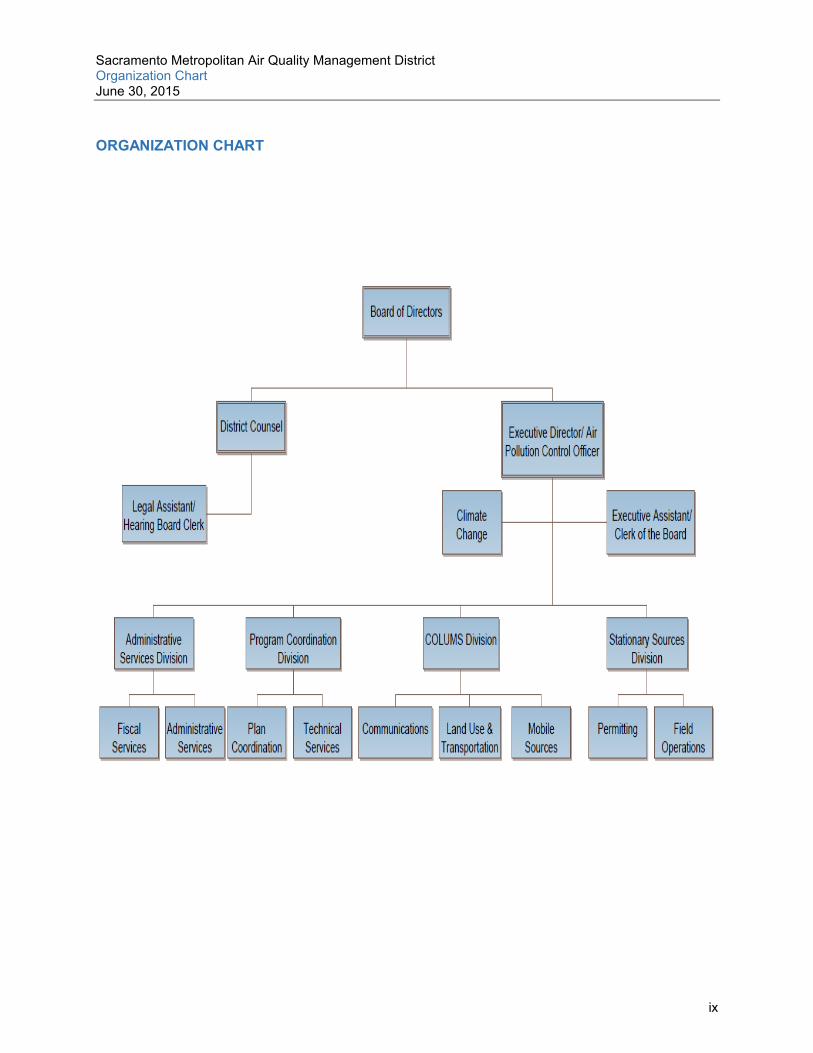
ORGANIZATION CHART

FINANCIAL SECTION
James Marta & Company LLP Certified Public Accountants
Accounting, Auditing, Consulting, and Tax
1
INDEPENDENT AUDITOR'S REPORT
Board of DirectorsSacramento Metropolitan Air Quality Management DistrictSacramento, California 95814
Report on the Financial Statements
We have audited the accompanying financial statements of the governmental activities, the business-type activities, each major fund, and the aggregate remaining fund information of the Sacramento Metropolitan Air Quality Management District (the “District”), as of and for the year ended June 30, 2015, and the related notes to the financial statements, which collectivelycomprise the District’s basic financial statements as listed in the table of contents.
Management’s Responsibility for the Financial Statements
Management is responsible for the preparation and fair presentation of these financial statements in accordance with accounting principles generally accepted in the United States of America; this includes the design, implementation, and maintenance of internal control relevant to the preparation and fair presentation of financial statements that are free from material misstatement, whether due to fraud or error.
Auditor’s Responsibility
Our responsibility is to express an opinion on these financial statements based on our audit. We conducted our audit in accordance with auditing standards generally accepted in the United States of America, the standards applicable to financial audits contained in Government Auditing Standards, issued by the Comptroller General of the United States, and the State Controller’s Minimum Audit Requirements for California Special Districts. Those standards require that we plan and perform the audit to obtain reasonable assurance about whether the financial statements are free from material misstatement.
An audit involves performing procedures to obtain audit evidence about the amounts and disclosures in the financial statements. The procedures selected depend on the auditor’s judgment, including the assessment of the risks of material misstatement of the financial statements, whether due to fraud or error. In making those risk assessments, the auditor considers internal control relevant to the entity’s preparation and fair presentation of the financial statements in order to design audit procedures that are appropriate in the circumstances, but not for the purpose of expressing an opinion on the effectiveness of the entity’s internal control. Accordingly, we express no such opinion. An audit also includes evaluating the appropriateness of accounting policies used and the reasonableness of significant accounting estimates made by management, as well as evaluating the overall presentation of the financial statements.
We believe that the audit evidence we have obtained is sufficient and appropriate to provide a basis for our audit opinion.

2
Opinion
In our opinion, the financial statements referred to above present fairly, in all material respects,the financial position of the governmental activities, the business-type activities, each major fund, and the aggregate remaining fund information of Sacramento Metropolitan Air Quality Management District as of June 30, 2015, and the respective changes in its financial position and, where applicable, cash flows thereof for the year then ended in accordance with accounting principles generally accepted in the United States of America.
Other Matters
Required Supplementary Information
Accounting principles generally accepted in the United States of America require that Management’s Discussion and Analysis (pages 4-10), the Budget to Actual Comparisons (pages 44-45), Schedule of Funding Progress for Other Postemployment Benefits (page 46), Schedule of Proportionate Share of the Net Pension Liability (page 47), and the Schedule of Contributions (page 48) be presented to supplement the basic financial statements. Such information, although not a part of the basic financial statements, is required by the Governmental Accounting Standards Board (GASB) who considers it to be an essential part of financial reporting for placing the basic financial statements in an appropriate operational, economic or historical context. We have applied certain limited procedures to the required supplementary information in accordance with auditing standards generally accepted in the United States of America, which consisted principally of inquiries of management about the methods of preparing the information and comparing the information for consistency with management’s responses to our inquiries, the basic financial statements and other knowledge we obtained during our audit of the basic financial statements. We do not express an opinion or provide any assurance on the information because the limited procedures do not provide us with sufficient evidence to express an opinion or provide any assurance.
Other Information
Our audit was conducted for the purpose of forming an opinion on the basic financials statements of the District. The accompanying “Schedule of Expenditures of Federal Awards” is presented for purposes of additional analysis as required by U.S. Office of Management and Budget Circular A-133, Audits of States, Local Governments, and Non-Profit Organizations, and is not a required part of the basic financial statements of Sacramento Metropolitan Air Quality Management District.
The Schedule of Expenditures of Federal Awards is the responsibility of management and was derived from and relates directly to the underlying accounting and other records used to prepare the basic financial statements. The information has been subjected to the auditing procedures applied in the audit of the basic financial statements and certain additional procedures, including comparing and reconciling such information directly to the underlying accounting and other records used to prepare the basic financial statements or to the basic financial statements themselves, and other additional procedures in accordance with auditing standards generally accepted in the United States of America. In our opinion, the information is fairly stated in all material respects in relation to the basic financial statements as a whole.

3
Change in Accounting Principle
As discussed in Note 1 to the financial statements, in 2015 the District adopted new accounting guidance, GASB Statement No. 68, Accounting and Financial Reporting for Pensions – an amendment of GASB Statement No. 27, and GASB Statement No. 71, Pension Transition for Contribution Made Subsequent to the Measurement Date – an amendment of GASB Statement No. 68. The District has not restated the actual and pro forma effect of the Statements on the financial statements as of and for the year ended June 30, 2014. This data is not readily available due to an actuary study not being prepared in accordance with GASB 68 for measurement dates prior to June 30, 2014. Our opinion is not modified with respect to this matter.
The effects of this restatement are described in Note 1 to the basic financial statements. The implementation of GASB 68 required the District to recognize its unfunded net pension liability resulting in the District having a negative unrestricted net position in the current year. The District currently funds this obligation on a pay-as-you go basis. The District anticipates that its ongoing funding and current resources are sufficient to meet its obligations as they come due.
Report on Other Legal and Regulatory Requirements
In accordance with Government Auditing Standards, we have also issued our report dated December 29, 2015 on our consideration of Sacramento Metropolitan Air Quality Management District’s internal control over financial reporting and our tests of its compliance with certain provisions of laws, regulations, contracts, grant agreements, and other matters. The purpose of that report is to describe the scope of our testing of internal control over financial reporting and compliance and the results of that testing, and not to provide an opinion on the internal control over financial reporting or on compliance. That report is an integral part of an audit performed in accordance with Government Auditing Standards in considering the District’s internal control over financial reporting and compliance.
James Marta & Company LLPCertified Public AccountantsSacramento, CaliforniaDecember 29, 2015

Sacramento Metropolitan Air Quality Management DistrictManagement’s Discussion and Analysisfor the Year Ended June 30, 2015
4
MANAGEMENT’S DISCUSSION AND ANALYSIS
This section of the District’s Comprehensive Annual Financial Report provides a narrative overview and analysis of the District’s financial activities for the fiscal year ended June 30, 2015.Please read this document in conjunction with the transmittal letter located in the introductory section, and the District’s financial statements which follow this discussion.
Financial Highlights
The following are the highlights for the fiscal year ended June 30, 2015:
The District’s total net position was $16,580,172 as of June 30, 2015. The District’s total net position decreased $5,494,226 due to the implementation of
GASB 68 which involves a change in accounting for pension liabilities and created a prior period adjustment of $7,287,421 to net position.
As of June 30, 2015 the District’s governmental funds reported an ending fund balance of $21,708,214, an increase of $1,319,545 from the prior year. Approximately 6.43% of this amount or $1,395,878 is available for spending at the government’s discretion (unassigned fund balance). Of this amount, 100% is available in the general fund.
The District’s total outstanding long-term debt decreased by $270,000, and the District did not incur any additional debt during fiscal year 2014-15.
Overview of Financial Statements
The District’s basic financial statements are comprised of three components: 1) government-wide financial statements; 2) fund financial statements; and 3) notes to the basic financial statements. This report also includes supplementary information to furnish additional detail to support the basic financial statements.
Government-wide Financial Statements
The government-wide financial statements provide readers with the overall financial position and activities of the District. These financial statements include the Statement of Net Position and the Statement of Activities.
The Statement of Net Position reports all assets held, liabilities owed and deferred inflows/outflows of resources by the District. Over time, increases or decreases in net positionmay serve as an indicator of whether the District’s financial position is improving or deteriorating.
The Statement of Activities includes all current year revenues and expenses regardless of the timing of related cash flows. Thus, revenue and expenses are reported in this statement for some items that will only result in cash flows in future fiscal periods such as earned but unused vacation leave.
Both of the District’s Statement of Net Position and Statement of Activities distinguish the District’s functions that are principally supported by taxes, grants and intergovernmental revenues (governmental activities) from other functions that are intended to recover all or a significant portion of their costs through user fees and charges (business-type activities). The District’s governmental activities include air pollution rule development, permitting and enforcement, public outreach, incentive programs, and various other air quality management
Sacramento Metropolitan Air Quality Management DistrictManagement’s Discussion and Analysisfor the Year Ended June 30, 2015
5
activities. The District’s business-type activities include management and leasing of a building the District owns and occupies.
The government-wide financial statements can be found on pages 12-13.
Fund Financial Statements
A fund is a grouping of related accounts that is used to maintain control over resources that have been segregated for specific activities or objectives. The District, like other state and local governments, uses fund accounting to ensure and demonstrate compliance with finance-related legal requirements. All of the District’s funds can be divided into two categories: governmental funds and proprietary funds.
Governmental funds. Governmental funds are reported as governmental activities in the government-wide financial statements. However, governmental fund financial statements focus on near-term inflows and outflows of spendable resources, as well as on balances of spendable resources available at the end of the fiscal year. Such information may be useful in evaluating the government’s near-term financing requirements.
Because the governmental funds focus on near-term financing requirements, it is useful to compare the governmental funds with similar information presented for governmental activitiesin the Government-Wide Financial Statements. By doing so, readers may better understand the long-term impact of the government’s near-term financing decisions. The Governmental Fund Balance Sheet and the Governmental Funds Statement of Revenues, Expenditures, and Changes in Fund Balances provide a reconciliation to facilitate this comparison between governmental funds and governmental activities.
The District adopts an annual appropriated budget for its General Fund. A budgetary comparison statement has been provided for the General Fund to demonstrate compliance with this budget.
The basic governmental fund financial statements can be found on pages 14-17.
Proprietary funds. The District uses the Covell Building Fund, to account for the operation and maintenance of the District’s building. Proprietary fund financial statements provide the same type of information as government-wide financial statements, only in more detail. The District’s Proprietary Fund Financial Statements for the District’s building and rental activities can be found on pages 18-20.
Notes to the Basic Financial Statements
The notes provide additional information to the reader for a full understanding of the data provided in the government-wide and fund financial statements. The notes to the basic financial statements can be found on pages 21-42.
Other Information
In addition to the basic financial statements and accompanying notes, the District also presents certain required supplementary information concerning the District’s final budget to actual comparison. Required supplementary information can be found starting on page 44.

Sacramento Metropolitan Air Quality Management DistrictManagement’s Discussion and Analysisfor the Year Ended June 30, 2015
6
Furthermore, the District presents a Schedule of Expenditures of Federal Awards on page 51 as other supplementary information.
Government-wide Financial Analysis
As noted earlier, net position may serve over time as a useful indicator of the government’s financial position. In the District’s case, assets exceeded liabilities by $16,580,172 at the close of fiscal year 2014-15. The schedule below presents a condensed Statement of Net Position as of June 30, 2015 compared with the prior fiscal year.
91.21% of the District’s net position consists of resources subject to external restrictions on how they may be used. 6.19% of the District’s net position reflects its net investment in capital assets (e.g. land, buildings, and equipment) less any related debt used to acquire those assets that is still outstanding.
Governmental net position decreased by $5,692,987, mainly due to the application of GASB 68 which resulted in a prior period adjustment that decreased beginning net position by$7,287,421. Excluding the GASB 68 prior period adjustment, the change in net position from governmental activities was $1,594,434.
2014 2015 2014 2015 2014 2015
Assets and Deferred Outflows of Resources
Current and other assets 29,157$ 30,681$ 1,725$ 1,782$ 30,882$ 32,463$
Capital assets 765 793 4,404 4,268 5,169 5,061
Deferred outflows of resources - 1,190 - - - 1,190
Total Assets and Deferred Outlfows of Resources 29,922 32,664 6,129 6,050 36,051 38,714
Liabilities and Deferred Inflows of Resources
Current liabilities 9,604 9,795 304 294 9,908 10,089
Non-current liabilities 27 6,592 4,041 3,774 4,068 10,366
Deferred inflows of resources - 1,679 - - 1,679
Total Liabilities and Deferred Inlfows of Resources 9,631 18,066 4,345 4,068 13,976 22,134
Net Position
Net investment in capital assets 765 793 93 233 858 1,026
Restricted 18,733 14,706 416 416 19,149 15,122
Unrestricted 793 (901) 1,275 1,333 2,068 432
Total Net Position 20,291$ 14,598$ 1,784$ 1,982$ 22,075$ 16,580$
Governmental
Activities
Business – Type
Activities
Total
Condensed Statement Of Net Position(in thousands)

Sacramento Metropolitan Air Quality Management DistrictManagement’s Discussion and Analysisfor the Year Ended June 30, 2015
7
The following schedule shows revenues by major source, expenses by function and Changes in Net Position for the fiscal years ended June 30, 2014 and June 30, 2015.
Governmental Activities
Excluding the prior period adjustment for the implementation of GASB 68, governmentalactivities increased the District’s net position by $1,594,434. Key elements of this increase are as follows:
Operating grants and contributions increased approximately $4.8 million mainly due to the extension of the Carl Moyer program that was previously designated to end in 2015.
The increase in revenue was largely offset by a corresponding $3.5 million increase in expenses via incentives provided by Mobile Source programs, such as the Goods Movement Emission Reduction Program (GMERP).
2014 2015 2014 2015 2014 2015
Revenues
Program Revenues:
Charges for services 7,340$ 6,953$ 796$ 888$ 8,136$ 7,841$
Operating grants and contributions 11,231 15,997 - - 11,231 15,997
General Revenues:
Grants/subventions 6,615 6,808 - - 6,615 6,808
Interest 19 25 6 8 25 33
Gain on sale - 16 - - - 16
Penalties/settlements 397 570 - - 397 570
Total Revenues 25,602 30,369 802 896 26,404 31,265
Expenses
Stationary Source activities 5,748 5,918 - - 5,748 5,918
Mobile Source activities 11,479 14,884 - - 11,479 14,884
Program Coordination activities 3,837 3,884 - - 3,837 3,884
Strategic Planning activities 3,772 3,878 - - 3,772 3,878
Building operations and obligations - - 641 698 641 698
Depreciation 148 211 - - 148 211
Total Expenses 24,984 28,775 641 698 25,625 29,473
Increase (Decrease) in Net Position 618 1,594 161 198 779 1,792
Beginning Net Position, as Previously Reported 19,672 20,290 1,623 1,784 21,295 22,074
Prior Period Adjustment - (7,287) - - - (7,287)
Beginning Net Position, as Adjusted 19,672 13,003 1,623 1,784 21,295 14,787
Ending Net Position 20,290$ 14,597$ 1,784$ 1,982$ 22,074$ 16,579$
Governmental Business – TypeTotal
Activities Activities
Condensed Statement of Activities(in thousands)

Sacramento Metropolitan Air Quality Management DistrictManagement’s Discussion and Analysisfor the Year Ended June 30, 2015
8
Business-type Activities
Business-type activities increased the District’s net position by $198,761. Key elements of this increase are as follows:
Operating revenues from the building were $888,592. There was a $92,821 increase from the prior year revenue due to increase in District rent. Operating Expenses increased $62,625 from payment on lease commission.
A principal payment of $270,000 was paid in fiscal year 2014-15 for the Certificate of Participation (COP). The principal payment for next year will be $275,000.
Financial Analysis of the Governmental Funds
As noted earlier, the District uses fund accounting to ensure and demonstrate compliance with finance-related legal requirements.
Governmental Funds
The District has two governmental funds, the General and Emission Technology Fund. Governmental funds provide information on near-term inflows, outflows and balances of spendable resources. Such information is useful in assessing the District’s financial requirements. In particular, unassigned fund balance may serve as a useful measure of a government’s net resources available for discretionary use. They represent the portion of the fund balance which has not yet been limited to use for a particular purpose by either an external party, the District itself, or a group or individual that has been delegated authority to assign resources for use for particular purposes by the District.
The General fund is District’s chief operating fund. At the end of the fiscal year 2014-15,unassigned fund balance of the general fund was $1,395,878, an increase of $603,144 over the prior year. As a measure of the General fund’s liquidity, it may be useful to compare both unassigned fund balance and total fund balance to total general fund expenditures. Unassigned fund balance represents approximately 8.1% of total general fund expenditures, while total fund balance represents approximately 70.6% of that same amount.
The Emission Technology Fund accounts for the resources accumulated and payments made for mobile source incentive awards. There are no operating expenditures in this fund and 100%of the fund balance is restricted for mobile source incentive awards.
Proprietary Fund
The Covell Building Fund is used to account for activity related to the District’s headquarters building. The District’s proprietary fund financial statements provide the same type of information found in the government-wide financial statements, but in more detail.
The proprietary fund’s unrestricted net position as of June 30, 2015 were $1,333,418. The total increase in net position was $198,761.

Sacramento Metropolitan Air Quality Management DistrictManagement’s Discussion and Analysisfor the Year Ended June 30, 2015
9
General Fund Budgetary Highlights
Original budget compared to final budget. During the year there were two amendments made to the original budget:
Account Original Budget Amended Budget DifferenceProfessional Services $8,899,405 $4,351,431 ($4,547,974)Capital Expenditures 300,132 564,532 264,400
There were two budget amendments that decreased Professional Services. The first reduced the revenue and expenditure budgets equally in the amount of $4.3 million to reflect the transfer of the control of the Bike Share Program from the District to Sacramento Area Council of Governments (SACOG). The Bike Share program was transferred to SACOG because it is a regional program that includes areas outside the District and more appropriately fell within the scope of SACOG’s mission. The second amendment moved $200,000 from the budget for the construction of the near road air quality monitoring site from Professional Services to Capital Expenditures to more accurately reflect the nature of the transaction. This caused a corresponding increase in the budget for Capital Expenditures.
Realized revenues were $272,022 less than budgeted revenues for fiscal year 2014-15. The District has various grants that are reimbursed as expended. Federal grants were $1,336,942less than budgeted and, since these grants are billed as expended, there are events or reasons when expenditures will be less than what is budgeted. An example would be fewer “Spare The Air” days. The District also receives incentive funds from various programs outside of state subventions.
Expenditures were $3,423,188 less than budgeted. The District contracts with various outside entities to perform work outside the expertise of District staff. The majority of the difference from actual to budget is a result of savings in these contracts and ongoing savings measures implemented by management that resulted in savings of $1,883,459. There were additional savings of $1,214,479 in salaries and benefits from unfilled budgeted positions.
Capital Assets and Debt Administration
Capital AssetsAs of June 30, 2015 the District’s net investment in capital assets for its governmental activities and business-type activities was $5,061,504 (net of accumulated depreciation). This investment in capital assets includes land, building, office equipment, laboratory equipment, and air monitoring stations. The total investment in capital assets for the current fiscal year was $239,283.
The investment in the capital assets includes upgrades to the District’s air monitoring stations, IT systems, and building. The District did not issue any additional debt to purchase capital assets. Additional information on capital assets can be found in the Notes to the Financial Statements on page 32.
Long-term Debt
At the end of fiscal year 14-15, the District had outstanding bonds secured by the District’s office building. Total debt outstanding as of June 30, 2015 was $4,036,026. Additional information on the District’s long-term debt can be found in the Notes to the Basic Financial Statements on page 33.
Sacramento Metropolitan Air Quality Management DistrictManagement’s Discussion and Analysisfor the Year Ended June 30, 2015
10
Economic Factors and Next Year’s Budgets and Rates
The fiscal year 2015-16 General Fund budget showed an increase of $1,453,919 compared to the amended fiscal year 2014-15 budget. Salaries and benefits increased $378,011 with anaddition of two funded positions and a 2% cost of living increase. Services and suppliesincreased $1,137,190 and Capital expenditures increased $203,800 due to monitoring station upgrades. The District has kept operating costs in check since the economic downturn. A multi-year fee increase to stationary source permits approved in fiscal year 2013-14 will allow the District to replenish the stationary source fund balance.
Budgeted Emission technology revenues increased $2,241,007 and expenditures decreased $9,884,560 with a decrease in the use of fund balance. The majority of these funds is provided through the state of California and is for incentive programs to reduce emissions from heavy-duty vehicles.
For the year ended June 30, 2015 there are no foreseeable economic or political conditions that would have a material effect on the financial position of the District. The District does not receive property tax monies, and the sales tax monies received are only 8.89% of the general fund budget.
Requests for Information
This financial report is designed to provide a general overview of the District’s finances for readers of the financial statements. Questions concerning any of the information provided in this report or requests for additional financial information should be addressed to:
Sacramento Metropolitan Air Quality Management District777 12th Street, 3rd Floor, Sacramento CA 95814

BASIC FINANCIAL STATEMENTS

Sacramento Metropolitan Air Quality Management DistrictGovernment-wide Financial StatementsStatement of Net PositionJune 30, 2015
The accompanying notes are an integral part of these financial statements. 12
Primary Government
Governmental Business-type
Activities Activities Total
Assets
Current assets:
Cash and cash equivalents 28,127,175$ 1,358,818$ 29,485,993$
Receivables 2,398,521 4,675 2,403,196
Prepaid expenses 155,110 2,006 157,116
Total current assets: 30,680,806 1,365,499 32,046,305
Non-current assets:
Deposits with others - certificate of participation reserve - 416,334 416,334
Capital assets
Land and other non-depreciable assets - 1,086,652 1,086,652
Other capital assets - net of depreciation 792,677 3,182,175 3,974,852
Total non-current assets: 792,677 4,685,161 5,477,838
Total assets: 31,473,483 6,050,660 37,524,143
Deferred Outflow of Resources
Deferred outflow on pensions 1,190,342 - 1,190,342
Liabilities
Current liabilities:
Accounts payable and accrued liabilities 1,584,782 18,191 1,602,973
Accrued wages and benefits payable 94,462 - 94,462
Unearned revenue 7,293,348 1,280 7,294,628
Compensated absences - due within one year 822,440 - 822,440
Certificates of participation - due within one year - 275,000 275,000
Total current liabilities: 9,795,032 294,471 10,089,503
Non-current liabilities
Deposits from others - 12,610 12,610
Compensated absences - due in more than one year 102,216 - 102,216
Certificates of participation - due in more than one year - 3,761,026 3,761,026
Pension liability, net 6,489,889 - 6,489,889
Total noncurrent liabilities: 6,592,105 3,773,636 10,365,741
Total liabilities: 16,387,137 4,068,107 20,455,244
Deferred Inflow of Resources
Deferred inflow on pensions 1,679,069 - 1,679,069
Net Position
Net investment in capital assets 792,677 232,801 1,025,478
Restricted
Emission technology incentives 9,549,952 - 9,549,952
Land use mitigation 1,580,308 - 1,580,308
Mobile source/air monitoring 3,489,835 - 3,489,835
SEED 85,654 - 85,654
Debt service - 416,334 416,334
Unrestricted (900,807) 1,333,418 432,611
Total net position: 14,597,619$ 1,982,553$ 16,580,172$

Sacramento Metropolitan Air Quality Management District Government-wide Financial Statements Statement of Activities June 30, 2015
The accompanying notes are an integral part of these financial statements. 13
Program Revenues Net (Expense) Revenue and Changes in Net position
Operating BusinessCharges for Grants and Governmental Type
Expenses Services Contributions Activities Activities TotalPrimary government:
Governmental activities:Stationary Source activities 5,918,050$ 6,440,801$ -$ 522,751$ -$ 522,751$ Mobile Source activities 14,884,085 106,376 13,910,787 (866,922) - (866,922) Program Coordination activities 3,883,548 265,185 1,442,936 (2,175,427) - (2,175,427) Strategic Planning activities 3,877,953 140,712 643,422 (3,093,819) - (3,093,819) Depreciation expense - unallocated 211,551 - - (211,551) - (211,551)
Total governmental activities 28,775,187 6,953,074 15,997,145 (5,824,968) - (5,824,968)
Business-type activities:Building operations and obligations 697,804 888,592 - - 190,788 190,788
Total primary government 29,472,991$ 7,841,666$ 15,997,145$ (5,824,968) 190,788 (5,634,180)
General revenues: DMV fees 4,635,715 - 4,635,715 Sales Tax 1,541,388 - 1,541,388 Grants - not restricted to specific activities 631,080 - 631,080
Interest 25,241 7,973 33,214 Gain on sale of capital assets 16,270 16,270 Penalties/settlements 569,708 - 569,708
Total general revenue 7,419,402 7,973 7,427,375 Change in Net Position 1,594,434 198,761 1,793,195 Net Position - As Originally Reported 20,290,606 1,783,792 22,074,398 Prior Period Adjustment (7,287,421) - (7,287,421) Begining Net Position - As Restated 13,003,185 1,783,792 14,786,977 Net Position - ending balance 14,597,619$ 1,982,553$ 16,580,172$
Functions

Sacramento Metropolitan Air Quality Management DistrictFund Financial StatementsBalance Sheet – Governmental FundsJune 30, 2015
The accompanying notes are an integral part of these financial statements. 14
ASSETS General
Emission
Technology
Total
Governmental
Assets
Cash and equivalents 11,408,147$ 16,719,028$ 28,127,175$
Accounts receivables 1,777,040 621,481 2,398,521
Prepaid expenses 155,110 - 155,110
Total assets 13,340,297$ 17,340,509$ 30,680,806$
LIABILITIES AND FUND BALANCE
Liabilities
Accounts payable 774,099$ 810,683$ 1,584,782$
Accrued wages and benefits payable 94,462 - 94,462
Unearned revenue 313,474 6,979,874 7,293,348
Total liabilities 1,182,035 7,790,557 8,972,592
Fund balance
Nonspendable 155,110 - 155,110
Restricted for:
Emission Technology incentives - 9,549,952 9,549,952
Land Use Mitigation 1,580,308 - 1,580,308
Mobile Source/Air Monitoring 8,231,798 - 8,231,798
SEED 85,654 - 85,654
Air Toxics 49,819 - 49,819
Stationary Source Permitting 339,695 - 339,695
Assigned
Contingency 320,000 - 320,000
Unassigned 1,395,878 - 1,395,878
Total Fund Balances 12,158,262 9,549,952 21,708,214
Total liabilities and fund balances 13,340,297$ 17,340,509$ 30,680,806$

Sacramento Metropolitan Air Quality Management DistrictFund Financial StatementsReconciliation of the Governmental Funds Balance Sheet to the Statement of Net PositionJune 30, 2015
The accompanying notes are an integral part of these financial statements. 15
21,708,214$
Capital assets at historical cost: 2,952,261$
Accumulated depreciation: (2,159,584)
792,677
Net pension liability (6,489,889)
Compensated absences payable (924,656)
(7,414,545)
Deferred outflows of resources relating to pensions 1,190,342
Deferred inflows of resources relating to pensions (1,679,069)
(488,727)
14,597,619$
Long-term liabilities: In governmental funds, Only current liabilities
are reported. In the statement of net position, all liabilities,
including long-term liabilities, are reported. Long-term liabilities
relating to governmental activities consist of:
Net position of governmental activities:
Fund balances - total governmental fund
Amounts reported for governmental activities in the Statement of
Net Position are different because:
Capital assets: In governmental funds, only current assets are
reported. In the statement of net position, all assets are reported,
includung capital assets and accumulated depreciation.
Deferred outflows and inflows of resources relating to pensions: In
goverrnmental funds, deferred outflows and inflows of resources
relating to pensions are not reported because they are applicable
to future periods. In the statement of net position, deferred
outflows and inflows of resources relating to pensions are reported.

Sacramento Metropolitan Air Quality Management DistrictFund Financial StatementsStatement of Revenues, Expenditures and Changes in Fund Balance – Governmental Fundsfor the Year Ended June 30, 2015
The accompanying notes are an integral part of these financial statements. 16
Revenues: General
Emission
Technology
Total
Governmental
DMV surcharge 4,742,024$ 2,250,164$ 6,992,188$
Sales/use tax 1,541,388 - 1,541,388
Permits and fees 7,416,470 - 7,416,470
Local government aid 648,910 - 648,910
State subvention 911,207 9,684,278 10,595,485
Federal grants 1,956,707 1,141,828 3,098,535
Interest 25,241 35,131 60,372
Total revenues 17,241,947 13,111,401 30,353,348
Expenditures:
Stationary source activities 6,016,226 - 6,016,226
Mobile source activities 3,093,146 11,838,997 14,932,143
Program coordination activities 3,943,621 - 3,943,621
Strategic planning activities 3,918,801 - 3,918,801
Capital outlay 239,282 - 239,282
Total expenditures 17,211,076 11,838,997 29,050,073
Other Financing Sources (Uses)
Gain on sale of capital assets 16,270 - 16,270
Net change in fund balances 47,141 1,272,404 1,319,545
Fund balances, July 1, 2014 12,111,122 8,277,548 20,388,670
Fund balances, June 30, 2015 12,158,263$ 9,549,952$ 21,708,215$

Sacramento Metropolitan Air Quality Management DistrictFund Financial StatementsReconciliation of the Governmental Funds Statement of Revenues, Expenditures and Changes in Fund Balances to the Statement of Activitiesfor the Year Ended June 30, 2015
The accompanying notes are an integral part of these financial statements. 17
Net change in fund balances - total governmental funds 1,319,545$
Governmental funds report capital outlay as expenditures. However,
in the Government-wide Statement of Activities the cost of those
assets is allocated over their estimated useful lives and reported as
deprciation expense. This is the amount of capital outlay recorded in
the current period. 239,282
Depreciation expense on capital assets is reported in the
Government-wide Statement of Activities, but they do not require the
use of current financial resources. Therfore, depreciation expense is
not reported as expenditures in governmental funds. (211,551)
Pensions: In governmental funds, pension costs are recognized
when employer contributions are made. In the statement of
activities, pension costs are recognized on the accrual basis. This
year, the difference between accrual-basis pension costs and actual
employer contributions was: 308,805
Changes in long-term compensated absences are reported in the
Government-wide Statement of Activities, but they do not require the
use of current financial resources. Therefore they are not reported as
expenditures in governmental funds. (61,647)
1,594,434$
Amounts reported for governmental activities in the Statement of Activities
are different because:
Changes in net position of governmental activities:
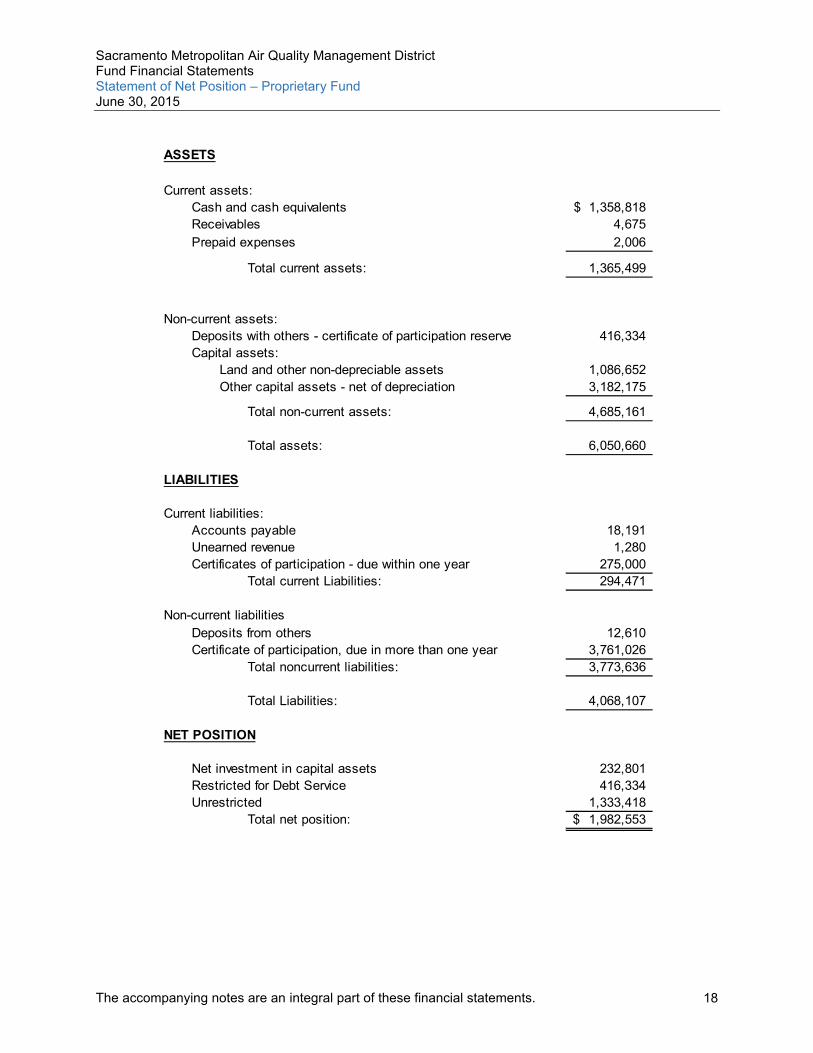
Sacramento Metropolitan Air Quality Management DistrictFund Financial StatementsStatement of Net Position – Proprietary FundJune 30, 2015
The accompanying notes are an integral part of these financial statements. 18
Current assets:
Cash and cash equivalents 1,358,818$
Receivables 4,675
Prepaid expenses 2,006
Total current assets: 1,365,499
Non-current assets:
Deposits with others - certificate of participation reserve 416,334
Capital assets:
Land and other non-depreciable assets 1,086,652
Other capital assets - net of depreciation 3,182,175
Total non-current assets: 4,685,161
Total assets: 6,050,660
Current liabilities:
Accounts payable 18,191
Unearned revenue 1,280
Certificates of participation - due within one year 275,000
Total current Liabilities: 294,471
Non-current liabilities
Deposits from others 12,610
Certificate of participation, due in more than one year 3,761,026
Total noncurrent liabilities: 3,773,636
Total liabilities Total Liabilities: 4,068,107
Net investment in capital assets 232,801
Restricted for Debt Service 416,334
Unrestricted 1,333,418
Total net position: 1,982,553$
ASSETS
LIABILITIES
NET POSITION

Sacramento Metropolitan Air Quality Management DistrictFund Financial StatementsStatement of Revenues, Expenses and Changes in Net Position – Proprietary Fundfor the Year Ended June 30, 2015
The accompanying notes are an integral part of these financial statements. 19
Operating revenues:
Rental income 832,323$
Parking income 56,269
Total operating revenue 888,592
Operating expenses:
Repairs and maintenance costs 128,036
Utilities, security and communications 85,338
Management fees 105,433
Parking lot operations 84,473
Depreciation expense 152,467
Other expense 1,888
Total operating expenses 557,635
Operating income 330,957
Non-operating revenues and expenses:
Interest income 7,973
Interest expense (140,169)
Net non-operating revenues (expenses) (132,196)
Changes in net position 198,761
Net Position, July 1, 2014 1,783,792
Net Position, June 30, 2015 1,982,553$

Sacramento Metropolitan Air Quality Management District
Fund Financial StatementsStatement of Cash Flows – Proprietary Fundfor the Year Ended June 30, 2015
The accompanying notes are an integral part of these financial statements. 20
Cash flows from operating activities:
Cash received from rental activities 898,796$
Cash paid for goods and services (421,554)
Net cash provided by operating activities 477,242
Cash flows from capital and related financing activities:
Principal paid on capital debt (270,000)
Purchases of Capital assets (17,252)
Interest paid on long-term debt (140,169)
Net cash used for capital and related financing activities (427,421)
Cash flows from investing activities:
Interest and dividends received 3,025
Net cash provided by investing activities 3,025
Net increase in cash and cash equivalents 52,846
Beginning cash balance July 1, 2014 1,305,972
Ending cash balance June 30, 2015 1,358,818$
Reconciliation of operating income to net cash provided
by operating activities:
Operating income 330,957$
Adjustment to reconcile operating income to net cash
provided by operating activities:
Depreciation expense 152,467
Effects of changes in :
Accounts receivable (3,042)
Accounts payable (15,727)
Unearned Revenue 636
Prepaids (659)
Deposits from others 12,610
Net cash provided by operating activities 477,242$

Sacramento Metropolitan Air Quality Management DistrictNotes to the Financial Statementsfor the Year Ended June 30, 2015
21
1. SUMMARY OF SIGNIFICANT ACCOUNTING POLICIES
A. ACCOUNTING POLICIES
The Sacramento Metropolitan Air Quality Management District (District) accounts for its financial transactions in accordance with accounting principles generally accepted in the United States of America as prescribed by the Governmental Accounting Standards Board (GASB) and the American Institute of Certified Public Accountants (AICPA).
B. REPORTING ENTITY
The Sacramento Air Pollution Control District was formed by the Sacramento County Board of Supervisors in December of 1959. In July of 1996 the Sacramento Metropolitan Air Quality Management District (SMAQMD) was created under Health and Safety Code Sections 40960 ET. seq. to monitor, promote and improve air quality in the County of Sacramento. The District functions under the oversight of its elected fourteen-member Board of Directors. The District has no component units.
C. BASIS OF PRESENTATION
Government-wide financial statements
The statement of net position and the statement of activities display information about the District as a whole. These statements include the financial activities of the primary government, represented by activity type (e.g. governmental, business).
The government-wide statements are prepared using the economic resources measurement focus. This is the same approach used in the preparation of the proprietary fund financial statements, but differs from the manner in which governmental fund financial statements are prepared. Therefore, reconciliations, containing brief explanations to better identify the relationship between the government-wide statements and the statements for governmental funds, are included.
The government-wide statement of net position records all of the District’s assets and liabilities including capital assets, long-term liabilities, deferred inflows and deferred outflows.
The government-wide statement of activities presents a comparison between total expenses and program revenues for each function or program of the District’s governmental activities. Total expenses are those that are associated with or allocated to a service, program, or department and are therefore identifiable to a particular function. Program revenues include charges paid by the recipients of goods or services offered by a program, as well as grants and contributions that are restricted to meeting the operational requirements of a particular program. Revenues which are not classified as program revenues are presented as general revenues of the District.
Sacramento Metropolitan Air Quality Management DistrictNotes to the Financial Statementsfor the Year Ended June 30, 2015
22
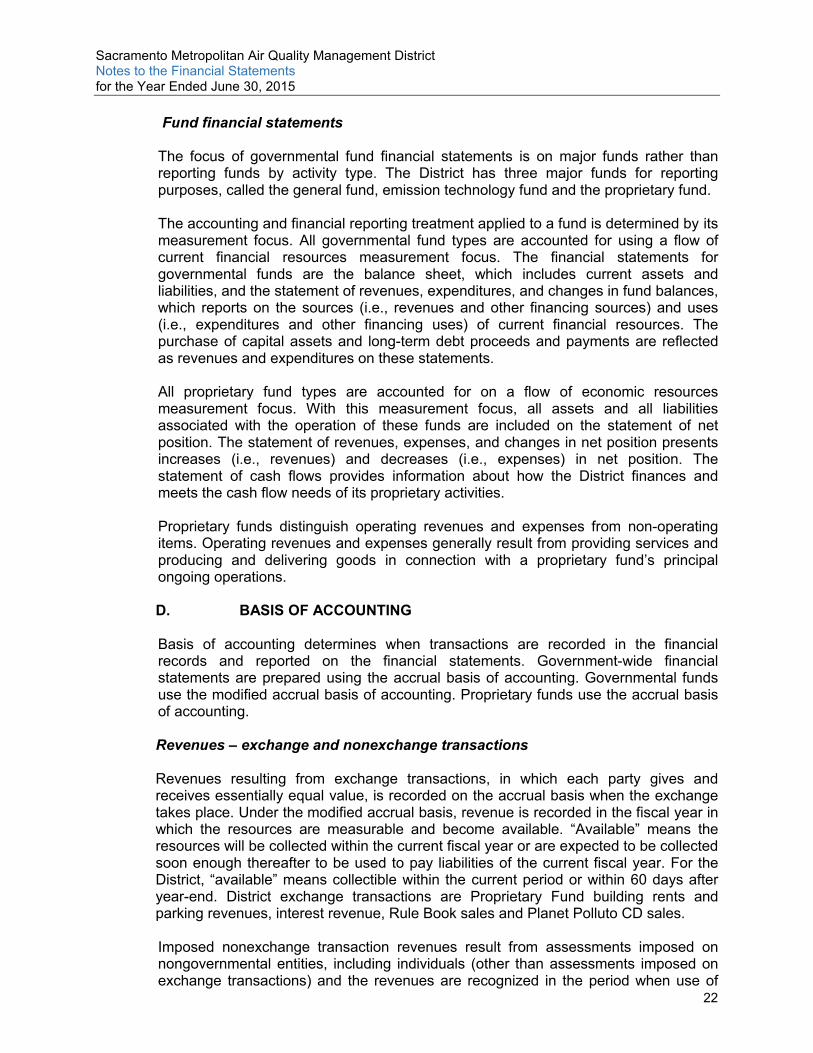
Fund financial statements
The focus of governmental fund financial statements is on major funds rather than reporting funds by activity type. The District has three major funds for reporting purposes, called the general fund, emission technology fund and the proprietary fund.
The accounting and financial reporting treatment applied to a fund is determined by its measurement focus. All governmental fund types are accounted for using a flow of current financial resources measurement focus. The financial statements for governmental funds are the balance sheet, which includes current assets and liabilities, and the statement of revenues, expenditures, and changes in fund balances, which reports on the sources (i.e., revenues and other financing sources) and uses (i.e., expenditures and other financing uses) of current financial resources. The purchase of capital assets and long-term debt proceeds and payments are reflected as revenues and expenditures on these statements.
All proprietary fund types are accounted for on a flow of economic resources measurement focus. With this measurement focus, all assets and all liabilities associated with the operation of these funds are included on the statement of net position. The statement of revenues, expenses, and changes in net position presents increases (i.e., revenues) and decreases (i.e., expenses) in net position. The statement of cash flows provides information about how the District finances and meets the cash flow needs of its proprietary activities.
Proprietary funds distinguish operating revenues and expenses from non-operating items. Operating revenues and expenses generally result from providing services andproducing and delivering goods in connection with a proprietary fund’s principal ongoing operations.
D. BASIS OF ACCOUNTING
Basis of accounting determines when transactions are recorded in the financial records and reported on the financial statements. Government-wide financial statements are prepared using the accrual basis of accounting. Governmental funds use the modified accrual basis of accounting. Proprietary funds use the accrual basis of accounting.
Revenues – exchange and nonexchange transactions
Revenues resulting from exchange transactions, in which each party gives and receives essentially equal value, is recorded on the accrual basis when the exchange takes place. Under the modified accrual basis, revenue is recorded in the fiscal year in which the resources are measurable and become available. “Available” means the resources will be collected within the current fiscal year or are expected to be collected soon enough thereafter to be used to pay liabilities of the current fiscal year. For the District, “available” means collectible within the current period or within 60 days after year-end. District exchange transactions are Proprietary Fund building rents and parking revenues, interest revenue, Rule Book sales and Planet Polluto CD sales.
Imposed nonexchange transaction revenues result from assessments imposed on nongovernmental entities, including individuals (other than assessments imposed on exchange transactions) and the revenues are recognized in the period when use of
Sacramento Metropolitan Air Quality Management DistrictNotes to the Financial Statementsfor the Year Ended June 30, 2015
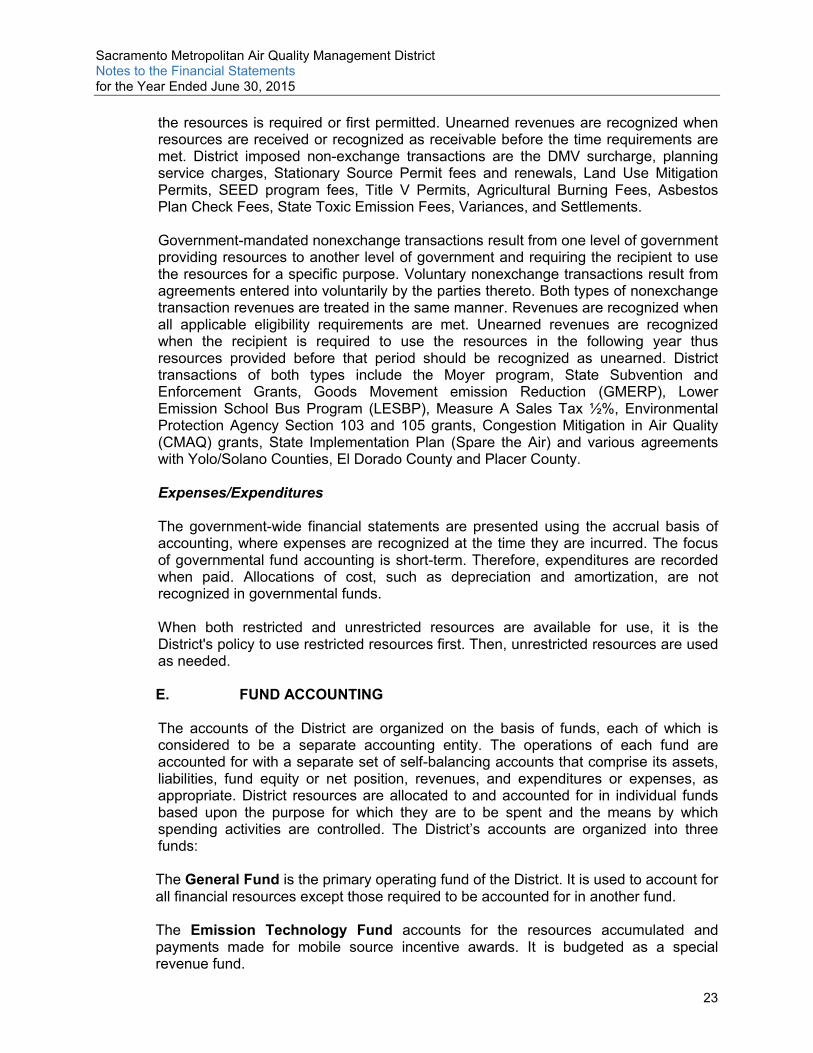
23
the resources is required or first permitted. Unearned revenues are recognized when resources are received or recognized as receivable before the time requirements are met. District imposed non-exchange transactions are the DMV surcharge, planning service charges, Stationary Source Permit fees and renewals, Land Use Mitigation Permits, SEED program fees, Title V Permits, Agricultural Burning Fees, Asbestos Plan Check Fees, State Toxic Emission Fees, Variances, and Settlements.
Government-mandated nonexchange transactions result from one level of government providing resources to another level of government and requiring the recipient to use the resources for a specific purpose. Voluntary nonexchange transactions result from agreements entered into voluntarily by the parties thereto. Both types of nonexchange transaction revenues are treated in the same manner. Revenues are recognized when all applicable eligibility requirements are met. Unearned revenues are recognized when the recipient is required to use the resources in the following year thus resources provided before that period should be recognized as unearned. District transactions of both types include the Moyer program, State Subvention and Enforcement Grants, Goods Movement emission Reduction (GMERP), Lower Emission School Bus Program (LESBP), Measure A Sales Tax ½%, Environmental Protection Agency Section 103 and 105 grants, Congestion Mitigation in Air Quality (CMAQ) grants, State Implementation Plan (Spare the Air) and various agreements with Yolo/Solano Counties, El Dorado County and Placer County.
Expenses/Expenditures
The government-wide financial statements are presented using the accrual basis of accounting, where expenses are recognized at the time they are incurred. The focus of governmental fund accounting is short-term. Therefore, expenditures are recorded when paid. Allocations of cost, such as depreciation and amortization, are not recognized in governmental funds.
When both restricted and unrestricted resources are available for use, it is the District's policy to use restricted resources first. Then, unrestricted resources are used as needed.
E. FUND ACCOUNTING
The accounts of the District are organized on the basis of funds, each of which is considered to be a separate accounting entity. The operations of each fund are accounted for with a separate set of self-balancing accounts that comprise its assets, liabilities, fund equity or net position, revenues, and expenditures or expenses, as appropriate. District resources are allocated to and accounted for in individual funds based upon the purpose for which they are to be spent and the means by which spending activities are controlled. The District’s accounts are organized into three funds:
The General Fund is the primary operating fund of the District. It is used to account for all financial resources except those required to be accounted for in another fund.
The Emission Technology Fund accounts for the resources accumulated and payments made for mobile source incentive awards. It is budgeted as a special revenue fund.

Sacramento Metropolitan Air Quality Management DistrictNotes to the Financial Statementsfor the Year Ended June 30, 2015
24
The Proprietary Fund reports the ownership and operational revenues and expenses of the District’s building along with the long-term debt obligations.
F. BUDGETS AND BUDGETARY ACCOUNTING
Annual budgets, as required by state statues, are adopted on a basis of accounting consistent with generally accepted accounting principles for the general fund.
On or before the last day in February of each year, all divisions of the District submit budget packages to the administrative services manager so that a budget may be prepared. At the May Board of Directors’ meeting, the proposed budget is presented to the Board for review. As required by air pollution control laws, noticing is done 30 days prior to the public hearing. The Board holds public hearings and a final budget must be prepared and adopted no later than the June meeting.
The appropriated budget is prepared by fund, function and division. The District’s division managers may make transfers of appropriations within an object (e.g. salaries and benefits, services and supplies, capital outlay and interfund charges). Transfers of appropriations between objects require the approval of the Board. The legal level of budgetary control is the object level.
G. CASH AND CASH EQUIVALENTS
The District considers all highly liquid investments with a maturity of three months or less at the time of purchase to be cash equivalents.
H. CAPITAL ASSETS
Capital assets are those purchased or acquired with an original cost of $5,000 or more and a useful life of greater than one year. They are reported at historical cost or estimated historical cost. Additions, improvements, and other capital outlays that significantly extend the useful life of an asset are capitalized. Other costs for repairs and maintenance are expensed as incurred.
Depreciation on all assets is provided on a straight-line basis over the following estimated useful lives:
Asset Class Years
Machinery and equipment 2-20Buildings 39
I. COMPENSATED ABSENCES
Accumulated unpaid employee vacation benefits and compensated time-off for certain employees in lieu of overtime compensation and/or working on holidays per bargaining agreements are recognized as liabilities of the District on the government-wide financial statements. Compensated absences are liquidated by the General Fund.
Accumulated sick leave benefits are not recognized as liabilities of the District. The District's policy is to record sick leave as an operating expenditure in the period taken

Sacramento Metropolitan Air Quality Management DistrictNotes to the Financial Statementsfor the Year Ended June 30, 2015
25
since such benefits do not vest nor is payment probable; however, a portion of sick leave is added to the creditable service period for calculation of retirement benefits when the employee retires.
J. DEFERRED INFLOW/OUTFLOW OF RESOURCES
In addition to assets, the statement of net position reports separate sections for deferred outflows of resources and deferred inflows of resources. Deferred outflows of resources represent a consumption of resources that apples to a future period(s) and will not be recognized as an outflow of resources (expense) until then. Conversely, deferred inflows of resources represent an acquisition of resources that applies to a future period(s) and will not be recognized as an inflow of resources (revenue) until that time.
Contributions made to the District’s pension plan(s) after the measurement date but before the fiscal year end are recorded as a deferred outflow of resources and will reduce the net position liability in the next fiscal year.
Additional factors involved in the calculation of the District’s pension expense and net position liability include the differences between expected and actual experience,changes in assumptions, differences between projected and actual investment earnings, changes in proportion, and differences between the Districts contributions and proportionate share of contributions. These factors are recorded as deferred outflows and inflows of resources and amortized over various periods.
K. PENSIONS LIABILITY
For purposes of measuring the net position liability and deferred outflows/inflows of resources related to pensions, and pension expense, information about the fiduciary net position of the District’s California Public Employees’ Retirement System (CalPERS) and additions to/deductions from the Plan’s fiduciary net position have been determined on the same basis as they are reported by CalPERS. For this purpose, benefit payments (including refunds of employee contributions) are recognized when due and payable in accordance with the benefit terms. Investments are reported at fair value.
L. CHANGE IN ACCOUNTING PRINCIPLE
In June 2012, the GASB issued Statement No. 68, Accounting and Financial Reporting for Pensions – An Amendment of GASB Statement No. 27. The primary objective of this Statement is to improve accounting and financial reporting by state and local governments for pensions. It also improves information provided by state and local governmental employers about financial support for pensions that is provided by other entities.
This Statement replaces the requirements of Statement No. 27, Accounting for Pensions by State and Local Governmental Employers, as well as the requirements of Statement No. 50, Pension Disclosures, as they relate to pensions that are provided through pension plans administered as trusts or equivalent arrangements (hereafter jointly referred to as trusts) that meet certain criteria. The requirements of Statements 27 and 50 remain applicable for pensions that are not covered by the scope of this Statement.

Sacramento Metropolitan Air Quality Management DistrictNotes to the Financial Statementsfor the Year Ended June 30, 2015
26
The scope of this Statement addresses accounting and financial reporting for pensions that are provided to the employees of state and local governmental employers through pension plans that are administered through trusts that have the following characteristics: contributions from employers and nonemployer contributing entities to the pension plan and earnings on those contributions are irrevocable; pension plan assets are dedicated to providing pensions to plan members in accordance with the benefit terms; and pension plan assets are legally protected from the creditors of employers, nonemployer contributing entities, and the pension plan administrator. If the plan is a defined benefit pension plan, plan assets also are legally protected from creditors of the plan members.
This Statement establishes standards for measuring and recognizing liabilities, deferred outflows of resources, and deferred inflows of resources, and expense/expenditures. For defined benefit pensions, this Statement identifies the methods and assumptions that should be used to project benefit payments, discount projected benefit payments to their actuarial present value, and attribute the present value to periods of employee service.
For defined benefit pensions, this Statement requires the liability of employers and nonemployer contributing entities to employees for defined benefit pensions (net pension liability) to be measured as the portion of the present value of projected benefit payments to be provided through the pension plan to current active and inactive employees that is attributed to those employees’ past periods of service (total pension liability), less the amount of the pension plan’s fiduciary net position.
As of June 30, 2015, according to GASB 68, the District’s total pension liability must be recognized. Therefore, the previous pension liability as of June 30, 2014 in the amount of $7,287,421 has been shown as a restatement of net position on the Statement of Activities as a separate line item. The effect of the restatement is recognition of a net pension liability of $8,353,783 and deferred outflows of $1,066,362.
In November 2013, GASB issued Statement No. 71, Pension Transition for Contributions Made Subsequent To the Measurement Date. The objective of this Statement is to address an issue regarding application of the transition provisions of Statement No. 68. The issue relates to amounts associated with contributions, if any, made by a state or local government employer or nonemployer contributing entity to a defined benefit pension plan after the measurement date of the governments’ beginning net pension liability. This Statement amends paragraph 137 of Statement No. 68 to require that, at transition, a government recognize a beginning deferred outflow of resources for its pension contributions, if any, made subsequent to the measurement date of the beginning net pension liability. Statement No. 68, as amended, continues to require that beginning balances for other deferred outflows of resources and deferred inflows of resources related to pensions be reported at transition only if it is practical to determine all such amounts. The provisions of this Statement are required to be applied simultaneously with the provisions of Statement No. 68 and are effective for the District’s fiscal year ending June 30, 2015.
As of June 30, 2015, according to GASB 71, the District had contributions subsequent to the measurement date. As a result of the contributions, in the current year the District had deferred outflows of $1,190,342 and deferred inflows of $1,679,069 resulting from the implementation of GASB 71.

Sacramento Metropolitan Air Quality Management DistrictNotes to the Financial Statementsfor the Year Ended June 30, 2015
27
M. FUND BALANCE
In accordance with Governmental Accounting Standards Board (GASB) Statement No. 54, “Fund Balance Reporting and Governmental Fund type Definitions”, the District is required to report fund balances in the following categories: Nonspendable, Restricted, Committed, Assigned and/or Unassigned.
Nonspendable Fund Balance reflects assets not in spendable form, either because they will never convert to cash (e.g. prepaid expense) or must remain intact pursuant to legal or contractual requirements.
Restricted Fund Balance reflects amounts that can be spent only for the specific purposes stipulated by constitution, external resource providers, or through enabling legislation.
Committed Fund Balance reflects amounts that can be used only for the specific purposes determined by a formal action of the government’s highest level of decision-making authority: the Board of Directors. Commitments may be established, modified, or rescinded only through resolutions approved by the Board of Directors.
Assigned Fund Balance reflects amounts intended to be used only for specific purposes but do not meet the criteria to be classified as restricted or committed. Under the District’s adopted policy, only the Board of Directors is authorized to assign amounts for specific purposes.
Unassigned Fund Balance represents the residual classification for the government’s general fund and includes all spendable amounts not contained in other classifications.
When expenditures are incurred for purposes of which restricted, committed, assigned and unassigned fund balances are available, the District considers restricted funds to have been spent first, followed by committed, assigned and unassigned, respectively.
N. LONG-TERM LIABILITIES
The District reports long-term liabilities of governmental funds at face value in the government-wide financial statements, and long-term liabilities payable from proprietary funds are reported in the proprietary fund financial statements and government-wide financial statements. Bond premiums and discounts are deferred and amortized over the life of the bonds using the straight line method.
In the governmental fund financial statements, debt premiums, discounts, and issuance costs are recognized during the current period. The face amount of debt issued and any premiums received are reported as other financing sources while discounts are reported as other financing uses. Issuance costs are reported as debt service expenditures.

Sacramento Metropolitan Air Quality Management DistrictNotes to the Financial Statementsfor the Year Ended June 30, 2015
28
O. UNEARNED REVENUE
Under both the accrual and the modified accrual basis of accounting, revenue may be recognized only when it is earned. Revenue that is classified as unearned has been received but is unearned at June 30, 2015. The makeup of unearned revenue is
ProgramGovernmental
FundsProprietary
FundsLand Use $ 313,474 $ -GMERP 6,979,874 -
Miscellaneous 1,280Total $ 7,293,348 $ 1,280
P. REVENUE FROM BUILDING LEASES
Lease revenues reported in the proprietary fund are recorded on a straight-line basis where the sums of all the rents payable over the life of a tenant lease are reported pro-ratably over the life of the lease.
Q. ELIMINATIONS AND RECLASSIFICATIONS
In the process of aggregating data for the government-wide statements, some amounts reported as interfund activity and balances in the fund financial statements, were eliminated or reclassified. Interfund receivables and payables were eliminated to minimize the “grossing up” effect on assets and liabilities within the government activities column.
R. USE OF ESTIMATES
Management is called upon to use estimates and assumptions. These estimates and assumptions may affect the reported amounts of assets and liabilities and disclosure of contingent assets and liabilities at the date of the financial statements and the reported amounts of revenues and expenditures during the reporting period. Actual results may differ from those estimates.
S. RECLASSIFICATIONS
Certain reclassifications have been made to the prior year balances to conform to the current year presentation.
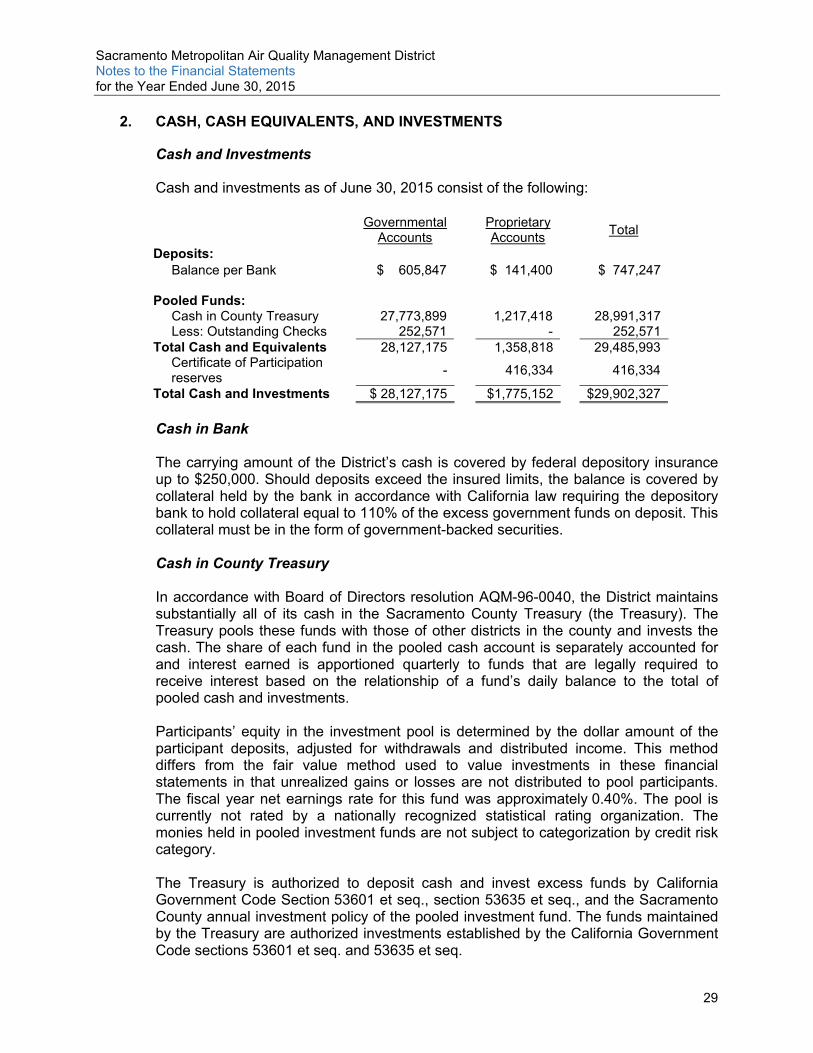
Sacramento Metropolitan Air Quality Management DistrictNotes to the Financial Statementsfor the Year Ended June 30, 2015
29
2. CASH, CASH EQUIVALENTS, AND INVESTMENTS
Cash and Investments
Cash and investments as of June 30, 2015 consist of the following:
Governmental Accounts
Proprietary Accounts
Total
Deposits:Balance per Bank $ 605,847 $ 141,400 $ 747,247
Pooled Funds:Cash in County Treasury 27,773,899 1,217,418 28,991,317Less: Outstanding Checks 252,571 - 252,571
Total Cash and Equivalents 28,127,175 1,358,818 29,485,993Certificate of Participationreserves
- 416,334 416,334
Total Cash and Investments $ 28,127,175 $1,775,152 $29,902,327
Cash in Bank
The carrying amount of the District’s cash is covered by federal depository insurance up to $250,000. Should deposits exceed the insured limits, the balance is covered by collateral held by the bank in accordance with California law requiring the depository bank to hold collateral equal to 110% of the excess government funds on deposit. This collateral must be in the form of government-backed securities.
Cash in County Treasury
In accordance with Board of Directors resolution AQM-96-0040, the District maintains substantially all of its cash in the Sacramento County Treasury (the Treasury). The Treasury pools these funds with those of other districts in the county and invests the cash. The share of each fund in the pooled cash account is separately accounted for and interest earned is apportioned quarterly to funds that are legally required to receive interest based on the relationship of a fund’s daily balance to the total of pooled cash and investments.
Participants’ equity in the investment pool is determined by the dollar amount of the participant deposits, adjusted for withdrawals and distributed income. This method differs from the fair value method used to value investments in these financial statements in that unrealized gains or losses are not distributed to pool participants. The fiscal year net earnings rate for this fund was approximately 0.40%. The pool is currently not rated by a nationally recognized statistical rating organization. The monies held in pooled investment funds are not subject to categorization by credit risk category.
The Treasury is authorized to deposit cash and invest excess funds by California Government Code Section 53601 et seq., section 53635 et seq., and the Sacramento County annual investment policy of the pooled investment fund. The funds maintained by the Treasury are authorized investments established by the California Government Code sections 53601 et seq. and 53635 et seq.

Sacramento Metropolitan Air Quality Management DistrictNotes to the Financial Statementsfor the Year Ended June 30, 2015
30
Interest Rate Risk
The District’s investment policy limits investment maturities as a means of managing its exposure to fair value losses arising from increasing interest rates. Investments are generally limited to five years or less. At the end of June 30, 2015, Treasury’s investments are in accordance with the District’s investment policy. The Treasury’s investment has an average days-to-maturity of 262 days and yields 0.41% as of June 30, 2015.
Credit Risk
Except for municipal obligations and Community Reinvestment Act (CRA) bank deposits and certificates of deposit, the issuer’s short-term credit ratings shall be at or above A-1 by Standard & Poor’s, P-1 by Moody’s and, if available, F 1 by Fitch, and the issuer’s long-term credit ratings shall be at or above A by Standard & Poor’s and A 2 by Moody’s, and, if available, A by Fitch. Municipal obligations shall be at or above a short-term rating of SP-1 by Standard & Poor’s, MIGI by Moody’s, and, if available, F1 by Fitch. In addition, domestic banks are limited to those with a Fitch Individual bank rating of A or better, without regard to modifiers.
Investments Authorized by the District’s Investment Policy
The table below identifies the investment types authorized for the District by the California Government Code Section 53601. This table also identifies certain provisions of the California Government Code that address interest rate risk, credit risk, and concentration of credit risk.
Authorized Investment TypeMaximum Maturity
Maximum Percentage of Portfolio
Maximum Investment in One Issuer
U.S. Treasury Notes & Agency Obligations 5 years 100% N/A
Washington Supranational Obligations 5 years 30% 10%
Municipal Notes 5 years 80% 10%
Registered State Warrants 5 years 80% 10%
Bankers Acceptances 180 days 40% 10%
Commercial Paper 270 days 40% 10%
Negotiable Certificates of Deposit 180 days 30% 10%
CRA Bank Deposit/Certificates of Deposit 1 year 30% 10%
Repurchase Agreements 1 year 30% 10%
Reverse Repurchase Agreements 92 days 20% 10%
Medium-Term Corporate Notes 180 days 30% 10%
Collateralized Mortgage Obligations 180 days 20% 10%
Local Agency Investment Fund (LAIF) N/A $50 million 10%
3. INVESTMENTS AUTHORIZED BY DEBT AGREEMENTS
Investments of debt proceeds held by the bond trustee, Certificate of Participation (COP) Reserve in the amount of $416,334 are included in Business-type Activities as deposits with others. These moneys are governed by provisions of the debt

Sacramento Metropolitan Air Quality Management DistrictNotes to the Financial Statementsfor the Year Ended June 30, 2015
31
agreements, rather than the general provisions of the California Government Code or the District’s investment policy.
Moneys in the COP Reserve will at all times be in the amount of the Reserve Requirement. The Reserve Requirement is defined as , the lesser of (i) 10% of the original principal amount, (ii) an amount equal to the maximum annual Lease payment payable in a Certificate Year by the District, or (iii) 125% of the average annual lease payment.
4. ACCOUNTS RECEIVABLE
Accounts receivable consisted of the following as of June 30, 2015:
Governmental Funds:Interest $ 60,372DMV Surcharge 1,223,258Federal and State Grants 770,072Mutual Settlement/Fines 54,150Permits and Fees 135,039Local Government Aid 146,672Miscellaneous 8,958
Total receivables $2,398,521
Proprietary Fund:Miscellaneous $ 4,675
5. OPERATING LEASES
The District leases an air monitoring site under an operating lease. Total cost for the lease was $3,240 for the year ended June 30, 2015. The future minimum lease payments for this lease are as follows:
Year ending, June 30 Amount2016 $3,2762017 3,2762018 3,2762019 3,2762020 3,276
2021-2024 13,104
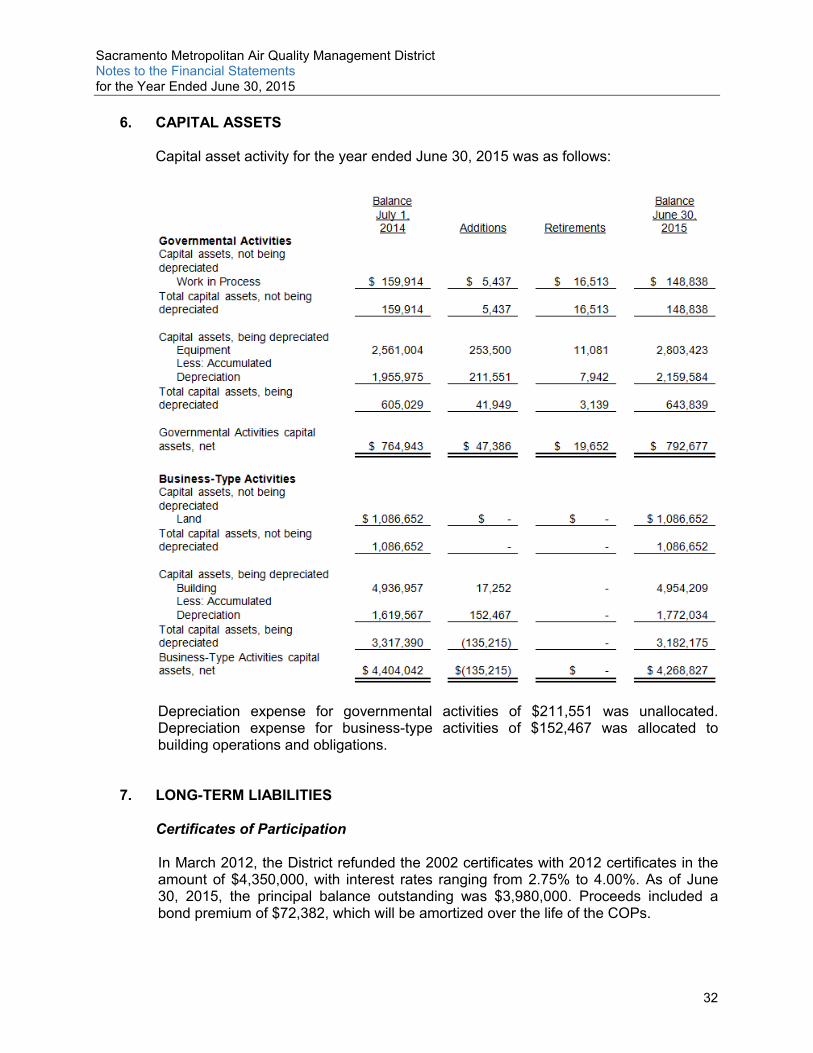
Sacramento Metropolitan Air Quality Management DistrictNotes to the Financial Statementsfor the Year Ended June 30, 2015
32
6. CAPITAL ASSETS
Capital asset activity for the year ended June 30, 2015 was as follows:
Depreciation expense for governmental activities of $211,551 was unallocated. Depreciation expense for business-type activities of $152,467 was allocated to building operations and obligations.
7. LONG-TERM LIABILITIES
Certificates of Participation
In March 2012, the District refunded the 2002 certificates with 2012 certificates in the amount of $4,350,000, with interest rates ranging from 2.75% to 4.00%. As of June 30, 2015, the principal balance outstanding was $3,980,000. Proceeds included a bond premium of $72,382, which will be amortized over the life of the COPs.

Sacramento Metropolitan Air Quality Management DistrictNotes to the Financial Statementsfor the Year Ended June 30, 2015
33
The certificates mature as follows:
Year Ending June 30, Principal Interest Total2016 $ 275,000 $ 130,631 $ 405,6312017 285,000 121,543 406,5432018 295,000 112,844 407,8442019 305,000 103,844 408,8442020 315,000 94,544 409,544
2021-2025 1,725,000 318,572 2,043,5722026-2027 780,000 31,400 811,400
$3,980,000.00 $913,378.00 $4,893,378.00Unamortized Premium 56,026 - 56,026
Totals $ 4,036,026 $ 913,378 $ 4,949,404
As of June 30, 2015 total interest expense for the COPs was $140,169, and principal paid on the COPs was $270,000.
Changes in Long-Term Liabilities
Long-term liability activity for the year ended June 30, 2015, was as follows:
Beginning Balance Additions Deductions
Ending Balance
Due Within One Year
Business-type activitiesCertificates of Participation $4,250,000 $ - $ 270,000 $3,980,000 $ 275,000
Governmental ActivitiesCompensated Absences $ 863,007 $942,717 $ 881,068 $ 924,656 $ 822,440
8. RISK MANAGEMENT/CLAIMS LIABILITIES
The District is exposed to various risks of loss related to theft of, damage to and destruction of assets; errors and omissions; and natural disasters for which the District is covered by commercial insurance purchased from independent third parties. There have been no significant changes in insurance coverage and no settlements or claims have been made in the last four years.
During the fiscal year ended June 30, 2015, the District insured with the Special District Risk Management Authority (SDRMA) for general liability, errors and omissions, workers’ compensation, and a variety of comprehensive coverage (See Note 9). The District also provides a selection of health insurance coverage and elective options for additional health related insurance coverage.
9. JOINT VENTURES (Joint Powers Agreement)
The District is a member of the Special District Risk Management Authority (SDRMA), through a Joint Power Agreement (JPA). The relationship between the District and the JPA is such that the JPA is not a component unit of the District for financial reporting purposes.

Sacramento Metropolitan Air Quality Management DistrictNotes to the Financial Statementsfor the Year Ended June 30, 2015
34
SDRMA arranges for and provides property, liability, error and omissions, auto liability, crime and fidelity, workers’ comp and boiler and machinery insurance to its members. The JPA is governed by a board consisting of a representative from each member district. The board controls the operations of the JPA, including selection of management and approval of operating budgets, independent of any influence by the member districts beyond their representation on the board. Each member district pays a premium commensurate with the level of coverage requested and shares surpluses and deficits proportionate to their participation in SDRMA.
Condensed audited financial information of SDRMA for the year ended June 30, 2015 is as follows:
Total Assets $ 107,630,328Deferred Outflow of Resources
973,962
Total Liabilities 59,619,796Deferred Inflow of Resources
294,368
Net Position $ 48,690,126
Total Revenues $ 57,016,861Total Expenses 60,652,085
Net Income (Loss) $ (3,635,224)
Complete audited financial statements for the JPA can be obtained by contacting SDRMA, 1112 I Street, Suite 300, Sacramento CA 95814.

Sacramento Metropolitan Air Quality Management DistrictNotes to the Financial Statementsfor the Year Ended June 30, 2015
35
Nature of Participation
Program
Deductible per Occurrence Annual Coverage Limit
General Liability $500 $10,000,000 Per Occurrence
Public Officials and Employees Errors
$0$10,000,000 Per Occurrence/Annual Aggregate
Personal Liability for Board Members/Directors
$500$500,000 Per Occurrence/Annual Aggregate per each elected /appointed Board Member/Director
Employment Practices Liability $0$10,000,000 Per Occurrence/General Aggregate
Employee Benefits Liability $0$10,000,000 Per Occurrence/General Aggregate
Employee Dishonesty Coverage
$0$400,000 Per Occurrence
Auto Liability $1,000 $10,000,000 Per Occurrence
Uninsured/Underinsured Motorist
$1,000$750,000 Each Accident
Property Coverage $0 $1,000,000,000 Each Occurrence
Boiler and Machinery Coverage $1,000 $100,000,000 Each Occurrence
Statutory Workers’ Comp $0 Statutory Per Occurrence
10. COMMITMENTS AND CONTINGENCIES
State and Federal Allowances, Awards, and Grants
The District has received state and federal funds for specific purposes that are subject to review and audit by the grantor agencies. Although such audits could generate expenditure disallowances under terms of the grants, it is believed that any required reimbursement would not be material.
11. EMPLOYEE RETIREMENT SYSTEMS
SCERS
On June 30, 1996, the District ceased participation in the Sacramento County Employees’ Retirement System (SCERS). Vested participants were given the option of withdrawing their account balances or leaving their balances within SCERS. The District retained liability for its share of the County’s bonded pension liability. The most recent actuarial valuation on June 30, 2013 determined that the District had a Net Pension Asset of $148,992.

Sacramento Metropolitan Air Quality Management DistrictNotes to the Financial Statementsfor the Year Ended June 30, 2015
36
CalPERS
Plan Description
Effective July 1, 1996, all qualified permanent and probationary employees began participating in the California Public Employee Retirement System (CalPERS), a cost-sharing multiple-employer defined benefit plan administered by CalPERS. Benefit provisions under the Plans are established by State statute and District resolution.CalPERS issues publicly available reports that include a full description of the pension plans regarding benefit provisions, assumptions and membership information that can be found on the CalPERS website.
CalPERS issues a separate Comprehensive Annual Financial Report. Copies of the CalPERS annual financial report may be obtained from the CalPERS Executive Office – 400 P Street, Sacramento CA 95814.
Benefits Provided
The benefits for public agencies are established by contract with CalPERS in accordance with the provisions of the Public Employees Retirement Law. All permanent part-time and full-time employees of the District are required to participate in CalPERS. CalPERS provides service retirement and disability benefits, annual cost of living adjustments and death benefits to plan members, who must be public employees and beneficiaries. Benefits are based on years of credited service, equal to one year of full time employment. Members with 5 years of total service are eligible to retire at age 50 or 52 (depending on the Plan) with statutorily reduced benefits.
The Plan’s provisions and benefits in effect at June 30, 2015, are summarized as follows:
Hire datePrior to
January 1, 2013On or after
January 1, 2013
Benefit formula 2% @ 55 2% @ 62Benefit vesting schedule 5 years of service 5 years of serviceBenefit payments Monthly for life Monthly for lifeRetirement age 50-63 or older 52-67 or olderMonthly benefits, as a % of eligible compensation 1.426% to 2.418% 1.0% to 2.5%Required employee contribution rates 7.0% 6.25%Required employer contribution rates 12.956% 6.25%Final Compensation 36 months 36 months
Funding Policy
Section 20814 (c) of the California Public Employees’ Retirement Law requires that the employer contribution rates for all public employers be determined on an annual basis by an actuary and shall be effective on July 1st following the notice of a change in rate.Funding contributions for the Plans are determined annually on an actuarial basis as of June 30th by CalPERS. The actuarially determined rate is the estimated amount necessary to finance the costs of benefits earned by employees during the year, with an additional amount to finance any unfunded accrued liability. The District is required to contribute the difference between the actuarially determined rate and the contribution rate of employees.

Sacramento Metropolitan Air Quality Management DistrictNotes to the Financial Statementsfor the Year Ended June 30, 2015
37
For the year ended June 30, 2015, the contributions recognized as part of pension expense for the Plan were $1,190,342.
Pension Liabilities, Pension Expenses and Deferred Outflows/Inflows of Resources Related to Pensions
As of June 30, 2015, the District reported a net pension liability for its proportionate share of the net pension liability of the Plan in the amount of $6,489,889.
The District’s net pension liability for the Plan is measured as the proportionate share of the net pension liability. The net pension liability of the Plan is measured as of June 30, 2014 (the measurement date), and the total pension liability for the Plan used to calculate the net pension liability was determined by an actuarial valuation as of June 30, 2013 rolled forward to June 30, 2014 using standard update procedures. The District’s proportion of the net pension liability was based on a projection of the District’s long-term share of contributions to the pension plan relative to the projected contributions of all participating employers, actuarially determined. The District’s proportionate share of the net pension liability for the Plan as of 2014 was as follows:
Proportion – June 30, 2014 0.10430%
For the year ended June 30, 2015, the District recognized pension expense of $881,537. At June 30, 2015, the District reported deferred outflows of resources and deferred inflows of resources related to pensions from the following sources:
Deferred Outflows Deferred Inflows
of Resources of Resources
Pension contributions subsequent to
measurement date 1,190,342$ -$
Differences between actual and expected
experience - -
Changes in assumptions - -
Net differences between projected and actual
earnings on plan investments - (1,772,314)
Change in employer's proportion - (178,376)
Differences between employer's proportion and
employer's proportion using actual
contributions - 271,621
Total 1,190,342$ (1,679,069)$

Sacramento Metropolitan Air Quality Management DistrictNotes to the Financial Statementsfor the Year Ended June 30, 2015
38
$1,190,342 reported as deferred outflows of resources related to contribution subsequent to the measurement date will be recognized as a reduction of the net pension liability in the year ended June 30, 2016. Other amounts reported as deferred inflows of resources related to pensions will be recognized as pension expense as follows:
Measurement Period Ended
June 302015 $(436,218)2016 (436,218)2017 (425,250)2018 (381,383)2019 -Thereafter -
Actuarial assumptions
For the measurement period ending June 30, 2014 (the measurement date), the total pension liability was determined by rolling forward the June 30, 2013 total pension liability. Both the June 30, 2013 total pension liability and the June 30, 2014 total pension liability were based on the following actuarial methods and assumptions:
Actuarial cost method Entry Age Normal in accordance with the requirements of GASB Statement No. 68
Actuarial AssumptionsDiscount Rate 7.50%Inflation 2.75%Salary Increases Varies by Entry Age and ServiceInvestment Rate of Return
7.50% Net of Pension Olan Investment and Administrative Expenses; includes inflation
Mortality rate Table1 Derived using CalPERS Membership Data for all Funds
Post Retirement Benefit Increase
Contract COLA up to 2.75% until PurchasingPower Protection Allowance applies, 2.75% thereafter
1The mortality table used was developed based on CalPERS specific data. The table
includes 20 years of mortality improvements using Society of Actuaries Scale BB.
All other actuarial assumptions used in the June 30, 2013 valuation were based on the results of an actuarial experience study for the fiscal years 1997 to 2011, including updates to salary increase, mortality and retirement rates. The Experience Study report can be obtained at CalPERS’ website under Forms and Publications.
Discount Rate
The discount rate used to measure the total pension liability was 7.50% for the Plan.To determine whether the municipal bond rate should be used in the calculation of a discount rate for each plan, CalPERS stress tested plan that would most likely in a discount rate that would be different from the actuarially assumed discount rate. Based

Sacramento Metropolitan Air Quality Management DistrictNotes to the Financial Statementsfor the Year Ended June 30, 2015
39
on the testing, none of the tested plans run out of assets. Therefore the current 7.50% discount rate is adequate and the use of the municipal bond rate calculation is not necessary. The long term expected discount rate of 7.50% will be applied to all plans in the Public Employees Retirement Fund (PERF). The stress results are presented are presented in a detailed report called “GASB Crossover Testing report” that can be obtained from the CalPERS website under GASB 68 section.
According to Paragraph 30 of Statement 68, the long-term discount rate should be determined without reduction for pension plan administrative expense. The 7.50% investment return assumption used in this accounting valuation is net of administrative expenses. Administrative expenses are assumed to be 15 basis points. An investment return excluding administrative expenses would have been 7.65%. Using this lower discount rate has resulted in a slightly higher Total Pension Liability and Net Pension Liability. CalPERS checked the materiality threshold for the difference in calculation and did not find it to be a material difference.
CalPERS is scheduled to review all actuarial assumptions as part of its regular Asset Liability Management (ALM) review cycle that is scheduled to be completed in February 2018. Any changes to the discount rate will require Board action and proper stakeholder outreach. For these reasons, CalPERS expects to continue using a discount rate net of administrative expenses for BASB 67 and 68 calculations through at least fiscal year 2017-18. CalPERS will continue to check the materiality of the difference in the calculation until such time as we have changed our methodology.
The long-term expected rate of return on pension plan investments was determined using a building-block method in which best estimate ranges of expected future real rates of return (expected returns, net of pension plan investment expense and inflation) are developed for each major asset class.
In determining the long-term expected rate of return, CalPERS took into account both short-term and long-term market return expectations as well as the expected pension fund cash flows. Using historical returns of all the funds’ asset classes, expected compound returns were calculated over the short-term (first 10 years) and the long-term (11-60 years) using a building block approach. Using the expected nominal returns for both short-term and long-term, the present value of benefits was calculated for each fund. The expected rate of return was set by calculating the single equivalent expected return that arrived at the same present value of benefits for cash flows as the one calculated using both short-term and long-term returns. The expected rate of return was then set equivalent to the single equivalent rate calculated above and rounded down to the nearest one quarter of one percent.

Sacramento Metropolitan Air Quality Management DistrictNotes to the Financial Statementsfor the Year Ended June 30, 2015
40
The table below reflects the long-term expected real rate of return by asset class. The rate of return was calculated using the capital market assumptions applied to determine the discount rate and assets allocation. These rates of return are net of administrative expenses.
Asset ClassNew Strategic
AllocationReal Return Years 1-10a
Real Return Years 11+b
Global Equity 47.0% 5.25% 5.71%Global Fixed Income 19.0% 0.99% 2.43%Inflation Sensitive 6.0% 0.45% 3.36%Private Equity 12.0% 6.83% 6.95%Real Estate 11.0% 4.50% 5.13%Infrastructure and Forest Land 3.0% 4.50% 5.09%Liquidity 2.0% -0.55% -1.05%Total 100%
a) An expected inflation of 2.5% used for this periodb) An expected inflation of 3.0% used for this period
Sensitivity of the Proportionate Share of the Net Pension Liability to Changes in the Discount Rate
The following table presents the District’s proportionate share of the net pension liability for the Plan, calculated using the discount rate for the plan, as well as what the District’s proportionate share of the net pension liability would be if it were calculated using a discount rate that is 1 percentage point lower and 1 percentage point higher than the current rate:
Discount Rate-1%
(6.50%)
Current Discount Rate
(7.50%)
Discount Rate +1%
(8.50%)Plan’s Net Pension Liability $10,773,840 $6,489,889 $2,934,616
12. OTHER POSTEMPLOYMENT BENEFITS (OPEB)
Plan Description
The District participates in a single-employer defined benefit medical plan administered by the California Public Employees’ Retirement System (CalPERS). The plan provides postemployment healthcare benefits to eligible retirees by contributing the minimum employer contributions (MEC) $122 in calendar year 2015. An additional $150 is contributed towards retiree health care costs based upon a Board approved employee contract. This coverage is available for employees who retire with the District on reaching normal retirement age. At June 30, 2015 the District had 13 retirees participating in the plan.
The District has established an irrevocable trust to pre-fund the OPEB Annual Required Contribution (ARC) with the California Employers’ Retiree Benefit Trust (CERBT).
Funding Policy
The Districts MEC is set by Government Code Section 22892. Effective January 1,

Sacramento Metropolitan Air Quality Management DistrictNotes to the Financial Statementsfor the Year Ended June 30, 2015
41
the CalPERS Board adjusts the rate to reflect any change in the medical care component of the Consumer Price Index (CPI).
The District is required to contribute the annual required contribution of the employer (ARC), an amount actuarially determined in accordance with the parameters of GASB Statement 45, which was initially implemented prospectively by the District. The ARC represents a level of funding that, if paid on an ongoing basis, is projected to cover normal cost each year and amortize any unfunded actuarial liabilities over a period not to exceed thirty years.
For the year ended June 30, 2015 the District funded $62,127 into the CERBT. The current ARC rate is 0.65% of annual covered payroll.
Annual OPEB Cost
For the year ended June 30, 2015, the District’s OPEB cost (expense) was $62,127which included the ARC and the Net OPEB Obligation at the beginning of the year.
The District’s annual OPEB costs, the annual OPEB cost contributed to the plan, and the net obligation for the fiscal year ended June 30, 2015 and the two preceding fiscal years were as follows:
Annual OPEB Cost $62,127Contributions Made 62,127Change in Net OPEB Obligation -Net OPEB Obligation (Asset) - Beginning -Net OPEB Obligation (Asset) - Ending -
Funded status and funding progress
As of June 30, 2015, the most recent actuarial valuation date, the funded status of the plan was as follows:
Actuarial accrued liability (AAL) $2,275,719Actuarial value of plan assets 1,455,178
Unfunded (overfunded) actuarial accrued liability (UAAL) $820,541
Funded ratio (actuarial value of plan assets/AAL) 64%Covered payroll (annual payroll of active employees by the plan) $ 9,386,000UAAL as a percentage of covered payroll 9%

Sacramento Metropolitan Air Quality Management DistrictNotes to the Financial Statementsfor the Year Ended June 30, 2015
42
Actuarial Methods and Assumptions
The ARC for the plan was determined as part of the June 30, 2013 actuarial valuation using the following methods and assumptions.
Actuarial cost method Entry age normalAmortization method Level percent of payrollAmortization period 15 year rollingInflation rate 3.00%Asset valuation method Market valueInvestment return 6.12%Projected salary increases 3.00%Healthcare cost trend rate 6.50% – 7.00%
13. DEFERRED COMPENSATION PLAN
The District offers its employees an elective deferred compensation plan created in accordance with Internal Revenue Code Section 457. The plan permits a portion of the employees’ salary to be deferred into future years. These funds are not available to employees until termination, retirement, death or unforeseen emergency.
The deferred compensation plan contributions are invested in various investment funds selected by the participating employees. The available investment options include a fixed return fund, stock fund, bond fund and a money market fund. Allamounts of compensation deferred under the plan and all income attributed to those amounts are held in trust for the exclusive benefit and use of plan participants and their beneficiaries per federal legislation dated January 1, 1999.
14. SUBSEQUENT EVENTS
Management has reviewed its financial statements and evaluated subsequent events for the period of time from its year ended June 30, 2015 through December 29, 2015, the date the financial statements were issued. Management is not aware of any subsequent events that would require recognition or disclosure in the accompanying financial statements.

REQUIRED SUPPLEMENTARY INFORMATION

Sacramento Metropolitan Air Quality Management DistrictSchedule of Revenues, Expenditures and Changes in Fund BalancesGeneral Fund – Budget and Actualfor the Year Ended June 30, 2015
See accompanying notes to required supplementary information. 44
Annual budgets, as required by state statues, are adopted on a basis of accounting consistent with generally accepted accounting principles for the general fund.
Variance with
Amended Budget
Actual Favorable
Revenues: Original Amended Amounts (Unfavorable)
DMV surcharge 4,480,630$ 4,480,630$ 4,742,024$ 261,394$
Sales/use tax 1,557,880 1,557,880 1,541,388 (16,492)
Permits and fees 7,080,171 7,080,171 7,416,470 336,299
Local government aid 669,586 175,000 648,910 473,910
State subvention 891,639 891,639 911,207 19,568
Federal grants 7,099,063 3,293,649 1,956,707 (1,336,942)
Interest 35,000 35,000 25,241 (9,759)
Total revenues 21,813,969 17,513,969 17,241,947 (272,022)
Expenditures:
Salaries and benefits 13,018,613 13,018,613 12,112,939 905,674
Services and supplies 11,290,255 6,742,313 4,858,855 1,883,458
Capital expenditures 300,132 564,532 239,282 325,250
Total expenditures 24,609,000 20,325,458 17,211,076 3,114,382
Excess (deficiency) of revenues
over(under) expenditures (2,795,031)$ (2,811,489)$ 30,871$ 2,842,360$

Sacramento Metropolitan Air Quality Management DistrictSchedule of Revenues, Expenditures and Changes in Fund BalancesEmissions Technology Fund – Budget and Actualfor the Year Ended June 30, 2015
See accompanying notes to required supplementary information. 45
Annual budgets, as required by state statues, are adopted on a basis of accounting consistent with generally accepted accounting principles for the emission technology fund.
Variance with
Amended Budget
Actual Favorable
Revenues: Original Amended Amounts (Unfavorable)
DMV surcharge 1,900,000 1,900,000$ 2,250,164$ 350,164$
Local government aid - - - -
State Subvention 11,473,854 11,473,854 9,684,278 (1,789,576)
Federal grants 1,216,614 1,216,614 1,141,828 (74,786)
Interest 100,000 100,000 35,131 (64,869)
Total revenues 14,690,468 14,690,468 13,111,401 (1,579,067)
Expenditures:
Services and supplies 32,879,507 35,746,747 11,838,997 23,907,750
Excess (deficiency) of revenues
over(under) expenditures (18,189,039)$ (21,056,279)$ 1,272,404$ 22,328,683$

Sacramento Metropolitan Air Quality Management DistrictSchedule of Funding Progress for Other Postemployment Benefitsfor the Year Ended June 30, 2015
See accompanying notes to required supplementary information. 46
Actuarial
Valuation
Date
Actuarial
Accrued
Liability
Value of
Assets
Unfunded
Liability
Funded
Status
Annual
Covered
Payroll
UAAL as
% of
Payroll
6/30/2011 1,039,114$ 1,097,022$ (57,908)$ 105.57% 8,685,414$ -0.67%
6/30/2013 1,180,932$ 1,247,158$ (66,226)$ 105.61% 9,294,000$ -0.71%
6/30/2015 2,275,719$ 1,455,178$ 820,541$ 64.00% 9,386,000$ 9.00%
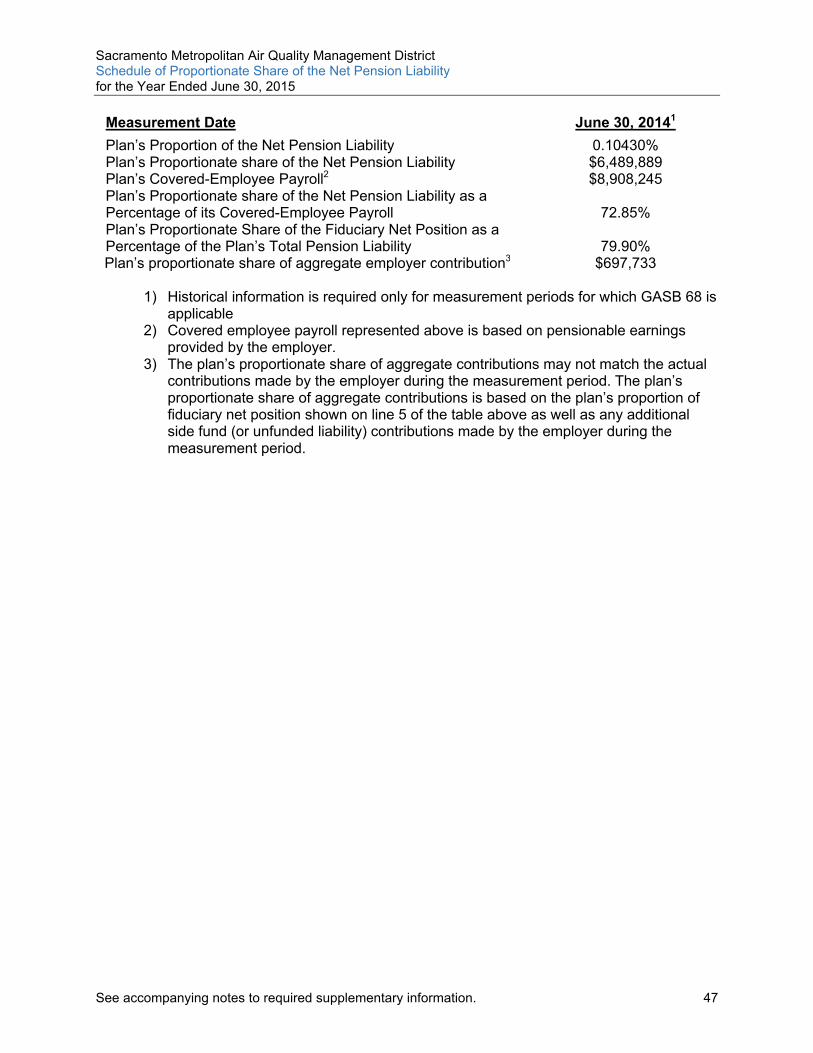
Sacramento Metropolitan Air Quality Management DistrictSchedule of Proportionate Share of the Net Pension Liabilityfor the Year Ended June 30, 2015
See accompanying notes to required supplementary information. 47
Measurement Date June 30, 20141
Plan’s Proportion of the Net Pension Liability 0.10430%Plan’s Proportionate share of the Net Pension Liability $6,489,889Plan’s Covered-Employee Payroll2 $8,908,245Plan’s Proportionate share of the Net Pension Liability as a Percentage of its Covered-Employee Payroll 72.85%Plan’s Proportionate Share of the Fiduciary Net Position as a Percentage of the Plan’s Total Pension Liability 79.90%Plan’s proportionate share of aggregate employer contribution3 $697,733
1) Historical information is required only for measurement periods for which GASB 68 is applicable
2) Covered employee payroll represented above is based on pensionable earnings provided by the employer.
3) The plan’s proportionate share of aggregate contributions may not match the actual contributions made by the employer during the measurement period. The plan’s proportionate share of aggregate contributions is based on the plan’s proportion of fiduciary net position shown on line 5 of the table above as well as any additional side fund (or unfunded liability) contributions made by the employer during the measurement period.

Sacramento Metropolitan Air Quality Management DistrictSchedule of Contributionsfor the Year Ended June 30, 2015
See accompanying notes to required supplementary information. 48
Fiscal Year 2013-141
Actuarially Determined Contribution2 $ 1,066,362Contributions in Relation to the Actuarially Determined Contribution 1,068,331Contribution Deficiency (Excess) $ (1,969)
Covered Employee Payroll3,4 $ 8,908,246
Contributions as a percentage of covered-employee payroll3 11.99%
1) Historical information is required only for measurement periods for which GASB 68 is applicable.
2) Employers are assumed to make contributions equal to the actuarially determined contributions (which is the actuarially determined contribution). However, some employers may choose to make additional contributions towards their side fund or their unfunded liability. Employer contributions for such plans exceed the actuarially determined contributions. CalPERS has determined that the employer obligations referred to as “side funds” do not conform to the circumstances described in paragraph 120 of GASB 68, therefore are not considered separately financed specific liabilities.
3) Covered-Employee Payroll represented above is based on pensionable earnings provided by the employer.
4) Payroll from prior year ($) was assumed to increase by the 3.00 percent payroll growth.

Sacramento Metropolitan Air Quality Management DistrictNotes to Required Supplementary Informationfor the Year Ended June 30, 2015
49
1. Budgetary Comparison Schedule District employs budget control by object level coded and by individual appropriation accounts. Budgets are prepared on the modified accrual basis of accounting in accordance with accounting principles generally accepted in the United States of America as prescribed by the Governmental Accounting Standards Board. Expenditures cannot legally exceed appropriations by major object code. Expenditures cannot legally exceed appropriations by major object code.
2. Schedule of Funding Progress for Other Postemployment Benefits
This schedule represents funding progress for retiree health benefits (OPEB).
3. Schedule of Proportionate Share of Net Pension Liability
In 2015, amounts reported as changes in assumptions resulted primarily from adjustments to expected retirement ages of general employees.
Fiscal year 2015 was the 1st year of implementation, therefore only one year is shown.
4. Schedule of Contributions
If an employer’s contributions to the plan are actuarially determined or based on statutory or contractual requirements, the employer’s actuarially determined contribution to the pension plan (or, if applicable, its statutorily or contractually required contribution), the employer’s actual contributions, the difference between the actual and actuarially determined contributions (or statutorily or contractually required), and a ratio of the actual contributions divided by covered-employee payroll.

OTHER SUPPLEMENTARY INFORMATION

Sacramento Metropolitan Air Quality Management DistrictSchedule of Expenditures of Federal Awardsfor the Year Ended June 30, 2015
51
Grant#
Federal CFDA
NumberTotal
ExpendituresU.S Environmental Protection Agency
Air Pollution Control A 00903114 66.001 $ 304,206A 00903115 66.001 1,110,595
Surveys, Studies, Investigations, etc. PM 99T08501 66.034 41,060PM 00T61201 66.034 13,612
National Clean Diesel-Agricultural Water Irrigation Pump Voucher Program DE 00T75401 66.039 149,683
CAA-Special Purpose Activities-Nitrogen Dioxide Near Roadway Monitoring XA 00T81301 66.034 14,051
National Clean Diesel Program-Repowered Union Pacific Line Haul Locomotive to Cleaner Standards DE 00T95901 66.039 684,292
DERA Refuse Trucks DE 99T06901 66.039 337,690
U.S Highway Planning and Construction
Spare The Air Year 8CML-6236 (011) 20.205 434,492
Spare The Air Year 9CML6236
(012) 20.205 8,854
Total Revenues and Expenditures related to grants $ 3,098,535
Note: Basis of Presentation
The accompanying schedule of expenditures of federal awards includes the federal grant activity of Sacramento Metropolitan Air Quality Management District and is presented on the modified accrual basis of accounting. The information in this schedule is presented in accordance with the requirements of OMB Circular A-133 Audits of States, Local Governments and Non-Profit Organizations. Therefore, some amountspresented in this schedule may differ from amounts presented in, or used in the preparation of, the basic financial statements.

STATISTICAL SECTION

Sacramento Metropolitan Air Quality Management DistrictStatistical Section Overviewfor the Year Ended June 30, 2015
53
STATISTICAL SECTION OVERVIEW
This part of the comprehensive financial report presents detailed information as a context for understanding what the information in the financial statements, note disclosures, and required supplementary information says about the District’s overall financial health.
Financial Trends
The following schedules contain trend information to help the reader understand how the District’s financial performance and well-being have changed over time:
SCHEDULE 1 – Net Position by Component – Last Ten Fiscal Years
SCHEDULE 2 – Changes in Net Position – Last Ten Fiscal Years
SCHEDULE 3 – Fund Balances of Government Funds – Last Ten Fiscal Years
SCHEDULE 4 – Changes in Fund Balances of Government Funds – Last Ten Fiscal Years
SCHEDULE 5 – General Government Expenditures by Major Object – Last Ten Fiscal Year
SCHEDULE 6 – General Government Expenditures by Functions – Last Ten Fiscal Years
Revenue Capacity
The following schedules present information to help the reader assess the District’s own source revenue, permits and fees:
SCHEDULE 7 – General Government Revenues by Source – Last Ten Fiscal Years
SCHEDULE 8 – Own Source Government Revenue Base – Last Ten Fiscal Years
Operating Information
The following schedules contain service and infrastructure data to help the reader understand how the information in the District’s financial report relates to the services the District providesand the activities it performs:
SCHEDULE 9 – Demographic Information – Last Ten Years
SCHEDULE 10 – DMV Registrations (Autos & Trucks) – Last Ten Years
SCHEDULE 11 – Principal Employers – Current Year and Ten Years Ago
SCHEDULE 12 – District Staff Position List – Last Ten Fiscal Years
SCHEDULE 13 – Ratios of Outstanding Debt by Type – Last Ten Years
SCHEDULE 14 – Capital Assets by Function/Program – Last Seven Fiscal Years
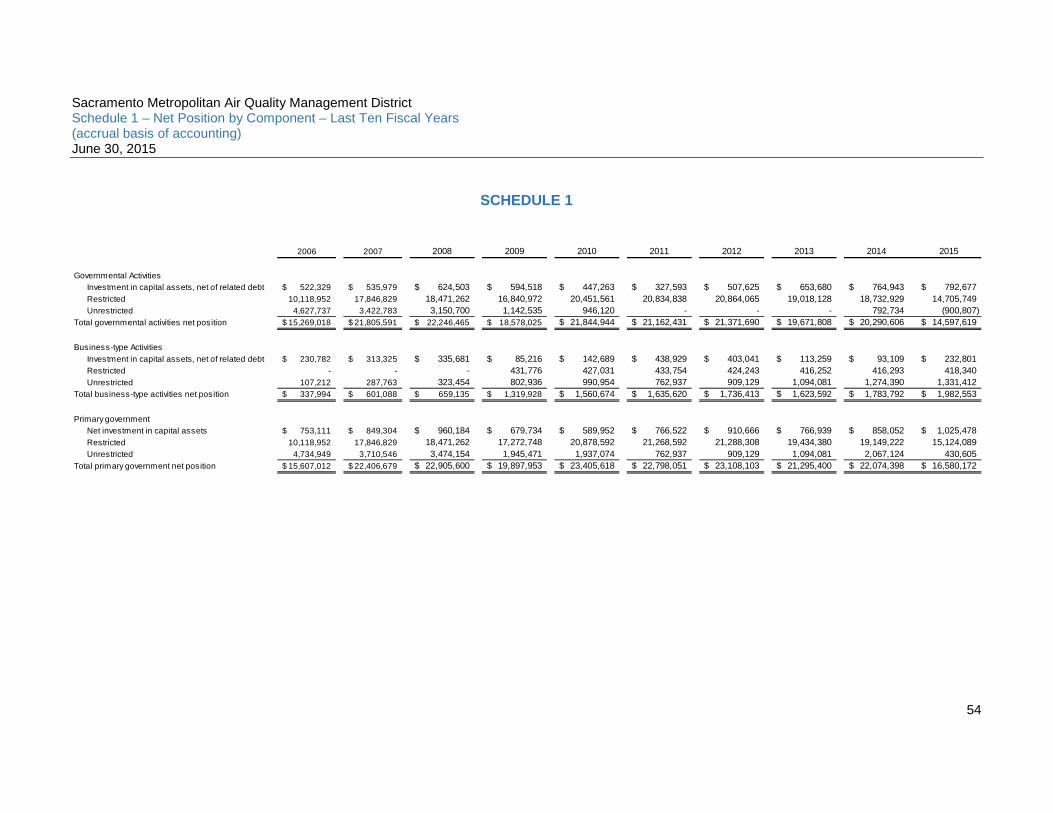
Sacramento Metropolitan Air Quality Management District Schedule 1 – Net Position by Component – Last Ten Fiscal Years (accrual basis of accounting) June 30, 2015
54
SCHEDULE 1
2006 2007 2008 2009 2010 2011 2012 2013 2014 2015
Governmental ActivitiesInvestment in capital assets, net of related debt 522,329$ 535,979$ 624,503$ 594,518$ 447,263$ 327,593$ 507,625$ 653,680$ 764,943$ 792,677$ Restricted 10,118,952 17,846,829 18,471,262 16,840,972 20,451,561 20,834,838 20,864,065 19,018,128 18,732,929 14,705,749 Unrestricted 4,627,737 3,422,783 3,150,700 1,142,535 946,120 - - - 792,734 (900,807)
Total governmental activities net position 15,269,018$ 21,805,591$ 22,246,465$ 18,578,025$ 21,844,944$ 21,162,431$ 21,371,690$ 19,671,808$ 20,290,606$ 14,597,619$
Business-type ActivitiesInvestment in capital assets, net of related debt 230,782$ 313,325$ 335,681$ 85,216$ 142,689$ 438,929$ 403,041$ 113,259$ 93,109$ 232,801$ Restricted - - - 431,776 427,031 433,754 424,243 416,252 416,293 418,340 Unrestricted 107,212 287,763 323,454 802,936 990,954 762,937 909,129 1,094,081 1,274,390 1,331,412
Total business-type activities net position 337,994$ 601,088$ 659,135$ 1,319,928$ 1,560,674$ 1,635,620$ 1,736,413$ 1,623,592$ 1,783,792$ 1,982,553$
Primary governmentNet investment in capital assets 753,111$ 849,304$ 960,184$ 679,734$ 589,952$ 766,522$ 910,666$ 766,939$ 858,052$ 1,025,478$ Restricted 10,118,952 17,846,829 18,471,262 17,272,748 20,878,592 21,268,592 21,288,308 19,434,380 19,149,222 15,124,089 Unrestricted 4,734,949 3,710,546 3,474,154 1,945,471 1,937,074 762,937 909,129 1,094,081 2,067,124 430,605
Total primary government net position 15,607,012$ 22,406,679$ 22,905,600$ 19,897,953$ 23,405,618$ 22,798,051$ 23,108,103$ 21,295,400$ 22,074,398$ 16,580,172$

Sacramento Metropolitan Air Quality Management DistrictSchedule 2 – Changes in Net Position – Last Ten Fiscal Years(accrual basis of accounting)June 30, 2015
55
SCHEDULE 2
2006 2007 2008 2009 2010 2011 2012 2013 2014 2015
Expenses
Governmental Activities
Stationary source activities 4,703,166$ 5,091,593$ 5,192,799$ 8,954,634$ 6,132,920$ 5,823,570$ 5,864,304$ 5,739,977$ 5,747,748$ 5,918,050$
Mobile source activities 6,902,841 11,450,669 11,310,141 11,652,160 13,096,491 12,207,979 34,715,045 28,384,959 11,478,921 14,884,085
Program coordination activities 2,943,252 3,883,940 3,519,465 4,581,824 4,346,725 4,286,273 3,973,143 3,768,674 3,836,739 3,883,548
Strategic planning activities 2,594,043 3,593,197 3,715,156 3,909,988 4,048,968 3,548,148 3,650,376 3,677,908 3,772,415 3,877,953
Depreciation expense-unallocated 103,278 112,904 138,142 149,067 165,753 140,459 125,386 144,940 148,389 211,551
Total governmental activities 17,246,580$ 24,132,303$ 23,875,703$ 29,247,673$ 27,790,857$ 26,006,429$ 48,328,254$ 41,716,458$ 24,984,212$ 28,775,187$
Business-type activities
Building operations and obligations 699,799$ 740,111$ 811,392$ 779,943$ 739,766$ 760,079$ 959,018$ 650,968$ 641,654$ 697,804$
Total primary government expenses 17,946,379$ 24,872,414$ 24,687,095$ 30,027,616$ 28,530,623$ 26,766,508$ 49,287,272$ 42,367,426$ 25,625,866$ 29,472,991$
Program Revenues
Governmental Activities
Charges for services
Stationary source activities 4,072,422$ 6,163,810$ 4,617,658$ 4,868,387$ 4,857,740$ 5,297,300$ 4,912,279$ 5,431,158$ 5,867,492$ 6,440,801$
Mobile source activities 5,046,606 - - 561,345 532,447 703,135 824,850 996,018 106,376
Program coordination activities 612,827 (111,894) 41,879 136,336 136,552 84,794 84,408 96,170 68,314 265,185
Strategic planning activities - - - - 40,207 567,305 470,716 40,839 408,808 140,712
Operating grants and contributions
Stationary source activities 735,527 1,365,145 298,000 3,875,126 764,839 336,324 519,136 401,685 - -
Mobile source activities 510,366 13,831,821 7,796,251 10,721,789 15,088,024 10,355,463 32,815,391 24,933,316 9,141,087 13,910,787
Program coordination activities 467,643 867,950 2,382,599 1,538,889 1,985,190 1,086,075 1,274,400 926,954 1,446,883 1,442,936
Strategic planning activities 204,377 379,326 554,018 964,812 969,308 607,520 625,227 794,100 643,422 643,422
Total governmental activities 11,649,768$ 22,496,158$ 15,690,405$ 22,105,339$ 24,403,205$ 18,867,228$ 41,404,692$ 33,449,072$ 18,572,024$ 22,950,219$
Business-type activities
Building operations and obligations 840,666$ 974,720$ 837,381$ 943,695$ 948,942$ 807,106$ 884,688$ 748,642$ 795,771$ 888,592$
Total primary government program revenues 12,490,434$ 23,470,878$ 16,527,786$ 23,049,034$ 25,352,147$ 19,674,334$ 42,289,380$ 34,197,714$ 19,367,795$ 23,838,811$
Net (Expense) Revenue
Government activities (5,596,812)$ (1,636,145)$ (8,185,298)$ (7,142,334)$ (3,387,652)$ (7,139,201)$ (6,923,562)$ (8,267,386)$ (6,412,188)$ (5,824,968)$
Business-type activities 140,867 234,609 25,989 163,752 209,176 47,027 (74,330) 97,674 154,117 190,788
Total primary government net (expenses) revenue (5,455,945)$ (1,401,536)$ (8,159,309)$ (6,978,582)$ (3,178,476)$ (7,092,174)$ (6,997,892)$ (8,169,712)$ (6,258,071)$ (5,634,180)$
General revenues
Governmental activities
Grants and subventions 5,902,833$ 6,090,320$ 6,884,648$ 8,324,288$ 5,684,433$ 5,696,646$ 6,216,082$ 6,056,461$ 6,614,984$ 6,808,183$
Interest 524,224 991,786 1,086,702 515,419 268,262 230,368 204,424 64,378 18,965 25,241
Gain on sale of capital assets 16,270
Penalties/Settlements 911,166 1,090,612 654,822 977,533 701,876 529,674 712,315 446,663 397,037 569,708
Transfers - - - (456,966) - - - - - -
Total governmental activities 7,338,223$ 8,172,718$ 8,626,172$ 9,360,274$ 6,654,571$ 6,456,688$ 7,132,821$ 6,567,502$ 7,030,986$ 7,419,402$
Business-type activities
Interest 27,859$ 28,485$ 32,058$ 40,075$ 31,570$ 27,919$ 175,123$ 10,268$ 6,083$ 7,973$
Transfers - - - 456,966 - - - - - -
Total business-type activities 27,859 28,485 32,058 497,041 31,570 27,919 175,123 10,268 6,083 7,973
Total Primary government revenue 7,366,082$ 8,201,203$ 8,658,230$ 9,857,315$ 6,686,141$ 6,484,607$ 7,307,944$ 6,577,770$ 7,037,069$ 7,427,375$
Change in net position
Government activities 1,741,411$ 6,536,573$ 440,874$ 2,217,940$ 3,266,919$ (682,513)$ 209,259$ (1,699,884)$ 618,798$ 1,594,434$
Business-type activities 168,726 263,094 58,047 660,793 240,746 74,946 100,793 107,942 160,200 198,761
Total Primary government 1,910,137$ 6,799,667$ 498,921$ 2,878,733$ 3,507,665$ (607,567)$ 310,052$ (1,591,942)$ 778,998$ 1,793,195$

Sacramento Metropolitan Air Quality Management DistrictSchedule 3 – Fund Balances of Governmental Funds – Last Ten Fiscal Years(modified accrual basis of accounting)June 30, 2015
56
SCHEDULE 3
2006 2007 2008 2009 2010 2011 2012 2013 2014 2015
General FundRestricted 9,798,952$ 13,238,198$ 16,317,844$ 9,789,530$ 2,858,052$ 12,144,152$ 12,169,654$ 11,350,172$ 10,998,388$ 10,442,384$ Assigned 320,000 320,000 320,000 320,000 2,407,273 320,000 320,000 320,000 320,000 320,000 Unrestricted 5,144,677 8,295,221 5,751,365 8,666,336 7,906,636 - - - 792,734 1,395,878
Total General Fund 15,263,629$ 21,853,419$ 22,389,209$ 18,775,866$ 13,171,961$ 12,464,152$ 12,489,654$ 11,670,172$ 12,111,122$ 12,158,262$
Emission Technology FundRestricted -$ -$ -$ -$ 9,064,562$ 9,211,835$ 9,267,343$ 8,194,251$ 8,277,548$ 9,549,952$
Total Emission Technology fund -$ -$ -$ -$ 9,064,562$ 9,211,835$ 9,267,343$ 8,194,251$ 8,277,548$ 9,549,952$

Sacramento Metropolitan Air Quality Management DistrictSchedule 4 – Changes in Fund Balances of Governmental Funds – Last Ten Fiscal Years(modified accrual basis of accounting)June 30, 2015
57
SCHEDULE 4
2006 2007 2008 2009 2010 2011 2012 2013 2014 2015
REVENUES
Taxes 8,005,095$ 8,272,593$ 9,069,286$ 9,471,327$ 8,025,308$ 7,451,650$ 8,071,327$ 7,929,307$ 8,334,914$ 8,533,576$
Intergovermental 4,554,831 14,617,951 7,754,619 13,564,665 16,058,522 11,162,826 34,081,710 25,879,092 10,507,331 14,342,930 Licenses/Permits 5,903,839 6,786,546 6,405,970 8,371,169 6,705,683 6,479,071 6,180,051 6,015,064 6,741,800 7,416,470
Use of Money/Property 524,224 991,786 1,086,702 515,419 268,262 230,368 204,424 193,112 18,965 60,372
Total Revenue 18,987,989 30,668,876 24,316,577 31,922,580 31,057,775 25,323,915 48,537,512 40,016,575 25,603,010 30,353,348
EXPENDITURES
Current:
Stationary Sources 4,673,680 5,065,949 5,122,449 8,944,106 6,114,436 5,822,646 5,843,577 5,758,644 5,741,059 6,016,226
Mobile Source 6,882,379 11,432,875 11,261,327 11,647,191 13,088,034 12,207,527 34,704,891 28,394,103 11,475,645 14,932,141 Program coordination 2,924,503 3,867,636 3,474,737 4,575,926 4,334,342 4,285,664 3,959,488 3,780,971 3,832,332 3,943,621
Strategic Planning 2,585,849 3,586,072 3,695,608 3,906,272 4,041,810 3,547,825 3,643,128 3,684,435 3,770,076 3,918,802
Capital Outlay 84,638 126,554 226,666 119,082 18,498 20,789 305,418 290,995 259,652 239,283 Total Expenditures 17,151,049 24,079,086 23,780,787 29,192,577 27,597,120 25,884,451 48,456,502 41,909,148 25,078,764 29,050,073
Excess (Deficiency) of Revenue
over Expenditures 1,836,940 6,589,790 535,790 2,730,003 3,460,655 (560,536) 81,010 (1,892,573) 524,246 1,303,275
OTHER FINANCING SOURCES (USES)
Transfer Out - - - 456,966 - - - - - - Gain on sale of capital assets - - - - - - - - - 16,270
Net change in fund balances 1,836,940$ 6,589,790$ 535,790$ 2,273,037$ 3,460,655$ (560,536)$ 81,010$ (1,892,573)$ 524,246$ 1,319,545$

Sacramento Metropolitan Air Quality Management DistrictSchedule 5 – General Government Expenditures by Major Object – Last Ten Fiscal Years(budgetary basis)June 30, 2015
58
SCHEDULE 5
Fiscal YearSalaries & Benefits
Services & Supplies
Equipment/Fixed Assets Interfund Charges Contingency Total
06-07 9,500,743$ 15,159,559$ 227,500$ 414,682$ 450,000$ 25,752,484$
07-08 10,959,562$ 22,329,068$ 360,400$ 840,000$ 450,000$ 34,939,030$
08-09 12,183,771$ 13,507,796$ 110,400$ 5,142,528$ 450,000$ 31,394,495$09-10 12,199,760$ 8,128,192$ 38,000$ 3,851,831$ -$ 24,217,783$10-11 11,584,777$ 6,425,969$ 43,500$ 1,407,642$ -$ 19,461,888$11-12 11,946,558$ 6,619,728$ 317,000$ 704,652$ -$ 19,587,938$12-13 11,997,789$ 5,552,842$ 397,000$ 679,789$ -$ 18,627,420$
13-14 12,472,301$ 5,132,405$ 180,532$ 806,871$ -$ 18,592,109$14-15 13,018,613$ 5,670,628$ 564,532$ 1,071,655$ -$ 20,325,428$15-16 13,396,624$ 6,807,818$ 768,332$ 806,573$ -$ 21,779,347$
The budgeted expenditures represent the adopted budget adjusted for Board approved modifications based on new or modified expenditures.

Sacramento Metropolitan Air Quality Management DistrictSchedule 6 – General Government Expenditures by Function – Last Ten Fiscal YearsJune 30, 2015
59
SCHEDULE 6
Fiscal YearSalaries & Benefits
Services & Supplies
Payments to Governments
Interfund Charges Capital Outlay Total
05-06 8,150,698$ 8,915,710$ -$ -$ 84,639$ 17,151,047$
06-07 8,933,557 15,018,975 - - 126,554 24,079,086
07-08 9,993,878 13,560,243 - - 226,666 23,780,787
08-09 11,328,021 17,671,068 - 456,966 119,082 29,575,137
09-10 11,619,250 16,383,724 - (424,353) 18,498 27,597,119
10-11 11,456,352 14,506,789 - 783,157 20,789 26,767,087
11-12 11,527,097 36,623,987 - - 305,418 48,456,502
12-13 11,817,905 29,800,249 - - 290,995 41,909,149
13-14 12,011,320 12,807,792 - - 259,652 25,078,764
14-15 12,112,938 16,697,852 - - 239,283 29,050,073

Sacramento Metropolitan Air Quality Management DistrictSchedule 7 – General Government Revenues by Source – Last Ten Fiscal YearsJune 30, 2015
60
SCHEDULE 7
Fiscal Year Taxes Intergovernmental
Licenses/
Permits
Use of Money &
Property
Increase in Fair Value of
Investments Misc Total
05-06 8,005,095$ 4,554,831$ 5,903,839$ 524,224$ -$ -$ 18,987,989$
06-07 8,272,593 14,617,951 6,786,546 991,786 - - 30,668,876 07-08 9,069,286 7,754,619 6,405,970 1,086,702 - - 24,316,577
08-09 9,471,327 13,564,665 8,371,169 515,419 - - 31,922,580 09-10 5,810,923 3,653,527 6,705,683 116,135 - - 16,286,268 10-11 5,498,449 3,998,568 6,479,071 59,403 - - 16,035,491
11-12 5,940,636 4,289,423 6,180,051 44,337 - - 16,454,447 12-13 5,862,442 3,637,602 6,015,064 64,380 - - 15,579,488
13-14 6,095,314 4,082,326 6,741,800 9,934 - - 16,929,374 14-15 6,283,412 3,516,824 7,416,470 25,241 - - 17,241,947

Sacramento Metropolitan Air Quality Management DistrictSchedule 8 – Own Source Government Revenue Base – Last Ten YearsJune 30, 2015
61
SCHEDULE 8
Year Active Permits** Actual Revenue***
2006 3,819 2,665,209$ 2007 4,006 2,656,920 2008 4,060 2,381,639 2009 4,183 3,345,143 2010 4,242 3,501,857 2011 4,238 4,366,411 2012 4,247 4,224,561 2013 4,269 4,419,326 2014 4,331 4,754,372 2015 4,346 4,767,562

Sacramento Metropolitan Air Quality Management DistrictSchedule 9 – Demographic Information – Last Ten YearsJune 30, 2015
62
SCHEDULE 9
Sources: California Department of Finance, California Employment Development Department, E-5 population and housing estimates, annual average employment by industry data, and long-term socio-economic forecasts by county
(1) Data not available
YearCounty Population
(January 1)County Total
Personal Income
County Per Capita Income
County Unemployment Rate
2006 1,369,563 51,575,249$ 37,628$ 4.90%2007 1,381,161 53,769,563 38,931 5.40%2008 1,394,438 55,206,829 39,591 6.90%2009 1,408,601 54,434,987 38,647 12.00%2010 1,422,316 55,176,682 38,794 12.70%2011 1,436,262 57,996,392 40,380 12.60%2012 1,450,121 60,668,975 41,837 10.90%2013 2,217,515 100,936,181 45,518 7.50%2014 2,244,397 105,153,710 46,852 5.70%2015 (1) (1) (1) (1)

Sacramento Metropolitan Air Quality Management DistrictSchedule 10 – DMV Registrations (Autos & Trucks) – Last Ten YearsJune 30, 2015
63
SCHEDULE 10
Source: California Department of Motor Vehicles
(1) Data not available
YearVehicles Registered (As of December 31)
2006 1,174,309 2007 1,165,993 2008 1,157,002 2009 1,159,910 2010 1,157,341 2011 1,141,979 2012 1,142,212 2013 1,179,656 2014 1,208,025 2015 (1)

Sacramento Metropolitan Air Quality Management DistrictSchedule 11 – Principal Employers – Current Year and Ten Years AgoJune 30, 2015
64
SCHEDULE 11
Source: California Employment Development Department
2006 2015
Employer Employees Rank
Percentage of
Total County
Employment Employees Rank
Percentage of
Total County
Employment
Private Industry 676,100 1 74% 689,900 1 74%
State Government 103,000 2 11% 116,300 2 13%
Local Government 109,300 3 12% 100,400 3 11%
Federal Government 13,100 4 1% 13,700 4 1%
Farm 8,300 5 1% 9,300 5 1%
Total All Industries 909,800 100% 929,600 100%
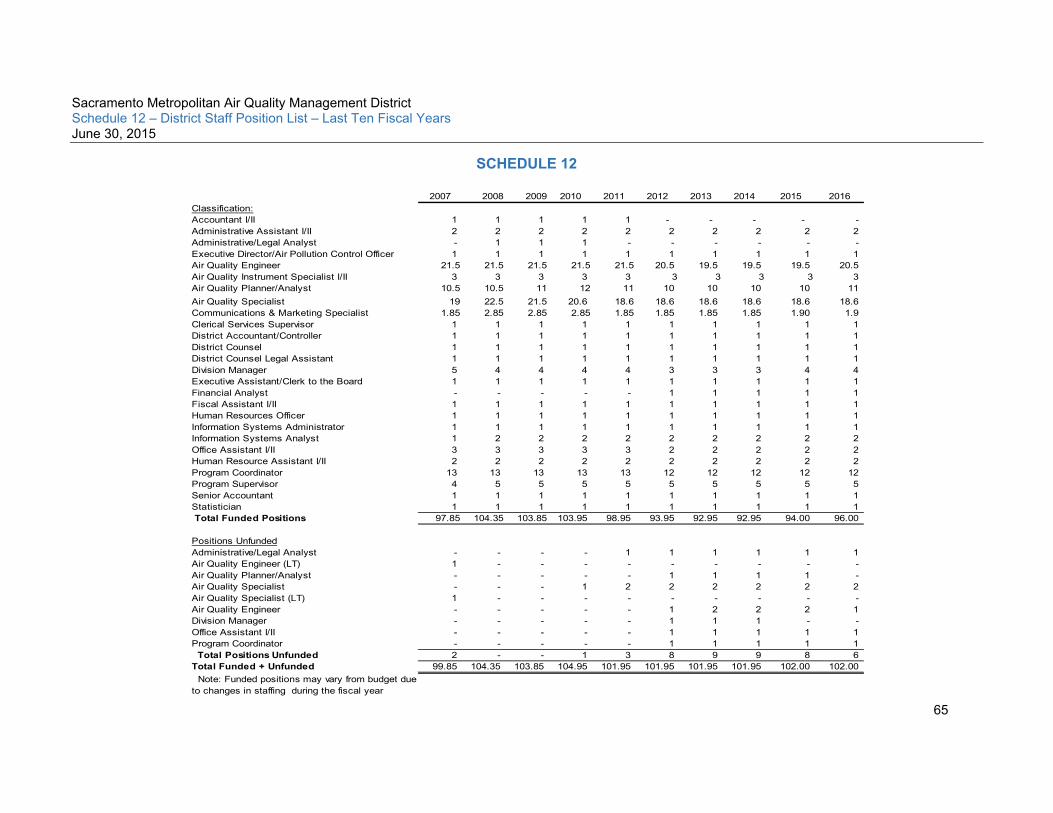
Sacramento Metropolitan Air Quality Management DistrictSchedule 12 – District Staff Position List – Last Ten Fiscal YearsJune 30, 2015
65
SCHEDULE 12
2007 2008 2009 2010 2011 2012 2013 2014 2015 2016
Classification:
Accountant I/II 1 1 1 1 1 - - - - -
Administrative Assistant I/II 2 2 2 2 2 2 2 2 2 2
Administrative/Legal Analyst - 1 1 1 - - - - - -
Executive Director/Air Pollution Control Officer 1 1 1 1 1 1 1 1 1 1
Air Quality Engineer 21.5 21.5 21.5 21.5 21.5 20.5 19.5 19.5 19.5 20.5
Air Quality Instrument Specialist I/II 3 3 3 3 3 3 3 3 3 3
Air Quality Planner/Analyst 10.5 10.5 11 12 11 10 10 10 10 11
Air Quality Specialist 19 22.5 21.5 20.6 18.6 18.6 18.6 18.6 18.6 18.6
Communications & Marketing Specialist 1.85 2.85 2.85 2.85 1.85 1.85 1.85 1.85 1.90 1.9
Clerical Services Supervisor 1 1 1 1 1 1 1 1 1 1
District Accountant/Controller 1 1 1 1 1 1 1 1 1 1
District Counsel 1 1 1 1 1 1 1 1 1 1
District Counsel Legal Assistant 1 1 1 1 1 1 1 1 1 1
Division Manager 5 4 4 4 4 3 3 3 4 4
Executive Assistant/Clerk to the Board 1 1 1 1 1 1 1 1 1 1
Financial Analyst - - - - - 1 1 1 1 1
Fiscal Assistant I/II 1 1 1 1 1 1 1 1 1 1
Human Resources Officer 1 1 1 1 1 1 1 1 1 1
Information Systems Administrator 1 1 1 1 1 1 1 1 1 1
Information Systems Analyst 1 2 2 2 2 2 2 2 2 2
Office Assistant I/II 3 3 3 3 3 2 2 2 2 2
Human Resource Assistant I/II 2 2 2 2 2 2 2 2 2 2
Program Coordinator 13 13 13 13 13 12 12 12 12 12
Program Supervisor 4 5 5 5 5 5 5 5 5 5
Senior Accountant 1 1 1 1 1 1 1 1 1 1
Statistician 1 1 1 1 1 1 1 1 1 1
Total Funded Positions 97.85 104.35 103.85 103.95 98.95 93.95 92.95 92.95 94.00 96.00
Positions Unfunded
Administrative/Legal Analyst - - - - 1 1 1 1 1 1
Air Quality Engineer (LT) 1 - - - - - - - - -
Air Quality Planner/Analyst - - - - - 1 1 1 1 -
Air Quality Specialist - - - 1 2 2 2 2 2 2
Air Quality Specialist (LT) 1 - - - - - - - - -
Air Quality Engineer - - - - - 1 2 2 2 1
Division Manager - - - - - 1 1 1 - -
Office Assistant I/II - - - - - 1 1 1 1 1
Program Coordinator - - - - - 1 1 1 1 1
Total Positions Unfunded 2 - - 1 3 8 9 9 8 6
Total Funded + Unfunded 99.85 104.35 103.85 104.95 101.95 101.95 101.95 101.95 102.00 102.00
Note: Funded positions may vary from budget due
to changes in staffing during the fiscal year

Sacramento Metropolitan Air Quality Management DistrictSchedule 13 – Ratios of Outstanding Debt by Type – Last Ten Fiscal YearsJune 30, 2015
66
SCHEDULE 13
(1) See Schedule 9 (Demographic Information- Last Ten Years) for personal income and population data(2) Data not available
Fiscal Year
Certificate of
Participation Bond Premium
Total Primary
Government
Total Debt as a Percentage of
Sacramento
County
Personal
Income (1)
Total Debt
Per Capita
for
Sacramento
County (1)
2006 5,260,000$ 50,334$ 5,310,334$ 11% 4$
2007 5,110,000 47,810 5,157,810 10% 4$
2008 4,955,000 45,285 5,000,285 10% 4$
2009 4,790,000 42,760 4,832,760 9% 3$
2010 4,620,000 40,235 4,660,235 8% 3$
2011 4,445,000 37,941 4,482,941 8% 3$
2012 4,350,000 70,747 4,420,747 7% 3$ 2013 4,350,000 65,840 4,415,840 4% 2$
2014 4,250,000 60,933 4,310,933 4% 2$
2015 3,980,000 56,026 4,036,026 (2) (2)

Sacramento Metropolitan Air Quality Management DistrictSchedule 14 – Capital Assets by Function/Program – Last Seven Fiscal YearJune 30, 2015
67
SCHEDULE 14
Function/Program 2009 2010 2011 2012 2013 2014 2015
Monitoring Air Quality
Number of air monitoring stations 11 10 10 10 10 11 11
Number of air monitoring instruments 82 74 76 75 77 89 89
installed in the air monitoring stations
to measure air quality
Vehicles - - - - 19 19 19


