190
Comprehensive Annual Financial Report for the Year Ending December 31, 2016 County of Berks, Pennsylvania

Comprehensive
Annual Financial
Report for the
Year Ending
December 31, 2016
County of Berks,
Pennsylvania

County of Berks, Pennsylvania
Comprehensive
Annual Financial
Report for the
Year Ending
December 31, 2016
Commissioners:
Christian Y. Leinbach, Chair
Kevin S. Barnhardt, Vice Chair
Mark C. Scott, Esq.
Prepared by the
Office of the Controller

Comprehensive Annual Financial Report County of Berks Year ended December 31, 2016
i
Table of Contents: Page(s)
Introductory Information:
Letter of Transmittal 1 – 5
Certificate of Achievement for Excellence in Financial Reporting 6 County of Berks - List of Elected Officials 7 County of Berks Organizational Chart 8
County of Berks Map 9
Financial Information:
Independent Auditor’s Report 10 – 12 Management’s Discussion and Analysis 13 – 26
Financial Statements:
Statement of Net Position FS 2 – 3 Statement of Activities FS 4 – 5 Balance Sheet – Governmental Funds FS 6 Reconciliation of the Governmental Funds Balance Sheet to the Statement of Net Position
FS 7
Statement of Revenues, Expenditures and Changes in Fund Balances Governmental Funds
FS 8
Reconciliation of Statement of Revenues, Expenditures and Changes in Fund Balances of Governmental Funds to the Statement of Activities
FS 9
Statement of Net Position – Proprietary Funds – Enterprise Funds FS 10 Statement of Revenues, Expenses and Changes in Fund Net Position Proprietary Funds – Enterprise Funds
FS 11
Statement of Cash Flows – Proprietary Funds – Enterprise Funds FS 12 Statement of Fiduciary Net Position – Fiduciary Funds FS 13 Statement of Changes in Fiduciary Net Position – Fiduciary Funds FS 14 Statement of Net Position (Deficit) – Component Units FS 15

Comprehensive Annual Financial Report County of Berks Year ended December 31, 2016
ii
Table of Contents (continued): Page(s)
Statement of Activities/Revenues, Expenses and Changes in Net Position (Deficits) – Component Units FS 16
Notes to Financial Statements:
Note 1 – Summary of Significant Accounting Policies N 1 Note 2 – Cash and Investments N 13 Note 3 – Restricted Assets N 27 Note 4 – Real Estate Taxes and Tax Abatements N 28 Note 5 – Interfund Balances and Activity N 29 Note 6 – Capital Assets N 31 Note 7 – Retirement Plans N 37 Note 8 – Future Lease Rentals Receivable and Related Debt N 50 Note 9 – Risk Management N 50 Note 10 – Long-Term Debt N 54 Note 11 – Fund Balance Policy N 67 Note 12 – Obligations under Capital Leases N 69 Note 13 – Commitments and Contingencies N 70 Note 14 – Contractual Agreement Revenue N 72 Note 15 – Post Employment Benefit Plans other than Pensions N 73 Note 16 – Subsequent Events N 75

Comprehensive Annual Financial Report County of Berks Year ended December 31, 2016
iii
Table of Contents (continued): Page(s)
Required Supplemental Information:
General Fund Schedule of Revenues, Expenditures and Changes in Fund Balances - General Fund – Budget and Actual
RSI 1 – 3
Children and Youth Services Schedule of Revenues, Expenditures and Changes in Fund Balances - Children and Youth Services Special Revenue Fund – Budget and Actual
RSI 4
Health Choices Schedule of Revenues, Expenditures and Changes in Fund Balances – Health Choices Special Revenue Fund – Budget and Actual
RSI 5
Note to Required Supplemental Information RSI 6
Schedule of Changes in the County’s Net Pension Asset (Liability) and Related Ratios – Berks County Employees’ Retirement Fund
RSI 7
Schedule of County Contributions Berks County Employees’ Retirement Fund
RSI 8
Other Supplemental Information:
Nonmajor Governmental Funds: Combining Balance Sheet – Nonmajor Governmental Funds OSI 2 – 4
Combining Statement of Revenues, Expenditures and Changes in Fund Balances – Nonmajor Governmental Funds
OSI 5 – 7
Liquid Fuels Schedule of Revenues, Expenditures and Changes in Fund Balances - Liquid Fuels Special Revenue Fund – Budget and Actual
OSI 8
Domestic Relations Schedule of Revenues, Expenditures and Changes in Fund Balances - Domestic Relations Special Revenue Fund – Budget and Actual
OSI 9
Employment and Training Schedule of Revenues, Expenditures and Changes in Fund Balances - Employment and Training Special Revenue Fund – Budget and Actual
OSI 10

Comprehensive Annual Financial Report County of Berks Year ended December 31, 2016
iv
Table of Contents (continued):
Other Supplemental Information (continued):
Page(s)
Office of Aging Schedule of Revenues, Expenditures and Changes in Fund Balances - Office of Aging Special Revenue Fund – Budget and Actual
OSI 11
Special Legislation Schedule of Revenues, Expenditures and Changes in Fund Balances - Special Legislation Special Revenue Fund – Budget and Actual
OSI 12
Mental Health/ Developmental Disabilities Schedule of Revenues, Expenditures and Changes in Fund Balances - Mental Health/ Developmental Disabilities Special Revenue Fund – Budget and Actual
OSI 13
Human Services Schedule of Revenues, Expenditures and Changes in Fund Balances - Human Services Special Revenue Fund – Budget and Actual
OSI 14
Drug and Alcohol Schedule of Revenues, Expenditures and Changes in Fund Balances - Drug and Alcohol Special Revenue Fund – Budget and Actual
OSI 15
Department of Emergency Services Special Revenue Fund Schedule of Revenues, Expenditures and Changes in Fund Balances Department of Emergency Services Special Revenue Fund – Budget and Actual
OSI 16
Community Development Special Revenue Fund Schedule of Revenues, Expenditures and Changes in Fund Balances - Community Development Special Revenue Fund – Budget and Actual
OSI 17
Capital Projects Special Revenue Fund Schedule of Revenues, Expenditures and Changes in Fund Balances Capital Projects Special Revenue Fund – Budget and Actual
OSI 18
Berks County Residential Center Enterprise Fund Schedule of Revenues, Expenses and Changes in Fund Net Position Berks County Residential Center Enterprise Fund – Budget and Actual
OSI 19
Berks Heim Enterprise Fund Schedule of Revenues, Expenses and Changes in Fund Net Position - Berks Heim Enterprise Fund – Budget and Actual
OSI 20
Agency Fund Statement of Changes in Net Position
OSI 21

Comprehensive Annual Financial Report County of Berks Year ended December 31, 2016
v
Table of Contents (continued): Page(s)
Statistical Information:
Statistical Section – Categories SI 1 Net Position by Component – Last Ten Years
SI 2
Changes in Net Position – Last Ten Years SI 3
Changes in Net Position – Last Ten Years
SI 4
Fund Balances of Governmental Funds – Last Ten Years SI 5
Changes in Fund Balances of Governmental Funds – Last Ten Years
SI 6
Total Revenue by Source, Governmental Funds – Last Ten Years SI 7
Assessed Value and Estimated Actual Value of Taxable Property – Last Ten Years SI 8
Property Tax Rates per $1,000 of Assessed Value – Direct and Overlapping Governments – Last Ten Years
SI 9
Principal Taxpayers – Current and Nine Years Ago SI 10 Property Tax Levies and Collections – Last Ten Years SI 11 Direct and Overlapping Property Tax Rates – Last Ten Years SI 12 – 13 Ratio of Outstanding Debt by Type – Last Ten Years SI 14 Ratios of General Bonded Debt Outstanding – Last Ten Years SI 15 Direct and Overlapping Governmental Activities Debt – December 31, 2016 SI 16 – 17
Legal Debt Margin Information – Last Ten Years SI 18
Ratio of Annual Debt Service Expenditures for General Obligation Bonded Debt to Total General Governmental Expenditures – Last Ten Years
SI 19
Demographic and Economic Statistics – Last Ten Years SI 20
Principal Employers – Current Year and Nine Years Ago
SI 21
Full-Time Equivalent Employees by Function/Program – Last Ten Years SI 22 Operating Indicators by Function/Program – Last Ten Years SI 23 - 24 Capital Assets Statistics by Function/Program – Last Ten Years SI 25

County of Berks, Pennsylvania
Comprehensive
Annual Financial
Report Introductory
Information for
the Year Ending
December 31, 2016

COUNTY OF BERKS, PENNSYLVANIA Office of the Commissioners
Services Center, 13th Floor 633 Court Street Reading, PA 19601
Christian Y. Leinbach, Commissioner Chair Kevin S. Barnhardt, Commissioner Mark C. Scott, Esq., Commissioner
To: The Citizens of the County of Berks
Phone: 610.478.6136 Fax: 610.478.6293
E-mail: [email protected]
Ron Seaman, Chief Administrative Officer Christine M. Sadler, Solicitor Maryjo Gibson, Chief Clerk
June 30, 2017
This Comprehensive Annual Financial Report (CAFR) of the County of Berks for the year ended December 31, 2016 is submitted herewith to the citizens of the County of Berks and other interested readers of these financial -statements. This CAFR was prepared by the Office of the Controller on behalf of the Board of Commissioners. Responsibility for both the accuracy of the presented data and the completeness and fairness of the presentation, including all disclosures, rests with County management. We believe the data, as presented, is accurate in all material respects; that it is presented in a manner designed to fairly set forth the financial position and results of operations of the County, as measured by the financial activity of its various funds; and that all disclosures necessary to enable the reader to gain a clear understanding of the County's financial affairs have been included.
The organization, form, and contents of this CAFR and the accompanying financial statements and statistical tables were prepared in accordance with the standards established by the Governmental Accounting Standards Board (GASB), the Government Finance Officers Association (GFOA) and the American Institute of Certified Public Accountants (AICPA). The County's financial statements have been audited by the certified public accounting firm ofRKL, LLP. The goal of the independent audit was to provide reasonable assurance that the financial statements of the County for the year ended December 31, 2016 are free of material misstatement. The independent certified public accounting firm has issued an unmodified opinion on the County's financial statements as of and for the year ended December 31, 2016. The auditor's report is located at the beginning of the financial section of this report.
As a recipient of federal financial assistance, the County is also required to undergo an annual single audit in conformity with the provisions of the Single Audit Act of 1984 and Subpart F of Title 2 U.S. Code of Federal Regulations (CFR) Part 200, Uniform Administrative Requirements, Cost Principles, and Audit Requirements for Federal Awards (Uniform Guidance). Information related to this single audit is included in a separately issued Single Audit Report issued by the County's external CPA firm.
In developing and evaluating the County's accounting system, consideration is given to the adequacy of internal controls. Internal accounting controls are designed to provide reasonable, but not absolute assurance regarding ( 1) the safeguarding of assets against loss from unauthorized use or disposition; (2) the reliability of financial records for preparing financial statements; and (3) maintaining accountability for assets. The concept of reasonable assurance recognizes that the cost of internal controls should not exceed the benefits likely to be derived, and that the evaluation of cost and benefits requires estimates and judgments by management. All internal accounting control evaluations occur within the above framework. We believe that the County's internal accounting controls ( 1) adequately safeguard assets, (2)
Dedicated to public service with integrity, virtue & excellence
www .countyofberks.com

Letter of Transmittal
2016 Comprehensive Annual Financial Report
2
provide reasonable assurance of proper recording of financial transactions, and (3) maintain accountability for assets. The letter of transmittal is designed to complement, and should be read in conjunction with, Management’s Discussion and Analysis (MD&A), and the included financial statements and financial statement notes. MD&A provides a narrative introduction, overview, and analysis of the financial statements and can be found immediately following the report of independent auditors. Profile of the County and Government
The County of Berks is a diamond shaped area of 864 square miles located in Southeast Pennsylvania. It is strategically located at the intersection of a dynamic market of economic, trade and industrial activities in the New York - Washington, DC corridor. The county seat, the City of Reading, is 56 miles northeast of Philadelphia, one of the leading industrial and trade complexes of the nation, while also being near other major metropolitan areas of Baltimore, 97 miles to the south, and New York City, 125 miles to the northeast. The County is bordered by Lebanon and Lancaster Counties to the Southwest, Chester and Montgomery Counties to the Southeast, Lehigh County to the Northeast, and Schuylkill County to the Northwest. Originally settled over 250 years ago, the County has shifted from primarily an agrarian-based economy to mining and forging, to manufacturing, and most recently to service-related business. The trend away from manufacturing is expected to continue into the next decade. The service industry, in particular banking, retail, business, health, and social services, is projected to grow the most over the next ten years. The County’s current estimated population is 413,691 in 73 boroughs, townships and the City of Reading, and has been exhibiting an upward trend for the last decade. The County is a third class county, by population, and is governed by a Board of Commissioners under the County Code of 1955. Three County Commissioners, not all from the same political party, are elected every four years, and are assisted in the operation of County government by 9 elected Row Officers, 16 elected Judges of Court and Judicial Officers, and several appointed department heads. A full organization chart follows this Letter of Transmittal. On an annual basis, the County must develop an Operating and Capital Projects Budget, which serves as the foundation of the County’s financial planning and control system. The County Commissioners must adopt this annual revenue and expenditure budget for the County by December 31 of each year for the subsequent year. In 2016, the Commissioners adopted a balanced budget, requiring no tax increase. Financial Reporting Entity This CAFR includes all funds (agencies) of the County, and through those funds, provides a full range of services including the court system, prison, nursing home, education and cultural programs, public safety, economic development, human services programs for children, families and the aged, as well as general administration. In addition to general governmental activities, the County also has discretely presented
component units. These units of government are included in the County’s reporting entity because of the County’s authority to appoint a voting majority of their boards of directors and their dependent financial relationships with the County. Please refer to Note 1.A in the Notes to the Financial Statements for detailed information about the County’s component units and related organizations.

Letter of Transmittal
2016 Comprehensive Annual Financial Report
3
Economic Condition & Outlook
Overall, the County economy continues to show slow and steady growth. The labor market remains strong and the labor force grew 1.5% this past year. The unemployment rate remained nearly steady and continues to be below the national level. Manufacturing remains the largest employment sector of Berks County’s economy and contributes the most to Berks County’s GDP. In July, East Penn Manufacturing opened a $150 million expansion facility at its Lyons campus, ultimately creating several hundred additional manufacturing jobs. In October, the Reading Health System completed its $346 million expansion project and opened its multilevel surgical Healthplex building, thereby increasing campus space by 20%. The System continues to open numerous urgent care and surgical facilities throughout the County. The County maintains many investments to facilitate operations, capital expansion and retirement plans. The investment policy is to minimize credit and market risks, while maintaining a competitive yield on the portfolios. Accordingly, deposits are insured by federal depository insurance, invested in governmental obligations, or collateralized in accordance with the Commonwealth of Pennsylvania Act 72. The County maintains a defined benefit retirement plan with mandatory membership for all full-time County employees, through a 5% required contribution. Net plan position was valued at $417,550,029, an increase of 4.6% from the prior year. Please refer to Note 2 in the Notes to Financial Statements for a detailed analysis of cash and investment information and to Note 7 in the Notes to the Financial Statements for disclosure on the County’s Employees’ Pension Plan. Even though the County was able to implement a no tax increase budget for the 2017 year, succeeding year’s budgets are forecast to face a continued revenue compression from both federal and state governments in funding the areas of Children and Youth Services, Juvenile Probation and Youth Detention. In addressing these issues, the County is committed to maintaining a balanced budget, while working to restructure and reduce operating costs. The County is now completing its eleventh year of self-insurance in healthcare coverage, while maintaining other third party coverage to control the rising, overall cost of insurance protection. Analysis of the ten year history points to a substantial out-of-pocket savings through self-insurance. Workers Compensation Insurance has been similarly self-insured, in this case since 2002. Please refer to Note 9 in the Notes to Financial Statements for detailed Risk Management information.
For the third consecutive year the County maintained its continuing effort to maximize cash flow related to its debt issues, and issued its 2016 General Obligation Bonds. Proceeds of the 2016 bond issue were used to advance refund the County’s 2009 Series A General Obligation Bonds resulting in a substantial cumulative savings on future debt service payments. Several major capital projects were completed during the year, most notable the Normal Avenue and Phillips bridges and a portion of the Elevator Modernization Project. Going forward, in order to eliminate the need for future tax increases, it is imperative that the County continue to maximize non-property tax revenue and streamline its service delivery. It is likewise vital to maintain an adequate level of General Fund balance, and not look to this fund to finance future shortfalls in operating revenues. These steps and a five-year financial forecast are part of the County’s long-term financial planning process.

Letter of Transmittal 2016 Comprehensive Annual Financial Report
Certificate of Achievement
The GFOA of the United States and Canada awarded a Ce1tificate of Achievement for Excellence in Financial Rep01ting to the County for its CAFR for the year ended December 31, 2015 . The County has received this prestigious award for one year. In order to be awarded a Ce1tificate of Achievement, the County is required to publish an easily readable and efficiently organized CAFR that satisfies both GASB and applicable legal requirements.
A Ce1tificate of Achievement is valued for a period of one year only. We believe our current repo1t continues to conform to Ce1tificate of Achievement Program requirements, and we are submitting it to the GFOA to determine eligibility for another ce1tificate.
Acknowledgements
The preparation of this CAFR could not have been accomplished without the dedicated efforts and professionalism of the staff of the Accounting Depaitment in the Office of the Controller and the Office of Budget and Finance. We would like to personally thank these individuals for their assistance in improving both the accuracy and quality of this impo1tant County document.
We would like to fmther express our appreciation to the ce1tified public accounting firm ofRKL, LLP, who audited the general ledger and financial statements from which these schedules are taken, and who provided invaluable guidance in its presentation.
Respectfully submitted,
~/~ Christian Y. Leinbach Commissioner Chair
~/~ Mark C. Scott, Esq. Commissioner
~~~f~ Ronald M. Rutkowski, APM Deputy Controller (
Controller
ernmental Accountant-Team Lead
4
William T. Consugar, CP ~ Manager of Financial Re
~-!?c/'~ h R. Lumis, CGFM, CCS or Governmental Accountant
.>

Letter of Transmittal 2016 Comprehensive Annual Financial Report
~~i~~ Kari L. Bollinger, CPA, CGMA Senior Governmental Accountant
~xf~ -- Scott S. Poch, CPA, CGMA
Senior Governmental Accountant
5
Michael R. Oppenheimer, CPA, CGMA Senior Governmental Accountant
~~);Iona Linda S. Long · Accounting Assistant

�
Government Finance Officers Association
Certificate of Achievement for Excellence
in Financial Reporting
Presented to
County of Berks
Pennsylvania
For its Comprehensive Annual Financial Report
for the Fiscal Year Ended
December 31, 2015
Executive Director/CEO

7
County of Berks
List of Elected Officials
June 2017
Commissioners
Christian Y. Leinbach, Chair Kevin S. Barnhardt, Vice Chair Controller Mark C. Scott, Esq. Sandra M. Graffius Clerk of Courts Treasurer James P. Troutman A. Dennis Adams, CPA
District Attorney Register of Wills
John T. Adams, Esq. Lawrence J. Medaglia, Jr. Coroner Acting Prothonotary Dennis J. Hess Jonathan DelCollo Sheriff Recorder of Deeds
Eric J. Weaknecht Frederick C. Sheeler
Judges of Court Honorable Paul M. Yatron, President Judge Honorable Jeffrey K. Sprecher, Judge Honorable Scott E. Lash, Judge Honorable Mary Ann Ullman, Judge Honorable Thomas G. Parisi, Judge Honorable James M. Bucci, Judge Honorable Timothy J. Rowley, Judge Honorable Madelyn S. Fudeman, Judge Honorable M. Theresa Johnson, Judge Honorable James M. Lillis, Judge Honorable Eleni Dimitriou Geishauser, Judge Honorable Patrick T. Barrett, Judge Honorable Jill Gehman Koestel, Judge Honorable Arthur E. Grim, Senior Judge Honorable Peter W. Schmehl, Senior Judge Honorable Scott D. Keller, Senior Judge Honorable Stephen B. Lieberman, Senior Judge Honorable John A. Boccabella, Senior Judge

8
8

County of Berks,
Pennsylvania
9

County of Berks, Pennsylvania
Comprehensive
Annual Financial
Report Financial
Information for
the Year Ending
December 31, 2016

INDEPENDENT AUDITOR’S REPORT
The following pages are the report of the County’s independent certified public
accounting firm on the audit of its financial statements performed for the year
ended December 31, 2016.

1330 Broadcasting Road, P.O. Box 7008, Wyomissing, PA 19610-6008 Main: 610.376.1595 Fax: 610.376.7340 RKLcpa.com
10
Independent Auditor's Report
Board of County Commissioners and County Controller County of Berks, Pennsylvania
Report on the Financial Statements
We have audited the accompanying financial statements of the governmental activities, the business-type activities, the aggregate discretely presented component units, each major fund, and the aggregate remaining fund information of the County of Berks, Pennsylvania, as of and for the year ended December 31, 2016, and the related notes to the financial statements, which collectively comprise the County of Berks' basic financial statements as listed in the table of contents.
Management's Responsibility for the Financial Statements
Management is responsible for the preparation and fair presentation of these financial statements in accordance with accounting principles generally accepted in the United States of America; this includes the design, implementation, and maintenance of internal control relevant to the preparation and fair presentation of financial statements that are free from material misstatement, whether due to fraud or error.
Auditor's Responsibility
Our responsibility is to express opinions on these financial statements based on our audit. We conducted our audit in accordance with auditing standards generally accepted in the United States of America and the standards applicable to financial audits contained in Government Auditing Standards, issued by the Comptroller General of the United States. Those standards require that we plan and perform the audit to obtain reasonable assurance about whether the financial statements are free from material misstatement.
We did not audit the financial statements of the Reading Regional Airport Authority and the Reading Area Community College as of September 30, 2016 and June 30, 2016, respectively, which represent 99%, 99%, and 94% of the assets and deferred outflows of resources, net position, and revenues of the discretely presented component units, respectively. Those statements were audited by other auditors, whose reports have been furnished to us, and our opinion, insofar as it relates to the amounts included for the discretely presented component units, is based solely on the reports of other auditors.

11
Auditor's Responsibility (continued)
An audit involves performing procedures to obtain audit evidence about the amounts and disclosures in the financial statements. The procedures selected depend on the auditor's judgment, including the assessment of the risks of material misstatement of the financial statements, whether due to fraud or error. In making those risk assessments, the auditor considers internal control relevant to the entity's preparation and fair presentation of the financial statements in order to design audit procedures that are appropriate in the circumstances, but not for the purpose of expressing an opinion on the effectiveness of the entity's internal control. Accordingly, we express no such opinion. An audit also includes evaluating the appropriateness of accounting policies used and the reasonableness of significant accounting estimates made by management, as well as evaluating the overall presentation of the financial statements.
We believe that the audit evidence we have obtained is sufficient and appropriate to provide a basis for our audit opinions.
Opinions
In our opinion, the financial statements referred to above present fairly, in all material respects, the respective financial position of the governmental activities, the business-type activities, the aggregate discretely presented component units, each major fund and the aggregate remaining fund information of the County of Berks, Pennsylvania, as of December 31, 2016, and the respective changes in financial position and, where applicable, cash flows thereof for the year then ended in accordance with accounting principles generally accepted in the United States of America.
Required Supplementary Information
Accounting principles generally accepted in the United States of America require that the required supplementary information, including Management's Discussion and Analysis on Pages 13 - 26, budgetary comparison information on Pages RSI 1 - 6, Schedule of Changes in the County of Berks' Net Pension Liability and Related Ratios and Schedule of County Contributions on Pages RSI 7 and 8 be presented to supplement the basic financial statements. Such information, although not a part of the basic financial statements, is required by the Governmental Accounting Standards Board who considers it to be an essential part of financial reporting for placing the basic financial statements in an appropriate operational, economic, or historical context. We have applied certain limited procedures to the required supplementary information in accordance with auditing standards generally accepted in the United States of America, which consisted of inquiries of management about the methods of preparing the information and comparing the information for consistency with management's responses to our inquiries, the basic financial statements, and other knowledge we obtained during our audit of the basic financial statements. We do not express an opinion or provide any assurance on the information because the limited procedures do not provide us with sufficient evidence to express an opinion or provide any assurance.
Other Supplementary Information
Our audit was conducted for the purpose of forming opinions on the financial statements that collectively comprise the County of Berks' basic financial statements. The introductory section, other supplementary information in the table of contents listed on Pages OSI 2 - 22 and statistical section are presented for purposes of additional analysis and are not a required part of the basic financial statements.

12
Other Supplementary Information (continued)
The introductory section, other supplementary information, and statistical section are the responsibility of management and were derived from and relate directly to the underlying accounting and other records used to prepare the basic financial statements. The other supplementary information on Pages OSI 2 - 22 has been subjected to the auditing procedures applied in the audit of the basic financial statements and certain additional procedures, including comparing and reconciling such information directly to the underlying accounting, and other records used to prepare the basic financial statements or to the basic financial statements themselves, and other additional procedures in accordance with auditing standards generally accepted in the United States of America. In our opinion, the other supplementary information on Pages OSI 2 - 22 is fairly stated, in all material respects, in relation to the basic financial statements as a whole.
The introductory section and statistical section have not been subjected to auditing procedures applied in the audit of the basic financial statements and, accordingly, we do not express an opinion or provide assurance on them.
Other Reporting Required by Government Auditing Standards
In accordance with Government Auditing Standards, we have also issued our report dated June 30, 2017 on our consideration of the County of Berks' internal control over financial reporting and on our tests of its compliance with certain provisions of laws, regulations, contracts and grant agreements, and other matters. The purpose of that report is to describe the scope of our testing of internal control over financial reporting and compliance and the results of that testing, and not to provide an opinion on internal control over financial reporting or on compliance. That report is an integral part of an audit performed in accordance with Government Auditing Standards in considering the County of Berks' internal control over financial reporting and compliance. June 30, 2017 Wyomissing, Pennsylvania

MANAGEMENT’S DISCUSSION AND ANALYSIS
The purpose of the Management’s Discussion and Analysis section is to provide
users of the basic financial statements with a narrative introduction, overview and
analysis of those statements.

County of Berks
Management’s Discussion and Analysis
December 31, 2016
(amounts rounded to nearest thousand)
13
The County of Berks (County) management discussion and analysis (MD&A) is intended to present a narrative overview of the County and an analysis of the County’s financial performance for the year ended December 31, 2016. The MD&A is intended to be read in conjunction with the transmittal letter at the beginning of this report and the County’s basic financial statements and notes to financial statements following this section in order to obtain a thorough understanding of the County’s financial condition at December 31, 2016. Dollar amounts throughout the MD&A are rounded to the nearest thousand of dollars unless otherwise indicated.
FINANCIAL HIGHLIGHTS
• The County’s net position, restated for 2015, increased in 2016 by $23,612 to $275,419. Unrestricted net position at year-end decreased by $16,933 to $139,356.
• Total outstanding bonds and other debt at December 31, 2016 was $253,535, a decrease of $30,181 from the prior year, as a previous bond issue was entirely refunded. The County’s bond rating from Moody’s is Aa1, stable outlook.
• Property tax rates remained unchanged at 7.372 mills for the fourth straight year in 2016.
• During 2016, the County’s General Fund balance decreased by $16,443 to $134,841. The unassigned portion of that fund balance was $118,930, a decrease of $16,093 from the unassigned fund balance at the end of 2015.
OVERVIEW OF THE FINANCIAL STATEMENTS
The following narrative explains the County’s basic financial statements. The basic financial statements consist of three parts: (1) Government-wide financial statements (2) Fund financial statements (3) Notes to basic financial statements. Required supplementary information is included in addition to the basic financial statements. Government-wide financial statements, (pages FS 2-5 of this report), provide a broad overview of the County’s overall financial status, as well as the financial status of the County’s component units, in a manner similar to a private-sector business, using the accrual basis of accounting. Please refer to Note 1, section B, for further information regarding accrual basis of accounting. The Statement of Net Position includes information on all County assets, deferred outflows and inflows of resources, and liabilities, with the difference between these items being reported as net position. This statement serves a purpose similar to that of the balance sheet of a private-sector business. Net position is one way to measure the County’s financial position. Over time, increases or decreases in the County’s net position is one indicator of whether the County financial position is improving or deteriorating. However, other non-financial factors such as changes in the County’s real property tax base and general economic conditions must be considered to assess the overall position of the County.
The Statement of Activities includes information that focuses on how the County’s net position changed during the year. All changes to net position are recorded using the accrual basis of accounting, which requires that revenues be recorded when they are earned and expenses be recorded when the goods and/or

County of Berks
Management’s Discussion and Analysis
December 31, 2016
(amounts rounded to nearest thousand)
14
services are received, regardless of when cash is received or paid. Because it separates program revenue (revenue generated by specific programs through charges for services, grants and contributions) from general revenue (revenue provided by taxes and other sources not tied to a particular program), it shows to what extent each program has to rely on local taxes for funding. These government wide financial statements separate functions of the County into governmental and business-type activities. Governmental activities are principally supported by intergovernmental revenues and property taxes. These activities include general government, judicial, public safety, culture and recreation, community and economic development, public works, community support, debt service administrative expenses and solid waste. The business-type activities of the County include Berks Heim, the County’s long-term care facility, and the Residential Center. These activities charge a fee to those residents and customers to help cover the cost of services or submit costs for reimbursement through cost reimbursement plans. The primary government and its discretely presented component units are included in the government-wide financial statements. Component units reflect the activities of legally separate government entities over which the County can exercise influence and/or be obligated to provide financial support. The County has three discretely presented component units including the Berks County Solid Waste Authority; Reading Regional Airport Authority; and Reading Area Community College. Complete and detailed financial statements for the individual component units can be obtained from their administrative offices (See Note 1 of the Notes to the Financial Statements for addresses.) Fund Financial Statements provide more detailed information on the County’s individual funds. A fund is a group of related accounts used to keep track of specific sources of funding and spending for particular purposes, using the modified accrual basis of accounting. Please refer to Note 1, section B for further information regarding modified accrual basis of accounting. The County uses fund accounting to ensure and demonstrate finance-related legal compliance. The County has three kinds of funds: governmental funds, proprietary funds, and fiduciary funds. Governmental funds are used to account for the same functions reported in governmental activities in the government-wide financial statements. However, unlike the government-wide financial statements, governmental funds statements report the County’s basic services and focus on: (1) the flow in and out of cash and other financial assets that can readily be converted into cash, and: (2) the balances left at year-end that are available for spending. Since the focus of governmental funds is narrower than the government wide financial statements, it is helpful to compare the information presented in each type of financial statement. The comparison between governmental activities and governmental funds is facilitated in reconciliations that follow both the governmental funds Balance Sheet and the governmental funds Statement of Revenues, Expenditures and Changes in Fund Balances. The County maintains eighteen individual government funds, three of which are considered to be major governmental funds. Information for the General Fund, Children and Youth Services, and Health Choices is presented separately in the governmental funds Balance Sheet and in the governmental funds Statement of Revenues, Expenditures and Changes in Fund Balances. Data for non-major governmental funds are combined into a single, aggregated presentation. Summary fund data by fund type and individual fund data for these non-major governmental funds is provided as other supplementary information in the form of combining statements found on Other Supplemental Information (“OSI”) pages 2-7 of this report.

County of Berks
Management’s Discussion and Analysis
December 31, 2016
(amounts rounded to nearest thousand)
15
The County adopts an annual budget for all governmental funds. Budgetary comparisons are provided for the County’s major funds on pages Required Supplemental Information (“RSI”) pages 1-5, while the non-major funds are provided on pages OSI pages 8-20. Proprietary funds report business-type programs and activities that charge fees designed to recover the cost of providing services. Proprietary funds provide the same type of information as the government-wide financial statements; however, more detailed information is provided and the cash flow statement is included. Enterprise funds are used to report the same functions presented as business-type activities in the government-wide financial statements, using the full accrual basis of accounting. Enterprise Funds in the County are used to account for the Berks County Residential Center and Berks Heim. The County adopts an annual budget for the proprietary funds, as required by the state law. Budgetary comparisons of the County’s proprietary funds are presented as OSI. The proprietary fund financial statements are found on pages FS 10-12 and OSI 19-20 of this report.
Fiduciary funds are funds for which the County is the trustee or fiduciary. These include the Berks County Employees’ Retirement Fund and certain agency funds, or clearing accounts for assets held by the County in its role as custodian until the funds are allocated to the private parties, organizations or government agencies to which they belong. The County is responsible to ensure the assets reported in these funds are used for their intended purposes. This fiduciary activity is reported in a separate statement of fiduciary net position and a statement of changes in fiduciary net position. These funds are excluded from the County’s government-wide financial statements because the County cannot use these assets to finance its operations. The fiduciary fund financial statements are found on pages FS 13-14 of this report. Notes to the Basic Financial Statements provide detailed information that is needed for a full understanding of the data provided in the government-wide and fund financial statements. The notes are an integral part of the financial statements and should be reviewed in conjunction with them. The notes can be found on pages N 1–N 75 of this report. Required Supplementary Information includes budgetary comparison schedules for the General Fund and for major special revenue funds, notes on the budgetary basis of accounting, as well as schedules related to the County’s net pension liability and County pension contributions. Required supplementary information can be found on pages RSI 1 to 8 of this report. Other Supplementary Information includes the nonmajor funds balance sheet, budgetary comparison schedules for the nonmajor special revenue funds, the enterprise funds, and the change in net position of the agency fund. Other supplementary information can be found on pages OSI 2 to 21 of this report.

16
GOVERNMENT-WIDE FINANCIAL ANALYSIS
Condensed Statement of Net Position
The County of Berks’ net position, which is the amount that assets and deferred outflows of resources exceed liabilities and deferred inflows of resources was $275,419 at December 31, 2016. The following table breaks out governmental activities from business-type activities for total assets, total deferred outflows of resources, total liabilities, total deferred inflows of resources, and net position.
Governmental activities Business-type activities Total
2016 2015 2016 2015 2016 2015
(Restated) (Restated) (Restated)
Noncapital assets 255,459$ 283,574$ 7,213$ 3,666$ 262,672$ 287,240$
Capital assets 285,221 275,881 35,531 35,667 320,752 311,548
Total assets 540,680 559,455 42,744 39,333 583,424 598,788
Deferred outflows 27,732 32,491 5,249 6,978 32,981 39,469
Total assets and
deferred outflows 568,412 591,946 47,993 46,311 616,405 638,257
Current liabilities 71,336 86,690 4,467 3,936 75,803 90,626
Noncurrent liabilities 222,432 251,344 28,130 28,962 250,562 280,306
Total liabilities 293,768 338,034 32,597 32,898 326,365 370,932
Deferred inflows 13,390 14,197 1,231 1,321 14,621 15,518
Total liabilities and
deferred inflows 307,158 352,231 33,828 34,219 340,986 386,450
Net position:
Net investmeint in
capital assets 81,932 43,806 13,724 13,188 95,656 56,994
Restricted 40,408 39,885 - - 40,408 39,885
Unrestricted 138,914 156,024 441 (1,096) 139,355 154,928
Total net position 261,254$ 239,715$ 14,165$ 12,092$ 275,419$ 251,807$
During 2016, net position increased $23,612, or 9.4% to $275,419. Of this total, $95,656 represents the net investment in capital assets (the net balance of long-term assets in excess of long-term debt), while $40,408 is restricted for various purposes by external entities. The unrestricted net position of $139,355 represents funds available to support operations or provide for the repayment of long-term debt. Reasons for this change include: Current and other assets decreased by $24,568, or 8.6%, to $262,672. Reasons for this decrease include:
• Decrease in amounts due from other governments of $34,247 because receivables from 2015 included the 3rd and 4th quarter money due from the Commonwealth of Pennsylvania as a result of the budget impasse causing payments not being made until 2016.
• Cash and investments increased by $14,085 resulting from the receipt of money due from other governments during 2016 that the General Fund had paid for in advance during 2015.

County of Berks
Management’s Discussion and Analysis
December 31, 2016
(amounts rounded to nearest thousand)
17
• Accounts receivable from Health Choices decreased by $3,649 because 2015 revenue was received in 2016 related to an aid rate adjustment for the 2015 year.
• Unamortized bond refunding loss increased by $1,901 primarily because of the refunding of the 2009 A Series bond resulting in a loss of $2,661, as well normal amortization of all bond refundings during the year.
Capital assets are discussed in a subsequent analysis within this section. Current liabilities decreased by $14,823, or 16.4% to $75,803. This decrease is because of a decrease in accounts payable of $14,421 because of the payment of 2016 invoices in 2017 because of the state budget impasse during 2016.
Noncurrent liabilities decreased by $29,744, or 10.6%, to $250,562. This change is due primarily to the reasons described in the long-term debt section.
Changes in Net Position
The following statement of activities represents the balances and changes that occurred in net position for the year ended December 31, 2016. It shows revenues by source and expenses by function.

County of Berks
Management’s Discussion and Analysis
December 31, 2016
(amounts rounded to nearest thousand)
18
Governmental activities Business-type activities Total
2016 2015 2016 2015 2016 2015
(Restated) (Restated) (Restated)
Program revenues:
Charges for services 47,758$ 34,981$ 56,732$ 61,536$ 104,490$ 96,517$
Operating grants/contrib. 197,989 178,140 - 21 197,989 178,161
Capital grants/contrib. 11,664 7,127 9 - 11,673 7,127
General revenues:
Property taxes 136,869 136,152 - - 136,869 136,152
Hotel room tax 2,434 2,226 - - 2,434 2,226
Payment in lieu of taxes 238 243 - - 238 243
Investment earnings 1,474 1,135 2 8 1,476 1,143
Change - rate swaps (1,110) 490 (79) 627 (1,189) 1,117
Miscellaneous - other 4,945 - - - 4,945 -
Gain on disposal of
capital assets 87 21 - - 87 21
Rental of space 465 390 - 48 465 438
Total revenues 402,813 360,905 56,664 62,240 459,477 423,145
Expenses:
General government 36,083 24,518 - - 36,083 24,518
Judicial 50,163 49,574 - - 50,163 49,574
Public safety 73,693 60,793 - - 73,693 60,793
Human services 195,370 173,389 - - 195,370 173,389
Culture and recreation 8,048 7,757 - - 8,048 7,757
Comm & econ development 5,736 6,467 - - 5,736 6,467
Public works 1,108 2,213 - - 1,108 2,213
Community support 602 564 - - 602 564
Debt service 9,147 10,643 - - 9,147 10,643
Solid waste 1,177 1,241 - - 1,177 1,241
Dept of Emer. Serv. - - - 12,445 - 12,445
Residential Center - - 7,877 6,999 7,877 6,999
Berks Heim - - 46,861 39,333 46,861 39,333
Total expenses 381,127 337,159 54,738 58,777 435,865 395,936
Change before other items 21,686 23,746 1,926 3,463 23,612 27,209
Other items:
Transfers/cap contrib (147) 1,089 147 (1,089) - -
Conversion to spec. rev. - 6,090 - (6,090) - -
Total other items (147) 7,179 147 (7,179) - -
Change in net position 21,539 30,925 2,073 (3,716) 23,612 27,209
Net position - beginning 239,715 207,720 12,092 15,207 251,807 222,927
Prior Period Adjustments - 1,070 - 601 - 1,671
Net position - ending 261,254$ 239,715$ 14,165$ 12,092$ 275,419$ 251,807$

County of Berks
Management’s Discussion and Analysis
December 31, 2016
(amounts rounded to nearest thousand)
19
The County’s overall net position increased by $23,612, which includes an increase due to governmental activities of $21,539 and an increase in business-type activities of $2,073. Governmental activities:
Revenues increased by $41,908. Charges for services increased $12,777 due to an increase in service levels and because this is the first year that $11,489 or Department of Emergency Services revenue has been included in governmental activities and not business type activities because of a change in the funding stream and anticipated expenses being more than the funding. Operating grant revenue increased by $19,849 primarily due to an increase in managed care organization tax of approximately $7,000 and an increase in usage in Health Choices of approximately five thousand seven hundred members, which accounts for the $8,666 of the increase. Miscellaneous other increased $4,945 because of increased support from Berks Heim related to intergovernmental revenue. Expenses increased by $43,968. Expenses for general government increased by $11,565 primarily because of increased support to Berks Heim related to intergovernmental revenue of $4,945 and because of an increase in the expense related to the net pension asset and deferred outflows/inflows of resources related to the Berks County Employees Pension Plan of $5,195. Expenses for public safety increased by $12,900 because $11,332 of Department of Emergency Services is included as a governmental fund in 2016 for the first time. Expenses for Human Services increase by $21,981 primarily because of Health Choices revenue for increased usage and the tax as described in the preceding paragraph and because of increased usage in several human services funds. Other items decreased by $6,090 because the Department of Emergency Services switched from a business-type activity to a special revenue fund in 2015. While reviewing the changes noted above, please keep in mind the discussion in Note 1 to the financial statements of the measurement focus, basis of accounting and financial statement presentation. See the reconciliation on pages FS 7 and 9 which further explains the differences between changes in the County’s fund balance under the modified accrual basis and changes in net position under the accrual basis of accounting. Business-type activities: Charges for services decreased by $4,804 because of the reclassification of the Department of Emergency Services from a business-type activity to a special revenue fund in 2015 which decreased revenue by $10,787 compared to 2016. This was offset by an increase to Berks Heim revenue of $6,040, primarily because of an increase in state funding to offset costs of operations of $7,582 in 2016 that wasn’t available in 2015. Expenses decreased by $4,039 because of expenses for Department of Emergency Services of $11,017 not being included in 2016 and included in 2015, offset by increased expense of Berks Heim of $7,528 related to increased funding and usage compared to 2015. Other items increased by $6,090 because the Department of Emergency Services switched from a business-type activity to a special revenue fund in 2015.

County of Berks
Management’s Discussion and Analysis
December 31, 2016
(amounts rounded to nearest thousand)
20
FINANCIAL ANALYSIS OF GOVERNMENTAL FUNDS The County of Berks uses fund accounting to ensure and demonstrate compliance with finance-related legal requirements. The focus of governmental funds is to provide information on near-term inflows, outflows, and balances of spendable resources. Such information is useful in assessing the County’s financing requirements. In particular, unassigned fund balance may serve as a useful measure of the County’s net resources available for spending at the end of the year. Governmental funds accounting was not affected by the adoption of GASB Statement No. 34. Therefore schedules are presented to reconcile the fund statements to the government-wide statements. The County’s governmental funds include the general fund, special revenue funds, and a capital projects fund. The general fund is the chief operating fund for the County, while special revenue funds are restricted to specific legislated use. The capital project fund accounts for the proceeds and activity of bond issues. The major funds are shown on the statement of revenues, expenditures and changes in fund balances in the financial statements section.
At December 31, 2016, the County’s governmental funds reported total fund balances of $151,582, and decrease of $10,941 in comparison with December 31, 2015. Unassigned fund balance of $118,930, or 78.5%, is fund balance available for future appropriation. Restricted fund balance of $16,764, or 11.1%, is fund balance restricted by external entities. Committed fund balance of $7,327, or 4.8%, is amounts committed by the Board of Commissioners for specific purposes. The remaining fund balance of $8,561, or 5.6%, represents nonspendable items such as inventory and amounts assigned for specific purposes. General Fund: The General Fund accounts for all financial resources of the County except for those accounted for in other funds. At December 31, 2016, total fund balance of the General Fund was $134,841, while unrestricted fund balance was $118,930. As a measure of the General Fund’s liquidity, it may be useful to compare both unrestricted fund balance and total fund balance to total fund expenditures. Unrestricted fund balance represents 58.9% of total fund expenditures excluding other financing uses, while total fund balance represents 66.8% of the same amount. The General Fund’s fund balance decreased by $16,443 during the 2016 year because of the payment to bond escrow agent for defeasance of the 2009 Series A bonds of $15,063. General Fund revenues without other financing sources totaled $215,831, which represents a 3.3% increase, or $6,899, from the 2015 year. This is primarily due to an increase in aid from other governmental agencies of $5,605, an increase of departmental charges and reimbursements of $704, and an increase in real estate tax revenue of $389. Expenditures without other financing uses totaled $201,931, which represents a 3.8% increase, or $7,317, from the 2015 year. This is primarily due to the increase of community support related to Berks Heim of $4,945, and an increase in Culture and Recreation of $1,903.

County of Berks
Management’s Discussion and Analysis
December 31, 2016
(amounts rounded to nearest thousand)
21
Children and Youth Services Special Revenue Fund
The Children and Youth Services Special Revenue Fund is a major governmental fund that provides services to children and youth. This fund received $36,709 of revenues, and incurred $44,092 of expenses. The General Fund contributed $7,392 during 2016 as part of the required County contribution. Expenses increased by $1,610 compared to 2015 because of increased regulatory requirements and increased need for services. Overall revenue increased a similar amount during 2016. Health Choices Special Revenue Fund
The Health Choices Special Revenue Fund is a major governmental fund. This fund accounts for financial resources for the provision of a behavioral health managed care program for medical assistance recipients. Revenues in 2016 were $102,873, which represents a $15,666 increase, or 18.0% increase, from the 2015 year due to an increase in managed care organization tax of approximately $7,000 and an increase in usage in Health Choices of approximately five thousand seven hundred members, which accounts for the $8,666 of the increase. Budgetary highlights The Board of County Commissioners adopts a new budget on or before December 31 for the succeeding year for all County operations. The budget is developed at the department level for each revenue and expense account. This budget is revised throughout the year as needed on a weekly basis with Commissioners’ approval as follows:
• To move specific line item allocations to different line items on both an inter- and intra- departmental basis.
• To appropriate new revenue, when received, and the anticipated related spending authority.
Because the County is on a calendar year that differs from many Federal and State government agencies, it is difficult, at times, to forecast the exact amount of non-tax revenue that will be forthcoming during the County’s year. Many of the revenue variances are the result of federal and state revenues being either increased or decreased after the County budget is adopted.
During 2016, the General Fund revenue budget, excluding transfers and bond proceeds, increased $434 during the year from the original approved budget of $211,532 to the final budget of $211,966. Actual revenues received of $215,831 were $3,865 more than the final budget. The overall excess of final revenue to final budget can be traced to increased state agency funds.
The General Fund expenditure budget, excluding transfers, but including the amended budget related to payment to the bond escrow agent to enable comparison, increased $6,821 during 2016 from the original budget of $202,671 to the final budget of $209,492. Actual expenditures of $201,931 were $7,561 lower than the final budget. The overall less than budget condition for expenses can be traced primarily as Information Systems projects and Parks projects and expenditures were delayed and/or reorganized, budgeted contingency expenses were not used, Facilities costs were lower than expected, and overall general government expenses were lower than expected because of delay of projects and because of cost cutting measures in the County.

County of Berks
Management’s Discussion and Analysis
December 31, 2016
(amounts rounded to nearest thousand)
22
Capital Assets
The County’s investment in capital assets at December 31, 2016, net of accumulated depreciation, was $320,753. Capital assets consist primarily of the categories shown in the table below. During 2016, construction in progress increased significantly due to large scale work on the County owned Buttonwood Street Bridge as well as the Elevator Modernization project. Agricultural easements continued to grow as a part of the farmland preservation program. See Note 6 to the financial statements for more detailed information on capital asset activity. Government-wide financial statements present depreciable capital assets as being depreciated from the acquisition date until the end of the current year. Fund financial statements record capital asset activity purchases as expenditures.
Capital Assets (net of depreication)
Governmental activities Business-type activities Total
2016 2015 2016 2015 2016 2015
Land and improvements 15,788$ 14,643$ -$ -$ 15,788$ 14,643$
Agricultural easements 79,371 78,161 - - 79,371 78,161
Infrastructure 10,281 8,356 - - 10,281 8,356
Buildings and improvements 95,920 100,790 34,814 34,864 130,734 135,654
Furniture, fixtures, equipment
and vehicles 59,311 61,767 699 789 60,010 62,556
Historical treasures 2,280 2,280 - - 2,280 2,280
Software in progress 3,088 2,560 - - 3,088 2,560
Construction in progress 19,182 7,324 18 14 19,200 7,338
Total 285,221$ 275,881$ 35,531$ 35,667$ 320,752$ 311,548$
Long-term debt:
At December 31, 2016, the County had $253,535 of debt outstanding, including bonds and notes. This was a decrease of $30,181, or 10.6%, from the previous year, and reflects the advance refunding of the 2009 Series A General Obligation Bonds with the 2016 General Obligation Bonds and continued principal payments. The following table provides a comparative summary of outstanding debt for the current and prior year. Please refer to Note 10 of the financial statements for more information on the County’s long-term debt.

County of Berks
Management’s Discussion and Analysis
December 31, 2016
(amounts rounded to nearest thousand)
23
Summary of outstanding debt
Governmental activities Business-type activities Total
2016 2015 2016 2015 2016 2015
Bonds and notes:
Current portion 19,773$ 20,562$ 419$ 748$ 20,192$ 21,310$
Noncurrent portion 207,054 235,487 26,289 26,919 233,343 262,406
Total 226,827$ 256,049$ 26,708$ 27,667$ 253,535$ 283,716$ The amount of indebtedness a county may incur is limited by Pennsylvania law to 300 percent (non-electoral) and 400 percent (net non-electoral and lease rental) of a three-year average of the total revenue received, exclusive of governmental grants for a specific purpose. The County’s non-electoral debt limit at December 31, 2016 was approximately $1,378,801, compared to the total debt applicable to the debt limit of $226,636, which is well below the legal debt limit. The County’s net non-electoral and lease rental debt limit at December 31, 2016 was approximately $1,838,401, which when compared to applicable debt, is similarly below the legal debt limit. Detailed information about the County’s Long-term Debt can be found in Note 10 of the Financial Statements.
Bond rating As of December 31, 2016, Moody’s Investors Services continued to rate the County’s general obligation bonds at Aa1 (Stable Outlook), following the refunding of the 2008 General Obligation bonds and the remaining portion of the 2010 Series A General Obligation bonds.
ECONOMIC FACTORS AND NEXT YEAR’S BUDGET
Economic conditions The economic recovery continued to grow sluggishly in 2016. The President has promised to get economic growth to levels from the late 1990’s. The President’s agenda to cut corporate and individual taxes, improve the national infrastructure and cut regulations has fueled optimism, as evidenced by the stock market rallying to reach new all-time highs. The unemployment rate continued to hover at just under 5% as many measures of the job market have significantly improved. Employers added over two million jobs in 2016 and levels of underemployed and discouraged workers continued to decrease. Inflation levels remain low as wage levels are beginning to outperform increases in prices. The U.S. economy will be facing some challenges in 2017 if the President is unable to deliver on his promises. There could also be issues with the viability of the European Union. The Berks County economy is broad-based, containing many sectors included but not limited to, manufacturing, wholesale and retail trade, services, manufacturing and agriculture. While Berks County has lost a number of large organizations in the last 10 years, these jobs have been replaced with employers in other sectors. However, the manufacturing sector continues to generate the highest payroll as a whole throughout the County. There are several agencies throughout Berks County that are responsible for economic development. The Berks County Industrial Development Authority and the Greater Berks Development Fund provide site development and redevelopment assistance and financing. The Berks County Workforce Investment Board provides planning and funding for workforce education. The Berks

County of Berks
Management’s Discussion and Analysis
December 31, 2016
(amounts rounded to nearest thousand)
24
Economic Partnership coordinates economic development marketing and outreach business development throughout the County. The Greater Reading Chamber of Commerce and Industry advocates for local businesses and provides training assistance. Berks County continued to be third in Pennsylvania and among the top 100 counties in the entire nation in value of farm products sold as of the 2012 census. More than 40% of the County’s 864 square miles are dedicated to farming. The County’s growing farmland preservation program is designed to preserve the best lands for agricultural production and maintain viability of the County’s agricultural businesses. The County purchased agricultural preservation easements for over 1,458 additional acres during 2016, bringing total acreage under preservation to 70,469 acres on 713 farms. Overall, the County economy continues to show slow and steady growth. The labor market remains strong and the labor force grew 1.5% this past year. The unemployment rate remained nearly steady and continues to be below the national level. Manufacturing remains the largest employment sector of Berks County’s economy and contributes the most to Berks County’s GDP. In July, East Penn Manufacturing opened a $150 million expansion facility at its Lyons campus, ultimately creating several hundred additional manufacturing jobs. In October, the Reading Health System completed its $346 million expansion project and opened its multilevel surgical Healthplex building, thereby increasing campus space by 20%. The System continues to open numerous urgent care and surgical facilities throughout the County.
Market impact on investment income
The County did experience, however, a significant increase in its investment earnings during the year ($1,476 in 2016 versus $1,135 in 2015). This is primarily attributed to a change in the County’s investment policy in 2015 and the rising interest rates since 2015. In 2015, the Commissioners approved County investments in Treasuries, Fanny Maes and Freddie Macs, all instruments which traditionally produce higher rates of return than traditional money market accounts. The Commonwealth of Pennsylvania restricts county investments to government secured funds and certificates of deposit. The County uses LIBOR-based programs that have historically yielded a higher rate of return than standard money market and CD rates. The County’s Retirement Fund, with December 31, 2016 net position valued at $417,550, experienced investment income, net of investment expense, of $29,260 during 2016. During the year, the Retirement Fund had a diversified asset allocation program as discussed in Note 2. Due to the prefunding of the pension plan in 2012 with cash and pension bonds totaling $60,000, the County has minimized future required contributions to the plan. Based on investment experience and the prefunding of the plan, the contributions in 2016 were $2,089, which is an increase from $1,409 in 2015, and $234 in 2014. The actuary for the fund uses an aggregate, five-year smoothed market valuation method to calculate the fund requirements. The County has fully funded the required contribution in 2016. The County has received the latest report from this actuary indicating that its annual certified actuarially determined contribution for the 2017 will be $2,601. The 2017 contribution is 2.48 percent of estimated 2017 compensation of $104,730.

County of Berks
Management’s Discussion and Analysis
December 31, 2016
(amounts rounded to nearest thousand)
25
Government funding
The County relies heavily on federal and state operating grants and contributions for many of its programs. In 2016, 45.6 percent of total government-wide revenues came from these sources. By comparison, property taxes provide only 29.8 percent of government-wide revenues. Uncertainty about the direction and timing of federal and state budgets, especially their impact on the County’s human services programs, will have a direct effect on the programs and services in which the County participates.
Next Year’s Budget
For 2017, the County adopted a balanced budget at $496,480 in revenues, through the use of $3,636 of fund balance reserves to offset a revenue shortfall to expenditures. It was decided that it would be more prudent to absorb this deficit with these reserves to balance the budget, rather than increase property taxes. The budget assumes federal and state funding will satisfy the demand for our core human services levels throughout 2017. The 2017 budget continues to focus on several fiscal initiatives including, but not limited to:
• no property tax increase
• balanced operating budget without reserves
• limited headcount growth
• no issuance of new debt
• continued commitment to farmland preservation, education, economic development, library and park systems.
As in the current year, the greatest challenge to the upcoming 2016 operating budget continues to be the revenue compression coming from both the federal and state government grant programs and the minimal revenue increases coming from assessed values and property taxes. As the agencies develop their 2017 and forward budgets, the County is likely to receive less federal and state funding for mandated services in Children and Youth, Juvenile Probation and Aging services. This anticipated reduction in federal and state funding, combined with escalating wage, healthcare, pension and fuel costs, continues to put tremendous pressure on our budget. The average rate of inflation in personnel costs continues to outpace the rate of growth in property tax revenue. Traditional sources for increased in tax revenue from higher assessed property values are not keeping up with growing inflationary and non-inflationary costs. Other revenue sources, such as those in Health Choices and Mental Health Developmental Disabilities, are restricted, and cannot be used to fund general County services. To mitigate the impact of these negative budget factors, County management continues its multiple-strategy approach to reducing operating costs. One goal centers on continued prioritization and evaluation of all programs, to reduce or eliminate discretionary service costs to the level needed to balance the budget at the current tax rate. Another goal is to continually identify and implement continuing process improvement methods internally to effectively minimize cost. Such efforts include re-designing processes, consolidating office locations, automation of records, maintaining vigilant cost containment measures to scrutinize all wage and benefit costs and maintaining healthcare and workers’ compensation policies that utilize self-insurance to control the growth in personnel-related costs. In addition, the County is committed to maintaining an intensive legislative effort through an association of County Commissioners to preserve key federal and state funding streams.

County of Berks
Management’s Discussion and Analysis
December 31, 2016
(amounts rounded to nearest thousand)
26
CONTACTING THE COUNTY’S FINANCIAL MANAGEMENT This financial report is designed to provide citizens, taxpayers, customers, investors and creditors with a general overview of the County’s finances, and to demonstrate the County’s accountability for those finances. Questions concerning this financial information or requests for additional information should be directed to:
County of Berks Office of the Controller
633 Court Street, 12th floor Reading PA 19601-4311
Phone: 610-478-6150 Fax: 610-478-6890
Email: [email protected]

FINANCIAL STATEMENTS
This section, along with the Notes to Financial Statements, constitutes the core of
the Comprehensive Annual Financial Report’s financial presentation. It provides
both government-wide financial statements as well as fund financial statements,
and should be read in conjunction with the Notes to Financial Statements.

FS 1

Statement of Net Position County of Berks
December 31, 2016 2016 Comprehensive Annual Financial Report
Governmental Business-type Total Component
Assets: Units
Current assets:
Cash and cash equivalents 76,093,717$ 214,950$ 76,308,667$ 14,533,893$
Cash and cash equivalents, restricted 16,569,618 11,836 16,581,454 510,567
Due from broker 2,250,000 - 2,250,000 -
Investments 24,058,459 - 24,058,459 5,097,762
Investments, restricted 4,895,776 112,432 5,008,208 -
Taxes receivable, net 8,324,914 - 8,324,914 -
Accounts receivable, net 18,337,395 5,548,567 23,885,962 6,943,306
Notes receivable 606,456 - 606,456 -
Due from other governments 15,967,067 1,169,354 17,136,421 329,425
Due from other funds 1,648,954 (1,648,954) - -
Inventories 167,991 160,961 328,952 21,450
Prepaid expenses 4,382,281 52,777 4,435,058 678,556
Restricted deposits - - - 3,294
Total current assets 173,302,628 5,621,923 178,924,551 28,118,253
Noncurrent assets:
Investments 59,132,116 112,432 59,244,548 10,611,277
Loans receivable 9,543,332 - 9,543,332 -
Beneficial interests in perpetual trusts held by others - - - 4,629,846
Restricted assets:
Employee pay advance 63,289 52,733 116,022 -
Interest receivable 1,318,867 - 1,318,867 -
Liens receivable 4,440,349 - 4,440,349 -
Investments 1,667,568 - 1,667,568 -
Net pension asset 5,990,366 1,425,501 7,415,867 -
Collections - works of art - - - 909,433
Capital assets not being depreciated:
Land 13,481,858 - 13,481,858 7,969,936
Historical treasures 2,279,644 - 2,279,644 -
Agland easements 79,371,116 - 79,371,116 103,002
Software in progress 3,087,896 - 3,087,896 -
Construction in progress 19,182,126 17,642 19,199,768 2,784,448
Capital assets, net of accumulated depreciation:
Land improvements, net 2,306,634 - 2,306,634 -
Buildings and improvements, net 95,919,843 34,814,425 130,734,268 42,950,538
Furniture, fixtures, equipment and vehicles, net 59,311,440 699,027 60,010,467 3,065,735
Infrastructure, net 10,280,914 - 10,280,914 20,495,307
Leasehold improvements - - - 824,512
Total noncurrent assets 367,377,358 37,121,760 404,499,118 94,344,034
Deferred outflows of resources:
Unamortized bond refunding loss 5,094,000 253,929 5,347,929 -
Derivatives 1,929,984 80,354 2,010,338 -
Pension 20,708,308 4,914,556 25,622,864 166,816
Deferred charge on bond refunding - - - 254,843
Pension contributions made subsequent
to the measurement date - - - 304,638
Total deferred outflows of resources 27,732,292 5,248,839 32,981,131 726,297
Total assets and deferred outflows of resources 568,412,278 47,992,522 616,404,800 123,188,584
Primary Government
FS 2

Statement of Net Position County of Berks
December 31, 2016 2016 Comprehensive Annual Financial Report
Governmental Business-type Total Component
Liabilities: Units
Current liabilities:
Accounts payable 29,716,670$ 1,626,536$ 31,343,206$ 1,454,643$
Accrued liabilities 6,274,313 1,404,286 7,678,599 1,084,256
Due to other governments 936,566 - 936,566 -
Unearned revenue - - - 4,349,325
Advance revenue 1,958,117 - 1,958,117 -
Due to third parties 1,787,755 - 1,787,755 -
Accrued interest payable 1,304,236 130,179 1,434,415 -
Compensated absences 1,103,405 324,278 1,427,683 380,295
Deposits - - - 37,143
Accrued claims health insurance 8,274,622 402,760 8,677,382 -
Accrued claims liability 207,971 159,953 367,924 -
Notes payable, agricultural easement 96,505 - 96,505 -
Lease obligations - - - 4,136
Bonds, loans and notes payable 19,676,075 418,780 20,094,855 1,455,411
Total current liabilities 71,336,235 4,466,772 75,803,007 8,765,209
Noncurrent liabilities:
Compensated absences 3,288,588 625,121 3,913,709 388,984
Accrued claims liability 1,580,260 1,215,390 2,795,650 400,000
Other postemployment benefit liability - - - 269,841
Lease obligations - - - 12,259
Net pension liability - - - 4,561,577
Bonds, loans and notes payable 207,054,418 26,289,210 233,343,628 15,931,823
Payable from restricted assets 10,508,851 - 10,508,851 -
Total noncurrent liabilities 222,432,117 28,129,721 250,561,838 21,564,484
Total liabilities 293,768,352 32,596,493 326,364,845 30,329,693
Deferred inflows of resources:
Unearned grant/other revenue 10,153,864 107,046 10,260,910 -
Hedging derivative 1,084,333 - 1,084,333
Deferred rent revenue - - - 2,796,417
Pension 2,151,503 514,353 2,665,856 133,623
Unamortized bond refunding gain - 609,588 609,588 -
Total deferred inflows of resources 13,389,700 1,230,987 14,620,687 2,930,040
Net position:
Net investment in capital assets 81,931,824 13,723,645 95,655,469 61,044,692
Restricted for:
Gift fund 14,867 - 14,867 -
Farmland preservation 1,055,553 - 1,055,553 -
Hazmat response 1,499,667 - 1,499,667 -
Act 198 - Courts 344,740 - 344,740 -
Workers' compensation 287,514 - 287,514
Special revenue funds 36,207,731 - 36,207,731 -
Services Center Parking Garage 270,628 - 270,628
Act 13 Marcellus Shale 727,468 - 727,468
Debt service - - - 510,567
Foundation for Reading Area Community College - - - 13,673,776
Unrestricted net position (deficit) 138,914,234 441,397 139,355,631 14,699,816
Total net position 261,254,226$ 14,165,042$ 275,419,268$ 89,928,851$
See accompanying notes to the financial statements.
Primary Government
FS 3

Statement of Activities County of Berks
Year ended December 31, 2016 2016 Comprehensive Annual Financial Report
Program Revenues
Indirect Charges Operating Capital
Expense for Grants and Grants and
Expenses Allocation Services Contributions Contributions
Functions/Programs:
Primary government:
Governmental activities:
General government 51,235,822$ (15,153,245)$ 8,170,571$ 89,644$ -$
Judicial 43,659,243 6,503,509 12,480,779 1,703,929 -
Public safety 70,278,919 3,414,455 16,595,735 8,032,874 156,739
Human services 192,703,304 2,666,925 1,529,874 182,198,435 599,580
Culture and recreation 7,684,469 363,232 575,744 1,373,661 1,487,590
Community and economic development 5,426,328 309,985 2,035,597 3,229,495 -
Public works 1,004,210 103,952 1,178,078 1,313,101 9,420,215
Community support 570,634 30,971 67,800 - -
Debt service administrative expenses 9,077,433 69,329 1,475,870 - -
Solid waste 1,169,526 7,055 3,647,496 47,636 -
Total governmental activities 382,809,888 (1,683,832) 47,757,544 197,988,775 11,664,124
Business-type activities
Berks County Residential Center 7,576,187 301,251 8,836,182 - -
Berks Heim 45,478,632 1,382,581 47,896,629 - 8,587
Total business-type activities 53,054,819 1,683,832 56,732,811 - 8,587
Total primary government 435,864,707$ -$ 104,490,355$ 197,988,775$ 11,672,711$
Component units:
Total component units 39,781,596$ -$ 8,892,413$ 15,666,567$ -$
FS 4

Statement of Activities County of Berks
Year ended December 31, 2016 2016 Comprehensive Annual Financial Report
Governmental Business-type Component
Activities Activities Total Units
Functions/Programs:
Primary government:
Governmental activities:
General government (27,822,362)$ -$ (27,822,362)$
Judicial (35,978,044) - (35,978,044)
Public safety (48,908,026) - (48,908,026)
Human services (11,042,340) - (11,042,340)
Culture and recreation (4,610,706) - (4,610,706)
Community and economic development (471,221) - (471,221)
Public works 10,803,232 - 10,803,232
Community support (533,805) - (533,805)
Debt service administrative expenses (7,670,892) - (7,670,892)
Solid waste 2,518,551 - 2,518,551
Total governmental activities (123,715,613) - (123,715,613)
Business-type activities
Berks County Residential Center - 958,744 958,744
Berks Heim - 1,044,003 1,044,003
Total business-type activities - 2,002,747 2,002,747
Total primary government (123,715,613) 2,002,747 (121,712,866)
Component units:
Total component units (15,222,616)$
General Revenues
Taxes:
Property taxes, levied for general purposes 136,869,417 - 136,869,417 -
Hotel tax 2,434,126 - 2,434,126 -
Payments in lieu of taxes 237,561 - 237,561 -
Payments from County of Berks - - - 3,100,000
Payments from other governments - - - 10,003,372
Investment earnings 1,474,025 1,986 1,476,011 272,675
Change in fair value of interest rate swaps (1,109,819) (78,729) (1,188,548) -
Miscellaneous/other 4,945,007 - 4,945,007 2,315,084
Gain on disposal of capital assets 86,776 - 86,776 7,758
Rental of space 464,950 - 464,950 -
Transfers (146,980) 146,980 - -
Total general revenue and transfers 145,255,063 70,237 145,325,300 15,698,889
Change in net position 21,539,450 2,072,984 23,612,434 476,273
Net position - beginning, as restated 239,714,776 12,092,058 251,806,834 89,452,578
Net position, ending 261,254,226$ 14,165,042$ 275,419,268$ 89,928,851$
See accompanying notes to the financial statements.
Primary Government
Net (Expense) Revenue and Changes in Net Position
FS 5

Balance Sheet County of Berks
Governmental Funds 2016 Comprehensive Annual Financial Report
December 31, 2016
General Children and Health Total
Fund Youth Services Choices Nonmajor Governmental
Assets
Cash and cash equivalents 49,470,725$ 1,300$ 18,170,777$ 8,450,915$ 76,093,717$
Cash and cash equivalents, restricted 2,787,368 14,867 2,770,188 10,997,195 16,569,618
Due from broker 2,250,000 - - - 2,250,000
Investments 22,505,423 - - 1,553,036 24,058,459
Investments, restricted 883,568 - 4,012,208 - 4,895,776
Taxes receivable 8,142,149 - - 182,765 8,324,914
Accounts receivable 16,131,599 6,215 - 2,262,784 18,400,598
Accrued interest receivable 227,345 - 2,115 1,043,861 1,273,321
Due from other governments 3,312,883 5,331,302 - 7,322,968 15,967,153
Due from other funds - 4,303,071 93,059 4,999,989 9,396,119
Inventories 167,991 - - - 167,991
Prepaid expenses 1,554,364 - - 2,827,917 4,382,281
Loans receivable 3,954,788 - - 4,440,349 8,395,137
Investments, non-current 58,385,116 - - 747,000 59,132,116
Investments, non-current, restricted 799,568 - 868,000 - 1,667,568
Total assets 170,572,887$ 9,656,755$ 25,916,347$ 44,828,779$ 250,974,768$
Liabilities
Accounts payable 4,538,926$ 6,166,762$ 8,712,920$ 10,297,202$ 29,715,810
Accrued liabilities 4,294,692 396,431 14,152 922,528 5,627,803
Due to other funds 2,025,889 - - 5,721,276 7,747,165
Due to other governments 936,566 - - - 936,566
Unearned revenue 1,553,994 2,906,779 - 5,693,090 10,153,863
Due to third parties 1,842,107 - - - 1,842,107
Accrued claims health insurance 1,234,017 148,978 6,684,720 - 8,067,715
Payable from restricted assets 596,523 - 10,504,555 4,451 11,105,529
Total liabilities 17,022,714 9,618,950 25,916,347 22,638,547 75,196,558
Deferred inflows of resources
Unavailable property taxes 6,033,501 - - - 6,033,501
Other unavailable 12,675,518 2,054 - 5,484,898 18,162,470
Total deferred inflows of resources 18,709,019 2,054 - 5,484,898 24,195,971
Fund balances:
Nonspendable 1,641,843 4,560 - 2,832,318 4,478,721
Restricted 2,859,389 31,191 - 13,873,016 16,763,596
Committed 7,327,174 - - - 7,327,174
Assigned 4,082,537 - - - 4,082,537
Unassigned 118,930,211 - - - 118,930,211
Total fund balances 134,841,154 35,751 - 16,705,334 151,582,239
Total liabilities, deferred inflows of
resources and fund balances 170,572,887$ 9,656,755$ 25,916,347$ 44,828,779$ 250,974,768$
See accompanying notes to the financial statements.
FS 6

Reconciliation of the Governmental Funds Balance Sheet County of Berks
to the Statement of Net Position 2016 Comprehensive Annual Financial Report
December 31, 2016
Total fund balances for governmental funds 151,582,239$
Total net position reported for governmental activities in the statement of net position is different
because:
Capital assets used in governmental activities are not financial resources and therefore are not
reported in the funds. Those assets consist of:
Land and improvements, net 15,788,492$
Agland easements 79,371,116
Infrastructure, net 10,280,914
Building and improvements, net 95,919,843
Furniture, fixtures, equipment and vehicles, net 59,311,440
Historical treasures 2,279,644
Software in Progress 3,087,896
Construction in progress 19,182,126
285,221,471
These pension items are not financial resources and therefore not reported in the funds.
Net pension asset 5,990,366
Deferred outflow of resources 20,708,308
Deferred inflow of resources (2,151,503)
Revenue that was not available soon enough to pay for the current period's expenditures and,
therefore reported as advance revenue in the funds.
Property taxes 2,376,747
Delinquent property taxes 3,656,754
Clerk of Courts departmental charges and reimbursements 9,059,873
Community Development liens receivable 5,484,210
District Justices departmental charges and reimbursements 1,660,269
22,237,853
Other assets not available to pay for current period's expenditures and therefore not reported in the
funds.
Amount due from Greater Berks Development Fund for outstanding bonds payable 6,195,000
Accrued interest receivable from Greater Berks Development Fund 45,546
6,240,546
Other liabilities not paid until future periods that are a current period expense.
Payroll and payroll taxes (203,245)
Long-term liabilities related to the County's governmental activities, including bonds payable, are not
due and payable in the current period and therefore are not reported as fund liabilities. Interest on long-
term debt is not accrued in governmental funds, but is recognized as an expenditure when due. Both
current and long-term liabilities are reported in the statement of net position. Amounts borrowed are
recognized when received in the governmental funds and increase fund balance. Amounts disbursed
to paying agents are paid from governmental funds and reduce fund balance.
Balances at December 31, 2016 are:
Swap agreements/deferred inflow for hedging swap agreements 845,651
Accrued interest on bonds and notes (1,304,236)
Compensated absences (4,391,993)
Accrued claims liabilities (1,788,231)
Bonds and notes payable (221,733,000)
(228,371,809)
Total net position of governmental activities 261,254,226$
See accompanying notes to the financial statements.
FS 7

Statement of Revenues, Expenditures and Changes in Fund Balances County of Berks
Governmental Funds 2016 Comprehensive Annual Financial Report
Year ended December 31, 2016
General Children and Health Total
Fund Youth Services Choices Nonmajor Governmental
Revenues
Taxes:
Property 136,924,879$ -$ -$ -$ 136,924,879$
Hotel - - - 2,434,126 2,434,126
Court costs, fines and forfeitures 3,021,575 - - - 3,021,575
Intergovernmental revenue 13,273,887 35,843,586 102,809,008 58,365,023 210,291,504
Departmental charges and reimbursements 53,119,775 855,447 - 13,159,040 67,134,262
Payments in lieu of taxes 237,561 - - - 237,561
Rentals 400,736 - - 64,214 464,950
Sales of property, supplies and equipment 86,776 - - - 86,776
Investment earnings 1,275,006 8,668 64,096 126,255 1,474,025
Miscellaneous 7,491,100 1,445 - 1,892,251 9,384,796
Total revenues 215,831,295 36,709,146 102,873,104 76,040,909 431,454,454
Expenditures
Current:
General government, administrative 40,848,250 - - 2,713,442 43,561,692
General government, judicial 51,875,934 - - 21,748 51,897,682
Public safety 60,971,781 - - 11,331,715 72,303,496
Human services - 44,092,453 102,857,841 48,648,360 195,598,654
Capital outlay - - 2,143,152 2,143,152
Culture and recreation 8,705,093 - - - 8,705,093
Community and economic development 3,602,108 - - 3,290,111 6,892,219
Public works 197,609 - - 11,496,345 11,693,954
Community support 10,538,809 - - - 10,538,809
Intergovernmental expenditures - Solid waste 928,453 - - - 928,453
Debt service:
Principal 18,896,062 - - - 18,896,062
Interest and fiscal charges 5,106,802 - - - 5,106,802
Debt issuance costs 119,123 - - - 119,123
Administrative expenditures 141,015 - - - 141,015
Total expenditures 201,931,039 44,092,453 102,857,841 79,644,873 428,526,206
Excess (deficiency) of revenues over (under)
expenditures 13,900,256 (7,383,307) 15,263 (3,603,964) 2,928,248
Other financing sources (uses)
Issuance of refunding bonds 9,790,000 - - - 9,790,000
Premium on issuance of refunding bonds 209,950 - - - 209,950
Payment to refunded bonds escrow agent (24,943,412) - - - (24,943,412)
Transfers in 3,715,526 7,746,118 - 11,657,073 23,118,717
Transfers out (19,115,035) (353,287) (15,263) (2,561,157) (22,044,742)
Total other financing sources (uses) (30,342,971) 7,392,831 (15,263) 9,095,916 (13,869,487)
Net changes in fund balances (16,442,715) 9,524 - 5,491,952 (10,941,239)
Fund balances, beginning, as restated 151,283,869 26,227 - 11,213,382 162,523,478
Fund balances, ending 134,841,154$ 35,751$ -$ 16,705,334$ 151,582,239$
See accompanying notes to the financial statements.
FS 8

Reconciliation of Statement of Revenues, Expenditures and Changes in Fund Balances County of Berksof Governmental Funds to the Statement of Activities 2016 Comprehensive Annual Financial ReportYear ended December 31, 2016
Net change in fund balances - total governmental funds (10,941,239)$
Amounts reported for governmental activities in the statement of activities are different because:
Governmental funds report capital outlay as expenditures. However, in the statement of activities,
the cost of those assets is allocated over their estimated useful lives and reported as depreciation
expense. In the current period these amounts are:Expenditures for capital assets / agricultural easements 21,677,911$
Transfer of capital assets from General Fund to Berks County Residential Center (1,140,206) Depreciation expense (11,197,604)
9,340,101
The issuance of long-term debt provides current financial resources to governmental funds, while the
repayment of the principal of long-term debt uses current financial resources. Neither transaction has
any effect on net position. Also, governmental funds report the effect of premiums, discounts, and
similar items when debt is first issued, whereas these amounts are deferred and amortized in the
statement of activities. The net effects of these differences in the current period are:
Change in swap liability (1,109,819) Debt principal repayments 20,031,320 Bond principal borrowings - refunding (9,790,000) Issuance of notes payable (145,307) Payment to escrow agent for refunded bonds 24,943,412 Bond premium/discounts/refunding losses (177,123) Accreted interest (3,718,316)
30,034,167
Interest is expensed when paid in the governmental funds. However, in the government-wide
statements interest is matched to the period in which it was incurred. In the current period the net
effect of matching interest expense to the proper period is: 195,733
Revenues in the statement of activities that are not available to provide current financial resources
are not reported as revenues in the funds. At the government-wide level revenue recognition is not
limited by availability. The effects of these adjustments in the current year are:Taxes (55,462) Services 1,756,060 Notes receivable (1,047,605)
652,993
Some expenses reported in the statement of activities do not require the use of current financial
resources and, therefore, are not reported as expenditures in governmental funds:Payroll, payroll taxes, and select employee benefits (8,667) Net pension obligation (7,733,638)
(7,742,305)
Change in net position of governmental activities 21,539,450$
See accompanying notes to the financial statements.
FS 9

Statement of Net Position County of Berks
Proprietary Funds - Enterprise Funds 2016 Comprehensive Annual Financial Report
December 31, 2016
Berks County
Residential Berks
Center Heim Totals
Assets:
Current assets:
Cash and cash equivalents 1,000$ 213,950$ 214,950$
Cash and cash equivalents, restricted - 11,836 11,836
Investments, restricted - 112,432 112,432
Accounts receivable, net - 5,548,567 5,548,567
Due from other governments 1,169,354 - 1,169,354
Due from other funds 933,383 - 933,383
Inventories 68,273 92,688 160,961
Prepaid expenses - 52,777 52,777
Total current assets 2,172,010 6,032,250 8,204,260
Noncurrent assets:
Employee pay advance - 52,733 52,733
Investments - 112,432 112,432
Pension asset 215,374 1,210,127 1,425,501
Capital assets:
Buildings and improvements, net 8,158,674 26,655,751 34,814,425
Furniture, fixtures, equipment and vehicles, net 70,779 628,248 699,027
Construction in progress - 17,642 17,642
Total noncurrent assets 8,444,827 28,676,933 37,121,760
Deferred outflows of resources:
Pension 733,657 4,180,899 4,914,556
Unamortized bond refunding loss 253,929 - 253,929
Derivatives 11,917 68,437 80,354
Total deferred outflows of resources 999,503 4,249,336 5,248,839
Total assets and deferred outflows of resources 11,616,340 38,958,519 50,574,859
Liabilities:
Current liabilities:
Accounts payable 380,798 1,245,738 1,626,536
Accrued liabilities 304,714 1,099,572 1,404,286
Due to other funds - 2,582,337 2,582,337
Accrued interest payable 17,737 112,442 130,179
Compensated absences 35,169 289,109 324,278
Accrued claims health insurance 65,051 337,709 402,760
Accrued claims liability 8,428 151,525 159,953
Bonds payable, net 58,843 359,937 418,780
Total current liabilities 870,740 6,178,369 7,049,109
Noncurrent liabilities:
Compensated absences 91,039 534,082 625,121
Accrued claims liability 64,037 1,151,353 1,215,390
Bonds payable, net 3,618,158 22,671,052 26,289,210
Total noncurrent liabilities 3,773,234 24,356,487 28,129,721
Total liabilities 4,643,974 30,534,856 35,178,830
Deferred inflows of resources:
Unearned revenue 74,037 - 74,037
Unearned grant revenue - 33,009 33,009
Unamortized bond refunding gain - 609,588 609,588
Pension 79,036 435,317 514,353
Total deferred inflows of resources 153,073 1,077,914 1,230,987
Net position:
Net investment in capital assets 5,587,420 8,136,225 13,723,645
Unrestricted net position (deficit) 1,231,873 (790,476) 441,397
Total net position 6,819,293$ 7,345,749$ 14,165,042$
See accompanying notes to the financial statements.
FS 10

Statement of Revenues, Expenses and Changes in Fund Net Position County of Berks
Proprietary Funds - Enterprise Funds 2016 Comprehensive Annual Financial Report
Year ended December 31, 2016
Berks County
Residential Berks
Center Heim Totals
Operating revenues
Charges for services 6,569,647$ 38,757,649$ 45,327,296$
Other operating revenues 2,266,535 9,138,980 11,405,515
Total operating revenues 8,836,182 47,896,629 56,732,811
Operating expenses
Program services 7,378,331 33,751,870 41,130,201
Administrative expenses - 6,209,680 6,209,680
Depreciation 360,298 1,076,797 1,437,095
Total operating expenses 7,738,629 41,038,347 48,776,976
Operating income 1,097,553 6,858,282 7,955,835
Nonoperating revenues (expenses)
Grants - 8,587 8,587
Investment earnings - 1,986 1,986
Change in fair value of interest rate swaps (11,701) (67,028) (78,729)
Interest expense (138,809) (877,859) (1,016,668)
Contribution to General Fund - (4,945,007) (4,945,007)
Total nonoperating revenues (expenses) (150,510) (5,879,321) (6,029,831)
Income before transfers 947,043 978,961 1,926,004
Transfers in 1,220,957 15,000 1,235,957
Transfers out (1,088,977) - (1,088,977)
Change in net position 1,079,023 993,961 2,072,984
Total net position, beginning, as restated 5,740,270 6,351,788 12,092,058
Total net position, ending 6,819,293$ 7,345,749$ 14,165,042$
See accompanying notes to the financial statements.
FS 11

Statement of Cash Flows County of Berks
Proprietary Funds - Enterprise Funds 2016 Comprehensive Annual Financial Report
Year ended December 31, 2016
Berks County
Residential Berks
Center Heim Totals
Cash flows from operating activities
Receipts from customers 8,865,064$ 48,428,146$ 57,293,210$
Payments to suppliers (2,191,655) (10,647,982) (12,839,637)
Payments to employees (4,591,894) (27,586,100) (32,177,994)
Net cash provided by operating activities 2,081,515 10,194,064 12,275,579
Cash flows from noncapital financing activities
Principal paid on bonds (27,963) (160,506) (188,469)
Receipts from other governments - 8,587 8,587
Interest paid (21,147) (121,169) (142,316)
Contribution from General Fund - (4,945,007) (4,945,007)
Transfers from (to) other funds (1,088,977) 15,000 (1,073,977)
Amounts due from (to) other funds (730,671) (3,812,141) (4,542,812)
Net cash used by noncapital financing activities (1,868,758) (9,015,236) (10,883,994)
Cash flows from capital and related financing activities
Principal paid on bonds (75,900) (484,800) (560,700)
Interest paid (117,888) (757,685) (875,573)
Construction in progress - (17,642) (17,642)
Purchase of capital assets (18,969) (44,112) (63,081)
Net cash used by capital and related financing activities (212,757) (1,304,239) (1,516,996)
Cash flows from investing activities
Investment earnings received - 1,986 1,986
Net cash provided by investing activties - 1,986 1,986
Net decrease in cash and cash equivalents - (123,425) (123,425)
Cash and cash equivalents, beginning 1,000 349,211 350,211
Cash and cash equivalents, ending 1,000$ 225,786$ 226,786$
Reconciliation of operating income to net cash
provided by operating activities:
Operating income 1,097,553$ 6,858,282$ 7,955,835$
Adjustments to reconcile operating income to net cash
provided by operating activities:
Depreciation expense 360,298 1,076,797 1,437,095
Amortization of bond premium (28,680) (181,641) (210,321)
Amortization of refunding loss 21,161 (50,799) (29,638)
Changes in assets and liabilities:
Accounts receivable, net - 636,493 636,493
Due from other governments (45,155) - (45,155)
Employee pay advance - 10,342 10,342
Inventories (6,235) 2,879 (3,356)
Prepaid expenses - 2,399 2,399
Pension asset, net 45,724 226,555 272,279
Pension deferred outflow 273,420 1,356,334 1,629,754
Accounts payable and accrued liabilities 299,847 582,375 882,222
Unearned revenue 74,037 - 74,037
Unearned grant revenue - (104,976) (104,976)
Due to third parties - (1,166) (1,166)
Compensated absences (9,860) (194,645) (204,505)
Accrued claims health insurance 5,308 17,040 22,348
Accrued claims liability (4,502) (35,253) (39,755)
Pension deferred inflow (1,401) (6,952) (8,353)
Net cash provided by operating activities 2,081,515$ 10,194,064$ 12,275,579$
See accompanying notes to the financial statements.
FS 12

Statement of Fiduciary Net Position County of Berks
Fiduciary Funds 2016 Comprehensive Annual Financial Report
December 31, 2016
Berks County
Employees'
Retirement Agency
Assets
Cash and cash equivalents 177,527$ 9,434,186$
Receivables:
Contributions receivable 315,889 -
Investment income receivable 233,037 -
Total receivables 548,926 -
Investments, at fair value (see Note 2):
Fixed income securities 137,688,144 -
Domestic equities 131,260,932 -
International equities 58,279,149 -
Real estate/Alternative 89,968,300 -
Certificates of deposit - 2,856,982
Total investments 417,196,525 2,856,982
Total assets 417,922,978 12,291,168
Liabilities
Accounts payable 357,421 -
Accrued liabilities 209 -
Due to third parties 15,319 12,291,168
Total liabilities 372,949 12,291,168$
Net position
Net position restricted for pension 417,550,029$
See accompanying notes to the financial statements.
FS 13

Statement of Changes in Fiduciary Net Position County of Berks
Fiduciary Funds 2016 Comprehensive Annual Financial Report
Year ended December 31, 2016
Berks County
Employees'
Retirement
Additions
Contributions:
Member 6,500,174$
County 2,088,776
Total contributions 8,588,950
Investment income:
Net increase in fair value of investments 22,424,460
Interest and dividends 8,273,382
Less investment expenses (1,438,286)
Net investment income 29,259,556
Other 32,040
Total additions 37,880,546
Deductions
Benefit payments, including refunds of member contributions 19,382,777
Administrative expense 71,068
Total deductions 19,453,845
Change in net position 18,426,701
Net position restricted for pension, beginning 399,123,328
Net position restricted for pension, ending 417,550,029$
See accompanying notes to the financial statements.
FS 14

Statement of Net Position (Deficit) County of Berks
Component Units 2016 Comprehensive Annual Financial Report
December 31, 2016Reading
Berks County Regional Reading Area
Solid Waste Airport Community
Authority Authority ** College * Total
Assets
Current assets:Cash and cash equivalents 247,185$ 2,084,540$ 12,202,168$ 14,533,893$ Cash and cash equivalents, restricted - 510,567 - 510,567 Investments - - 5,097,762 5,097,762 Accounts receivable, net 142,933 277,536 6,522,837 6,943,306 Due from other governments - 329,425 - 329,425 Inventories - - 21,450 21,450 Prepaid expenses 14,143 24,332 640,081 678,556 Deposits - 3,294 - 3,294
Total current assets 404,261 3,229,694 24,484,298 28,118,253
Noncurrent assets:
Investments - - 10,611,277 10,611,277 Beneficial interests in perpetual trusts held by others - - 4,629,846 4,629,846 Collections - works of art - - 909,433 909,433 Capital assets:
Land and improvements, net 111,957 6,776,423 1,081,556 7,969,936 Air easement rights - 103,002 - 103,002 Infrastructure, net - 20,495,307 - 20,495,307 Buildings and improvements, net - 6,452,356 36,498,182 42,950,538 Furniture, fixtures, equipment and vehicles, net 104,754 753,115 2,207,866 3,065,735 Leasehold improvements - 824,512 - 824,512 Construction in progress 65,328 2,386,614 332,506 2,784,448
Total noncurrent assets 282,039 37,791,329 56,270,666 94,344,034
Deferred outflows of resources:
Deferred charge on bond refunding - - 254,843 254,843 Pension - - 166,816 166,816
Pension contributions made subsequent to the measurement date - - 304,638 304,638
Total deferred outflows of resources - - 726,297 726,297
Total assets and deferred outflows of resources 686,300 41,021,023 81,481,261 123,188,584
Liabilities
Accounts payable 7,118 399,032 1,048,493 1,454,643 Accrued liabilities 8,710 6,091 1,069,455 1,084,256 Unearned revenue - 46,924 4,302,401 4,349,325 Compensated absences - - 380,295 380,295 Deposits - 37,143 - 37,143 Lease obligations - - 4,136 4,136 Bonds, loans and notes payable - - 1,455,411 1,455,411
Total current liabilities 15,828 489,190 8,260,191 8,765,209
Noncurrent liabilities:
Compensated absences - - 388,984 388,984 Medical insurance liability - - 400,000 400,000 Other postemployment benefit liability - - 269,841 269,841 Lease obligations - - 12,259 12,259 Net pension liability - - 4,561,577 4,561,577
Bonds, loans and notes payable - 4,420,000 11,511,823 15,931,823
Total noncurrent liabilities - 4,420,000 17,144,484 21,564,484
Total liabilities 15,828 4,909,190 25,404,675 30,329,693
Deferred inflows of resources
Deferred rent revenue - 2,796,417 - 2,796,417 Deferred pension expense - - 133,623 133,623
Total deferred inflows of resources - 2,796,417 133,623 2,930,040
Net position:
Net investment in capital assets 282,039 33,371,329 27,391,324 61,044,692 Restricted for:
Debt service - 510,567 - 510,567 Foundation for Reading Area Community College - - 13,673,776 13,673,776
Unrestricted net position (deficit) 388,433 (566,480) 14,877,863 14,699,816
Total net position 670,472$ 33,315,416$ 55,942,963$ 89,928,851$
* Presented as of June 30, 2016** Presented as of September 30, 2016
See accompanying notes to the financial statements.
FS 15

Statement of Activities/Revenues, Expenses and Changes in Net Position (Deficits) County of Berks
Component Units 2016 Comprehensive Annual Financial Report
Year ended December 31, 2016Reading
Berks County Regional Reading Area
Solid Waste Airport Community
Authority Authority ** College * Total
Operating revenues
Charges for services 428,922$ 2,194,015$ 5,096,070$ 7,719,007$
Charges for services (from County of Berks) 1,173,406 - - 1,173,406
Operating grants and contributions - 1,990,783 13,736,523 15,727,306
Investment earnings - - 123,216 123,216
Other revenues - - 2,246,562 2,246,562
Total operating revenues 1,602,328 4,184,798 21,202,371 26,989,497
Total operating expenses 727,481 3,811,366 34,573,207 39,112,054
Operating income (loss) 874,847 373,432 (13,370,836) (12,122,557)
Nonoperating revenues (expenses)Payments from County of Berks - - 3,100,000 3,100,000 Payments from other governments - - 8,760,192 8,760,192 Contributions to County of Berks (60,739) - - (60,739) Investment income 4,398 4,564 140,497 149,459 Interest expense (6,703) (123,999) (538,840) (669,542) Gain on disposal of capital assets - - 7,758 7,758 Miscellaneous income (loss) (108,086) 60,794 - (47,292)
Total nonoperating revenues (expenses) (171,130) (58,641) 11,469,607 11,239,836
Other revenues:
Payments from other governments - - 1,243,180 1,243,180
Long-term gifts and grants - - 82,474 82,474
Insurance proceeds - - 33,340 33,340
Total other revenues - - 1,358,994 1,358,994
Change in net position (deficit) 703,717 314,791 (542,235) 476,273
Net position (deficit) - beginning, as restated (33,245) 33,000,625 56,485,198 89,452,578
Total net position, ending 670,472$ 33,315,416$ 55,942,963$ 89,928,851$
* Presented for the year ended June 30, 2016
** Presented for the year ended September 30, 2016
See accompanying notes to the financial statements.
FS 16

NOTES TO FINANCIAL STATEMENTS
The Notes to Financial Statements complete the core of the Annual Financial
Report’s financial section. They are intended to provide a more complete disclo-
sure of relevant information than can be presented in the numeric format of the
financial statements.

N 1
NOTE 1: SUMMARY OF SIGNIFICANT ACCOUNTING POLICIES The financial statements of the County of Berks (the County) were prepared in accordance with accounting principles generally accepted in the United States of America (“GAAP”), consistently applied, applicable to governmental units, as prescribed by the Governmental Accounting Standards Board (“GASB”).
A. The financial reporting entity
The County of Berks, Pennsylvania, was formed on March 11, 1752. The County is a political subdivision of the Commonwealth of Pennsylvania. The County is a Third Class county based on population. The County operates under the direction of an elected Board of Commissioners consisting of three members. The County provides the following services: general administrative services, tax assessment and collection, judicial, public improvements, public safety, conservation and development, and human services programs.
Accounting principles generally accepted in the United States of America require that the reporting entity consists of the primary government and organizations for which the primary government is financially accountable. In addition, the primary government may determine through the exercise of management’s professional judgment that the inclusion of an organization that does not meet the financial accountability criteria is necessary in order to prevent the reporting entity’s financial statements from being misleading. In such instances, that organization should be included as a component unit if the nature and significance of their relationship with the primary government or other component units are such that the exclusion from the financial reporting entity would render the financial reporting entity’s financial statements incomplete or misleading. In evaluating how to define the reporting entity, management has considered all potential component units. The decision to include a potential component unit in the reporting entity was made based upon the above criteria. Since two of the County’s component units report on a fiscal year end and are included in the County’s calendar year financial statement, amounts due to/from component units/primary government may not net to zero. The County has elected to include the following discretely presented component units in the financial reporting entity:
• Berks County Solid Waste Authority was created to develop and implement a municipal waste management system for the County consistent with the Berks County Municipal Waste Management Plan. The members of the governing board of the Solid Waste Authority are appointed by the Board of County Commissioners. The County allocates a portion of the landfill host fees to pay the debt service of the Authority, and the County guaranteed the debt of the Solid Waste Authority. The Authority operates on a fiscal year ending December 31.
• The Reading Regional Airport Authority is a public authority created under the Pennsylvania Municipal Authorities Act of 1935 and 1945 and is responsible for the operations of the Reading Regional Airport. The governing body of the Reading Regional Airport Authority is a Board consisting of seven directors who are appointed by the Board of County Commissioners. The County guarantees a portion of the debt of the Reading Regional Airport Authority. The Reading Regional Airport Authority operates on a fiscal year ending September 30.

N 2
• Reading Area Community College is a publicly-supported comprehensive community college, serving primarily Berks County. The Trustees of the governing board of Reading Area Community College are appointed by the Board of County Commissioners. The County sponsors the College and supports its capital expansion initiatives. The Reading Area Community College operates on a fiscal year ending June 30.
Complete and detailed financial statements for the individual component units can be obtained from their administrative offices:
Berks County Solid Waste Authority Berks County Services Center – 14th Floor 633 Court Street Reading, PA 19601
Reading Regional Airport Authority 2501 Bernville Road Reading, PA 19605
Reading Area Community College 10 South Second Street, P.O. Box 1706 Reading, PA 19603-1706
Related organizations
The Board of County Commissioners is also responsible for appointing the members of the governing boards of other organizations, but the County's accountability for these organizations generally does not extend beyond making the appointments. These organizations include:
• Berks Area Regional Transportation Authority • Berks County Conservation District • Berks County Housing Authority • Berks County Industrial Development Authority • Berks County Municipal Authority • Berks County Convention Center Authority • Council on Chemical Abuse, Inc. • Redevelopment Authority of the County of Berks
B. Measurement focus, basis of accounting, and financial statement presentation
The basic financial statements of the County are composed of the following:
• Government-wide financial statements
• Fund financial statements
• Notes to financial statements
1. Government-wide financial statements
Government-wide financial statements display information about the reporting government as a whole, except for its fiduciary activities. These statements include separate columns for the governmental and business-type activities of the primary government, as well as its discretely presented component units. Governmental activities, which normally are supported by taxes

N 3
and intergovernmental revenues, are reported separately from business-type activities, which rely, to a significant extent, on fees and charges for support. Likewise, the primary government is reported separately from the legally separate component units for which the primary government is financially accountable.
Government-wide financial statements are reported using the economic resources measurement focus and the accrual basis of accounting, as are the proprietary fund financial statements. Under the accrual basis of accounting, revenues, expenses, gains, losses, assets, and liabilities resulting from exchange and exchange-like transactions are recognized when the exchange takes place. Revenues, expenses, gains, losses, assets, and liabilities resulting from nonexchange transactions are recognized in accordance with the requirements of GASB Statement No. 33, “Accounting and Financial Reporting for Nonexchange Transactions.” Program revenues include charges for services, special assessments, and payments made by parties outside of the reporting government’s citizenry, if that money is restricted to a particular program. Program revenues are netted with program expenses in the statement of activities to present the net cost of each program. Amounts paid to acquire capital assets are capitalized as assets in the government-wide financial statements, rather than reported as expenditures. Proceeds of long-term debt are recorded as liabilities in the government-wide financial statements, rather than as other financing sources. Amounts paid to reduce long-term indebtedness of the reporting government are reported as a reduction of the related liability, rather than as an expenditure. As a general rule the effect of interfund activity has been eliminated from the government-wide financial statements. Exceptions to this general rule are the yearly contributions made to the component units from the County’s governmental funds and transfers between governmental funds and business-type and fiduciary funds. Elimination of these contributions would distort the direct costs and program revenues reported for the various functions concerned. The County chooses to allocate indirect costs in a separate column in the government-wide financial statements.
2. Fund financial statements
The underlying accounting system of the County is organized and operated on the basis of separate funds, each of which is considered to be a separate accounting entity. The operations of each fund are accounted for with a separate set of self-balancing accounts that comprise its assets, deferred outflows of resources, liabilities, deferred inflows of resources, fund balance, revenues and expenditures or expenses, as appropriate. Governmental resources are allocated to and accounted for in individual funds based upon the purposes for which they are to be spent and the means by which spending activities are controlled. The financial statements for governmental, proprietary, and fiduciary funds are presented after the government-wide financial statements. These statements display information about major funds individually and nonmajor funds in the aggregate for governmental and enterprise funds. The fiduciary statements include financial information for the agency fund and the retirement fund. The agency fund primarily represents assets held by the County in a custodial capacity for other individuals or governments, and do not involve the measurement of results of operations. Agency funds do not have a measurement focus, but assets and liabilities are reported using the accrual basis of accounting. The Berks County Employees’

N 4
Retirement Fund accounts for the additions and deductions to the County’s defined benefit plan in a manner similar to a proprietary fund. When both restricted and unrestricted resources are combined in a fund, expenses are considered to be paid first from restricted resources, and then from unrestricted resources.
• Governmental funds
Governmental fund financial statements are reported using the current financial resources measurement focus and the modified accrual basis of accounting. Revenues are recognized as soon as they are both measurable and available. Revenues are considered to be available when they are collected within the current period or soon enough thereafter to pay liabilities of the current period. For this purpose, the County considers revenues, except property taxes, to be available if they are collected within 180 days of the end of the current fiscal period. Property taxes are deemed available if collected within 60 days of the end of the current fiscal period. Licenses, operating and capital grants, and interest associated with the current fiscal period are all considered to be susceptible to accrual and so have been recognized as revenues of the current fiscal period. All other revenue items are considered to be measurable only when cash is received by the County. Expenditures generally are recorded when a liability is incurred, as under accrual accounting. Under the current financial resources measurement focus, only current assets and current liabilities are generally included on the balance sheet. The reported fund balance is considered to be a measure of “available spendable resources”. Governmental funds operating statements present increases (revenues and other financing sources) and decreases (expenditures and other financing uses) in net current assets. Accordingly, they are said to present a summary of sources and uses of “available spendable resources” during a period.
Non-current portions of long-term receivables due to governmental funds are reported on their balance sheets in spite of their spending measurement focus.
Non-current portions of other long-term receivables are offset by fund balance reserve accounts.
Amounts expended to acquire capital assets are recorded as expenditures in the year that resources were expended, rather than as fund assets. The proceeds of long-term debt are recorded as other financing sources rather than as a fund liability. However, debt service expenditures, as well as expenditures related to compensated absences and claims and judgments, are recorded only when payment is due.
• Proprietary funds
The County’s enterprise funds are proprietary funds. In the fund financial statements, proprietary funds are presented using the accrual basis of accounting and the economic resources measurement focus. Revenues are recognized when they are earned and expenses are recognized when the related goods or services are delivered. All assets and all liabilities (whether current or noncurrent) associated with their activity are included on the statement of net position. Proprietary fund type operating statements present increases (revenues) and decreases (expenses) in total net position.

N 5
Proprietary fund operating revenues and expenses, such as charges for services, program services and administrative expenses, result from exchange transactions associated with the principal activity of the fund. Exchange transactions are those in which each party receives and gives up essentially equal values. Non-operating revenues and expenses, such as operating grants, subsidies, investment earnings, interest expense and bond issuance costs, result from nonexchange transactions or ancillary activities.
Amounts paid to acquire capital assets are capitalized as assets in the fund financial statements, rather than reported as expenses. Proceeds of long-term debt are recorded as a liability in the fund financial statements, rather than as revenue. Amounts paid to reduce long-term indebtedness are reported as a reduction of the related liabilities, rather than an expense.
C. Basis of presentation
The determination of major funds is based on minimum criteria as set forth in GASB Statement No. 34, “Basic Financial Statements – and Management’s Discussion and Analysis – for State and Local
Governments”. The non-major funds are combined in a column in the fund financial statements. The following are the County’s major funds for 2016:
1. Governmental fund types
• General The General Fund accounts for all financial resources except those accounted for in another fund. Revenues of this fund are primarily derived from real estate taxes, state and federal grants, and fees for services. Many of the basic activities of the County are accounted for in this fund, including operation of general County government, the judicial system, public safety, culture and recreation, and some community and economic development and human services.
• Children and Youth Services The Children and Youth Services Fund accounts for financial resources related to the provision of services to children and youth. Revenues of this fund are derived from federal and state grants. Expenditures are restricted to provision of the program.
• Health Choices The Health Choices Fund accounts for financial resources related to the provision of a behavioral health managed care program for medical assistance recipients. Revenues of this fund are derived from state grants. Expenditures are restricted to provision of the program.
2. Proprietary fund types
• Enterprise: Berks County Residential Center The Berks County Residential Center Fund accounts for the operations of the County’s family shelter for immigrants placed by the Federal Government, financed and operated in a manner similar to private business enterprise – where the intent of the governing body is that the cost of providing service to the Federal Government on a continuing basis be financed or recovered primarily through cost reimbursement plans.

N 6
• Enterprise: Berks County Home - Berks Heim The Berks County Home – Berks Heim Fund accounts for operations of the long-term care facility financed and operated in a manner similar to private business enterprises - where the intent of the governing body is that costs of providing services to the general public on a continuing basis be financed or recovered primarily through user charges and cost reimbursement plans.
3. Other fund types
• Retirement Trust The Berks County Employees’ Retirement Trust Fund accounts for the revenue (i.e., member contributions, County appropriations, and net investment income) and the expenditures (i.e., allowance contributions refunded, retirement allowances, and death benefits paid) of the County’s defined benefit retirement plan.
• Agency Agency funds consist of restricted assets of the various row offices and other fiduciary accounts of the County. Row office funds for bail posted, sheriff's sales, realty transfer taxes held and owed to other governmental entities, and other funds reserved for disposition of legal actions, by Berks Heim for residents and by the prison for inmates, are mainly escrow funds.
D. Investments
Investments of all funds are stated at fair value based on quoted market values.
E. Cash and cash equivalents
The County considers all unrestricted highly liquid investments with a maturity of three months or less when purchased to be cash equivalents.
F. Receivables
All property taxes receivable, accounts receivable, interest and liens receivable are shown net of an allowance for uncollectible amounts. The allowance for property taxes is equal to .09 percent of the 2016 property tax levy outstanding at December 31, 2016. The allowance for court fines, fees and costs is equal to 90 percent of the outstanding accounts receivable at December 31, 2016. The allowance for district justices’ fines and court costs is equal to 40 percent of the outstanding accounts receivable at December 31, 2016. The allowance for liens for the closing cost assistance program is equal to 100 percent of the outstanding balance at December 31, 2016. The allowance for liens and interest for property rehabilitation and certain mortgage programs is equal to 20 percent of the outstanding balance at December 31, 2016.
G. Interfund transactions
As a result of its operations, the County affects a variety of transactions between funds to finance operations. Accordingly, to the extent that certain interfund transactions have not been paid or received, appropriate interfund receivables or payables have been established.
Any residual balances outstanding between the governmental activities and business-type activities are reported in the government-wide financial statements as internal balances.

N 7
H. Inventories and prepaid items
Inventories are valued at cost using the first-in, first-out method. Inventories in excess of $25,000 for governmental funds are recorded as expenditures when consumed rather than when purchased. Office supplies such as paper and copier supplies are not considered inventory, and are recorded as expenditures/expenses when purchased. In governmental fund types, there is a reservation of fund balance equal to the inventory balance as these amounts are not available for appropriation.
Certain payments to vendors reflect costs applicable to future accounting periods, and are recorded as prepaid items in both government-wide and fund financial statements, using the consumption method. In governmental fund types, there is a reservation of fund balance equal to the prepaid items as these amounts are not available for appropriation.
I. Restricted assets
Restricted assets represent revenues set aside for liquidation of specific obligations, as detailed in Note 3.
J. Capital assets
Capital assets, which include property, equipment and infrastructure (bridges acquired, reconstructed or significantly improved in years ending after December 31, 1980), are reported in the applicable governmental or business-type activities columns on the government-wide financial statements. Capital assets are defined by the County as assets with an initial, individual or system (multiple items that rely on each other to function) cost of $5,000 ($75,000 for infrastructure assets) and an estimated useful life exceeding one year. Such assets are recorded at historical costs. Donated capital assets are recorded at the estimated fair market value at the time of donation.
The costs of normal maintenance and repairs that do not add to the value of the asset or materially extend its useful life are not capitalized. Major outlays for capital assets and improvements are capitalized as projects are constructed. Interest incurred during the construction phase of capital assets of business-type activities is included as part of the capitalized value of the assets constructed.
In order to preserve farmland and open space, the County purchases agricultural easements. An agricultural easement restricts the use of land from commercial development in perpetuity and encourages the continued agricultural use of land. An easement is thus considered an intangible asset of the County, and recorded in the government-wide financial statements.
The capital assets (see Note 6) of the County are depreciated/amortized using the straight-line method over the following estimated useful lives:
Land improvements 20 years
Buildings and improvements 10 - 45 years
Machinery and equipment 6 - 10 years
Motor vehicles 3 - 5 years
Computer equipment 3 - 5 years
Infrastructure 40 years

N 8
K. Deferred outflows/inflows of resources
A deferred outflow of resources represents a consumption of net position that applies to a future period not recognized as an outflow of resources until that future period. A deferred inflow of resources represents an acquisition of net position that applies to a future period not recognized as an inflow of resources until that future period.
L. Fund balance
In the fund financial statements, the County has established and will maintain reservations of fund balance in accordance with GASB Statement No. 54 (GASB 54), “Fund Balance Reporting and
Governmental Fund Type Definitions.” GASB 54 establishes criteria to report fund balance as nonspendable, restricted, committed, assigned or unassigned based on the required restraints on the resource. This policy applies to the County’s General Fund and all governmental funds. Fund balance information is used to identify the available resources to repay long-term debt, reduce property taxes, add new governmental programs, expand existing programs or enhance the financial position of the County in accordance with policies established by the Board of Commissioners. Please refer to Note 11 for more information on fund balance.
M. Net Position
GASB Statement No. 63 (GASB 63), “Financial Reporting of Deferred Outflows of Resources,
Deferred Inflows of Resources, and Net Position,” requires the classification of net position into the three components shown below, which are defined as follows:
Net Investment in capital assets – This category groups all capital assets, including infrastructure, into one component of net position. Accumulated depreciation and the outstanding balances of debt that are attributable to the acquisition, construction or improvement of these assets reduce the balance in this category. Restricted net position – This category presents external restrictions imposed by creditors, grantors, contributors or laws or regulations of other governments and restrictions imposed by law through constitutional provisions or enabling legislation. Unrestricted net position – This category represents net position of the County, which are not restricted for any project or other purpose.
N. Indirect costs, maintenance in lieu of rent, allocated costs
Indirect costs, maintenance in lieu of rent, and allocated costs are charged to various state and federal programs based on a formal plan developed annually by the County. These costs are reflected in the fund financial statements as expenditures/expenses in those funds benefiting from the services provided and as a reduction of expenditures in the general fund, which provides the services. These costs are recorded on a full absorption basis in order to reflect the total cost of operations of the various funds. The government-wide financial statements contain a separate column for the allocation of these costs to various functions.
N 9
O. Compensated absences
The County follows the provisions of GASB Statement No. 16, “Accounting for Compensated
Absences.” Calculation of the liability amount is determined by the appropriate vacation and sick payments which would be available to employees if they would leave or retire from the County. The County accrues accumulated unpaid vacation and sick leave when earned by the employee in the government-wide financial statements. All accumulated vacation and vested sick leave pay is recorded as an expense and a liability in the proprietary fund types at the time the liability is accrued. Governmental fund types record accumulated vacation and vested sick leave pay as an expenditure in the current year to the extent it is paid during the year.
P. Pension
For measurement purposes, the net pension asset, deferred outflows of resources and deferred inflows of resources related to pensions, and pension expense, information about the fiduciary net position of the Berks County Employees’ Pension Plan (“BCEPP”) and additions to/deductions from BCEPP’s fiduciary net position have been determined on the same basis as reported by BCEPP. For this purpose, benefit payments (including refunds of employee contributions) are recognized when due and payable in accordance with the benefit terms. Investments are reported at fair value.
Q. Self-insurance
The County is self-insured for the risk of loss related to workers compensation and healthcare insurance claims. Self-insurance for workers compensation began in 2002, and healthcare insurance began in 2006. Details of the County’s self-insurance activities are included in Note 9 on Risk Management.
R. Estimates
The preparation of the financial statements, in conformity with GAAP, requires management to make estimates and assumptions that affect certain reported amounts and disclosures. Actual results may differ from the estimates.
S. Long-term obligations
Long-term debt and other long-term obligations are reported as liabilities in the applicable governmental activities, business-type activities, or proprietary fund type Statement of Net Position. Bond premiums and discounts are deferred and amortized over the life of the bonds using the effective interest method. Bond issuance costs are expensed when incurred. Bonds payable are reported net of the applicable bond premium or discount. Derivatives, or swaps, may be entered into at the discretion of the County, to take advantage of favorable prevailing interest rates with respect to its general obligation bonds. In cases where it is more advantageous to terminate an existing swap, termination fees are expensed in the period that the termination is executed and reported as a Special Item. In accordance with GASB Statement No. 23, “Accounting and Financial Reporting for Refundings of
Debt Reported by Proprietary Activities,” the County has adopted the following policy for current refundings and advance refundings resulting in the defeasance of debt reported in proprietary funds. The difference between the reacquisition price and the net carrying amount of the old debt, will be deferred and amortized in a systematic and rational manner over the remaining life of the old debt or the life of the new debt, whichever is shorter. On the statement of net position, the deferred amount is reported as a deduction from or an addition to the new debt liability.

N 10
In the fund financial statements, governmental fund types recognize bond premiums and discounts, as well as bond issuance costs, during the current period. The face amount of debt issued is reported as other financing sources. Premiums received on debt issuances are reported as other financing sources, while discounts on debt issuances are reported as other financing uses. Issuance costs, whether or not withheld from the actual debt proceeds received, are reported as debt service expenditures.
T. Intergovernmental revenues
Intergovernmental revenues represent revenues received from the Commonwealth of Pennsylvania and federal agencies generally to fund specific programs. Awards made on the basis of entitlement periods are recorded as intergovernmental revenues when entitlement occurs. Reimbursement type grants are recorded as revenues when the related expenditures are incurred. In the governmental funds financial statements, grants are recorded when revenues are also measurable and available.
U. Allowable Expenses under Grants
Under the terms of federal and state grants, periodic audits are required and certain costs may be questioned as not being appropriate expenditures under the terms of the grants. Such audits could lead to reimbursement to the grantor agencies. County management believes disallowances, if any, will be immaterial.
V. Restatement of Entity-Wide Financial Statements
The County’s beginning entity-wide net position has been restated to properly reflect the effect of prior period adjustments as follows:
Governmental funds:
Net position, beginning, as previously reported 238,643,876$
Amounts in "W" Restatement of Governmental Funds
Financial Statements (see below) (1,450,770)
Prior period adjustment 2,521,670
Net position, beginning, as restated 239,714,776$
In addition to the reasons noted below for the General Fund and the Employment & Training and Children and Youth Special Revenue Funds, the Governmental Funds experienced a prior period adjustment related to pension deferred outflow of resources that corrected the prior classification of service cost related to member contributions and interest credited to members of the Berks County Employees’ Pension Plan.

N 11
W. Restatement of Governmental Funds/Enterprise Fund Financial Statements
The County’s beginning fund balances in governmental funds and net position in enterprise funds has been restated to properly reflect the effect of prior and current period adjustments as follows:
General Fund
Fund balance, beginning, as previously reported 152,963,058$
Prior period adjustments (1,679,189)
Fund balance, beginning, as restated 151,283,869$ Prior period adjustments in the General Fund to:
• Write off a receivable in the amount of $310,778 due to a decrease in funding.
• Reclassify prior period errors of $1,368,411 to the General Fund from the Children and Youth Services Special Revenue Fund and the Juvenile Probation Office.
Children and Youth Services Special Revenue Fund
Fund balance, beginning, as previously reported 18,499$
Prior period adjustment 7,728
Fund balance, beginning, as restated 26,227$
Prior period adjustment in the Children and Youth Services Special Revenue Fund to adjust trial balances to reflect 2016 actual results.
Employment and Training Special Revenue Fund
Fund balance, beginning, as previously reported 198,200$
Prior period adjustment 220,691
Fund balance, beginning, as restated 418,891$
Prior period adjustment in the Employment and Training Special Revenue Fund to recognize revenue deferred in the prior year that should have been recognized in 2015.
Berks County Residential Center Enterprise Fund
Total net position, beginning, as previously reported 5,647,843$
Prior period adjustment 92,427
Total net positon, beginning, as restated 5,740,270$
The Berks County Residential Center Enterprise Fund experienced a prior period adjustment related to pension deferred outflow of resources that corrected the prior classification of service cost related to member contributions and interest credited to members in the Berks County Employees’ Pension Plan.
Berks Heim Enterprise Fund
Total net position, beginning, as previously reported 5,842,190$
Prior period adjustment 509,598
Total net positon, beginning, as restated 6,351,788$

N 12
The Berks Heim Enterprise Fund experienced a prior period adjustment related to pension deferred outflow of resources that corrected the prior classification of service cost and related to member contributions and interest credited to members in the Berks County Employees’ Pension Plan.
X. Pending and Adopted Accounting Pronouncements
In February 2015, the GASB issued Statement No. 72, “Fair Value Measurement and Application.”
The adoption of this statement had no effect on the financial reporting information of the County, except to change disclosures in Note 2. In August 2015, the GASB issued Statement No. 77, “Tax Abatement Disclosures.” The adoption of this statement had no effect on the financial reporting information of the County, except to change disclosures in Note 4. In December 2015, the GASB issued Statement No. 79, “Certain External Investment Pools and Pool
Participants.” The adoption of this statement had no effect on the financial reporting information of the County, except to change disclosures in Note 2. In January 2016, the GASB issued Statement No. 80, “Blending Requirements for Certain Component
Units—an amendment of GASB Statement No. 14.” The County is required to adopt GASB No. 80 for its year 2017 financial statements. In March 2016, the GASB issued Statement No. 81, “Irrevocable Split-Interest Agreements.” The County is required to adopt GASB No. 81 for its year 2017 financial statements. In March 2016, the GASB issued Statement No. 82, “Pension Issues-an amendment of GASB
Statements No. 67, No. 68, and No. 73.” The County is required to adopt GASB No. 82 for its year 2017 financial statements. In November 2016, the GASB issued Statement No. 83, “Certain Asset Retirement Obligations.” The County is required to adopt GASB No. 83 for its year 2019 financial statements.

N 13
NOTE 2: CASH AND INVESTMENTS A. Primary government
Interest rate risk: The County of Berks has a formal investment policy for General Operating Funds that limits investment maturities as a means of managing its exposure to fair value losses arising from increasing interest rates, with the exception of the Retirement Fund which has an official investment policy. The maximum remaining maturity of any individual security is 5 years or less at the time of purchase. The average duration of the Portfolio shall be 3 years or less. All investments will be actively traded in a secondary market to ensure liquidity. The County investment policy follows Section 1706 of the County Code of the Commonwealth of Pennsylvania.
Under Section 1706 of the County Code of the Commonwealth of Pennsylvania, the County is authorized to invest its funds in the following:
• United States Treasury Bills.
• Short-term obligations of the United States government or its agencies or instrumentalities.
• Deposits in savings accounts or time deposits, other than certificates of deposit, or share accounts of institutions having their principal place of business in the Commonwealth of Pennsylvania and insured by the Federal Deposit Insurance Corporation (“FDIC”) or other like insurance.
• Obligations of the United States or any of its agencies or instrumentalities backed by the full faith and credit of the United States, the Commonwealth of Pennsylvania, or any of its agencies or instrumentalities backed by the full faith and credit of the Commonwealth of Pennsylvania, or of any political subdivision of the Commonwealth of Pennsylvania, or any of its agencies or instrumentalities backed by the full faith and credit of the political subdivision.
• Shares of an investment company registered under the Investment Company Act of 1940, whose shares are registered under the Securities Act of 1933.
• Certificates of deposit purchased from institutions having their principal place of business in or outside the Commonwealth of Pennsylvania that are insured by the FDIC or other like insurance. For any amounts in excess of the insured maximum, such deposits shall be collateralized by a pledge or assignment of assets pursuant to Act No. 72 of the General Assembly. Certificates of deposit may not exceed 20% of a bank's total capital surplus or 20% of a savings and loan's or savings bank's assets net of its liabilities.
• Commercial paper and prime commercial paper meeting certain requirements.
• Repurchase agreements that are fully collateralized by obligations of the United States of America. In addition, the County Code provides that the Retirement Trust Fund may make any investment authorized by 20 PA.A. Ch. 7302b (relating to fiduciaries' investments).

N 14
The carrying amounts of the cash and investments at December 31, 2016 consist of the following:
Cash and cash equivalents 102,484,934$
Petty cash 16,926
Investments 510,032,264
612,534,124$
Financial statement classification:
Statement of net position:
Current assets, cash and cash equivalents 76,308,667
Current assets, cash and cash equivalents, restricted 16,581,454
Current assets, investments 24,058,459
Current assets, investments, restricted 5,008,208
Noncurrent assets, investments 59,244,548
Noncurrent assets, investments, restricted 1,667,568
Statement of fiduciary net position:
Berks County Employees' Retirement Trust Fund:
Cash and cash equivalents 177,553
Investments 417,196,499
Agency fund:
Cash and cash equivalents 9,434,186
Investments 2,856,982
612,534,124$
Cash and cash equivalents
The County’s available cash and cash equivalents are invested in demand deposit accounts, repurchase agreements, certificates of deposit, money market funds, mutual funds, and securities backed by the full faith and credit of the United States government. The County has custodial credit risk on cash deposits. This is the risk that in the event of a financial institution failure, the County's deposits may not be returned. The County has a deposit policy for custodial risk that requires depository institutions to pledge securities as collateral for deposits that exceed depository insurance.
At December 31, 2016, the carrying amounts of the County’s bank deposits were $102,484,934 and the bank balances were $105,188,870, of which $795,399 was covered by Federal Depository Insurance, $87,351,923 was collateralized under Act No. 72 of the 1971 Session of the Pennsylvania General Assembly, in which financial institutions were granted the authority to secure deposits of public bodies by pledging a pool of assets, as defined by the Act, to cover all public funds deposited in excess of federal depository insurance limits, $7,365,943 was invested in an external investment pool, described in more detail below, $7,272,684 was invested in money market funds, and the remaining balance of $2,402,921 was invested in repurchase agreements. The County invests in PLGIT, an external investment pool, to ensure safety and maximize efficiency, liquidity, and yield for County funds. PLGIT issues separately audited financial statements which are available to the public. The Commonwealth of Pennsylvania provides external regulatory oversight for

N 15
the external investment pool. At December 31, 2016, PLGIT carried an AAAm rating and had an average maturity of less than one year. The County’s position in the pool is the same value as the pool shares.
The County invests in various money market funds, in the amount of $7,272,684, which have been classified as cash and cash equivalents in the statement of net position. These money market funds are unrated and have an average maturity of less than one year. The County invests in repurchase agreements where the underlying securities are U.S. Government mortgage-backed securities. These securities are unrated and have an average maturity of less than one year. The County’s investment in repurchase agreements is held by the counterparty, not in the County’s name. The County’s funds are invested in various types of financial instruments. This diversification of the investment portfolio serves to assist in mitigating the various types of risks associated with different types of financial instruments. Due to the level of risk associated with certain investments, it is at least reasonably possible that changes in the values of investments could occur in the near term and that such a change could materially affect the amount reported on the statement of fiduciary net position. Core Trust Property Collective Trust: Valued at the Trust’s proportionate interest in the net assets of the SEI Core Property Fund, LP (the “Fund”). The Trust is part of a “master feeder fund” complex, by which the Trust invests substantially all of its assets in the Fund. The Net Asset Value (“NAV”), as provided by the trustee of the Fund, is used as a practical expedient to estimate fair value. The NAV is based on the fair value of the underlying investments held by the fund less its liabilities. This practical expedient is not used when it is determined to be probable that the fund will sell the investment for an amount different than the reported NAV. Participant transactions (purchased and sales) may occur daily. Were the Plan to initiate a full redemption of the collective trust, the investment adviser reserves the right to temporarily delay withdrawal from the trust in order to ensure that securities liquidations will be carried out in an orderly business manner. Special Situations Collective Trust: Valued at NAV of units of a collective trust of the Plan’s interests in the Investment Funds and not the underlying holdings of such Investment Funds. The NAV, as provided by the trustee, is used as a practical expedient to estimate fair value. The NAV is based on the fair value of the underlying investments held by the fund less its liabilities. This practical expedient is not used when it is determined to be probable that the fund will sell the investment for an amount different than the reported NAV. Participant transactions (purchased and sales) may occur daily. Were the Plan to initiate a full redemption of the collective trust, the investment adviser reserves the right to temporarily delay withdrawal from the trust in order to ensure that securities liquidations will be carried out in an orderly business manner. Energy Debt Collective Investment Trust: Valued at NAV of units of a collective trust of the Plan’s interests in the Investment Funds and not the underlying holdings of such Investment Funds. The NAV, as provided by the trustee, is used as a practical expedient to estimate fair value. The NAV is based on the fair value of the underlying investments held by the fund less its liabilities. This practical expedient is not used when it is determined to be probable that the fund will sell the investment for an amount different than the reported NAV. Participant transactions (purchased and sales) may occur daily. Were the Plan to initiate a full redemption of the collective trust, the investment adviser reserves the right to temporarily delay withdrawal from the trust in order to ensure that securities liquidations will be carried out in an orderly business manner.

N 16
As of December 31, 2016, the County had the following investments and maturities:
Investment Maturities (in Years)
Investment Type Fair Value < 1 1-5 6-10 >10
Governmental Funds
General Fund
Negot. certif. of deposit 1,683,136$ 883,568$ 799,568$ -$ -$
U.S. Govt agency securities 80,890,539 22,505,423 58,385,116 - -
Health Choices Fund
Negot. certif. of deposit 2,372,644 1,504,644 868,000 - -
U.S. Govt agency securities 2,507,564 2,507,564 - - -
Other Governmental Funds
Negot. certif. of deposit 1,494,000 747,000 747,000 - -
U.S. Govt agency securities 806,036 806,036 - - -
Total Governmental Funds 89,753,919 28,954,235 60,799,684 - -
Enterprise Funds
Berks Heim
Negot. certif. of deposit 224,864 112,432 112,432 - -
Fiduciary Funds
County Employees' Retirement:
Collective Trusts
Core Trust Property 44,455,090$ 44,455,090$ -$ -$ -$
Energy Debt 17,594,013 17,594,013 - - -
Special Situations 2,716,099 2,716,099 - - -
Equity Mutual Funds
Large Cap Disciplined 90,085,097 90,085,097 - - -
Small/Mid Cap 29,852,407 29,852,407 - - -
Emerging Markets 11,323,428 11,323,428 - - -
World Ex-US 58,279,149 58,279,149 - - -
Dynamic Asset Allocation 25,203,098 25,203,098 - - -
Fixed Income Mutual Funds
Core Fixed Income 38,340,966 38,340,966 - - -
High Yield Bonds 20,409,674 20,409,674 - - -
Limited Duration Bonds 19,868,453 19,868,453 - - -
Opportunistic Income 28,265,222 28,265,222 - - -
Emerging Markets Debt 18,852,130 18,852,130 - - -
Multi-Asset Real Return 11,951,673 11,951,673 - - -
Agency Funds:
Negot. certif. of deposit 2,856,982 2,856,982 - - -
Total Fiduciary Funds 420,053,481 420,053,481 - - -
Total Investments 510,032,264$ 449,120,148$ 60,912,116$ -$ -$
Credit risk: State law limits investments in commercial paper and corporate bonds to the top two ratings issued by nationally recognized statistical rating organizations (NRSROs). The County’s investments in certificates of deposit at December 31, 2016 were $8,631,626. Of this total, $4,969,000 was covered by Federal Depository Insurance, and $3,662,626 was collateralized under Act No. 72 of the 1971 Session of the Pennsylvania General Assembly, in which financial institutions were granted the authority to secure deposits of public bodies by pledging a pool of assets, as defined by the Act, to cover all public funds deposited in excess of federal depository insurance limits.

N 17
The County had the following level of exposure to credit risk as of December 31, 2016:
Fair Value Rating
U.S. Govt agency obligations 84,204,139$ AAA
Negotiable certificates of deposit 8,631,626 Unrated
Mutual funds - Core fixed income 38,340,966 AA-
Mutual funds - Emerging Mkts Debt 18,852,130 BB+
Mutual funds - High Yield Bonds 20,409,674 B+
Mutual funds - Limited Duration 19,868,453 AA-
Mutual funds - Opportunistic Income 28,265,222 BBB+
Concentration in credit risk: The County places no limit on the amount the County may invest in any one issuer, with the exception of its Pension Funds. The County Pension Fund investment managers are authorized by the Retirement Board to invest in marketable debt issues of the U.S. Treasury, U.S. Agencies, U.S. corporations, U.S. banks or other financial institutions, mortgage or asset backed securities, Yankee bonds, and cash equivalents. Investment managers may also invest in mutual funds and other commingled investments.
The Retirement Board has passed a “Statement of Investment Policy” which establishes a target asset allocation for each type of investment as noted below. Several other target allocations exist within each investment type noted below and can be found in the Statement of Investment Policy. The investment guidelines allow for the following types of investments and target allocations:
Asset Class Target Allocation
Domestic equity 22%
International equity 22%
Fixed Income 40%
Real Estate/Alternative 16%
Cash 0%
Total 100%
At December 31, 2016, the pension investment portfolio was in compliance with the County’s investment policy as it relates to pension funds.
Custodial credit risk: For an investment, custodial credit risk is the risk that, in the event of the failure of the counterparty, the County will not be able to recover the value of its investments or collateral securities that are in the possession of an outside party. Although the County’s investment policy does not specifically address the issue of custodial credit risk, it is the practice of the County to hold all investments in the counterparties’ name. As of December 31, 2016, $510,032,290 of the County’s investments is held by the investment counterparties. Foreign currency risk: The County does not have a formal policy to limit foreign currency risk with the exception of its Pension Funds. The County Pension Fund Investment policy prohibits the buying and selling of foreign securities not registered through an SEC filing or not denominated in US dollars, except for managers hired specifically for international investments. Risk of loss arises from changes in currency exchange rates. The County had no exposure to foreign currency risk as of December 31, 2016.

N 18
Fair Value Measurement: The County categorizes its fair value measurements within the fair value hierarchy established by generally accepted accounting principles. The hierarchy sets out a fair value hierarchy with the highest priority being quoted prices in active markets (Level 1 measurements) and the lowest priority to unobservable inputs (Level 3 measurement). Accordingly, the degree of judgment exercised in determining fair value is greatest for instruments categorized in Level 3. The inputs used to measure fair value may fall into different levels of the fair value hierarchy. In such cases, for disclosure purposes, the fair value hierarchy classification is determined based on the lowest level input that is significant to the fair value measurement in its entirety. Fair value measurements will be classified and disclosed in one of the following three categories:
Level 1: Quoted market prices in active markets for identical assets or liabilities. Level 2: Observable market based inputs or unobservable inputs that are corroborated by market data. Level 3: Unobservable inputs that are not corroborated by market data.
The following table presents the balances of fair value measurements on a recurring basis by level within the hierarchy as of December 31, 2016:

N 19
Quoted Prices in
Active Markets Significant Significant
for Identical Observable Unobservable
Assets Inputs Inputs
Investment (Level 1) (Level 2) (Level 3) Total
By fair value level
Negotiable Certificates
of Deposit 8,631,626$ -$ -$ 8,631,626$
U.S. Government Agency notes 84,204,139 - - 84,204,139
Fixed income mutual funds
Core Fixed Income 38,340,966 - - 38,340,966
High Yield Bond 20,409,674 - - 20,409,674
Limited Duration Bond 19,868,453 - - 19,868,453
Opportunistic Income 28,265,222 - - 28,265,222
Emerging Markets Debt 18,852,130 - - 18,852,130
Multi-Asset Real Return 11,951,673 - - 11,951,673
Total fixed income mutual funds 137,688,118 - - 137,688,118
Equity mutual funds
Large Cap Disciplined 90,085,097 - - 90,085,097
Small/Mid Cap 29,852,407 - - 29,852,407
Emerging Markets 11,323,428 - - 11,323,428
World Ex-US 58,279,149 - - 58,279,149
Dynamic Asset Allocation 25,203,098 - - 25,203,098
Total equity mutual funds 214,743,179 - - 214,743,179
Total investments by
fair value level 445,267,062$ -$ -$ 445,267,062$
Measured at Net Asset Value (NAV)
Collective Trust Funds 64,765,202
Total investment measured
at fair value 510,032,264$
Investment derivative instruments
Interest Rate Swaps 926,005$ 926,005$

N 20
Negotiable certificates of deposit, U.S. Treasury and Agency notes, and debt and equity securities classified in Level 1 of the fair value hierarchy are valued using prices quoted in active markets for those securities. Derivative investments classified in Level 2 of the fair value hierarchy are valued using a market approach that considers benchmark interest rates and foreign exchange rates. Collective investment funds are valued at net asset value (NAV) of units held. The NAV is used as a practical expedient to estimate fair value. The NAV is based on the fair value of the underlying investments held by the funds less their liabilities. The following table summarizes investments for which fair value is measured using the NAV per share practical expedient:
Fair Unfunded Redemption Redemption
Value Commitment Frequency Notice Period
Collective Trust Funds
Core Property (a) 44,455,090$ -$ Immediate None
Energy Debt (b) 17,594,013 - Immediate None
Special Situations (c) 2,716,099 - Immediate None
Total Collective Trust Funds 64,765,202$ -$ (a) The Core Property Collective Investment Trust Fund is a “master feeder” complex, by which the Trust
invests substantially all of its assets in the SEI Core Property Fund, LP. (CPF) This structure provides a means for eligible investors to participate in investments in various private investment funds, many of which will pursue U.S. Core Real Estate Strategies. The CPF invests directly and indirectly in a diversified pool of private investment vehicles that invest in commercial real estate properties. Most properties are owned outright with mortgage debt generally limited to 40% of total value aggregate across the entire portfolio. The CPF seeks both current income and long-term capital appreciation through management of the portfolio. Investments in this Fund can be redeemed daily at the current NAV per share based on the fair value of the underlying investments. The fair value of investments in this Fund has been estimated using the NAV per share of the underlying investments.
(b) The Energy Debt Collective Investment Trust Fund is a “master feeder” complex, by which the Trust
invests substantially all of its assets in the SEI Energy Debt Fund, LP. (EDF) This structure provides a means for eligible investors to participate in investments in below investment grade bonds and loans (and other debt and equity instruments) of U.S. and international energy companies. The EDF seeks to achieve high total returns. Investments in this Fund can be redeemed daily at the current NAV per share based on the fair value of the underlying investments. The fair value of investments in this Fund has been estimated using the NAV per share of the underlying investments.

N 21
(c) The Special Situations Collective Fund is a “master feeder” complex, by which the Trust invests substantially all of its assets in the SEI Special Situations Fund, LP. (SSF) This structure provides a means for eligible investors to participate in investments in various private investment funds, many of which will pursue hedged investment strategies. The SSF invests using a “fund of funds” approach, which includes investments in various private funds such as hedge funds that pursue “hedged” or other “alternative” investment strategies, private equity funds, hybrid funds and any other “alternative” investment funds, while also opportunistically investing directly in any other securities and financial instruments. The SSF seeks to achieve high returns balanced against an appropriately level of volatility and directional market exposure over a full market cycle. Investments in this Fund can be redeemed daily at the current NAV per share based on the fair value of the underlying investments. The fair value of investments in this Fund has been estimated using the NAV per share of the underlying investments.
B. Component units
1. Berks County Solid Waste Authority
The Authority’s available cash is invested in demand deposit accounts and money market accounts. The carrying amounts of the cash deposits at December 31, 2016 consist of the demand deposits of $247,185.
Custodial credit risk - deposits: Custodial risk is the risk that in the event of a bank failure, the Authority’s deposits may not be returned. The Authority has a deposit policy for custodial risk that requires depository institutions to pledge securities as collateral for deposits that exceed depository insurance. At December 31, 2016, the carrying amount of the Authority’s cash deposits was $247,185 and the bank balance was $374,529, all of which was covered by Federal Deposit Insurance.
2. Reading Regional Airport Authority
The Authority’s investment authority is set by state statute to include: U.S. Treasury Bills, short-term U.S. Government or Agency obligations, deposits in savings accounts, time deposits, or share accounts, obligations of the United States or any of its agencies or instrumentalities, obligations of the Commonwealth of Pennsylvania or any of its agencies or instrumentalities and shares of any investment company which invests only in the above or certificates of deposit. Pursuant to Act 72 of the Pennsylvania State Legislature, a depository must pledge assets to secure state and municipal deposits. The pledged assets must at least be equal to the total amount of such assets required to secure all of the public deposits at the depository and may be on a pooled basis. Additionally, all such pledged assets must be delivered to a legal custodian.
The Authority’s cash and cash equivalents consist of the following at September 30, 2016:
Petty cash 250$
Unrestricted cash 2,084,290
Settlement fund cash 510,567
Escrow deposits 3,294
2,598,401$

N 22
Custodial credit risk – deposit: Custodial credit risk is the risk that in the event of a bank failure, the Authority’s deposits may not be returned to it. The Authority does not have a policy for custodial credit risk. At September 30, 2016, $2,354,284 of the Authority’s bank balance of $2,604,284 was exposed to custodial credit risk because it was uninsured and the collateral held by the depositing agent was not in the Authority’s name. As of September 30, 2016, bank balances of deposits were entirely insured by either Federal Depository Insurance or collateralized in accordance with Act 72 of the 1971 Session of the Pennsylvania General Assembly.
Investment Policies: The Authority does not currently have a formal investment policy establishing interest rate, credit risk, and concentrations of credit risk as it currently has all deposits with financial institutions which are classified as cash on the accompanying financial statements.
3. Reading Area Community College
Cash and cash equivalents at June 30, 2016 consist of the following:
Cash on hand 3,650$
Cash 12,198,518
Investments 15,709,039
27,911,207$
Custodial credit risk – deposits: Custodial credit risk is the risk that in the event of a bank failure, the College’s deposits may not be returned. The College has adopted a policy for custodial credit risk, which includes monthly monitoring of the assets and annual verification. At June 30, 2016, the carrying amount of the College’s deposits was $11,738,392 and the bank balance was $11,852,490. Of the bank balance, $250,000 was covered by federal depository insurance and $11,602,490 was exposed to custodial credit risk because it was uninsured and the collateral held by the depository’s agent was not in the College’s name. At June 30, 2016, the cash and cash equivalents for the College Foundation was $460,126. All balances above federal depository insurance limits and exposed to custodial credit risk were covered by the collateralization requirements in accordance with Act 72.
Investments: The College authorizes the following investment instruments which are allowable under PA Law including Act 72 of 1971:
• Direct obligations of the United States of America (USA) i.e. US Treasury Obligations
• Obligations fully and unconditionally guaranteed as to timely payment of principal and interest by any agency or instrumentality of the USA.
• Obligations of government sponsored agencies which are not backed by the full faith and credit of the USA including Federal Home Loan Mortgage Corporation (FHLMC), Farm Credit System (FCS), Federal Home Bank Loans (FHLB), and Federal National Mortgage Associations (FNMNA) excluding “stripped mortgage securities” purchase at proceeds exceeding their principal amounts.
• Deposits in savings accounts or time deposits in certificates of deposit insured by the Federal Deposit Insurance Company or other like insurance and for any amounts above the insured maximum, provided that approved collateral is provided by law, therefore shall be pledged by the depository.
• Repurchase agreements that are fully collateralized by obligation of the USA. Monthly statements of deposit collateral shall be obtained from the authorized depository.

N 23
Pennsylvania Act 10 of 2016 became effective May 25, 2016 and expanded the permitted investment types to include commercial paper, bankers’ acceptances, negotiable certificates of deposit, and insured bank deposit reciprocals as long as certain safeguards related to credit quality and maturity are met. The College categorizes its fair value measurements within the fair value hierarchy established by generally accepted accounting principles. The hierarchy is based on the valuation inputs used to measure fair value of the asset. Level 1 inputs are quoted prices in active markets for identical assets: Level 2 inputs are significant other observable inputs; Level 3 inputs are significant unobservable inputs. The College’s entire investment carrying value of $5,097,762 is valued using bid prices for comparable securities (Level 2 input). The fair value of investments for the College is presented below as of June 30, 2016:
Investment Interest Rates Total < 1 year > 1 year
FHLB Notes .785% - 1.125% 748,555$ 250,678$ 497,877$
FNMA .875% - 1.875% 2,248,133 241,085 2,007,048
FHLMC .750% - 1.375% 1,993,404 491,390 1,502,014
Other 107,670 107,670 -
Total Investments 5,097,762$ 1,090,823$ 4,006,939$ Interest rate risk: The College does have a formal investment policy that limits maturities in certain investments as a means of managing its exposure to fair value losses arising from increasing interest rates. Credit risk and concentration of credit risk: The College does have an investment policy that would limit its investment choices to certain credit ratings. As of June 30, 2016, the College’s investments in FHLB, FNMA, and FHLMC were rated as Aaa by Standard & Poor’s. The College places no limit on the amount the College may invest in any one issuer. The College’s investments in FHLB, FNMA, and FHLMC are all over five percent of total investments. Custodial credit risk: For an investment, custodial credit risk is the risk that, in the event of the failure of the counterparty, the College will not be able to recover the value of its investments or collateral security that are in the possession of an outside party. The College has no investments subject to custodial credit risk. Foundation investments as of June 30, 2016 are summarized as follows:
Investment Total
Equity funds 7,284,646$
Fixed income securities 3,140,922
Cash and equivalents 185,709
Total Investments 10,611,277$

N 24
The following schedule summarizes the investment return and its classification in the statement of activities for the year ended June 30, 2016:
Temporarily Permanently
Category Unrestricted Restricted Restricted Total
Interest 41,436$ 177,057$ 218,493$
Market losses (17,640)$ (77,637)$ -$ (95,277)$
Total 23,796$ 99,420$ -$ 123,216$
The Foundation has investments in mutual funds consisting primarily of bond and equity securities. Generally accepted accounting principles establish a framework for measuring fair value. That framework provides a fair value hierarchy that prioritizes the inputs to valuation techniques used to measure fair value. The hierarchy gives the highest priority to unadjusted quoted prices in active markets for identical assets or liabilities (Level 1 measurements), and the lowest priority to unobservable inputs (Level 3 measurements). The three levels of the fair value hierarchy under generally accepted accounting principles are described below:
Level 1: Inputs to the valuation methodology are unadjusted quoted prices for identical assets or liabilities in active markets that the College has the ability to access.
Level 2: Inputs to the valuation methodology include:
• Quoted prices for similar assets and liabilities in active markets;
• Quoted prices for identical or similar assets and liabilities in inactive markets;
• Inputs other than quoted prices that are observable for the asset or liability;
• Inputs that are derived principally from or corroborated by observable market data by correlation or other means.
Level 3: Inputs to the valuation methodology are unobservable and significant to the fair
value measurement. The asset’s or liability’s fair value measurement level within the fair value hierarchy is based on the lowest level of any input that is significant to the fair value measurement. Valuation techniques used need to maximize the use of observable inputs and minimize the use of unobservable inputs. Following is a description of the valuation methodologies used for assets measured at fair value. There have been no changes in the methodologies used at June 30, 2016. Investments: The investments are held by a trust company. The investments consist of money market funds, fixed income securities, and equity securities. The trust company has rated their holdings in accordance with the fair value hierarchy as noted above with Level 1 consisting of money market funds, fixed income securities, and equity securities. Beneficial Interests in Perpetual Trusts: The Foundation is the beneficiary of two trusts which are managed by two banks. The banks hold the investments in diversified and balanced portfolios consisting of cash and money market funds and equity securities. These investments are valued by the trust managers based on the quoted market prices for shares held or current bid price of funds held at year end.

N 25
Charitable Remainder Trust Receivable: The Foundation is the beneficiary of a charitable remainder trust that is managed by a third party bank. The bank holds the investments in diversified and balanced portfolios. These investments are valued by the trust managers based on the quoted market prices for shares held or current bid price of funds held at year end. The methods described previously may produce a fair value calculation that may not be indicative of net realizable value or reflective of future fair values. Furthermore, while the Foundation believes its valuation methods are appropriate and consistent with other market participants, the use of different methodologies or assumptions to determine the fair value of certain financial instruments could result in a different fair value measurement at the reporting date. The following tables set for the by level, within the fair value hierarchy, the Foundation’s assets at fair value as of June 30, 2016:
Category Level 1 Level 2 Level 3 Total
Equity 7,284,646$ -$ -$ 7,284,646$
Fixed income 3,140,922 - - 3,140,922
Total investments, at market 10,425,568 - - 10,425,568
Beneficial interest in
perpetual trusts - - 4,629,846 4,629,846
Beneficial interest in CRAT - - 125,000 125,000
Total assets at fair value 10,425,568$ -$ 4,754,846$ 15,180,414$
The table below sets forth a summary of changes in the fair value of the Foundation’s Level 3 assets for the year ended June 30, 2016:
Balance, beginning of year 4,152,774$
Contributions/purchases 213,036
Realized and unrealized gains 389,036
Balance, end of year 4,754,846$ During the year ended June 30, 2016, the Foundation was named the beneficiary of a Charitable Remainder Trust to provide capital for the science center improvements. A Charitable Remainder Trust provides for the payment of distributions to designated beneficiaries over the Trust’s term. Under terms of the Trust agreement dated April 13, 2016, the Foundation is to receive the Trust principal as then constituted and any accrued or undistributed net income upon the death of the surviving beneficiary or expiration of seven years, whichever comes first. Based on the beneficiary life expectancy and a 6.4 percent discount rate, the present value of future benefit expected to be received by the Foundation was estimated to be $125,000, as of June 330, 2016, which is recorded as a temporarily restricted contribution and a Charitable Remainder Trust receivable. The Foundation is a beneficiary of two irrevocable trusts held by various trust departments of financial institutions. The Foundation recorded its proportionate share of the fair market value of

N 26
principal of each trust when received. Agreement terms provide that the Foundation receives its proportionate share of the net income earned by the funds held in trust. Distributions from the trusts are recorded as trust income in temporarily restricted net assets and amounted to $138,100 for the year ended June 30, 2016. The value of the trusts recorded is $4,629,846 at June 30, 2016.

N 27
NOTE 3: RESTRICTED ASSETS
Cash and investments whose use is limited to a specific purpose have been classified as “restricted” in the Statement of Net Position and Balance Sheet. Restricted assets at December 31, 2016 consist of the following:
Cash and cash
equivalents Investments
Governmental funds
General Fund
Antietam Lake 466,216$ -$
Act 198 Fund 344,740 -
Environmental Litigation 69,660 -
Hazmat Response Fund 282,120 1,410,000
MCT Trust 580,366 -
Inmate Pay 3,502 -
Parks Trust Accounts 1,028,315 -
Workers' Compensation Trust 14,378 273,136
Special Legislation Funds
Adult Probation Supervision Fund 2,308,732 -
Coroner Record Improvement Fund 130,014 -
Courts Automation Fund 214,762 -
Hotel Tax Account 132,529 -
Prothonotary Automation Fund 89,359 -
Register of Wills Record Improvement Fund 134,559 -
Recorder of Deeds Record Improvement Fund 263,696 -
Treasurer Record Improvement Fund 355,671 -
Children and Youth Services
Gift Fund 14,867
Health Choices Special Revenue Fund
Appendix V - Jumbo Auto Renew CD - 805,644
Reinvestment account 802,036 -
Risk & Contingency account 1,968,152 4,074,564
Capital Projects Funds
Unspent bond proceeds Series B of 2009 19,621 -
Unspent bond proceeds Series A of 2010 178,191 -
Unspent bond proceeds Series B of 2010 119,931 -
Unspent bond proceeds Series C of 2010 1,054,803 -
Unspent bond proceeds Series D of 2010 14,900 -
Unspent bond proceeds 2012 Tax Exempt 690,306 -
Unspent bond proceeds Series A of 2012 460,964 -
Unspent bond proceeds Series of 2013 4,827,228 -
Total governmental funds 16,569,618$ 6,563,344$
Business-Type Activity
Berks Heim
Workers' Compensation Trust 11,836$ 224,864$

N 28
NOTE 4: REAL ESTATE TAXES AND TAX ABATEMENTS
Real estate taxes attach an enforceable lien on property on January 1. Taxes are billed on or about March, payable under the following terms: 2% discount, March through April 30; face amount, May through June 30, and 10% penalty between July 1 and January 15 of the subsequent year. After January 15 of the subsequent year, the levies are sent to the Berks County Tax Claim Bureau for collection. The County bills these taxes that are collected by elected local tax collectors. The County collects delinquent real estate taxes on behalf of itself and other taxing authorities. The 2016 adopted rate of taxation was 7.372 mills. County property tax revenues were reduced by $972,423 because of legislation enacted by the Commonwealth of Pennsylvania under the following programs: Local Economic Revitalization Tax Assistance (LERTA) Program
The LERTA Program authorizes local taxing authorities within the County to exempt property taxes of new construction in deteriorated areas of economically depressed communities and improvements to certain deteriorated industrial, commercial and other business property. The LERTA tax exemptions are authorized under Act 76 of 1977 (72 P.S. section 4722 et seq.) which was passed by the General Assembly of Pennsylvania. A local taxing authority by ordinance or resolution may exempt from real property taxation the assessed valuation of improvements to deteriorated properties and the assessed valuation of new construction within designated deteriorated areas. The County recognizes, supports and approves any LERTA of any municipality located within the boundaries of the County that has established a standard LERTA from property tax for certain deteriorated industrial, commercial or other business property. Application to each local taxing authority for a tax exemption under a LERTA ordinance is to be made at the same time a building permit is secured or other official notification is made. A copy of the exemption request shall be forwarded to the County Board of Assessment. The assessment office shall assess separately the new construction or improvement and calculate the amounts of the assessment eligible for tax exemption in accordance with the limits established by the local taxing authorities and notify the taxpayer and the local taxing authorities of the reassessment and amounts of the assessment eligible for exemption. For the first year immediately following the date upon which the improvement become assessable, 100 percent of the assessed valuation of the eligible improvement shall be exempted from real estate tax. In subsequent years, the amount exempted from real estate tax is reduced by 10 percent each year, and after the tenth year, the exemption shall terminate.
The exempted portion of the assessable improvement is not included on the property owner’s tax bill. The exemption from taxes is upon the eligible property and does not terminate upon the sale or exchange of the property.
The exemption from real estate taxes provided for herein shall be forfeited by the Applicant and/or any subsequent owner of the real estate upon the occurrence of failure to pay any non-exempt real estate taxes by the last day of the time period to pay such taxes in the penalty period.
The following local taxing authorities within the County have enacted LERTA ordinances or resolutions:
• City of Reading
• Borough of Wyomissing

N 29
• Bethel Township
• Borough of Birdsboro
• Bern Township
The County forgone real estate tax revenue as a result of LERTA tax abatement agreements entered into by the Commonwealth of Pennsylvania was $703,671 for the year ended December 31, 2016.
Keystone Opportunity Zone Program (KOZ) Program
The KOZ Program provides 100% abatement of real property taxation on the assessed valuation of
deteriorated property in an area designated as a subzone within this Commonwealth. The real
property tax abatements under this program are authorized under Act 92 of 1998, P.L. 705, as
amended (the “Act”), which was passed by the General Assembly of Pennsylvania.
For a qualified business to qualify each year for property tax abatement under the Act, a business shall own or lease real property in a Subzone from which the business actively conducts a trade, profession or business. The qualified business shall receive certification from the Department that the business is located and is in the active conduct of a trade, profession or business, within the Subzone. The business shall obtain annual renewal of the certification from the Department to continue to qualify as a qualified business. For a property owner to qualify each year for property tax abatement under the Act, the property owner must apply annually to the Department in order to receive approval for property tax abatement, as required by Section 907 of the Act. The deadline to file a KOZ application is December 31st of the year for which benefits are to be received. Applicants must be in full compliance with all state and local tax laws and building and housing code provisions, in order to claim property tax abatements offered in the Act. Compliant applications will receive an approval letter from the Department. The approval letter is verification of eligibility to receive KOZ benefits from state and local entities. Property tax abatement is applied by way of exemption of assessed value. The Pennsylvania Department of Revenue reserves the right to conduct an audit of an applicant for benefits to ensure full compliance with the Act. Any party improperly receiving KOZ tax benefits must return all tax benefits received and will be subject to the applicable interest, civil and criminal penalty provisions in the Act. The County forgone real estate tax revenue as a result of KOZ tax abatement agreements entered into by the Commonwealth of Pennsylvania was $268,752 for the year ended December 31, 2016.
NOTE 5: INTERFUND BALANCES AND ACTIVITY
The County uses a pooled operating fund to enhance investment return, therefore interfund receivables and payables are recorded to recognize amounts held by the general fund in the pooled account on behalf of other funds. In addition, the general fund paid expenses on behalf of other funds, therefore a corresponding interfund receivable and payable has been recorded.
Interfund receivable and payable balances of each individual fund as of December 31, 2016 are as follows:

N 30
Due from Due to
other funds other funds
Governmental funds:
General fund -$ 2,025,889$
Children and Youth Services 4,303,071 -
Health Choices 93,059 -
Nonmajor 4,999,989 5,721,276
9,396,119 7,747,165
Proprietary funds:
Berks County Residential Center 933,383 -
Berks Heim - 2,582,337
933,383 2,582,337
Total 10,329,502$ 10,329,502$
Transfers represent the settlement of interfund transactions between the general fund and other types of funds. Transfers may cover temporary cash shortfalls or be a permanent allocation of local tax resources.
Transfers of each individual fund in 2016 are as follows:
Transfers In Transfers Out
Governmental funds:
General fund 3,715,526$ 19,115,035$
Children and Youth Services 7,746,118 353,287
Health Choices - 15,263
Nonmajor 11,657,073 2,561,157
23,118,717 22,044,742
Proprietary funds:
Berks County Residential Center 1,220,957 1,088,977
Berks Heim 15,000 -
1,235,957 1,088,977
Total 24,354,674$ 23,133,719$
The majority of the amounts noted above are comprised of these transfers:
• Transfers of $17,214,153 were made from the General Fund to several funds during 2016 to cover deficits.
• Transfers of $1,608,592 were made from the Special Legislation Special Revenue Fund to the General Fund for Adult Probation Office wage reimbursements.
• Transfers of $6,759,580 were made from the General Fund to the Department of Emergency Services Special Revenue Fund to remove due to General Fund arising from prior years.

N 31
• Transfers of $1,726,372 were made from the General Fund to the Drug and Alcohol Special Revenue Fund for County contributions to the Council on Chemical Abuse.
• Transfers of $1,220,956 were made from the General Fund in Berks County Residential Center to transfer the Annex capital asset costs. This transfer was made in the entity wide financial statements only and causes transfers in to not equal transfers out in 2016.
• Transfers of $1,088,977 were made from Berks County Residential Center to the General Fund for rental of space.
• Transfers of $15,000 were made from the General Fund to Berks Heim to transfer funds for parking lot improvements.
NOTE 6: CAPITAL ASSETS
A. Primary government
1. Capital assets
Capital asset activity for the year ended December 31, 2016 was as follows:
• Governmental activities:
Transfers
Beginning Additions/ Retirements/ Between Ending
balance Transfers in Transfers out Activities balance
Capital assets, not being depreciated:
Land 13,481,858$ -$ -$ -$ 13,481,858$
Historical treasures 2,279,644 - - - 2,279,644
Agricultural easements 78,161,441 1,209,675 - - 79,371,116
Software in progress 2,560,399 1,421,220 (893,723) - 3,087,896
Construction in progress 7,324,041 14,680,049 (2,821,964) - 19,182,126
Total capital assets, not being depreciated 103,807,383 17,310,944 (3,715,687) - 117,402,640
Capital assets, being depreciated:
Land improvements 2,415,041 1,334,468 - - 3,749,509
Buildings and improvements 205,916,568 1,979,073 - (1,281,098) 206,614,543
Furniture, fixtures, equipment, and vehicles 87,334,226 2,512,648 (4,726,185) - 85,120,689
Infrastructure 10,587,072 2,256,465 - - 12,843,537
Total capital assets, being depreciated 306,252,907 8,082,654 (4,726,185) (1,281,098) 308,328,278
Total capital assets, historical cost 410,060,290 25,393,598 (8,441,872) (1,281,098) 425,730,918
Less accumulated depreciation for:
Land improvements 1,253,317 189,558 - - 1,442,875
Building and improvements 105,126,846 5,627,996 - (60,142) 110,694,700
Furniture, fixtures, equipment, and vehicles 25,567,242 4,968,192 (4,726,185) - 25,809,249
Infrastructure 2,231,515 331,108 - - 2,562,623
Total accumulated depreciation 134,178,920 11,116,854 (4,726,185) (60,142) 140,509,447
Total capital assets, net of accumulated
depreciation 275,881,370$ 14,276,744$ (3,715,687)$ (1,220,956)$ 285,221,471$

N 32
Transfers between activities in both capital asset tables represent Annex Project costs allocated to the Berks County Residential Center Enterprise Fund from the General Fund.
• Business-type activities:
Transfers
Beginning Additions/ Retirements/ Between Ending
balance Transfers in Transfers out Activities balance
Capital assets, not being depreciated:
Construction in progress 14,366$ 17,642$ (14,366)$ -$ 17,642$
Capital assets, being depreciated:
Buildings and improvements 46,941,229 11,309 - 1,281,098 48,233,636
Furniture, fixtures, equipment, and vehicles 4,896,189 66,137 (7,120) - 4,955,206
Total capital assets, being depreciated 51,837,418 77,446 (7,120) 1,281,098 53,188,842
Total capital assets, historical cost 51,851,784 95,088 (21,486) 1,281,098 53,206,484
Less accumulated depreciation for:
Building and improvements 12,077,610 1,281,459 - 60,142 13,419,211
Furniture, fixtures, equipment, and vehicles 4,107,663 155,636 (7,120) - 4,256,179
Total accumulated depreciation 16,185,273 1,437,095 (7,120) 60,142 17,675,390
Total capital assets, net of accumulated
depreciation 35,666,511$ (1,342,007)$ (14,366)$ 1,220,956$ 35,531,094$
2. Depreciation expense
Depreciation expense was charged to functions/programs of the primary government during 2016 as follows:
• Governmental activities:
Judicial 434,047$
Public safety 4,532,864
Public works 533,125
General government 5,078,640
Human services 40,935
Community and economic
development 52,000
Culture and recreation 445,243
Total 11,116,854$
• Business-type activities:
Berks County Residential Center 360,298$
Berks Heim 1,076,797
Total 1,437,095$

N 33
3. Capital projects commitments
The Anthony’s Mill Bridge project is in the construction phase with expenditures to date totaling $222,017. Management anticipates this project to be completed by March 31, 2017 with a projected final cost of approximately $244 thousand. The Buttonwood Street Bridge project is in the construction phase with expenditures to date totaling $13,553,729. Management anticipates this project to be completed by April 30, 2017 with a projected final cost of approximately $15.7 million.
The Blandon Bridge project is in the design phase with expenditures to date totaling $506,470. Management anticipates this project to be completed by December 31, 2018 with a projected final cost of approximately $1.7 million. The Peach Street Bridge project is in the design phase with expenditures to date totaling $13,625. Management anticipates this project to be completed by December 31, 2018 with a projected final cost of approximately $34 thousand. The Dreibelbis Station Bridge project is in the design phase with expenditures to date totaling $209,366. Management anticipates this project to be completed by December 31, 2018 with a projected final cost of approximately $1.9 million. The Manatawny Bridge project is in the design phase with expenditures to date totaling $550,923. Management anticipates this project to be completed by December 31, 2018 with a projected final cost of approximately $1.7 million. The Burkey’s Bridge project is in the design phase with expenditures to date totaling $14,044. Management anticipates this project to be completed by December 31, 2018 with a projected final cost of approximately $82 thousand. The Hartz Mill Bridge project is in the design phase with expenditures to date totaling $9,749. Management anticipates this project to be completed by December 31, 2018 with a projected final cost of approximately $97 thousand. The Fisher’s Mill Bridge project is in the design phase with expenditures to date totaling $16,207. Management anticipates this project to be completed by December 31, 2018 with a projected final cost of approximately $148 thousand. The Elevator Rehabilitation Project is in the construction phase with expenditures to date totaling $3,494,095. Management anticipates this project to be completed by December 31, 2017 with a projected final cost of approximately $5.9 million.

N 34
B. Component units
1. Berks County Solid Waste Authority
Capital asset activity for the year ended December 31, 2016 was as follows:
Balance Balance
January 1, December 31,
2016 Additions Deletions 2016
Capital assets not being depreciated:
Construction in progress -$ 65,328$ -$ 65,328$
Capital assets being depreciated:
Site improvements 214,291 28,011 - 242,302
Recycling equipment 205,870 19,353 (31,508) 193,715
Total capital assets being depreciated 420,161 47,364 (31,508) 436,017
Less accumulated depreciation for:
Site improvements 97,731 32,614 - 130,345
Recycling equipment 87,452 24,713 (23,204) 88,961
Total accumulated depreciation 185,183 57,327 (23,204) 219,306
Total capital assets, net 234,978$ 55,365$ (8,304)$ 282,039$

N 35
2. Reading Regional Airport Authority
Capital asset activity for the year ended September 30, 2016 was as follows:
Balance
October 1, Balance
2015 Transfers/ September 30,
(Restated) Additions Deletions 2016
Capital assets, not being depreciated:
Land 4,636,399$ -$ -$ 4,636,399$
Air easement rights 103,002 - - 103,002
Construction in progress 391,914 2,159,587 (164,887) 2,386,614
Total capital assets, not being depreciated 5,131,315 2,159,587 (164,887) 7,126,015
Capital assets, being depreciated:
Land improvements 9,305,879 - - 9,305,879
Infrastructure 39,587,433 - - 39,587,433
Buildings and improvements 17,440,810 - - 17,440,810
Furniture and equipment 3,760,984 22,304 - 3,783,288
Leasehold improvements 2,198,700 - - 2,198,700
Total capital assets, being depreciated 72,293,806 22,304 - 72,316,110
Total capital assets, historical cost 77,425,121 2,181,891 (164,887) 79,442,125
Less accumulated depreciation for:
Land improvements 6,859,500 306,355 - 7,165,855
Infrastructure 17,695,945 1,396,181 - 19,092,126
Buildings and improvements 10,545,891 442,563 - 10,988,454
Furniture and equipment 2,934,008 96,165 - 3,030,173
Leasehold improvements 1,282,575 91,613 - 1,374,188
Total accumulated depreciation 39,317,919 2,332,877 - 41,650,796
Total capital assets, net of
accumulated depreciation 38,107,202$ (150,986)$ (164,887)$ 37,791,329$
Depreciation expense for the Authority for the year ended September 30, 2016 was $2,332,877.

N 36
3. Reading Area Community College
Capital asset activity for the year ended June 30, 2016 is as follows:
Depreciation expense for the College for the year ended June 30, 2016 was $2,302,154.
Balance Balance
July 1, Transfers/ June 30,
2015 Additions Deletions 2016
Capital assets, not being depreciated:
Land 1,081,556$ -$ -$ 1,081,556$
Construction in progress 569,016 658,294 (894,804) 332,506
Total capital assets, not being depreciated 1,650,572 658,294 (894,804) 1,414,062
Capital assets, being depreciated:
Buildings and improvements 63,668,803 1,039,122 (923) 64,707,002
Equipment, furnishings and library books 9,241,342 333,894 (114,344) 9,460,892
Total capital assets, being depreciated 72,910,145 1,373,016 (115,267) 74,167,894
Total capital assets, historical cost 74,560,717 2,031,310 (1,010,071) 75,581,956
Less accumulated depreciation for:
Buildings and improvements 26,469,121 1,740,622 (923) 28,208,820
Equipment, furnishings and library books 6,804,925 561,532 (113,431) 7,253,026
Total accumulated depreciation 33,274,046 2,302,154 (114,354) 35,461,846
Total capital assets being depreciated, net 39,636,099 (929,138) (913) 38,706,048
Total capital assets, net of
accumulated depreciation 41,286,671$ (270,844)$ (895,717)$ 40,120,110$

N 37
NOTE 7: RETIREMENT PLANS A. Primary government
1. General information about the Plan
Plan description. The County provides a single-employer defined benefit pension plan, the Berks County Employees’ Pension Plan (“BCEPP”) that covers all employees of the County. All employees expected to work over 1,000 hours per year are required to enter the plan, and County elected officials have the option of enrolling in the plan. The plan is included in the financial statements of the County as a retirement trust fund and does not issue a separate financial statement. The plan provides retirement, disability and death benefits to plan members and their beneficiaries pursuant to Act 96 of 1971 of the Commonwealth of Pennsylvania (County Pension Law), which may be amended by the General Assembly of the Commonwealth of Pennsylvania. BCEPP is administered by the Berks County Employees’ Retirement Fund Board (“Board”). Management of BCEPP is vested in the Board, which consists of five members – three elected County Commissioners, the County Controller, and the County Treasurer. Benefits provided. BCEPP provides retirement, disability, and death benefits. Retirement benefits for plan members are calculated as a percent of the member’s highest 3-year average salary times the member’s years of service depending on class basis. Plan members with 20 years of service are eligible to retire at age 55. Plan members that have attained age 60 are eligible to retire. All plan members are eligible for disability benefits after 5 years of service if disabled while in service and unable to continue as a county employee. Disability retirement benefits are equal to 25% of highest average salary at time of retirement. Death benefit for a member who dies with 10 years of service prior to retirement is the total present value of member’s retirement paid in a lump sum. A plan member who leaves County service with less than 5 years of service may withdraw his or her contributions, plus any accumulated interest. On an ad hoc basis, cost-of-living adjustments to each member’s retirement allowance shall be reviewed at least once in every three years subsequent to the member’s retirement date. The adjustment, should the County elect to give one, is a percentage of the change in the Consumer Price Index. Employees covered by benefit terms. At December 31, 2016, the following employees were covered by benefit terms:
Inactive plan members or beneficiaries currently receiving benefits 1,147
Inactive plan members entitled to but not yet receiving benefits 215
Active plan members 2,024
Total members 3,386
Contributions. An actuarially determined contribution is recommended by the plan actuary. The actuarially determined rate is the estimated amount necessary to finance the costs of benefits earned by plan members during the year, with additional amount to finance an unfunded accrued liability. For the 2016 measurement period, the active member contribution rate was 5.0 percent of annual pay, and the County average contribution rate was 2.01 percent of annual payroll.

N 38
2. Net Pension (Asset) Liability
The County’s net pension (asset) liability was measured as of December 31, 2016, and the total pension asset used to calculate the net pension (asset) liability was determined by an actuarial valuation as of that date. Actuarial Assumptions. The total pension asset in the December 31, 2016 actuarial valuation was determined using the following actuarial assumptions, applied to all periods included in the measurement:
• Inflation: 3.0 percent
• Salary increase: 3.5 percent, average, including inflation
• Investment rate of return: 7.5 percent, net of pension plan investment expense, including inflation.
Mortality rates were based on the 1983 Group Annuitant Mortality Tables for Males and Females with no projected improvement. The actuarial assumptions used in the valuation for the 2016 measurement period were based on past experience under the plan and reasonable future expectations which represent our best estimate of anticipated experience under the plan. An actuarial experience study was performed during 2016; however, no modifications to assumptions were made as a result.
The long-term expected rate of return on pension plan investments was determined using a building-block method in which best-estimate ranges of expected future real rates of return (expected returns, net of pension plan investment expense and inflation) are developed for each major asset class. These ranges are combined to produce the long-term expected rate of return by weighting the expected future real rates of return by the target asset allocation percentage and by adding expected inflation. Best estimates of arithmetic real rates of return for each major asset class included in the pension plan’s target asset allocation for the 2016 measurement period (see pension plan’s investment policy) are summarized in the following table:
Asset Class Real Rate of Return
Domestic equity 5.4-6.4%
International equity 5.5-6.5%
Fixed income 1.3-3.3%
Real estate 4.5-5.5%
Cash 0.0-1.0%
Discount rate. The discount rate used to measure the total pension liability was 7.5 percent. The projection of cash flows used to determine the discount rate assumed that plan member contributions will be made at the current contribution rate and that County contributions will be made at rates equal to the actuarially determined contribution rates. Based on those assumptions, the pension plan’s fiduciary net position was projected to be available to make all projected future benefit payments of current plan members. Therefore, the long-term expected rate of return on pension plan investments was applied to all periods of projected benefit payments to determine the total pension liability (i.e. no depletion date is projected to occur). See pages RSI 7 and 8 for further information.

N 39
Changes in Net Pension (Asset) Liability
Increase/(Decrease)
Total Pension Plan Fiduciary Net Pension
Liability Net Position (Asset) Liablity
(a) (b) (a) - (b)
Balance at December 31, 2015 401,758,296$ 399,123,328$ (2,634,968)$
Restatement (see Note 1) (11,435,134) - 11,435,134
Balance as restated at
December 31, 2015 390,323,162 399,123,328 8,800,166
Changes for the year:
Service cost 10,623,914 - (10,623,914)
Interest cost 29,071,529 - (29,071,529)
Difference between expected
and actual experience (501,667) - 501,667
Contributions - County - 2,088,776 2,088,776
Contributions - member - 6,500,174 6,500,174
Net investment income - 29,291,596 29,291,596
Other additions - (29,494) (29,494)
Benefit payments, including
refunds of member
contributions (19,382,776) (19,382,776) -
Administrative expense - (41,575) (41,575)
Net changes 19,811,000 18,426,701 (1,384,299)
Balance at December 31, 2016 410,134,162$ 417,550,029$ 7,415,867$
Sensitivity of the net pension (asset) liability to changes in the discount rate. The following presents the net pension (asset) liability of the County, calculated using the discount rate of 7.5%, as well as what the County’s net pension (asset) liability would be if it were calculated using a discount rate that is 1 percentage point lower or higher than the current rate:
County's net
pension (asset)
Discount rate liability
1% decrease (6.5%) (35,854,019)$
Current discount rate (7.5%) 7,415,867$
1% increase (8.5%) 37,775,326$
Pension plan fiduciary net position. Detailed information about the pension plan’s fiduciary net position is available on pages FS 13 and FS 14 of this financial statement.

N 40
3. Pension Expense and Deferred Outflows/Inflows of Resources Related to Pensions.
At December 31, 2016, the County reported deferred outflows of resources and deferred inflows of resources related to pensions from the following sources:
Total Pension Liability Plan Fiduciary Net Position
(Outflow) Inflow (Outflow) Inflow Total
Deferred Inflow/(Outflow) of Resources
as of December 31, 2015 -$ (8,893,864)$ (30,617,599)$ -$ (39,511,463)$
Restatement (3,290,747) 11,602,185 - - 8,311,438
Deferred Inflow/(Outflow) of Resources
as of December 31, 2015, as restated (3,290,747) 2,708,321 (30,617,599) - (31,200,025)
2016 Differences between expected - 501,667 (243,672) - 257,995
and actual experience
2016 portion recognized as pension expense 498,598 (544,132) 8,030,556 - 7,985,022
Deferred Inflow/(Outflow) of Resources
as of December 31, 2016 (2,792,149)$ 2,665,856$ (22,830,715)$ -$ (22,957,008)
Change in Deferred Inflow/(Outflow) of
Resources during 2016 (8,243,017)$
For the 2016 year, the County recognized pension expense of $11,716,092. Amounts reported as deferred outflows/inflows of resources related to pensions will be recognized in pension expense as follows:
Year Ended Amount
2017 (7,985,022)$
2018 (7,985,020)
2019 (6,675,335)
2020 (3,202)
2021 (47,857)
Thereafter (260,572)
(22,957,008)$ 4. Payable to the Pension Plan
For the year ended December 31, 2016, the County had no outstanding amount of contributions to the pension plan required for the year ended December 31, 2016.

N 41
B. Component units
1. Reading Regional Airport Authority
The Authority contributes to the Central Pennsylvania Teamsters Pension Fund, (CPTPF) a Multi-Employer Defined Contribution Pension Plan on behalf of the employees covered by the collective bargaining unit.
In a defined contribution plan, benefits depend solely on amounts contributed to the Plan plus investment earnings. Employees are eligible for participation in the Plan after they have been employed by the Authority for thirteen weeks. The collective bargaining agreement requires the Authority to contribute a fixed amount per employee each month; this contribution amount was $471 at September 30, 2016. The Authority’s contributions for each employee are fully vested when made. The pension contribution for the year ended September 30, 2016 was $39,041.
Employees not covered by the CPTPF receive an amount not in excess of five percent of their base salary, which is contributed to their respective 403(b) account. The Authority’s contribution for the year ended September 30, 2016 was $6,303.
2. Reading Area Community College
Retirement Plans
Employees of the College are currently enrolled in one of three retirement plans. The Pennsylvania State Employees’ Retirement System (“SERS”) and the Public School Employees’ Retirement System (“PSERS”) each administer a cost-sharing, multiple employer defined benefit plan. The Teachers Insurance and Annuity Association/College Retirement and Equity Fund (“TIAA/CREF”) administers a multiple employer defined contribution plan. Employees who were previously a member of SERS or PSERS and have not withdrawn their funds in full are automatically enrolled in SERS or PSERS upon employment with the College; otherwise, only the TIAA/CREF are available to employees.
Employee Defined Benefit Pension Plans
Summary of Significant Accounting Policies
Pension Plans
For purposes of measuring the net pension liability, deferred outflows of resources and deferred inflows of resources related to pensions, and pension expense, information about the fiduciary net position of PSERS and SERS and additions to/deductions from PSERS and SERS fiduciary net position have been determined on the same basis as they are reported by PSERS and SERS. For the purpose, benefit payments (including refunds of employee contributions) are recognized when due and payable in accordance with benefit terms. Investments are reported at fair value.

N 42
General Information about the Pension Plan
Plan descriptions
SERS is a governmental cost-sharing multi-employer defined benefit pension plan established by the Commonwealth of Pennsylvania to provide pension benefits for employees of state government and certain independent agencies. SERS is a component unit of the Commonwealth and is included in the Commonwealth’s financial report as a pension trust fund. PSERS is a governmental cost-sharing multi-employer defined benefit pension plan that provides retirement benefits to public school employees of the Commonwealth of Pennsylvania under Title 24 Part IV of the Pennsylvania General Assembly. The members eligible to participate in the System include all full-time public school employees, part-time hourly public school employees who render at least 500 hours of service in the school year, and part-time per diem public school employees who render at least 80 days of service in the school year in any of the reporting entities in Pennsylvania. PSERS issues a publicly available financial report that can be obtained at www.psers.state.pa.us. Benefits provided SERS provides retirement, death, and disability benefits. Cost of Living Adjustments (COLA) are provided ad hoc at the discretion of the General Assembly. Article II of the Commonwealth of Pennsylvania’s Constitution assigns the authority to establish and amend the benefit provision of the plan to the General Assembly. Member retirement benefits are determined by taking years of credited service times final average salary times two percent times class of service multiplier. Prior to Act 2010-120, employees who retire at age 60 with three years of service, or with 35 years of service if under age 60, are entitled to a normal annual retirement benefit. Members of the General Assembly and certain employees classified in hazardous duty positions can retire with full benefits at age 50, with at least three years of service. Act 2010-120 preserved all benefits in place for members, but mandated a number of benefit reductions for new members effective January 1, 2011. The benefit reduction included a new class of membership that accrues benefits at 2 percent of their final average salary instead of the previous 2.5 percent. The new vesting period changed from five to ten years of credited service, and the option to withdraw lump-sum accumulated benefits. PSERS provides retirement, disability, and death benefits. Members are eligible for monthly retirement benefits upon reaching (a) age 62 with at least one year of credited service; (b) age 60 with 30 or more years of credited service: or (c) 35 more years of service regardless of age. Act 120 of 2010 (Act 120) preserves the benefits of existing members and introduced benefit reductions for individuals who became new members on or after July 1, 2011. Act 120 created two new membership classes, Membership Class T-E (Class T-E) and Membership Class T-F (Class T-F). To qualify for normal retirement, Class T-E and Class T-F members must work until age 65 with a minimum of three years of service or attain a total combination of age and service that is equal to or greater than 92 with a minimum of 35 years of service. Benefits are generally equal to 2 percent or 2.5 percent, depending upon membership class, of the member’s final average salary (as defined in the Code) multiplied by the number of years of credited service. For members whose membership started prior to July 1, 2011, after completion of five years of service, a member’s right to the defined benefits is vested and early

N 43
retirement benefits may be elected. For Class T-E and Class T-F members, the right to benefits is vested after ten years of service. PSERS participants are eligible for disability retirement benefits after completion of five years of credited service. Such benefits are generally equal to 2 percent or 2.5 percent, depending upon membership class, of the member’s final average salary (as defined in the Code) multiplied by the number of years of credited service, but not less than one-third of such salary nor greater than the benefit the member would have had at normal retirement age. Members over normal retirement age may apply for disability benefits. Death benefits are payable upon the death of an active PSERS member who has reached age 62 with at least one year of credited service (age 65 with at least three years of credited service for Class T-E and Class T-F members) or who has at least five years of credited service (ten years for Class T-E and Class T-F members). Such benefits are actuarially equivalent to the benefit that would have been effective if the member has retired on the day before death. Contributions Pursuant to 5507 of the SERC (71 PA. C.S. 5507) requires the Commonwealth and other employers whose employees are SERS members to make contributions to the fund on behalf of all active members and annuitants necessary to fund the liabilities and provide the annuity reserves required to pay benefits. SERS funding policy, as set by the board, provides for periodic active member contributions at statutory rates. SERS fund policy, as set by the board, provides for periodic active member contributions at statutory rates. The SERS funding policy also provides for periodic employer contributions at actuarially determined rates based on SERS funding valuation, expressed as a percentage of annual retirement covered payroll, such that they, along with employee contributions and an actuarially determined rate of investment return, are adequate to accumulate assets to pay benefits when due. However, Act 2010-120 imposes rate increase collars (limits on annual rate increases) on employer contributions that keep the employer contribution rate below the rates established in accordance with the actuarial parameters. The collar of the Commonwealth fiscal year 2013-2014 was 4.5 percent and will remain at that rate until no longer needed. SERS Member Contributions: The general membership contribution rate for all Class A and Class AA members is 5 percent and 6.25 percent of salary, respectively. The general membership contribution rate under Act 2010-120 for A-3 and A-4 members is 6.25 percent and 9.3 percent of salary, respectively. The contribution rate for Class D-4 members is 7.5 percent. All employee contributions are recorded in individually identified accounts that are credited with interest, calculated at 4 percent per annum, as mandated by statute. SERS Employer Contributions: Participating employer contributions for SERS are based upon an actuarially determined percentage of gross pay that is necessary to provide SERS with assets sufficient to meet the benefits to be paid to members. The College contribution rate at June 30, 2016 ranged between 17.18 percent and 24.86 percent of gross pay depending on the class of the employee. Contributions to the pension plan from the College were $15,211 for the year ended June 30, 2016. The PSERS contribution policy is set by state statute and requires contributions by active members, employees and the Commonwealth of Pennsylvania.
N 44
PSERS Member Contributions: Active members who joined the System prior to July 22, 1983, contribute at 5.25 percent (Membership Class T-C) or at 6.50 percent (Membership Class T-D) of the member’s qualifying compensation. Members who joined the System on or after July 22, 1983, and who were active or inactive as of July 1, 2001, contribute at 6.25 percent (Membership Class T-C) or at 7.50 percent (Membership Class T-D) of the member’s qualifying compensation. Members who joined the System after June 30, 2001 and before July 1, 2011, contribute at 7.50 percent (automatic Membership Class T-D). For all new hires and for members who elected Class T-D membership, the higher contribution rates began with service rendered on or after January 1, 2002. Members who joined the System after June 30, 2011 automatically contribute at the Membership Class T-E rate of 7.5 percent (base rate) of the member’s qualifying compensation. All new hires after June 30, 2011, who elect Class T-F membership, contribute at 10.3 percent (base rate) of the member’s qualifying compensation. Membership Class T-E and Class T-F are affected by a “shared risk” provision in Act 120 of 2010 that in future fiscal years could cause the Membership Class T-E contribution rate to fluctuate between 7.5 percent and 9.5 percent and Membership Class T-F contribution rate to fluctuate between 10.3 percent and 12.3 percent. PSERS Employer Contributions: The College’s contractually required contribution rate for fiscal year ended June 30, 2016 was 25.00 percent of covered payroll of which the Commonwealth of Pennsylvania contributes 50 percent of the College’s contractually required contributions. The contractually required contribution is actually determined as an amount that, when combined with the employee contributions, is expected to finance the costs of benefits earned by employees during the year, with an additional amount to finance any unfunded accrued liability. The rate was certified by the PSERS board of trustees. Contributions to the pension plan from the College were $300,068 for the year ended June 30, 2016. PSERS State Contributions: Pursuant to Section 8327 of the PSERS Retirement Code, the Commonwealth of Pennsylvania funds 50 percent of the College’s retirement expense directly to the plan. This arrangement does meet the criteria of a special funding situation in accordance with GASB standards. Therefore, the net pension liabilities and related pension expense represent 50 percent of the College’s share of these amounts. Pension Liabilities, Pension Expense, and Deferred Outflow of Resources and Deferred
Inflows of Resources Related to Pensions
At June 30, 2016, the College reported a liability of $186,577 for its proportionate share of the SERS net pension liability. The SERS net pension liability was measured as of December 31, 2015, and the total pension liability used to calculate the net pension liability was determined by rolling forward the System’s total pension liability as of December 31, 2014 to December

N 45
31, 2015. The College’s proportion of the SERS net pension liability was calculated utilizing the projected employer’s contributions for the following year as it relates to the total projected employer’s contributions for the following year. At December 31, 2015, the College’s proportion was 0.0010 percent, which was a decrease of 0.0007 percent from its proportion measured as of December 31, 2014. At June 30, 2016, the College reported a liability for its proportionate share of the PSERS net pension liability that reflected a reduction for Commonwealth of Pennsylvania pension support provided to the College. The amount recognized by the College as its proportionate share of the net pension liability, the related Commonwealth support, and the total portion of the net pension liability that was associated with the College are as follows:
College's proportional share of the net pension liability 4,375,000$
Commonwealth's proportional share of the net pension liability 4,375,000
Total proportionate share of the net pension liability 8,750,000$
The PSERS net pension liability was measured as of June 30, 2015, and the total pension liability used to calculate the net pension liability was determined by rolling forward the System’s total pension liability as of June 30, 2014 to June 30, 2015. The College’s proportion of the PSERS net pension liability was calculated utilizing the employer’s one-year reported covered payroll as it relates to the total one-year reported covered payroll. At June 30, 2015, the College’s proportion was 0.0101 percent, which was a decrease of 0.0001 percent from its proportion measured as of June 30, 2014. For the year ended June 30, 2016, the College recognized total pension expense from the two plans of $114,302. At June 30, 2016, the College reported deferred outflows of resources and deferred inflows of resources related to pensions from the following sources:
Deferred Deferred
Outflow of Inflow of
Resources Resources
Net difference between projcted and actual
investment earnings 18,995$ 9,000$
Change of assumptions 5,544 -
Difference between expected and actual experience 3,777 18,000
Changes in proportions 121,832 106,491
Difference between employer contributions and
proportionate share of total contributions 16,668 132
Contributions subsequent to the measurement date 304,638 -
471,454$ 133,623$ The $304,638 reported as deferred outflows of resources resulting from College pension contributions made subsequent to the measurement date will be recognized as a reduction of the net pension liability in the year ended June 30, 2017.

N 46
Other amounts reported as deferred outflows of resources and deferred inflows of resources related to pensions will be recognized in pension expense as follows for the years ending June 30:
2017 (329)$
2018 (329)
2019 (329)
2020 37,222
2021 (3,042)
33,193$ SERS Actuarial Assumptions The actuarial valuation uses assumptions regarding future rates of investment return and rates of retirement, withdrawal, death, and disability among SERS members and their beneficiaries. The current set of assumptions used in the December 31, 2014 actuarial valuation, with the exception of the discount rate assumption, was adopted by the State Employees’ Retirement Board based upon actual experience of SERS during the years 2006 through 2010. Based upon subsequent review of SERS investment data and results, the Board approved a reduction in the assumed discount rate from 8.00 percent to 7.50 percent effective as of the December 31, 2011 actuarial valuation and the 7.50 percent assumption has remained in effect since then. The following actuarial assumptions applied to all periods included in the measurement:
• Actuarial cost method: Entry Age Normal.
• Investment return: 7.50 percent, includes inflation at 2.75 percent.
• Salary increases: Effective average of 5.50 percent, which reflects an allowance for inflation of with a range of 4.30 percent and 11.05 percent including inflation at 2.75 percent.
• Mortality rates were based on the RP-2000 Mortality Tables adjusted for actual plan experience and future improvement.
PSERS Actuarial Assumptions The total pension liability as of June 30, 2015 was determined by rolling forward the System’s total pension liability as of the June 30, 2014 actuarial valuation to June 30, 2015 using the following actuarial assumptions, applied to all periods included in the measurement:
• Actuarial cost method: Entry Age Normal level of percent pay
• Investment return: 7.50 percent, includes inflation at 3.00 percent.
• Salary increases: Effective average of 6.10 percent, which reflects an allowance for inflation of 3.00 percent, real wage growth of 1 percent, and merit or seniority increases of 1.50 percent .
• Mortality rates were based on the RP-2000 Combined Healthy Annuitant Tables (male and female) with age set back three years for both males and females. For disabled annuitants the RP-2000 Combined Disabled Tables (male and female) with age set back seven years for males and three years for females.

N 47
The actuarial assumptions used in the June 30, 2014 valuation were based on the experience study that was performed for the five-year period ended June 30, 2010. The recommended assumption changes based on this experience study were adopted by the board at its March 11, 2011 board meeting, and were effective beginning with the June 30, 2011 actuarial valuation. The long-term expected rate of return on both pension plans’ investments was determined using a building-block method in which best-estimate ranges of expected future real rates of return (expected returns, net of pension plan investment expense and inflation) are developed for each major asset class. These ranges are combined to produce the long-term expected rate of return by weighing the expected future real rates of return by the target asset allocation percentage and by adding expected inflation. The SERS pension plan’s policy in regard to the allocation of invested plan assets is established and may be amended by the board. Plan assets are managed with a long-term objective of achieving and maintaining a fully funded status for the benefits provided through the pension. The below was the board’s adopted asset allocation policy and best estimates of geometric real rates of return for each major asset class as of December 31, 2015.
Long-Term
Target Expected Real
Asset Class Allocation Rate of Return
Alternative investments 15% 8.50%
Global public equity 40% 5.40%
Real assets 17% 4.95%
Diversifying assets 10% 5.00%
Fixed income 15% 1.50%
Liquidity reserve 3% 0.00%
100% The PSERS pension plan’s policy in regard to the allocation of invested plan assets is established and may be amended by the board. Plan assets are managed with a long-term objective of achieving and maintaining a fully funded status for the benefits provided through the pension. The below was the board’s adopted asset allocation policy and best estimates of geometric real rates of return for each major asset class as of June 30, 2015.

N 48
Long-Term
Target Expected Real
Asset Class Allocation Rate of Return
Public markets global equity 22.5% 4.8%
Private markets 15.0% 6.6%
Private real estate 12.0% 4.5%
Global fixed income 7.5% 2.4%
U.S. long treasuries 3.0% 1.4%
TIPS 12.0% 1.1%
High yield bonds 6.0% 3.3%
Cash 3.0% 0.7%
Absolute return 10.0% 4.9%
Risk parity 10.0% 3.7%
MLPs/Infrastructure 5.0% 5.2%
Commodities 8.0% 3.1%
Financing (LIBOR) -14.0% 1.1%
100.0%
Discount Rate: SERS and PSERS The discount rate used to measure the total pension liability was 7.50 percent. The projection of cash flows used to determine the discount rate assumed that contributions from plan members will be made at the current contribution rate and that contributions from employers will be made at contractually required rates, actuarially determined. Based on those assumptions, the pension plan’s fiduciary net position was projected to be available to make all projected future benefit payments of current plan members. Therefore, the long-term expected rate of return on the pension plan investments was applied to all periods of projected benefit payments to determine the total pension liability. Sensitivity of the College’s Proportionate Share of the Net Pension Liability to Changes in the Discount Rate The following presents the net pension liability, calculated using the discount rate of 7.50 percent, as well as what the net pension liability would be if it were calculated using a discount rate that is 1-percentage point lower (6.50%) or 1-percentage point higher (8.50%) than the current rate:
Current
1% Decrease Discount Rate 1% Increase
6.50% 7.50% 8.50%
College's proportionate share of the
SERS' net pension liability 231,764$ 186,577$ 147,832$
College's proportionate share of the
PSERS' net pension liability 5,392,000 4,375,000 3,520,000

N 49
Pension Plan Fiduciary Net Position Detailed information about PSERS’ fiduciary net position is available in PSERS Comprehensive Annual Financial Report which can be found on the System’s website at www.psers.state.pa.us. Detailed information about SERS’ fiduciary net position is available in SERS Comprehensive Annual Financial Report which can be found on the System’s website at www.sers.pa.gov. Payable to the Pension Plan At June 30, 2016, the College had an accrued balance due to PSERS of $78,768. This amount represents the College’s contractually obligated contributions for wages earned in April 2016 through June 2016. The balance will be paid in September 2016. Employee Defined Contribution Pension Plan
TIAA-CREF is a cost-sharing multi-employer defined contribution plan and an option to employees who wish to participate in a program whose benefits depend solely on amounts contributed plus investment earnings. Employees who elect to participate in this plan are required to make a contribution of 6.25 percent (5% if enrolled before 1983) of their gross pay. The College contribution rate at June 30, 2016 was between 6.00 percent and 9.00 percent of gross pay depending on the class of employee. Beyond that salary-based contribution, the College bears no responsibility for any liabilities, funded or unfunded, of TIAA/CREF. Contributions are immediately and fully vested. The contributions to TIAA-CREF for the year ended June 30, 2016 was $1,824,311, which consisted of $1,066,380 from the College and $757,931 from employees. 403(b) Tax Shelter Plan
The College has established a 403(b) tax shelter plan permitting the establishment of accounts for college employees to voluntarily set aside monies to supplement their retirement income. All college employees are eligible to participate. The College does not contribute to the Plan.

N 50
NOTE 8: FUTURE LEASE RENTALS RECEIVABLE AND RELATED DEBT
A. Component units
1. Reading Regional Airport Authority The majority of rental agreements currently in effect for airport facilities are multi-year leases, subject to renewal. At September 30, 2016, future minimum lease payments receivable under significant noncancelable long-term operating leases are as follows for each year ending September 30:
2017 879,176$
2018 798,205
2019 714,119
2020 694,415
2021 614,556
Thereafter 4,781,815
8,482,286$
NOTE 9: RISK MANAGEMENT
A. Primary government
The County is exposed to various risks of loss related to torts, theft of, damage to, and destruction of assets, errors and omissions, and natural disasters. The risks are covered by commercial insurance purchased from independent third parties. Settled claims from these risks have not exceeded commercial insurance coverage for the past five years.
1. Self-insured workers’ compensation
Since 2002, the County is exposed to risk of loss related to self-insurance activities for workers’ compensation. The County has excess workers’ compensation insurance with a self-insured retention per occurrence of $600,000.
The County maintains workers’ compensation reserves for claims incurred and claims incurred but not reported in the funds to which, per the County’s estimate, they apply. Liabilities are reported on the government-wide and proprietary fund statements. Based on history of claims paid and the County’s Aa1 Moody’s rating, the required balance in the Workers Compensation Trust Fund maintained by the County is $524,215 for 2016. The accrued liability for workers’ compensation is determined by an actuary in accordance with actuarial principles; such claims are not discounted. There have been no changes in insurance coverage, retention limits or excess loss policies from the prior year. The amounts of settlements for the past three fiscal years did not exceed excess loss insurance coverage. All discounted accrued workers’ compensation self-insurance liabilities at December 31, 2016, are summarized as follows:

N 51
Governmental activities 1,788,231$
Business-type activities 1,375,343
Total 3,163,574$ The following summary provides aggregate information on workers’ compensation self-insurance liabilities; incurred claims and payments during the years ended December 31, 2014, 2015 and 2016.
January 1 Incurred December 31
Year liability claims Payments liability
2014 3,790,088$ 948,752$ 988,883$ 3,749,957$
2015 3,749,957$ 932,703$ 1,367,896$ 3,314,764$
2016 3,314,764$ 850,336$ 1,001,526$ 3,163,574$
2. Self-insured healthcare In addition to those risks noted above, the County is exposed further to risk of loss related to claims activities for employees’ healthcare. The County elected to self-insure for employee healthcare insurance beginning in 2006, and maintains healthcare reserves for claims incurred, and claims incurred but not reported, in the funds to which, per the County’s estimate, they apply. Liabilities are reported on the government-wide and proprietary fund statements. The accrued healthcare claims liability is based on the requirements of GASB Statement 10, as amended by GASB Statement 30, which requires that a liability for claims, reported and unreported, be recorded, if information prior to the issuance of financial statements indicates that it is probable that a liability has been incurred at the date of the financial statements, and the amount of the loss can be reasonably determined. This determination has been made by the County, to be conservative in its provisions for healthcare reserves, along with the assistance of its healthcare insurance advisor. The County has contracted with a third party administrator to process claims which are paid from the General Fund on a monthly basis. During 2016, the County has incurred and processed healthcare claims of $30.5 million. All accrued incurred but not recorded (IBNR) healthcare claims liabilities at December 31, 2016, are summarized as follows:
Governmental activities 1,595,356$
Business-type activities 402,760
Total 1,998,116$ The following summary provides aggregate information on healthcare self-insurance liabilities, incurred claims and payments during the years ended December 31, 2014, 2015 and 2016.
January 1 Incurred December 31
Year liability claims Payments liability
2014 1,871,346$ 26,731,037$ 26,643,726$ 1,958,657$
2015 1,958,657$ 27,968,237$ 28,073,894$ 1,853,000$
2016 1,853,000$ 30,638,686$ 30,493,570$ 1,998,116$

N 52
3. Health Choices self-insured healthcare During 1997, the Commonwealth of Pennsylvania’s Department of Human Services (DHS) implemented a managed care program for the Medicaid population in Pennsylvania. This program, called the Health Choices Program, was developed and implemented in stages with the County being part of the third implementation. The County has contracted with a behavioral health managed care organization, Community Care Behavioral Health Organization (Community Care), which is responsible for most of the day to day functions including care management, establishment of the provider network, and claims payments to providers. Community Care accrues an estimate of its healthcare cost liability at the end of each accounting period. All monthly incurred claims estimates are calculated by Community Care’s actuary. The actuary uses a multitude of items in the calculation of incurred claims. Such items include authorizations, paid claims, historical trends, completion factors, provider issues, etc. Incurred claims are accrued on a monthly basis in Community Care’s general ledger. Community Care and the actuary continuously monitor prior month’s incurred amounts and regularly make contract year to date adjustments to Community Care’s incurred balances. Medical liability is composed of two parts: Received but Unpaid Claims (RBUCs) and IBNR. Community Care generates its estimate of RBUCs by using all claims that were actually entered into the claims processing system using a hierarchy of paid amount, allowed amount, or billed amount to calculate the RBUCs amount. IBNR is the difference between the total estimated medical liability and the RBUCs. These are reported on the DHS Financial Report 6, Claims Payable (RBUCs and IBNRs). The actuary issued a Statement of Actuarial Opinion certifying the total June 30, 2016 RBUC and IBNR. The County contracts with an independent actuary to review the medical expense amounts reported by Community Care to ensure the amounts are actuarially sound. The amount of accrued incurred but not recorded (IBNR) healthcare claims liabilities at
December 31, 2016, is $6,679,266, and is included in accrued claims other in the
accompanying governmental funds balance sheet. The following summary provides aggregate information on Health Choice’s self-insured healthcare liabilities, incurred claims and payments during the years ended December 31, 2014, 2015 and 2016.
January 1 Incurred December 31
Year Liability Claims Payments Liability
2014 5,703,602$ 66,380,363$ 66,460,531$ 5,623,434$
2015 5,623,434$ 70,726,711$ 70,245,582$ 6,104,563$
2016 6,104,563$ 72,607,437$ 72,032,734$ 6,679,266$

N 53
A. Component units
1. Reading Area Community College
The College is exposed to various risks of loss related to torts; theft of, damage to, and destruction of assets; errors and omissions; injuries to employees; and natural disasters. Significant losses are covered by commercial insurance for all major programs except for health insurance, for which the College retains partial risk of loss. For insured programs there were no significant reductions in insurance coverages of the 2015/2016 year. Settlement amounts have not exceeded insurance coverage for the current year or the three prior years. The College funds health insurance claims up to $65,000 individually and $3,699,283 in the aggregate for the year ended June 30, 2016. Stop gap insurance is in place for claims in excess of these thresholds. Included in the financial statement is a liability for $400,000 for outstanding estimated claims at June 30, 2016. This liability is entirely funded. Activity in the liability for outstanding claims and claim adjustment expenses is summarized as follows for the period ending June 30, 2016:
.
Balance at July 1 400,000$
Claims incurred 2,968,938
Claims paid (2,968,938)
Balance at June 30 400,000$

A. Primary government
1. General obligation bonds
· Governmental activities
Balance Accretion Balance
outstanding in capital outstanding
January 1, Additions/ appreciation December 31, Due within
2016 Transfers bonds Reductions 2016 one year
1992 Second Series General Obligation Bonds,
$108,070,131, varying interest rates ranging from
2.70% to 6.25% through 2017, including current
interest bonds and capital appreciation bonds, to
advance refund the Series 1990 General
Obligation Bonds and a portion of the 1992 First
Series General Obligation Bonds. 20,884,208$ -$ 1,325,647$ 11,495,000$ 10,714,855$ 10,714,855$
1993 Second Series General Obligation Bonds,
$43,057,830, varying interest rates ranging from
2.50% to 5.00% through 2020, including current
interest bonds and capital appreciation bonds to
advance refund a portion of the 1992 Second
Series General Obligation Bonds. 43,625,273 - 2,392,669 3,460,000 42,557,942 3,560,000
2005 General Obligation Bonds, $9,415,000,
varying interest rates ranging from 5.10% to
5.90% through 2021, to refund a portion of
principal and interest on the Series 1995 General
Obligation Bonds. 7,235,000 - - 1,040,000 6,195,000 1,105,000
2009 General Obligation Bonds Series A,
$29,800,000, varying interest rates ranging from
3% to 4.7% through 2029, to refund the Series
1999 General Obligation Bonds. 22,620,000 - - 22,620,000 - -
2009 General Obligation Bonds Series B Build
America, $15,050,000 (governmental activities
$14,823,000; business-type activities $227,700),
varying interest rates ranging from 1.234% to
6.133% through 2029, to fund County Capital
Projects. 13,701,160 - - 200,900 13,500,260 210,700
During 2016, the County issued General Obligation Bond Series 2016 in the amount of $9,790,000. The 2016 Series Bonds were issued at a premium of
$209,950. The proceeds of the bonds were used to advance refund the 2009 Series A General Obligation Bonds and to pay issuance costs. The bond
proceeds of $9,790,000 were used to pay bond issuance costs of $119,123 and to transfer $9,880,826 to an escrow agent for the 2009 Series A Bonds.
The County also deposited an additional $15,062,585 of County funds for the defeasance of the $12,830,000 remaining portion of the 2009 Series A
bonds not refinanced with the 2016 Series Bonds. These funds are invested in United States Treasury Obligations which provide sufficient funds to pay
interest and principal on all outstanding 2009 Series A bonds. The aggregate difference in debt service between the 2016 Series Bonds and the 2009
Series A Bonds totaled $19,275,730. The economic gain on the transaction (difference between the present values of the old and new debt service
payments) was $1,769,974. Due to this transaction, a refunding loss is recognized in the funds where the bonds are recorded. The refunding loss will be
amortized over the life of the 2016 Series Bonds.
At December 31, 2016, general obligation bonds consisted of the following:
N 54

2010 General Obligation Bonds Series B,
Recovery Zone Economic Development Bonds,
$7,790,000, varying interest rates ranging from
4.27% to 5.485% through 2025, to fund County
Capital Projects. 7,765,000 - - 5,000 7,760,000 780,000
2010 General Obligation Bonds Series C, Build
America Bonds, $42,405,000, varying interest
rates ranging from 2.35% to 5.8% through 2030,
to fund County Capital Projects. 42,375,000 - - 5,000 42,370,000 5,000
2010 General Obligation Bonds Series D,
$6,550,000, varying interest rates ranging from
.87% to 4.16% through 2020, to fund County
Capital Projects. 3,545,000 - - 660,000 2,885,000 685,000
2012 General Obligation Bonds, $9,870,000,
varying interest rates ranging from .29% to
3.125% through 2030, to refund the Second Series
of 2002 General Obligation Bonds, and to fund
County Capital Projects. 9,490,000 - - 85,000 9,405,000 85,000
2012 Federally Taxable General Obligation Bonds
Series A, $37,280,000 (governmental activities
$29,940,942; business-type activities $7,339,058),
varying interest rates ranging from .382% to
3.328% through 2037 to fund County Pension
Liabilities, and to fund County Capital Projects. 28,355,332 - - 981,531 27,373,801 989,920
2013 General Obligation Bonds, $17,785,000,
varying interest rates ranging from 1% to 5%
through 2033, to fund County Capital Projects. 15,850,000 - - 635,000 15,215,000 650,000
2014 General Obligation Bonds, $10,000,000,
varying interest rates ranging from .25% to 3.0%
through 2029, to advance refund a portion of the
2010 General Obligation Bonds Series A and to
pay for the issuance costs associated with the
bonds. 9,995,000 - - 5,000 9,990,000 5,000
2015 General Obligation Bonds, $44,030,000
(governmental activities $24,656,800; business-
type activities $19,373,200), varying interest rates
ranging from .18% to 5.0% through 2028, to
advance refund the Series 2008 General
Obligation Bonds and to advance refund the
remaining portion of the 2010 Series A General
Obligation Bonds. 24,525,200 - - 708,400 23,816,800 285,600
2016 General Obligation Bonds, $9,790,000,
varying interest rates ranging from .43% to 4.0%
through 2029, to advance refund the 2009 Series
A General Obligation Bonds. - 9,790,000 - 660,000 9,130,000 600,000
249,966,173$ 9,790,000$ 3,718,316$ 42,560,831$ 220,913,658$ 19,676,075$
N 55

Unamortized premium 2009A 60,141 - - 60,141 -
Unamortized discount 2012 (72,024) - - (5,054) (66,970)
Unamortized premium 2013 2,452,081 - - 136,227 2,315,854
Unamortized premium 2014 71,934 - - 5,138 66,796
Unamortized premium 2015 3,479,854 - - 267,681 3,212,173
Unamortized premium 2016 - 209,950 - 14,996 194,954
Total 255,958,159$ 9,999,950$ 3,718,316$ 43,039,960$ 226,636,465$
Less: Current Maturities (19,676,075)
206,960,390$
Total Debt
Years ending Principal Interest Service
2017 19,676,075$ 7,352,069$ 27,028,144$
2018 20,504,203 7,178,672 27,682,875
2019 20,686,982 6,981,307 27,668,289
2020 20,941,260 6,745,741 27,687,001
2021 12,392,233 6,497,674 18,889,907
2022-2026 63,578,826 24,387,143 87,965,969
2027-2031 56,657,913 9,127,626 65,785,539
2032-2036 10,550,363 1,519,351 12,069,714
2037-2040 1,807,861 71,176 1,879,037
226,795,716$ 69,860,759$ 296,656,475$
Unaccreted principal (5,882,058)
Unamortized premium 5,789,777
Unamortized discount (66,970)
Bonds and notes payable at December 31, 2016 226,636,465$
The 1992 Second Series and 1993 Second Series General Obligation Bonds contain capital appreciation bonds. Each year, a portion of the principal is
accreted. The full amount of the maturity value on these funds is included in the principal column of the following table, which discloses future debt
service requirements:
N 56

· Business-type activities
Balance Accretion Balance
outstanding in capital outstanding
January 1, Additions/ appreciation December 31, Due within
2016 Transfers bonds Reductions 2016 one year
2009 General Obligation Bonds Series B Build
America, $15,050,000 (governmental activities
$14,823,000; business-type activities $227,700),
varying interest rates ranging from 1.234% to
6.133% through 2029, to fund County Capital
Projects. 218,840$ -$ -$ 4,100$ 214,740$ 4,300$
2012 Federally Taxable General Obligation Bonds
Series A, $37,280,000 (governmental activities
$29,940,942; business-type activities 7,339,058),
varying interest rates ranging from .382% to
3.328% through 2037 to fund County Pension
Liabilities, and to fund County Capital Projects. 5,444,669 - - 188,469 5,256,200 190,080
2015 General Obligation Bonds, $44,030,000
(governmental activities $24,656,800; business-
type activities $19,373,200), varying interest rates
ranging from .18% to 5.0% through 2028, to
advance refund the Series 2008 General
Obligation Bonds and to advance refund the
remaining portion of the 2010 Series A General
Obligation Bonds. 19,269,800 - - 556,600 18,713,200 224,400
24,933,309$ -$ -$ 749,169$ 24,184,140$ 418,780$
Unamortized premium 2015 2,734,171 - - 210,321 2,523,850
Total 27,667,480$ -$ -$ 959,490$ 26,707,990$
Less: Current Maturities (418,780)
26,289,210$
Debt service requirements to maturity are as follows:
Total Debt
Years ending Principal Interest Service
2017 418,780$ 1,041,437$ 1,460,217$
2018 425,796 1,032,114 1,457,910
2019 438,018 1,019,918 1,457,936
2020 443,740 1,006,717 1,450,457
2021 3,052,767 997,417 4,050,184
2022-2026 12,261,176 3,082,160 15,343,336
2027-2031 5,247,090 740,088 5,987,178
2032-2036 1,549,637 255,735 1,805,372
2037-2040 347,136 13,667 360,803
24,184,140$ 9,189,253$ 33,373,393$
Unamortized premium 2,523,850
Bonds and notes payable at December 31, 2016 26,707,990$
N 57

N 58
2. Derivatives
In March 2014, the County entered into an interest rate basis swap agreement with a financial institution in connection with the Series A of 2012 General Obligation Bonds. The agreement effective date is March 17, 2014 and terminates on November 15, 2037. The financial institution is a floating rate payer based on 67% of 30-day LIBOR. The County is a floating rate payer based upon the BMA Municipal Bond Index as published by Municipal Market Data.
In May 2011, the County entered into an interest rate basis swap agreement with a financial institution in connection with the Series C of 2010 General Obligation Bonds. The agreement effective date is May 11, 2011 and terminates on November 15, 2030. The financial institution is a floating rate payer based on 67% of 30-day LIBOR. The County is a floating rate payer based upon the BMA Municipal Bond Index as published by Municipal Market Data. In September 2016, the County entered into an interest rate basis swap agreement with a financial institution in connection with the Series C of 2010 General Obligation Bonds. The agreement effective date is November 15, 2020 and terminates on November 15, 2030 if early termination is not elected prior to 2030. The County is a fixed rate payer if the agreement doesn’t terminate beginning on November 15, 2020 at 1.149% of notional value at the beginning of each year. The fair value balances and notional amounts of derivative instruments outstanding at December 31, 2016, classified by individual derivative, and the changes in fair value of such derivative instruments for the year then ended as reported in the 2016 financial statements are as follows:
Changes in Fair Value Fair Value
Classification Amount Classification Amount Notional
Governmental activities
Investment derivatives:
Interest rate swap Investment revenue (700,377)$ Investment 426,655$ 42,370,000$
Interest rate swap Investment revenue (409,534) Investment 418,996 32,630,000
Cash flow hedges:
Interest rate swap Deferred inflow 1,084,333 Debt 1,084,333 38,305,000
Business-type activities
Investment derivatives:
Interest rate swap Investment revenue (78,637) Investment 80,354 32,630,000
Total of all activities
Investment derivatives:
Interest rate swap Investment revenue (700,377) Investment 426,655 42,370,000
Interest rate swap Investment revenue (488,171) Investment 499,350 65,260,000
Cash flow hedges:
Interest rate swap Deferred inflow 1,084,333$ Debt 1,084,333$ 38,305,000$
The investment derivative instruments are reported as a derivative asset and as a borrowing in the respective activities column of the statement of net position. The change in fair market value during the year ended December 31, 2016, is accounted for as a component of investment

N 59
earnings on the statement of activities. The cash flow hedge derivative instrument is reported as a derivative asset and as deferred inflow of resources in the respective activities column of the statement of net position. The change in fair value is recognized by adjusting both accounts on the statement of net position. The valuations shown are not actual market prices at which an offer would be made for unwinding any transactions, but rather calculated mathematical approximations of market values derived from proprietary models as of a given date. The methods used for the valuation result in the derivatives being classified as Level 2 investments in the County’s fair value disclosure. The following table displays the objectives and terms of the County’s hedging derivative instruments outstanding at December 31, 2016, along with the credit rating of the associated counterparty. This hedging derivative has a mandatory early termination date of November 15, 2020, so the debt disclosures are not applicable to this derivative for that reason.
Type Receive-fixed interest rate swap
Objective Hedge changes in fair value of Series C of 2010 bonds
Notional Amount $38,305,000
Effective Date 11/15/2020
Maturity Date 11/15/2030
Terms Receive 67% LIBOR plus .535%, pay 1.149%
Counterparty Credit rating Aa3/AA-/AA
Through the use of derivative instruments the County is exposed to a variety of risks, including credit risk, interest rate risk, termination risk, market-access risk, and basis risk. The County has diversified this risk by using various financial institutions selected via a competitive bidding process.
Basis Risk / Interest Rate Risk – is the risk that interest rates move such that the percentage of the 1 Month LIBOR rate or 5 year ISDA rate plus fixed spread received by the County is lower than the variable rate paid by the County to the counterparty. If the percentage of the 1 Month LIBOR rate plus fixed spread received by the County is lower than the variable rate the County is paying to the counterparty under the terms of the swap, the County would be obligated to make a periodic net swap payment to the counterparty – based on market conditions, the net swap payments due by the County to the counterparty could be significant. Tax Risk - is the risk that the tax laws change (such as adoption of a National Flat Tax or a reduction in the marginal income tax rates) would cause a reduction or elimination of the benefits of issuing tax-exempt debt and, in this event, the percentage of the taxable (1-Month LIBOR or 5 year ISDA) market would not correlate to the tax-exempt market (SIFMA Index) on the same historic basis and the estimated benefit to the County would be significantly reduced or eliminated.
Counterparty Risk – is the risk that the counterparty will default on their swap payments under the interest rate swap agreement to the County. Termination Risk–the risk that the County decides to terminate the Swap or a termination event occurs and the County is obligated to terminate the Swap and market conditions are such that the

N 60
County is “out of the money.” In an “out of the money” scenario, the County would have to pay termination payment to the counterparty to terminate the Swap which could be significant.
Rollover Risk – is the risk that the County is obligated to terminate or amend the Swap if it decides to refinance its Federally Taxable General Obligation Bonds, Series C of 2010 and Series A of 2012.
Credit (Default) Risk – is the risk that the County’s long-term credit rating is downgraded in the future, giving the counterparties an additional termination event if the County does not post the amount of collateral needed to secure its obligations under the terms of the Swap. In the event that the County cannot post an amount of collateral required, the counterparty will have the ability to obligate the County to terminate the swap at the then current market rate.
3. Letter of Credit
The County has a standby letter of credit in the amount of $65,000 at December 31, 2016. The
letter of credit was issued to act as security for the County’s pre-self-insurance claims for worker’s compensation prior to 2002.
4. Defeasance of debt
In prior years, the County defeased certain general obligation bonds by placing the proceeds of new bonds into an irrevocable trust to provide for all future debt service payments on the old bonds. Accordingly, the trust account assets and the liability for the defeased bonds are not included in the financial statements. At December 31, 2016, $77,580,000 of bonds outstanding is considered defeased. During 2016, the County defeased its Series A of 2009 General Obligation Bonds by placing proceeds from its 2016 General Obligation Bonds and by separately contributing County funds into an irrevocable trust to provide for all future debt service payments on the old bonds. Accordingly, the trust account assets and the liability for the defeased bonds are not included in the financial
statements. At December 31, 2016, $21,385,000 of bonds outstanding is considered defeased.
5. Reimbursement agreement
In connection with the issuance of the 1995 General Obligation Bonds in the amount of $9,840,000, the County entered into a reimbursement agreement with the Greater Berks Development Fund. Under the terms of the agreement, the County is reimbursed for the debt service requirements of the 1995 General Obligation Bonds. The 2005 General Obligation Bonds in accordance with the negotiated Option Agreement of September 2002 refunded the 1995 General Obligation bonds in November 2005. The reimbursement agreement with the Greater Berks Development Fund remains in place as of December 31, 2016.
6. Federal arbitrage regulations
The County is subject to federal arbitrage regulations on its non-taxable general obligation bonds and notes. There was no outstanding liability for federal arbitrage due and payable in the governmental funds or the accrual-based government wide financial statements at December 31, 2016.

N 61
7. Other changes in long term liabilities
The following represents changes in long-term liabilities, other than bond issues:
Balance Balance
January 1, December 31, Due within
2016 Additions Reductions 2016 one year
Governmental activities:
Agricultural easement
installment purchases 90,450$ 145,307$ 45,225$ 190,532$ 96,505$
Workers compensation
accrued liabilities 1,899,666 557,542 668,977 1,788,231 207,971
Compensated absences
payable 4,274,897 6,648,222 6,531,126 4,391,993 1,103,405
Total governmental
activities 6,265,013$ 7,351,071$ 7,245,328$ 6,370,756$ 1,407,881$
Business-type activities:
Workers compensation
accrued liabilities 1,415,098$ 292,794$ 332,549$ 1,375,343$ 159,953$
Compensated absences
payable 1,153,904 1,472,925 1,677,430 949,399 324,278
Total business-type
activities 2,569,002$ 1,765,719$ 2,009,979$ 2,324,742$ 484,231$
For governmental activities, agricultural easement installment purchases are liquidated by the land preservation fund. Worker’s compensation accrued liabilities and compensated absences payable are liquidated by the general fund and special revenue funds.
8. Guaranteed debt of others
The following revenue bonds and notes are guaranteed by the County, with balances outstanding as of December 31, 2016. The County has not been called upon to make any payments related to this debt.
Series of 2008, Reading Regional Airport Authority 4,420,000
Series of 2007, Redevelopment Authority of Berks County 1,383,829

N 62
B. Component units
A. Revenue bonds payable
• Berks County Solid Waste Authority
At December 31, 2016, revenue bonds payable consisted of the following:
Balance Balance
outstanding outstanding
January 1, Additions December 31,
Bonds 2016 (payments) 2016 County Guaranteed Revenue Bonds,
Series of 2009, varying interest rates
from 2.00% to 2.75% through 2016,
initial issue $6,290,000 975,000$ (975,000)$ -$ The County of Berks has unconditionally and irrevocably guaranteed the full and prompt payment of the debt service on the 2009 revenue bonds when they become due and payable, pursuant to the guaranty agreement dated September 15, 2009 between the County and the Authority. In addition, the bonds are collateralized by substantially all revenues of the Authority and balances in the Authority’s trust accounts. In March 2016, the bonds were paid in full.
• Reading Area Community College
Bonds payable on June 30, 2016, consisted of several outstanding tax-exempt revenue bond series issued by the State Public School Building Authority (SPSBA). In connection with the bond issuance, the College entered into a loan agreement with SPSBA under which the College has pledged its full faith and credit for the repayment of the bonds. The loan constitutes an unsecured general obligation of the College. The bonds were issued to provide funds to undertake various capital projects at the College or to advance refund certain previously issued bonds. Activity for the various bond series for the year ended June 30, 2016, was as follows:
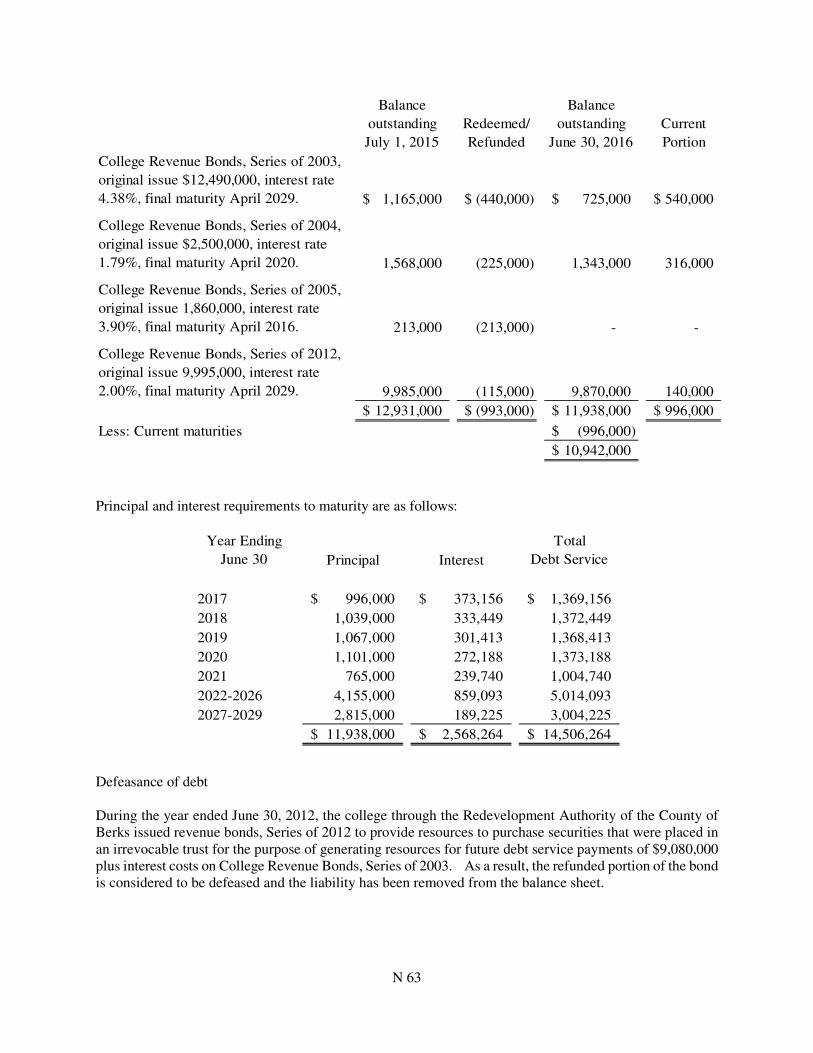
N 63
Balance
outstanding
July 1, 2015
Redeemed/
Refunded
Balance
outstanding
June 30, 2016
Current
Portion
College Revenue Bonds, Series of 2003,
original issue $12,490,000, interest rate
4.38%, final maturity April 2029. 1,165,000$ (440,000)$ 725,000$ 540,000$
College Revenue Bonds, Series of 2004,
original issue $2,500,000, interest rate
1.79%, final maturity April 2020. 1,568,000 (225,000) 1,343,000 316,000
College Revenue Bonds, Series of 2005,
original issue 1,860,000, interest rate
3.90%, final maturity April 2016. 213,000 (213,000) - -
College Revenue Bonds, Series of 2012,
original issue 9,995,000, interest rate
2.00%, final maturity April 2029. 9,985,000 (115,000) 9,870,000 140,000
12,931,000$ (993,000)$ 11,938,000$ 996,000$
Less: Current maturities (996,000)$
10,942,000$
Principal and interest requirements to maturity are as follows:
Year Ending
June 30 Principal Interest
Total
Debt Service
2017 996,000$ 373,156$ 1,369,156$
2018 1,039,000 333,449 1,372,449
2019 1,067,000 301,413 1,368,413
2020 1,101,000 272,188 1,373,188
2021 765,000 239,740 1,004,740
2022-2026 4,155,000 859,093 5,014,093
2027-2029 2,815,000 189,225 3,004,225
11,938,000$ 2,568,264$ 14,506,264$
Defeasance of debt During the year ended June 30, 2012, the college through the Redevelopment Authority of the County of Berks issued revenue bonds, Series of 2012 to provide resources to purchase securities that were placed in an irrevocable trust for the purpose of generating resources for future debt service payments of $9,080,000 plus interest costs on College Revenue Bonds, Series of 2003. As a result, the refunded portion of the bond is considered to be defeased and the liability has been removed from the balance sheet.

N 64
• Reading Regional Airport Authority
Notes
September 30,
2016
Revenue Note, Series A of 2008 - On November 20, 2008, the Authority issued the
Guaranteed Revenue Note, Series A of 2008 (AMT) in the amount $3,705,000. The
proceeds were used to currently refund the 2004A Bonds. The Note will mature on
April 1, 2026. The Note bears interest at fixed rate of 2.80% through October 1,
2021. Thereafter, the interest rate shall be adjusted from time to time to equal the 1-
Month London Interbank Offered Rate, plus 150 basis points. However, the
maximum interest rate on the Note shall never exceed 4.50% per annum. Principal
and interest are payable semi-annually. The Authority had made prepayments in the
amount of $1,855,000, which satisfied principal payments through October 2018. 1,850,000$
Revenue Note, Series B of 2008 - On November 20, 2008, the Authority issued the
Guaranteed Revenue Note, Series B of 2008 (non-AMT) in the amount $3,850,000.
The proceeds were used to currently refund the 2004B Bonds. The Note will mature
on October 1, 2033. The Note bears interest at fixed rate of 2.80% through October
2021. Thereafter, the interest rate shall be adjusted from time to time to equal the 1-
Month London Interbank Offered Rate, plus 150 basis points. However, the
maximum interest rate on the Note shall never exceed 5.50% per annum. Principal
and interest are payable semi-annually. The Authority had made prepayments in the
amount of $1,280,000, which satisfied principal payments through October 2025. 2,570,000
Total 4,420,000$
Less: Amount due within one year and classified as current -
4,420,000$
The County of Berks guaranteed the $3,705,000 and the $3,850,000 Revenue Notes, Series A of 2008 and Series B of 2008 issuances, respectively, of Reading Regional Airport Authority where the County of Berks guaranteed full and prompt payment of the debt service on the 2008 Revenue Notes when they become due and payable, pursuant to a guaranty agreement dated June 23, 2004, between the County of Berks and Reading Regional Airport Authority. In the event that Reading Regional Airport Authority is unable to make a payment, the County of Berks will be required to make that payment.

N 65
The following schedule summarizes long-term debt activity for the year:
Beginning
Balance Additions
Reductions/
Refunding
Ending
Balance
Amount
Due Within
One Year
Revenue Notes:
Seried A of 2008 1,850,000$ -$ -$ 1,850,000$ -$
Series B of 2008 2,570,000 - - 2,570,000 -
4,420,000$ -$ -$ 4,420,000$ -$
The following schedule summarizes debt service requirements to maturity. Interest for the variable portion of the notes is calculated at the interest rate in effect at year end:
Year ending
September 30 Principal Interest
Total Debt
service
2017 -$ 123,760$ 123,760$
2018 - 123,760 123,760
2019 140,000 123,760 263,760
2020 290,000 117,810 407,810
2021 295,000 109,690 404,690
2022-2026 1,235,000 439,950 1,674,950
2027-2031 1,535,000 252,420 1,787,420
2032-2034 925,000 39,550 964,550
4,420,000$ 1,330,700$ 5,750,700$
Revenue Notes, Series A and B of 2008
B. Lines of Credit
• Reading Regional Airport Authority
In August 2015, the Authority obtained a revolving line of credit available with a local financial institution. The line of credit has a maximum borrowing limit of $1,000,000 and an interest rate at the Wall Street Journal prime rate. Interest only payments are due monthly with principal due on April 30, 2017. There was no balance on the line of credit at September 30, 2016.
• Reading Area Community College
As of June 30, 2016, the College has an unsecured bank line of credit of $5,000,000. The maximum borrowings will be reduced to $2,500,000 from July 1, 2016 to December 31, 2016. The line requires monthly interest payments at the rate of the Wall Street Journal prime rate minus 0.50 percent and expires on February 28, 2017. There was no outstanding balance on this line of credit at June 30, 2016.

N 66
C. Long-term liabilities
• Reading Area Community College
Loans payable to Pennsylvania State Public School Building Authority:
Balance
outstanding
June 30,
2016
On October 31, 2012, the College entered into an agreement to borrow up
to $1,1000,000 to finance the Campus Wide Building Emergency Audio
Mass Notification System and an Energy Conservation Lighting Initiative.
The agreement requires semiannual payments of $115,848, including
interest at 2.00% per annum. Final payment is due in June 2017. The
College has pledged its full faith and credit for the repayment of the loan. 327,874$
On March 15, 2014, the College entered into an agreement to borrow up to
$1,167,000 to finance the Energy Conservation Window Replacement and
Exterior Factor Insulation System Project to one building of the College.
The agreement requires semiannual payments of $123,017, including
interest at 2.00% per annum. Final payment is due in March 2019. The
College has pledged its full faith and credit for the repayment of the loan. 701,360
1,029,234
Portion payable within one year and classified as current (459,411)
Total long term debt 569,823$
The following schedule summarizes the principal and interest maturities for the years ended June 30:
Principal Interest
2017 459,411$ 18,576$
2018 339,462 9,221
2019 230,361 3,410
1,029,234$ 31,207$
Accrued compensated absences for the year ending June 30, 2016 was $769,279, with $380,295 due within one year.

N 67
NOTE 11: FUND BALANCE POLICY A. Primary government
Governmental funds report fund balance in classifications prescribed by GASB 54 primarily based on the extent to which the County is required to use resources in accordance with specific purposes. The classifications created by GASB 54 and used by the County are as follows, with specific County information included herein:
Nonspendable – This classification consists of amounts that cannot be spent because they are either not in spendable form or are legally required to be maintained intact. The County is obligated to restore operating deficits or receive prior amounts paid for this classification. Restricted – This classification consists of amounts that are restricted to specific purposes either by (1) external groups such as creditors, grantors, contributors or laws and regulations of other governments, or (2) law through constitutional provisions or enabling legislation. The restriction is binding unless removed with the consent of the resource provider. Committed - This classification consists of amounts used for specific purposes imposed by formal action of the County’s highest level of decision-making authority, the Board of Commissioners. The commitment is binding unless removed in the same manner imposed. Formal action must occur prior to year-end; however, the amount may be determined subsequent to year end. The County has not formally adopted a policy as to the formal action required to be taken to establish, modify, or rescind a fund balance commitment. Assigned – This classification consists of amounts constrained by the County’s intent to be used for specific purposes that are neither restricted nor committed. The County has not formally adopted a policy regarding the body or official authorized to assign amounts to a specific purpose and the policy established by the governing body pursuant to which that authorization is given.
Unassigned – This classification consists of amounts that have not been assigned to other funds and that have not been restricted, committed, or assigned to specific purposes within the General Fund. The General Fund should be the only fund that reports a positive unassigned fund balance.
When more than one classification of fund balance is available for a particular purpose, the County’s spending policy is to apply disbursements of fund balance in this classification order: restricted, committed, assigned, and unassigned fund balance. Disbursements are approved by the Board of Commissioners at the weekly meeting, by inclusion in the annual budget and amendments thereto.
Compliance with provisions of this policy is reviewed as a part of the annual budget adoption process, and the amounts of nonspendable, restricted, committed, assigned and the minimum level of assigned fund balance is determined during this process.
The County has not formally adopted a minimum fund balance policy.
Fund balances of the County’s governmental funds at December 31, 2016 consist of the following:

N 68
General Children and Health Total
Fund Youth Services Choices Nonmajor Governmental
Nonspendable:
Employee pay advance 54,328$ 4,560$ -$ 4,401$ 63,289$
Inventories and prepaid expenses 1,587,515 - - 2,827,917 4,415,432
Total Nonspendable 1,641,843 4,560 - 2,832,318 4,478,721
Restricted:
Gift fund - 14,867 - - 14,867
Hazmat response 1,499,667 - - - 1,499,667
Act 198 - Courts 344,740 - - - 344,740
Workers' compensation 287,514 - - - 287,514
Special revenue funds - 16,324 - 13,873,016 13,889,340
Act 13 Marcellus Shale 727,468 - - - 727,468
Total Restricted 2,859,389 31,191 - 13,873,016 16,763,596
Committed:
Farmland preservation 1,055,553 - - - 1,055,553
Services Center Parking Garage 270,628 - - - 270,628
222 Corridor 5,000,000 - - - 5,000,000
Waste Water Treatment Plant 1,000,993 - - - 1,000,993
Total Committed 7,327,174 - - - 7,327,174
Assigned:
Environmental litigation 69,660 - - - 69,660
Divorce Masters 12,877 - - - 12,877
Health care self insurance 4,000,000 - - - 4,000,000
Total Assigned 4,082,537 - - - 4,082,537
Unassigned 118,930,211 - - - 118,930,211
Total Governmental Funds Fund Balance 134,841,154$ 35,751$ -$ 16,705,334$ 151,582,239$
The County’s Board of Commissioners hereby establish the following fund balance reserves in the classification and amounts shown in the above table:
• Employee pay advance – this reservation represents long-term receivable from employees resulting from a change in payroll records. The receivable is not available to meet current expenditures.
• Inventories and prepaid expenses – this reservation represents recorded assets for inventories and prepaid expenses. These items are not available to meet current expenditures.
• Gift fund – this restriction represents donations to be used for program purposes.
• Hazmat response – this restriction represents fees and other charges to be used to fund the cleanup of hazardous materials incidents in the General Fund.
• Act 198 – Courts – this restriction represents fines and costs collected by the Clerk of Courts from defendants in Drug & Alcohol court cases, and can only be spent on drug and alcohol prevention programs in the General Fund.
• Workers compensation – this restriction represents funds restricted to pay future workers’ compensation claims in the General Fund.
• Special revenue funds – this restriction represents amounts restricted by law or external parties to fund the operations of certain special revenue funds.

N 69
• Act 13 Marcellus Shale Money – this restriction represents amounts restricted to fund improvements to the County’s park system.
• Farmland preservation – this commitment represents funds raised to purchase farmland as part of the agricultural preservation program in the General Fund.
• Services Center Parking Garage – this commitment represents amounts restricted to fund any necessary repairs to the Services Center Parking Garage.
• 222 Corridor – this commitment represents future expenditures in the 222 Corridor project in the General Fund.
• Waste Water Treatment Plant – this commitment represents the funds assigned to the Waste Water Treatment Plant.
• Environmental Litigation – this assignment represents possible environmental litigation costs by the County in the General Fund.
• Divorce Masters – this assignment represents a commitment to this program.
• Health care self-insurance – this assignment represents the estimated obligation in excess of stop loss insurance for the health care self-insurance program due within the 2016 year.
NOTE 12: OBLIGATIONS UNDER CAPITAL LEASES
A. Component units
1. Reading Area Community College
Following is a summary of property held under capital leases at June 30, 2016:
Computer equipment and copiers 25,212$
Less: Accumulated depreciation (6,182)
19,030$
The interest rates on the capitalized leases range from 3.75% to 6.29% and are imputed based on the lower of the College’s incremental borrowing rate at the inception of the lease or the lessor’s implicit rate of return. Minimum lease payments under capital leases as of June 30 are as follows:
2017 4,991$
2018 4,991
2019 4,992
2020 3,471
Less: amount representing interest (2,050)
Present value of lease payments 16,395$

N 70
NOTE 13: COMMITMENTS AND CONTINGENCIES
A. Primary government
Approximately 66% of the County’s employees are covered by collective bargaining agreements as of December 31, 2016. Two AFSCME unions and the Teamster union contract, which expired December 31, 2015, are still under negotiation. The Fraternal Order of Police contract expires December 31, 2020. The Pennsylvania Social Services Unit contract expires on December 31, 2017. Both the United Food & Commercial Workers and the Service Employees International Union contracts expire on December 31, 2019. A new union, the Deputy Sheriff’s Association, started in 2015 and contract negotiations are still ongoing.
The County leases building space for certain County and District Justice Offices. The County has also entered into an operating lease for equipment. These leases have expiration dates extending through 2021. Total expenses for all operating leases were $1,305,329 for the year ended December 31, 2016.
The following is a schedule of future minimum lease payments under the above operating leases:
2017 796,646$
2018 561,375
2019 92,415
2020 57,400
2021 106,200
Total 1,614,036$
The County participates in a number of grant programs funded, in whole or part, by federal, state and other sources. These programs are subject to program compliance audits by the grantors or their representatives. The audits of these programs for or including the fiscal year ended December 31, 2016 have not yet been conducted. Additionally, certain audits related to prior fiscal years have not been finalized. Accordingly, the County’s compliance with applicable grant requirements will be established at some future date. The amount, if any, of expenditures which may be disallowed by the granting agencies cannot be determined at this time, although the County expects such amounts, if any to be immaterial. The County is involved in various lawsuits arising in the ordinary course of its municipal activities. The County Solicitor and County management believe that the resolution of these actions is not expected to have an unfavorable outcome or have a materially adverse effect on the financial statements of the County. In addition, we have no knowledge of any unasserted claims and assessments (considered to be probable of assertion), that if asserted, would have a reasonable possibility of an unfavorable outcome.
B. Component units
1. Berks County Solid Waste Authority
The Authority has employment agreements with the Executive Director and the Recycling Center Operator through March 31, 2017 and July 31, 2017, respectively, which provides for specific wages, benefits (defined therein), and amendment and termination provisions. The

N 71
agreements may automatically be renewed for successive one-year terms thereafter absent notice of termination by either party. The Authority is a defendant in a lawsuit that has been referred to the Authority’s solicitor. While it is not feasible to determine the outcome of this matter, in the opinion of the Authority’s management, any total ultimate liability would not have a material effect on the Authority’s financial position.
2. Reading Regional Airport Authority
The Authority is exposed to various risks of loss related to torts; theft of, damage to and destruction of assets; errors and omissions; injuries to employees; and natural disasters. Significant losses are covered by commercial insurance for all major programs. There were no significant reductions in insurance coverage from the 2015/2016 year. Settlement amounts have not exceeded insurance coverage for the current year or three prior years. Amounts received or receivable from grantor agencies are subject to audit and adjustment by grantor agencies, principally the federal government. Any disallowed claims, including amounts already collected, may constitute a liability of the applicable funds. This amount, if any, of expenditures which may be disallowed by the grantor cannot be determined at this time although the Authority expects such amounts, if any, to be immaterial.
3. Reading Area Community College
Federal and State revenues
Revenues reflected by the College from federal and state government organizations are subject to audit and verification by the applicable organization. Any disallowed claims, including amounts already collected, may constitute a liability of applicable funds. The amount, if any, of expenditures which may be disallowed or claims that may be disallowed cannot be determined by the College at this time, although the College expects such amount, if any, to be immaterial. Operating lease commitments The College has entered into several lease agreements for the rental of classroom space, parking space, and certain equipment. Rent expense for the year ended June 30, 2016 approximated $971,000. Minimum future rental payments under noncancelable operating leases are as follows:
2017 968,630$
2018 245,630
2019 94,034
2020 8,071
Total 1,316,365$
N 72
NOTE 14: CONTRACTUAL AGREEMENT REVENUE
Component unit
Berks County Solid Waste Authority
On April 20, 2000, the Authority entered into an agreement with Allied Waste Industries, Inc., Browning-Ferris, Inc., New Morgan Landfill Company and all of their affiliated companies and representatives and agents (collectively “BFI”.) The agreement states that in return for BFI’s consideration of $100,000 annually, the Authority shall not contest, challenge, reverse, terminate, affect or undo either the Eco Industrial Park or the reconfiguration of the boundaries of the Conestoga Landfill or the definition of the Facility Site in the Disposal Service Agreement as amended as the reconfiguration boundaries are described in the Authority’s February 16, 1999 Resolution and in the amended Disposal Service Agreement of October 12, 1989. The annual payments will cease upon the permanent cessation of receipt of waste at the landfill. On January 24, 2008, the Authority entered into an agreement with the County of Berks in which the Authority will administer the county-wide drop-off recycling and rural recycling programs. As per the agreement, the County paid the Authority $185,000 for the 2016 year. In the event that neither party terminates this agreement, the agreement shall automatically renew each year on January 1. The Authority’s ability to generate revenue from administrative fees or other surcharges related to “flow controlled” delivery of trash is severely limited. Sufficient revenue for Authority debt service and operating expenses may be available in the form of host fees payable to the County and specifically earmarked for payment of debt service under the terms of a Stipulation of Settlement entered into by the County, the Authority, and Browning-Ferris, Inc. The County has abided by its obligation to provide sufficient host fees for payment of the Authority’s debt service. During 2016, the Authority received $988,406 in host fees from the County.
Reading Area Community College
The College entered into a contract with Follett Higher Education Group, Inc., effective November 2007, for a period of five years to operate the College’s bookstore. Effective November 2012, the contract was renewed for an additional five years with certain amendments. Terms of the contract require Follett to pay the College 9 percent of sales up to $2,500,000, 11 percent of sales from $2,500,000 to $5,000,000 and 13 percent of sales over $5,000,000. In addition, the amended contract stated that Follett will renovate and move the bookstore facility for a cost up to $525,000. The actual total cost of renovations was $435,506. Per the agreement, any early termination of the contract before the five years have been reached will result in the College paying Follett the book value of the renovations put in service by Follett depreciated over the contract life. The College recognized the building improvement for the renovations and is recognizing the contribution from Follett over the life of the contract. Unearned revenue from the renovations is $116,135 as of June 30, 2016. Total revenues from this agreement, including the amortization of the bookstore renovations, were $314,139 for the year ended June 30, 2016.
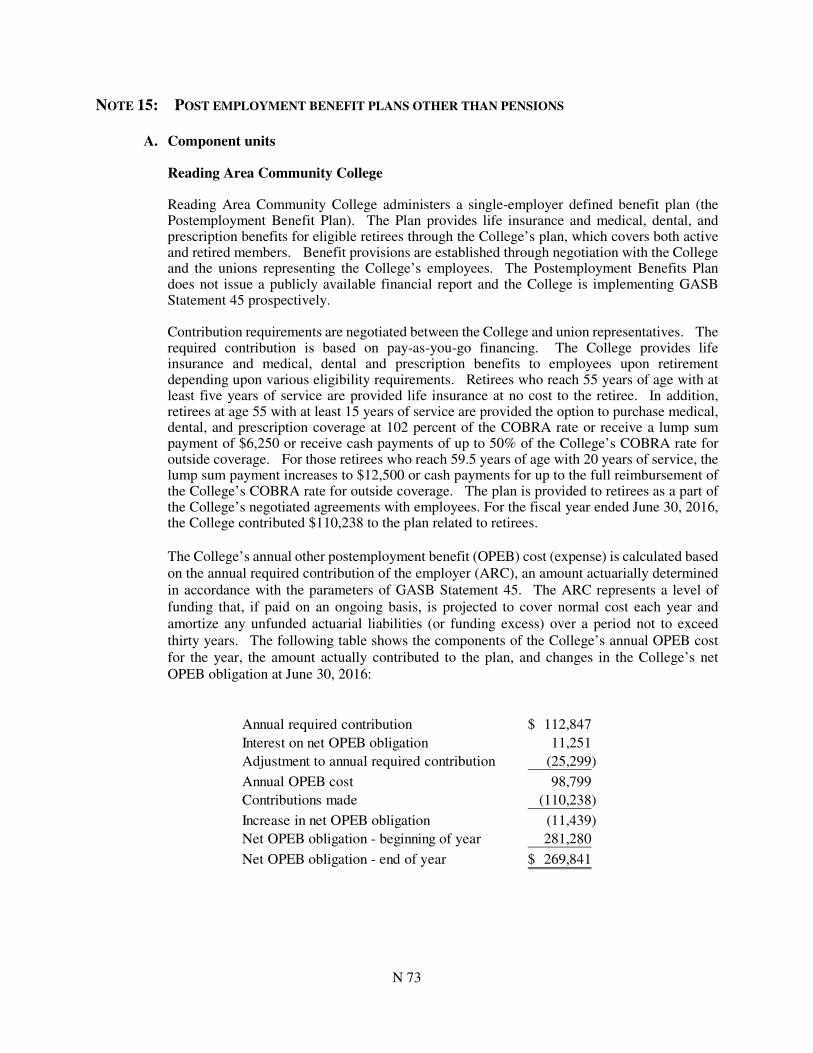
N 73
NOTE 15: POST EMPLOYMENT BENEFIT PLANS OTHER THAN PENSIONS
A. Component units
Reading Area Community College
Reading Area Community College administers a single-employer defined benefit plan (the Postemployment Benefit Plan). The Plan provides life insurance and medical, dental, and prescription benefits for eligible retirees through the College’s plan, which covers both active and retired members. Benefit provisions are established through negotiation with the College and the unions representing the College’s employees. The Postemployment Benefits Plan does not issue a publicly available financial report and the College is implementing GASB Statement 45 prospectively. Contribution requirements are negotiated between the College and union representatives. The required contribution is based on pay-as-you-go financing. The College provides life insurance and medical, dental and prescription benefits to employees upon retirement depending upon various eligibility requirements. Retirees who reach 55 years of age with at least five years of service are provided life insurance at no cost to the retiree. In addition, retirees at age 55 with at least 15 years of service are provided the option to purchase medical, dental, and prescription coverage at 102 percent of the COBRA rate or receive a lump sum payment of $6,250 or receive cash payments of up to 50% of the College’s COBRA rate for outside coverage. For those retirees who reach 59.5 years of age with 20 years of service, the lump sum payment increases to $12,500 or cash payments for up to the full reimbursement of the College’s COBRA rate for outside coverage. The plan is provided to retirees as a part of the College’s negotiated agreements with employees. For the fiscal year ended June 30, 2016, the College contributed $110,238 to the plan related to retirees. The College’s annual other postemployment benefit (OPEB) cost (expense) is calculated based on the annual required contribution of the employer (ARC), an amount actuarially determined in accordance with the parameters of GASB Statement 45. The ARC represents a level of funding that, if paid on an ongoing basis, is projected to cover normal cost each year and amortize any unfunded actuarial liabilities (or funding excess) over a period not to exceed thirty years. The following table shows the components of the College’s annual OPEB cost for the year, the amount actually contributed to the plan, and changes in the College’s net OPEB obligation at June 30, 2016:
Annual required contribution 112,847$
Interest on net OPEB obligation 11,251
Adjustment to annual required contribution (25,299)
Annual OPEB cost 98,799
Contributions made (110,238)
Increase in net OPEB obligation (11,439)
Net OPEB obligation - beginning of year 281,280
Net OPEB obligation - end of year 269,841$

N 74
The College’s annual OPEB cost, the percentage of annual OPEB cost contributed to the plan, and the net OPEB obligation as of June 30, 2016 was as follows:
Percentage
Fiscal of Annual
Year Annual OPEB Cost Net OPEB
Ended OPEB Cost Contributed Obligation
6/30/2016 98,799$ 111.6% 269,841$
6/30/2015 89,766 57.9% 281,280
6/30/2014 90,570 50.2% 243,452 As of July 1, 2015, the most recent actuarial valuation date, the plan was unfunded. The actuarial accrued liability for benefits was $952,515, and the actuarial value of assets was $0, resulting in an unfunded actuarial accrued liability (UAAL) of $952,515. The covered payroll (annual payroll of active employees covered under the plan) was $16,809,025, and the ratio of the UAAL to covered payroll was 5.67%. Actuarial valuations of an ongoing plan involve estimates of the value of reported amounts and assumptions about the probability of occurrence of events far into the future. Examples include assumptions about future employment, mortality, and the healthcare cost trend. Amounts determined regarding the funded status of the Plan and the annual required contributions of the employer are subject to continual revision as actual results are compared with past expectations and new estimates are made about the future. Projections of benefits for financial reporting purposes are based on the substantive plan (the plan as understood by the employer and the plan members) and include the types of benefits provided at the time of each valuation and the historical pattern of sharing of benefit costs between the employer and the plan members to that point. The actuarial methods and assumptions used include techniques that are designed to reduce the effects of short-term volatility in actuarial accrued liabilities and the actuarial value of assets, consistent with the long-term perspective of the calculations. In the July 1, 2015 actuarial valuation, the projected unit credit method was used. The actuarial assumptions included a 4.00% discount rate and 2.75% rate of inflation. The annual healthcare cost trend rate of 7.0% initially, decreasing 0.25% per year to an ultimate rate of 4.5% in 2023 and later. The unfunded actuarial accrued liability is being amortized at the end of the year based on level dollar and a 30-year open amortization period.

N 75
NOTE 16: SUBSEQUENT EVENTS
A. Primary government
The County has evaluated subsequent events through June 30, 2017. This date is the date that the financial statements were available to be issued. No material events subsequent to December 31, 2016 were noted as a result of this evaluation.
B. Component unit
• Reading Area Community College
Subsequent to the year ended June 30, 2016, the College Revenue Notes Series of 2016 was issued by a Pennsylvania Municipal Authority on behalf of the College in the proposed aggregate principal amount of $4,090,000. The Notes consisted of the Series A of 2016 in the amount of $3,350,000 and Series B in the amount of $740,000. The Revenue Note Series A will mature on October 15, 2036 with interest at 2.30 percent through October 15, 2026 and interest at 65 percent of the sum of 30 day LIBOR plus 200 basis points through maturity. The Revenue Note Series B will mature October 15, 2021 with interest fixed at 2.05 percent. The notes were issued to finance the renovations to and equipping of the College’s Science Laboratory facilities on the College’s main campus.

REQUIRED SUPPLEMENTAL INFORMATION
The Required Supplemental Information represents prescribed financial infor-
mation that addresses retirement fund data and budgetary comparisons for the
general fund and major individual special revenue funds.

Schedule of Revenues, Expenditures and Changes in Fund Balances County of BerksGeneral Fund - Budget and Actual 2016 Comprehensive Annual Financial ReportYear ended December 31, 2016
Original Final Variance with
budget budget Actual final budget
positive
(negative)
Revenues
Property taxes 136,178,473$ $ 136,178,473 $ 136,924,879 746,406$ Court costs, fines and forfeitures 3,610,547 3,610,547 3,021,575 (588,972) Investment earnings 1,378,439 1,378,439 1,275,006 (103,433) Intergovernmental revenue 13,986,171 14,394,070 13,273,887 (1,120,183) Departmental charges and reimbursements 53,017,897 53,022,953 53,119,775 96,822 Payments in lieu of taxes 262,788 262,788 237,561 (25,227) Rentals 452,862 452,862 400,736 (52,126) Sale of property, supplies and equipment 18,000 18,000 86,776 68,776
Miscellaneous 2,626,716 2,628,057 7,491,100 4,863,043
Total revenues 211,531,893 211,946,189 215,831,295 3,885,106
Expenditures
General government, administrative: Commissioners 1,830,945 1,860,409 1,516,094 344,315 Solicitors 1,308,716 1,671,608 1,714,658 (43,050) Facilities 13,471,625 14,157,858 11,808,722 2,349,136 Courthouse Security 1,408,868 1,399,112 1,338,514 60,598 Election Services 1,839,648 1,859,462 1,868,396 (8,934) Real Estate Assessment 3,718,268 3,742,693 2,520,339 1,222,354 Treasurer 816,384 835,028 827,728 7,300 Tax Collectors 450,985 452,330 459,765 (7,435) Tax Claim Bureau 924,588 965,597 756,006 209,591 Controller 2,155,336 2,196,978 2,181,354 15,624 Recorder of Deeds 1,152,279 1,172,393 1,129,123 43,270 Mailroom/Printing 497,473 524,585 518,742 5,843 Information Systems 8,915,310 7,947,160 6,328,371 1,618,789 Purchasing 704,650 716,486 645,047 71,439 Archives 274,608 278,045 277,521 524 Budget 1,227,307 1,353,670 1,364,998 (11,328) Human Resources 3,209,973 3,072,595 3,279,667 (207,072) Insurance 2,292,571 2,292,571 1,500,320 792,251 Telecommunications 254,033 251,519 205,146 46,373
Veterans Affairs 636,017 650,270 607,739 42,531
Total general government, administrative 47,089,584 47,400,369 40,848,250 6,552,119
General government, judicial:
Register of Wills 1,031,610 1,045,874 1,041,971 3,903 Sheriff 9,228,620 9,432,051 9,620,463 (188,412) Coroner 1,451,605 1,454,780 1,466,606 (11,826) Prothonotary 2,433,780 2,534,805 2,445,334 89,471 Clerk of Courts 2,459,776 2,496,745 2,443,947 52,798 Public Defender 3,389,082 3,413,124 3,270,059 143,065 District Attorney 10,714,034 10,966,728 10,711,380 255,348 Law Library 599,732 604,183 595,996 8,187 Court Administration 8,659,971 8,912,628 8,863,456 49,172 District Justices 9,629,673 9,561,192 8,971,904 589,288
Court Reporters 2,340,010 2,354,032 2,444,818 (90,786)
Total general government, judicial 51,937,893 52,776,142 51,875,934 900,208
RSI 1

Schedule of Revenues, Expenditures and Changes in Fund Balances County of Berks
General Fund - Budget and Actual 2016 Comprehensive Annual Financial Report
Year ended December 31, 2016
Original Final Variance with
budget budget Actual final budget
positive
(negative)
Public Safety:
Adult Probation 7,515,354 7,751,420 7,746,045 5,375
Juvenile Probation 14,739,556 14,802,933 14,462,742 340,191
Prison 33,219,617 33,756,120 34,182,476 (426,356)
Community Corrections 1,958,455 2,123,759 2,763,670 (639,911)
Department of Emergency Services 1,813,098 2,044,775 1,816,848 227,927
Total public safety 59,246,080 60,479,007 60,971,781 (492,774)
Culture and Recreation:
Berks County Public Libraries 3,759,764 3,826,943 3,789,040 37,903
Parks 5,251,441 5,688,270 4,916,053 772,217
Total culture and recreation 9,011,205 9,515,213 8,705,093 810,120
Community and Economic Development:
Planning 1,603,556 1,621,129 1,596,806 24,323
Agricultural Extension Service 541,924 541,944 542,485 (541)
Agland Preservation 1,365,023 1,481,399 1,462,817 18,582
Total community and economic development 3,510,503 3,644,472 3,602,108 42,364
Public Works:
Recycling 197,079 197,543 197,609 (66)
Community Support:
Contributions:
Community Bail Program 631,539 639,357 639,056 301
Berks Economic Partnership 500,000 700,000 700,000 -
Libraries 900,000 900,000 900,000 -
Miscellaneous Contributions 239,500 269,500 254,746 14,754
Berks Heim - 4,945,007 4,945,007 -
Reading Area Community College 3,100,000 3,100,000 3,100,000 -
Total community support 5,371,039 10,553,864 10,538,809 15,055
Contingency:
Contingency general 1,458,119 - - -
Debt Service:
Principal, interest and fiscal charges 38,810,892 23,836,594 24,002,864 (166,270)
Debt issuance costs - - 119,123 (119,123)
Administrative expenses 84,329 141,017 141,015 2
Total debt service 38,895,221 23,977,611 24,263,002 (285,391)
Intergovernmental:
Solid Waste debt service 928,497 928,497 928,453 44
Total expenditures for general fund 217,645,220 209,472,718 201,931,039 7,541,679
Excess (deficiency) of revenue over (under)
expenditures (6,113,327) 2,473,471 13,900,256 11,426,785
RSI 2

Schedule of Revenues, Expenditures and Changes in Fund Balances County of Berks
General Fund - Budget and Actual 2016 Comprehensive Annual Financial Report
Year ended December 31, 2016
Original Final Variance with
budget budget Actual final budget
positive
(negative)
Other financing sources (uses):
Issuance of refunding bonds - - 9,790,000 9,790,000
Premium on issuance of refunding bonds - - 209,950 209,950
Payment to refunded bonds escrow agent - (14,974,000) (24,943,412) (9,969,412)
Transfers in 3,405,293 3,752,816 3,715,526 (37,290)
Transfers out (13,567,759) (20,501,022) (19,115,035) 1,385,987
Total other financing sources (uses) (10,162,466) (31,722,206) (30,342,971) 1,379,235
Net change in fund balances (16,275,793) (29,248,735) (16,442,715) 12,806,020
Fund balances, beginning, as restated 151,283,869 151,283,869 151,283,869 -
Fund balances, ending 135,008,076$ 122,035,134$ 134,841,154$ 12,806,020$
RSI 3

Schedule of Revenues, Expenditures and Changes in Fund Balances County of Berks
Children and Youth Services Special Revenue Fund - Budget and Actual 2016 Comprehensive Annual Financial Report
Year ended December 31, 2016
Original Final Variance with
budget budget Actual final budget
positive
(negative)
Revenues
Intergovernmental revenue 37,545,347$ 37,544,054$ 35,843,586$ (1,700,468)$
Departmental charges and reimbursements 866,200 866,200 855,447 (10,753)
Investment earnings - - 8,668 8,668
Miscellaneous 6,444 6,444 1,445 (4,999)
Total revenues 38,417,991 38,416,698 36,709,146 (1,707,552)
Expenditures
Current:
Human services 44,939,712 44,925,155 44,092,453 832,702
Total expenditures 44,939,712 44,925,155 44,092,453 832,702
Deficiency of revenues under expenditures (6,521,721) (6,508,457) (7,383,307) (874,850)
Other financing sources (uses):
Transfers in 6,891,217 6,889,510 7,746,118 856,608
Transfers out (369,496) (381,053) (353,287) 27,766
Total other financing sources (uses) 6,521,721 6,508,457 7,392,831 884,374
Net change in fund balances - - 9,524 9,524
Fund balances, beginning, as restated 26,227 26,227 26,227 -
Fund balances, ending 26,227$ 26,227$ 35,751$ 9,524$
RSI 4

Schedule of Revenues, Expenditures and Changes in Fund Balances County of Berks
Health Choices Special Revenue Fund - Budget and Actual 2016 Comprehensive Annual Financial Report
Year ended December 31, 2016
Original Final Variance with
budget budget Actual final budget
positive
(negative)
Revenues
Intergovernmental revenue 91,600,000$ 104,832,236$ 102,809,008$ (2,023,228)$
Investment earnings 15,000 57,236 64,096 6,860
Total revenues 91,615,000 104,889,472 102,873,104 (2,016,368)
Expenditures
Current:
Human services 91,600,405 104,874,205 102,857,841 2,016,364
Total expenditures 91,600,405 104,874,205 102,857,841 2,016,364
Excess (deficiency) of revenue over (under)
expenditures14,595 15,267 15,263 (4)
Other financing uses:
Transfers out (14,595) (15,267) (15,263) 4
Total other financing uses (14,595) (15,267) (15,263) 4
Net change in fund balances - - - -
Fund balances, beginning - - - -
Fund balances, ending -$ -$ -$ -$
RSI 5

Note to Required Supplemental Information County of Berks
Year ended December 31, 2016 2016 Comprehensive Annual Financial Report
Note 1: Budgets and budgetary accounting
Annual budgets are adopted by the County on a basis consistent with accounting principlesgenerally accepted in the United States of America for all governmental fund types.
On or before June 30, all County departments and agencies submit requests forappropriations for the following year to the Office of Budget and Finance, which compiles therequests and submits a comprehensive budget request document. The Board ofCommissioners makes the proposed budget available for public inspection at least twentydays prior to the date of adoption. On or before December 31, the budget is adopted by theBoard of Commissioners. Subsequent to the budget approval, the Board of Commissionersadopts the appropriation measures required to put the budget into effect and fixes the rate oftaxation.
The County maintains budgetary control at the line item level of expenditures as authorizedby resolution of the Board of Commissioners. The Director of Budget and Finance maymake transfers between accounts under $5,000, while transfers of $5,000 or greater requirethe approval of the Board of Commissioners. Any supplemental appropriations to the Budgetare approved by the Board of Commissioners.
Encumbrance accounting is employed in governmental fund types. Encumbrances, whichrepresent commitments for goods and services not yet received, are reported as assignedfund balance, and do not constitute expenditures or liabilities, because the commitments willbe re-appropriated and honored during the subsequent year.
RSI 6

Schedule of Changes in the County's Net Pension Asset (Liability) and Related Ratios County of Berks
Berks County Employees' Retirement Fund 2016 Comprehensive Annual Financial Report
Last 10 Fiscal Years
2015 2014
2016 (Restated) (Restated)
Total pension liability
Service cost 10,623,914$ 10,332,061$ 10,035,976$
Interest 29,071,529 27,673,435 25,973,019
Differences between expected and actual
experience (501,667) 3,789,345 (3,642,225)
Benefit payments, including refunds of
employee contributions (19,382,776) (18,690,853) (16,016,484)
Net change in total pension liability 19,811,000 23,103,988 16,350,286
Total pension liability, beginning 390,323,162 367,219,174 350,868,888
Total pension liability, ending 410,134,162$ 390,323,162$ 367,219,174$
Plan fiduciary net position
Contributions-employer 2,088,776$ 1,408,537$ 233,518$
Contributions-member 6,500,174 6,256,829 6,074,679
Net investment income 29,291,596 (2,797,938) 23,044,386
Other additions - 5,708 27,002
Benefit payments, including refunds of
member contributions (19,382,777) (18,690,853) (16,016,484)
Administrative expense (71,068) (72,490) (63,898)
Net change in plan fiduciary net position 18,426,701 (13,890,207) 13,299,203 Plan fiduciary net position, beginning 399,123,328 413,013,535 399,714,332
Plan fiduciary net position, ending 417,550,029$ 399,123,328$ 413,013,535$
County of Berks' net pension (liability) asset 7,415,867$ 8,800,166$ 45,794,361$
Plan fiduciary net position as a percentage
of total pension (liability) asset 101.81% 102.25% 112.47%
Covered-employee payroll 104,729,710$ 103,847,803$ 100,988,654$
County of Berks' net pension (liability) asset as a
percentage of covered-employee payroll 7.1% 8.5% 45.3%
Note to Schedule:
This schedule is to present the requirement to show information for 10 years. However, until a full 10-year trend is
compiled, information for those years for which information is available is shown.
RSI 7

Schedule of County Contributions County of Berks
Berks County Employees' Retirement Fund 2016 Comprehensive Annual Financial Report
Last 10 Fiscal Years
2016 2015 2014 2013 2012 2011 2010 2009 2008 2007
Actuarially determined contributions 2,088,776$ 1,408,537$ 233,518$ 2,665,246$ 9,796,229$ 8,002,599$ 11,599,747$ 11,064,607$ 5,039,939$ 6,902,040$
Pension prefunding - - - - 63,144,061 - - - - -
Contributions in relation to the actuarially
determined contribution 2,088,776 1,408,537 233,518 2,665,246 9,796,229 8,002,599 11,599,747 11,064,607 5,039,939 6,902,040
Contribution deficiency (excess) -$ -$ -$ -$ (63,144,061)$ -$ -$ -$ -$ -$
Covered-employee payroll 104,729,710$ 103,847,803$ 100,988,654$ 98,776,314$ 99,233,198$ 98,644,764$ 96,728,405$ 93,697,475$ 91,594,431$ 90,809,719$
Contributions as a percentage of covered-
employee payroll 1.99% 1.36% 0.23% 2.70% 9.87% 8.11% 11.99% 11.81% 5.50% 7.60%
Annual money-weighted rate of return,
net of investment expense 7.89% -0.51% 5.75%
Notes to Schedule:
Valuation date: January 1 of each year
Actuarially determined contributions rates are calculated as of January 1, one year prior to the end of the fiscal year in which contributions are reported.
Methods and assumptions used to determine contribution rates:
Actuarial cost method Entry age
Amortization method Level dollar
Remaining amortization period 15 years
Asset valuation method Market value
Inflation
Salary increase 3.5%, average, including inflation
Investment rate of return 7.5%, net of pension plan investment expense, including inflation
Retirement age Age 60 or 55 with 20 years' service
Mortality 1983 Group Annuity Mortality Tables for males and females with no projected improvement
Other information:
In 2012, the County prefunded the pension plan with cash and pension bonds.
Annual money-weighted rate of return, net of investment expense not computed before GASB 68 implemetation in 2014.
3.0%
RSI 8

OTHER SUPPLEMENTAL INFORMATION
Other Supplemental Information provides combining financial statements for
non-major governmental funds, plus budgetary comparisons for these non-major
funds, other Enterprise funds (business-type activities) and Agency funds.

OSI 1

Combining Balance Sheet County of Berks
Nonmajor Governmental Funds 2016 Comprehensive Annual Financial Report
December 31, 2016
Special Revenue
Liquid Domestic Employment & Office of
Fuels Relations Training Aging
Assets
Cash and cash equivalents 2,810,842$ 550$ 100$ 225$
Cash and cash equivalents, restricted - - - -
Investments 1,553,036 - - -
Taxes receivable - - - -
Accounts receivable 19,238 21,208 66,560 42,675
Accrued interest receivable - - - -
Due from other governments 3,852,928 1,562,193 524,151 123,828
Due from other funds - - 471,896 2,390,054
Prepaid expenses - - 20,315 -
Loans receivable - - - -
Investments, non-current 747,000 - - -
Total assets 8,983,044$ 1,583,951$ 1,083,022$ 2,556,782$
Liabilities
Accounts payable 794,681$ 5,801$ 261,785$ 640,157$
Accrued liabilities 2,586 334,547 63,381 135,623
Unearned revenue 3,458,754 - 9,380 1,731,774
Due to other funds 936,642 1,240,889 - -
Payable from restricted assets - - - -
Total liabilities 5,192,663 1,581,237 334,546 2,507,554
Deferred inflows of resources
Other unavailable - - - -
Total deferred inflows of resources - - - -
Fund balances
Nonspendable - 2,714 22,002 -
Restricted 3,790,381 - 726,474 49,228
Assigned - - - -
Unassigned - - - -
Total fund balances 3,790,381 2,714 748,476 49,228
Total liabilities, deferred inflows of
resources and fund balances 8,983,044$ 1,583,951$ 1,083,022$ 2,556,782$
OSI 2

Combining Balance Sheet County of Berks
Nonmajor Governmental Funds 2016 Comprehensive Annual Financial Report
December 31, 2016
Special Revenue
Mental Health/
Special Developmental Human Drug and
Legislation Disabilities Services Alcohol
Assets
Cash and cash equivalents -$ -$ -$ -$
Cash and cash equivalents, restricted 3,629,321 - - -
Investments - - - -
Taxes receivable 182,765 - - -
Accounts receivable 20,860 - - -
Accrued interest receivable - - - -
Due from other governments 303,039 414,468 533,249 1
Due from other funds - 1,461,843 676,196 -
Prepaid expenses - - - -
Loans receivable - - - -
Investments, non-current - - - -
Total assets 4,135,985$ 1,876,311$ 1,209,445$ 1$
Liabilities
Accounts payable 1,079,610$ 1,377,142$ 1,164,594$ -$
Accrued liabilities - 23,076 1,368 -
Unearned revenue - 471,925 21,257 -
Due to other funds 3,882 - - 1
Payable from restricted assets - - 4,451 -
Total liabilities 1,083,492 1,872,143 1,191,670 1
Deferred inflows of resources
Other unavailable - - - -
Total deferred inflows of resources - - - -
Fund balances
Nonspendable - - - -
Restricted 3,052,493 4,168 17,775 -
Assigned - - - -
Unassigned - - - -
Total fund balances 3,052,493 4,168 17,775 -
Total liabilities, deferred inflows of
resources and fund balances 4,135,985$ 1,876,311$ 1,209,445$ 1$
OSI 3

Combining Balance Sheet County of Berks
Nonmajor Governmental Funds 2016 Comprehensive Annual Financial Report
December 31, 2016
Special Revenue
Department of
Emergency Community Capital
Services Development Projects Total
Assets
Cash and cash equivalents 5,639,198$ -$ -$ 8,450,915$
Cash and cash equivalents, restricted 1,930 - 7,365,944 10,997,195
Investments - - - 1,553,036
Taxes receivable - - - 182,765
Accounts receivable 1,976,536 115,707 - 2,262,784
Accrued interest receivable - 1,043,861 - 1,043,861
Due from other governments 4,321 4,790 - 7,322,968
Due from other funds - - - 4,999,989
Prepaid expenses 2,807,602 - - 2,827,917
Loans receivable - 4,440,349 - 4,440,349
Investments, non-current - - - 747,000
Total assets 10,429,587$ 5,604,707$ 7,365,944$ 44,828,779$
Liabilities
Accounts payable 120,128$ 52,368$ 4,800,936$ 10,297,202$
Accrued liabilities 361,947 - 922,528
Unearned revenue - - - 5,693,090
Due to other funds 2,714,711 68,129 757,022 5,721,276
Payable from restricted assets - - - 4,451
Total liabilities 3,196,786 120,497 5,557,958 22,638,547
Deferred inflows of resources
Other unavailable 688 5,484,210 - 5,484,898
Total deferred inflows of resources 688 5,484,210 - 5,484,898
Fund balances
Nonspendable 2,807,602 - - 2,832,318
Restricted 4,424,511 - 1,807,986 13,873,016
Assigned - - - -
Unassigned - - - -
Total fund balances 7,232,113 - 1,807,986 16,705,334
Total liabilities, deferred inflows of
resources and fund balances 10,429,587$ 5,604,707$ 7,365,944$ 44,828,779$
OSI 4

Combining Statement of Revenues, Expenditures and Changes in Fund Balances County of Berks
Nonmajor Governmental Funds 2016 Comprehensive Annual Financial Report
Year ended December 31, 2016
Liquid Domestic Employment Office of
Fuels Relations & Training Aging
Revenues
Intergovernmental revenue 10,733,316$ 4,276,485$ 5,344,795$ 9,206,019$
Hotel tax - - - -
Departmental charges and reimbursements - 229,953 - 232,704
Investment earnings 36,867 - 3,171 12,208
Rental 11,100 - - -
Miscellaneous 1,178,078 - 182,019 2,417
Total revenues 11,959,361 4,506,438 5,529,985 9,453,348
Expenditures
Current:
General government, administrative - - - -
General government, judicial - - - -
Public safety - - - -
Human services - 6,240,437 5,156,254 9,354,175
Capital outlay - - - -
Community and economic development - - - -
Public works 11,496,345 - - -
Total expenditures 11,496,345 6,240,437 5,156,254 9,354,175
Excess (deficiency) of revenues over (under)
expenditures463,016 (1,733,999) 373,731 99,173
Other financing sources (uses)
Transfers in 18,000 1,875,532 - 403,158
Transfers out (2,611) (141,533) (44,146) (491,520)
Total other financing sources (uses) 15,389 1,733,999 (44,146) (88,362)
Net changes in fund balances 478,405 - 329,585 10,811
Fund balances, beginning, as restated 3,311,976 2,714 418,891 38,417
Fund balances, ending 3,790,381$ 2,714$ 748,476$ 49,228$
Special Revenue
OSI 5
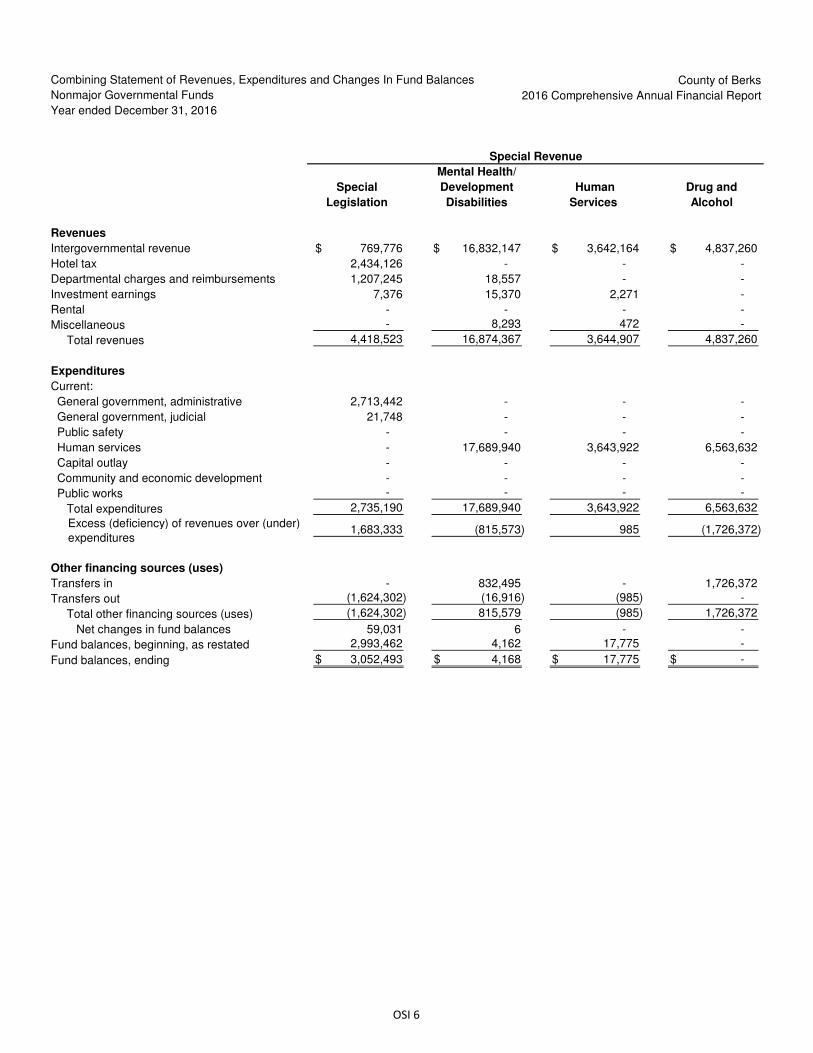
Combining Statement of Revenues, Expenditures and Changes In Fund Balances County of Berks
Nonmajor Governmental Funds 2016 Comprehensive Annual Financial Report
Year ended December 31, 2016
Special Revenue
Mental Health/
Special Development Human Drug and
Legislation Disabilities Services Alcohol
Revenues
Intergovernmental revenue 769,776$ 16,832,147$ 3,642,164$ 4,837,260$
Hotel tax 2,434,126 - - -
Departmental charges and reimbursements 1,207,245 18,557 - -
Investment earnings 7,376 15,370 2,271 -
Rental - - - -
Miscellaneous - 8,293 472 -
Total revenues 4,418,523 16,874,367 3,644,907 4,837,260
Expenditures
Current:
General government, administrative 2,713,442 - - -
General government, judicial 21,748 - - -
Public safety - - - -
Human services - 17,689,940 3,643,922 6,563,632
Capital outlay - - - -
Community and economic development - - - -
Public works - - - -
Total expenditures 2,735,190 17,689,940 3,643,922 6,563,632
Excess (deficiency) of revenues over (under)
expenditures1,683,333 (815,573) 985 (1,726,372)
Other financing sources (uses)
Transfers in - 832,495 - 1,726,372
Transfers out (1,624,302) (16,916) (985) -
Total other financing sources (uses) (1,624,302) 815,579 (985) 1,726,372
Net changes in fund balances 59,031 6 - -
Fund balances, beginning, as restated 2,993,462 4,162 17,775 -
Fund balances, ending 3,052,493$ 4,168$ 17,775$ -$
OSI 6

Combining Statement of Revenues, Expenditures and Changes In Fund Balances County of Berks
Nonmajor Governmental Funds 2016 Comprehensive Annual Financial Report
Year ended December 31, 2016
Special Revenue
Department of
Emergency Community Capital
Services Development Projects Total
Revenues
Intergovernmental revenue 4,321$ 2,718,740$ -$ 58,365,023$
Hotel tax - - - 2,434,126
Departmental charges and reimbursements 10,899,622 570,959 - 13,159,040
Investment earnings 10,871 1 38,120 126,255
Rental 53,114 - - 64,214
Miscellaneous 520,972 - - 1,892,251
Total revenues 11,488,900 3,289,700 38,120 76,040,909
Expenditures
Current:
General government, administrative - - - 2,713,442
General government, judicial - - - 21,748
Public Safety 11,331,715 - - 11,331,715
Human services - - - 48,648,360
Capital outlay - - 2,143,152 2,143,152
Community and economic development - 3,290,111 - 3,290,111
Public works - - - 11,496,345
Total expenditures 11,331,715 3,290,111 2,143,152 79,644,873
Excess (deficiency) of revenues over (under)
expenditures157,185 (411) (2,105,032) (3,603,964)
Other financing sources (uses)
Transfers in 6,759,580 - 41,936 11,657,073
Transfers out (239,144) - - (2,561,157)
Total other financing sources (uses) 6,520,436 - 41,936 9,095,916
Net changes in fund balances 6,677,621 (411) (2,063,096) 5,491,952
Fund balances, beginning, as restated 554,492 411 3,871,082 11,213,382
Fund balances, ending 7,232,113$ -$ 1,807,986$ 16,705,334$
OSI 7

Schedule of Revenues, Expenditures and Changes in Fund Balances County of Berks
Liquid Fuels Special Revenue Fund - Budget and Actual 2016 Comprehensive Annual Financial Report
Year ended December 31, 2016
Original Final Variance with
budget budget Actual final budget
positive
(negative)
Revenues
Intergovernmental revenue 17,220,695$ 20,231,066$ 10,733,316$ (9,497,750)$
Investment earnings 43,010 43,010 36,867 (6,143)
Rental 11,100 11,100 11,100 -
Miscellaneous 1,002,688 1,019,821 1,178,078 158,257
Total revenues 18,277,493 21,304,997 11,959,361 (9,345,636)
Expenditures
Current:
Public works 19,207,866 23,436,967 11,496,345 11,940,622
Total expenditures 19,207,866 23,436,967 11,496,345 11,940,622
Excess (deficiency) of revenues over (under)
expenditures (930,373) (2,131,970) 463,016 2,594,986
Other financing sources (uses):
Transfers in - 18,000 18,000 -
Transfers out (7,693) (7,693) (2,611) 5,082
Total other financing sources (uses) (7,693) 10,307 15,389 5,082
Net change in fund balances (938,066) (2,121,663) 478,405 2,600,068
Fund balances, beginning 3,311,976 3,311,976 3,311,976 -
Fund balances, ending 2,373,910$ 1,190,313$ 3,790,381$ 2,600,068$
OSI 8

Schedule of Revenues, Expenditures and Changes in Fund Balances County of Berks
Domestic Relations Special Revenue Fund - Budget and Actual 2016 Comprehensive Annual Financial Report
Year ended December 31, 2016
Original Final Variance with
budget budget Actual final budget
positive
(negative)
Revenues
Intergovernmental revenue 4,414,300$ 4,459,800$ 4,276,485$ (183,315)$
Departmental charges and reimbursements 360,000 360,000 229,953 (130,047)
Total revenues 4,774,300 4,819,800 4,506,438 (313,362)
Expenditures
Current:
Human services 6,392,242 6,437,742 6,240,437 197,305
Total expenditures 6,392,242 6,437,742 6,240,437 197,305
Deficiency of revenue under expenditures (1,617,942) (1,617,942) (1,733,999) (116,057)
Other financing sources (uses):
Transfers in 1,763,150 1,763,150 1,875,532 112,382
Transfers out (145,208) (145,208) (141,533) 3,675
Total other financing sources (uses) 1,617,942 1,617,942 1,733,999 116,057
Net change in fund balances - - - -
Fund balances, beginning 2,714 2,714 2,714 -
Fund balances, ending 2,714$ 2,714$ 2,714$ -$
OSI 9

Schedule of Revenues, Expenditures and Changes in Fund Balances County of Berks
Employment and Training Special Revenue Fund - Budget and Actual 2016 Comprehensive Annual Financial Report
Year ended December 31, 2016
Original Final Variance with
budget budget Actual final budget
positive
(negative)
Revenues
Intergovernmental revenue 4,738,017$ 5,764,785$ 5,344,795$ (419,990)$
Departmental charges and reimbursements - - - -
Investment earnings - - 3,171 3,171
Miscellaneous 193,963 200,088 182,019 (18,069)
Total revenues 4,931,980 5,964,873 5,529,985 (434,888)
Expenditures
Current:
Human services 4,885,381 5,932,887 5,156,254 776,633
Total expenditures 4,885,381 5,932,887 5,156,254 776,633
Excess of revenue over expenditures 46,599 31,986 373,731 341,745
Other financing uses:
Transfers out (46,599) (46,599) (44,146) 2,453
Total other financing uses (46,599) (46,599) (44,146) 2,453
Net change in fund balances - (14,613) 329,585 344,198
Fund balances, beginning, as restated 418,891 418,891 418,891 -
Fund balances, ending 418,891$ 404,278$ 748,476$ 344,198$
OSI 10

Schedule of Revenues, Expenditures and Changes in Fund Balances County of Berks
Office of Aging Special Revenue Fund - Budget and Actual 2016 Comprehensive Annual Financial Report
Year ended December 31, 2016
Original Final Variance with
budget budget Actual final budget
positive
(negative)
Revenues
Intergovernmental revenue 7,761,500$ 9,369,818$ 9,206,019$ (163,799)$
Departmental charges and reimbursements 248,177 248,177 232,704 (15,473)
Investment earnings 5,038 5,038 12,208 7,170
Miscellaneous 4,352 4,352 2,417 (1,935)
Total revenues 8,019,067 9,627,385 9,453,348 (174,037)
Expenditures
Current:
Human services 7,934,459 9,535,157 9,354,175 180,982
Total expenditures 7,934,459 9,535,157 9,354,175 180,982
Excess of revenue over expenditures 84,608 92,228 99,173 6,945
Other financing sources (uses):
Transfers in 507,805 403,159 403,158 (1)
Transfers out (592,413) (495,387) (491,520) 3,867
Total other financing sources (uses) (84,608) (92,228) (88,362) 3,866
Net change in fund balances - - 10,811 10,811
Fund balances, beginning 38,417 38,417 38,417 -
Fund balances, ending 38,417$ 38,417$ 49,228$ 10,811$
OSI 11

Schedule of Revenues, Expenditures and Changes in Fund Balances County of Berks
Special Legislation Special Revenue Fund - Budget and Actual 2016 Comprehensive Annual Financial Report
Year ended December 31, 2016
Original Final Variance with
budget budget Actual final budget
positive
(negative)
Revenues
Intergovernmental revenue 848,488$ 848,488$ 769,776$ (78,712)$
Hotel tax 2,174,102 2,174,102 2,434,126 260,024
Departmental charges and reimbursements 1,090,903 1,090,903 1,207,245 116,342
Investment earnings 2,983 2,983 7,376 4,393
Total revenues 4,116,476 4,116,476 4,418,523 302,047
Expenditures
Current:
General government, administrative 2,356,318 2,357,237 2,713,442 (356,205)
General government, judicial 30,000 30,000 21,748 8,252
Total expenditures 2,386,318 2,387,237 2,735,190 (347,953)
Excess (deficiency) of revenue over (under)
expenditures1,730,158 1,729,239 1,683,333 (45,906)
Other financing uses:
Transfers out (1,529,392) (1,634,835) (1,624,302) 10,533
Total other financing uses (1,529,392) (1,634,835) (1,624,302) 10,533
Net change in fund balances (deficits) 200,766 94,404 59,031 (35,373)
Fund balances, beginning 2,993,462 2,993,462 2,993,462 -
Fund balances, ending 3,194,228$ 3,087,866$ 3,052,493$ (35,373)$
OSI 12

Schedule of Revenues, Expenditures and Changes in Fund Balances County of Berks
Mental Health/Developmental Disabilities Special Revenue Fund - Budget and Actual 2016 Comprehensive Annual Financial Report
Year ended December 31, 2016
Original Final Variance with
budget budget Actual final budget
positive
(negative)
Revenues
Intergovernmental revenue 15,669,263$ 16,991,651$ 16,832,147$ (159,504)$
Departmental charges and reimbursements 36,623 36,723 18,557 (18,166)
Investment earnings 5,000 15,370 15,370 -
Miscellaneous 18,312 18,312 8,293 (10,019)
Total revenues 15,729,198 17,062,056 16,874,367 (187,689)
Expenditures
Current:
Human services 16,413,506 17,874,937 17,689,940 184,997
Total expenditures 16,413,506 17,874,937 17,689,940 184,997
Deficiency of revenue under expenditures (684,308) (812,881) (815,573) (2,692)
Other financing sources (uses):
Transfers in 702,467 832,638 832,495 (143)
Transfers out (18,159) (19,757) (16,916) 2,841
Total other financing sources (uses) 684,308 812,881 815,579 2,698
Net change in fund balances - - 6 6
Fund balances, beginning 4,162 4,162 4,162 -
Fund balances, ending 4,162$ 4,162$ 4,168$ 6$
OSI 13

Schedule of Revenues, Expenditures and Changes in Fund Balances County of Berks
Human Services Special Revenue Fund - Budget and Actual 2016 Comprehensive Annual Financial Report
Year ended December 31, 2016
Original Final Variance with
budget budget Actual final budget
positive
(negative)
Revenues
Intergovernmental revenue 2,766,272$ 3,645,251$ 3,642,164$ (3,087)$
Investment earnings 500 2,272 2,271 (1)
Miscellaneous - 472 472 -
Total revenues 2,766,772 3,647,995 3,644,907 (3,088)
Expenditures
Current:
Human services 2,766,206 3,646,997 3,643,922 3,075
Total expenditures 2,766,206 3,646,997 3,643,922 3,075
Excess (deficiency) of revenue over (under)
expenditures566 998 985 (13)
Other financing sources (uses):
Transfers out (566) (998) (985) 13
Total other financing sources (uses) (566) (998) (985) 13
Net change in fund balances - - - -
Fund balances, beginning 17,775 17,775 17,775 -
Fund balances, ending 17,775$ 17,775$ 17,775$ -$
OSI 14

Schedule of Revenues, Expenditures and Changes in Fund Balances County of Berks
Drug and Alcohol Special Revenue Fund - Budget and Actual 2016 Comprehensive Annual Financial Report
Year ended December 31, 2016
Original Final Variance with
budget budget Actual final budget
positive
(negative)
Revenue
Intergovernmental revenue 4,213,348$ 4,837,261$ 4,837,260$ (1)$
Total revenue 4,213,348 4,837,261 4,837,260 (1)
Expenditures
Current:
Human services 5,939,720 6,563,633 6,563,632 (1)
Total expenditures 5,939,720 6,563,633 6,563,632 (1)
Excess (deficiency) of revenue over (under)
expenditures (1,726,372) (1,726,372) (1,726,372) -
Other financing sources:
Transfers in 1,726,372 1,726,372 1,726,372 -
Total other financing sources 1,726,372 1,726,372 1,726,372 -
Net change in fund balances - - - -
Fund balances, beginning - - - -
Fund balances, ending -$ -$ -$ -$
OSI 15

Schedule of Revenues, Expenditures and Changes in Fund Balances County of Berks
Department of Emergency Services Special Revenue Fund - Budget and Actual 2016 Comprehensive Annual Financial Report
Year ended December 31, 2016
Original Final Variance with
budget budget Actual final budget
positive
(negative)
Revenues
Intergovernmental revenue -$ 4,322$ 4,321$ (1)$
Departmental charges and reimbursements 9,872,182 10,900,142 10,899,622 (520)
Investment earnings 8,241 10,871 10,871 -
Rental 60,000 60,000 53,114 (6,886)
Miscellaneous 521,252 521,252 520,972 (280)
Total revenues 10,461,675 11,496,587 11,488,900 (7,687)
Expenditures
Current:
Public safety 13,836,228 15,007,358 11,331,715 3,675,643
Total expenditures 13,836,228 15,007,358 11,331,715 3,675,643
Excess (deficiency) of revenues over (under)
expenditures (3,374,553) (3,510,771) 157,185 3,667,956
Other financing sources (uses):
Transfers in 2,384,553 9,167,033 6,759,580 (2,407,453)
Transfers out - (242,156) (239,144) 3,012
Total other financing sources (uses) 2,384,553 8,924,877 6,520,436 (2,404,441)
Net change in fund balances (990,000) 5,414,106 6,677,621 1,263,515
Fund balances, beginning 554,492 554,492 554,492 -
Fund balances, ending (435,508)$ 5,968,598$ 7,232,113$ 1,263,515$
OSI 16

Schedule of Revenues, Expenditures and Changes in Fund Balances County of Berks
Community Development Special Revenue Fund - Budget and Actual 2016 Comprehensive Annual Financial Report
Year ended December 31, 2016
Original Final Variance with
budget budget Actual final budget
positive
(negative)
Revenues
Intergovernmental revenue 3,587,051$ 3,587,051$ 2,718,740$ (868,311)$
Departmental charges and reimbursements 513,685 570,959 570,959 -
Investment earnings - - 1 1
Miscellaneous - - - -
Total revenues 4,100,736 4,158,010 3,289,700 (868,310)
Expenditures
Current:
Community and economic development 4,100,736 4,158,010 3,290,111 867,899
Total expenditures 4,100,736 4,158,010 3,290,111 867,899
Excess (deficiency) of revenue over (under)
expenditures - - (411) (411)
Fund balances, beginning 411 411 411 -
Fund balances, ending 411$ 411$ -$ (411)$
OSI 17

Schedule of Revenues, Expenditures and Changes in Fund Balances County of Berks
Capital Projects Special Revenue Fund - Budget and Actual 2016 Comprehensive Annual Financial Report
Year ended December 31, 2016
Original Final Variance with
budget budget Actual final budget
positive
(negative)
Revenues
Investment earnings -$ -$ 38,120$ 38,120$
Expenditures
Current:
Administrative expense - 110 - 110
Capital outlay 2,923,734 3,296,147 2,143,152 1,152,995
Total expenditures 2,923,734 3,296,257 2,143,152 1,153,105
Excess (deficiency) of revenue over (under)
expenditures(2,923,734) (3,296,257) (2,105,032) 1,191,225
Other financing sources:
Transfers in - - 41,936 41,936
Total other financing sources - - 41,936 41,936
Net change in fund balances (2,923,734) (3,296,257) (2,063,096) 1,233,161
Fund balances, beginning 3,871,082 3,871,082 3,871,082 -
Fund balances, ending 947,348$ 574,825$ 1,807,986$ 1,233,161$
OSI 18

Schedule of Revenues, Expenses and Changes in Net Position County of Berks
Berks County Residential Center Enterprise Fund - Budget and Actual 2016 Comprehensive Annual Financial Report
Year ended December 31, 2016
Original Final Variance with
budget budget Actual final budget
positive
(negative)
Operating revenues
Charges for services 6,671,747$ 6,679,377$ 6,569,647$ (109,730)$
Other operating revenues 1,934,860 2,427,404 2,266,535 (160,869)
Total operating revenues 8,606,607 9,106,781 8,836,182 (270,599)
Operating expenses
Shelter care - Immigration and naturalizations 7,194,613 7,668,988 7,378,331 290,657
Depreciation 275,361 275,361 360,298 (84,937)
Total operating expenses 7,469,974 7,944,349 7,738,629 205,720
Operating income (loss) 1,136,633 1,162,432 1,097,553 (64,879)
Nonoperating revenues (expenses)
Change in fair value of interest rate swaps - - (11,701) (11,701)
Interest expense (138,914) (138,914) (138,809) 105
Total nonoperating revenues (expenses) (138,914) (138,914) (150,510) (11,596)
Income before transfers 997,719 1,023,518 947,043 (76,475)
Transfers in - - 1,220,957 1,220,957
Transfers out (1,088,977) (1,088,977) (1,088,977) -
Change in net position (91,258) (65,459) 1,079,023 1,144,482
Total net position, beginning, as restated 5,740,270 5,740,270 5,740,270 -
Total net position, ending 5,649,012$ 5,674,811$ 6,819,293$ 1,144,482$
Note: Capital outlay Original and Final budget was $0 and $25,799, respectively.
OSI 19

Schedule of Revenues, Expenses and Changes in Net Position County of Berks
Berks Heim Enterprise Fund - Budget and Actual 2016 Comprehensive Annual Financial Report
Year ended December 31, 2016
Original Final Variance with
budget budget Actual final budget
positive
(negative)
Operating revenues
Charges for services 38,884,022$ 39,204,022$ 38,757,649$ (446,373)$
Other operating revenues 3,790,262 3,634,676 9,138,980 5,504,304
Total operating revenues 42,674,284 42,838,698 47,896,629 5,057,931
Operating expenses
Financial administration 3,084,736 3,082,961 2,974,441 108,520
Administrative expenses 1,946,480 1,955,394 3,235,239 (1,279,845)
Special services 176,459 176,429 160,370 16,059
Dietary 3,780,710 3,781,260 3,559,554 221,706
Laundry 701,742 710,274 680,902 29,372
Environmental services 2,002,274 2,010,788 1,923,284 87,504
Plant operations 1,390,010 1,402,461 1,419,855 (17,394)
Nursing 19,486,416 19,579,254 19,799,480 (220,226)
Physician services 77,509 78,134 75,714 2,420
Pharmacy services 765,000 765,000 678,849 86,151
Medical services 289,575 289,660 273,429 16,231
Therapeutic activity 524,442 524,442 468,052 56,390
Social service 286,708 286,843 267,747 19,096
Physical therapy service 1,882,478 1,877,478 1,659,385 218,093
Staff development 362,633 362,633 411,858 (49,225)
Materials management 231,171 245,558 254,075 (8,517)
Personnel 128,314 129,089 127,827 1,262
Security 253,233 253,658 241,104 12,554
Volunteers 72,942 73,192 72,318 874
Nursing administration 1,547,582 1,555,347 1,481,368 73,979
Admissions 214,882 214,882 196,699 18,183
Depreciation 923,466 923,466 1,076,797 (153,331)
Total operating expenses 40,128,762 40,278,203 41,038,347 (760,144)
Operating income 2,545,522 2,560,495 6,858,282 4,297,787
Nonoperating revenues (expenses)
Grants - - 8,587 8,587
Investment earnings 1,160 1,160 1,986 826
Change in fair value of interest rate swaps - - (67,028) (67,028)
Interest expense (878,158) (878,158) (877,859) 299
Contribution to General Fund - (4,950,000) (4,945,007) 4,993
Total nonoperating revenues (expenses) (876,998) (5,826,998) (5,879,321) (52,323)
Income before transfers 1,668,524 (3,266,503) 978,961 4,245,464
Transfers in - 15,000 15,000 -
Change in net position 1,668,524 (3,251,503) 993,961 4,245,464
Total net position, beginning, as restated 6,351,788 6,351,788 6,351,788 -
Total net position, ending 8,020,312$ 3,100,285$ 7,345,749$ 4,245,464$
Note: Capital outlay Original and Final budget was $180,300 and $210,965, respectively.
OSI 20

Statement of Changes in Net Position County of Berks
Agency Fund 2016 Comprehensive Annual Financial Report
Year ended December 31, 2016
Balance Additions Reductions Balance
January 1, Increase (Decrease) December 31,
2016 (Decrease) Increase 2016
Assets
Cash, cash equivalents, and investments 12,557,651$ (1) 123,545,057$ (123,811,540)$ 12,291,168$
Total assets 12,557,651$ 123,545,057$ (123,811,540)$ 12,291,168$
Liabilities
Due to third parties by department:
Prothonotary 1,707,973$ (4,270,504)$ 4,139,402$ 1,576,871$
Register of Wills 143,438 (1,630,464) 1,651,143 164,117
Berks Heim 227,315 (199,742) 228,589 256,162
District Attorney 4,089,800 (1) (1,734,192) 1,561,532 3,917,140
Sheriff 2,139,147 (31,437,844) 31,377,320 2,078,623
Clerk of Courts 1,837,163 (7,391,542) 7,627,673 2,073,294
Juvenile Probation 2,821 (50,430) 50,140 2,531
Recorder of Deeds 1,728,165 (40,416,823) 40,386,328 1,697,670
Berks County Residential Center 6,859 (52,055) 55,238 10,042
Domestic Relations 92,512 (1,974,593) 1,915,879 33,798
Prison 77,264 (2,043,809) 2,046,850 80,305
Controller 69,417 (483,779) 502,076 87,714
Treasurer 435,777 (32,125,766) 32,002,890 312,901
Total liabilities 12,557,651$ (123,811,543)$ 123,545,060$ 12,291,168$
(1) Amount changed to properly recognize 2 certificates of deposit not discovered during prior years.
OSI 21

OSI 22

County of Berks, Pennsylvania
Comprehensive
Annual Financial
Report Statistical
Information for
the Year Ending
December 31, 2016

County of BerksStatistical Section - Categories
Year Ended December 31, 2016
This section presents trend, contextual and detail information to help readers evaluate the financial information presented in the proceeding sections. This information is presented in the following six categories:
Financial Trends
Financial trends information is intended to help readers understand and assess how the County of Berks' financial position has changed over time.
Revenue Capacity
Revenue capacity information is intended to assist readers better understand and assess the factors affecting the County of Berks' ability to generate its own revenue, most notably the real estate property tax.
Debt Capacity
Debt capacity information is intended to assist readers better understand and assess the County of Berks' debt burden and its ability to issue additional debt.
Demographic and Economic Information
Demographic and economic information is intended to help readers better understand the socioeconomic environment in which the County of Berks' operates.
Operating Information
Operating information is intended to provide readers with information for evaluating the County of Berks' financial statement information as it relates to the services the County of Berks provides and activities it performs.
Miscellaneous Statistics
Miscellaneous statistics is intended to help readers better understand the demographics in which the County of Berks' operates and exists.
SI 1

County of Berks
Net Position by Component
Last Ten Years
(accrual basis of accounting)
2016 2015 2014 2013 2012 2011 2010 2009 2008 2007
(Restated) (Restated) (Restated)
Governmental activities
Net Investment in Capital Assets 81,931,824$ 43,806,168$ 23,918,071$ 9,829,007$ 17,083,783$ 9,109,197$ 1,934,910$ (3,074,102)$ (806,368)$ (6,609,944)$
Restricted 40,408,168 39,884,858 24,326,098 11,685,944 12,257,593 16,010,546 24,338,877 15,006,073 15,532,395 22,090,866
Unrestricted 138,914,234 156,023,750 159,475,948 (1) 160,689,349 (1) 165,487,146 163,473,570 171,236,880 158,519,256 178,601,460 141,295,519
Total governmental activities net position 261,254,226$ 239,714,776$ 207,720,117$ 182,204,300$ 194,828,522$ 188,593,313$ 197,510,667$ 170,451,227$ 193,327,487$ 156,776,441$
Business-type activities
Net Investment in Capital Assets 13,723,645$ 13,187,836$ 25,658,496$ 25,034,275$ 13,829,836$ 9,406,663$ 8,680,936$ 7,679,473$ 6,993,441$ 6,232,707$
Restricted - - - - - - - - - -
Unrestricted deficit 441,397 (1,095,778) (10,451,880) (2) (12,457,169) (2) (9,366,816) (8,319,120) (23,180,373) (22,007,130) (21,971,731) (17,113,402)
Total business-type activities net position 14,165,042$ 12,092,058$ 15,206,616$ 12,577,106$ 4,463,020$ 1,087,543$ (14,499,437)$ (14,327,657)$ (14,978,290)$ (10,880,695)$
Primary government
Net Investment in Capital Assets 95,655,469$ 56,994,004$ 49,576,567$ 34,863,282$ 30,913,619$ 18,515,860$ 10,615,846$ 4,605,371$ 6,187,073$ (377,237)$
Restricted 40,408,168 39,884,858 24,326,098 11,685,944 12,257,593 16,010,546 24,338,877 15,006,073 15,532,395 22,090,866
Unrestricted 139,355,631 154,927,972 149,024,068 148,232,180 156,120,330 155,154,450 148,056,507 136,512,126 156,629,729 124,182,117
Total primary government net position 275,419,268$ 251,806,834$ 222,926,733$ 194,781,406$ 199,291,542$ 189,680,856$ 183,011,230$ 156,123,570$ 178,349,197$ 145,895,746$
(1) Decrease is the result of implementing GASB 68 and other prior period adjustments described in Note 1.
(2) Increase is the result of implementing GASB 68 and other prior period adjustments described in Note 1.
SI 2

County of Berks
Changes in Net Position
Last Ten Years
(accrual basis of accounting)
2016 2015 2014 2013 2012 2011 2010 2009 2008 2007Expenses
Governmental activities:
General government 36,082,577$ 24,518,197$ 15,721,339$ 18,758,919$ 17,615,938$ 19,358,233$ 20,021,126$ 19,027,105$ 16,967,271$ 17,137,883$
Judicial 50,162,752 49,573,970 48,391,839 47,033,776 48,313,567 46,672,086 45,019,035 43,649,614 39,902,544 38,851,150
Public safety 73,693,374 60,793,123 58,902,986 58,557,094 57,900,874 53,971,066 53,449,933 51,736,377 51,349,756 50,612,056
Human services 195,370,229 173,389,044 167,089,187 169,216,796 181,005,416 187,841,278 171,929,312 197,140,748 215,746,590 198,740,276
Culture and recreation 8,047,701 7,756,963 7,392,985 7,541,491 7,961,633 7,127,616 7,653,072 8,365,231 3,637,542 7,217,689
Community and economic development 5,736,313 6,466,588 5,790,903 4,674,567 5,447,335 7,164,309 8,114,649 9,127,377 11,503,120 9,070,704
Public works 1,108,162 2,212,561 1,518,619 1,143,574 997,263 948,645 523,018 500,943 1,754,015 1,460,151
Community support 601,605 564,489 1,825,423 5,706,515 5,308,083 6,858,598 6,659,295 4,349,754 4,413,443 4,481,716 Debt service administrative expenses 9,146,762 10,642,781 11,239,235 16,320,620 12,442,872 16,918,941 11,508,880 8,832,087 25,017,761 11,800,763
Capital Projects - - - - - - - 647,030 570,118 -
Solid waste 1,176,581 1,241,206 1,247,078 1,245,347 1,280,046 1,275,635 1,141,743 1,184,106 948,403 1,051,489
Total governmental activities expenses 381,126,056$ 337,158,922$ 319,119,594$ 330,198,699$ 338,273,027$ 348,136,407$ 326,020,063$ 344,560,372$ 371,810,563$ 340,423,877$
Business-type activities
Department of Emergency Services - 12,445,334 12,793,480 8,652,660 8,614,042 7,967,837 7,454,948 6,599,262 5,759,836 5,280,858
Berks County Residential Center 7,877,438 6,999,440 5,667,274 6,088,570 6,047,116 5,464,568 - - - -
Berks Heim 46,861,213 39,332,775 37,753,556 38,407,433 38,763,708 37,757,747 36,383,076 35,501,563 37,089,818 32,818,771 Youth Center - - - - 4,416,787 5,885,897 12,778,024 12,804,773 14,033,304 12,783,713
Total business-type activities expenses 54,738,651 58,777,549 56,214,310 53,148,663 57,841,653 57,076,049 56,616,048 54,905,598 56,882,958 50,883,342
Total primary government expenses 435,864,707$ 395,936,471$ 375,333,904$ 383,347,362$ 396,114,680$ 405,212,456$ 382,636,111$ 399,465,970$ 428,693,521$ 391,307,219$
Program Revenues
Governmental activities:
Charges for services :
General government 8,170,571 7,974,794 7,892,340 8,370,615 7,700,054 7,449,565 7,002,381 6,253,914 5,595,438 7,831,963
Judicial 12,480,779 11,114,805 12,229,763 11,650,097 10,056,699 10,256,054 11,472,650 10,403,760 32,281,495 11,416,614
Public safety 16,595,735 6,135,812 7,219,251 7,081,372 5,619,927 5,148,579 5,594,622 5,392,272 5,337,705 4,663,580
Human services 1,529,874 1,720,468 1,842,966 1,561,502 2,016,753 2,071,743 2,114,879 2,983,530 2,358,395 2,455,765
Culture and recreation 575,744 135,187 112,481 75,756 124,492 116,685 133,154 92,750 128,830 103,783
Community and economic development 2,035,597 940,375 672,165 749,067 1,053,516 573,080 1,417,454 1,108,273 3,096,504 1,109,761
Public works 1,178,078 2,021,583 22,902 - - 346 3,225 11,995 98,605 131,732
Solid waste 3,647,496 3,422,991 3,574,193 2,820,596 2,775,018 2,911,968 2,738,410 4,142,028 3,886,825 4,588,050
Other activities 1,543,670 1,514,558 1,503,982 2,405,976 1,934,098 1,941,296 1,180,059 271,123 - -
Operating grants and contributions 197,988,775 178,140,256 177,271,350 174,282,405 189,380,439 194,760,629 191,577,202 203,067,031 224,184,850 209,042,189 Capital grants and contributions 11,664,124 7,127,307 42,348 3,038,095 675,629 2,820,932 1,921,128 2,382,912 1,935,758 2,045,758
Total governmental activities program revenues 257,410,443$ 220,248,136$ 212,383,741$ 212,035,481$ 221,336,625$ 228,050,877$ 225,155,164$ 236,109,588$ 278,904,405$ 243,389,195$
Business-type activities
Charges for services :
Department of Emergency Services - 10,787,498 8,753,289 8,059,740 7,687,064 7,867,909 8,349,161 7,582,026 6,998,921 5,184,269
Berks County Residential Center 8,836,182 8,861,784 7,664,164 6,985,278 6,523,375 6,018,136 - - - -
Berks Heim 47,896,629 41,886,562 41,017,725 40,974,069 40,567,133 40,201,168 37,117,616 36,386,199 34,821,807 33,224,695
Youth Center - - - - 567,352 2,091,611 8,432,646 8,465,715 8,299,295 8,816,470
Operating grants and contributions - 21,236 93,120 51,522 1,252,856 2,296,085 2,117,133 2,659,792 2,146,724 2,447,643 Capital grants and contributions 8,587 - - - - - - - - -
Total business-type activities program revenues 56,741,398 61,557,080 57,528,298 56,070,609 56,597,780 58,474,909 56,016,556 55,093,732 52,266,747 49,673,077
Total primary government program revenues 314,151,841$ 281,805,216$ 269,912,039$ 268,106,090$ 277,934,405$ 286,525,786$ 281,171,720$ 291,203,320$ 331,171,152$ 293,062,272$
Net (expense)/revenue
Governmental activities (123,715,613) (116,910,786) (106,735,853) (118,163,218) (116,936,402) (120,085,530) (100,864,899) (108,450,784) (92,906,158) (97,034,682) Business-type activities 2,002,747 2,779,531 1,313,988 2,921,946 (1,243,873) 1,398,860 (599,492) 188,134 (4,616,211) (1,210,265)
Total primary government net expense (121,712,866)$ (114,131,255)$ (105,421,865)$ (115,241,272)$ (118,180,275)$ (118,686,670)$ (101,464,391)$ (108,262,650)$ (97,522,369)$ (98,244,947)$
SI 3

County of Berks
Changes in Net Position (continued)
Last Ten Years
(accrual basis of accounting)
2016 2015 2014 2013 2012 2011 2010 2009 2008 2007
General Revenues and Other Changes in Net Position
Governmental activities:Taxes:
Property taxes, levied for general purposes 136,869,417$ 136,151,892$ 136,033,476$ 134,808,089$ 127,067,035$ 127,133,403$ 127,849,461$ 126,343,025$ 125,151,669$ 123,269,687$ Hotel room 2,434,126 2,225,844 2,055,944 1,844,957 1,647,698 1,590,516 1,471,283 1,335,233 1,632,693 1,677,537
Payments in lieu of taxes 237,561 242,774 266,532 220,931 316,221 249,053 324,063 170,159 274,085 223,628 Investment earnings 1,474,025 1,134,503 639,352 550,091 833,259 1,049,014 850,893 3,438,690 6,108,261 9,632,013 Changes in fair value of investment rate swaps (1,109,819) 490,084 601,668 - - - - - - - Rentals 464,950 389,756 328,094 356,407 202,812 - - - - - Miscellaneous 4,945,007 - - - - - - - 8,615,137 - Gain (loss) on sale of capital assets 86,776 20,720 (245,199) 68,874 46,931 18,100 27,008 26,006 18,777 26,558 Conversion to special revenue fund - 6,089,996 - - - - - - - - Transfer of assets to related entity - - (5,746,011) - - - - - - - Swap termination fee - - - - - - - (13,766,920) (5,663,249) - Transfers (146,980) 1,088,977 (436,774) (10,196,998) (4,816,823) (14,158,452) (401,900) (396,908) (412,300) (437,520)
Total governmental activities 145,255,063$ 147,834,546$ 133,497,082$ 127,652,351$ 125,297,133$ 115,881,634$ 130,120,808$ 117,149,285$ 135,725,073$ 134,391,903$
Business-type activitiesInvestment earnings 1,986 8,088 7,349 5,962 5,248 8,658 25,828 66,604 48,924 172,062 Changes in fair value of investment rate swaps (78,729) 626,541 830,097 - - - - - - - Rental of space - 48,230 43,998 27,643 22,464 21,010 - - - - Gain (loss) on sale of capital assets - - (2,696) 818 - - - - - - Miscellaneous - - - - - - (16) (1,013) - - Conversion to special revenue fund - (6,089,996) - - - - - - - - Transfers 146,980 (1,088,977) 436,774 10,196,997 4,816,823 14,158,452 401,900 396,908 412,300 437,520
Total business-type activities 70,237 (6,496,114) 1,315,522 10,231,420 4,844,535 14,188,120 427,712 462,499 461,224 609,582
Total primary government general revenue 145,325,300$ 141,338,432$ 134,812,604$ 137,883,771$ 130,141,668$ 130,069,754$ 130,548,520$ 117,611,784$ 136,186,297$ 135,001,485$
Changes in Net Position
Governmental activities 21,539,450 30,923,760 26,761,229 9,489,133 8,360,731 (4,203,896) 29,255,909 8,698,501 42,818,915 37,357,221 Business-type activities 2,072,984 (3,716,583) 2,629,510 13,153,366 3,600,662 15,586,980 (171,780) 650,633 (4,154,987) (600,683)
Total primary government net revenue 23,612,434$ 27,207,177$ 29,390,739$ 22,642,499$ 11,961,393$ 11,383,084$ 29,084,129$ 9,349,134$ 38,663,928$ 36,756,538$
SI 4

County of Berks
Fund Balances of Governmental Funds
Last Ten Years
(modified accrual basis of accounting)
2016 2015 2014 2013 2012 2011 2010 2009 2008 2007
(Restated) (Restated) (Restated)
General Fund
Nonspendable 1,641,843$ 1,584,554$ 1,364,327$ 398,435$ 592,927$ 878,350$ -$ -$ -$ -$
Restricted 2,859,389 4,125,006 4,201,282 4,869,238 2,299,603 1,865,358 - - - -
Committed 7,327,174 - - - - - - - - -
Assigned 4,082,537 10,551,289 11,323,251 16,953,963 19,545,324 35,008,622 - - - -
Unassigned 118,930,211 135,023,020 134,990,876 110,406,873 102,045,175 115,808,679 - - - -
Reserved - - - - - - 22,143,083 22,126,655 22,282,025 17,214,184
Unreserved - - - - - - 135,857,859 123,004,381 111,756,048 100,028,177 Total General Fund 134,841,154$ 151,283,869$ 151,879,736$ 132,628,509$ 124,483,029$ 153,561,009$ 158,000,942$ 145,131,036$ 134,038,073$ 117,242,361$
All other governmental funds
Nonspendable 2,836,878 3,116,156 32,408 12,455 15,128 15,891 - - - -
Restricted 13,904,207 10,523,506 15,054,053 49,188,337 55,487,813 65,973,877 - - - -
Assigned - 66,759 - - - - - - - -
Unassigned - (2,466,812) - - (45,567) (270,263) - - - -
Reserved - - - - - - 20,302 13,029,506 22,149 2,323,617
Unreserved - - - - - - 89,703,186 13,709,145 14,171,821 58,851,871 Total all other governmental funds 16,741,085$ 11,239,609$ 15,086,461$ 49,200,792$ 55,457,374$ 65,719,505$ 89,723,488$ 26,738,651$ 14,193,970$ 61,175,488$
Total governmental funds 151,582,239$ 162,523,478$ 166,966,197$ 181,829,301$ 179,940,403$ 219,280,514$ 247,724,430$ 171,869,687$ 148,232,043$ 178,417,849$
Note:
The County implemented GASB Statement No. 54 in 2011 under which governmental fund balances are reported as nonspendable, restricted, committed, assigned, and unassigned compared
to reserved and unreserved.
SI 5

County of Berks
Changes in Fund Balances of Governmental Funds
Last Ten Years
(modified accrual basis of accounting)
Revenues 2016 2015 2014 2013 2012 2011 2010 2009 2008 2007
Taxes:
Property 136,924,879$ 136,536,071$ 136,328,388$ 135,388,540$ 127,003,623$ 127,740,394$ 125,922,864$ 126,396,815$ 125,151,669$ 123,621,270$
Hotel 2,434,126 2,225,844 2,055,944 1,844,957 1,647,698 1,590,516 1,471,283 1,335,233 1,632,693 1,677,537
Court costs, fines and forfeitures 3,021,575 3,350,999 3,524,023 3,724,858 3,533,648 3,600,846 4,556,223 3,698,738 322,746 448,271
Intergovernmental revenue 210,291,504 185,900,383 178,186,729 177,199,936 191,267,090 198,655,502 193,442,460 206,041,376 225,381,986 210,396,462
Department charges and reimbursements 67,134,262 55,614,535 58,480,623 56,555,546 54,394,935 51,789,888 24,701,700 25,136,056 29,965,275 29,520,039
Payments in lieu of taxes 237,561 89,730 102,196 51,827 135,367 61,979 131,780 58,551 274,085 223,628
Rentals 464,950 389,756 328,094 356,407 202,812 224,206 216,663 223,811 237,981 237,344
Sales of property, supplies and equipment 86,776 20,720 18,250 68,874 46,931 18,100 27,008 26,006 18,777 26,556
Investment earnings 1,474,025 1,134,503 639,352 550,092 833,261 1,049,014 1,695,035 3,438,710 5,968,895 9,530,791 Other revenue 9,384,796 5,088,961 2,572,505 4,014,222 1,444,130 1,754,018 7,045,682 6,625,792 5,660,307 6,578,373
Total revenues 431,454,454$ 390,351,502$ 382,236,104$ 379,755,259$ 380,509,495$ 386,484,463$ 359,210,698$ 372,981,088$ 394,614,414$ 382,260,271$
Expenditures
Current:
General government, administrative 43,561,692$ 42,140,641$ 41,134,083$ 39,852,191$ 47,959,429$ 38,636,615$ 18,830,640$ 19,573,975$ 15,639,565$ 15,187,582$
General government, judicial 51,897,682 51,638,171 50,335,681 49,460,353 65,573,490 48,819,429 46,906,599 44,664,478 42,020,768 40,376,874
Public safety 72,303,496 61,057,768 61,456,822 58,692,210 72,374,351 53,443,564 53,128,773 52,369,464 52,120,453 50,209,220
Human services 195,598,654 173,905,554 167,515,886 169,602,996 191,747,864 190,338,788 172,719,027 197,741,401 216,731,445 199,443,663
Culture and recreation 8,705,093 6,801,869 6,435,971 7,885,299 9,268,854 11,176,693 8,004,068 8,421,498 8,139,205 7,532,798
Community and economic development 6,892,219 7,976,468 6,820,729 6,526,379 7,180,694 7,578,062 10,839,751 15,402,477 22,159,195 15,382,486
Public works 11,693,954 8,681,128 5,699,803 2,721,058 1,868,944 1,210,529 979,830 823,743 1,672,100 1,240,471
Community support 10,538,809 5,537,268 5,980,470 5,061,857 5,307,490 5,133,316 6,692,107 4,376,935 4,410,317 4,485,602
Intergovernmental expenditures- Solid waste 928,453 993,342 998,452 997,007 1,000,219 997,450 844,401 893,571 948,403 1,051,489
Debt service:
Principal 18,896,062 18,758,298 19,026,576 19,429,357 19,481,932 14,127,753 29,068,574 8,292,218 45,445,174 11,652,987
Interest 5,106,802 5,773,802 6,274,112 8,043,447 9,346,689 9,934,093 5,976,629 4,488,528 7,105,831 8,008,564
Debt issuance costs 119,123 178,668 118,742 141,629 430,673 - 691,302 407,689 8,744 -
Administrative expenditures 141,015 80,461 109,147 12,302 15,518 38,902 - 37,239 136,994 158,583 Capital outlay 2,143,152 4,671,727 26,310,999 24,595,446 20,906,488 8,702,465 15,017,354 1,216,625 5,197,641 3,395,612
Total expenditures 428,526,206$ 388,195,165$ 398,217,473$ 393,021,531$ 452,462,635$ 390,137,659$ 369,699,055$ 358,709,841$ 421,735,835$ 358,125,931$
Excess (deficiency) of revenues over (under) expenditures 2,928,248$ 2,156,337$ (15,981,369)$ (13,266,272)$ (71,953,140)$ (3,653,196)$ (10,488,357)$ 14,271,247$ (27,121,421)$ 24,134,340$
Other financing sources (uses)
Transfers in 23,118,717$ 13,749,987$ 12,607,913$ 14,488,107$ 21,491,843$ 18,964,872$ 8,468,764$ 10,138,474$ 13,288,542$ 10,270,640$
Transfers out (22,044,742) (19,631,432) (11,870,836) (15,816,894) (27,676,447) (33,123,324) (8,870,664) (10,535,383) (13,700,842) (10,708,160)
Bond premium 209,950 3,613,694 82,210 2,860,762 - - - 114,396 - -
Issuance of long term debt - - - 17,785,000 29,940,941 - 72,077,540 19,874,004 16,151,487 2,243,417
Payments to refunded bond escrow agent (24,943,412) (27,211,227) (9,963,468) - - - - (26,258,174) (1,042,021) -
Issuance of refunding bonds 9,790,000 23,776,200 10,000,000 - 9,870,000 - 14,667,460 29,800,000 - -
Conversion to special revenue fund - 554,492 Payment to escrow agent - - - - - - - - (5,073,078) -
Total other financing sources (uses) (13,869,487)$ (5,148,286)$ 855,819$ 19,316,975$ 33,626,337$ (14,158,452)$ 86,343,100$ 23,133,317$ 9,624,088$ 1,805,897$
Special Item
Swap termination fee -$ -$ -$ -$ -$ (2,876,000)$ -$ (13,766,920)$ (5,663,249)$ -$
Net change in fund balances (10,941,239)$ (2,991,949)$ (15,125,550)$ 6,050,703$ (38,326,803)$ (20,687,648)$ 75,854,743$ 23,637,644$ (23,160,582)$ 25,940,237$
Debt Service
Percentage of noncapital expenditures 5.7% 6.5% 6.9% 7.5% 6.8% 6.3% 10.1% 3.7% 12.3% 5.6%
Note:
This schedule has been included to provide prior years' information as it was presented in the prior years' reports, not restated for prior year adjustments.
SI 6

County of Berks
Total Revenue by Source, Governmental Funds
Last Ten Years
(modified accrual basis of accounting)
Fiscal
Year Taxes
Court Costs,
Fines &
Forfeitures
Inter -
Governmental
Revenues
Department
Charges &
Reimbursements
Payments in
Lieu of Taxes Rentals
Sale of
property,
supplies, and
equipment
Investment
Earnings
Other
Revenues Totals
2016 139,359,005$ 3,021,575$ 210,291,504$ 67,134,262$ 237,561$ 464,950$ 86,776$ 1,474,025$ 9,384,796$ 431,454,454$
2015 138,761,915 3,350,999 185,900,383 55,614,535 89,730 389,756 20,720 1,134,503 5,088,961 390,351,502
2014 138,384,332 3,524,023 178,186,729 58,480,623 102,196 328,094 18,250 639,352 2,572,505 382,236,104
2013 137,233,497 3,724,858 177,199,936 56,555,546 51,827 356,407 68,874 550,092 4,014,222 379,755,259
2012 128,651,321 3,533,648 191,267,090 54,394,935 135,364 202,812 46,931 833,261 1,444,130 380,509,492
2011 129,330,910 3,600,846 198,655,502 51,789,888 61,979 224,206 18,100 1,049,014 1,754,018 386,484,463
2010 127,394,147 4,556,223 193,442,460 24,701,700 131,780 216,663 27,008 1,695,035 7,045,682 359,210,698
2009 127,732,048 3,698,738 206,041,376 25,136,056 58,551 223,811 26,006 3,438,710 6,625,792 372,981,088
2008 126,784,362 322,746 225,381,986 29,965,275 274,085 237,981 18,777 5,968,895 5,660,307 394,614,414
2007 125,298,807 448,271 210,396,462 29,520,039 223,628 237,344 26,556 9,530,791 6,578,373 382,260,271
Source:
County of Berks, Financial Statements, as restated in individual CAFR's
SI 7

County of Berks
Assessed Value and Estimated Actual Value of Taxable Property
Last Ten Years
Fiscal
Year
Tax-Exempt
Property
Residential
Property
Commercial
Property
Industrial
Property
Total Taxable
Assessed Value Market Value
Assessed Value as
a Percentage of
Market Value
Common Level
Ratio
Total
Direct
Tax Rate2016 2,813,697,200$ 14,452,726,600$ 3,390,894,000$ 815,271,200$ $ 18,658,891,800 19,378,229,700$ 96.3% 75.60% 7.372%2015 2,792,647,500 14,426,375,000 3,388,924,200 806,010,200 18,621,309,400 19,335,256,500 96.3% 76.30% 7.372%
2014 2,773,724,300 14,383,351,500 3,381,283,700 792,507,900 18,557,143,100 19,265,737,800 96.3% 78.10% 7.372%
2013 2,756,192,800 14,339,515,800 3,363,960,000 787,046,700 18,490,522,500 19,194,308,100 96.3% 77.90% 7.372%
2012 2,744,225,900 14,333,218,900 3,364,298,400 775,615,500 18,473,132,800 19,170,097,000 96.4% 73.20% 6.935%
2011 2,722,905,100 14,312,618,000 3,355,340,500 789,901,800 18,457,860,300 19,151,011,000 96.4% 70.70% 6.935%2010 2,690,011,100 14,250,643,200 3,369,197,100 807,453,600 18,427,293,900 19,120,898,600 96.4% 67.70% 6.935%
2009 2,626,786,500 14,198,056,200 3,328,190,800 806,966,600 18,333,213,600 19,021,124,000 96.4% 65.70% 6.935%
2008 2,598,730,300 14,104,166,100 3,255,012,600 806,598,200 18,165,776,900 18,824,246,500 96.5% 68.10% 6.935%
2007 2,483,014,000 13,848,061,200 3,179,432,600 825,152,900 17,852,646,700 18,517,754,300 96.4% 75.00% 6.935%
Notes:
For Population Figures, Refer to Demographic and Economic Statistics Page of Comprehensive Annual Financial Report
Source:
County of Berks Assessment Office
SI 8

County of Berks
Property Tax Rates Per $1,000 of Assessed Value
Direct and Overlapping Governments
Last Ten Years
Tax Year County of Berks
City, Borough, or
Township School District (1) Total
2016 7.372 3.63 28.07 39.07
2015 7.372 3.35 27.57 38.29
2014 7.372 3.32 27.22 37.91
2013 7.372 3.22 26.77 37.36
2012 6.935 3.08 26.24 36.26
2011 6.935 2.92 25.42 35.28
2010 6.935 2.77 24.80 34.51
2009 6.935 2.70 24.66 34.30
2008 6.935 2.78 22.32 32.05
2007 6.935 2.77 23.58 33.30
Notes:
(1) Each unit within these classes levies its own millage rate. The rates shown are averages. The CAFR's
statistical section contains a current year breakdown of overlapping taxes by municipality, and their
related school districts.
Source:
County of Berks Assessment Office
SI 9

County of Berks
Principal Taxpayers
Current and Nine Years Ago
Taxpayer Business/ Product
Taxable Assessed
Value Rank
Percentage
of Total
County
Taxable
Assessed
Value
Taxable Assessed
Value Rank
Percentage
of Total
County
Taxable
Assessed
Value
Berkshire Mall LLC Shopping Mall 63,049,400$ 1 0.34% 75,500,000$ 1 0.42%
BRE RC Exeter PA LP Shopping Mall 56,207,100 2 0.30%
Green Hills Realty Association, LP Leasing 42,348,100 3 0.23% 29,148,100 3 0.16%
East Penn Manufacturing Co. Battery Manufacturing 41,736,400 4 0.22% 28,477,400 4 0.16%
Spring Ridge Associates, Inc. Shopping Mall 41,491,000 5 0.22% 40,131,600 2 0.22%
Highlands at Wyomissing Intermediate Care 37,449,800 6 0.20% 28,055,000 5 0.16%
Reading Hospitality LLC Lodging 32,087,900 7 0.17%
Phoebe Berks Village Inc. Intermediate Care 28,976,400 8 0.16% 22,000,000 10 0.12%
Morgantown Crossings LP Furniture Manufacturing 24,560,300 9 0.13% 25,923,500 6 0.15%
Carpenter Technology Corp. Specialty Steel Manufacturing 22,513,900 10 0.12% 23,305,900 8 0.13%
Ashley Furniture Industries - - 24,554,500 7 0.14%
Sithe Pennsylvania Holdings - - 22,511,900 9 0.13%
Total 390,420,300$ 2.09% 319,607,900$ 1.79%
Note
Total County of Berks assessed valuation for 2016: 18,658,891,800
Source
County of Berks Assessment Office
2016 2007
SI 10

County of Berks
Property Tax Levies and Collections
Last Ten Years
Calendar Year
ended
December 31
Total Tax Levy
(1)
Current Tax
Collections (2)
Percentage of
Levy Collected
Delinquent
Tax
Collections (3)
Total Tax
Collections
Total Tax
Collections To
Tax Levy
2016 $137,553,350 $132,573,006 96.38% $4,351,873 $136,924,879 99.54%
2015 137,276,293 132,039,450 96.19% 4,496,621 136,536,071 99.46%
2014 136,803,259 131,640,203 96.23% 4,688,185 136,328,388 99.65%
2013 136,318,729 130,260,182 95.56% 5,128,358 135,388,540 99.09%
2012 128,117,506 122,243,142 95.41% 4,760,481 127,003,623 99.06%
2011 128,011,510 122,252,616 95.50% 5,487,778 127,740,394 99.79%
2010 127,825,213 121,799,628 95.29% 4,123,236 125,922,864 98.51%
2009 127,793,283 121,851,760 95.35% 4,635,366 126,396,815 98.98%
2008 126,776,530 120,903,442 95.37% 4,156,787 125,151,669 98.65%
2007 125,166,266 119,508,722 95.48% 3,785,225 123,621,270 98.50%
Notes:
(1) Does not include interims and additions to duplicate
(2) Includes discounts, penalties, interims, additions, rebates and error adjustments
(3) Includes penalties and adjustments
Source:
County of Berks Assessment Office
County of Berks Treasurer's Office
County of Berks Tax Claim Bureau
SI 11

County of Berks
Direct and Overlapping Property Tax Rates
Last Ten Years
(rate per $1,000 of assessed value)
2016 2015 2014 2013 2012 2011 2010 2009 2008 2007
Function/Program
County Direct Rates
Total direct rate 7.37 7.37 7.37 7.37 6.94 6.94 6.94 6.94 6.94 6.94
Municipalities
City:
City of Reading 17.69 15.69 15.69 15.69 14.33 14.33 11.95 10.90 11.45 10.90
Boroughs:
Bally 5.00 5.00 4.70 4.50 4.50 4.30 4.10 4.10 3.30 3.30
Bechtelsville 4.50 4.50 4.50 4.50 4.00 3.60 3.60 3.60 3.60 3.60
Bernville 4.44 4.44 4.44 4.44 3.94 3.94 3.94 2.94 2.94 2.94
Birdsboro 6.86 6.66 6.66 6.16 6.16 6.16 6.16 4.36 3.33 3.33
Boyertown 5.64 5.14 5.14 5.14 5.14 5.14 4.99 4.84 3.85 3.85
Centerport 3.00 3.00 3.00 3.00 3.00 2.00 2.00 2.00 2.00 2.00
Fleetwood 6.00 6.00 5.50 5.50 5.50 3.00 2.75 2.70 2.70 2.70
Hamburg 8.00 8.00 7.50 6.50 5.50 5.50 5.50 5.50 5.25 5.25
Kenhorst 5.60 5.60 5.60 4.60 3.60 3.60 3.60 3.10 3.10 3.10
Kutztown 4.10 4.10 3.35 3.10 3.10 2.85 2.85 2.85 2.40 2.40
Laureldale 5.90 5.90 5.90 4.90 4.90 4.90 4.90 4.90 3.60 3.60
Leesport 5.72 5.72 5.72 5.72 5.72 5.72 5.72 5.72 5.72 5.72
Lenhartsville 1.00 1.00 1.00 1.00 1.00 1.00 1.00 1.00 1.00 1.00
Lyons 1.85 1.85 1.85 1.85 1.85 1.85 1.85 1.85 1.85 1.85
Mohnton 4.55 4.30 4.30 3.80 3.80 3.80 3.60 3.60 2.27 2.27
Mt. Penn 8.50 7.40 7.40 7.40 7.40 7.40 7.40 7.40 6.40 6.40
New Morgan 1.56 1.56 4.50 4.50 2.99 2.99 1.83 1.83 25.52 25.52
Robesonia 4.65 4.65 4.40 4.40 4.40 4.15 4.15 4.15 3.15 3.15
St. Lawrence 6.64 6.00 5.70 5.70 5.30 5.30 5.30 3.84 3.84 3.84
Shillington 7.14 5.89 5.89 4.89 4.89 4.89 4.39 4.39 3.89 3.89
Shoemakersville 6.50 5.50 5.50 5.50 5.50 5.50 5.00 5.00 5.00 5.00
Sinking Spring 7.32 7.32 7.32 6.32 6.32 5.04 5.04 3.84 3.84 3.84
Strausstown 3.00 3.00 2.50 2.50 2.50 2.50 2.00 2.00 2.00 2.00
Topton 5.85 5.85 5.85 5.85 6.35 5.60 5.60 5.40 5.00 5.00
Wernersville 6.10 6.10 6.10 5.60 5.60 5.60 5.60 5.60 4.20 4.20
West Reading 7.60 7.10 7.10 7.10 7.10 7.10 7.10 6.85 5.60 5.60
Womelsdorf 4.50 3.50 3.50 3.00 3.00 3.00 3.00 3.06 2.50 2.50
Wyomissing 3.90 3.90 3.90 3.63 3.63 3.43 3.13 2.63 2.63 2.63
Townships:
Albany 0.60 0.60 0.60 0.60 0.60 0.60 0.60 0.60 0.60 0.60
Alsace 1.50 1.00 1.00 1.00 1.00 1.00 1.00 1.00 1.00 1.00
Amity 1.95 1.95 1.95 1.80 1.80 1.80 1.80 1.80 1.03 1.03
Bern 3.44 3.44 3.19 3.12 3.12 3.12 3.12 2.60 2.60 2.60
Bethel 2.00 2.00 2.00 2.00 2.00 2.00 1.50 2.12 1.50 1.50
Brecknock 2.33 1.95 1.95 1.95 1.95 1.75 1.75 1.75 1.00 1.00
Caernarvon 2.48 2.48 2.48 2.48 2.38 2.38 2.38 2.13 1.88 1.88
Centre 0.36 0.36 0.36 0.36 0.36 0.36 0.36 0.36 0.36 0.36
Colebrookdale 3.50 3.50 3.50 3.50 3.00 3.00 3.00 3.00 3.00 3.00
Cumru 6.18 6.18 5.68 5.28 5.28 4.78 4.78 3.78 3.60 3.60
District 0.35 0.35 0.35 0.35 0.35 0.35 0.35 0.35 0.35 0.35
Douglass 3.30 2.30 2.30 2.00 2.00 2.00 2.00 2.00 2.00 2.00
Exeter 3.25 2.87 2.87 2.87 2.69 2.69 2.43 2.33 1.30 1.30
Greenwich 1.00 1.00 1.00 1.00 1.00 0.60 0.80 0.60 0.60 0.60
Heidelberg 1.50 1.50 1.50 1.50 1.50 1.50 1.50 1.50 1.20 1.20
Hereford 1.20 0.96 0.96 0.96 0.96 0.96 0.80 0.80 0.80 0.80
Jefferson 0.18 0.18 0.18 0.18 0.18 0.18 0.18 0.18 0.18 0.18
Longswamp 2.80 2.80 2.80 2.80 2.85 2.32 2.32 2.32 2.18 2.18
SI 12

County of Berks
Direct and Overlapping Property Tax Rates
Last Ten Years
(rate per $1,000 of assessed value)
2016 2015 2014 2013 2012 2011 2010 2009 2008 2007
Function/Program
Townships (continued)
Lower Alsace 7.95 7.18 7.18 6.68 6.68 6.68 6.68 6.68 4.07 4.07
Lower Heidelberg 4.79 4.79 4.79 4.80 4.85 4.85 2.55 0.68 0.68 0.68
Maidencreek 1.75 1.75 1.50 1.50 1.13 1.13 1.13 1.13 1.25 1.25
Marion 1.30 1.30 1.30 1.30 1.30 1.20 1.00 1.00 1.00 1.00
Maxatawny 2.36 2.36 2.36 3.36 3.36 3.36 3.36 2.68 2.68 2.68
Muhlenberg 5.00 5.00 4.80 4.80 4.50 4.25 4.25 4.25 4.05 4.05
North Heidelberg 1.00 1.00 0.40 0.40 0.40 0.40 0.20 0.20 0.20 0.20
Oley 2.80 2.80 2.80 2.80 2.59 2.50 2.50 3.10 3.00 3.00
Ontelaunee 4.05 3.80 3.80 3.80 3.80 3.80 3.80 3.80 3.80 3.80
Penn 1.00 1.00 1.00 1.00 1.00 1.00 1.00 1.00 1.00 1.00
Perry 0.80 0.80 0.80 0.80 0.80 0.80 0.25 0.25 0.25 0.25
Pike 0.87 0.87 0.87 0.87 0.87 0.87 0.87 0.87 0.87 0.87
Richmond 3.50 2.50 2.25 2.00 1.75 1.75 1.75 1.75 1.75 1.75
Robeson 2.75 2.75 2.75 2.50 2.50 2.25 2.25 2.25 2.00 2.00
Rockland 1.00 1.00 1.00 1.00 0.60 0.60 0.30 0.30 0.30 0.30
Ruscombmanor 0.09 0.09 0.09 0.09 0.09 0.09 0.09 0.09 0.09 0.09
South Heidelberg 3.35 3.35 3.05 2.55 2.55 2.25 2.25 1.75 1.25 1.25
Spring 3.25 3.25 3.25 3.25 3.25 3.00 2.65 2.75 2.35 2.35
Tilden 1.45 1.45 1.45 1.45 0.95 0.92 0.92 0.42 0.42 0.42
Tulpehocken 1.60 1.60 1.60 1.60 1.60 1.60 1.60 1.60 1.60 1.60
Union 3.65 3.65 3.65 3.65 2.15 2.15 2.15 1.90 1.90 1.90
Upper Bern 1.95 1.95 1.95 1.95 1.95 1.95 1.20 1.20 1.20 1.20
Upper Tulpehocken 0.80 0.80 0.80 0.80 0.80 0.80 0.80 0.80 0.60 0.60
Washington 2.70 2.70 2.70 4.32 4.32 2.32 2.32 1.70 1.70 1.70
Windsor 0.30 0.30 0.30 0.30 0.30 0.30 0.30 0.30 0.30 0.30
School Districts:
Antietam 37.79 36.79 35.86 34.56 33.75 32.35 31.60 31.60 30.80 30.80
Boyertown 24.27 23.96 23.39 22.52 21.88 20.77 20.02 19.64 19.24 19.24
Brandywine Heights 32.30 32.30 32.30 32.30 31.25 30.00 29.70 29.00 28.10 28.10
Conrad Weiser 27.14 26.32 25.71 25.71 25.27 24.32 24.32 24.32 24.20 23.40
Daniel Boone 29.70 28.96 28.96 28.96 28.96 28.42 27.65 27.65 26.25 26.25
Exeter 32.22 31.25 31.25 30.80 30.10 29.62 28.62 27.78 25.83 25.83
Fleetwood 31.81 30.96 30.21 29.21 28.22 27.28 26.61 26.35 25.56 25.56
Governor Mifflin 27.10 26.60 26.00 25.30 24.50 23.20 22.60 22.50 21.60 21.60
Hamburg 26.71 26.46 26.21 25.96 25.71 25.21 24.96 24.71 23.73 23.27
Kutztown 29.95 29.95 29.95 29.25 28.76 28.28 28.28 27.17 25.53 25.53
Muhlenberg 28.56 27.81 27.56 26.81 26.31 25.56 25.06 24.31 23.81 23.81
Oley Valley 26.33 25.84 25.39 24.93 24.56 23.82 23.82 23.82 23.42 23.42
Reading 17.93 17.41 17.41 16.92 16.92 16.46 16.46 19.75 19.75 19.75
Schuylkill Valley 27.07 26.79 26.79 26.79 26.27 25.13 24.43 23.68 22.88 22.88
Tulpehocken 27.70 27.70 27.70 27.70 27.70 27.45 27.08 27.08 25.83 25.83
Twin Valley 26.77 25.74 24.54 23.88 22.60 21.70 21.40 20.30 19.30 19.30
Upper Perkiomen 24.95 24.60 24.25 24.00 23.66 23.66 20.75 22.76 19.69 19.69
Wilson 24.95 24.60 24.25 24.00 23.66 21.95 20.75 19.55 18.55 18.55
Wyomissing 30.07 29.78 29.49 29.05 28.57 27.89 27.11 26.41 25.17 25.17
Note:
Total annual real estate taxes (county, municipal, school) per $1,000 of assessed value.
Source:
County of Berks Assessment Office
SI 13
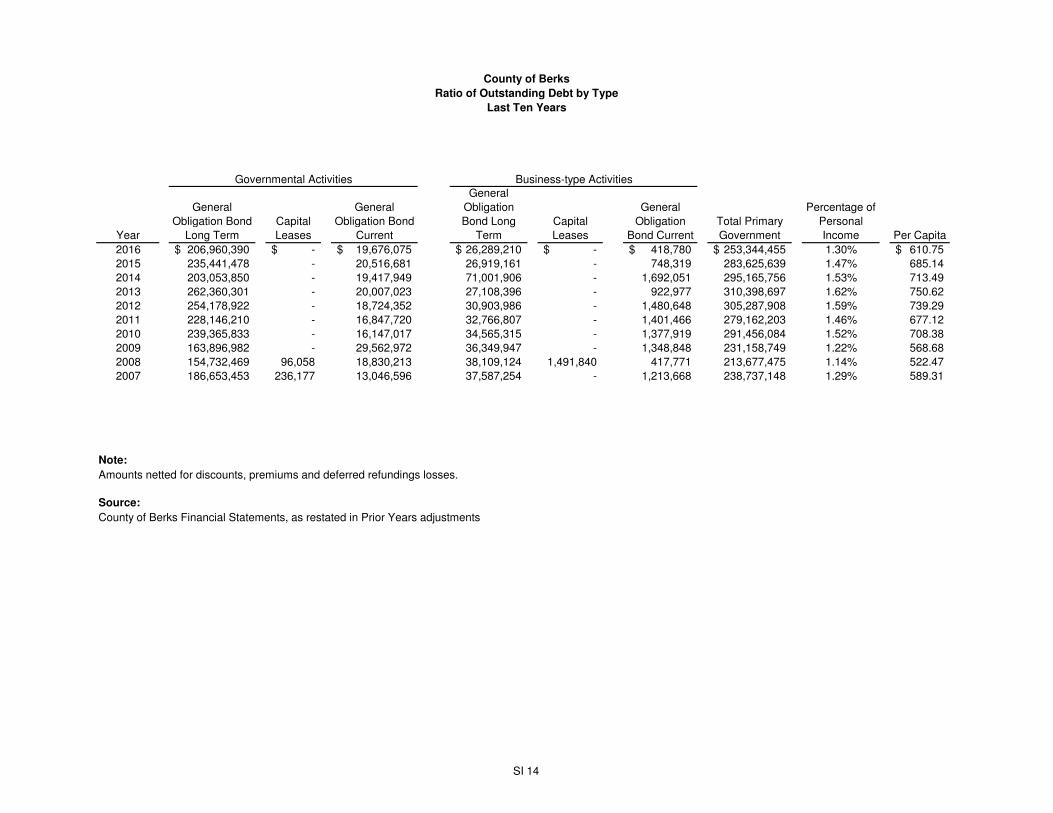
County of Berks
Ratio of Outstanding Debt by Type
Last Ten Years
Year
General
Obligation Bond
Long Term
Capital
Leases
General
Obligation Bond
Current
General
Obligation
Bond Long
Term
Capital
Leases
General
Obligation
Bond Current
Total Primary
Government
Percentage of
Personal
Income Per Capita
2016 206,960,390$ -$ 19,676,075$ 26,289,210$ -$ 418,780$ 253,344,455$ 1.30% 610.75$
2015 235,441,478 - 20,516,681 26,919,161 - 748,319 283,625,639 1.47% 685.14
2014 203,053,850 - 19,417,949 71,001,906 - 1,692,051 295,165,756 1.53% 713.49
2013 262,360,301 - 20,007,023 27,108,396 - 922,977 310,398,697 1.62% 750.62
2012 254,178,922 - 18,724,352 30,903,986 - 1,480,648 305,287,908 1.59% 739.29
2011 228,146,210 - 16,847,720 32,766,807 - 1,401,466 279,162,203 1.46% 677.12
2010 239,365,833 - 16,147,017 34,565,315 - 1,377,919 291,456,084 1.52% 708.38
2009 163,896,982 - 29,562,972 36,349,947 - 1,348,848 231,158,749 1.22% 568.68
2008 154,732,469 96,058 18,830,213 38,109,124 1,491,840 417,771 213,677,475 1.14% 522.47
2007 186,653,453 236,177 13,046,596 37,587,254 - 1,213,668 238,737,148 1.29% 589.31
Note:
Amounts netted for discounts, premiums and deferred refundings losses.
Source:
County of Berks Financial Statements, as restated in Prior Years adjustments
Governmental Activities Business-type Activities
SI 14

County of Berks
Ratios of General Bonded Debt Outstanding
Last Ten Years
Fiscal
Year Population
Estimated Actual
Taxable Value
General
Obligation Debt
Ratio of General
Obligation Debt
to Assessed
Value
General
Obligation
Debt Per
Capita
2016 414,812 * 19,454,270,800$ 253,344,455$ 1.30% 610.75
2015 413,965 19,335,256,500 283,625,639 1.47% 685.14
2014 413,691 19,265,737,800 295,165,756 1.53% 713.49
2013 413,521 19,194,308,100 321,748,697 1.68% 778.07
2012 412,948 19,170,097,000 305,287,908 1.59% 739.29
2011 412,279 19,151,011,000 278,905,880 1.46% 676.50
2010 411,442 19,120,898,600 291,456,084 1.52% 708.38
2009 406,481 19,021,124,000 215,831,423 1.02% 476.15
2008 408,979 18,824,246,500 201,390,664 0.87% 398.90
2007 405,113 18,517,754,300 234,906,800 1.06% 484.24
Notes:
* Estimate used for 2016 population
Source:
Pennsylvania State Data Center or Census Bureau (Census Report or Most Recent Yearly Estimates)
County of Berks Assessment Office
County of Berks Financial Statements, as restated in Prior Year adjustments
SI 15

County of BerksDirect and Overlapping Governmental Activities Debt
December 31, 2016
Direct Debt of County and Related Entities
Net Debt Outstanding
Percentage Applicable
Estimated Share of Direct and
Overlapping Debt
County of Berks 226,636,465$ 100% $ 226,636,465
Overlapping DebtSchool Districts:
Antietam 17,255,000$ 100% 17,255,000$ Boyertown Area 96,290,000 100% 96,290,000 Brandywine Heights 18,950,000 100% 18,950,000 Conrad Weiser 36,282,000 100% 36,282,000 Daniel Boone Area 85,561,038 100% 85,561,038 Exeter Township 76,243,326 100% 76,243,326 Fleetwood Area 31,057,733 100% 31,057,733 Governor Mifflin Area 63,750,000 100% 63,750,000 Hamburg Area 45,325,000 100% 45,325,000 Kutztown Area 23,595,000 100% 23,595,000 Muhlenberg Area 38,575,000 100% 38,575,000 Oley Valley 27,567,813 100% 27,567,813 Reading School District 375,560,000 100% 375,560,000 Schuylkill Valley 19,690,000 100% 19,690,000 Tulpehocken Area 24,760,000 100% 24,760,000 Twin Valley 36,041,221 100% 36,041,221 Wilson Area 85,455,000 100% 85,455,000 Wyomissing Area 31,040,000 100% 31,040,000
Total School Districts 1,132,998,131$ 1,132,998,131$
MunicipalitiesCity of Reading 281,943,920$ (1) 100% 281,943,920$ Albany Township 249,511 (1) 100% 249,511 Alsace Township 2,276,835 100% 2,276,835 Amity Township 3,027,240 100% 3,027,240 Bally Borough 1,370,174 100% 1,370,174 Bern Township 137,633 100% 137,633 Bernville Borough 1,106,012 100% 1,106,012 Bethel Township 571,288 100% 571,288 Birdsboro Borough 1,634,488 100% 1,634,488 Boyertown Borough 1,326,313 100% 1,326,313 Brecknock Township 51,553 100% 51,553 Caernarvon Township 1,643,536 100% 1,643,536 Colebrookdale Township 1,014,622 100% 1,014,622 Cumru Township 2,667,000 100% 2,667,000 Exeter Township 48,931,705 100% 48,931,705 Fleetwood Borough 1,771,319 100% 1,771,319 Greenwich Township 76,000 100% 76,000 Hamburg Borough 9,999,023 100% 9,999,023 Heidelberg Township 13,578 100% 13,578 Hereford Township 19,745 100% 19,745 Kutztown Borough 19,460,000 100% 19,460,000 Leesport Borough 35,808 100% 35,808 Lenhartsville Borough 415,812 (1) 100% 415,812 Longswamp Township 805,079 100% 805,079 Lower Alsace Township 2,742,342 100% 2,742,342 Lower Heidelberg Township 6,950,000 100% 6,950,000
Note
(1) Unavailable - used latest data available
SI 16

County of Berks
Direct and Overlapping Governmental Activities Debt
December 31, 2016
Direct Debt of County and Related Entities (continued)
Net Debt
Outstanding
Percentage
Applicable
Estimated Share of
Direct and
Overlapping Debt
Lyons Borough 1,881 100% 1,881
Maidencreek Township 197,210 100% 197,210
Maxatawny Township 637,306 100% 637,306
Mt. Penn Borough 365,866 100% 365,866
Mohnton Borough 334,322 100% 334,322
Muhlenberg Township 17,005,753 100% 17,005,753
New Morgan Borough 13,539,953 (1) 100% 13,539,953
Oley Township 66,763 100% 66,763
Ontelaunee Township 2,637,810 100% 2,637,810
Penn Township 63,251 (1) 100% 63,251
Richmond Township 2,699,714 100% 2,699,714
Robeson Township 1,269,074 100% 1,269,074
Robesonia Borough 64,539 100% 64,539
St. Lawrence Borough 735,375 100% 735,375
Shillington Borough 2,051,975 100% 2,051,975
Shoemakersville Borough 487,235 100% 487,235
Sinking Spring Borough 4,774,196 100% 4,774,196
Spring Township 20,645,022 100% 20,645,022
South Heidelberg Township 1,469,000 100% 1,469,000
Tilden Township 6,377,046 100% 6,377,046
Topton Borough 1,295,085 100% 1,295,085
Tulpehocken Township 2,446,287 100% 2,446,287
Union Township 991,857 100% 991,857
Washington Township 10,550,000 100% 10,550,000
Wernersville Borough 1,307,000 100% 1,307,000
West Reading Borough 10,233,665 100% 10,233,665 Womelsdorf Borough 227,269 100% 227,269
Total Municipalities 492,714,990$ 492,714,990$
Total overlapping debt $ 1,625,713,121
TOTAL DIRECT AND OVERLAPPING DEBT $ 1,852,349,586
Note
(1) Unavailable - used latest data available
Source
Annual Reports from individual School Districts and Municipalities
SI 17

County of Berks
Legal Debt Margin Information
Last Ten Years
2016 2015 2014 2013 2012 2011 2010 2009 2008 2007
Debt Limit at 300% 1,378,800,855$ 1,324,954,399$ 1,307,926,447$ 1,309,909,635$ # 1,288,660,406$ 1,266,195,075$ 1,257,080,566$ 1,263,049,573$ 1,249,850,277$ 1,198,877,349$
Total amount of debt applicable to debt limit net of
discount on zero coupon bonds 226,636,465 255,958,159 222,677,099 246,929,029 240,494,029 237,407,346 242,343,081 279,590,000 238,784,576 261,601,800
Legal Debt Margin 1,152,164,390$ 1,068,996,240$ 1,085,249,348$ 1,062,980,606$ 1,048,166,377$ 1,028,787,729$ 1,014,737,485$ 983,459,573$ 1,011,065,701$ 937,275,549$
Total net debt applicable to the limit as a
percentage of debt limit 16.44% 19.32% 17.03% 18.85% 18.66% 18.75% 19.28% 22.14% 19.11% 21.82%
Total Revenues Received 488,187,265$ 451,204,255$ 439,409,335$ 434,340,809$ 434,176,303$ 441,392,523$ 413,091,580$ 411,710,972$ 433,221,494$ 418,117,107$
Total net revenue 1,378,800,855$ 1,324,954,399$ 1,307,926,447$
Borrowing base = Total net revenues,
divided by three 459,600,285$ 441,651,466$ 435,975,482$
Note:
2008 total revenues received restated
Source:
County of Berks, Financial Statements
Calendar Year
SI 18

Ratio of Annual Debt Service Expenditures
For General Obligation Bonded Debt
To Total General Governmental Expenditures
Last Ten Years
Fiscal
Year Principal Interest Debt Service
Total General
Governmental
Expenditures
Ratio of Debt
Service to Total
Governmental
Expenditures
2016 18,896,062$ 5,106,802$ 24,002,864$ 428,526,206$ 5.60%
2015 18,758,298 5,773,802 24,532,100 388,195,165 6.32%
2014 19,026,576 6,274,112 25,300,688 398,217,473 6.35%
2013 19,429,357 8,043,447 27,472,804 393,021,531 6.99%
2012 19,481,932 9,346,689 28,828,621 452,462,635 * 6.37%
2011 14,127,753 9,934,093 24,061,846 390,137,659 6.17%
2010 29,068,574 5,976,629 35,045,203 369,699,055 9.48%
2009 8,292,218 4,488,528 12,780,746 358,709,841 3.56%
2008 45,445,174 7,105,831 52,551,005 338,327,940 15.53%
2007 11,652,987 8,008,564 19,661,551 310,232,438 6.34%
Notes:
* Includes prefunding of pension plan
Source:
County of Berks, Financial Statements
SI 19

County of Berks
Demographic and Economics Statistics
Last Ten Years
Calendar
Year Population
Per Capita
Personal
Income
Median
Household
Income
Median
Age
Higher
Education
Enrollment
Public School
Enrollment
Unemployment
Rate
Average Sales
Price of
Residential
Property
2016 414,812 * * * * * 4.4% *
2015 413,965 27,146 55,936 39.7 27,985 71,160 4.8% 168,200
2014 413,691 26,998 55,798 39.7 28,503 71,358 4.8% 169,200
2013 412,078 26,723 55,170 39.5 28,648 71,866 7.2% 170,600
2012 411,094 26,478 55,021 39.4 28,341 72,288 7.7% 173,400
2011 409,624 26,332 54,823 39.1 27,919 72,356 7.9% 174,000
2010 407,310 25,518 53,470 38.9 27,660 72,063 8.7% 170,400
2009 406,481 26,505 56,983 36.7 27,568 73,138 5.5% 192,400
2008 408,979 24,488 55,103 38.5 25,360 75,447 5.5% 153,100
2007 405,113 25,030 54,402 38.4 22,273 70,415 4.5% 149,700
* 2016 data not available. Population estimated
Source:
Individual Institutions
County of Berks Assessment Office
Pennsylvania Department of Labor & Industry, Bureau of Research and Statistics
SI 20

County of Berks
Principal Employers
Current Year and Nine Years Ago
Employer Employees Rank
Percentage of
Total
Employment Employees Rank
Percentage of
Total
Employment
East Penn Manufacturing Co. Inc. * 1 * 4,000 3 1.98%
Reading Health System * 2 * 5,618 1 2.78%
County of Berks 2,342 3 * 2,582 4 1.28%
Carpenter Technology Corp. * 4 * 4,015 2 1.99%
Wal-Mart Stores * 5 * 1,974 7 0.98%
Pennsylvania Government * 6 * (1)
Reading School District * 7 * 2,500 5 1.24%
Boscov's Inc. * 8 * 2,000 6 0.99%
Penske Truck Leasing * 9 * (1)
Reading Health Physician Network * 10 * (1)
St. Joseph Medical Center - (1) * 1,585 8 0.78%
Redner's Warehouse Markets - (1) * 1,294 10 0.64%
Sovereign Bank - (1) * 1,555 9 0.77%
Total 2,342 * 27,123 13.41%
Total County Labor Force 212,900 202,260
Note:
*- 2016 employee data available
(1) - Employer not on both lists
Source:
Pennsylvania Department of Labor & Industry, Bureau of Research and Statistics
2016 2007
SI 21

County of Berks
Full-Time Equivalent Employees by Function/Program
Last Ten Years
2016 2015 2014 2013 2012 2011 2010 2009 2008 2007Function/Program
Governmental activities:
General government 197 196 193 205 203 209 200 181 186 200
Judicial 458 462 465 457 463 468 471 451 454 454
Public safety 487 412 398 397 390 391 404 380 389 508
Public works - - - - - - - 2 2 1
Human services 294 293 297 302 307 315 313 298 312 252
Culture and recreation 34 35 35 35 35 30 31 36 36 42
Community and economic development 19 19 17 21 22 9 9 23 41 17
Total governmental activities 1,489 1,417 1,405 1,417 1,420 1,422 1,428 1,371 1,420 1,474
Business-type activities
Berks Heim 399 402 398 399 398 403 415 384 430 433 Emergency Services - (3) 79 78 79 81 77 77 56 54 62
Berks County Residential Center 64 68 57 55 55 54 51 (2) - - -
Youth Center - - - - (1) 1 58 71 134 142 164
Total business-type activities expenses 463 549 533 533 535 592 614 574 626 659
Total primary government expenses 1,952 1,966 1,938 1,950 1,955 2,014 2,042 1,945 2,046 2,133
Note:
A full-time employee is scheduled to work 2,080 hours per year (including vacation and sick leave). Full-time equivalent employment
is calculated by dividing total labor hours by 2,080.
(1) Youth Center closed in 2012
(2) Berks County Residential Center opened in 2010
(3) Emergency Services merged with Public Safety in 2016
Source:
County of Berks, Personnel Statements
SI 22

County of Berks
Operating Indicators by Function/Program
Last Ten Years
2016 2015 2014 2013 2012 2011 2010 2009 2008 2007
Function/Program
Governmental activities:
General government
Elections
New Registrations 20,387 ** 4,859 4,896 4,360 11,283 ** 4,494 5,782 3,795 27,128 ** 6,269
Absentee Ballots Processed 9,358 2,177 2,830 1,962 7,396 2,814 5,282 3,034 12,501 2,246
Change of Address/Party 62,101 25,057 20,178 18,954 22,397 22,405 21,063 21,679 36,117 19,971
Cancellations 43,348 7,092 8,641 3,023 6,262 2,615 19,110 4,496 8,447 25,206
**2008, 2012 and 2016 were presidential election years,
which accounts for higher voter turnout
Real Estate (2) (1)
Appeal summaries - 1,485 1,657 1,075 1,517 1,720 2,070 2,421 1,713 1,010
Change Notices - 2,964 4,299 3,205 3,840 2,002 3,907 7,517 12,509 8,291
Parcels Created - 388 328 384 288 373 451 568 670 1,549
Acreage Changed - 587 470 524 600 664 735 785 1,205 1,150
Judicial
Coroner
Total Cases 3,386 3,230 3,057 3,172 2,966 3,044 2,863 2,792 2,757 2,732
Cremations 2,004 1,865 1,699 1,695 1,518 1,367 1,291 1,294 1,158 1,050
District Attorney
Criminal Case Prosecution (1)
Adult Cases 6,560 6,533 6,865 6,500 6,135 5,258 5,965 6,516 6,436 5,585
Juvenile Cases 804 890 2,074 2,371 2,454 1,967 1,958 2,247 2,365 2,278
Narcotics Enforcement Team 780 602 187 251 236 295 257 308 625 550
DUI Central Booking 658 602 665 620 587 522 492 567 670 639
Major Crimes 2,484 2,215 1,592 2,481 1,382 1,322 1,250 1,098 930 838
Fugitive/Warrants Unit - 226 - - - - - - 1,960 1,900
Register of Wills (1)
Estates Opened 1,886 1,865 1,670 1,764 1,778 1,870 1,780 1,646 1,661 1,695
Marriage Licenses Issued 2,396 2,403 2,349 2,268 2,410 2,253 2,268 2,286 2,406 2,400
Adoptions 227 190 214 207 215 235 215 238 220 185
Public Safety
County Prison
Inmates Committed 6,328 6,701 6,840 7,050 6,774 6,557 6,816 7,105 7,875 7,783
Average Daily Population 1,024 1,171 1,187 1,199 1,115 1,045 1,046 1,083 1,161 1,198
Inmate Counseling Sessions 1,690 1,568 1,547 2,582 1,630 1,687 1,579 1,900 1,948 1,344
Inmate Work Release Participants 92 83 110 114 108 114 116 113 177 178
Inmates Enrolled in Education 422 498 395 362 502 378 412 584 471 563
Public Works
Recycling Center (1)
Tons Recycled Curbside 51,597 55,291 51,757 52,250 51,708 44,069 40,650 56,220 47,027 35,000
Tons Recycled Drop-off 1,625 1,585 1,660 1,662 1,547 1,450 1,804 1,290 1,479 15,000
Tons Recycled Commercial 161,972 158,866 142,918 124,200 120,669 113,237 157,390 165,823 56,361 38,000
Tons Recycled by County 1,472 1,510 1,659 1,600 1,881 1,413 2,009 1,856 352 15,000
Note
(1) Data unavailable - estimated used for reporting purposes
(2) Data unavailable
** Presidential election year, so more registrations processed.
SI 23

County of Berks
Operating Indicators by Function/Program
Last Ten Years
2016 2015 2014 2013 2012 2011 2010 2009 2008 2007
Function/Program
Human services
CareerLink (1)
Companies Served 465 417 375 310 725 720 700 750 975 805
Adults Served 58 126 149 152 110 137 84 61 58 110
Youth Served 545 571 539 593 734 837 604 457 353 400
Dislocated Workers Served 265 304 434 451 472 605 553 386 279 350
JOBS Program (EARN) 340 442 342 356 609 1,848 1,426 1,910 1,966 1,500
Culture and recreation
Ag Land Preservation
Number of Farm Applicants 127 123 139 139 131 125 115 115 131 164
Number of Farms Selected 24 21 23 21 43 30 19 19 72 54
Funds Raised 100 - 147 - 2,349 145 40,000 149 - 2,000
Community and economic development
Planning
Act 247 Subdivision Reviews 151 134 152 142 143 143 180 159 246 292
Act 247 Ordinance Reviews 42 44 31 45 74 69 57 92 76 87
Act 537 Sewage Reviews 10 - 3 3 1 8 4 2 5 6
Act 97 Solid Waste Reviews 5 1 2 3 3 1 2 - 3 3
911
Total 911 Calls 194,460 211,700 210,461 204,083 218,832 219,556 195,568 182,918 189,082 189,063
Average Daily Call Volume 533 580 577 560 600 602 536 501 518 517
Average Answer in < 10 seconds 99% 99% 99% 99% 99% 99% 99% 90% 98% 97%
Surcharge Funds Received (3) 1,297,310$ 2,194,832$ 2,286,686$ 2,346,944$ 2,456,854$ 2,596,960$ 2,805,471$ 2,743,870$ 3,008,941$
Surcharge Funds Disbursed (3) 1,054,321$ 1,628,053$ 1,776,841$ 1,923,136$ 2,094,802$ 2,429,253$ 2,646,909$ 2,743,870$ 3,535,439$
Business-type activities
Berks Heim
In-house Days
Private Pay 22,090 20,866 19,983 21,790 21,535 21,681 21,766 21,780 25,330 20,931
Medical Assistance/Medicare A 127,110 127,593 129,382 127,730 130,110 129,520 127,634 127,403 119,235 126,161
Bedhold Days 556 554 500 742 574 725 705 693 608 620
Berks County Residential Center/Youth Center
Average Daily Population
Berks County Residential Center 80 80 67 74 80 56 64 69 78 78
Youth Center (2) - - - - - 23 30 31 53 65
Note
(1) Data unavailable - estimated used for reporting purposes
(2) Youth Center closed in 2011
(3) As of August 2015, no longer tracking because of change in funding regulations.
Source:
Individual County Departments
SI 24

County of Berks
Capital Asset Statistic by Function/Program
Last Ten Years
2016 2015 2014 2013 2012 2011 2010 2009 2008 2007Function/Program
Governmental activities:
General government
Land and land improvements 2,221,983$ 2,221,983$ 2,221,983$ 3,499,090$ 1,664,570$ 149,143$ 149,143$ 149,143$ 149,143$ 149,143$
Buildings and building improvements 137,923,541 138,719,289 112,252,678 111,790,776 126,923,789 120,179,203 113,359,988 109,873,007 108,974,664 107,843,698
Furniture, fixtures, and equipment 13,428,370 81,095,364 9,878,697 9,444,535 12,334,176 14,743,969 16,663,345 15,089,538 11,664,913 10,612,067
Construction in progress 6,970,633 3,285,230 26,820,832 46,783,680 23,243,334 9,352,390 8,166,676 467,408 1,843,385 5,804,530
Infrastructure 85,760 - - - - - - - - -
Agricultural easements 79,371,116 78,161,441 76,669,703 75,085,203 73,173,727 71,453,155 70,520,705 65,523,487 60,241,043 50,202,075
240,001,403 303,483,307 227,843,893 246,603,284 237,339,596 215,877,860 208,859,857 191,102,583 182,873,148 174,611,513
Judicial
Buildings and building improvements 1,005,804 907,096 757,634 1,128,901 1,128,901 1,036,828 1,029,921 808,116 808,116 798,116
Furniture, fixtures, and equipment 2,552,861 2,262,887 2,625,854 2,577,830 2,537,914 2,570,410 2,810,086 2,572,079 2,367,352 2,605,100
Construction in progress - - - - 87,621 - - 17,201 - -
3,558,665 3,169,983 3,383,488 3,706,731 3,754,436 3,607,238 3,840,007 3,397,396 3,175,468 3,403,216
Public Safety
Buildings and building improvements 49,830,760 48,959,401 46,797,847 46,872,609 53,039,836 43,681,188 43,681,189 40,648,038 34,312,739 33,591,909
Furniture, fixtures, and equipment 67,310,794 2,168,160 2,356,084 2,104,994 2,469,719 2,567,719 2,885,226 2,845,873 2,703,657 2,620,782
Construction in progress 102,128 - - - - - - 1,857,450 7,882,680 -
117,243,682 51,127,561 49,153,931 48,977,603 55,509,555 46,248,907 46,566,415 45,351,361 44,899,076 36,212,692
Public Works
Land and land improvements 41,516 41,516 41,516 41,516 41,516 5,816 - - - -
Buildings and building improvements 8,051,863 8,051,863 8,051,863 8,051,863 8,051,863 8,051,863 8,051,863 8,051,863 8,051,863 7,931,533
Furniture, fixtures, and equipment 225,836 225,836 176,726 176,726 192,317 179,409 179,409 179,409 179,409 179,409
Construction in progress 15,158,118 6,599,210 4,619,721 2,000,718 1,160,164 555,538 446,340 183,685 - -
Infrastructure 12,757,777 10,587,072 6,051,426 4,799,840 4,132,152 4,116,857 4,003,494 3,836,116 3,836,116 2,481,469
36,235,110 25,505,497 18,941,252 15,070,663 13,578,012 12,909,483 12,681,106 12,251,073 12,067,388 10,592,411
Human services
Buildings and building improvements 137,750 113,931 - 110,700 110,700 110,700 110,700 110,700 - -
Furniture, fixtures, and equipment 482,406 500,446 500,493 569,902 550,415 672,658 693,168 636,117 620,454 567,660
620,156 614,377 500,493 680,602 661,115 783,358 803,868 746,817 620,454 567,660
Culture and recreation
Land and land improvements 14,967,868 13,633,400 13,550,628 13,491,264 13,081,317 11,064,480 11,041,962 11,041,962 9,691,962 4,993,128
Buildings and building improvements 7,821,125 7,321,287 7,150,341 7,087,808 6,904,979 7,514,007 6,856,080 6,506,061 6,426,624 6,376,113
Furniture, fixtures, and equipment 1,097,063 1,058,175 1,043,562 972,820 1,061,688 934,890 1,180,422 1,136,603 963,677 889,462
Construction in progress 39,143 - - - 2,456,287 566,848 124,215 - -
Historical treasures 2,279,644 2,279,644 2,279,644 2,279,644 2,166,153 1,915,631 873,000 873,000 873,000 873,000
26,204,843 24,292,506 24,024,175 23,831,536 23,214,137 23,885,295 20,518,312 19,681,841 17,955,263 13,131,703
Community and economic development
Buildings and building improvements 1,843,700 1,843,700 1,843,700 1,843,700 1,843,700 1,843,700 1,843,700 1,843,700 1,843,700 1,843,700
Furniture, fixtures, and equipment 23,359 23,359 23,359 23,359 48,648 144,457 144,457 144,457 135,803 135,803
1,867,059 1,867,059 1,867,059 1,867,059 1,892,348 1,988,157 1,988,157 1,988,157 1,979,503 1,979,503
Total governmental - cost 425,730,918 410,060,290 325,714,291 340,737,478 335,949,199 305,300,298 295,257,722 274,519,228 263,570,300 240,498,699
Business-type activities
Department of Emergency Services (1)
Buildings and building improvements - - 486,846 486,845 486,846 486,846 486,846 486,846 486,846 -
Furniture, fixtures, and equipment - - 67,581,031 11,301,560 9,954,737 10,192,384 10,191,882 10,191,152 9,855,214 5,641,157
Construction in progress - - 668,570 8,103,310 6,885,539 2,119,052 1,374,341 30,915 - -
- - 68,736,447 19,891,715 17,327,122 12,798,282 12,053,069 10,708,913 10,342,060 5,641,157
Berks County Residential Center (2)
Buildings and building improvements 10,187,060 8,909,018 7,912,681 7,902,464 505,847 9,718,080 9,718,080 9,718,080 9,607,709 9,456,623
Furniture, fixtures, and equipment 368,724 346,699 285,023 239,133 239,133 731,975 731,975 731,975 656,862 634,455
Construction in progress - - 126,822 - 412,450 - - - 7,348 -
10,555,784 9,255,717 8,324,526 8,141,597 1,157,430 10,450,055 10,450,055 10,450,055 10,271,919 10,091,078
Berks Heim
Buildings and building improvements 38,046,576 38,032,210 38,013,639 37,749,851 37,731,995 37,601,419 37,601,419 37,601,420 37,601,420 37,544,028
Furniture, fixtures, and equipment 4,586,482 4,549,490 3,962,829 3,887,423 3,808,013 3,727,912 3,438,957 3,429,756 3,417,718 3,370,361
Construction in progress 17,642 14,367 278,646 - - 12,620 - - - -
42,650,700 42,596,067 42,255,114 41,637,274 41,540,008 41,341,951 41,040,376 41,031,176 41,019,138 40,914,389
Total business-type activities 53,206,484 51,851,784 119,316,087 69,670,586 60,024,560 64,590,288 63,543,500 62,190,142 61,633,117 56,646,625
Total primary government 478,937,402 461,912,074 445,030,378 410,408,064 395,973,759 369,890,586 358,801,222 336,709,370 325,203,417 297,145,324
Note:
(1) Converted to special revenue fund in 2015
(2) Youth Center closed in 2012
Berks County Residential Center opened in 2010
Source:
Comprehensive Annual Financial Reports
SI 25

SI 26


