Page 1
COMPREHENSIVE ANNUAL
FINANCIAL REPORT
OF
UPPER DEERFIELD TOWNSHIP
BOARD OF EDUCATION
UPPER DEERFIELD TOWNSHIP, NEW JERSEY
FOR THE FISCAL YEAR ENDED JUNE 30, 2016
Prepared by
Township of Upper Deerfield Township Board of Education
Finance Department
Page 2
UPPER DEERFIELD TOWNSHIP SCHOOL DISTRICT
OUTLINE OF CAFR
INTRODUCTORY SECTION
Page
Letter of Transmittal
Roster of Officials
Consultants and Advisors
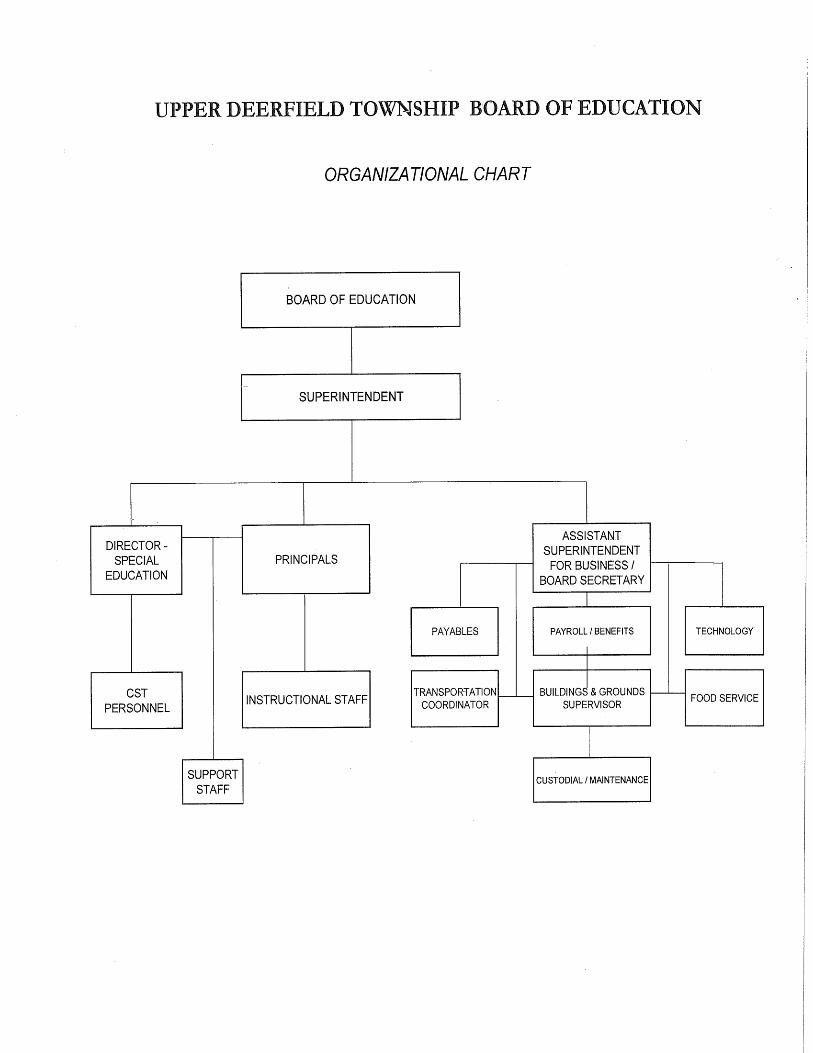
Organizational Chart
FINANCIAL SECTION
Independent Auditor’s Report 1-3
Required Supplementary Information - Part 1
Management’s Discussion and Analysis
Basic Financial Statements
A. District/Charter School-Wide Financial Statements:
A-1 Statement of Net Position 4
A-2 Statement of Activities 5
B. Fund Financial Statements:
Governmental Funds:
B-1 Balance Sheet 6
B-2 Statement of Revenues, Expenditures and Changes in Fund Balances 7
B-3 Reconciliation of the Statement of Revenues, Expenditures and Changes
In Fund Balances of Governmental Funds to the Statement of
Activities 8
Proprietary Funds:
B-4 Statement of Net Position 9
B-5 Statement of Revenues, Expenses and Changes in Fund Net Position 10
B-6 Statement of Cash Flows 11
Fiduciary Funds:
B-7 Statement of Fiduciary Net Position
12
B-8 Statement of Changes in Fiduciary Net Position 13
Notes to Financial Statements 14-37
Required Supplementary Information – Part II
C. Budgetary Comparison Schedules:
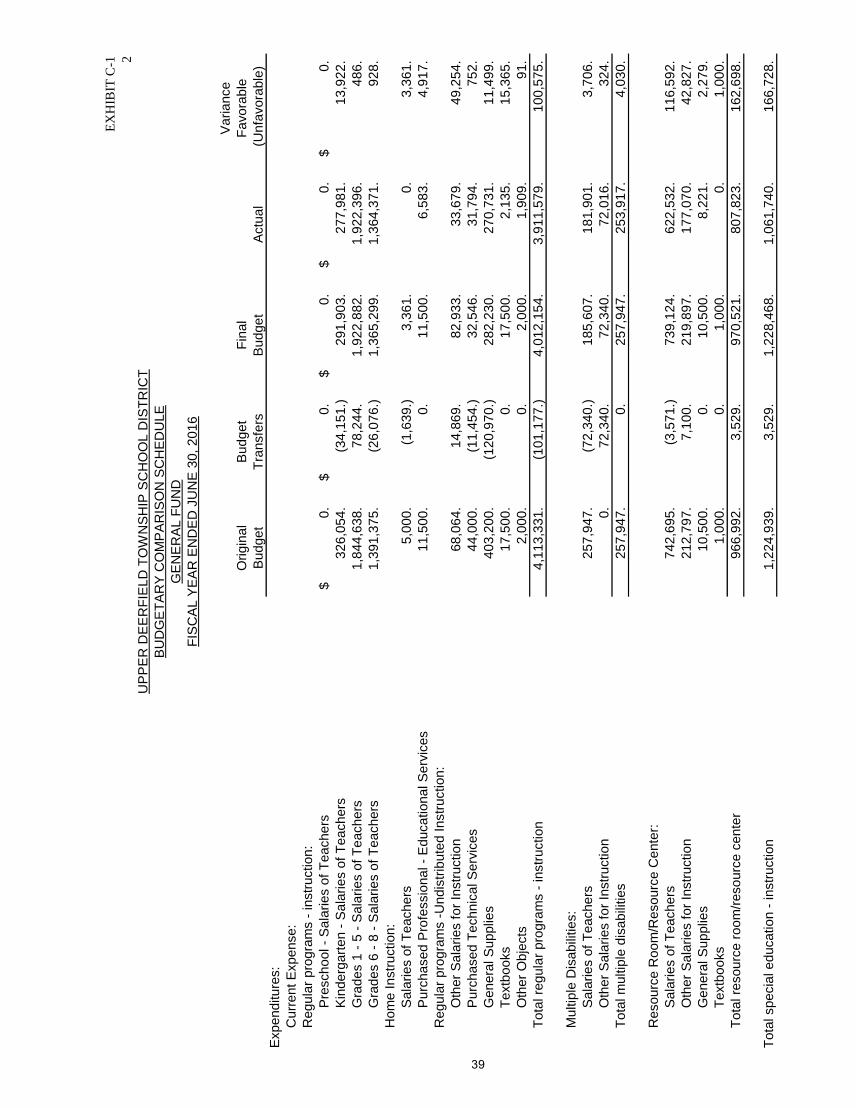
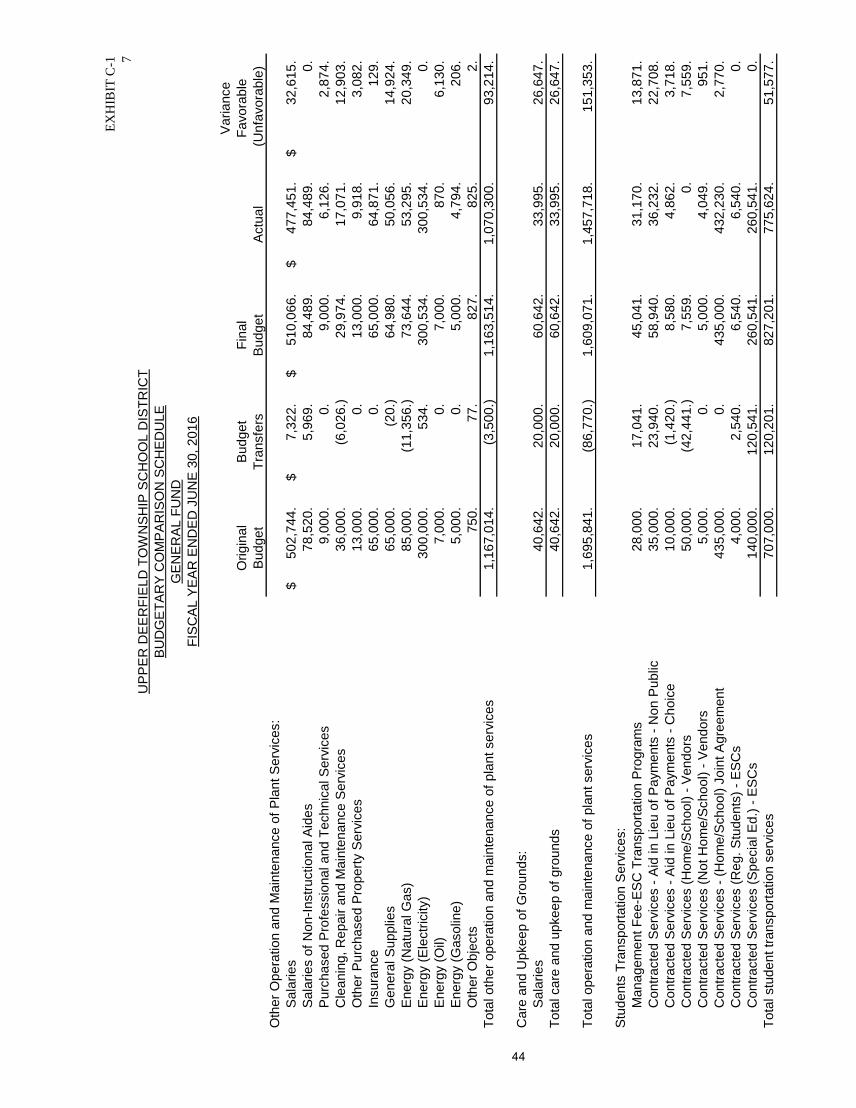
C-1 Budgetary Comparison Schedule – General Fund 38-46
C-1a Combining Schedule of Revenues, Expenditures, and Changes in Fund
Balance – Budget and Actual N/A
C-1b Education Jobs Fund Program – Budget and Actual N/A
C-2 Budgetary Comparison Schedule – Special Revenue Fund 47
Page 3
UPPER DEERFIELD TOWNSHIP SCHOOL DISTRICT
OUTLINE OF CAFR
(Continued)
Page
Notes to the Required Supplementary Information – Part II
C-3 Budget-to-GAAP Reconciliations 48
Required Supplementary Information – Part III
L. Schedules Related to Accounting and Reporting for Pensions (GASB 68)
L-1 Schedule of the District’s Proportionate Share of the Net Pension 49
Liability – PERS
L-2 Schedule of District Contribution – PERS & TPAF 50
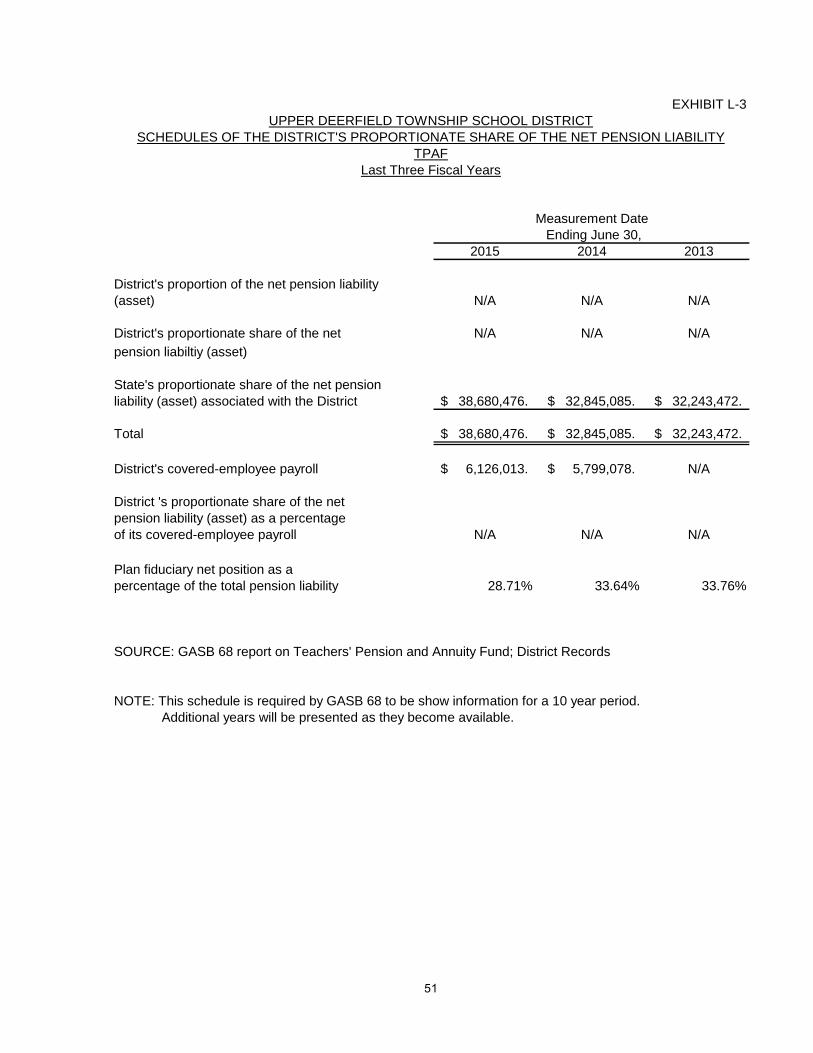
L-3 Schedule of the District’s Proportionate Share of the Net Pension
Liability – TPAF 51
Note to the Required Supplementary Information – Part III 52
Other Supplementary Information
D. School Based Budget Schedules:
D-1 Combining Balance Sheet N/A
D-2 Blended Resource Fund – Schedule of Expenditures Allocated
By Resource Type – Actual N/A
D-3 Blended Resource Fund – Schedule of Blended Expenditures –
Budget and Actual N/A
E. Special Revenue Fund:
E-1 Combining Schedule of Program Revenues and Expenditures Special
Revenue Fund – Budgetary Basis 53
E-2 Pre-School Education Aid Schedule(s) of Expenditures – Budgetary Basis 54
F. Capital Projects Fund:
F-1 Summary Schedule of Project Expenditures 55
F-2 Summary Schedule of Revenues, Expenditures, and Changes in Fund Balance –
Budgetary Basis 56
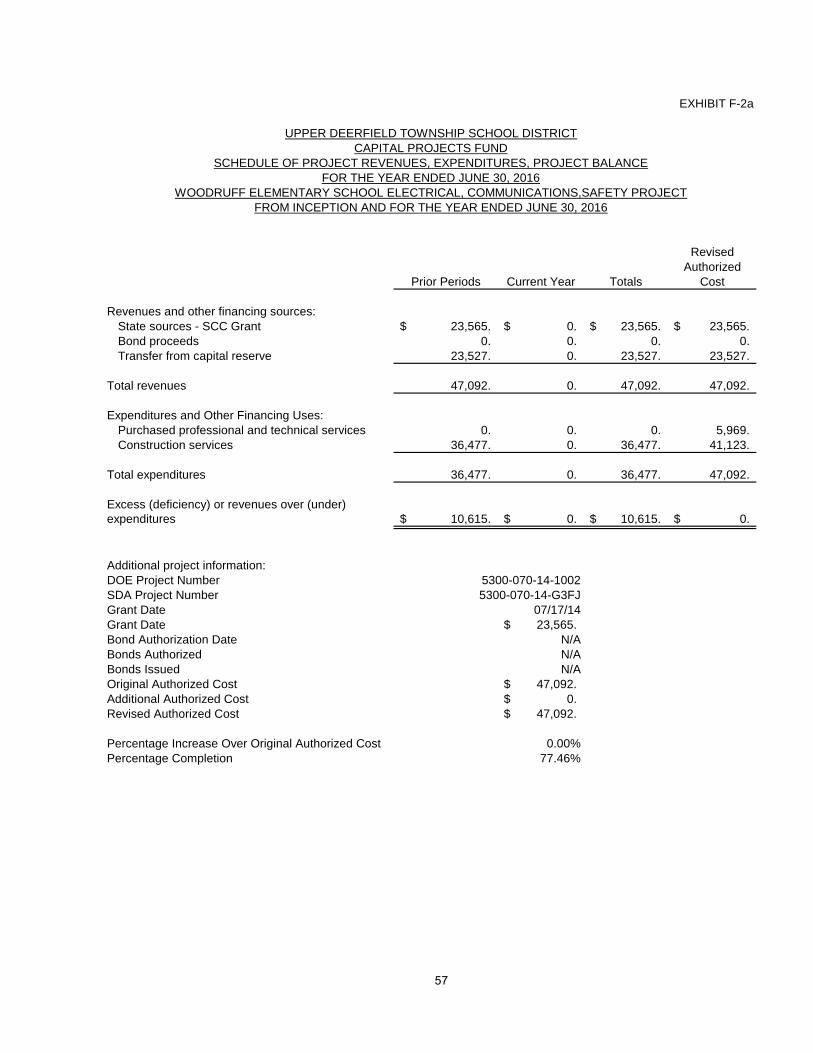
F-2a Schedule of Project Revenues, Expenditures, Project Balance, and Project
Status – Budgetary Basis – Charles F. Seabrook Elementary School: HVAC,
Roof, Security 57
F-2b Schedule of Project Revenues, Expenditures, Project Balance and Project
Status – Budgetary Basis – Elizabeth F. Moore School: HVAC, Roof,
Security 58
F-2c Schedule of Project Revenues, Expenditures, Project Balance, and Project
Status - Budgetary Basis – Woodruff Elementary School: HVAC, Roof,
Door/Window Replacement 59
G. Proprietary Funds:
Enterprise Fund:
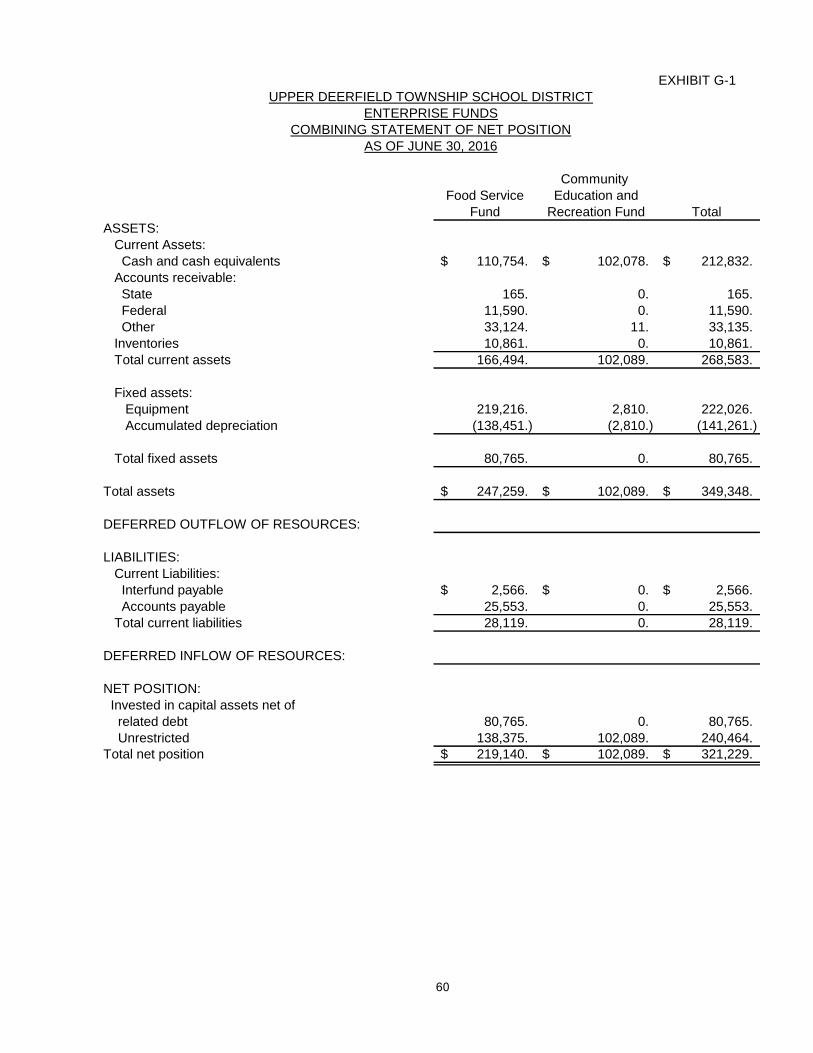
G-1 Combining Schedule of Net Position 60
G-2 Combining Schedule of Revenues, Expenses and Changes in Fund Net Position 61
G-3 Combining Schedule of Cash Flows 62
Page 4
UPPER DEERFIELD TOWNSHIP SCHOOL DISTRICT
OUTLINE OF CAFR
(Continued)
Page
H. Internal Service Fund:
G-4 Combining Schedule of Net Position 63
G-5 Combining Schedule of Revenues, Expenses and Changes in Fund Net Position 64
G-6 Combining Schedule of Cash Flows 65
I. Fiduciary Fund:
H-1 Combining Statement of Fiduciary Net Position 66
H-2 Combining Statement of Changes in Fiduciary Net Position 67
H-3 Student Activity Agency Fund Schedule of Receipts and Disbursements 68
H-4 Payroll Agency Fund Schedule of Receipts and Disbursements 69
J. Long-Term Debt:
I-1 Schedule of Serial Bonds 70
I-2 Schedule of Obligations Under Capital Leases N/A
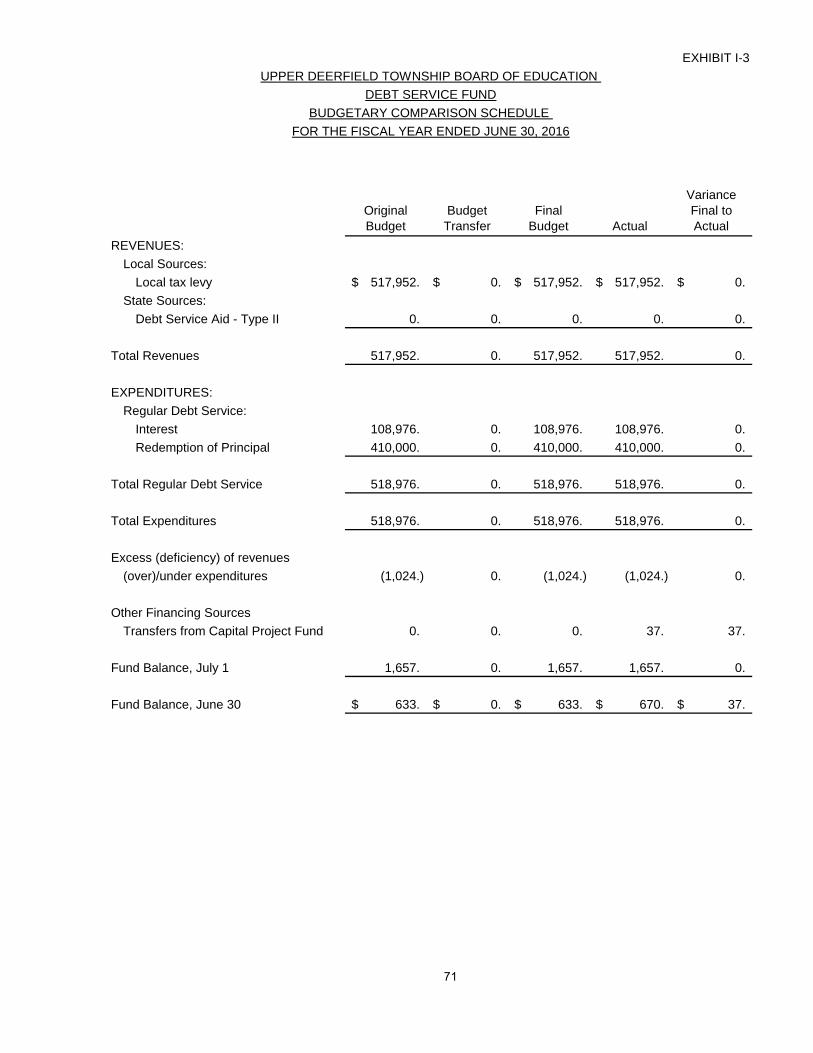
I-3 Debt Service Fund Budgetary Comparison Schedule 71
Statistical Section
Financial Trends
J-1 Net Position by Component 72
J-2 Changes in Net Position 73-74
J-3 Fund Balances – Governmental Funds 75
J-4 Changes in Fund Balances – Governmental Funds 76-77
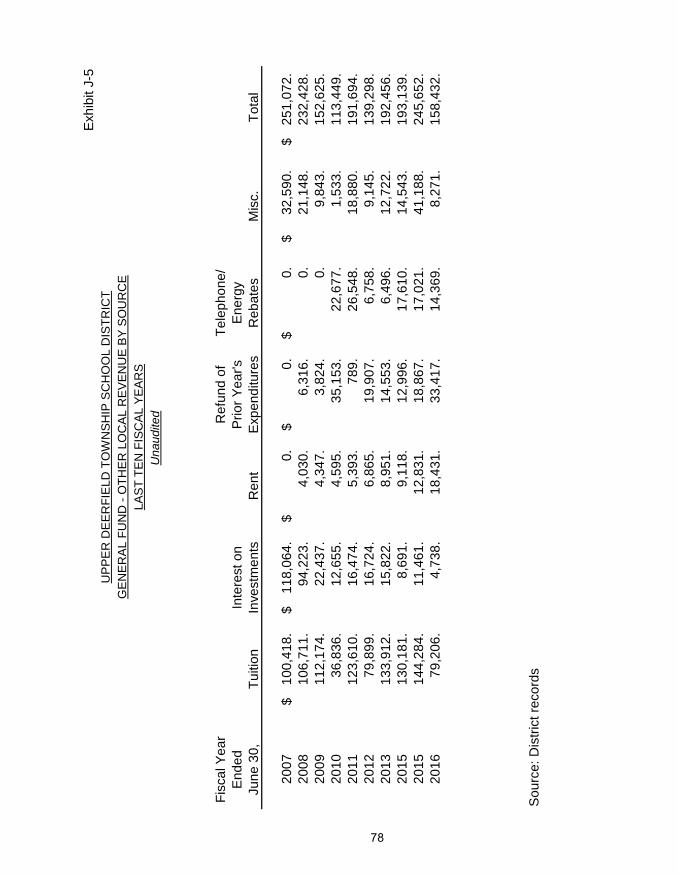
J-5 General Fund Other Local Revenue by Source 78
Revenue Capacity
J-6 Assessed Value and Estimated Actual Value of Taxable Property 79
J-7 Direct and Overlapping Property Tax Rates 80
J-8 Principal Property Taxpayers* 81
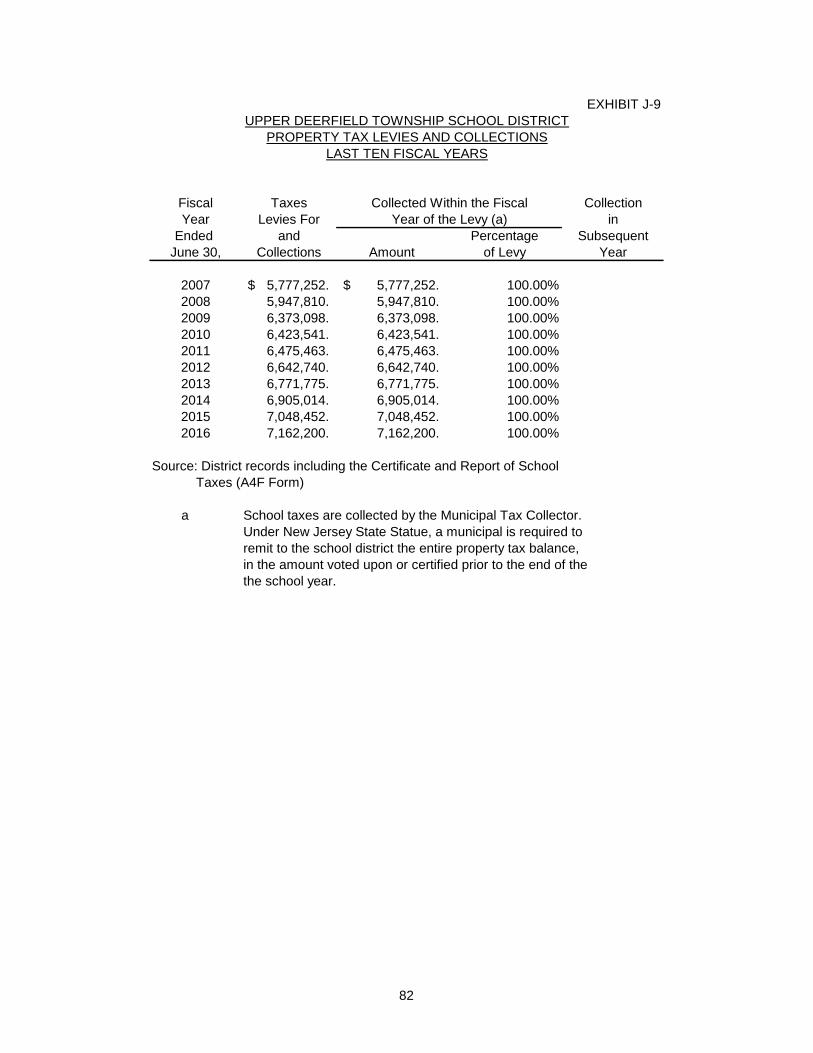
J-9 Property Tax Levies and Collections 82
Debt Capacity
J-10 Ratios of Outstanding Debt by Type 83
J-11 Ratios of Net General Bonded Debt Outstanding 84
J-12 Direct and Overlapping Governmental Activities Debt 85
J-13 Legal Debt Margin Information 86
Demographic and Economic Information
J-14 Demographic and Economic Statistics 87
J-15 Principal Employers 88
Operating Information
J-16 Full-Time Equivalent District/Charter School Employees by
Function/Program 89
J-17 Operating Statistics 90
J-18 School Building Information 91
J-19 Schedule of Required Maintenance Expenditures by School Facility 92
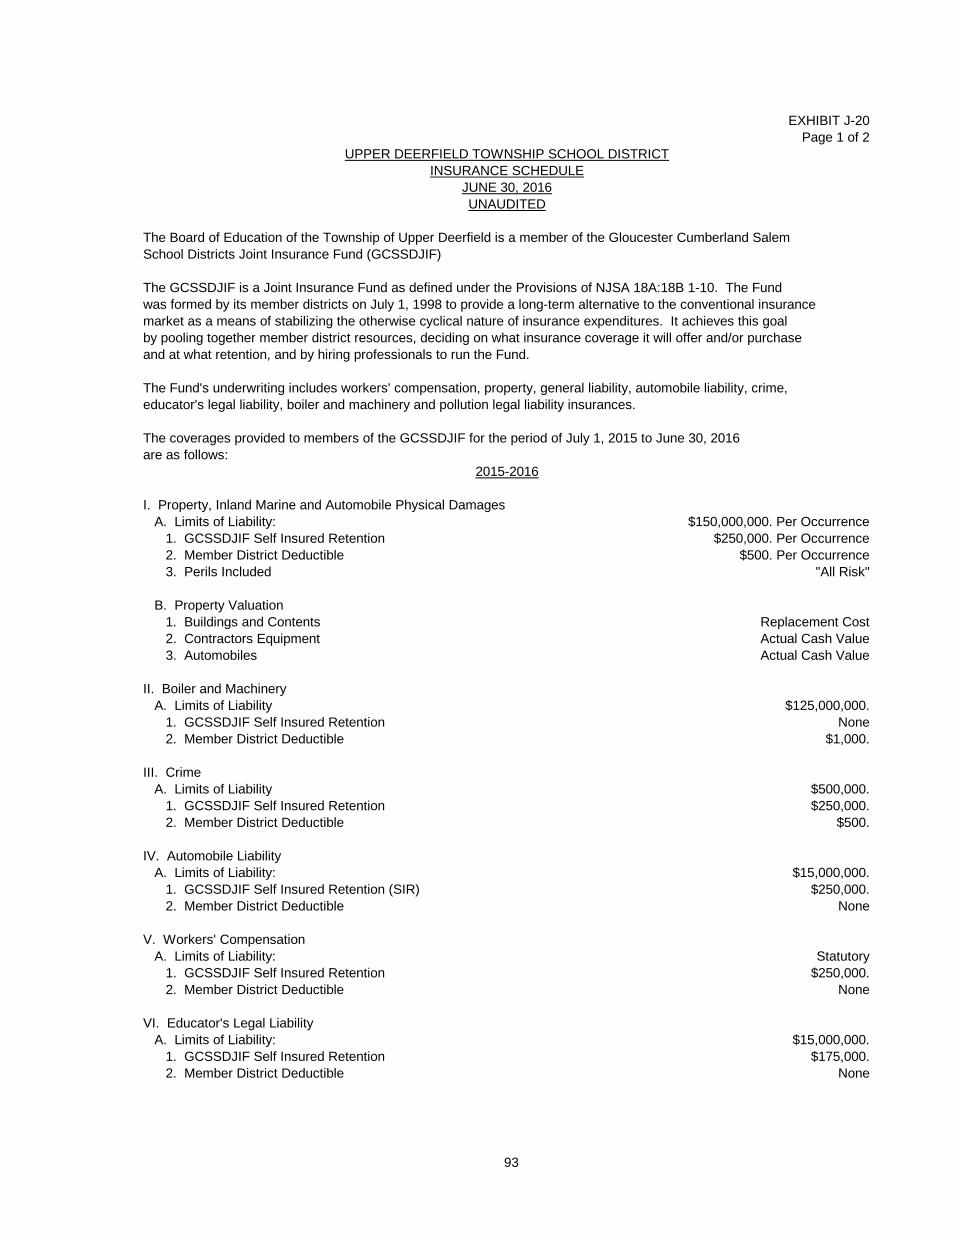
J-20 Insurance Schedule 93-94
Page 5
UPPER DEERFIELD TOWNSHIP SCHOOL DISTRICT
OUTLINE OF CAFR
(Continued)
SINGLE AUDIT SECTION
K-1 Report on Internal Control over Financial Reporting and on Compliance
And Other Matters Based on an Audit of Financial Statements
Performed in Accordance with Government Auditing Standards 95-96
K-2 Report on Compliance For Each Major Program; Report on Internal Control
Over Compliance 97-99
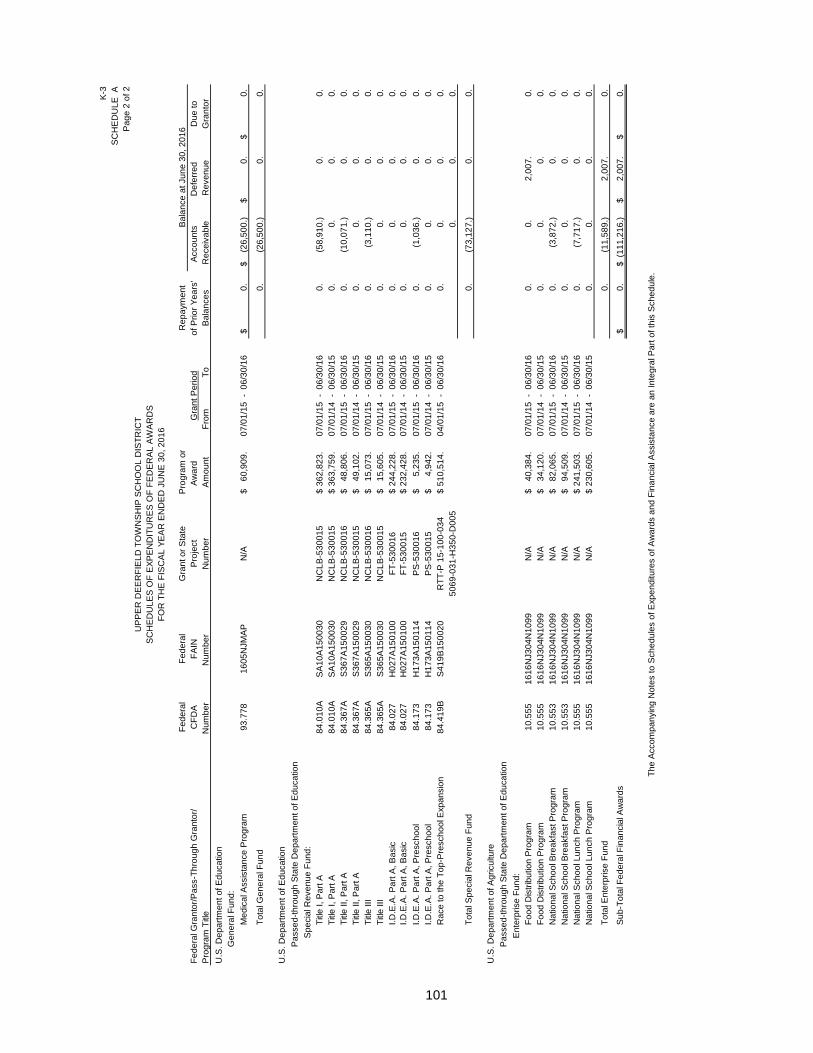
K-3 Schedule of Expenditures of Federal Awards, Schedule A 100-101
K-4 Schedule of Expenditures of State Financial Assistance, Schedule B 102-103
K-5 Notes to the Schedules of Awards and Financial Assistance 104-105
K-6 Schedule of Findings and Questioned Costs 106-109
K-7 Summary Schedule of Prior Audit Findings 110
Page 6
INTRODUCTORY SECTION
Page 7
November 18, 2016
Honorable President and
Members of the Board of Education
Upper Deerfield Township School District
Seabrook, NJ 08302
Dear Board Members:
The comprehensive annual financial report of the Upper Deerfield Township School District for
the fiscal year ended June 30, 2016, is hereby submitted. Responsibility for both the accuracy of the data
and completeness and fairness of the presentation, including all disclosures, rests with the management of
the Upper Deerfield Township Board of Education. To the best of our knowledge and belief, the data
presented in this report is accurate in all material respects and is reported in a manner designated to
present fairly the financial position and results of operations of the various funds and account groups of
the District. All disclosures necessary to enable the reader to gain an understanding of the District’s
financial activities have been included.
The comprehensive annual financial report is presented in four sections: introductory, financial,
statistical and single audit. The introductory section includes this transmittal letter, the District’s
organizational chart and a list of principal officials. The financial section includes the general-purpose
financial statements and schedules, as well as the auditor’s report thereon. The statistical section includes
selected financial and demographic information, generally presented on a multi-year basis. The District is
required to undergo an annual single audit in conformity with the provisions of the Single Audit Act
Revisions of 1996 and the U.S. Office of Management and Budget, the Uniform Administrative
Requirements for Federal Awards 2 CFR 200 and NJ Treasury Circular OMB 15-08 OMB, “Single Audit
Policy for Recipients of Federal Grants, State Grants and State Aid Payments”. Information related to
this single audit, including the auditor’s report on the internal control structure and compliance with
applicable laws and regulations and findings and recommendations, are included in the single audit
section of this report.
1) REPORTING ENTITY AND ITS SERVICES: Upper Deerfield Township School District is an
independent reporting entity within the criteria adopted by the GASB as established by GASB
Statement No. 14. All funds and account groups of the District are included in this report. The
Upper Deerfield Township Board of Education and all its schools constitute the District’s reporting
entity.
Page 8
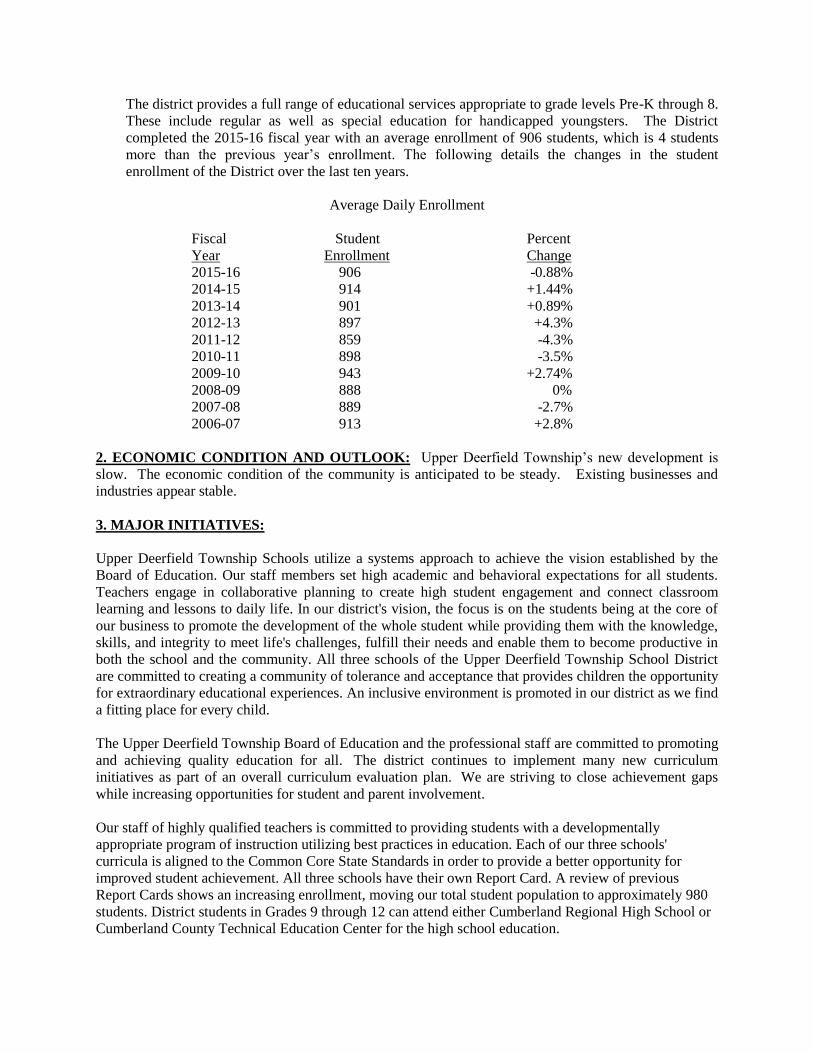
The district provides a full range of educational services appropriate to grade levels Pre-K through 8.
These include regular as well as special education for handicapped youngsters. The District
completed the 2015-16 fiscal year with an average enrollment of 906 students, which is 4 students
more than the previous year’s enrollment. The following details the changes in the student
enrollment of the District over the last ten years.
Average Daily Enrollment
Fiscal Student Percent
Year Enrollment Change
2015-16 906 -0.88%
2014-15 914 +1.44%
2013-14 901 +0.89%
2012-13 897 +4.3%
2011-12 859 -4.3%
2010-11 898 -3.5%
2009-10 943 +2.74%
2008-09 888 0%
2007-08 889 -2.7%
2006-07 913 +2.8%
2. ECONOMIC CONDITION AND OUTLOOK: Upper Deerfield Township’s new development is
slow. The economic condition of the community is anticipated to be steady. Existing businesses and
industries appear stable.
3. MAJOR INITIATIVES:
Upper Deerfield Township Schools utilize a systems approach to achieve the vision established by the
Board of Education. Our staff members set high academic and behavioral expectations for all students.
Teachers engage in collaborative planning to create high student engagement and connect classroom
learning and lessons to daily life. In our district's vision, the focus is on the students being at the core of
our business to promote the development of the whole student while providing them with the knowledge,
skills, and integrity to meet life's challenges, fulfill their needs and enable them to become productive in
both the school and the community. All three schools of the Upper Deerfield Township School District
are committed to creating a community of tolerance and acceptance that provides children the opportunity
for extraordinary educational experiences. An inclusive environment is promoted in our district as we find
a fitting place for every child.
The Upper Deerfield Township Board of Education and the professional staff are committed to promoting
and achieving quality education for all. The district continues to implement many new curriculum
initiatives as part of an overall curriculum evaluation plan. We are striving to close achievement gaps
while increasing opportunities for student and parent involvement.
Our staff of highly qualified teachers is committed to providing students with a developmentally
appropriate program of instruction utilizing best practices in education. Each of our three schools'
curricula is aligned to the Common Core State Standards in order to provide a better opportunity for
improved student achievement. All three schools have their own Report Card. A review of previous
Report Cards shows an increasing enrollment, moving our total student population to approximately 980
students. District students in Grades 9 through 12 can attend either Cumberland Regional High School or
Cumberland County Technical Education Center for the high school education.
Page 9
Once again in the classrooms this year there is an across-the-board initiative to enhance student
engagement and responsibility for learning. The staff is committed to finding ways to continue to improve
student learning as evidenced by the work of several Professional Learning Communities (PLC) focusing
on this topic. The Common Core has been embraced and is being implemented on all levels, supported by
our ever expanding technology initiatives.
In grades three through eight students have individual chromebooks while the pre-k through grade two
students are working with iPads in the classroom which will be expanded for individual iPads in the next
year. There is access to computers in each building in a personal computer lab. The Common Core is
supplemented by an opportunity to participate in Spanish in grades four through eight and all students are
exposed to a rich experience in visual and performing arts and vocal and instrumental music.
Our community of Upper Deerfield has much to be proud of because of our three schools. The entire
School District "family" maintains a great sense of pride in all that has been and continues to be
accomplished in our district and our three schools both individually and collectively. Each school
collaborates with all of its stakeholders to continue a tradition of providing our students with an excellent,
challenging education in an environment promoting and cultivating lifelong skills. Our faculty, staff, and
parents dedicate their time and energy to our schools in order to provide each student with a rewarding
and enriching educational experience. The PTO is very involved in the successful operation of the District
as they work tirelessly not only to support, but also enhance the District both financially and in helping
provide assistance to staff in a variety of activities. The Board of Education continues to provide support
of the District leadership and staff through support of programs, policy and governance.
The educational programs are designed to ensure all students are provided with opportunities to prepare
themselves for the future of their choice. We recognize that not all children learn at the same rate.
Accordingly, our three schools are structured to provide diverse learning environments which actively
engage students in critical thinking, strategic planning, hands-on learning and problem solving. All
students are active partners in their learning experience and equally accepting of their responsibility to
challenge themselves to meet with success.
Upper Deerfield Township School District is reaching out into the community and continues to develop
partnerships with various businesses and other districts to share services. This provides additional
positive support in various ways and strengthens the educational effort of the school district.
4) INTERNAL ACCOUNTING CONTROLS: Management of the District is responsible for
establishing and maintaining an internal control structure designed to ensure that the assets of the District
are protected from loss, theft or misuse and to ensure that adequate accounting data are compiled to allow
for the preparation of financial statements in conformity with generally accepted accounting principles
(GAAP). The internal control structure is designed to provide reasonable, but not absolute, assurance that
these objectives are met. The concept of reasonable assurance recognizes that: (1) the cost of a control
should not exceed the benefits likely to be derived; and (2) the valuation of costs and benefits requires
estimates and judgments by management.
As a recipient of federal and state financial assistance, the District also is responsible for ensuring that an
adequate internal control structure is in place to ensure compliance with applicable laws and regulations
related to those programs. This internal control structure is also subject to periodic evaluation by the
District management.
Page 10
As part of the District’s single audit described earlier, tests are made to determine the adequacy of the
internal control structure, including that portion related to federal and state financial assistance programs,
as well as to determine that the District has complied with applicable laws and regulations.
5)_ BUDGETARY CONTROLS: In addition to internal accounting controls, the District maintains
budgetary controls. The objective of these budgetary controls is to ensure compliance with legal
provisions embodied in the annual appropriation budget approved by the voters of the municipality.
Annual appropriation budgets are adopted for the general fund, the special revenue fund, and the debt
service fund. Project-length budgets are approved for the capital improvements accounted for in the
capital projects fund. The final budget amount as amended for the fiscal year is reflected in the financial
section.
An encumbrance accounting system is used to record outstanding purchase commitments on a line item
basis. Open encumbrances at year-end are either canceled or are included as reappropriation of fund
balance in the subsequent year. Those amounts to be reappropriated are reported as reservations of fund
balances at June 30, 2016.
6) ACCOUNTING SYSTEM AND REPORTS: The District’s accounting records reflect generally
accepted accounting principles, as promulgated by the Governmental Accounting Standards Board
(GASB). The accounting system of the District is organized on the basis of funds and account groups.
These funds and account groups are explained in “Notes to the Financial Statements”, Note 1.
7) FINANCIAL INFORMATION AT FISCAL YEAR-END: As demonstrated by the various
statements and schedules included in the financial section of this report, the District continues to meet its
responsibility for sound financial management. The following schedule presents a summary of the
general fund, special revenue fund and debt service fund revenues for the fiscal year ended June 30, 2016
and the amount and percentage of increases in relation to prior year revenues.
PERCENT INCREASE PERCENT OF
OF (DECREASE) INCREASE
REVENUE AMOUNT TOTAL FROM 2015 (DECREASE)
Local Sources $ 7,320,632. 44.37% $ 26,285. 0.36%
State Sources 7,964,013. 47.72% 119,282. 1.50%
Federal Sources 1,155,012. 4.75% 374,854. 32.45%
Total $ 16,439,657. 100.00% $ 520,421. 2.73%
The following schedule presents a summary of general fund, special revenue fund and debt service fund
expenditures for the fiscal year ended June 30, 2016 and the percentage of increases and decreases in
relation to prior year amounts.
PERCENT INCREASE PERCENT OF
OF (DECREASE) INCREASE
EXPENDITURES AMOUNT TOTAL FROM 2015 (DECREASE)
Current Expense:
Instruction $6,383,580. 39.16% $ 252,288. 3.95%
Undistributed
Expenditures: 9,072,729. 55.65% 769,787. 8.48%
Capital Outlay 326,682. 2.00% 156,156. 47.80%
Debt Service 518,976. 3.18% (16,072.) (3.10%)
Total $16,301,967. 100.00% $ 1,162,159. 7.13%
Page 12
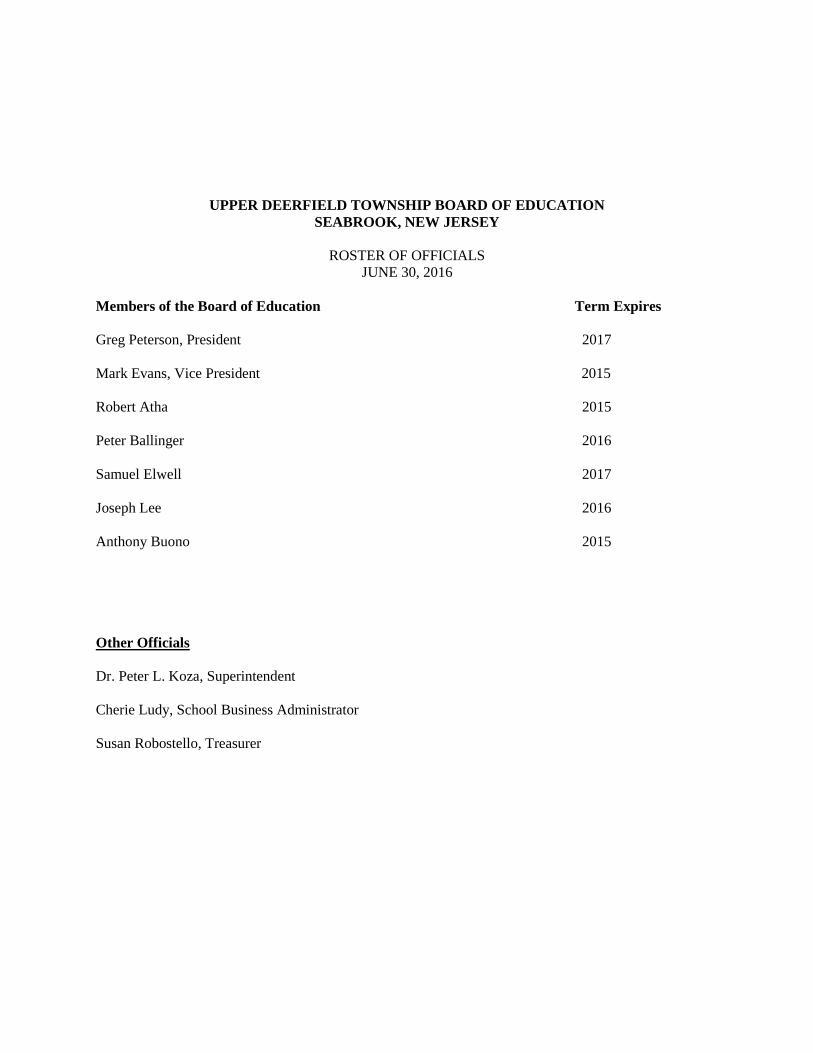
UPPER DEERFIELD TOWNSHIP BOARD OF EDUCATION
SEABROOK, NEW JERSEY
ROSTER OF OFFICIALS
JUNE 30, 2016
Members of the Board of Education Term Expires
Greg Peterson, President 2017
Mark Evans, Vice President 2015
Robert Atha 2015
Peter Ballinger 2016
Samuel Elwell 2017
Joseph Lee 2016
Anthony Buono 2015
Other Officials
Dr. Peter L. Koza, Superintendent
Cherie Ludy, School Business Administrator
Susan Robostello, Treasurer
Page 15
FINANCIAL SECTION
Page 16
INDEPENDENT AUDITOR’S REPORT
The Honorable President and
Members of the Board of Education
Upper Deerfield Township School District
County of Cumberland, New Jersey
Report on Financial Statements
We have audited the accompanying financial statements of the governmental activities, the business-type
activities, each major fund and the aggregate remaining fund information of the Board of Education of the
Upper Deerfield Township School District in the County of Cumberland, in the State of New Jersey, as of
and for the fiscal year ended June 30, 2016, and the related notes to the financial statements, which
collectively comprise the Board of Education’s basic financial statements as listed in the table of contents.
Management’s Responsibility for the Financial Statements
Management is responsible for the preparation and fair presentation of these financial statements in
accordance with accounting principles generally accepted in the United States of America; this includes the
design, implementation, and maintenance of internal control relevant to the preparation and fair
presentation of financial statements that are free from material misstatement, whether due to fraud or error.
Auditor’s Responsibility
Our responsibility is to express opinions on these financial statements based on our audit. We conducted
our audit in accordance with auditing standards generally accepted in the United States of America and the
standards applicable to financial audits contained in Government Auditing Standards, issued by the
Comptroller General of the United States; and audit requirements as prescribed by the Office of School
Finance, Department of Education, State of New Jersey. Those standards require that we plan and perform
the audit to obtain reasonable assurance about whether the financial statements are free from material
misstatement.
An audit involves performing procedures to obtain audit evidence about the amounts and disclosures in the
financial statements. The procedures selected depend on the auditor’s judgment, including the assessment
of the risks of material misstatement of the financial statements, whether due to fraud or error. In making
those risk assessments, the auditor considers internal control relevant to the entity’s preparation and fair
presentation of the financial statements in order to design audit procedures that are appropriate in the
circumstances, but not for the purpose of expressing an opinion on the effectiveness of the entity’s internal
control. Accordingly, we express no such opinion. An audit also includes evaluating the appropriateness
of accounting policies used and the reasonableness of significant accounting estimates made by
management, as well as evaluating the overall presentation of the financial statements.
We believe that the audit evidence we have obtained is sufficient and appropriate to provide a basis for our
audit opinions.
1
Page 17
INDEPENDENT AUDITOR’S REPORT
(Continued)
Opinions
In our opinion, the financial statements referred to above present fairly, in all material respects, the
respective financial position of the governmental activities, the business-type activities, each major fund
and the aggregate remaining fund information of the Upper Deerfield Township Board of Education in the
County of Cumberland, State of New Jersey, as of June 30, 2016, and the respective changes in financial
position and, where applicable, cash flows thereof for the year then ended in accordance with accounting
principles generally accepted in the United States of America.
Other Matters
Required Supplementary Information
Accounting principles generally accepted in the United States of America require that the Management’s
Discussion and Analysis, Budgetary Comparison Information, Schedules Related to Accounting and
Reporting for Pension, and Notes to the Required Supplemental Information on pages 38 through 51 and
52 be presented to supplement the basic financial statements. Such information, although not part of the
basic financial statements, is required by the Governmental Accounting Standards Board who considers it
to be an essential part of financial reporting for placing the basic financial statements in an appropriate
operational, economic, or historical context. We have applied certain limited procedures to the required
supplementary information in accordance with auditing standards generally accepted in the United States of
America, which consisted of inquiries of management about the methods of preparing the information and
comparing the information for consistency with management’s response to our inquiries, the basic financial
statements, and other knowledge we obtained during our audit of the basic financial statements. We do not
express an opinion or provide any assurance on the information because the limited procedures do not
provide us with sufficient evidence to express an opinion or provide any assurance.
Other Information
Our audit was conducted for the purpose of forming opinions on the financial statements that collectively
comprise the Upper Deerfield Township Board of Education’s basic financial statements The
accompanying schedule of expenditures of federal awards as required by Title 2 U.S Code of Federal
Regulations Part 200, Uniform Administrative Requirements, Cost Principles, and Audit Requirements
for Federal Awards, (Uniform Guidance), and schedule of expenditures of state awards as required by
New Jersey OMB’s Circular 15-08, Single Audit Policy for Recipients of Federal Grants, State Grants,
and State Aid are presented for purposes of additional analysis and are not a required part of the basic
financial statements. The accompanying introductory information, statistical sections, combining and
individual non-major fund financial statements are also presented for purposes of additional analysis and
are not a required part of the basic financial statements.
The accompanying combining and individual non-major fund financial statements, schedule of expenditures
of federal awards, and schedule of expenditure of state awards are the responsibility of management and
were derived from and relate directly to the underlying accounting and other records used to prepare the
basic financial statements. Such information has been subjected to the auditing procedures applied in the
audit of the basic financial statements and certain additional procedures, including comparing and
reconciling such information directly to the underlying accounting and other records used to prepare the
basic financial statements or to the basic financial statements themselves, and other additional procedures
in accordance with auditing standards generally accepted in the United States of America. In our opinion,
the accompanying combining and individual non-major fund financial statements, schedule of expenditures
of federal awards, and schedule expenditures of state awards are fairly stated, in all material respects, in
relation to the basic financial statements as a whole.
2
Page 18
INDEPENDENT AUDITOR’S REPORT
(Continued)
The introductory informational and statistical section have not been subjected to the auditing procedures
applied in the audit of the basic financial statements, and accordingly, we do not express an opinion or
provide any assurance on them.
Other Reporting Required by Government Auditing Standards
In accordance with Government Auditing Standards, we have also issued our report dated November 18,
2016 on our consideration of the Upper Deerfield Township Board of Education’s internal control over
financial reporting and on our tests of its compliance with certain provisions of laws, regulations, contracts,
and grant agreements and other matters. The purpose of that report is to describe the scope of our testing
of internal control over financial reporting and compliance and the results of that testing, and not to provide
an opinion on internal control over financial reporting or on compliance. That report is an integral part of
an audit performed in accordance with Government Auditing Standards in considering Upper Deerfield
Township Board of Education’s internal control over financial reporting and compliance.
Respectfully submitted,
Samuel A. Delp, Jr.
Public School Accountant, #745
Triantos & Delp
Certified Public Accountants, LLC
November 18, 2016
3
Page 19
REQUIRED SUPPLEMENTARY INFORMATION–PART I
Page 20
MANAGEMENT’S DECISION AND ANALYSIS
Page 21
Management Discussion and Analysis
This section of the Upper Deerfield Township School District’s Comprehensive Annual Financial
Report presents our discussion and analysis of the District’s financial performance during the fiscal
year ending on June 30, 2016. Please read it in conjunction with the transmittal letter at the front of this
report and the District’s financial statements, which immediately follow this section.
Overview of the Financial Statements
This annual report consists of three parts: management’s discussion and analysis (this section), the
basic financial statements, and required supplementary information. The basic financial statements
include two kinds of statements that present different views of the District:
The first two statements are district-wide financial statements that provide both short-term and
long-term information about the District’s overall financial status.
The remaining statements are fund financial statements that focus on individual parts of the
District, reporting the District’s operations in more detail than the District-wide statements.
The governmental funds statements tell how basic services such as regular and special
education were financed in the short term as well as what remains for future spending.
Proprietary funds statements offer short- and long-term financial information about activities
the District operates like businesses.
Fiduciary funds statements provide information about the financial relationships in which the
District acts solely as a trustee or agent for the benefit of others.
The financial statements also include notes that explain some of the information in the statements and
provide more detailed data. The statements are followed by a section of required supplementary
information that further explains and supports the financial statements with a comparison of the
District’s budget for the year.
Figure A-1 below summarizes the major features of the District’s financial statements, including the
portion of the District’s activities that cover and the types of information they contain. The remainder
of this overview section of management’s discussion and analysis highlights the structure and contents
of each of the statements.
Page 22
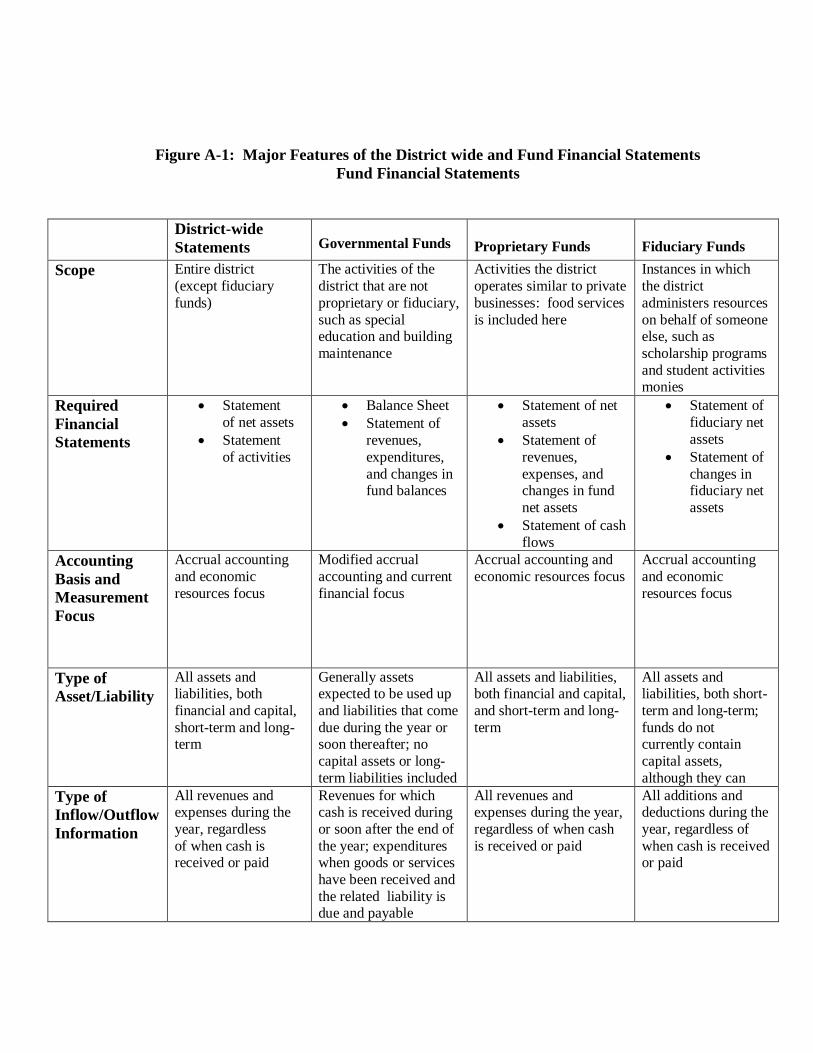
Figure A-1: Major Features of the District wide and Fund Financial Statements
Fund Financial Statements
District-wide
Statements
Governmental Funds
Proprietary Funds
Fiduciary Funds
Scope Entire district
(except fiduciary
funds)
The activities of the
district that are not
proprietary or fiduciary,
such as special education and building
maintenance
Activities the district
operates similar to private
businesses: food services
is included here
Instances in which
the district
administers resources
on behalf of someone else, such as
scholarship programs
and student activities monies
Required
Financial
Statements
Statement
of net assets
Statement
of activities
Balance Sheet
Statement of
revenues,
expenditures,
and changes in fund balances
Statement of net
assets
Statement of
revenues,
expenses, and changes in fund
net assets
Statement of cash
flows
Statement of
fiduciary net
assets
Statement of
changes in fiduciary net
assets
Accounting
Basis and
Measurement
Focus
Accrual accounting
and economic
resources focus
Modified accrual
accounting and current
financial focus
Accrual accounting and
economic resources focus
Accrual accounting
and economic
resources focus
Type of
Asset/Liability
All assets and liabilities, both
financial and capital,
short-term and long-term
Generally assets expected to be used up
and liabilities that come
due during the year or soon thereafter; no
capital assets or long-
term liabilities included
All assets and liabilities, both financial and capital,
and short-term and long-
term
All assets and liabilities, both short-
term and long-term;
funds do not currently contain
capital assets,
although they can
Type of
Inflow/Outflow
Information
All revenues and expenses during the
year, regardless
of when cash is received or paid
Revenues for which cash is received during
or soon after the end of
the year; expenditures when goods or services
have been received and
the related liability is due and payable
All revenues and expenses during the year,
regardless of when cash
is received or paid
All additions and deductions during the
year, regardless of
when cash is received or paid
Page 23
District-wide Financial Statements
The district-wide statements report information about the District as a whole using accounting methods
similar to those used by private sector companies. The statement of net position includes all of the
District’s assets and liabilities. All of the current year’s revenues and expenses are accounted for in the
statement of activities regardless of when cash is received or paid.
The two district-wide statements report the District’s net position and how it has changed. Net position
- the difference between the District’s assets and deferred outflows and liabilities and deferred inflows -
is one way to measure the District’s overall financial health or position.
Over time, increases or decreases in the District’s net position is an indicator of whether its
financial position is improving or deteriorating, respectively.
To assess the overall financial condition of the District additional non-financial factors, such as
changes in the District’s property tax base and the condition of school buildings and other
facilities should be considered.
In the District-wide financial statements, the District’s activities are divided into two categories:
Governmental activities: Most of the District’s basic services are included here, such as regular
and special education, transportation and administration. Property taxes and state aid finance
most of these activities.
Business-type activities: The District charges fees to help it cover the costs of certain services it
provides. The District’s food service program would be included here.
Fund Financial Statements
The fund financial statements provide more detailed information about the District’s funds, focusing on
its most significant or “major” funds – not the District as a whole. Funds are accounting devices the
District uses to keep track of specific sources of funding and spending on particular programs:
Some funds are required by state law and by bond covenants.
The District establishes other funds to control and manage money for particular purposes, (such
as repaying its long-term debts or completing approved capital projects) or to show that it is
properly using certain revenues (such as federal grants).
The District has four kinds of funds:
Governmental funds: Most of the District’s basic services are included in governmental funds,
which generally focus on (1) how cash and other financial assets that can readily be converted
to cash flow in and out and (2) the balances left at year-end that are available for spending.
Consequently, the governmental funds statements provide a detailed short-term view that helps
the reader determine whether there are more or fewer financial resources that can be spent in the
near future to finance the District’s programs. Because this information does not encompass the
additional long-term focus of the district-wide statements, additional information at the bottom
of the governmental funds statements explains the relationship (or differences) between them.
Proprietary funds: Services for which the District charges a fee are generally reported in
proprietary funds. Proprietary funds are reported in the same way as the district-wide
statements.
Page 24
In fact, the District’s enterprise funds (one type of proprietary fund) are the same as its
business-type activities, but provide more detail and additional information, such as cash flow.
Internal service funds: (the other kind of proprietary fund) are optional and utilized to report
activities that provide supplies and services for other District programs and activities.
Fiduciary funds: The District is the trustee, or fiduciary, for assets that belong to others, such as
the student activity fund. The District is responsible for ensuring that the assets reported in
these funds are used only for their intended purposes and by those to whom the assets belong.
The District excludes these activities from the district-wide financial statements because the
District cannot use these assets to finance its operations.
Financial Analysis of the District as a Whole
(in thousands)
Net assets. The District’s combined net assets are $9,852 on June 30, 2016 (see Table A-1). Less than
3% of the total net assets are from business-type activities. The balance of the total net assets, which is
in excess of 97%, attributable to governmental activities.
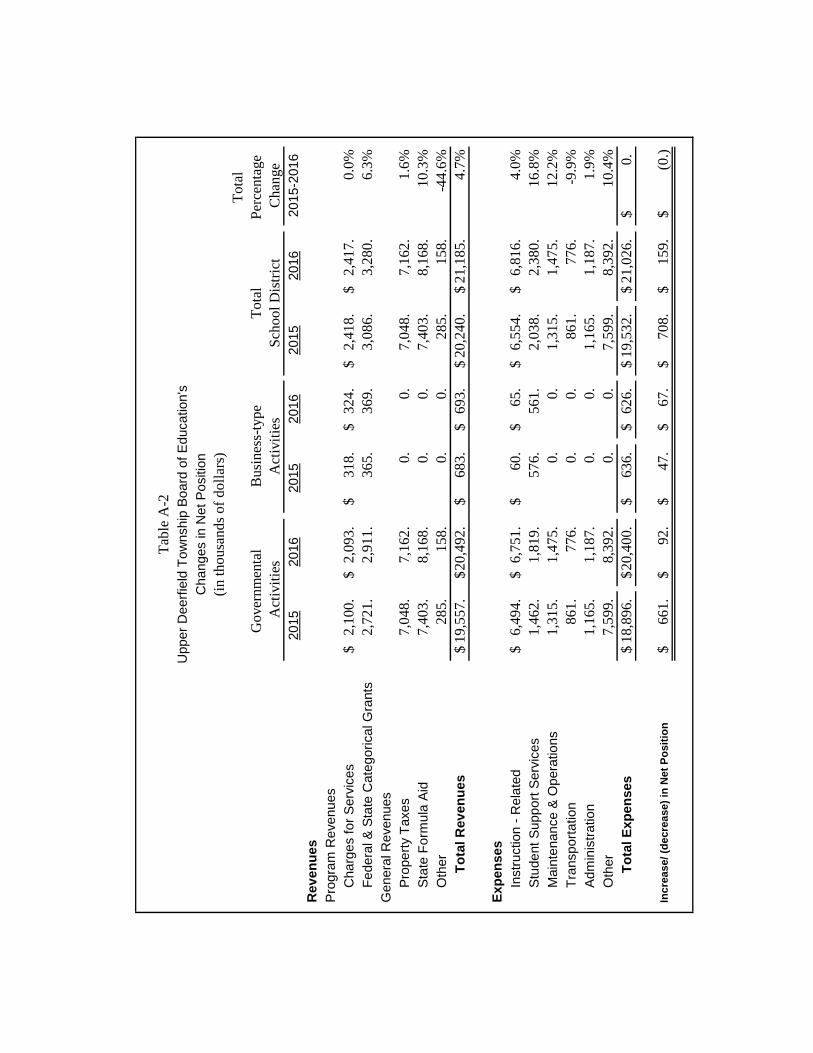
Changes in net assets. The District’s total revenues are $21,185 for the fiscal period ended June 30,
2016 (see Table A-2). Property taxes and state formula aid accounted for 72% of the District’s
revenue. 15% is derived from state and federal aid for specific programs, and the remainder, 13% from
fees charged for services and miscellaneous resources.
The District’s predominant expenses are related to educating and caring for students 44%. The purely
administrative activities of the District accounted for 6% of total costs. Salary increases due to
contractual agreements for teachers and other educational staff are included in the instruction-related
costs. Total revenues surpassed expenses increasing net assets approximately $159 last year, primarily
in governmental activities.
Governmental Activities.
Revenues for governmental activities were $20,492. Total expenses amounted to $20,400. The
increase in net position in governmental activities of $92 for 2016.
Business-Type Activities.
Revenues of the District’s business-type activities amounted to $693 and expenses were $626. Factors
contributing to these results included:
The community school had revenue in excess of expenses of approximately $35.
Food service revenue in excess of expenses of approximately $33.
Financial Analysis of the District’s Funds
(in thousands)
The strong financial performance of the District as a whole is primarily reflected in its governmental funds.
As the district completed the year, its governmental funds reported combined balances of $2,359 of which
$26 was reserved per capital improvements in the capital project fund. Miscellaneous revenue exceeded the
amounts anticipated in the 2016 budget.
Page 25
General Fund Budgetary Highlights
Over the course of the year, the District revised the annual operating budget several times. These
budget amendments were due to:
Transfers between budgetary line accounts to prevent overruns.
The District’s final budget anticipated utilizing $680 in fund balance and $205 of prior year
encumbrances to fund the appropriation plan for this fiscal period. The actual result of operations was
an increase in the general fund balance of $135.
Actual expenditures for capital outlay amounted to $327 in the Operating Fund and $119 in the Capital
Projects Fund.
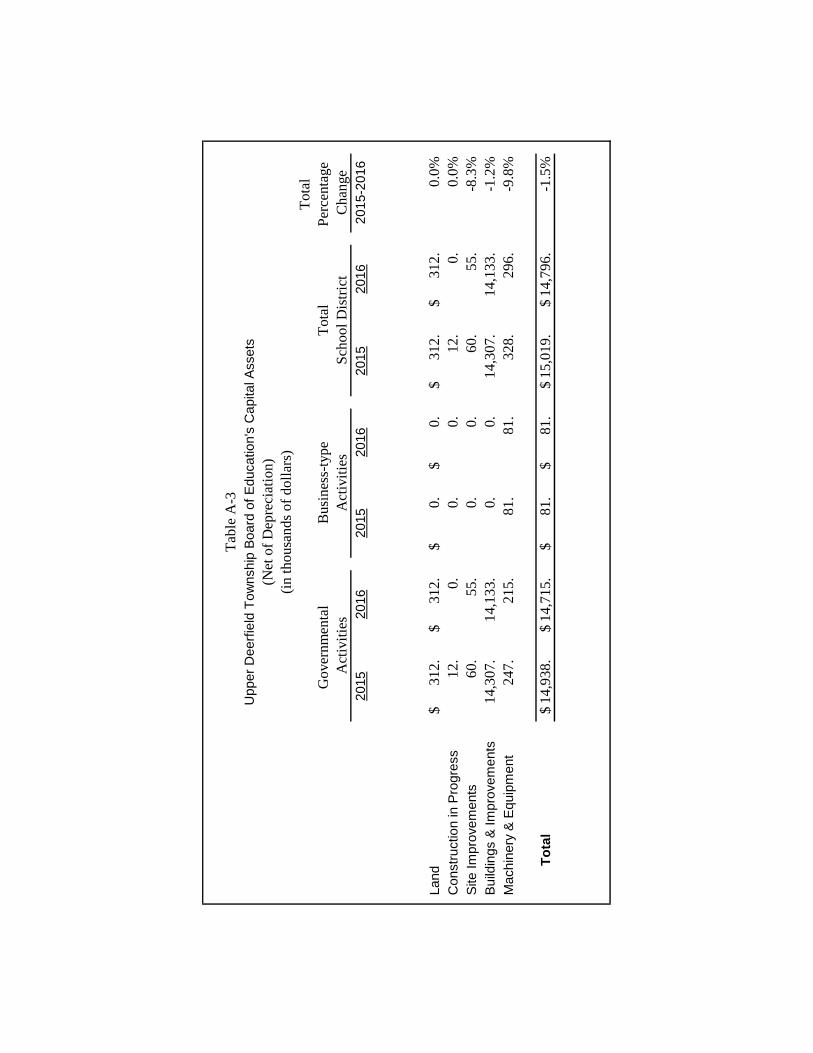
Capital Asset and Debt Administration
(in thousands)
Capital Assets
By the end of 2016, the District had invested $22,843 in a broad range of capital assets, including
school buildings, athletic facilities, computer and audiovisual equipment, and administrative offices.
(See Table A-3) (More detailed information about capital assets can be found in Note 5 to the financial
statements.) Total depreciation expenses for the year was $565 while building improvements and
additions to equipment and furniture and land amounted to $342.
Long-Term Debt
The state limits the amount of general obligation debt the District can issue to 3 percent of the
equalized valuation of all taxable property within the District. The current limit is $18,708 of which
$16,338 is available for the issuance of debt.
Factors Bearing on the District’s Future
At the time these financial statements were prepared and audited, the District was aware of the
following existing circumstances that could significantly affect its financial health in the future:
State Formula Aid for the fiscal year 2015-2016 was flat funded to the previous year. It is the
District’s hope the State will apply the CEIFA formula resulting in the distribution of aid on the
formula’s enrollment basis. By including the District in the litigation regarding the effect of not
being funded by the SFRA, the District hopes to obtain financial award in the future. The
District’s special revenue is an unpredictable revenue source. The District avails itself of every
grant opportunity to increase educational opportunities for the students.
Contacting the District’s Financial Management
This financial report is designed to provide the District’s citizens, taxpayers, customers, investors and
creditors with a general overview of the District’s finances and to demonstrate the District’s
accountability of the money it receives. If you have questions about this report or need additional
financial information, contact Cherie Bratty Assistant Superintendent for Business/Board Secretary,
Upper Deerfield Township School District, 1385 Highway 77, Seabrook, NJ 08302.
Page 26
To
tal
Per
cen
tage
Ch
ange
2015
2016
2015
2016
2015
2016
2015-2
016
Curr
ent
and O
ther
Ass
ets
2,6
66.
$
2,7
16.
$
197.
$
368.
$
2
,86
3.
$
3
,08
4.
$
7
.7%
Cap
ital
Ass
ets
14,9
38.
14,7
15.
89.
81.
15
,02
7.
14
,79
6.
-1.5
%
To
tal A
ssets
17,6
04.
$
17,4
31.
$
286.
$
449.
$
1
7,8
90
.$
1
7,8
80
.$
-0
.1%
Defe
rred
Ou
tflo
ws o
f R
eso
urc
es
560.
$
1,5
72.
$
0.
$
0.
$
0
.$
1,5
72
.$
0.0
%
Curr
ent
Lia
bil
itie
s1,0
71.
$
1,0
35.
$
33.
$
28.
$
1,1
04
.$
1,0
63
.$
-3.7
%
Noncu
rren
t L
iab
ilit
ies
7,2
30.
8,2
14.
0.
0.
7
,23
0.
8
,21
4.
1
3.6
%
To
tal L
iab
ilit
ies
8,3
01.
$
9,2
49.
$
33.
$
28.
$
8,3
34
.$
9,2
77
.$
11
.3%
Defe
rred
In
flo
ws o
f R
eso
urc
es
424.
$
223.
$
0.
$
0.
$
0
.$
22
3.
$
0
.0%
Net P
ositio
n
Inves
ted i
n C
apit
al A
sset
s
Net
of
Rel
ated
Deb
t12,1
13.
$
12,3
45.
$
89.
$
81.
$
12
,20
2.
$
12
,42
6.
$
1.8
%
Res
tric
ted
2,4
19.
2,7
16.
0.
0.
2
,41
9.
2
,71
6.
1
2.3
%
Unre
stri
cted
(5,0
93.)
(5,5
30.)
164.
240.
(4
,92
9.)
(5,2
90
.)
7.3
%
To
tal N
et
Po
sit
ion
9,4
39.
$
9,5
31.
$
253.
$
321.
$
9
,69
2.
$
9
,85
2.
$
0
.$
To
tal
Sch
oo
l D
istr
ict
Tab
le A
-1
Upper
Deerf
ield
Tow
nship
Board
of
Education's
Net P
ositio
n
(in
thousa
nds
of
doll
ars)
Gover
nm
enta
l
Act
ivit
ies
Busi
nes
s-ty
pe
Act
ivit
ies
Page 27
To
tal
Per
cen
tage
Ch
ange
2015
2016
2015
2016
2015
2016
2015-2
016
Rev
en
ues
Pro
gra
m R
evenues
Charg
es f
or
Serv
ices
2,1
00.
$
2,0
93.
$
318.
$
324.
$
2,4
18
.$
2,4
17
.$
0
.0%
Federa
l &
Sta
te C
ate
gorical G
rants
2,7
21.
2,9
11.
365.
369.
3,0
86
.
3,2
80
.
6
.3%
Genera
l R
evenues
Pro
pert
y T
axes
7,0
48.
7,1
62.
0.
0.
7
,04
8.
7
,16
2.
1
.6%
Sta
te F
orm
ula
Aid
7,4
03.
8,1
68.
0.
0.
7
,40
3.
8
,16
8.
1
0.3
%
Oth
er
285.
158.
0.
0.
2
85
.
15
8.
-44
.6%
To
tal R
ev
en
ues
19,5
57.
$
20,4
92.
$
683.
$
693.
$
20
,24
0.
$
21
,18
5.
$
4.7
%
Exp
en
ses
Instr
uction -
Rela
ted
6,4
94.
$
6,7
51.
$
60.
$
65.
$
6,5
54
.$
6,8
16
.$
4
.0%
Stu
dent S
upport
Serv
ices
1,4
62.
1,8
19.
576.
561.
2,0
38
.
2,3
80
.
1
6.8
%
Main
tenance &
Opera
tions
1,3
15.
1,4
75.
0.
0.
1
,31
5.
1
,47
5.
1
2.2
%
Tra
nsport
ation
861.
776.
0.
0.
8
61
.
77
6.
-9.9
%
Adm
inis
tration
1,1
65.
1,1
87.
0.
0.
1
,16
5.
1
,18
7.
1
.9%
Oth
er
7,5
99.
8,3
92.
0.
0.
7
,59
9.
8
,39
2.
1
0.4
%
To
tal E
xp
en
ses
18,8
96.
$
20,4
00.
$
636.
$
626.
$
19
,53
2.
$
21
,02
6.
$
0.
$
Inc
rease/
(de
cre
ase)
in N
et
Po
sit
ion
661.
$
92.
$
47.
$
67.
$
70
8.
$
15
9.
$
(0.)
$
Tab
le A
-2
To
tal
Sch
oo
l D
istr
ict
Changes in N
et P
ositio
n
Upper
Deerf
ield
Tow
nship
Board
of
Education's
(in
thousa
nds
of
doll
ars)
Gover
nm
enta
l
Act
ivit
ies
Busi
nes
s-ty
pe
Act
ivit
ies
Page 28
To
tal
Per
cen
tage
Ch
ange
2015
2016
2015
2016
2015
2016
2015-2
016
Land
312.
$
312.
$
0.
$
0.
$
3
12
.$
3
12
.$
0
.0%
Constr
uction in P
rogre
ss
12.
0.
0.
0.
1
2.
0
.
0
.0%
Site Im
pro
vem
ents
60.
55.
0.
0.
6
0.
5
5.
-8.3
%
Build
ings &
Im
pro
vem
ents
14,3
07.
14,1
33.
0.
0.
14,3
07
.
14
,13
3.
-1.2
%
Machin
ery
& E
quip
ment
247.
215.
81.
81.
32
8.
29
6.
-9
.8%
To
tal
14,9
38.
$
14,7
15.
$
81.
$
81.
$
15,0
19
.$
14
,79
6.
$
-1.5
%
Tab
le A
-3
To
tal
Sch
oo
l D
istr
ict
Upper
Deerf
ield
Tow
nship
Board
of
Education's
Capital A
ssets
(in t
housa
nds
of
doll
ars)
Gover
nm
enta
l
Act
ivit
ies
Busi
nes
s-ty
pe
Act
ivit
ies
(Net
of
Dep
reci
atio
n)
Page 29
BASIC FINANCIAL STATEMENTS
Page 30
DISTRICT-WIDE FINANCIAL STATEMENTS
Page 31
EXHIBIT A-1
Governmental
Activities
Business-Type
Activities Total
ASSETS:
Cash and Cash Equivalents 2,482,162.$ 212,832.$ 2,694,994.$
Receivables, net 233,956. 44,890. 278,846.
Inventory 0. 10,861. 10,861.
Capital assets, net 14,715,098. 80,765. 14,795,863.
Total Assets 17,431,216. 349,348. 17,780,564.
DEFERRED OUTFLOWS OF RESOURCES: 1,572,572. 0. 1,572,572.
LIABILITIES:
Accounts Payable 277,985. 25,553. 303,538.
Accounts Payable -Pension 224,761. 0. 224,761.
Interfund Payable (2,566.) 2,566. 0.
Unearned Revenue 73,237. 0. 73,237.
Accrued interest 38,711. 0. 38,711.
Noncurrent Liabilities:
Due within one year 422,827. 0. 422,827.
Due in more than one year 2,368,639. 0. 2,368,639.
Net pension liability 5,845,193. 0. 5,845,193.
Total Liabilities - 9,248,787. 28,119. 9,276,906.
DEFERRED INFLOWS OF RESOURCES: 223,152. 0. 223,152.
NET POSITION:
Invested in Capital Assets, net of related debt 12,345,098. 80,765. 12,425,863.
Restricted for:
Debt Service 670. 0. 670.
Capital Projects 634,999. 0. 634,999.
Other Purposes 2,080,393. 0. 2,080,393.
Unrestricted (5,529,312.) 240,464. (5,288,848.)
Total Net Position 9,531,848.$ 321,229.$ 9,853,077.$
JUNE 30, 2016
STATEMENT OF NET POSITION
UPPER DEERFIELD TOWNSHIP SCHOOL DISTRICT
See Accompanying Notes to the Basic Financial Statements
4
Page 32
EX
HIB
IT A
-2
Ne
t (E
xpe
nse
) R
eve
nue
S a
nd
Cha
nge
s in N
et A
sse
ts
Cha
rge
s f
or
Ope
rating G
rants
C
apita
l G
rants
G
ove
rnm
enta
lB
usin
ess-t
ype
Functio
ns/P
rogra
ms
Expe
nse
sS
erv
ice
sa
nd
Co
ntr
ibutio
ns
and
Co
ntr
ibutio
ns
Activitie
sA
ctivitie
sT
ota
l
G
ove
rnm
enta
l a
ctivitie
s:
In
str
uctio
n:
R
egula
r4
,22
2,2
25
.$
0.
$
0.
$
0.
$
(4,2
22
,22
5.)
$
0.
$
(4,2
22
,22
5.)
$
S
pe
cia
l ed
uca
tion
2,3
54
,41
6.
(2,3
54
,41
6.)
(2,3
54
,41
6.)
O
the
r spe
cia
l in
str
uction
17
4,0
65
.
(17
4,0
65
.)
(17
4,0
65
.)
S
uppo
rt s
erv
ice
s:
T
uitio
n2
03
,94
9.
(20
3,9
49
.)
(20
3,9
49
.)
S
tud
ent &
instr
uction r
ela
ted
se
rvic
es
1,6
14
,57
4.
(1,6
14
,57
4.)
(1,6
14
,57
4.)
S
cho
ol ad
min
istr
ative
se
rvic
es
50
7,4
46
.
(50
7,4
46
.)
(50
7,4
46
.)
G
ene
ral and
busin
ess a
dm
inis
tra
tive
se
rvic
es
31
5,9
93
.
(31
5,9
93
.)
(31
5,9
93
.)
C
entr
al se
rvic
es
25
0,0
54
.
(25
0,0
54
.)
(25
0,0
54
.)
A
dm
in info
te
chce
s1
13
,72
0.
(11
3,7
20
.)
(11
3,7
20
.)
P
lant o
pe
rations a
nd
ma
inte
na
nce
1,4
74
,66
1.
(1,4
74
,66
1.)
(1,4
74
,66
1.)
P
upil
tra
nspo
rta
tion
77
5,6
24
.
(77
5,6
24
.)
(77
5,6
24
.)
E
mplo
ye
e b
ene
fits
6,0
72
,73
7.
2,9
10
,86
5.
(3,1
61
,87
2.)
(3,1
61
,87
2.)
In
tere
st o
n lo
ng-t
erm
de
bt
10
2,2
80
.
(10
2,2
80
.)
(10
2,2
80
.)
T
ransfe
r to
cha
rte
r scho
ol
20
,54
9.
(20
,54
9.)
(20
,54
9.)
In
tern
al se
rvic
e f
und
2,0
93
,93
9.
2,0
92
,87
8.
(1,0
61
.)
(1,0
61
.)
S
tate
de
bt se
rvic
e a
sse
ssm
ent
10
4,6
18
.
(10
4,6
18
.)
(10
4,6
18
.)
T
ota
l go
ve
rnm
enta
l activitie
s2
0,4
00
,85
0.
2,0
92
,87
8.
2,9
10
,86
5.
0.
(15
,39
7,1
07
.)
0.
(15
,39
7,1
07
.)
B
usin
ess-t
ype
activitie
s:
F
oo
d S
erv
ice
56
0,9
45
.
22
6,2
78
.
36
9,2
15
.
0.
0.
34
,54
8.
34
,54
8.
C
ER
64
,52
8.
97
,39
0.
0.
0.
0.
32
,86
2.
32
,86
2.
T
ota
l busin
ess-t
ype
activitie
s6
25
,47
3.
32
3,6
68
.
36
9,2
15
.
0.
0.
67
,41
0.
67
,41
0.
To
tal prim
ary
go
ve
rnm
ent
21
,02
6,3
23
.$
2,4
16
,54
6.
$
3,2
80
,08
0.
$
0.
$
(15
,39
7,1
07
.)$
67
,41
0.
$
(15
,32
9,6
97
.)$
Ge
ne
ral re
ve
nue
s:
Ta
xe
s:
P
rope
rty ta
xe
s, le
vie
d f
or
ge
ne
ral purp
ose
s,n
et
6,6
44
,24
8.
$
0.
$
6,6
44
,24
8.
$
T
axe
s le
vie
d f
or
de
bt se
rvic
e5
17
,95
2.
51
7,9
52
.
Fe
de
ral a
nd
Sta
te a
id n
ot re
str
icte
d
6,7
89
,15
3.
6,7
89
,15
3.
Fe
de
ral a
nd
Sta
te a
id r
estr
icte
d
1,3
79
,45
7.
1,3
79
,45
7.
Tuitio
n r
ece
ive
d7
9,2
06
.
79
,20
6.
Inve
stm
ent e
arn
ings
4,9
91
.
25
1.
5,2
42
.
Mis
ce
llane
ous inco
me
74
,48
8.
74
,48
8.
To
tal ge
ne
ral re
ve
nue
s, spe
cia
l ite
ms, e
xtr
ao
rdin
ary
ite
ms a
nd
tra
nsfe
rs1
5,4
89
,49
5.
25
1.
15
,48
9,7
46
.
C
ha
nge
in N
et P
ositio
n9
2,3
88
.
67
,66
1.
16
0,0
49
.
Ne
t P
ositio
n—
be
gin
nin
g9
,43
9,4
60
.
25
3,5
68
.
9,6
93
,02
8.
Ne
t P
ositio
n—
end
ing
9,5
31
,84
8.
$
32
1,2
29
.$
9,8
53
,07
7.
$
UP
PE
R D
EE
RF
IEL
D T
OW
NS
HIP
SC
HO
OL
DIS
TR
ICT
ST
AT
EM
EN
T O
F A
CT
IVIT
IES
FO
R T
HE
YE
AR
EN
DE
D J
UN
E 3
0, 2
01
6
Pro
gra
m R
eve
nue
s
See
Acc
om
pan
yin
g N
ote
s to
the
Bas
ic F
inan
cial
Sta
tem
ents
5
Page 33
FUND FINANCIAL STATEMENTS
Page 34
GOVERNMENTAL FUNDS
Page 35
EXHIBIT B-1
Special Capital Debt Total
General Revenue Projects Service Permanent Governmental
Fund Fund Fund Fund Fund Funds
Assets:
Cash and cash equivalents 2,280,032.$ 0.$ 24,349.$ 1.$ 0.$ 2,304,382.$
Due from other funds 111,173. 0. 0. 670. 0. 111,843.
Receivables from other governments 42,579. 73,126. 88,086. 0. 0. 203,791.
Total assets 2,433,784.$ 73,126.$ 112,435.$ 671.$ 0.$ 2,620,016.$
Liabilities and Fund Balances:
Liabilities:
Accounts payable 79,191.$ 0.$ 0.$ 0.$ 0.$ 79,191.$
Interfund payable 0. 22,149. 86,443. 0. 0. 108,592.
Unearned revenue 0. 73,237. 0. 0. 0. 73,237.
Total liabilities 79,191. 95,386. 86,443. 0. 0. 261,020.
Fund Balances:
Restricted for:
Excess surplus-current year 760,937. 0. 0. 0. 0. 760,937.
Excess surplus -- designated for
Subsequent year's expenditures 578,289. 0. 0. 0. 0. 578,289.
Maintenance reserve 715,963. 0. 0. 0. 0. 715,963.
Capital reserve 609,007. 0. 0. 0. 609,007.
Committed to:
Other purposes 16,298. 0. 0. 0. 0. 16,298.
Assigned to:
Designated by BOE for
subsequent year's expenditures 8,906. 0. 0. 633. 0. 9,539.
Capital projects 0. 0. 25,992. 0. 0. 25,992.
Unassigned:
General fund (334,807.) 0. 0. 0. 0. (334,807.)
Special revenue fund 0. (22,260.) 0. 37. 0. (22,223.)
Total Fund balances 2,354,593. (22,260.) 25,992. 670. 0. 2,358,995.
Total liabilities and fund balances 2,433,784.$ 73,126.$ 112,435.$ 670.$ 0.$
Amounts reported for governmental activities in the statement of
net assets (A-1) are different because:
Capital assets used in governmental activities are not financial
resources and therefore are not reported in the funds. The cost
of the assets is $ 23,155,154. and the accumulated depreciation
is $ 8,440,056. (See Note 6). 14,715,098.$
Long-term liabilities, including bonds payable, are not due and
payable in the current period and therefore are not reported as
liabilities in the funds (see Note 8). (2,830,177.)
Internal service net assets (155,389.)
Pension related items in governmental funds:
Deferred outflows of resources 1,517,700.
Deferred inflows of resources (215,469.)
Pension account payable (216,962.)
Net pension liability (5,641,948.)
Total pension related items in governmental funds (4,556,679.)
Net assets of governmental activities 9,531,848.$
UPPER DEERFIELD TOWNSHIP SCHOOL DISTRICT
BALANCE SHEET
GOVERNMENTAL FUNDS
June 30, 2016
6
Page 36
EXHIBIT B-2
Special Capital Debt Total
General Revenue Projects Service Permanent Governmental
Fund Fund Fund Fund Fund Funds
REVENUES:
Local sources:
Local tax levy 6,644,248.$ 0.$ 0.$ 517,952.$ 0.$ 7,162,200.$
Tuition charges 79,206. 0. 0. 0. 0. 79,206.
Interest Earned 4,738. 0. 37. 0. 0. 4,775.
Miscellaneous 74,488. 0. 0. 0. 0. 74,488.
Total - Local Sources 6,802,680. 0. 37. 517,952. 0. 7,320,669.
State sources 7,738,445. 225,568. 59,786. 0. 0. 8,023,799.
Federal sources 60,909. 1,094,103. 0. 0. 1,155,012.
Total revenues 14,602,034. 1,319,671. 59,823. 517,952. 0. 16,499,480.
EXPENDITURES:
Current:
Regular instruction 3,911,579. 0. 0. 0. 0. 3,911,579.
Special education instruction 1,061,740. 1,236,196. 0. 0. 0. 2,297,936.
Other special instruction 174,065. 0. 0. 0. 0. 174,065.
Support services:
Tuition 203,949. 0. 0. 0. 0. 203,949.
Student & instruction related services 1,427,039. 131,055. 0. 0. 0. 1,558,094.
School administrative services 445,317. 0. 0. 0. 0. 445,317.
Other administrative services 253,864. 0. 0. 0. 0. 253,864.
Central services 250,054. 0. 0. 0. 0. 250,054.
Admin info tech 113,720. 0. 0. 0. 0. 113,720.
Plant operations and maintenance 1,457,718. 0. 0. 0. 0. 1,457,718.
Pupil transportation 775,624. 0. 0. 0. 0. 775,624.
Employee benefits 3,743,912. 249,928. 0. 0. 0. 3,993,840.
Debt service:
Principal 0. 0. 0. 410,000. 0. 410,000.
Interest and other charges 0. 0. 0. 108,976. 0. 108,976.
Capital outlay 326,682. 0. 119,497. 0. 0. 446,179.
Transfer to charter schools schools 20,549. 0. 0. 0. 0. 20,549.
Total expenditures 14,165,812. 1,617,179. 119,497. 518,976. 0. 16,421,464.
Excess (deficiency) of revenues over exp. 436,222. (297,508.) (59,674.) (1,024.) 0. 78,016.
OTHER FINANCING SOURCES (USES):
Transfers in 0. 300,476. 0. 37. 0. 300,513.
Transfers out (300,476.) 0. (37.) 0. 0. (300,513.)
Total other financing sources and uses (300,476.) 300,476. (37.) 37. 0. 0.
Net change in fund balance 135,746. 2,968. (59,711.) (987.) 0. 78,016.
Fund balance—July 1 2,218,847. (25,228.) 85,703. 1,657. 0. 2,280,979.
Fund balance—June 30 2,354,593.$ (22,260.)$ 25,992.$ 670.$ 0.$ 2,358,995.$
UPPER DEERFIELD TOWNSHIP SCHOOL DISTRICT
STATEMENT OF REVENUES, EXPENDITURES, AND CHANGES IN FUND BALANCES
GOVERNMENTAL FUNDS
FOR THE YEAR ENDED JUNE 30, 2016
See Accompanying Notes to the Financial Statements
7
Page 37
EXHIBIT B-3
UPPER DEERFIELD TOWNSHIP SCHOOL DISTRICT
RECONCILATION OF THE STATEMENT OF REVENUES, EXPENDITURES,
AND CHANGES IN FUND BALANCES OF GOVERNMENTAL FUNDS
TO THE STATEMENT OF ACTIVITIES
FOR THE YEAR ENDED JUNE 30, 2016
Total net changes in fund balances - governmental funds (from B-2) 78,016.$
Amounts reported for governmental activities in the statement of activities (A-2)
are different because:
Capital outlays are reported in governmental funds as expenditures. However, in the statement of
activities, the cost of those assets is allocated over their estimated useful lives as depreciation
expense.
This is the amount by which capital outlays exceeded depreciation in the period.
Depreciation expense (564,807.)
Capital outlays 341,561. (223,246.)
Adjustment to fixed assets
Repayment of bond principal is an expenditure in the governmental funds, but the repayment reduces
long-term liabilities in the statement of net assets and is not reported in the statement of activities.
Principal paid on bonds 410,000.
Principal paid on lease purchase 0. 410,000.
Decrease in accrued interest 6,696.
Proceeds from debt issues are a financing source in the governmental funds. They are not revenue
in the statement of activities; issuing debt increases long-term liabilities in the statement of net assets.
Proceeds of long-term debt 0.
Capital lease proceeds 0. 0.
In the statement of activities, certain operating expenses, e.g., compensated absences (vacations) are
measured by the amounts earned during the year. In the governmental funds, however, expenditures
for these items are reported in the amount of financial resources used (paid). When the earned amount
exceeds the paid amount, the difference is reduction in the reconciliation (-); when the paid amount
exceeds the earned amount the difference is an addition to the reconciliation (+). (6,111.)
Increase in pension expense (2,072,786.)
Increase in on-behalf pension payments 1,900,664.
Increase/(decrease) in internal service fund (845.)
Change in net position of governmental activities 92,388.$
See Accompanying Notes to the Financial Statements
8
Page 38
PROPRIETARY FUNDS
Page 39
EXHIBIT B-4
Governmental
Activities
Food Community Education Internal
Service and Recreation Fund Total Service Funds
ASSETS:
Current Assets:
Cash and cash equivalents 110,754.$ 102,078.$ 212,832.$ 177,780.$
Accounts receivable:
State 165. 0. 165. 0.
Federal 11,590. 0. 11,590. 0.
Other 33,124. 11. 33,135. 30,165.
Inventories 10,861. 0. 10,861. 0.
Total current assets 166,494. 102,089. 268,583. 207,945.
Noncurrent assets:
Furniture, machinery & equipment 219,216. 2,810. 222,026. 2,572.
Less accumulated depreciation (138,451.) (2,810.) (141,261.) (2,572.)
Total noncurrent assets 80,765. 0. 80,765. 0.
Total assets 247,259.$ 102,089.$ 349,348.$ 207,945.$
DEFERRED OUTFLOW OF RESOURCES: 0.$ 0.$ 0.$ 54,872.$
LIABILITIES:
Current Liabilities:
Accounts payable 25,553.$ 0.$ 25,553.$ 198,794.$
Interfund payable 2,566. 0. 2,566. 685.
Pension account payable 0. 0. 0. 7,799.
Total current liabilities 28,119.$ 0.$ 28,119.$ 207,278.$
Noncurrent liabilities:
Net pension liability 0. 0. 0. 203,245.
Total liabilities 28,119.$ 0.$ 28,119.$ 410,523.$
DEFERRED INFLOW OF RESOURCES: 0.$ 0.$ 0.$ 7,683.$
NET ASSETS:
Invested in capital assets net of
related debt 80,765. 0. 80,765. 0.
Unrestricted 138,375. 102,089. 240,464. (155,389.)
Total net assets 219,140.$ 102,089.$ 321,229.$ (155,389.)$
See Accompanying Notes to the Basic Financial Statements
UPPER DEERFIELD TOWNSHIP SCHOOL DISTRICT
STATEMENT OF NET POSITION
PROPRIETARY FUND
JUNE 30, 2016
Business-Type Activities
Enterprise Fund
9
Page 40
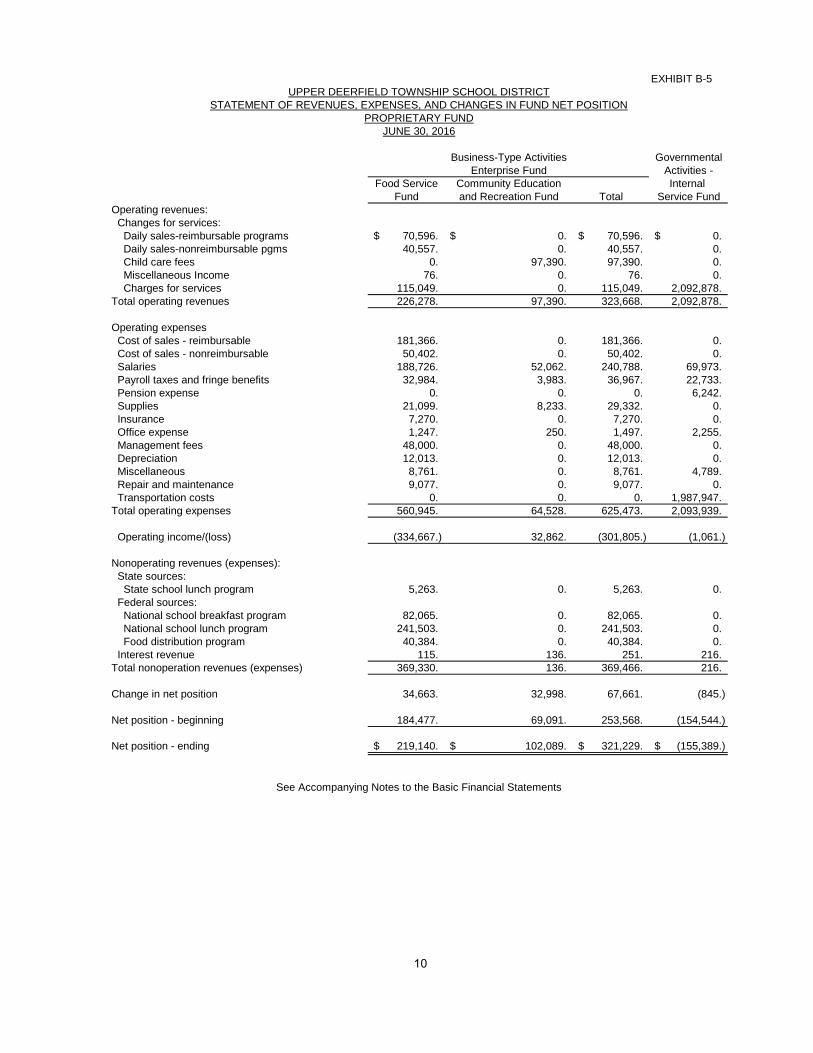
EXHIBIT B-5
Governmental
Activities -
Food Service Community Education Internal
Fund and Recreation Fund Total Service Fund
Operating revenues:
Changes for services:
Daily sales-reimbursable programs 70,596.$ 0.$ 70,596.$ 0.$
Daily sales-nonreimbursable pgms 40,557. 0. 40,557. 0.
Child care fees 0. 97,390. 97,390. 0.
Miscellaneous Income 76. 0. 76. 0.
Charges for services 115,049. 0. 115,049. 2,092,878.
Total operating revenues 226,278. 97,390. 323,668. 2,092,878.
Operating expenses
Cost of sales - reimbursable 181,366. 0. 181,366. 0.
Cost of sales - nonreimbursable 50,402. 0. 50,402. 0.
Salaries 188,726. 52,062. 240,788. 69,973.
Payroll taxes and fringe benefits 32,984. 3,983. 36,967. 22,733.
Pension expense 0. 0. 0. 6,242.
Supplies 21,099. 8,233. 29,332. 0.
Insurance 7,270. 0. 7,270. 0.
Office expense 1,247. 250. 1,497. 2,255.
Management fees 48,000. 0. 48,000. 0.
Depreciation 12,013. 0. 12,013. 0.
Miscellaneous 8,761. 0. 8,761. 4,789.
Repair and maintenance 9,077. 0. 9,077. 0.
Transportation costs 0. 0. 0. 1,987,947.
Total operating expenses 560,945. 64,528. 625,473. 2,093,939.
Operating income/(loss) (334,667.) 32,862. (301,805.) (1,061.)
Nonoperating revenues (expenses):
State sources:
State school lunch program 5,263. 0. 5,263. 0.
Federal sources:
National school breakfast program 82,065. 0. 82,065. 0.
National school lunch program 241,503. 0. 241,503. 0.
Food distribution program 40,384. 0. 40,384. 0.
Interest revenue 115. 136. 251. 216.
Total nonoperation revenues (expenses) 369,330. 136. 369,466. 216.
Change in net position 34,663. 32,998. 67,661. (845.)
Net position - beginning 184,477. 69,091. 253,568. (154,544.)
Net position - ending 219,140.$ 102,089.$ 321,229.$ (155,389.)$
See Accompanying Notes to the Basic Financial Statements
UPPER DEERFIELD TOWNSHIP SCHOOL DISTRICT
STATEMENT OF REVENUES, EXPENSES, AND CHANGES IN FUND NET POSITION
PROPRIETARY FUND
JUNE 30, 2016
Business-Type Activities
Enterprise Fund
10
Page 41
EXHIBIT B-6
Governmental
Activities -
Food Service Community Education Internal
Fund and Recreation Fund Total Service Fund
CASH FLOWS FROM OPERATING ACT.
Receipts from customers 111,221.$ 97,379.$ 208,600.$ 2,092,681.$
Payments to employees 0. (56,045.) (56,045.) (69,973.)
Payment for employee benefits 0. 0. 0. (22,732.)
Payments to suppliers (510,168.) (8,483.) (518,651.) (1,995,908.)
Other receipts/(payments) 112,323. 0. 112,323. 0.
Net cash provided by (used for) operating activities (286,624.) 32,851. (253,773.) 4,068.
CASH FLOWS FROM NONCAPITAL FINANCING ACT.
State Sources 5,286. 0. 5,286. 0.
Federal Sources 326,577. 0. 326,577. 0.
Net cash provided by (used for) non-
capital financing activities 331,863. 0. 331,863. 0.
CASH FLOWS FROM FINANCING ACTIVITIES:
Purchase of equipment (3,843.) 0. (3,843.) 0.
Interest of investments 115. 136. 251. 216.
Net cash provided by investing activites (3,728.) 136. (3,592.) 216.
Net increase (decrease) in cash and cash equilvalents 41,511. 32,987. 74,498. 4,284.
Balances - beginning of year 69,243. 69,091. 138,334. 173,496.
Balances - end of year 110,754.$ 102,078.$ 212,832.$ 177,780.$
Reconciliation of operating income (loss)
to net cash provided (used) by operating
activities:
Operating income (loss) (334,667)$ 32,862.$ (301,805.)$ (1,061)$
Adjust to reconcile operating income
(loss) to net cash provided by (used for)
operating activities
Depreciation and net amortization 12,013. 0. 12,013. 0.
Federal commodities 40,384. 0. 40,384. 0.
(Increase)/decrease in accts receivables, net (2,801.) (11.) (2,812.) (197.)
(Increase)/decrease in inventories 2,956. 0. 2,956. 0.
Increase/(decrease) in accounts payable (4,577.) 0. (4,577.) (916.)
Increase/(decrease) in pension accounts payable 0. 0. 0. 31.
Increase/(decrease) in interfund payable 68. 0. 68. 0.
(Increase)/decrease in deferred inflow 0. 0. 0. (35,437.)
Increase/(decrease) in deferred outflow 0. 0. 0. (7,021.)
Increase/(decrease) in net pension liability 0. 0. 0. 48,669.
Total adjustments 48,043. (11.) 48,032. 5,129.
Net cash provided by (used for) oper activities (286,624)$ 32,851.$ (253,773)$ 4,068.$
See Accompanying Notes to the Basic Financial Statements
UPPER DEERFIELD TOWNSHIP SCHOOL DISTRICT
STATEMENT OF CASH FLOWS
PROPRIETARY FUND
FOR YEAR ENDED JUNE 30, 2016
Business-Type Activities
Enterprise Funds
11
Page 43
EXHIBIT B-7
Unemployment CF Seabrook
Compensation Will Expendable Payroll/Agency Student
Trust Trust Fund Fund Activity
ASSETS:
Cash & Cash Equivalents 154,970.$ 1,027,243.$ 0.$ 40,755.$
Total Assets 154,970.$ 1,027,243.$ 0.$ 40,755.$
LIABILITIES:
Due to Student Groups 0.$ 0.$ 0.$ 40,755.$
Due to Payroll Withholdings 0. 0. 0. 0.
Total Liabilities 0. 0. 0.$ 40,755.$
NET POSITION:
Held in trust for unemployment claims 154,970.$
Unreserved 1,027,243.$
UPPER DEERFIELD TOWNSHIP SCHOOL DISTRICT
STATEMENT OF FIDUCIARY NET POSITION
AS OF JUNE 30, 2016
See Accompanying Notes to the Basic Financial Statements
FIDUCIARY FUNDS
12
Page 44
EXHIBIT B-8
Unemployment CF Seabrook
Compensation Will Expendable
ADDITIONS:
Contributions:
Plan Member 25,766.$ 0.$
Other 0. 88,581.
Total Contributions 25,766. 88,581.
Interest 218. 1,501.
Net Investment Earnings 218. 1,501.
DEDUCTIONS:
Unemployment Claims 1,480. 0.
Other Expenses 10,309. 111,200.
Total Deductions 11,789. 111,200.
Change in Net Position 14,195. (21,118.)
NET POSITION, JULY 1 140,775. 1,048,361.
NET POSITION, JUNE 30 154,970.$ 1,027,243.$
UPPER DEERFIELD TOWNSHIP SCHOOL DISTRICT
See Accompanying Notes to the Basic Financial Statements
FOR FISCAL YEAR ENDED JUNE 30, 2016
FIDUCIARY FUND
COMBINING STATEMENT OF CHANGES IN FIDUCIARY NET POSITION
13
Page 45
NOTES TO FINANCIAL STATEMENTS
Page 46
UPPER DEERFIELD TOWNSHIP SCHOOL DISTRICT
NOTES TO BASIC FINANCIAL STATEMENTS
FOR FISCAL YEAR ENDED JUNE 30, 2016
NOTE 1 – SUMMARY OF SIGNIFICANT ACCOUNTING POLICIES
The Upper Deerfield Township School District is an instrumentality of the State of New Jersey, established to
function as an educational institution. The Board consists of elected officials and is responsible for the fiscal control
of the District. A chief school administrator is appointed by the Board and is responsible for the administrative
control of the District.
The financial statements of the Board of Education (Board) of the Upper Deerfield Township School District
(District) have been prepared in conformity with generally accepted accounting principles (GAAP) as applied to
governmental units. The Governmental Accounting Standards Board (GASB) is the accepted standard-setting body
for establishing governmental accounting and financial reporting principles. In its accounting and financial
reporting, the District follows the pronouncements of the Governmental Accounting Standards Board (GASB). The
more significant accounting policies established in GAAP and used by the District are discussed below.
A. Reporting Entity
The Upper Deerfield Township School District is a Type II district located in the County of Cumberland, State of
New Jersey. As a Type II District, the School District functions independently through a Board of Education. The
board is comprised of nine (7) members elected to three (3) year terms. The purpose of the district is to educate
students in grades K-8. The Upper Deerfield Township School District had an enrollment at June 30, 2016 of 906
students.
The primary criterion for including activities within the District’s reporting entity, as set forth in Section 2100 of the
GASB Codification of Governmental Accounting and Financial Reporting Standards, is whether:
the organization is legally separate (can sue or be sued in their own name)
the District holds the corporate powers of the organization
the District appoints a voting majority of the organization’s board
the District is able to impose its will on the organization
the organization has the potential to impose a financial benefit/burden on the District
there is a fiscal dependency by the organization on the District
Based on the aforementioned criteria, the District had no component units.
B. Basic Financial Statements – Governmental Wide Financial Statements
The District’s basic financial statements include both government-wide (reporting the District as a whole) and fund
financial statements (reporting the District’s major funds). Both the government-wide and fund financial statements
categorize primary activities as either governmental or business type. The District’s general, special revenue, capital
projects, and debt service activities are classified as governmental activities. The District’s food service and
community education and recreation (CER) programs are classified as business-type activities.
In the governmental-wide Statement of Net Position, both the governmental and business-type activities column (a)
are presented on a consolidated basis by column, (b) and are reported on a full accrual, economic resource basis,
which recognizes all long-term assets and receivables as well as long-term debt and obligations. The District’s net
position are reported in three parts-invested in capital assets, net of related debt; restricted net position; and
unrestricted net position. The District first utilizes restricted resources to finance qualifying activities.
The government-wide Statement of Activities reports both the gross and net cost of each of the District’s functions
and business-type activities. The functions are also supported by general government revenues (property taxes,
tuition, certain intergovernmental revenues, etc.). The Statement of Activities reduces gross expenses (including
depreciation) by related program revenues, operating and capital grants. Program revenues must be directly
associated with the function (regular instruction, vocational programs, student & instruction related services, etc.) or
a business-type activity. Operating grants include operating-specific and discretionary (either operating or capital)
grants while the capital grants column reflects capital-specific grants.
14
Page 47
UPPER DEERFIELD TOWNSHIP SCHOOL DISTRICT
NOTES TO BASIC FINANCIAL STATEMENTS
FOR FISCAL YEAR ENDED JUNE 30, 2016
NOTE 1 – SUMMARY OF SIGNIFICANT ACCOUNTING POLICIES – (Continued)
B. Basic Financial Statements – Governmental Wide Financial Statements – (Continued)
The net costs (by function or business-type activity) are normally covered by general revenue (property taxes, federal
and state aid, interest income, etc.).
The government-wide focus is more on the sustainability of the District as an entity and the change in the District’s
net position resulting from the current year’s activities. Fiduciary funds are not included in the government-wide
statements.
C. Basic Financial Statements – Fund Financial Statements
The financial transactions of the District are reported in individual funds in the fund financial statements. Each fund
is accounted for by providing a separate set of self-balancing accounts that comprise its assets, liabilities, reserves,
fund equity, revenues and expenditures/expenses. The various funds are reported by generic classification within the
financial statements.
The emphasis in fund financial statements is on the major funds in either the governmental or business-type activities
categories. Nonmajor funds by a category are summarized into a single column. GASBS No. 34 sets forth minimum
criteria (percentage of the assets, liabilities, revenues or expenditures/expenses of either fund category of the
governmental and enterprise combined) for the determination of major funds. The nonmajor funds are combined in a
column in the fund financial statements. The State of New Jersey Department of Education has mandated that all
New Jersey School Districts must report all governmental funds as major, regardless of the fund meeting the GASB
definition of a major fund. However, the criteria are applied to proprietary funds.
The following fund types are used by the District:
1. Governmental Funds:
The focus of the governmental funds’ measurement (in the fund statements) is upon determination of financial
position and changes in financial position (sources, uses, and balances of financial resources) rather than upon net
income. The following is a description of the governmental funds of the District:
a. General Fund: The general fund is the general operating fund of the District. It is used to account for all
financial resources except those required to be accounted for in another fund. Included are certain
expenditures for vehicles and movable instructional or non-instructional equipment which are classified in
the Capital Outlay sub-fund.
As required by the New Jersey State Department of Education, the District includes budgeted Capital Outlay
in this fund. Generally accepted accounting principles as they pertain to governmental entities state that
General Fund resources may be used to directly finance capital outlays for long-lived improvements as long
as the resources in such cases are derived exclusively from unrestricted revenues.
Resources for budgeted capital outlay purposes are normally derived from State of New Jersey Aid, district
taxes and appropriated fund balance. Expenditures are those that result in the acquisition of or additions to
capital assets for land, existing buildings, improvements of grounds, construction of buildings, additions to
or remodeling of buildings and the purchase of built-in equipment. These resources can be transferred from
and to Current Expense by board resolution.
b. Special Revenue Fund: The Special Revenue Fund is used to account for the proceeds of specific revenue
from State and Federal Government, (other than major capital projects, Debt Service or the Enterprise
Funds) and local appropriations that are legally restricted to expenditures for specified purposes.
15
Page 48
UPPER DEERFIELD TOWNSHIP SCHOOL DISTRICT
NOTES TO BASIC FINANCIAL STATEMENTS
FOR FISCAL YEAR ENDED JUNE 30, 2016
NOTE 1 – SUMMARY OF SIGNIFICANT ACCOUNTING POLICIES – (Continued)
C. Basic Financial Statements – Fund Financial Statements – (Continued)
c. Capital Projects Fund: The capital projects fund is used to account for all financial resources to be used for
the acquisition or construction of major capital facilities (other than those financed by proprietary funds).
The financial resources are derived from temporary notes or serial bonds that are specifically authorized by
the voters as a separate question on the ballot either during the annual election or at a special election.
d. Debt Service Fund: The debt service fund is used to account for the accumulation of resources for, and the
payment of, principal and interest on bonds issued to finance major property acquisition, construction, and
improvement programs.
Fund Balances – Governmental Funds
In the fund financial statements, governmental funds report the following classifications of fund balance:
Nonspendable – includes amounts that cannot be spent because they are either not spendable in form
or are legally or contractually required to be maintained intact.
Restricted – includes amounts restricted by external sources (creditors, laws of other governments,
etc.) or by constitutional provision or enabling legislation.
Committed – includes amounts that can only be used for specific purposes. Committed fund balance
is reported pursuant to resolutions passed be the Board of Education, the District’s highest level of
decision making authority. Commitments may be modified or rescinded only through resolutions
approved by the Board of Education.
Assigned – includes amounts that the District intends to use for a specific purpose, but do not meet
the definition of restricted or committed fund balance. Under the District’s policy, amounts may be
assigned by the Business Administrator.
Unassigned – includes amounts that have not been assigned to other funds or restricted, committed
or assigned to a specific purpose within the General Fund. The District reports all amounts that meet
the unrestricted General Fund Balance Policy described below as unassigned:
The details of the fund balances are included in the Governmental Funds Balance Sheet. When an expenditure is
incurred for purposes for which both restricted or unrestricted fund balance is available, the District considers
restricted funds to been spent first. When an expenditure is incurred for which committed, assigned or unassigned
fund balance are available, the District considers amounts to have been spent first out of committed, then assigned
funds and finally unassigned funds as needed.
2. Proprietary Funds:
The focus of proprietary fund measurement is upon determination of operating income, changes in net position,
financial position, and cash flows. The generally accepted accounting principles applicable are those similar to
businesses in the private sector. The following is a description of the proprietary funds of the District:
a. Enterprise Funds are required to be used to account for operations for which a fee is charged to external
users of goods or services and the activity (a) is financed with debt that is solely secured by a pledge of the
net revenues, (b) has third party requirements that the cost of providing services, including capital costs, be
recovered with fees and charges or (c) establishes fees and charges based on a pricing policy designated to
recover similar costs. The District operates a food service fund to provide a child nutrition program for the
students of the district. The District also operates a CER program to provide educational and recreational
activities to the community.
16
Page 49
UPPER DEERFIELD TOWNSHIP SCHOOL DISTRICT
NOTES TO BASIC FINANCIAL STATEMENTS
FOR FISCAL YEAR ENDED JUNE 30, 2016
NOTE 1 – SUMMARY OF SIGNIFICANT ACCOUNTING POLICIES – (Continued)
C. Basic Financial Statements – Fund Financial Statements – (Continued)
b. Internal Service Fund are used to charge costs for certain activities to individual funds or other governmental
entities. The District’s internal service fund comprised of the Joint Pupil Transportation Program.
3. Fiduciary Funds:
Fiduciary Funds are used to report assets held in a trustee or agency capacity for others and therefore are not available
to support District programs. The reporting focus is on net position and changes in net position, and is reported using
accounting principles similar to proprietary funds.
The District’s fiduciary funds are presented in the fiduciary fund financial statements by type (pension, private
purpose and agency). Since by definition these assets are being held for the benefit of a third party (other local
governments, private parties, pension participants, etc.), and cannot be used to address activities or obligations of the
government, these funds are not incorporated into the entity-wide statements.
All fund internal activity is eliminated when carried to the Government-wide statements.
D. Basis of Accounting
Basis of accounting refers to the point at which revenues or expenditures/expenses are recognized in the accounts and
reported in the financial statements. It relates to the timing of the measurements made regardless of the measurement
focus applied.
1. Accrual:
Both governmental and business-type activities in the government-wide financial statements and the proprietary and
fiduciary fund financial statements are presented on the accrual basis of accounting. Revenues are recognized when
earned and expenses are recognized when incurred.
2. Modified Accrual:
The governmental fund financial statements are presented on the modified accrual basis of accounting. Under the
modified accrual basis of accounting, revenues are recorded when susceptible to accrual; i.e., both measurable and
available. “Available” means collectible within the current period or within 60 days after year end. Expenditures are
generally recognized under the modified accrual basis of accounting when the related liability is incurred. The
exception to this general rule is that principal and interest on general obligation long-term debt, if any, is recognized
when due.
E. Financial Statement Amounts
1. Cash and Cash Equivalents:
Cash and cash equivalents include petty cash, change funds, cash in banks and all highly liquid investments with a
maturity of three months or less at the time of purchase and are stated at cost plus accrued interest. U.S. Treasury
and agency obligations and certificates of deposit with maturities of one year or less when purchased are stated at
cost. All other investments are stated at fair value.
New Jersey school districts are limited as to the types of investments and types of financial institutions they may
invest in. New Jersey statute 18A:20-37 provides a list of permissible investments that may be purchased by New
Jersey school districts.
17
Page 50
UPPER DEERFIELD TOWNSHIP SCHOOL DISTRICT
NOTES TO BASIC FINANCIAL STATEMENTS
FOR FISCAL YEAR ENDED JUNE 30, 2016
NOTE 1 – SUMMARY OF SIGNIFICANT ACCOUNTING POLICIES – (Continued)
E. Financial Statement Amounts – (Continued)
Additionally, the District has adopted a cash management plan that requires it to deposit public funds in public
depositories protected from loss under the provisions of the Government Unit Deposit Protection Act (“GUDPA”).
GUDPA was enacted in 1970 to protect Governmental Units from a loss of funds on deposit with a failed banking
institution in New Jersey.
NJSA 17:9-41 et. seq. establishes the requirements for the security of deposits of governmental units. The statute
requires that no governmental unit shall deposit public funds in a public depository unless such funds are secured in
accordance with the Act. Public depositories include Savings and Loan institutions, banks (both state and national
banks) and savings banks the deposits of which are federally insured. All public depositories must pledge collateral,
having a market value at least equal to five percent of the average daily balance of collected public funds, to secure
the deposits of Governmental Units. If a pubic depository fails, the collateral it has pledged, plus the collateral of all
other public depositories, is available to pay the full amount of their deposits to the Governmental units.
2. Investments:
Investments, including deferred compensation and pension funds, are stated at fair value, (quoted market price or the
best available estimate). Interest earned on investments in the Capital Projects Fund is transferred to the general or
debt service fund.
3. Inventories:
Inventories and prepaid expenses, which benefit future periods, other than those recorded in the enterprise fund are
recorded as an expenditure during the year of purchase.
On district-wide financial statements and in the enterprise fund inventories are valued at cost, which approximates
market, using the first-in-first-out (FIFO) method. Prepaid expenses in the Enterprise Fund represent payments made
to vendors for services that will benefit periods beyond June 30, 2016.
4. Capital Assets:
Capital assets purchased or acquired with an original cost of $2,000 or more are reported at historical cost or
estimated historical cost. Contributed assets are reported at fair market value as of the date received. Additions,
improvements and other capital outlays that significantly extended the useful life of an asset are capitalized. Other
costs incurred for repairs and maintenance are expensed as incurred. Depreciation on all assets is provided on the
straight-line basis over the following estimated useful lives:
Buildings 20-50 years
Machinery and equipment 5-10 years
Improvements 10-20 years
Infrastructure Assets 50-65 years
Infrastructure assets include roads, parking lots, underground pipe, etc. The District includes all infrastructure assets
as depreciable assets in the financial statements.
18
Page 51
UPPER DEERFIELD TOWNSHIP SCHOOL DISTRICT
NOTES TO BASIC FINANCIAL STATEMENTS
FOR FISCAL YEAR ENDED JUNE 30, 2016
NOTE 1 – SUMMARY OF SIGNIFICANT ACCOUNTING POLICIES – (Continued)
E. Financial Statement Amounts – (Continued)
5. Revenues:
Substantially all governmental fund revenues are accrued. Property taxes are susceptible to accrual and under New
Jersey State Statutes a municipality is required to remit to its school district the entire balance of taxes in the amount
certified, prior to the end of the school year. The District records the entire approved tax levy as revenue (accrued) at
the start of the fiscal year, since the revenue is both measurable and available. Subsidies and grants to proprietary
funds, which finance either capital or current operations are reported as non-operating revenue. In respect to grant
revenues, the provider recognizes liabilities and expenses and the recipient recognizes receivables and revenue when
the applicable eligibility requirements, including time requirements are met. Resources transmitted before the
eligibility requirements are met are reported as advances by the provider and unearned revenue by the recipient.
Program revenues are reported as reductions to expenses in the statement of activities.
6. Expenditures:
Expenses are recognized when the related fund liability is incurred. Inventory costs other than those reported in the
enterprise fund are reported in the period when inventory items are purchased, rather than in the period used.
7. Compensated Absences:
Compensated absences are those absences for which employees will be paid, such as vacation, sick leave, and
sabbatical leave. A liability for compensated absences that are attributable to services already rendered, and that are
not contingent on a specific event that is outside the control of the District and its employees, is accrued as the
employees earn the rights to the benefits. Compensated absences that relate to future services, or that are contingent
on a specific event that is outside the control of the District and its employees, are accounted for in the period in
which such services are rendered or in which such events take place.
In governmental and similar trust funds, compensated absences that are expected to be liquidated with expendable
available financial resources are reported as both an expenditure and a fund liability in the fund that will pay for the
compensated absences. The remainder of the compensated absences liability is reported in the District-wide Financial
Statements as a Governmental Activity.
In proprietary and similar trust funds, compensated absences are recorded as an expense and liability of the fund that
will pay for them.
8. Interfund Activity:
Interfund activity is reported as loans, services provided, reimbursements or transfers. Loans are reported as
interfund receivables and payables as appropriate and are subject to elimination upon consolidation. Services
provided, deemed to be at market or near market rates, are treated as revenues and expenditures/expenses.
Reimbursements are when one fund incurs a cost, charges the appropriate benefitting fund and reduces its related
costs as reimbursement. All other interfund transactions are treated as transfers. Transfers between governmental or
proprietary funds are netted as part of the reconciliation to the government-wide financial statements.
19
Page 52
UPPER DEERFIELD TOWNSHIP SCHOOL DISTRICT
NOTES TO BASIC FINANCIAL STATEMENTS
FOR FISCAL YEAR ENDED JUNE 30, 2016
NOTE 1 – SUMMARY OF SIGNIFICANT ACCOUNTING POLICIES – (Continued)
E. Financial Statement Amounts – (Continued)
9. Budgets/Budgetary Control:
Annual appropriation budgets are prepared in the spring of each year for the general, special revenue, and debt
service funds. The budgets are submitted to the county office for approval and, as long as the District budget is
within State mandated CAPs, there is no public vote on the budget. If the budget exceeds State mandated CAPs, the
voters have an opportunity to approve or reject the budget at the regular election held in November. Budgets are
prepared using the modified accrual basis of accounting, except for the special revenue fund as described later. The
legal level of budgetary control is established at line item accounts within each fund. Line item accounts are defined
as the lowest (most specific) level of detail as established pursuant to the minimum chart of accounts referenced in
N.J.A.C. 6:23-2(g). Transfers of appropriations may be made by School Board resolution at any time during the
fiscal year and are subject to two-thirds majority vote by the School Board and under certain circumstances require
approval by the County Superintendent of Schools.
Formal budgetary integration into the accounting system is employed as a management control device during the
year. For governmental funds there are no substantial differences between the budgetary basis of accounting and
generally accepted accounting principles with the exception of the legally mandated revenue recognition of the last
state aid payment for budgetary purposes only and the special revenue fund as noted below. Encumbrance accounting
is also employed as an extension of formal budgetary integration in the governmental fund types. Unencumbered
appropriations lapse at fiscal year end.
The accounting records of the special revenue fund are maintained on the grant accounting budgetary basis. The
grant accounting budgetary basis differs from GAAP in that the grant accounting budgetary basis recognizes
encumbrances as expenditures and also recognizes the related revenues, whereas the GAAP basis does not. Sufficient
supplemental records are maintained to allow for the presentation of GAAP basis financial reports.
10. Tuition Receivables:
Tuition charges were established by the Boards of Education based on estimated costs. The nonresident tuition
charge for fiscal years 2015/16 was $79,206.
11. Tuition Payable:
Tuition charges for the fiscal years 15/16 were based on rates established by the receiving district. These rates are
subjected to change when the actual costs have been determined.
12. Use of Estimates:
The preparation of financial statements in conformity with generally accepted accounting principles requires
management to make estimates and assumptions that affect certain reported amounts and disclosures. Accordingly,
actual results could differ from those results.
13. Allocation of Costs:
In the government-wide statement of activities, the District has not allocated unallocated benefits to various
programs.
20
Page 53
UPPER DEERFIELD TOWNSHIP SCHOOL DISTRICT
NOTES TO BASIC FINANCIAL STATEMENTS
FOR FISCAL YEAR ENDED JUNE 30, 2016
NOTE 1 – SUMMARY OF SIGNIFICANT ACCOUNTING POLICIES – (Continued)
E. Financial Statement Amounts – (Continued)
14. Pensions
For purposes of measuring the net pension liability, deferred outflows of resources and deferred inflows of resources
related to pensions, and pension expense, information about the fiduciary net position of the Teachers’ Pension and
Annuity Fund (TPAF) and Public Employee Retirement System (PERS) and additions to/deductions from the
fiduciary net position have been determined on the same basis as they are reported by the TPAF and PERS. For this
purpose, benefits payments (including refunds of employee contributions) are recognized when due and payable in
accordance with the benefits terms. Investments are reported at fair value.
F. RECENT ACCOUNTING PRONOUNCEMENTS NOT YET EFFECTIVE
In February 2015, the Governmental Accounting Standards Board (GASB) issued Statement No. 72, “Fair Value
Measurement and Application”. This statement is effective for fiscal periods beginning after June 15, 2015 will not
have any effect on the District’s financial reporting.
In June 2015, the Governmental Accounting Standards Board (GASB) issued Statement No, 73, “Accounting and
Financial Reporting for Pension and Related Assets That Are Not Within the Scope of GASB Statement 68, and
Amendments to Certain Provisions of GASB Statement 67 and 68”. This statement is effective for fiscal periods
beginning after June 30, 2016, will not have any effect on the District’s financial reporting.
In June 2015, the Governmental Accounting Standards Board (GASB) issued Statement No. 74, “Financial Reporting
for Postemployment Benefit Plans Other Than Pension Plans”. This statement is effective for fiscal periods
beginning after June 30, 2016 establishes new accounting and financial reporting requirements for OPEB plans. It is
anticipated that this statement will not have any effect on the District’s financial reporting.
In June 2015, the Governmental Accounting Standards Board (GASB) issued Statement No. 75, “Accounting and
Financial Reporting for Postemployment Benefits Plans Other Than Pensions”. This statement is effective for fiscal
periods beginning after June 30, 2017. Although not determinable, the impact of this statement on the net position of
the entity is anticipated to be significant.
In June 2015, the Governmental Accounting Standards Board (GASB) issued Statement No. 76, “The Hierarchy of
General Accepted Accounting Principles for State and Local Governments.” This statement is effective for fiscal
periods beginning June 30, 2015, will not have any effect on the District’s financial reporting.
NOTE 2 - CASH AND CASH EQUIVALENTS AND INVESTMENTS
Cash and cash equivalents includes petty cash, change funds, cash in banks and highly liquid investments with a
maturity of three months or less at the time of purchase and are stated at cost plus accrued interest.
Investments are stated at cost, or amortized cost, which approximates market. The Board classifies U.S. Treasury
with Agency obligations and certificates of deposit, which have original maturity dates of more than three months but
less than twelve months from the date of purchase, as investments stated at cost. All other investments are stated at
fair value.
New Jersey school districts are limited as to the types of investments and types of financial institutions in which they
may invest. N.J.S.A. 18A:20-37 provides a list of permissible investments that may be purchased by New Jersey
school districts as follows:
a.) Bonds or other obligations of the United States or obligations guaranteed by the United States.
b.) Bonds or any Federal Intermediate Credit Bank, Federal Home Loan Bank, Federal National Mortgage
Agency or of any United States Bank for Cooperatives which have a maturity date not greater than
twelve months from the date of purchase.
21
Page 54
UPPER DEERFIELD TOWNSHIP SCHOOL DISTRICT
NOTES TO BASIC FINANCIAL STATEMENTS
FOR FISCAL YEAR ENDED JUNE 30, 2016
NOTE 2 - CASH AND CASH EQUIVALENTS AND INVESTMENTS – (Continued)
c.) Bonds or other obligations of the school district.
School districts are also permitted to deposit public funds in the State of New Jersey Cash Management Fund. As of
June 30, 2016, the District had no funds on deposit with the New Jersey Cash Management.
Deposits:
N.J.S.A. 17:9-41, et seq, establish requirements for the security of deposits of governmental units. The statutes
require that school districts deposit public funds in public depositories secured in accordance with the Governmental
Unit Deposit Protection Act, which is a multiple financial institution collateral pool enacted in 1970 to protect
governmental units from a loss of funds on deposit with a failed banking institution located in New Jersey, which are
insured by the Federal Deposit Insurance Corporation, the Federal Savings and Loan Insurance Corporation, or by
any other agency of the United States that insures deposits made in public depositories.
Public depositories include State or federally chartered banks, savings banks or associations located in or having a
branch office in the State of New Jersey, the deposits of which are federally insured.
All public depositories must pledge collateral, having a market value at least equal to 5% of the average daily balance
of collected public funds on deposit, to secure the deposits of Governmental Units. If a public depository fails, the
collateral it has pledged, plus the collateral of all other public depositories, is available to pay the full amount of their
deposits to Governmental Units.
All collateral must be deposited with the Federal Reserve Bank of New York, the Federal Reserve Bank of
Philadelphia, the Federal Home Loan Bank of New Jersey, or a banking institution that is a member of the Federal
Reserve System and has capital funds of not less than $25,000,000.
The school district has adopted a cash management plan that requires it to deposit public funds in public depositories
protected from loss under the Governmental Unit Deposit Protection Act and approves a list of authorized depository
institutions based on an evaluation of solicited responses and presentation of GUDPA certifications provided by the
financial institutions.
As of June 30, 2016, cash and cash equivalents in the fund financial statements of the District consisted of the
following:
Cash and Cash
Equivalents
Checking account $ 3,917,962.
TOTAL $ 3,917,962.
Custodial Credit Risk:
Custodial credit presents a risk that in the event of a bank failure, the School District’s deposits may not be returned
to it. The School District’s formal policy regarding custodial credit risk is in compliance with N.J.S.A. 17:9-41 et
seq. that the School District deposit all public funds in public depositories protected from loss under the provisions of
GUDPA Act as previously described.
The District does not place a limit on the amount that may be invested in any one issuer. As of June 30, 2016, the
District’s bank balance of $4,107,041 was insured or collateralized as follows:
Insured by Depository Insurance $ 250,000.
Collateralized under GUDPA 3,857,041.
TOTAL $4,107,041.
Interest Rate Risk
Interest rate risk is the risk that changes in interest rates will adversely affect the fair value of an investment.
22
Page 55
UPPER DEERFIELD TOWNSHIP SCHOOL DISTRICT
NOTES TO BASIC FINANCIAL STATEMENTS
FOR FISCAL YEAR ENDED JUNE 30, 2016
NOTE 2 - CASH AND CASH EQUIVALENTS AND INVESTMENTS – (Continued)
Credit Risk
Credit risk is the risk that an issuer of an investment will not fulfill its obligations. The District does not have a
policy that restricts investment choices beyond Title 18A:20-37.
NOTE 3 - CAPITAL RESERVE ACCOUNT
A capital reserve account was established by New Jersey school districts for the accumulation of funds for capital
outlay expenditures in subsequent fiscal years. The Capital Reserve Account is maintained in the General Fund and
its activity is included in the General Fund annual budget. Funds placed in the capital reserve account are restricted
to capital projects in the district’s approved Long Range Facilities Plan (LRFP). Upon submission of the LRFP to the
department, a district may deposit funds into the capital reserve at any time upon board resolution through the
transfer of undesignated, unreserved general fund balance that is anticipated in the budget certified for taxes. Post-
April, 2005 transfers must be in compliance with P.L.2005, C73(S1701). Pursuant to N.J.A.C. 6A:23A-14.1(g) the
balance in the account cannot at any time exceed the local support cost of uncompleted capital projects of $1,496,466
as shown in the approved LRFP.
The activity of the capital reserve for the July 1, 2015 to June 30, 2016 fiscal year is as follows:
Beginning Balance, July 1, 2015 $607,791.
Interest earnings 1,216.
Deposits
Approved in 2015/2016 Budget 0.
Board Resolution 0.
Withdrawals
Approved in 2015/2016 Budget 0.
Board Resolution 0.
Ending balance, June 30, 2016 $609,007.
NOTE 4 - MAINTENANCE RESERVE
The Maintenance reserve account is used to accumulate funds for the required maintenance of a facility in accordance
with the EFCFA (N.J.S.A. 18A:7G-9) as amended by P.L. 2004, c. 73 (S1701). Districts may increase the balance in
the maintenance reserve account by appropriating funds in the annual general fund budget certified for taxes
(N.J.A.C. 6A:23-2.14) or by transfer by board resolution at year end of any anticipated revenue or unexpended line
item appropriations, or both.
The activity of the maintenance reserve for the July 1, 2015 to June 30, 2016 year is as follows:
Beginning Balance July 1, 2015 $ 865,963.
2015-2016 Budget (400,000.)
Deposits – Board Resolution 250,000.
Withdrawals – Board Resolution 0.
Ending balance June 30, 2016 $ 715,963.
The June 30, 2016 maximum maintenance reserve amount is $1,049,963.
23
Page 56
UPPER DEERFIELD TOWNSHIP SCHOOL DISTRICT
NOTES TO BASIC FINANCIAL STATEMENTS
FOR FISCAL YEAR ENDED JUNE 30, 2016
NOTE 5 - FIXED ASSETS
Capital asset activity for the year ended June 30, 2016 was as follows:
Beginning
Balance
Additions
Retirements
Adjustments
Ending Balance
Governmental Activities:
Capital Assets that are not
Being Depreciated:
Land $ 312,269. $ 0. $ 0. $ 0. $ 312,269.
Construction in progress 11,687. 0. (11,687.) 0. 0.
Total Capital Assets not
being Depreciated
323,956.
0.
0.
0.
312,269.
Bldg & Bldg Improvements 21,280,352. 334,880. 0. 0. 21,615,232.
Site Improvements 696,155. 0. 0. 0. 696,155.
Machinery & Equipment 513,130. 18,368. 0. 0. 531,498.
Totals at Historical Cost 22,489,637. 353,248. 0. 0. 22,842,885.
Less: Accum. Deprec. for:
Bldg & Bldg Improvements (6,973,783.) (508,858.) 0. 0. (7,482,641.)
Site Improvements (635,905.) (4,820.) 0. 0. (640,725.)
Machinery & Equipment (265,561.) (51,129.) 0. 0. (316,690.)
Total Accum. Depreciation (7,875,249.) (564,807.) 0. 0. (8,440,056.)
Total Capital Assets
being depreciated net of
Accum. Depreciation
14,614,388.
(211,559.)
0.
0.
14,402,829.
Government Activities
Capital Assets, net
$ 14,938,344.
$ (211,559.)
$ (11,687.)
$ 0.
$ 14,715,098.
Business-type Activities:
Equipment $ 215,373. $ 3,843. $ 0. $ 0. $ 219,216.
Less Accum. Dep for:
Equipment (126,437.) (12,013.) 0. 0. (138,450.)
Business-type Activities
Capital Assets, net
$ 88,936.
$ (8,107.)
$ 0.
$ 0.
$ 80,766.
*Depreciation Expense was Charged to Governmental Functions as Follows: Instruction:
Special Education $ (310,645.)
Other Instruction (56,480.)
Support Services:
Student & Instruction Related Services (56,480.)
School Administration (62,129.)
General and Business Administrative Services (62,129.)
Plant Operations and Maintenance (16,943.)
Total Depreciation Expense $ (564,807.)
NOTE 6 - OPERATING LEASES
The District had operating leases for copying equipment during the year ended June 30, 2016. The total operating
lease payments made during the year were $20,187. The leases expire on various dates. Future minimum payments
due on the leases are as follows:
Year Amount
June 30, 2017 $15,880.
June 30, 2018 11,409.
June 30, 2019 7,957.
June 30, 2020 4,609.
June 30, 2021 3,457.
TOTAL $43,312.
24
Page 57
UPPER DEERFIELD TOWNSHIP SCHOOL DISTRICT
NOTES TO BASIC FINANCIAL STATEMENTS
FOR FISCAL YEAR ENDED JUNE 30, 2016
NOTE 7 - GENERAL LONG-TERM DEBT
During the fiscal year ended June 30, 2016, the following changes occurred in liabilities reported in the general long-
term debt account group:
Type of Debt
Balance at
06/30/15
Issued
Retired
Balance at
06/30/16
Amounts Due
Within 1 Year
Governmental Activities: Compensated Absences Payable $ 415,355. $ 6,111. $ 0. $ 421,466. $ 17,827. Bonds Payable 2,780,000. 0. (410,000.) 2,370,000. 405,000. Accrued Interest on Bonds 45,407. 0. (6,696.) 38,711. 38,711.
Total $ 3,240,762. $ 6,111. $ (416,696.) $ 2,830,177. $ 461,538.
The District has no long-term debt to be repaid from business-type activities.
A. Bonds Payable:
Bonds are authorized in accordance with State laws by the voters of the municipality through referendums. All bonds
are retired in serial installments within the statutory period of usefulness. Bonds issued by the Board are general
obligation bonds.
Principal and interest due on serial bonds outstanding is as follows:
Principal Interest Total
Year Ending June 30,
2017 $ 405,000. $ 92,904. $ 497,904.
2018 400,000. 77,028. 477,028.
2019 400,000. 61,348. 461,348.
2020 395,000. 45,668. 440,668.
2021 390,000. 30,184. 420,184.
2022 380,000. 14,896. 394,896.
$ 2,370,000. $ 322,028. $ 2,692,028.
B. Bonds Payable:
As of June 30, 2016, the Board had no authorized but not issued bonds.
C. Capital Leases Payable:
The District had no capital leases in force during the 2015-2016 year.
NOTE 8 – PENSION PLANS
Description of Plans - All required employees of the District are covered by either the Public Employees' Retirement
System or the Teachers' Pension and Annuity Fund which have been established by state statute and are administered
by the New Jersey Division of Pension and Benefits (Division). According to the State of New Jersey Administrative
Code, all obligations of both Systems will be assumed by the State of New Jersey should the Systems terminate. The
Division issues a publicly available financial report that includes the financial statements and required supplementary
information for the Public Employees Retirement System and the Teachers' Pension and Annuity Fund. These reports
may be obtained by writing to the Division of Pension and Benefits, PO Box 295, Trenton, New Jersey, 08625 or the
reports can be accessed on the internet at http://www.state.nj.us/treasury/pensions/annrptsachive.htm.
25
Page 58
UPPER DEERFIELD TOWNSHIP SCHOOL DISTRICT
NOTES TO BASIC FINANCIAL STATEMENTS
FOR FISCAL YEAR ENDED JUNE 30, 2016
NOTE 8 – PENSION PLANS – (Continued)
Teachers' Pension and Annuity Fund (TPAF)
The Teachers' Pension and Annuity Fund was established as of January 1, 1955, under the provisions of N.J.S.A.
18A:66 to provide retirement benefits, death, disability and medical benefits to certain qualified members. The
Teachers' Pension and Annuity Fund is considered a cost-sharing multiple-employer plan with a special funding
situation, as under current statute, all employer contributions are made by the State of New Jersey on behalf of the
District and the system's other related non-contributing employers. Membership is mandatory for substantially all
teachers or members of the professional staff certified by the State Board of Examiners, and employees of the
Department of Education who have titles that are unclassified, professional and certified.
Public Employees' Retirement System (PERS)
The Public Employees' Retirement System (PERS) was established as of January 1, 1955 under the provisions of
N.J.S.A. 43:15A to provide retirement, death, disability and medical benefits to certain qualified members. The
Public Employees' Retirement System is a cost-sharing multiple-employer plan. Membership is mandatory for
substantially all full-time employees of the State of New Jersey or any county, municipality, school district, or public
agency, provided the employee is not required to be a member of another state-administered retirement system or
other state or local jurisdiction.
Defined Contribution Retirement Program (DCRP)
The Defined Contribution Retirement Program (DCRP) was established as of July 1, 2007 under the provisions of
Chapter 92, P.L. 2007 and Chapter 103, P.L. 2007 (N.J.S.A. 43:15C-1 et seq.). The DCRP is a cost-sharing multiple-
employer defined contribution pension fund. The DCRP provides eligible members, and their beneficiaries with a tax-
sheltered, defined contribution retirement benefit, along with life insurance and disability coverage. Vesting and
benefit provisions are established by N. J.S.A. 43:15C-1 et. seq.
The contribution requirements of plan members are determined by state statute. In accordance with Chapter 92, P.L.
2007 and Chapter 103, P.L. 2007, plan members are required to contribute 5.5% of their annual covered salary. The
State Treasurer has the right under current law to make temporary reductions in member rates based on the existence
of surplus plan assets in the retirement system; however statute also requires the return to the normal rate when such
surplus pension assets no longer exist. In addition to the employee contributions, the School District’s contribution
amounts for each pay period are required to be transmitted to Prudential Financial not later than the fifth business day
after the date on which the employee is paid for that pay period.
Funding Policy
The contribution policy is set by N.J.S.A. 43:15A, Chapter 62, P.L. of 1994, Chapter 115, P.L. of 1997 and N.J.S.A.
18:66, and requires contributions by active members and contributing employers. Plan member and employer
contributions may be amended by State of New Jersey legislation. TPAF and PERS provide for employee
contributions of 5.5% of employees’ annual compensation, as defined. Employers are required to contribute at an
actuarially determined rate in both TPAF and PERS. The current TPAF rate is 6.92% and the PERS rate is 6.92% of
covered payroll. The School District’s contributions to TPAF for the years ending June 30, 2016, 2015 and 2014 are
shown below and paid by the State of New Jersey on behalf of the board, equal to the required contributions for each
year. The School District’s contributions to PERS for the years ending June 30, 2016, 2015 and 2014 are shown
below.
Three-Year Trend Information for PERS
Year
Funding
Annual
Pension
Cost (APC)
Percentage
Of APC
Contributed
June 30, 2016 $223,864. 100%
June 30, 2015 196,144. 100%
June 30, 2014 186,660. 100%
26
Page 59
UPPER DEERFIELD TOWNSHIP SCHOOL DISTRICT
NOTES TO BASIC FINANCIAL STATEMENTS
FOR FISCAL YEAR ENDED JUNE 30, 2016
NOTE 8 – PENSION PLANS – (Continued)
Three-Year Trend Information for TPAF
(Paid on Behalf of the District)
Year
Funding
Pension
Contribution
Post-Retirement
Medical (PRM)
Contribution
Total
Contribution
June 30, 2016 $461,127. $549,074. $1,010,201.
June 30, 2015 330,865. 525,248. 856,113.
June 30, 2014 259,974. 426,260. 686,234.
During the fiscal years ended June 30, 2016, 2015 and 2014, in accordance with NJSA 18A:66-66 the State of New
Jersey reimbursed the Board $439,556; $428,161; and $431,726; during the same fiscal years for the employer’s
share of social security contributions for TPAF members as calculated on their base salaries. These amounts, which
are not required to be budgeted, have been included in the financial statements, and the combining and individual
fund and account group statements and schedules as revenues and expenditures in accordance in GASB 27.
Vesting and Benefit Provisions - The vesting and benefit provisions for PERS are set by N.J.S.A. 43:15A and 43.3B,
and N.J.S.A. 18A:6C for TPAF. All benefits vest after eight to ten years of service, except for medical benefits that
vest after 25 years of service. Retirement benefits for age and service are available at age 60 and are generally
determined to be 1/60 of the final average salary for each year of service credit, as defined. Final average salary
equals the average salary for the final three years of service prior to retirement (or highest three years' compensation
if other than the final three years). Members may seek early retirement after achieving 25 years of service credit or
they may elect deferred retirement after achieving eight to ten years of service in which case benefits would begin the
first day of the month after the member attains normal retirement age. The TPAF and PERS provides for specified
medical benefits for members who retire after achieving 25 years of qualified service, as defined, or under the
disability provisions of the System. Members are always fully vested for their own contributions and, after three years
of service credit, become vested for 2% of related interest earned on the contributions. In the case of death before
retirement, members' beneficiaries are entitled to full interest credited to the members' accounts.
Significant Legislation Chapter 78, P.L. 2011, effective June 28, 2011 made various changes to the manner in which
the Public Employees’ Retirement System (PERS) and the Police and Firemen’s Retirement System (PFRS) operate
and to the benefit provisions of those systems.
Chapter 78’s provisions impacting employee pension and health benefits include:
New members of the PERS hired on or after June 28, 2011 (Tier 5 members) will need 30 years of creditable
service and age 65 for receipt of the early retirement benefit without a reduction of ¼ of 1% for each month
that the member is under age 65.
The eligibility age to qualify for a service retirement in the PERS is increased from age 63 to 65 for Tier 5
members.
The annual benefit under special retirement for new PFRS members enrolled after June 28, 2011 (Tier 3
members), will be 60% instead of 65% of the member’s final compensation plus 1% for each year of
creditable service over 25 years but not to exceed 30 years.
Increases in active member contribution rates. PERS active member rates increase from 5.5% of annual
compensation to 6.5% plus an additional 1% phased-in over 7 years; PFRS active member rate increase from
8.5% to 10%. For fiscal year 2012, the member contribution rates increased in October 2011. The phase-in
of the additional incremental member contribution rates for PES members will take place in July of each
subsequent fiscal year.
The payment of automatic cost-of-living adjustment (COLA) additional increases to current and future
retirees and beneficiaries is suspended until reactivated as permitted by this law.
27
Page 60
UPPER DEERFIELD TOWNSHIP SCHOOL DISTRICT
NOTES TO BASIC FINANCIAL STATEMENTS
FOR FISCAL YEAR ENDED JUNE 30, 2016
NOTE 8 – PENSION PLANS – (Continued)
New employee contribution requirements towards the cost of employer-provided health benefit coverage.
Employees are required to contribute a certain percentage of the cost of coverage. The rate of contribution is
determined based on the employee’s annual salary and the selected level of coverage. The increased
employee contributions will be phased in over a 4-year period for those employed prior to Chapter 78’s
effective date with a minimum contribution required to be at least 1.5% of salary.
In addition, this new legislation changes the method for amortizing the pension systems’ unfunded accrued
liability (from a level percent of pay method to a level dollar of pay).
Chapter 1, P.L. 2010, effective May 21, 2010, made a number of changes to the State-administered retirement
systems concerning eligibility, the retirement allowance formula, the definition of compensation, the positions eligible
for service credit, the non-forfeitable right to a pension, the prosecutor’s part of the PERS, special retirement under
the PFRS, and employer contributions to the retirement systems. Also, Chapter 1, P.L. 2010 changed the membership
eligibility criteria for new members of PERS from the amount of annual compensation to the number of hours worked
weekly. Also, it returned the benefit multiplier for new members of PERS to 1/60th from 1/55th, and it provided that
new members of PERS have the retirement allowance calculated using the average annual compensation for the last
five years of service instead of the last three years of service. New members of PERS will no longer receive pension
service credit from more than one employer. Pension service credit will be earned for the highest paid position only.
For new members of the PFRS, the law capped the maximum compensation that can be used to calculate a pension
from these plans at the annual wage contribution base for social security, and requires the pension to be calculated
using a three year average annual compensation instead of the last year’s salary. This law also closed the Prosecutors
Part of the PERS to new members and repealed the law for new members that provided a non-forfeitable right to
receive a pension based on the laws of the retirement system in place at the time 5 years of pension service credit is
attained. The law also requires the State to make its full pension contribution, defined a 1/7th of the required amount,
beginning in fiscal years 2012.
Chapter 3, P.L. 2010, effective May 21, 2010, replaced the accidental and ordinary disability retirement for new
members of the PERS with disability insurance coverage similar to that provided by the State to individuals enrolled
in the State’s Defined Contribution Retirement Program.
Chapter 92, P.L. 2007 implemented certain recommendations contained in the December 1, 2006 report of the Joint
Legislative Committee on Public Employee Benefits Reform; established a DCRP for elected and certain appointed
officials, effective July 1, 2007; the new pension loan interest rate became 4.69% per year, and an $8.00 processing
fee per loan was charged, effective January 1, 2008. The legislation also removed language from existing law that
permits the State Treasurer to reduce employer pension contributions needed to fund the Funds and Systems when
excess assets are available.
NOTE 9 – PUBLIC EMPLOYEES RETIREMENT SYSTEM (PERS)
At June 30, 2016, the District reported a liability of $5,845,193 for its proportionate share of the net pension liability.
The net pension liability was measured as of June 30, 2015, and the total pension liability used to calculate the net
pension liability was determined by an actuarial valuation as of that date. The District’s proportion of the net pension
liability was based on a projection of the District’s long-term share of contributions to the pension plan relative to the
projected contributions of all participating employers, actuarially determined. At June 30, 2015, the District’s
proportion was 0.0260388180%, which was an increase of 9.44% from its proportion measured as of June 30, 2014.
For the year ended June 30, 2016, the District recognized pension expense of $402,228. At June 30, 2016, the District
reported deferred outflows of resources and deferred inflows of resources related to PERS from the following sources:
28
Page 61
UPPER DEERFIELD TOWNSHIP SCHOOL DISTRICT
NOTES TO BASIC FINANCIAL STATEMENTS
FOR FISCAL YEAR ENDED JUNE 30, 2016
NOTE 9 – PUBLIC EMPLOYEES RETIREMENT SYSTEM (PERS) – (Continued)
Deferred Outflows
of Resources
Deferred Inflows
of Resources
Differences between expended and actual experience $ 139,446.
Changes of assumptions 627,727.
Net difference between projected and actual earnings
on pension plan investments
$ 223,152.
Changes in proportion and difference between District
contributions and proportionate share of contributions 356,774.
District contributions subsequent to the measurement date 448,625.
Total $ 1,572,572.
$ 223,152.
$448,625 reported as deferred outflows of resources related to pensions resulting from school district contributions
subsequent to the measurement date (June 30, 2015) will be recognized as a reduction of the net pension liability in
the year ended June 30, 2016. Other amounts reported as deferred outflows of resources and deferred inflows of
resources related to pensions will be recognized in pension expense as follows:
Year ended
June 30,
2017 $ 163,945.
2018 163,945.
2019 163,945.
2020 261,230.
2021 147,730.
Total $ 900,795.
Actuarial Assumptions
The collective total pension liability for the June 30, 2015 measurement date was determined by an actuarial
valuation as of July 1, 2014, which was rolled forward to June 30, 2015. This actuarial valuation used the following
actuarial assumptions:
Inflation rate
3.04 %
Salary increases:
2012-2021
2.15 – 4.40% based on age
Thereafter 3.15 – 5.40% based on age
Investment rate of return 7.90%
Mortality rates were based on the RP-2000 Combined Healthy Male and Female Mortality Tables (setback 1 year for
males and females) for service retirement and beneficiaries of former members with adjustments for mortality
improvements from the base year of 2012 based on Projection Scale AA. The RP-2000 Disabled Mortality Tables
(setback 3 years for males and setback 1 year for females) are used to value disabled retirees.
The actuarial assumptions used in the July 1, 2014 valuation were based on the results of an actuarial experience
study for the period July 1, 2008 to June 30, 2011. It is likely that future experience will not exactly conform to these
assumptions. To the extent that actual experience deviates from these assumptions, the emerging liabilities may be
higher or lower than anticipated. The more the experience deviates, the larger the impact on future financial
statements.
29
Page 62
UPPER DEERFIELD TOWNSHIP SCHOOL DISTRICT
NOTES TO BASIC FINANCIAL STATEMENTS
FOR FISCAL YEAR ENDED JUNE 30, 2016
NOTE 9 – PUBLIC EMPLOYEES RETIREMENT SYSTEM (PERS) – (Continued)
In accordance with State statute, the long-term expected rate of return on plan investments (7.90% at June 30, 2015)
is determined by the State Treasurer, after consultation with the Directors of the Division of Investments and Division
of Pensions and Benefits, the board of trustees and the actuaries. The long-term expected rate of return was
determined using a building block method in which best-estimate ranges of expected future real rates of return
(expected returns, net of pension plan investment expense and inflation) are developed for each major assets class.
These ranges are combined to produce the long-term expected rate of return by weighting the expected future real
rates of return by the target asset allocation percentage and be adding expected inflation. Best estimates of arithmetic
rates of return for each major asset class included in PERS’s target asset allocation as of June 30, 2015 are
summarized in the following table:
Asset Class
Target
Allocation
Long-Term
Expected Real
Rate of
Return
Cash 5.00% 1.04%
U.S. Treasuries 1.75% 1.64%
Investment Grade Credit 10.00% 1.79%
Mortgages 2.10% 1.62%
High Yield Bonds 2.00% 4.03%
Inflation-Indexed Bonds 1.50% 3.25%
Broad US Equities 27.25% 8.52%
Developed Foreign Equities 12.00% 6.88%
Emerging Market Equities 6.40% 10.00%
Private Equity 9.25% 12.41%
Hedge Funds/Absolute Return 12.00% 4.72%
Real Estate (Property) 2.00% 6.83%
Commodities 1.00% 5.32%
Global Debt ex US 3.50% -.0.40%
REIT 4.25% 5.12%
Discount Rate
The discount rate used to measure the total pension liability was 4.90% as of June 30, 2015. This single blended
discount rate was based on the long-term expected rate of return on pension plan investments of 7.90%, and a
municipal bond rate of 3.80% as of June 30, 2015, based on the Bond Buyer Go 20-Bond Municipal Bond Index
which includes tax-exempt general obligation municipal bonds with an average rating of AA/Aa or higher. The
projection of cash flows used to determine the discount rate assumed that contributions from plan members will be
made at the current member contribution rates and that contributions from employers will be made based on the
average of the last five years of contributions made in relation to the last five years of actuarially contributions. Based
on those assumptions, the play’s fiduciary net position was projected to be available to make projected future benefit
payments of current plan members through 2033. Therefore, the long-term expected rate of return on plan
investments was applied to projected benefits payments through 2033, and the municipal bond rate was applied to
projected benefits payments after that date in determining the total pension liability.
Sensitivity of the District’s proportionate share of the net pension liability to changes in the discount rate.
The following presents the District’s proportionate share of the net pension liability calculated using the discount rate
of 4.90%, as well as what the District’s proportionate share of the net pension liability would be if it were calculated
using a discount rate that is 1-percentage point lower (3.90%) or 1-percentage point higher (5.90%) than the current
rate:
30
Page 63
UPPER DEERFIELD TOWNSHIP SCHOOL DISTRICT
NOTES TO BASIC FINANCIAL STATEMENTS
FOR FISCAL YEAR ENDED JUNE 30, 2016
NOTE 9 – PUBLIC EMPLOYEES RETIREMENT SYSTEM (PERS) – (Continued)
1%
Decrease
(3.90%)
Current Discount
Rate
(4.90%)
1%
Increase
(5.90%)
District’s proportionate share of
the net pension liability
$ 7,264,860. $ 5,845,193. $ 4,654,955.
Pension plan fiduciary net position.
Detailed information about the pension plan’s fiduciary net position is available in the separately issued PERS
financial report.
NOTE 10 – TEACHERS’ PENSION AND ANNUITY FUND (TPAF)
At June 30, 2016, the District reported a liability for its proportionate share of the net pension liability that reflected a
reduction for State pension support provided to the District. The amount recognized by the District as its
proportionate share of the net pension liability, the related State support, and the total portion of the net pension
liability that was associated with the District were as follows:
District's proportionate share of the net pension liability
$ 0.
State's proportionate share of the net position liability
associated with the District
38,680,476.
Total
$ 38,680,476.
The net pension liability was measured as of June 30, 2015 and the total pension liability to calculate the net pension
liability was determined by an actuarial valuation as of that date. The District’s proportion of the net pension liability
was based on a projection of the District’s long-term share of contributions to the pension plan relative to the
projected contributions of all participating school districts and the State, actuarially determined. At June 30, 2015, the
District’s proportion was 0.00%, which was no change from its proportion measured as of June 30, 2014.
For the year ended June 30, 2016, the District recognized pension expense of $2,361,791 and revenue of $2,361,791
for support provided by the State.
Although the district does not report net pension liability or deferred outflows or inflows related to the TPAF, the
following schedule illustrates the collective net pension liability and deferred items and the State’s portion of the net
pension liability associated with the district. The collective amounts are the total of all New Jersey local governments
participating in the TPAF plan.
06/30/2015 0630/2014
Collective deferred outflows of resources
$ 7,522,890,856. $ 2,306,623,861.
Collective deferred inflows of resources
623,365,110. 1,763,205,593.
Collective net pension liability (nonemployer-
State of New Jersey
63,204,270,305.
53,446,745,367.
State’s portion of the net pension liability that
was associated with the district
38,680,476. 32,845,085.
State’s portion of the net pension liability that
was associated with the district as a percentage
of the collective net pension liability 0.0611991492%
0.061454%
31
Page 64
UPPER DEERFIELD TOWNSHIP SCHOOL DISTRICT
NOTES TO BASIC FINANCIAL STATEMENTS
FOR FISCAL YEAR ENDED JUNE 30, 2016
NOTE 10 – TEACHERS’ PENSION AND ANNUITY FUND (TPAF) – (Continued)
Actuarial assumptions
The total pension liability in the June 30, 2015 measurement date was determined by an actuarial valuation as of July
1, 2014, which was rolled forward to June 30, 2015. This actuarial valuation used the following actuarial
assumptions, applied to all periods in the measurement:
Inflation rate
2.50%
Salary increases:
2012-2021
Varied based on experience
Thereafter Varied based on experience
Investment rate of return 7.90%
Mortality rates were based on the RP-2000 Health Annuitant Mortality Table for Males or Females, as appropriate,
with adjustments for mortality improvements based on Scale AA. Pre-retirement mortality improvements for active
members are projected using Scale AA from the base year of 2000 until the valuation date plus 15 years to account for
future mortality improvement. Post-retirement mortality improvements for non-disabled annuitants are projected
using Scale AA from the base year of 2000 for males and 2003 for females until the valuation date plus 7 years to
account for future mortality improvement.
The actuarial assumptions used in the July 1, 2014 valuation were based on the results of an actuarial experience
study for the period July 1, 2009 to June 30, 2012.
Long-Term Expected Rate of Return
In accordance with State statute, the long-term expected rate of return on plan investments (7.90% at June 30, 2015)
is determined by the State Treasurer, after consultation with the Directors of the Division of Investments and Division
of Pensions and Benefits, the board of trustees and the actuaries. The long-term expected rate of return was
determined using a building block method in which best-estimates ranges of expected future real rates of return
(expected returns, net of pension plan investment expense and inflation) are developed for each major asset class.
These ranges are combined to produce the long-term expected rate of return by weighting the expected future real rate
of return by target asset allocation percentage and by adding expected inflation. Best estimate of arithmetic real rates
of return for each major asset class included in TPAF’s target asset allocation as of June 30, 2015 are summarized in
the following table:
32
Page 65
UPPER DEERFIELD TOWNSHIP SCHOOL DISTRICT
NOTES TO BASIC FINANCIAL STATEMENTS
FOR FISCAL YEAR ENDED JUNE 30, 2016
NOTE 10 – TEACHERS’ PENSION AND ANNUITY FUND (TPAF) – (Continued)
Asset Class
Target
Allocation
Long-Term
Expected Real
Rate of
Return
U,S, Cash 5.00% 0.53%
U.S. Government Bonds 1.75% 1.39%
U.S. Credit Bonds 13.50% 2.72%
U.S. Mortgages 2.10% 2.54%
U.S. Inflation-Indexed Bonds 1.50% 1,47%
U.S. High Yield Bonds 2.00% 4.57%
U.S. Equity Market 27.25% 5.63%
Foreign-Developed Equity 12.00% 6.22%
Emerging Market Equity 6.40% 8.46%
Private Real Estate Property 4.25% 3.97%
Timber 1.00% 4.09%
Farmland 1.00% 4.61%
Private Equity 9.25% 9.15%
Commodities 1.00% 3,58%
Hedge Funds - MultiStrategy 4.00% 4.59%
Hedge Funds – Equity Hedge 4.00% 5.68%
Hedge Funds - Distressed 4.00% 4.30%
Discount rate
The discount rate used to measure the total pension liability was 4.13% as of June 30, 2015. This single blended
discount rate was based on the long-term expected rate of return on pension plan investments of 7.90%, and a
municipal bond rate of 3.29% and 4.63% as of June 30, 2014 and 2013, respectively, based on the Bond Buyer Go 20-
Bond Municipal Bond Index which includes tax-exempt general obligation municipal bonds with an average rating of
AA/Aa or higher. The projection of cash flows used to determine the discount rate assumed that contributions from
plan members will be made at the current member contribution rates and that contributions from employers will be
made based on the average of the last five years of employers’ contribution. Based on those assumptions, the plan’s
fiduciary net position was projected to be available to make projected future benefit payments of current plan
members through 2027. Therefore, the long-term expected rate of return on plan investments was applied to projected
benefit payments through 2027, and the municipal bond rate was applied to projected benefit payments after that date
in determining the total pension liability.
Sensitivity of the Net Pension Liability to Changes in the Discount Rate
The following presents the net pension liability of the State as of June 30, 2015 calculated using the discount rate as
disclosed above as well as what the State’s net pension liability would be if it was calculated using a discount rate that
is 1-percentage point lower or 1-percentage-point higher than the current rate:
At 1%
Decrease (3.13%)
At current
discount
rate (4.13%)
At 1%
Increase (5.13%)
$ 75,559,915,440 63,577,864,440 53,254,610,440
Pension plan fiduciary net position.
Detailed information about the pension plan’s fiduciary net position is available in the separately issued TPAF
financial report.
33
Page 66
UPPER DEERFIELD TOWNSHIP SCHOOL DISTRICT
NOTES TO BASIC FINANCIAL STATEMENTS
FOR FISCAL YEAR ENDED JUNE 30, 2016
NOTE 11- POST RETIREMENT BENEFITS
P.L. 1987, c. 384 and P.L. 1990, c.6 required Teachers’ Pensions and Annuity Fund (TPAF) and the Public
Employees’ Retirement System (PERS), respectively, to fund post-retirement medical benefits for those State
employees who retire after accumulating 25 years of credited service or on a disability retirement. P.L. 2007, c.103
amended the law to eliminate the funding of post-retirement medical benefits through the TPAF and PERS. It
created separate funds outside of the pension plans for the funding and payment of post-retirement medical benefits
for retired state employees and retired educational employees. As of June 30, 2015, there were 107,314 retirees
receiving post-retirement medical benefits, and the State contributed $1.25 billion on their behalf. The cost of these
benefits is funded through contributions by the State in accordance with P.L. 1994, c.62. Funding of post-retirement
medical benefits changed from a pre-funding basis to a pay-as-you-go basis beginning in Fiscal Year 1994.
The State is also responsible for the cost attributable to P.L. 1992, c.126, which provides employer paid health
benefits to members of PERS, and the Alternate Benefit Program who retired from a board of education or county
college with 25 years of service. The State paid $214.1 million toward Chapter 126 benefits for 19,056 eligible
retired members in Fiscal Year 2015.
GASB statement #45 requires certain disclosures relating to governmental entities obligations for other post-
employment benefits (OPEB), which are post-employment benefits other than pensions. The District does not provide
post-employment benefits other than pension. Healthcare provided to eligible TPAF and PERS board of education
retirees through the NJ State Health Benefits Program are paid by the State of New Jersey and as such, no district
OPEB liability exists.
The School Employees Health Benefits Program (SEHBP) Act is found in New Jersey Statutes Annotated, Title 52,
article 17.25 et.seq. Rules governing the operation and administration of the program are found in Title 17, Chapter
9 of the New Jersey Administrative Code. The State of New Jersey Division of Pensions and Benefits issues a
publicly available financial report that includes financial statements and required supplementary information for
SEHBP. That report may be obtained from the Treasury website at:
http://www.nj.gov/treasury/pensions/pdf/financial/2015divisioncombined.pdf
NOTE 12 - COMPENSATED ABSENCES
The District accounts for compensated absences (e.g., unused vacation, sick leave) as directed by Government
Accounting Standards Board Statement No. 16 (GASB 16), “Accounting for Compensated Absences”. A liability for
compensated absences attributable to services already rendered and not contingent on a specific event that is outside
the control of the employer and employee is accrued as employees earn the rights to the benefits.
District employees are granted varying amounts of vacation and sick leave in accordance with the District’s personnel
policy. Upon termination, employees are paid for accrued vacation. The District’s policy permits employees to
accumulate unused sick leave and carry forward the full amount to subsequent years. Upon retirement employees
shall be paid by the District for the unused sick leave in accordance with the District’s agreements with the various
employee unions.
The liability for vested compensated absences of the governmental activities is recorded as long-term debt in the
district-wide statements. The current portion of the compensated absences balance is not considered material to the
applicable funds total liabilities, and therefore, is not shown separately from the long-term liability balance of
compensated absences.
The liability for vested compensated absences of the proprietary fund types is recorded within those funds as the
benefits accrue to employees. As of June 30, 2016, a liability existed for compensated absences in the Food Service
Fund in the amount of $0.
34
Page 67
UPPER DEERFIELD TOWNSHIP SCHOOL DISTRICT
NOTES TO BASIC FINANCIAL STATEMENTS
FOR FISCAL YEAR ENDED JUNE 30, 2016
NOTE 13 - DEFERRED COMPENSATION
The Board offers its employees a choice of the following deferred compensation plans created in accordance with
Internal Revenue Code Section 403(b). The plans, which are administered by the entities listed below, permits
participants to defer a portion of their salary until future years. Amounts deferred under the plans are not available to
employees until termination, retirement, death or unforeseeable emergency. The plan administrators are as follows:
GWN Marketing
NOTE 14 - RISK MANAGEMENT
The District is exposed to various types of loss related to torts; theft of, damage to, and destruction of assets; errors
and omissions; injuries to employees; and natural disasters.
Property and Liability Insurance – The District maintains commercial insurance coverage for property, liability,
student accident, and surety bonds. A complete schedule of insurance coverage can be found in the Statistical Section
of this Comprehensive Annual Financial Report.
New Jersey Unemployment Compensation Insurance – The District has elected to fund its New Jersey
Unemployment Compensation Insurance under the “Benefit Reimbursement Method”. Under this plan, the District is
required to reimburse the New Jersey Unemployment Trust Fund for benefits paid to its former employees and
charged to its account with the State. The District is billed quarterly for amounts due to the State. The following is a
summary of District contributions, employee contributions, reimbursements to the State for benefits paid and the
ending balance of the District’s expendable trust fund for the current and previous two years:
District Employee Interest Amount Ending
Fiscal Year Contributions Contributions Income Reimbursed Balance
2015-2016 $0. $25,766. $218. $11,789. $154,970.
2014-2015 0. 24,792. 554. 34,150. 140,775.
2013-2014 0. 25,255. 673. 40,789. 149,579.
NOTE 15 - INTERFUND RECEIVABLES AND PAYABLES
The following interfund balances remained on the balance sheet at June 30, 2016.
Interfund Interfund
Fund Receivable Payable
General Fund $ 111,173. $ 0.
Special Revenue Fund 0. 22,149.
Capital Projects Fund 0. 86,433.
Debt Service Fund 670. 0.
Enterprise Fund 0. 2,566.
Internal Service Fund 0. 685.
$111,843. $111,843.
The balances resulted from the time lag between the dates that:
1. Interfund goods and services are provided or reimbursable expenditures occur;
2. Transactions are recorded in the accounting system, and;
3. Payments between funds are made.
The amount due from the Special Revenue Fund to the General Fund is the result of grant expenditures being paid in
advance of the receipt of grant funds.
The amount due from the Capital Projects Fund to the Debt Service Fund is a result of transferring the interest earned
in the Capital Projects Fund.
35
Page 68
UPPER DEERFIELD TOWNSHIP SCHOOL DISTRICT
NOTES TO BASIC FINANCIAL STATEMENTS
FOR FISCAL YEAR ENDED JUNE 30, 2016
NOTE 16 - CONTINGENT LIABILITIES
The Board is involved in several claims and lawsuits incidental to its operation. In the opinion of the administration
and legal counsel, the ultimate resolution of these matters will not have a material adverse effect on the financial
position of the District.
NOTE 17 - CALCULATION OF EXCESS SURPLUS
In accordance with N.J.S.A. 18A:7F-7, as amended by P.L. 2004, c.73 (S1701), the designation for Reserved Fund
Balance – Excess Surplus is a required calculation pursuant to the New Jersey Comprehensive Educational
Improvement and Financing Act of 1996 (CEIFA). New Jersey school districts are required to reserve General Fund
fund balance at the fiscal year end of June 30, if they did not appropriate a required minimum amount as budgeted
fund balance in their subsequent years’ budget. The excess fund balance at June 30, 2016 is $1,339,226.
NOTE 18 - DEFICIT FUND BALANCES
The District has a deficit fund balances of $0 in the General Fund and $(22,260) in the Special Revenue Fund as of
June 30, 2016 as reported in the fund statements (modified accrual basis). N.J.S.A. 18A:22-44.2 provides that in the
event a state school aid payment is not made until the following school budget year, districts must record the delayed
one or more June state aid payment as revenue, for budget purposes only, in the current school budget year. The bill
provides legal authority for school districts to recognize this revenue in the current budget year. For
intergovernmental transactions, GASB Statement No. 33 requires that recognition (revenue, expenditure, asset,
liability) should be in symmetry, i.e., if one government recognizes an asset, the other government recognizes a
liability. Since the State is recording the June state aid payment(s) in the subsequent fiscal year, the school district
can not recognize the June state aid payment(s) on the GAAP financial statements until the year the State records the
payable. Due to the timing difference of recording the June state aid payment(s), the General and Special Revenue
Fund balance deficit does not alone indicate the district is facing financial difficulties.
Pursuant to N.J.S.A. 18A:22-44.2 any negative unreserved, undesignated general fund balance that is reported as a
direct result from a delay in the June payment(s) of state aid until the following fiscal year, is not considered in
violation of New Jersey statute and regulation nor in need of corrective action. The District deficit in the GAAP
funds statements of $(22,260) is equal to (or) is less than the last state aid payments.
NOTE 19 - FUND BALANCE
NONSPENDABLE
As stated in Note 1, the nonspendable fund balance classification includes amounts that cannot be spent because they
are either not in spendable form or are legally or contractually required to be maintained intact. There are no
nonspendable fund balances of the School district as of June 30, 2016.
RESTRICTED
As stated in Note 1, the restricted fund balance classification includes amounts that are restricted to specific purposes.
Such restrictions, or constraints, are placed on the use of resources by either of the following: (1) externally imposed
by creditors, grantors, contributors, or laws or regulations of other governments; or (2) imposed by law through
constitutional provisions or enabling legislation. Specific restrictions of the School District’s fund balance are
summarized as follows:
General Fund:
Excess Surplus: In accordance with N.J.S.A. 18A:7F-7, as amended, the designation of restricted fund
balance – excess surplus is the result of a required calculation pursuant to the New Jersey Comprehensive
Educational Improvement and Financing Act of 1996 (CEIFA). New Jersey school districts are required to
reserve general fund balance at the fiscal year end of June 30 if they did not appropriate a required minimum
amount as budgeted fund balance in their subsequent years’ budget. The excess fund balance at June 30,
2016 is $1,339,226; $578,289 has been restricted and designated for utilization in the 2016-2017 budget.
Capital Reserve Account: As of June 30, 2016, the balance in the capital reserve account is $609,007.
These funds are restricted for the future approved capital projects of school facilities.
36
Page 69
UPPER DEERFIELD TOWNSHIP SCHOOL DISTRICT
NOTES TO BASIC FINANCIAL STATEMENTS
FOR FISCAL YEAR ENDED JUNE 30, 2016
NOTE 19 - FUND BALANCE – (Continued)
For Maintenance Reserve Account: As of June 30, 2016, the balance in the maintenance reserve account is
$715,963. These funds are restricted for the required maintenance of school facilities in accordance with
Educational Facilities Construction and Financing Act (EFCFA) (N.J.S.A. 18A:7G-9) as amended by P.L.
2004, c.73 (S1701).
COMMITTED
As stated in Note 1, the committed fund balance classification includes amounts that can only be used for specific
purposes pursuant to constraints imposed by formal action of the School District’s highest level of decision making
authority, which, for the School District, is the Board of Education. Such formal action consists of an affirmative
vote by the Board of Education, memorialized by the adoption of a resolution. Once committed, amounts cannot be
used for any other purpose unless the Board of Education removes, or changes, the specified use by taking the same
type of action (resolution) it employed to previously commit those amounts.
Other Purposes: As of June 30, 2016, the School District had $16,298 of encumbrances outstanding for
purchase orders and contracts signed by the School District but not completed as of the close of the fiscal
year.
ASSIGNED
As stated in Note 1, the assigned fund balance classification includes amounts that are constrained by the School
District’s intent to be used for specific purposes, but are neither restricted nor committed. Specific assignments of the
School District’s fund balance are summarized as follows:
For Subsequent Year’s Expenditures: The School District has appropriated and included as an anticipated
revenue for the fiscal year ending June 30, 2017, $8,906 of general fund balance, $25,992 of capital project
fund balance, and $633 of the debt service fund balance at June 30, 2016.
UNASSIGNED
As stated in Note 1, the unassigned fund balance classification represents fund balance that has not been restricted,
committed, or assigned to specific purposes. The School District’s unassigned fund balance is summarized as
follows:
General Fund:
As of June 30, 2016, the unassigned fund balance of the general fund was $(334,807).
Debt Service Fund:
Of the $670 Debt Service balance at June 30, 2016; $633 has been appropriated and included as anticipated
revenue for the year ending June 30, 2017 and $37 is unreserved and undesignated.
NOTE 20 - SUBSEQUENT EVENTS
Management has reviewed and evaluated all events and transactions that occurred from June 30, 2016 through
November 18, 2016, the date that the financial statements were available to be issued for possible disclosure and
recognition in the financial statements, and no items have come to the attention of the District that would require
disclosure.
37
Page 70
REQUIRED SUPPLEMENTARY INFORMATION–PART II
Page 71
BUDGETARY COMPARISON SCHEDULES
Page 72
EX
HIB
IT C
-1 1
Va
ria
nce
Ori
gin
al
Bu
dg
et
Fin
al
Fa
vo
rab
le
Bu
dg
et
Tra
nsfe
rsB
ud
ge
tA
ctu
al
(U
nfa
vo
rab
le)
RE
VE
NU
ES
:
Lo
ca
l S
ou
rce
s:
.
L
oca
l T
ax L
evy
6,6
44
,24
8.
$
0
.$
6,6
44
,24
8.
$
6
,64
4,2
48
.$
0
.$
T
uitio
n2
0,0
00
.
0
.
20
,00
0.
79
,20
6.
59
,20
6.
In
tere
st
Ea
rne
d
35
0.
0.
3
50
.
4
,73
8.
4
,38
8.
M
isce
llan
eo
us
39
,00
0.
0.
3
9,0
00
.
7
4,4
88
.
3
5,4
88
.
To
tal -
Lo
ca
l S
ou
rce
s6
,70
3,5
98
.
0.
6
,70
3,5
98
.
6,8
02
,68
0.
99
,08
2.
Sta
te S
ou
rce
s:
E
qu
aliz
atio
n A
id5
,60
4,1
94
.
0.
5
,60
4,1
94
.
5,6
04
,19
4.
0.
S
ch
oo
l C
ho
ice
Aid
0.
0.
0
.
0
.
0.
S
up
ple
me
nta
l C
ore
Cu
rric
ulu
m
0.
0.
0
.
0
.
0.
C
ate
go
rica
l T
ran
sp
ort
atio
n A
id5
8,1
20
.
0
.
58
,12
0.
58
,12
0.
0.
S
pe
cia
l E
du
ca
tio
n A
id4
56
,60
1.
0
.
45
6,6
01
.
45
6,6
01
.
0.
B
ilin
qu
al E
du
ca
tio
n0
.
0
.
0.
0.
0
.
S
ecu
rity
Aid
14
6,6
67
.
0.
1
46
,66
7.
1
46
,66
7.
0
.
P
AR
CC
Re
ad
ine
ss A
id8
,37
0.
0
.
8,3
70
.
8,3
70
.
0.
P
er
Pu
pil
Gro
wth
Aid
8,3
70
.
0.
8
,37
0.
8
,37
0.
0
.
T
PA
F P
en
sio
n (
On
-Be
ha
lf -
No
n-B
ud
ge
ted
)0
.
0
.
0.
1,0
10
,20
1.
1,0
10
,20
1.
T
PA
F S
ocia
l S
ecu
rity
(R
eim
bu
rse
d -
No
n-B
ud
ge
ted
)0
.
0
.
0.
43
9,5
56
.
43
9,5
56
.
A
dd
itio
na
l N
on
-pu
blic
Tra
nsp
ort
atio
n A
id0
.
0
.
0.
5,7
42
.
5,7
42
.
To
tal S
tate
So
urc
es
6,2
82
,32
2.
0
.
6,2
82
,32
2.
7
,73
7,8
21
.
1
,45
5,4
99
.
Fe
de
ral S
ou
rce
s:
M
ed
ica
l A
ssis
tan
ce
Pro
gra
m2
8,1
80
.
0
.
28
,18
0.
60
,90
9.
32
,72
9.
To
tal -
Fe
de
ral S
ou
rce
s2
8,1
80
.
0
.
28
,18
0.
60
,90
9.
32
,72
9.
To
tal R
eve
nu
es
13
,01
4,1
00
.
0
.
13
,01
4,1
00
.
1
4,6
01
,41
0.
1
,58
7,3
10
.
UP
PE
R D
EE
RF
IEL
D T
OW
NS
HIP
SC
HO
OL
DIS
TR
ICT
BU
DG
ET
AR
Y C
OM
PA
RIS
ON
SC
HE
DU
LE
GE
NE
RA
L F
UN
D
FIS
CA
L Y
EA
R E
ND
ED
JU
NE
30
, 2
01
6
38
Page 73
EX
HIB
IT C
- 21
Va
ria
nce
Ori
gin
al
Bu
dg
et
Fin
al
Fa
vo
rab
le
Bu
dg
et
Tra
nsfe
rsB
ud
ge
tA
ctu
al
(U
nfa
vo
rab
le)
UP
PE
R D
EE
RF
IEL
D T
OW
NS
HIP
SC
HO
OL
DIS
TR
ICT
BU
DG
ET
AR
Y C
OM
PA
RIS
ON
SC
HE
DU
LE
GE
NE
RA
L F
UN
D
FIS
CA
L Y
EA
R E
ND
ED
JU
NE
30
, 2
01
6
Exp
en
ditu
res:
Cu
rre
nt
Exp
en
se
:
Re
gu
lar
pro
gra
ms -
in
str
uctio
n:
Pre
sch
oo
l -
Sa
larie
s o
f T
ea
ch
ers
0.
$
0
.$
0.
$
0
.$
0.
$
Kin
de
rga
rte
n -
Sa
larie
s o
f T
ea
ch
ers
32
6,0
54
.
(34
,15
1.)
29
1,9
03
.
27
7,9
81
.
13
,92
2.
Gra
de
s 1
- 5
- S
ala
rie
s o
f T
ea
ch
ers
1,8
44
,63
8.
7
8,2
44
.
1,9
22
,88
2.
1
,92
2,3
96
.
4
86
.
Gra
de
s 6
- 8
- S
ala
rie
s o
f T
ea
ch
ers
1,3
91
,37
5.
(2
6,0
76
.)
1
,36
5,2
99
.
1,3
64
,37
1.
92
8.
Ho
me
In
str
uctio
n:
Sa
larie
s o
f T
ea
ch
ers
5,0
00
.
(1,6
39
.)
3,3
61
.
0.
3
,36
1.
Pu
rch
ase
d P
rofe
ssio
na
l -
Ed
uca
tio
na
l S
erv
ice
s1
1,5
00
.
0
.
11
,50
0.
6,5
83
.
4,9
17
.
Re
gu
lar
pro
gra
ms -
Un
dis
trib
ute
d I
nstr
uctio
n:
Oth
er
Sa
larie
s f
or
Instr
uctio
n6
8,0
64
.
1
4,8
69
.
82
,93
3.
33
,67
9.
49
,25
4.
Pu
rch
ase
d T
ech
nic
al S
erv
ice
s4
4,0
00
.
(1
1,4
54
.)
3
2,5
46
.
3
1,7
94
.
7
52
.
Ge
ne
ral S
up
plie
s4
03
,20
0.
(1
20
,97
0.)
2
82
,23
0.
2
70
,73
1.
1
1,4
99
.
Te
xtb
oo
ks
17
,50
0.
0.
1
7,5
00
.
2
,13
5.
1
5,3
65
.
Oth
er
Ob
jects
2,0
00
.
0.
2
,00
0.
1
,90
9.
9
1.
To
tal re
gu
lar
pro
gra
ms -
in
str
uctio
n4
,11
3,3
31
.
(10
1,1
77
.)
4,0
12
,15
4.
3
,91
1,5
79
.
1
00
,57
5.
Mu
ltip
le D
isa
bili
tie
s:
Sa
larie
s o
f T
ea
ch
ers
2
57
,94
7.
(7
2,3
40
.)
1
85
,60
7.
1
81
,90
1.
3
,70
6.
Oth
er
Sa
larie
s f
or
Instr
uctio
n0
.
7
2,3
40
.
72
,34
0.
72
,01
6.
32
4.
To
tal m
ultip
le d
isa
bili
tie
s2
57
,94
7.
0
.
25
7,9
47
.
25
3,9
17
.
4,0
30
.
Re
so
urc
e R
oo
m/R
eso
urc
e C
en
ter:
Sa
larie
s o
f T
ea
ch
ers
74
2,6
95
.
(3,5
71
.)
73
9,1
24
.
62
2,5
32
.
11
6,5
92
.
Oth
er
Sa
larie
s f
or
Instr
uctio
n2
12
,79
7.
7
,10
0.
21
9,8
97
.
17
7,0
70
.
42
,82
7.
Ge
ne
ral S
up
plie
s1
0,5
00
.
0
.
10
,50
0.
8,2
21
.
2,2
79
.
Te
xtb
oo
ks
1,0
00
.
0.
1
,00
0.
0
.
1,0
00
.
To
tal re
so
urc
e r
oo
m/r
eso
urc
e c
en
ter
96
6,9
92
.
3,5
29
.
9
70
,52
1.
8
07
,82
3.
1
62
,69
8.
To
tal sp
ecia
l e
du
ca
tio
n -
in
str
uctio
n1
,22
4,9
39
.
3,5
29
.
1
,22
8,4
68
.
1,0
61
,74
0.
16
6,7
28
.
39
Page 74
EX
HIB
IT C
- 31
Va
ria
nce
Ori
gin
al
Bu
dg
et
Fin
al
Fa
vo
rab
le
Bu
dg
et
Tra
nsfe
rsB
ud
ge
tA
ctu
al
(U
nfa
vo
rab
le)
UP
PE
R D
EE
RF
IEL
D T
OW
NS
HIP
SC
HO
OL
DIS
TR
ICT
BU
DG
ET
AR
Y C
OM
PA
RIS
ON
SC
HE
DU
LE
GE
NE
RA
L F
UN
D
FIS
CA
L Y
EA
R E
ND
ED
JU
NE
30
, 2
01
6
Ba
sic
Skill
s/R
em
ed
ial In
str
uctio
n:
Sa
larie
s o
f T
ea
ch
ers
6
5,2
38
.$
(36
1.)
$
6
4,8
77
.$
20
,13
1.
$
44
,74
6.
$
Oth
er
Sa
larie
s f
or
Instr
uctio
n6
8,8
76
.
3
60
.
69
,23
6.
47
,92
6.
21
,31
0.
To
tal b
asic
skill
s/r
em
ed
ial in
str
uctio
n1
34
,11
4.
(1
.)
13
4,1
13
.
68
,05
7.
66
,05
6.
Bili
ng
ua
l E
du
ca
tio
n -
In
str
uctio
n:
Sa
larie
s o
f T
ea
ch
ers
70
,04
7.
3,5
71
.
7
3,6
18
.
7
3,6
18
.
0
.
Pu
rch
ase
d P
rofe
ssio
na
l -
Ed
uca
tio
na
l S
erv
ice
s
36
,60
5.
3,2
15
.
3
9,8
20
.
2
9,8
92
.
9
,92
8.
Ge
ne
ral S
up
plie
s1
,50
0.
1
,00
0.
2,5
00
.
2,4
98
.
2.
To
tal b
ilin
gu
al e
du
ca
tio
n -
in
str
uctio
n1
08
,15
2.
7
,78
6.
11
5,9
38
.
10
6,0
08
.
9,9
30
.
To
tal in
str
uctio
n5
,58
0,5
36
.
(89
,86
3.)
5,4
90
,67
3.
5
,14
7,3
84
.
3
43
,28
9.
Un
dis
trib
ute
d e
xp
en
ditu
res:
Instr
uctio
n:
Tu
itio
n -
Oth
er
LE
A's
With
in t
he
Sta
te -
Re
gu
lar
12
,00
0.
43
3.
1
2,4
33
.
1
1,7
45
.
6
88
.
Tu
itio
n -
Oth
er
LE
A's
With
in t
he
Sta
te -
Sp
ecia
l3
5,0
00
.
(9
,26
3.)
2
5,7
37
.
1
5,6
47
.
1
0,0
90
.
Tu
itio
n -
Co
. S
pe
c.
Se
rvic
es a
nd
Re
gio
na
l D
ay S
ch
ls3
5,0
00
.
3
9,3
25
.
74
,32
5.
72
,31
7.
2,0
08
.
Tu
itio
n -
Pri
va
te S
ch
ls/H
an
dic
ap
pe
d w
ith
in S
tate
10
0,0
00
.
4,2
45
.
1
04
,24
5.
1
04
,24
0.
5
.
To
tal in
str
uctio
n1
82
,00
0.
3
4,7
40
.
21
6,7
40
.
20
3,9
49
.
12
,79
1.
Att
en
da
nce
an
d S
ocia
l W
ork
Se
rvic
es:
Pu
rch
ase
d P
rofe
ssio
na
l a
nd
Te
ch
nic
al S
erv
ice
s1
,00
0.
0
.
1,0
00
.
0.
1
,00
0.
To
tal a
tte
nd
an
ce
an
d s
ocia
l w
ork
se
rvic
es
1,0
00
.
0.
1
,00
0.
0
.
1,0
00
.
He
alth
Se
rvic
es:
Sa
larie
s2
17
,82
0.
(2
,63
1.)
2
15
,18
9.
2
10
,18
7.
5
,00
2.
Pu
rch
ase
d P
rofe
ssio
na
l a
nd
Te
ch
nic
al S
erv
ice
s4
,30
0.
7
00
.
5,0
00
.
4,6
02
.
39
8.
Oth
er
Pu
rch
ase
d S
erv
ice
s1
50
.
0
.
15
0.
15
0.
0
.
Su
pp
lies a
nd
Ma
teri
als
5,5
50
.
13
1.
5
,68
1.
5
,42
9.
2
52
.
Oth
er
Ob
jects
10
0.
0.
1
00
.
0
.
10
0.
To
tal h
ea
lth
se
rvic
es
22
7,9
20
.
(1,8
00
.)
22
6,1
20
.
22
0,3
68
.
5,7
52
.
40
Page 75
EX
HIB
IT C
- 41
Va
ria
nce
Ori
gin
al
Bu
dg
et
Fin
al
Fa
vo
rab
le
Bu
dg
et
Tra
nsfe
rsB
ud
ge
tA
ctu
al
(U
nfa
vo
rab
le)
UP
PE
R D
EE
RF
IEL
D T
OW
NS
HIP
SC
HO
OL
DIS
TR
ICT
BU
DG
ET
AR
Y C
OM
PA
RIS
ON
SC
HE
DU
LE
GE
NE
RA
L F
UN
D
FIS
CA
L Y
EA
R E
ND
ED
JU
NE
30
, 2
01
6
Sp
ee
ch
, O
T,
PT
an
d R
ela
ted
Se
rvic
es:
Sa
larie
s9
5,6
78
.$
(4,6
52
.)$
91
,02
6.
$
86
,18
3.
$
4,8
43
.$
Pu
rch
ase
d P
rofe
ssio
na
l -
Ed
uca
tio
na
l S
erv
ice
s7
,50
0.
8
9,3
52
.
96
,85
2.
96
,85
1.
1.
Su
pp
lies a
nd
Ma
teri
als
1,0
00
.
0.
1
,00
0.
7
7.
92
3.
To
tal sp
ee
ch
, O
T,
PT
an
d r
ela
ted
se
rvic
es
10
4,1
78
.
84
,70
0.
1
88
,87
8.
1
83
,11
1.
5
,76
7.
Oth
er
Su
pp
Se
rv S
tud
-Extr
a S
erv
Se
rvic
es:
Sa
larie
s7
1,2
01
.
3
3,6
68
.
10
4,8
69
.
10
4,4
34
.
43
5.
To
tal O
the
r S
up
p S
erv
Stu
d-E
xtr
a S
erv
Se
rvic
es:
71
,20
1.
33
,66
8.
1
04
,86
9.
1
04
,43
4.
4
35
.
Gu
ida
nce
:
Sa
larie
s o
f O
the
r P
rofe
ssio
na
l S
taff
22
6,3
96
.
0.
2
26
,39
6.
1
86
,11
1.
4
0,2
85
.
Oth
er
Pu
rch
ase
d P
rofe
ssio
na
l a
nd
Te
ch
nic
al S
erv
.5
,00
0.
0
.
5,0
00
.
0.
5
,00
0.
Su
pp
lies a
nd
Ma
teri
als
6,0
00
.
0.
6
,00
0.
2
,88
4.
3
,11
6.
To
tal g
uid
an
ce
23
7,3
96
.
0.
2
37
,39
6.
1
88
,99
5.
4
8,4
01
.
Ch
ild S
tud
y T
ea
ms:
Sa
larie
s o
f O
the
r P
rofe
ssio
na
l S
taff
32
8,0
70
.
9,7
57
.
3
37
,82
7.
3
37
,82
6.
1
.
Sa
larie
s o
f S
ecre
tari
al a
nd
Cle
rica
l A
ssis
tan
ts4
2,1
27
.
(3
00
.)
41
,82
7.
41
,19
3.
63
4.
Pu
rch
ase
d P
rofe
ssio
na
l -
Ed
uca
tio
na
l S
erv
ice
s3
7,7
53
.
1
0,1
00
.
47
,85
3.
46
,70
0.
1,1
53
.
Oth
er
Pu
rch
ase
d P
rofe
ssio
na
l a
nd
Te
ch
nic
al S
erv
.1
0,0
00
.
2
,11
0.
12
,11
0.
12
,10
7.
3.
Mis
ce
llan
eo
us P
urc
ha
se
d S
erv
ice
s6
,00
0.
0
.
6,0
00
.
5,7
61
.
23
9.
Su
pp
lies a
nd
Ma
teri
als
10
,00
0.
0.
1
0,0
00
.
8
,73
3.
1
,26
7.
Oth
er
Ob
jects
10
0.
0.
1
00
.
0
.
10
0.
To
tal ch
ild s
tud
y t
ea
m4
34
,05
0.
2
1,6
67
.
45
5,7
17
.
45
2,3
20
.
3,3
97
.
Imp
rove
me
nt
of
Instr
uctio
n S
erv
ice
s/O
the
r S
up
po
rt
Se
rvic
es -
In
str
uctio
na
l S
taff
:
Sa
larie
s o
f O
the
r P
rofe
ssio
na
l S
taff
24
0,6
63
.
(12
,36
6.)
22
8,2
97
.
13
2,7
84
.
95
,51
3.
Pu
rch
ase
d P
rofe
ssio
na
l E
du
ca
tio
na
l S
erv
ice
s5
00
.
0
.
50
0.
0.
5
00
.
Oth
er
Pu
rch
ase
d P
rofe
ssio
na
l &
Te
ch
nic
al S
erv
ice
s1
0,0
00
.
3
,00
0.
13
,00
0.
11
,92
5.
1,0
75
.
Su
pp
lies a
nd
Ma
teri
als
2
,00
0.
0
.
2,0
00
.
0.
2
,00
0.
To
tal im
pro
ve
me
nt
of
instr
uctio
n s
erv
ice
s2
53
,16
3.
(9
,36
6.)
2
43
,79
7.
1
44
,70
9.
9
9,0
88
.
41
Page 76
EX
HIB
IT C
- 51
Va
ria
nce
Ori
gin
al
Bu
dg
et
Fin
al
Fa
vo
rab
le
Bu
dg
et
Tra
nsfe
rsB
ud
ge
tA
ctu
al
(U
nfa
vo
rab
le)
UP
PE
R D
EE
RF
IEL
D T
OW
NS
HIP
SC
HO
OL
DIS
TR
ICT
BU
DG
ET
AR
Y C
OM
PA
RIS
ON
SC
HE
DU
LE
GE
NE
RA
L F
UN
D
FIS
CA
L Y
EA
R E
ND
ED
JU
NE
30
, 2
01
6
Ed
uca
tio
na
l M
ed
ia S
erv
ice
s -
Sch
oo
l L
ibra
ry
Sa
larie
s1
01
,69
8.
$
1,5
58
.$
10
3,2
56
.$
10
3,0
72
.$
18
4.
$
Pu
rch
ase
d P
rofe
ssio
na
l a
nd
Te
ch
nic
al S
erv
ice
s7
,50
0.
0
.
7,5
00
.
1,1
47
.
6,3
53
.
Oth
er
Pu
rch
ase
d S
erv
ice
s4
00
.
0
.
40
0.
0.
4
00
.
Su
pp
lies a
nd
Ma
teri
als
13
,08
0.
(1,5
58
.)
11
,52
2.
9,1
77
.
2,3
45
.
Oth
er
Ob
jects
50
.
0.
5
0.
0
.
50
.
To
tal e
du
ca
tio
na
l m
ed
ia s
erv
ice
s -
sch
oo
l lib
rary
12
2,7
28
.
0.
1
22
,72
8.
1
13
,39
6.
9
,33
2.
Instr
uctio
na
l S
taff
Tra
inin
g S
erv
ice
s:
Pu
rch
ase
d P
rofe
ssio
na
l-E
du
ca
tio
na
l S
erv
ice
s2
5,0
00
.
(3
,00
0.)
2
2,0
00
.
1
8,5
75
.
3
,42
5.
Oth
er
Pu
rch
ase
d S
erv
ice
s6
,50
0.
0
.
6,5
00
.
1,1
31
.
5,3
69
.
Su
pp
lies a
nd
Ma
teri
als
50
0.
0.
5
00
.
0
.
50
0.
Oth
er
Ob
jects
35
0.
0.
3
50
.
0
.
35
0.
To
tal in
str
uctio
na
l stu
ff t
rain
ing
se
rvic
es
32
,35
0.
(3,0
00
.)
29
,35
0.
19
,70
6.
9,6
44
.
Su
pp
ort
Se
rvic
es -
Ge
ne
ral A
dm
inis
tra
tio
n:
Sa
larie
s1
17
,64
9.
1
1,5
29
.
12
9,1
78
.
12
4,1
40
.
5,0
38
.
Le
ga
l S
erv
ice
s1
0,0
00
.
(3
,24
5.)
6
,75
5.
1
,45
9.
5
,29
6.
Au
dit F
ee
s2
7,0
00
.
0
.
27
,00
0.
19
,65
0.
7,3
50
.
Arc
hite
ctu
ral/E
ng
ine
eri
ng
Se
rvic
es
11
,00
0.
(7,8
54
.)
3,1
46
.
1,0
00
.
2,1
46
.
Oth
er
Pu
rch
ase
d P
rofe
ssio
na
l S
erv
ice
s8
,00
0.
(2
,44
0.)
5
,56
0.
4
,52
8.
1
,03
2.
Co
mm
un
ica
tio
ns/T
ele
ph
on
e4
8,0
00
.
4
0.
48
,04
0.
37
,28
8.
10
,75
2.
BO
E O
the
r P
urc
ha
se
d S
erv
ice
s4
,00
0.
4
,36
9.
8,3
69
.
7,9
80
.
38
9.
Oth
er
Pu
rch
ase
d S
erv
ice
s5
0,0
00
.
(1
,00
0.)
4
9,0
00
.
4
4,4
38
.
4
,56
2.
Ge
ne
ral S
up
plie
s7
,12
3.
(2
,65
0.)
4
,47
3.
2
,63
4.
1
,83
9.
BO
E I
n H
ou
se
Tra
inin
g /
Me
etin
g S
up
plie
s7
50
.
0
.
75
0.
27
5.
4
75
.
Mis
ce
llan
eo
us E
xp
en
ditu
res
4,5
00
.
0.
4
,50
0.
3
,79
5.
7
05
.
BO
E M
em
be
rsh
ip D
ue
s &
Fe
es
8,0
00
.
0.
8
,00
0.
6
,67
7.
1
,32
3.
To
tal su
pp
ort
se
rvic
es -
ge
ne
ral a
dm
inis
tra
tio
n2
96
,02
2.
(1
,25
1.)
2
94
,77
1.
2
53
,86
4.
4
0,9
07
.
42
Page 77
EX
HIB
IT C
- 61
Va
ria
nce
Ori
gin
al
Bu
dg
et
Fin
al
Fa
vo
rab
le
Bu
dg
et
Tra
nsfe
rsB
ud
ge
tA
ctu
al
(U
nfa
vo
rab
le)
UP
PE
R D
EE
RF
IEL
D T
OW
NS
HIP
SC
HO
OL
DIS
TR
ICT
BU
DG
ET
AR
Y C
OM
PA
RIS
ON
SC
HE
DU
LE
GE
NE
RA
L F
UN
D
FIS
CA
L Y
EA
R E
ND
ED
JU
NE
30
, 2
01
6
Su
pp
ort
Se
rvic
es -
Sch
oo
l A
dm
inis
tra
tio
n:
Sa
larie
s o
f P
rin
cip
als
/Assis
tan
t P
rin
cip
als
22
0,5
27
.$
4,6
60
.$
22
5,1
87
.$
22
5,1
84
.$
3.
$
Sa
larie
s o
f S
ecre
tari
al a
nd
Cle
rica
l A
ssis
tan
ts1
75
,80
9.
2
,44
1.
17
8,2
50
.
17
6,8
25
.
1,4
25
.
Oth
er
Pu
rch
ase
d S
erv
ice
s3
3,0
00
.
0
.
33
,00
0.
24
,46
0.
8,5
40
.
Su
pp
lies a
nd
Ma
teri
als
22
,00
0.
0.
2
2,0
00
.
1
6,8
04
.
5
,19
6.
Oth
er
Ob
jects
7,0
00
.
0.
7
,00
0.
2
,04
4.
4
,95
6.
To
tal su
pp
ort
se
rvic
es -
sch
oo
l a
dm
inis
tra
tio
n4
58
,33
6.
7
,10
1.
46
5,4
37
.
44
5,3
17
.
20
,12
0.
Un
dis
trib
ute
d E
xp
en
ditu
res -
Ce
ntr
al S
erv
ice
s:
Sa
larie
s2
05
,74
3.
9
,85
5.
21
5,5
98
.
21
5,5
98
.
0.
Pu
rch
ase
d T
ech
nic
al S
erv
ice
s1
8,0
00
.
8
25
.
18
,82
5.
18
,82
5.
0.
Mis
c P
urc
ha
se
d S
erv
ice
s
( 4
00
-50
0 S
erie
s)
7,0
00
.
85
3.
7
,85
3.
7
,85
3.
0
.
Su
pp
lies a
nd
Ma
teri
als
7,5
00
.
(1,9
28
.)
5,5
72
.
5,1
89
.
38
3.
Inte
rest
on
Bo
nd
An
ticip
atio
n N
ote
s
0.
0.
0
.
0
.
0.
Mis
ce
llan
eo
us E
xp
en
ditu
res
2,5
00
.
25
0.
2
,75
0.
2
,58
9.
1
61
.
To
tal u
nd
istr
ibu
ted
exp
en
ditu
re -
ce
ntr
al se
rvic
es
24
0,7
43
.
9,8
55
.
2
50
,59
8.
2
50
,05
4.
5
44
.
Un
dis
trib
ute
d E
xp
en
ditu
res -
Ad
min
In
fo T
ech
:
Sa
larie
s2
6,3
05
.
8
8.
26
,39
3.
26
,39
3.
0.
Pu
rch
ase
d P
rofe
ssio
na
l S
erv
ice
s8
5,4
79
.
(1
8,3
58
.)
6
7,1
21
.
6
6,1
70
.
9
51
.
Oth
er
Pu
rch
ase
d S
erv
ice
s5
,00
0.
0
.
5,0
00
.
36
0.
4
,64
0.
Su
pp
lies a
nd
Ma
teri
als
20
,00
0.
4,2
12
.
2
4,2
12
.
2
0,7
97
.
3
,41
5.
Oth
er
Ob
jects
10
0.
0.
1
00
.
0
.
10
0.
To
tal u
nd
istr
ibu
ted
exp
en
ditu
res -
ad
min
in
fo t
ech
13
6,8
84
.
(14
,05
8.)
12
2,8
26
.
11
3,7
20
.
9,1
06
.
Allo
wa
ble
Ma
inte
na
nce
fo
r S
ch
oo
l F
acili
tie
s
Sa
larie
s7
3,1
85
.
0
.
73
,18
5.
61
,74
3.
11
,44
2.
Cle
an
ing
, R
ep
air
an
d M
ain
ten
an
ce
Se
rvic
es
40
0,0
00
.
(11
1,3
70
.)
28
8,6
30
.
26
8,7
99
.
19
,83
1.
Ge
ne
ral S
up
plie
s1
5,0
00
.
8
,10
0.
23
,10
0.
22
,88
1.
21
9.
To
tal a
llow
ab
le m
ain
ten
an
ce
fo
r sch
oo
l fa
cili
tie
s4
88
,18
5.
(1
03
,27
0.)
3
84
,91
5.
3
53
,42
3.
3
1,4
92
.
43
Page 78
EX
HIB
IT C
- 71
Va
ria
nce
Ori
gin
al
Bu
dg
et
Fin
al
Fa
vo
rab
le
Bu
dg
et
Tra
nsfe
rsB
ud
ge
tA
ctu
al
(U
nfa
vo
rab
le)
UP
PE
R D
EE
RF
IEL
D T
OW
NS
HIP
SC
HO
OL
DIS
TR
ICT
BU
DG
ET
AR
Y C
OM
PA
RIS
ON
SC
HE
DU
LE
GE
NE
RA
L F
UN
D
FIS
CA
L Y
EA
R E
ND
ED
JU
NE
30
, 2
01
6
Oth
er
Op
era
tio
n a
nd
Ma
inte
na
nce
of
Pla
nt
Se
rvic
es:
Sa
larie
s5
02
,74
4.
$
7,3
22
.$
51
0,0
66
.$
47
7,4
51
.$
32
,61
5.
$
Sa
larie
s o
f N
on
-In
str
uctio
na
l A
ide
s
78
,52
0.
5,9
69
.
8
4,4
89
.
8
4,4
89
.
0
.
Pu
rch
ase
d P
rofe
ssio
na
l a
nd
Te
ch
nic
al S
erv
ice
s9
,00
0.
0
.
9,0
00
.
6,1
26
.
2,8
74
.
Cle
an
ing
, R
ep
air
an
d M
ain
ten
an
ce
Se
rvic
es
36
,00
0.
(6,0
26
.)
29
,97
4.
17
,07
1.
12
,90
3.
Oth
er
Pu
rch
ase
d P
rop
ert
y S
erv
ice
s1
3,0
00
.
0
.
13
,00
0.
9,9
18
.
3,0
82
.
Insu
ran
ce
65
,00
0.
0.
6
5,0
00
.
6
4,8
71
.
1
29
.
Ge
ne
ral S
up
plie
s6
5,0
00
.
(2
0.)
64
,98
0.
50
,05
6.
14
,92
4.
En
erg
y (
Na
tura
l G
as)
85
,00
0.
(11
,35
6.)
73
,64
4.
53
,29
5.
20
,34
9.
En
erg
y (
Ele
ctr
icity)
30
0,0
00
.
53
4.
3
00
,53
4.
3
00
,53
4.
0
.
En
erg
y (
Oil)
7,0
00
.
0.
7
,00
0.
8
70
.
6,1
30
.
En
erg
y (
Ga
so
line
)5
,00
0.
0
.
5,0
00
.
4,7
94
.
20
6.
Oth
er
Ob
jects
75
0.
77
.
8
27
.
8
25
.
2.
To
tal o
the
r o
pe
ratio
n a
nd
ma
inte
na
nce
of
pla
nt
se
rvic
es
1,1
67
,01
4.
(3
,50
0.)
1
,16
3,5
14
.
1,0
70
,30
0.
93
,21
4.
Ca
re a
nd
Up
ke
ep
of
Gro
un
ds:
Sa
larie
s4
0,6
42
.
2
0,0
00
.
60
,64
2.
33
,99
5.
26
,64
7.
To
tal ca
re a
nd
up
ke
ep
of
gro
un
ds
40
,64
2.
20
,00
0.
6
0,6
42
.
3
3,9
95
.
2
6,6
47
.
To
tal o
pe
ratio
n a
nd
ma
inte
na
nce
of
pla
nt
se
rvic
es
1,6
95
,84
1.
(8
6,7
70
.)
1
,60
9,0
71
.
1,4
57
,71
8.
15
1,3
53
.
Stu
de
nts
Tra
nsp
ort
atio
n S
erv
ice
s:
Ma
na
ge
me
nt
Fe
e-E
SC
Tra
nsp
ort
atio
n P
rog
ram
s2
8,0
00
.
1
7,0
41
.
45
,04
1.
31
,17
0.
13
,87
1.
Co
ntr
acte
d S
erv
ice
s -
Aid
in
Lie
u o
f P
aym
en
ts -
No
n P
ub
lic3
5,0
00
.
2
3,9
40
.
58
,94
0.
36
,23
2.
22
,70
8.
Co
ntr
acte
d S
erv
ice
s -
Aid
in
Lie
u o
f P
aym
en
ts -
Ch
oic
e
10
,00
0.
(1,4
20
.)
8,5
80
.
4,8
62
.
3,7
18
.
Co
ntr
acte
d S
erv
ice
s (
Ho
me
/Sch
oo
l) -
Ve
nd
ors
50
,00
0.
(42
,44
1.)
7,5
59
.
0.
7
,55
9.
Co
ntr
acte
d S
erv
ice
s (
No
t H
om
e/S
ch
oo
l) -
Ve
nd
ors
5,0
00
.
0.
5
,00
0.
4
,04
9.
9
51
.
Co
ntr
acte
d S
erv
ice
s -
(H
om
e/S
ch
oo
l) J
oin
t A
gre
em
en
t4
35
,00
0.
0
.
43
5,0
00
.
43
2,2
30
.
2,7
70
.
Co
ntr
acte
d S
erv
ice
s (
Re
g.
Stu
de
nts
) -
ES
Cs
4,0
00
.
2,5
40
.
6
,54
0.
6
,54
0.
0
.
Co
ntr
acte
d S
erv
ice
s (
Sp
ecia
l E
d.)
- E
SC
s1
40
,00
0.
1
20
,54
1.
26
0,5
41
.
26
0,5
41
.
0.
To
tal stu
de
nt
tra
nsp
ort
atio
n s
erv
ice
s7
07
,00
0.
1
20
,20
1.
82
7,2
01
.
77
5,6
24
.
51
,57
7.
44
Page 79
EX
HIB
IT C
- 81
Va
ria
nce
Ori
gin
al
Bu
dg
et
Fin
al
Fa
vo
rab
le
Bu
dg
et
Tra
nsfe
rsB
ud
ge
tA
ctu
al
(U
nfa
vo
rab
le)
UP
PE
R D
EE
RF
IEL
D T
OW
NS
HIP
SC
HO
OL
DIS
TR
ICT
BU
DG
ET
AR
Y C
OM
PA
RIS
ON
SC
HE
DU
LE
GE
NE
RA
L F
UN
D
FIS
CA
L Y
EA
R E
ND
ED
JU
NE
30
, 2
01
6
Un
allo
ca
ted
Be
ne
fits
:
So
cia
l S
ecu
rity
Co
ntr
ibu
tio
ns
16
0,0
00
.$
41
,31
0.
$
20
1,3
10
.$
20
1,3
10
.$
0.
$
Oth
er
Re
tire
me
nt
Co
ntr
ibu
tio
ns -
Re
gu
lar
22
2,0
60
.
3,9
00
.
2
25
,96
0.
2
25
,15
5.
8
05
.
Un
em
plo
ym
en
t C
om
pe
nsa
tio
n3
,00
0.
0
.
3,0
00
.
0.
3
,00
0.
Wo
rkm
en
's C
om
pe
nsa
tio
n9
8,0
00
.
0
.
98
,00
0.
92
,96
7.
5,0
33
.
He
alth
Be
ne
fits
1,9
74
,29
0.
(1
71
,89
6.)
1
,80
2,3
94
.
1,7
54
,53
0.
47
,86
4.
Tu
itio
n R
eim
bu
rse
me
nt
30
,00
0.
(6,0
00
.)
24
,00
0.
10
,98
3.
13
,01
7.
Oth
er
Em
plo
ye
e B
en
efits
0.
9,2
10
.
9
,21
0.
9
,21
0.
0
.
To
tal u
na
lloca
ted
be
ne
fits
2,4
87
,35
0.
(1
23
,47
6.)
2
,36
3,8
74
.
2,2
94
,15
5.
69
,71
9.
On
Be
ha
lf T
PA
F P
en
sio
n C
on
t. (
No
n-B
ud
ge
ted
)0
.
0
.
0.
1,0
10
,20
1.
(1,0
10
,20
1.)
Re
imb
urs
ed
TP
AF
So
c.
Se
c.
Co
nt.
(N
on
-Bu
dg
ete
d)
0.
0.
0
.
4
39
,55
6.
(4
39
,55
6.)
To
tal u
nd
istr
ibu
ted
exp
en
ditu
res
7,6
88
,16
2.
7
2,2
11
.
7,7
60
,37
3.
8
,67
1,1
97
.
(9
10
,82
4.)
To
tal e
xp
en
ditu
res-c
urr
en
t e
xp
en
se
s1
3,2
68
,69
8.
(17
,65
2.)
13
,25
1,0
46
.
1
3,8
18
,58
1.
(5
67
,53
5.)
CA
PIT
AL
OU
TL
AY
:
Eq
uip
me
nt
Un
dis
trib
ute
d e
xp
en
ditu
res:
Re
qu
ire
d M
ain
ten
an
ce
fo
r S
ch
oo
l F
acili
tie
s5
,50
0.
1
3,3
79
.
18
,87
9.
18
,36
8.
51
1.
To
tal e
qu
ipm
en
t5
,50
0.
1
3,3
79
.
18
,87
9.
18
,36
8.
51
1.
Fa
cili
tie
s A
cq
uis
itio
n a
nd
Co
nstr
uctio
n S
erv
ice
s :
Co
nstr
uctio
n S
erv
ice
s
0.
20
3,6
96
.
2
03
,69
6.
2
03
,69
6.
0
.
Asse
ssm
en
t fo
r D
eb
t S
erv
ice
on
SD
A F
un
din
g1
04
,61
8.
0
.
10
4,6
18
.
10
4,6
18
.
0.
To
tal fa
cili
tie
s a
cq
uis
itio
n a
nd
ao
nstr
uctio
n s
erv
ice
s
10
4,6
18
.
20
3,6
96
.
3
08
,31
4.
3
08
,31
4.
0
.
To
tal ca
pita
l o
utla
y e
xp
en
ditu
res
11
0,1
18
.
21
7,0
75
.
3
27
,19
3.
3
26
,68
2.
5
11
.
Tra
nsfe
r o
f F
un
ds t
o C
ha
rte
r S
ch
oo
ls
14
,74
2.
5,8
07
.
2
0,5
49
.
2
0,5
49
.
0
.
To
tal e
xp
en
ditu
res
13
,39
3,5
58
.
2
05
,23
0.
13
,59
8,7
88
.
1
4,1
65
,81
2.
(5
67
,02
4.)
45
Page 80
EX
HIB
IT C
- 91
Va
ria
nce
Ori
gin
al
Bu
dg
et
Fin
al
Fa
vo
rab
le
Bu
dg
et
Tra
nsfe
rsB
ud
ge
tA
ctu
al
(U
nfa
vo
rab
le)
UP
PE
R D
EE
RF
IEL
D T
OW
NS
HIP
SC
HO
OL
DIS
TR
ICT
BU
DG
ET
AR
Y C
OM
PA
RIS
ON
SC
HE
DU
LE
GE
NE
RA
L F
UN
D
FIS
CA
L Y
EA
R E
ND
ED
JU
NE
30
, 2
01
6
Exce
ss (
De
ficie
ncy)
of
Re
ve
nu
es
Ove
r (U
nd
er)
Exp
en
ditu
res
(37
9,4
58
.)$
(2
05
,23
0.)
$
(5
84
,68
8.)
$
43
5,5
98
.$
1,0
20
,28
6.
$
Oth
er
Fin
an
cin
g S
ou
rce
s:
Op
era
tin
g T
ran
sfe
r O
ut:
Ge
ne
ral F
un
d -
Tra
nsfe
r to
Sp
ecia
l R
eve
nu
e F
d P
re-K
(30
0,4
76
.)
0
.
(30
0,4
76
.)
(3
00
,47
6.)
0
.
To
tal O
the
r F
ina
ncin
g S
ou
rce
s:
(30
0,4
76
.)
0
.
(30
0,4
76
.)
(3
00
,47
6.)
0
.
Exce
ss (
De
ficie
ncy)
of
Re
ve
nu
es a
nd
Oth
er
Fin
an
cin
g S
ou
rce
s
Ove
r (U
nd
er)
Exp
en
ditu
res a
nd
Oth
er
Fin
an
cin
g S
ou
rce
s (
Use
s)
(67
9,9
34
.)
(2
05
,23
0.)
(8
85
,16
4.)
13
5,1
22
.
1,0
20
,28
6.
Fu
nd
Ba
lan
ce
, Ju
ly 1
2,8
20
,35
1.
0
.
2,8
20
,35
1.
2
,82
0,3
51
.
0
.
Fu
nd
Ba
lan
ce
, Ju
ne
30
2,1
40
,41
7.
$
(2
05
,23
0.)
$
1
,93
5,1
87
.$
2,9
55
,47
3.
$
1,0
20
,28
6.
$
Re
ca
pitu
latio
n:
Re
str
icte
d F
un
d B
ala
nce
:
Ca
pita
l R
ese
rve
60
9,0
07
.$
Ma
inte
na
nce
Re
se
rve
71
5,9
63
.
Exce
ss s
urp
lus d
esig
nste
d f
or
su
bse
qu
en
t ye
ar's e
xp
en
ditu
res
57
8,2
89
.
Exce
ss s
urp
lus-c
urr
en
t ye
ar
76
0,9
37
.
Co
mm
itte
d F
un
d B
ala
nce
:
Ye
ar-
en
d e
ncu
mb
ran
ce
s1
6,2
98
.
Assig
ne
d F
un
d B
ala
nce
:
De
sig
na
ted
fo
r su
bse
qu
en
t ye
ar's e
xp
en
ditu
res
8,9
06
.
Un
assig
ne
d F
un
d B
ala
nce
26
6,0
73
.
2,9
55
,47
3.
Re
co
ncili
atio
n t
o G
ove
rnm
en
tal F
un
ds S
tate
me
nts
(G
AA
P):
Le
ss-S
tate
aid
pa
ym
en
ts n
ot
reco
gn
ize
d o
n G
AA
P b
asis
(60
0,8
80
.)
Fu
nd
Ba
lan
ce
pe
r G
ove
rnm
en
tal F
un
ds(G
AA
P)
2,3
54
,59
3.
$
46
Page 81
EX
HIB
IT C
-2
Vari
ance
Ori
gin
al
Budget
Fin
al
Favora
ble
Budget
Tra
nsfe
rsB
udget
Actu
al
(Unfa
vora
ble
)
RE
VE
NU
ES
:
Local S
ourc
es
300,4
76.
$
0.
$
300,4
76.
$
300,4
76.
$
0.
$
Sta
te S
ourc
es
222,6
00.
0.
222,6
00.
222,6
00.
0.
Federa
l S
ourc
es
1,1
89,8
56.
0.
1,1
89,8
56.
1,1
62,4
11.
(2
7,4
45.)
Tota
l R
evenues
1,7
12,9
32.
0.
1,7
12,9
32.
1,6
85,4
87.
(2
7,4
45.)
EX
PE
ND
ITU
RE
S:
Instr
uction
Sala
ries o
f T
eachers
806,2
35.
0.
806,2
35.
824,6
65.
(18,4
30.)
Oth
er
Sala
ries f
or
Instr
uction
139,1
73.
65,7
59.
204,9
32.
212,0
42.
(7,1
10.)
Purc
hased P
rofe
ssio
nal -E
ducational S
erv
ices
194,2
28.
0.
194,2
28.
194,2
28.
0.
Genera
l S
upplie
s3,5
10.
80,7
05.
84,2
15.
81,0
37.
3,1
78.
Tota
l In
str
uction
1,1
43,1
46.
146,4
64.
1,2
89,6
10.
1,3
11,9
72.
(2
2,3
62.)
Support
Serv
ices
Oth
er
Sala
ries
65,7
59.
(6
5,7
59.)
0.
0.
0.
Pers
onal S
erv
ices -
Em
plo
yee B
enefits
323,2
09.
0.
323,2
09.
323,1
65.
44.
Purc
hased P
rofe
ssio
nal -
Educational S
erv
ices
50,0
00.
0.
50,0
00.
50,0
00.
0.
Oth
er
Purc
hased P
rofe
ssio
nal S
erv
ices
24,4
48.
0.
24,4
48.
350.
24,0
98.
Genera
l S
upplie
s99,1
20.
(8
0,7
05.)
18,4
15.
0.
18,4
15.
Oth
er
Obje
cts
7,2
50.
0.
7,2
50.
0.
7,2
50.
Tota
l S
upport
Serv
ices
569,7
86.
(146,4
64.)
423,3
22.
373,5
15.
49,8
07.
Tota
l E
xpenditure
s1,7
12,9
32.
0.
1,7
12,9
32.
1,6
85,4
87.
27,4
45.
Tota
l O
utf
low
s1,7
12,9
32.
0.
1,7
12,9
32.
1,6
85,4
87.
27,4
45.
Excess (
Deficie
ncy)
of
Revenues O
ver
(Under)
expenditure
s0.
$
0.
$
0.
$
0.
$
0.
$
FO
R T
HE
FIS
CA
L Y
EA
R E
ND
ED
JU
NE
30,
2016
UP
PE
R D
EE
RF
IELD
TO
WN
SH
IP S
CH
OO
L D
IST
RIC
T
BU
DG
ET
AR
Y C
OM
PA
RIS
ON
SC
HE
DU
LE
SP
EC
IAL R
EV
EN
UE
FU
ND
47
Page 82
NOTES TO REQUIRED SUPPLEMENTARY
INFORMATION – PART II
Page 83
EXHIBIT C-3
Explanation of Differences between Budgetary Inflows and Outflows and GAAP Revenues and Expenditures.
General Fund
Special
Revenue Fund
Capital Projects
Fund
Sources/inflows of resources:
Actual amounts (budgetary) "revenues" from the budgetary
comparison schedules 14,601,410.$ 1,685,487.$ 37.$
Differences - Budget to GAAP:
Add: Prior Year Encumbrance 4,929
Less: Current Year Encumbrance (73,237.)
601,504. 25,228. 59,786
(600,880.) (22,260.)
14,602,034.$ 1,620,147.$ 59,823.$
Uses/Outflow of resources:
14,165,812.$ 1,685,487.$ 119,497.$
Differences - Budget to GAAP:
Prior Year Encumbrance Paid 4,929.
Current Year Encumbrance (73,237.)
14,165,812.$ 1,617,179.$ 119,497.$
UPPER DEERFIELD TOWNSHIP SCHOOL DISTRICT
Total Expenditures as reported on the statement of
revenues, expenditures, and changes in fund balances -
governmental funds.
State aid payment recognized for GAAP statement in
the current year, previously recognized for budgetary
purposes.
State aid payment recognized for budgetary purposes
not recognized for GAAP statements until the
subsequent year.
Total revenues as reported in the statement of revenues,
expenditures and changes in fund balances - governmental
funds.
Actual amounts (budgetary basis) "total outflows" from the
budgetary comparison schedule.
Grant accounting budgetary basis differs from
GAAP in that encumbrances are recognized as
expenditures, and the related revenue is recognized.
Encumbrances for supplies and equipment ordered but
not received are reported in the year the order is placed
for budgetary purposes, but in the year the supplies are
received for financial reporting purposes.
FOR THE FISCAL YEAR ENDED JUNE 30, 2016
BUDGETARY COMPARISON SCHEDULE
NOTES TO REQUIRED SUPPLEMENTARY INFORMATION
48
Page 84
REQUIRED SUPPLEMENTARY INFORMATION–PART III
Page 85
Schedules Related to Accounting and Reporting for Pensions
(GASB 68)
Page 86
EXHIBIT L-1
2015 2014 2013
District's proportion of the net pension
liability (asset) 0.02603882% 0.02379300% 0.02477300%
District's proportionate share of the net
pension liabiltiy (asset) 5,845,193.$ 4,454,654.$ 4,734,625.$
District's covered-employee payroll 1,776,658.$ 1,939,516.$ N/A
District 's proportionate share of the net
pension liability (asset) as a percentage
of its covered-employee payroll 329.00% 229.68% N/A
Plan fiduciary net position as a
percentage of the total pension liability 47.93% 52.08% 48.72%
SOURCE: GASB 68 report on Public Employee's Retirement System; District Records
NOTE: This schedule is required by GASB 68 to be show information for a 10 year period.
Additional years will be presented as they become available.
UPPER DEERFIELD TOWNSHIP SCHOOL DISTRICT
PERS
Measurement Date
Ending June 30,
Last Three Fiscal Years
SCHEDULES OF DISTRICT'S PROPORTIONATE SHARE OF THE NET PENSION LIABILITY
49
Page 87
EXHIBIT L-2
2016 2015 2014
Contractually required contribution 223,864.$ 196,144.$ 186,660.$
Contributions in relation to the
contractually required contribution (223,864.) (196,144.) (186,660.)
Contribution deficiency (excess) 0. 0. 0.
District's covered-employee payroll $1,776,658 1,939,516.$ N/A
Contributions as a percentage of
covered-employee payroll 12.60% 10.11% N/A
2016 2015 2014
Contractually required contribution N/A N/A N/A
Contributions in relation to the
contractually required contribution N/A N/A N/A
Contribution deficiency (excess) N/A N/A N/A
District's covered-employee payroll $6,126,013 5,799,078.$ N/A
Contributions as a percentage of
covered-employee payroll N/A N/A N/A
SOURCE: GASB 68 report on Public Employee's Retirement System/Teachers' Pension and Annuity Fund;
District Records
NOTE: This schedule is required by GASB 68 to be show information for a 10 year period.
Additional years will be presented as they become available.
Fiscal Year Ending June 30,
TPAF
UPPER DEERFIELD TOWNSHIP SCHOOL DISTRICT
SCHEDULE OF DISTRICT CONTRIBUTIONS
PERS
Last Three Fiscal Years
Fiscal Year Ending June 30,
50
Page 88
EXHIBIT L-3
2015 2014 2013
District's proportion of the net pension liability
(asset) N/A N/A N/A
District's proportionate share of the net N/A N/A N/A
pension liabiltiy (asset)
State's proportionate share of the net pension
liability (asset) associated with the District 38,680,476.$ 32,845,085.$ 32,243,472.$
Total 38,680,476.$ 32,845,085.$ 32,243,472.$
District's covered-employee payroll 6,126,013.$ 5,799,078.$ N/A
District 's proportionate share of the net
pension liability (asset) as a percentage
of its covered-employee payroll N/A N/A N/A
Plan fiduciary net position as a
percentage of the total pension liability 28.71% 33.64% 33.76%
SOURCE: GASB 68 report on Teachers' Pension and Annuity Fund; District Records
NOTE: This schedule is required by GASB 68 to be show information for a 10 year period.
Additional years will be presented as they become available.
UPPER DEERFIELD TOWNSHIP SCHOOL DISTRICT
SCHEDULES OF THE DISTRICT'S PROPORTIONATE SHARE OF THE NET PENSION LIABILITY
TPAF
Last Three Fiscal Years
Measurement Date
Ending June 30,
51
Page 89
NOTES TO REQUIRED SUPPLEMENTARY
INFORMATION – PART III
Page 90
EXHIBIT L-4
UPPER DEERFIELD TOWNSHIP SCHOOL DISTRICT
NOTES TO REQUIRED SUPPLEMENTARY INFORMATION
PENSION SCHEDULES
JUNE 30, 2016
Note 1: Teachers’ Pension and Annuity Fund (TPAF)
Changes of benefits terms. The vesting and benefits provisions are set by N.J.S.A. 18A:66. TPAF provides
retirement, death, and disability benefits. All benefits vest after years of service, except for medical benefits,
which vest after 25 years of service or under the disability provisions of TPAF. Members are always fully
vested for their own contributions and, after three years of service credit, become vented for 2% of related
interest earned on the contributions. In the case of death before retirement, members’ beneficiaries are
entitled to full interest credited to the member’s accounts.
Changes of assumptions. Mortality rates were based on the RP-2000 Health Annuitant Mortality for Males
or Females, as appropriate, with adjustments for mortality improvements based on Scale AA. Pre-retirement
mortality improvements for active member are projected using Scale AA from the base year of 2000 until
the valuation date plus 15 years to account for future mortality improvement. Post-retirement mortality
improvement for non-disabled annuitants are projected using Scale AA from the base year of 2000 for males
and 2003 for females until the valuation date plus 7 years to account for future mortality improvement.
Note 2: Public Employees’ Retirement System (PERS)
Changes of benefits terms. The vesting and benefits provisions are set by N.J.S.A. 43:15A. PERS provides
retirement, death, and disability benefits. All benefits vest after ten years of service, except for medical
benefits, which vest after 25 years of service or under the disability provisions of PERS.
Changes of assumptions. Mortality rates were based on the RP-2000 Combined Healthy Male and Female
Mortality Tables (setback 1 year for females) with adjustments for mortality improvements from the base
year of 2012 Based on Projection Scale AA.
Note 3: Schedule of School District’s Proportionate Share of the Net Pension Liability – PERS/TPAF
and Schedule of Employer’s Contribution for PERS/TPAF
The information presented in these required supplementary schedules was determined as part of the audit of
the State of New Jersey Division of Pension and Benefits. Additional information for the pension schedules
can be found in the notes to the financial statements.
52
Page 91
OTHER SUPPLEMENTARY INFORMATION
Page 92
SCHOOL BASED BUDGET SCHEDULES
N/A
Page 93
SPECIAL REVENUE FUND
Page 94
Exh
ibit E
-1
I.D
.E.A
. P
re-S
ch
oo
lP
re-S
ch
oo
lT
itle
I,
Pa
rt A
I.
D.E
.A.
Pa
rt B
Exp
an
sio
nE
du
ca
tio
nT
ota
lsB
asic
Title
II,
Pa
rtA
Title
III
Pa
rt B
, B
asic
Pre
-sch
oo
lG
rant
Pro
gra
m2016
RE
VE
NU
ES
Lo
ca
l S
ou
rce
s0.
$
0.
$
0.
$
0.
$
0.
$
0.
$
30
0,4
76
.$
3
00
,47
6.
$
Sta
te S
ou
rce
s0.
0.
0.
0.
0.
0.
22
2,6
00
.
2
22
,60
0.
Fe
de
ral S
ou
rce
s3
62
,82
2.
4
8,8
06
.
15
,07
3.
2
44
,22
8.
5
,19
1.
4
86
,29
1.
0.
1
,16
2,4
11
.
Tota
l R
evenues
36
2,8
22
.$
48
,80
6.
$
1
5,0
73
.$
24
4,2
28
.$
5,1
91
.$
48
6,2
91
.$
5
23
,07
6.
$
1,6
85
,48
7.
$
EX
PE
ND
ITU
RE
S:
Instr
uctio
n:
S
ala
rie
s o
f T
ea
ch
ers
23
8,7
99
.$
38
,73
5.
$
1
1,9
63
.$
0.
$
0.
$
26
2,1
09
.$
2
73
,05
9.
$
82
4,6
65
.$
Oth
er
Sa
larie
s f
or
Instr
uctio
n6
1,6
04
.
0.
0.
0.
4
,15
5.
6
7,5
16
.
78
,76
7.
2
12
,04
2.
O
the
r P
urc
ha
se
d S
erv
ice
s (
40
0-5
00
se
rie
s)
0.
0.
0.
1
94
,22
8.
0.
0.
0.
1
94
,22
8.
G
en
era
l S
up
plie
s332.
0.
0.
0.
0.
80
,70
5.
0.
8
1,0
37
.
To
tal in
str
uctio
n3
00
,73
5.
3
8,7
35
.
11
,96
3.
1
94
,22
8.
4
,15
5.
4
10
,33
0.
35
1,8
26
.
1
,31
1,9
72
.
Su
pp
ort
se
rvic
es:
P
ers
on
al S
erv
ice
s -
Em
plo
ye
e B
en
efits
62
,08
7.
10
,07
1.
3
,11
0.
0.
1
,03
6.
7
5,6
11
.
17
1,2
50
.
3
23
,16
5.
P
urc
ha
se
d P
rofe
ssio
na
l -
Ed
uca
tio
na
l S
erv
ice
s0.
0.
0.
5
0,0
00
.
0.
0.
0.
5
0,0
00
.
O
the
r P
urc
ha
se
d
Se
rvic
es
0.
0.
0.
0.
0.
350.
0.
350.
Ge
ne
ral S
up
plie
s0
.
0.
0.
0.
0.
0.
0.
8
0,7
05
.
To
tal su
pp
ort
se
rvic
es
62
,08
7.
10
,07
1.
3
,11
0.
50
,00
0.
1,0
36
.
75
,96
1.
1
71
,25
0.
37
3,5
15
.
To
tal e
xp
en
ditu
res
36
2,8
22
.$
48
,80
6.
$
1
5,0
73
.$
24
4,2
28
.$
5,1
91
.$
48
6,2
91
.$
5
23
,07
6.
$
1,6
85
,48
7.
$
UP
PE
R D
EE
RF
IEL
D T
OW
NS
HIP
SC
HO
OL
DIS
TR
ICT
SP
EC
IAL
RE
VE
NU
E F
UN
DC
OM
BIN
ING
SH
ED
UL
E O
F P
RO
GR
AM
RE
VE
NU
ES
AN
D E
XP
EN
DIT
UR
E
BU
DG
ET
AR
Y B
AS
ISF
OR
TH
E F
ISC
AL
YE
AR
EN
DE
D J
UN
E 3
0,
20
16
53
Page 95
EXHIBIT E-2
Budgeted Actual Variance
Expenditures:
Instruction:
Salaries - Teachers 273,059.$ 273,059.$ 0.$
Other Salaries for Instruction 78,767. 78,767. 0.
Supplies 0. 0. 0.
Total Instruction 351,826. 351,826. 0.
Support Services:
Salaries - Principal/Assistant 0. 0. 0.
Salaries - Other Professional 0. 0. 0.
Salaries - Secretarial/Clerical 0. 0. 0.
Other Salaries 0. 0. 0.
Personal Services - Employee Benefits 171,250. 171,250. 0.
Contracted Services 0. 0. 0.
Supplies 0. 0. 0.
Total Support Services 171,250. 171,250. 0.
Total Expenditures 523,076.$ 523,076.$ 0.$
Total revised 2015-2016 Pre-School Education Aid Allocation 222,600.$
Add: Actual Preschool Education Aid carryover (June 30, 2015) 0.
Add: Budgeted Transfer from General Fund 2015-2016 300,476.
Total Pre-School Education Aid Funds Available for 2015-2016 Budget 523,076.
Less: 2015-2016 Budgeted Pre-School Education Aid Including Prior Year Budget Carryover 523,076.
Available and Unbudgeted Pre-School Education Aid Funds as of June 30, 2016 0.
Add: June 30, 2016 Unexpended Pre-School Education Aid 0.
2015-2016 Carryover - Pre-School Education Aid/Pre-School 0.$
2015-2016 Pre-School Education Aid Carryover Budgeted for Pre-School Programs 2016-2017 0.$
BUDGETARY BASIS
FOR THE FISCAL YEAR ENDED JUNE 30, 2016
Total
UPPER DEERFIELD TOWNSHIP SCHOOL DISTRICT
SPECIAL REVENUE FUND
SCHEDULE OF PRE-SCHOOL EDUCATION PROGRAM
54
Page 96
CAPITAL PROJECTS FUND
Page 97
EX
HIB
IT F
-1
UP
PE
R D
EE
RF
IELD
TO
WN
SH
IP S
CH
OO
L D
IST
RIC
T
CA
PIT
AL P
RO
JE
CT
S F
UN
D
SU
MM
AR
Y S
CH
ED
ULE
OF
PR
OJE
CT
EX
PE
ND
ITU
RE
S
FO
R T
HE
YE
AR
EN
DE
D J
UN
E 3
0, 2016
Unexpended
Bala
nce
Issue/P
roje
ct T
itle
Appro
priations
Prior
Years
C
urr
ent Y
ear
June 3
0, 2016
5300-0
60-1
4-1
002
Woodru
ff E
lem
enta
ry S
chool:
Ele
ctr
ical, C
om
munic
ation, S
afe
ty47,0
92.
$
36,4
77.
$
0.
$
10,6
15.
$
5300-0
60-1
4-1
001
Eliz
abeth
F. M
oore
Ele
menta
ry S
chool:
Exte
rior
Clo
sure
, C
om
munic
ations, S
afe
ty185,0
52.
39,6
01.
119,4
97.
25,9
54.
5300-7
0-1
4-1
003
Charles F
. S
eabro
ok E
lem
enta
ry S
chool:
Ele
ctr
ical, C
om
munic
ation, S
afe
ty63,2
77.
47,8
34.
0.
15,4
43.
TO
TA
L295,4
21.
$
123,9
12.
$
119,4
97.
$
52,0
12.
$
Expenditure
s
55
Page 98
EXHIBIT F-2
UPPER DEERFIELD TOWNSHIP SCHOOL DISTRICT
CAPITAL PROJECTS FUND
SUMMARY SCHEDULE OF REVENUES, EXPENDITURES AND
FOR THE YEAR ENDED JUNE 30, 2016
Revenues and other financing sources:
State sources - SCC Grant 0.$
Bond proceeds 0.
Transfer from capital reserve 0.
Interest 37.
Total revenues 37.
Expenditures and Other Financing Uses:
Purchased professional and technical services 0.
Construction services 119,497.
Other 0.
Total expenditures 119,497.
Other financing uses:
Interest transfer to Debt Service Fund 37.
Excess (deficiency) or revenues over (under)
expenditures (119,497.)
Fund balance-beginning 171,509.$
Fund balance-ending 52,012.$
56
Page 99
EXHIBIT F-2a
UPPER DEERFIELD TOWNSHIP SCHOOL DISTRICT
CAPITAL PROJECTS FUND
SCHEDULE OF PROJECT REVENUES, EXPENDITURES, PROJECT BALANCE
FOR THE YEAR ENDED JUNE 30, 2016
WOODRUFF ELEMENTARY SCHOOL ELECTRICAL, COMMUNICATIONS,SAFETY PROJECT
FROM INCEPTION AND FOR THE YEAR ENDED JUNE 30, 2016
Revised
Authorized
Prior Periods Current Year Totals Cost
Revenues and other financing sources:
State sources - SCC Grant 23,565.$ 0.$ 23,565.$ 23,565.$
Bond proceeds 0. 0. 0. 0.
Transfer from capital reserve 23,527. 0. 23,527. 23,527.
Total revenues 47,092. 0. 47,092. 47,092.
Expenditures and Other Financing Uses:
Purchased professional and technical services 0. 0. 0. 5,969.
Construction services 36,477. 0. 36,477. 41,123.
Total expenditures 36,477. 0. 36,477. 47,092.
Excess (deficiency) or revenues over (under)
expenditures 10,615.$ 0.$ 10,615.$ 0.$
Additional project information:
DOE Project Number 5300-070-14-1002
SDA Project Number 5300-070-14-G3FJ
Grant Date 07/17/14
Grant Date 23,565.$
Bond Authorization Date N/A
Bonds Authorized N/A
Bonds Issued N/A
Original Authorized Cost 47,092.$
Additional Authorized Cost 0.$
Revised Authorized Cost 47,092.$
Percentage Increase Over Original Authorized Cost 0.00%
Percentage Completion 77.46%
57
Page 100
EXHIBIT F-2b
UPPER DEERFIELD TOWNSHIPL SCHOOL DISTRICT
CAPITAL PROJECTS FUND
SCHEDULE OF PROJECT REVENUES, EXPENDITURES, PROJECT BALANCE
FOR THE YEAR ENDED JUNE 30, 2016
ELIZABETH F MOORE ELEMENTARY SCHOOL PROJECT-EXTERIOR CLOSURE, COMMUNICATIONS,SAFETY
FROM INCEPTION AND FOR THE YEAR ENDED JUNE 30, 2016
Revised
Authorized
Prior Periods Current Year Totals Cost
Revenues and other financing sources:
State sources - SCC Grant 92,601.$ 0.$ 92,601.$ 92,601.$
Bond proceeds 0. 0. 0. 0.
Transfer from capital reserve 92,451. 0. 92,451. 92,451.
Total revenues 185,052. 0. 185,052. 185,052.
Expenditures and Other Financing Uses:
Purchased professional and technical services 10,760. 0. 10,760. 21,980.
Construction services 27,914. 119,497. 147,411. 163,072.
Other 927. 0. 927. 0.
Total expenditures 39,601. 119,497. 159,098. 185,052.
Excess (deficiency) or revenues over (under)
expenditures 145,451.$ (119,497.)$ 25,954.$ 0.$
Additional project information:
DOE Project Number 5300-060-14-1001
SDA Project Number 5300-060-14-G3FI
Grant Date 07/17/14
Grant Amount 92,601.$
Bond Authorization Date N/A
Bonds Authorized N/A
Bonds Issued N/A
Original Authorized Cost 185,052.$
Additional Authorized Cost 0.$
Revised Authorized Cost 185,052.$
Percentage Increase Over Original Authorized Cost 0.00%
Percentage Completion 85.97%
58
Page 101
EXHIBIT F-2c
UPPER DEERFIELD TOWNSHIP SCHOOL DISTRICT
CAPITAL PROJECTS FUND
SCHEDULE OF PROJECT REVENUES, EXPENDITURES, PROJECT BALANCE
FOR THE YEAR ENDED JUNE 30, 2016
CF SEABROOK ELEMENTARY SCHOOL-ELECTRICAL, COMMUNICATIONS,SAFETY PROJECT
FROM INCEPTION AND FOR THE YEAR ENDED JUNE 30, 2016
Revised
Authorized
Prior Periods Current Year Totals Cost
Revenues and other financing sources:
State sources - SCC Grant 31,664.$ 0.$ 31,664.$ 31,664.$
Bond proceeds 0. 0. 0. 0.
Transfer from capital reserve 31,613. 0. 31,613. 31,613.
Total revenues 63,277. 0. 63,277. 63,277.
0.
Expenditures and Other Financing Uses:
Construction services 47,834. 0. 47,834. 56,064.
Other 0. 0. 0. 7,213.
Total expenditures 47,834. 0. 47,834. 63,277.
Excess (deficiency) or revenues over (under)
expenditures 15,443.$ 0.$ 15,443.$ 0.$
Additional project information:
DOE Project Number 5300-070-14-1003
SDA Project Number 5300-070-14-G3Fh
Grant Date 07/17/14
Grant Date 31,664.$
Bond Authorization Date N/A
Bonds Authorized N/A
Bonds Issued N/A
Original Authorized Cost 63,277.$
Additional Authorized Cost 0.$
Revised Authorized Cost 63,277.$
Percentage Increase Over Original Authorized Cost 0.00%
Percentage Completion 75.59%
59
Page 102
PROPRIETARY FUNDS
Page 104
EXHIBIT G-1
Community
Food Service Education and
Fund Recreation Fund Total
ASSETS:
Current Assets:
Cash and cash equivalents 110,754.$ 102,078.$ 212,832.$
Accounts receivable:
State 165. 0. 165.
Federal 11,590. 0. 11,590.
Other 33,124. 11. 33,135.
Inventories 10,861. 0. 10,861.
Total current assets 166,494. 102,089. 268,583.
Fixed assets:
Equipment 219,216. 2,810. 222,026.
Accumulated depreciation (138,451.) (2,810.) (141,261.)
Total fixed assets 80,765. 0. 80,765.
Total assets 247,259.$ 102,089.$ 349,348.$
DEFERRED OUTFLOW OF RESOURCES:
LIABILITIES:
Current Liabilities:
Interfund payable 2,566.$ 0.$ 2,566.$
Accounts payable 25,553. 0. 25,553.
Total current liabilities 28,119. 0. 28,119.
DEFERRED INFLOW OF RESOURCES:
NET POSITION:
Invested in capital assets net of
related debt 80,765. 0. 80,765.
Unrestricted 138,375. 102,089. 240,464.
Total net position 219,140.$ 102,089.$ 321,229.$
UPPER DEERFIELD TOWNSHIP SCHOOL DISTRICT
ENTERPRISE FUNDS
COMBINING STATEMENT OF NET POSITION
AS OF JUNE 30, 2016
60
Page 105
EXHIBIT G-2
Community
Food Service Education and
Fund Recreation Fund Totals
OPERATING REVENUES:
Local sources:
Daily sales-reimbursable programs 70,596.$ 0.$ 70,596.$
Daily sales non-reimbursable programs 40,557. 0. 40,557.
Child care fees 0. 97,390. 97,390.
Miscellaneous Income 76. 0. 76.
Charges for service 115,049. 0. 115,049.
Total local sources 226,278. 97,390. 323,668.
Total operating revenues 226,278. 97,390. 323,668.
OPERATING EXPENSES:
Cost of sales - reimbursable 181,366. 0. 181,366.
Cost of sales - nonreimbursable 50,402. 0. 50,402.
Salaries 188,726. 52,062. 240,788.
Payroll taxes and fringe benefits 32,984. 3,983. 36,967.
Supplies 21,099. 8,233. 29,332.
Insurance 7,270. 0. 7,270.
Office expense 1,247. 250. 1,497.
Management fees 48,000. 0. 48,000.
Depreciation 12,013. 0. 12,013.
Miscellaneous 8,761. 0. 8,761.
Repair and maintenance 9,077. 0. 9,077.
Total operating expenses 560,945. 64,528. 625,473.
Operating income/(loss) (334,667.) 32,862. (301,805.)
Nonoperating revenues (expenses):
State sources:
State school lunch program 5,263. 0. 5,263.
Federal sources:
National school breakfast program 82,065. 0. 82,065.
National school lunch program 241,503. 0. 241,503.
Food distribution program 40,384. 0. 40,384.
Interest revenue 115. 136. 251.
Total nonoperation revenues 369,330. 136. 369,466.
Change in net position 34,663. 32,998. 67,661.
Net position - July 1 184,477. 69,091. 253,568.
Net position - June 30 219,140.$ 102,089.$ 321,229.$
UPPER DEERFIELD TOWNSHIP SCHOOL DISTRICT
COMBINING STATEMENT OF REVENUES, EXPENSES,
AND CHANGES IN FUND NET POSITION
FOR THE FISCAL YEAR ENDED JUNE 30, 2016
61
Page 106
EXHIBIT G-3
Community
Food Service Education and
Fund Recreation Fund Totals
CASH FLOWS FROM OPERATING ACTIVITIES
Receipts from customer 111,221.$ 97,379.$ 208,600.$
Payment to employees 0. (56,045.) (56,045.)
Cash payments to suppliers (510,168.) (8,483.) (518,651.)
Other receipts (payment) 112,323. 0. 112,323.
Net cash provided (used) by operating
activities (286,624.) 32,851. (253,773.)
CASH FLOWS FROM NONCAPITAL FINANCING ACTIVITIES:
State sources 5,286. 0. 5,286.
Federal sources 326,577. 0. 326,577.
Net cash provided by non-capital financing activities 331,863. 0. 331,863.
CASH FLOW FROM FINANCING ACTIVITIES
Purchase of equipment (3,843.) 0. (3,843.)
Interest on investments 115. 136. 251.
Net cash provided by investing activities (3,728.) 136. (3,592.)
Net increase/(decrease) in cash and cash equilvalents 41,511. 32,987. 74,498.
Cash and cash equivalents - July 1 69,243. 69,091. 138,334.
Cash and cash equivalents - June 30 110,754.$ 102,078.$ 212,832.$
Reconciliation of operating income/(loss) to
net cash provided/(used) by operating activities:
Operating income/(loss) (334,667.) 32,862. (301,805.)
Adjustments to reconcile operating loss to
cash provided (used) by operating activities:
Depreciation 12,013. 0. 12,013.
Federal commodities 40,384. 0. 40,384.
Change in assets and liabilities:
(Increase)/decrease in accounts receivable (2,801.) (11.) (2,812.)
(Increase)/decrease in inventory 2,956. 0. 2,956.
Increase/(decrease) in accounts payable (4,577.) 0. (4,577.)
Increase/(decrease) in interfund payable 68. 0. 68.
Net cash provided by (used) by operating activities (286,624.)$ 32,851.$ (253,773.)$
UPPER DEERFIELD TOWNSHIP SCHOOL DISTRICT
ENTERPRISE FUNDS
COMBINING STATEMENT OF CASH FLOWS
FOR THE FISCAL YEAR ENDED JUNE 30, 2016
62
Page 107
INTERNAL SERVICE FUND
Page 108
EXHIBIT G-4
Joint Pupil
Transportation Internal
Service Fund Total
ASSETS:
Current assets:
Cash and cash equivalents 177,780.$ 177,780.$
Accounts receivable 30,165. 30,165.
Interfund receivable 0. 0.
Total current assets 207,945. 207,945.
Fixed assets
Equipment 2,572. 2,572.
Accumulated depreciation (2,572.) (2,572.)
Total fixed assets 0. 0.
Total assets 207,945.$ 207,945.$
DEFERRED OUTFLOW OF RESOURCES: 54,872.$ 54,872.$
LIABILITIES:
Current Liabilities:
Accounts payable 198,794.$ 198,794.$
Interfund payable 685. 685.
Pension account payable 7,799. 7,799.$
Total current liabilities 207,278. 207,278.
Noncurrent liabilities:
Net pension liability 203,245. 203,245.$
Total liabilities 410,523. 410,523.
DEFERRED INFLOW OF RESOURCES: 7,683. 7,683.$
NET POSITION:
Unrestricted (155,389.) (155,389.)
Total net position (155,389.)$ (155,389.)$
UPPER DEERFIELD TOWNSHIP SCHOOL DISTRICT
INTERNAL SERVICE FUNDS
COMBINING STATEMENT OF NET POSITON
AS OF JUNE 30, 2016
63
Page 109
EXHIBIT G-5
Joint Pupil
Transportation Internal
Service Fund Total
OPERATING REVENUES:
Charges for services 2,092,878.$ 2,092,878.$
Total operating revenues 2,092,878. 2,092,878.
OPERATING EXPENSES:
Transportation costs 1,987,947. 1,987,947.
Salaries 69,973. 69,973.
Payroll taxes and fringe benefits 22,733. 22,733.
Pension expense 6,242. 6,242.
Office expense 2,255. 2,255.
Miscellaneous 4,789. 4,789.
Total operating expenses 2,093,939. 2,093,939.
Operating income/(loss) (1,061.) (1,061.)
Nonoperating revenue:
Interest revenue 216. 216.
Total nonoperating revenues 216. 216.
Change in net position (845.) (845.)
NET POSITION - JULY 1 (154,544.) (154,544.)
NET POSTION - JUNE 30 (155,389.)$ (155,389.)$
UPPER DEERFIELD TOWNSHIP SCHOOL DISTRICT
COMBINING STATEMENT OF REVENUES, EXPENSES, AND CHANGES
IN FUND NET POSITION
FOR THE FISCAL YEAR ENDED JUNE 30, 2016
INTERNAL SERVICE FUNDS
64
Page 110
EXHIBIT G-6
Joint Pupil
Transportation Internal
Service Fund Total
CASH FLOW FROM OPERATING ACTIVITIES:
Receipts from customers and users 2,092,681.$ 2,092,681.$
Payments to employees (69,973.) (69,973.)
Payments to employees' benefits (22,732.) (22,732.)
Payment to suppliers (1,995,908.) (1,995,908.)
Net cash provided (used) by operating activities 4,068. 4,068.
CASH FLOWS FOR INVESTING ACTIVITIES:
Interest on investments 216. 216.
Net cash provided (used) by financing activities 216. 216.
Net increase/decrease in cash and cash equivalents 4,284. 4,284.
Cash and cash equivalents - July 1 173,496. 173,496.
Cash and cash equivalents - June 30 177,780.$ 177,780.$
Reconciliation of operating income/(loss) to net cash provided/
(used) by operating activities:
Operating income (loss) (1,061.)$ (1,061.)$
Adjustments to reconcile operating income to net cash
provided by operating activities:
(Increase)/decrease in accounts receivable (197.) (197.)
Increase/(decrease) in accounts payables (916.) (916.)
Increase/(decrease) in pension accounts payables 31. 31.
(Increase)/decrease in deferred inflow (35,437.) (35,437.)
Increase/(decrease) in deferred outflow (7,021.) (7,021.)
Increase/(decrease) in net pension liability 48,669. 48,669.
Net cash provided (used in) operating activities 4,068.$ 4,068.$
FOR THE FISCAL YEAR ENDED JUNE 30, 2016
UPPER DEERFIELD TOWNSHIP SCHOOL DISTRICT
INTERNAL SERVICE FUNDS
COMBINING STATEMENT OF CASH FLOWS
65
Page 112
EX
HIB
IT H
-1
CF
Sea
bro
ok
Un
em
plo
ym
ent
Stu
de
nt
Will
Exp
en
da
ble
Co
mp
en
satio
n
Activity
Pa
yro
ll/A
ge
ncy
Tru
st
Fun
dT
rust
To
tal
AS
SE
TS
:
Ca
sh &
Ca
sh E
qu
iva
lents
4
0,7
55
.$
0.
$
1,0
27
,24
3.
$
1
54
,97
0.
$
1
,22
2,9
68
.$
To
tal A
sse
ts
40,7
55
.$
0.
$
1,0
27
,24
3.
$
1
54
,97
0.
$
1
,22
2,9
68
.$
DE
FE
RR
ED
OU
TF
LO
W O
F R
ES
OU
RC
ES
:
LIA
BIL
ITIE
S:
Du
e t
o S
tude
nt
Gro
up
s
40,7
55
.$
0.
$
0.
$
0.
$
40,7
55
.$
Pa
yro
ll d
ed
uctio
ns a
nd
with
ho
ldin
gs
0.
0.
0.
0.
0.
To
tal L
iabili
tie
s
40,7
55
.$
0.
$
0.
$
0.
$
40,7
55
.$
DE
FE
RR
ED
IN
FLO
W O
F R
ES
OU
RC
ES
:
NE
T P
OS
ITIO
N:
0.
0.
1,0
27
,24
3.
1
54
,97
0.
1
,18
2,2
13
.
To
tal N
et
Po
sitio
n0.
$
0.
$
1,0
27
,24
3.
$
1
54
,97
0.
$
1
,18
2,2
13
.$
UP
PE
R D
EE
RF
IELD
TO
WN
SH
IP S
CH
OO
L D
IST
RIC
T
CO
MB
ININ
G S
TA
TE
ME
NT
OF
FID
UC
IAR
Y N
ET
PO
SIT
ION
AS
OF
JU
NE
30,
201
6
66
Page 113
EXHIBIT H-2
Unemployment CF Seabrook
Compensation Will Expendable
Trust Trust Fund Total
ADDITIONS:
Contributions:
Plan Member 25,766.$ 0.$ 25,766.$
Other 88,581. 88,581.
Total Contributions 25,766. 88,581. 114,347.
Investment Earnings:
Interest 218. 1,501. 1,719.
Net Investment Earnings 218. 1,501. 1,719.
Total Additions 25,984. 90,082. 116,066.
DEDUCTIONS:
Unemployment Claims 1,480. 0. 1,480.
Other Expenses 10,309. 111,200. 121,509.
Total Deductions 11,789. 111,200. 122,989.
Change in Net Position 14,195. (21,118.) (6,923.)
NET POSITION, JULY 1 140,775. 1,048,361. 1,189,136.
NET POSITION, JUNE 30 154,970.$ 1,027,243.$ 1,182,213.$
FOR FISCAL YEAR ENDED JUNE 30, 2016
UPPER DEERFIELD TOWNSHIP SCHOOL DISTRICT
COMBINING STATEMENT OF CHANGES IN FIDUCIARY NET POSITION
FIDUCIARY FUND
67
Page 114
EXHIBIT H-3
Cash Cash
Balance Cash Cash Balance
July 1, 2015 Receipts Disbursements June 30,2016
Elementary Schools 33,236.$ 125,782.$ 118,263.$ 40,755.$
Total 33,236.$ 125,782.$ 118,263.$ 40,755.$
FOR THE FISCAL YEAR ENDED JUNE 30, 2016
UPPER DEERFIELD TOWNSHIP SCHOOL DISTRICT
STUDENT ACTIVITY AGENCY FUND SCHEDULE
OF RECEIPTS AND DISBURSEMENTS
FIDUCIARY FUND
68
Page 115
EX
HIB
IT H
-4
Ba
lan
ce
C
ash
C
ash
Ba
lan
ce
Ju
ly 1
, 2
01
5R
ece
ipts
Dis
bu
rse
me
nts
Ju
ne
30
, 2
01
6
AS
SE
TS
:
Ca
sh
& C
ash
Eq
uiv
ale
nts
6,9
55
.$
10
,47
0,3
85
.$
1
0,4
77
,34
0.
$
0.
$
To
tal A
sse
ts
6,9
55
.$
10
,47
0,3
85
.$
1
0,4
77
,34
0.
$
0.
$
LIA
BIL
ITIE
S:
Ne
t sa
larie
s, p
ayro
ll d
ed
uctio
ns &
with
ho
ldin
gs
6,5
12
.$
10
,47
0,3
85
.$
1
0,4
76
,89
7.
$
0.
$
Du
e to
Un
em
plo
ym
en
t4
43
.
44
3.
0.
To
tal L
iab
ilitie
s
6,9
55
.$
10
,47
0,3
85
.$
1
0,4
77
,34
0.
$
0.
$
FO
R T
HE
FIS
CA
L Y
EA
R E
ND
ED
JU
NE
30
, 2
01
6
UP
PE
R D
EE
RF
IEL
D T
OW
NS
HIP
SC
HO
OL
DIS
TR
ICT
PA
YR
OL
L A
GE
NC
Y F
UN
D
SC
HE
DU
LE
OF
RE
CE
IPT
S A
ND
DIS
BU
RS
EM
EN
TS
FID
UC
IAR
Y F
UN
D
69
Page 117
EX
HIB
IT I
-1
Issu
e
Date
A
mo
un
t
Sch
oo
l R
efu
nd
ing
Bo
nd
s
Se
rie
s 2
00
73
/14
/20
07
4,7
85
,00
0.
$
2
/1/2
01
64
10
,00
0.
3
.92
0%
2,7
80
,00
0.
$
0
.$
4
10
,00
0.
$
2,3
70
,00
0.
$
2/1
/20
17
40
5,0
00
.
3.9
20
%
2/1
/20
18
40
0,0
00
.
3.9
20
%
2/1
/20
19
40
0,0
00
.
3.9
20
%
2/1
/20
20
39
5,0
00
.
3.9
20
%
2/1
/20
21
39
0,0
00
.
3.9
20
%
2/1
/20
22
38
0,0
00
.
3.9
20
%
2,7
80
,00
0.
$
0
.$
4
10
,00
0.
$
2,3
70
,00
0.
$
Re
tire
d
Ba
lan
ce
Ju
ne
30
, 2
01
6
UP
PE
R D
EE
RF
IEL
D T
OW
NS
HIP
BO
AR
D O
F E
DU
CA
TIO
N
DE
BT
SE
RV
ICE
FU
ND
SC
HE
DU
LE
OF
SE
RIA
L B
ON
DS
JU
NE
30
, 2
01
6
Date
of
Issu
e
Am
ou
nt
of
Issu
e
An
nu
al M
atu
ritie
s
Inte
rest
Rate
Ba
lan
ce
Ju
ne
30
, 2
01
5Is
su
ed
70
Page 118
EXHIBIT I-3
Original
Budget
Budget
Transfer
Final
Budget Actual
Variance
Final to
Actual
REVENUES:
Local Sources:
Local tax levy 517,952.$ 0.$ 517,952.$ 517,952.$ 0.$
State Sources:
Debt Service Aid - Type II 0. 0. 0. 0. 0.
Total Revenues 517,952. 0. 517,952. 517,952. 0.
EXPENDITURES:
Regular Debt Service:
Interest 108,976. 0. 108,976. 108,976. 0.
Redemption of Principal 410,000. 0. 410,000. 410,000. 0.
Total Regular Debt Service 518,976. 0. 518,976. 518,976. 0.
Total Expenditures 518,976. 0. 518,976. 518,976. 0.
Excess (deficiency) of revenues
(over)/under expenditures (1,024.) 0. (1,024.) (1,024.) 0.
Other Financing Sources
Transfers from Capital Project Fund 0. 0. 0. 37. 37.
Fund Balance, July 1 1,657. 0. 1,657. 1,657. 0.
Fund Balance, June 30 633.$ 0.$ 633.$ 670.$ 37.$
UPPER DEERFIELD TOWNSHIP BOARD OF EDUCATION
DEBT SERVICE FUND
BUDGETARY COMPARISON SCHEDULE
FOR THE FISCAL YEAR ENDED JUNE 30, 2016
71
Page 119
STATISTICAL SECTION
Page 120
FINANCIAL TRENDS
Page 121
EX
HIB
IT J
-1
2007
2008
2009
2010
2011
2012
2013
2014
2015
2016
Govern
menta
l activitie
s
Investe
d in c
apital assets
, net of re
late
d d
ebt
10,0
99,2
45.
$
9,9
76,8
56.
$
10,1
22,4
96.
$
11,6
91,9
00.
$
12,6
45,9
03.
$
12,3
36,5
73.
$
12,2
54,9
81.
$
12,0
79,0
35.
$
12,1
12,9
37.
$
12,3
45,0
98.
$
Re
str
icte
d1,5
50,8
26.
2,4
86,8
77.
2,6
46,4
18.
1,7
04,2
22.
1,2
78,0
28.
1,3
14,6
58.
1,5
39,2
20.
1,8
86,4
04.
2,4
19,6
87.
2,7
16,0
62.
Un
restr
icte
d(6
5,1
60.)
(229,6
02.)
(530,0
06.)
(541,2
93.)
(518,5
48.)
(363,1
57.)
(537,7
89.)
(648,8
88.)
(5,0
93,1
64.)
1,3
08.
Tota
l govern
menta
l activitie
s n
et positio
n11,5
84,9
11.
$
12,2
34,1
31.
$
12,2
38,9
08.
$
12,8
54,8
29.
$
13,4
05,3
83.
$
13,2
88,0
74.
$
13,2
56,4
12.
$
13,3
16,5
51.
$
9,4
39,4
60.
$
15,0
62,4
68.
$
Busin
ess-t
ype a
ctivitie
s
Investe
d in c
apital assets
, net of re
late
d d
ebt
13,7
16.
$
18,7
79.
$
14,1
86.
$
14,9
72.
$
26,1
26.
$
98,4
60.
$
92,0
94.
$
81,1
65.
$
88,9
36.
$
80,7
65.
$
Un
restr
icte
d157,6
77.
146,6
49.
141,8
37.
168,4
42.
104,7
30.
39,4
67.
62,3
28.
125,2
25.
164,6
32.
240,4
64.
Tota
l busin
ess-t
ype a
ctivitie
s n
et positio
n171,3
93.
$
165,4
28.
$
156,0
23.
$
183,4
14.
$
130,8
56.
$
137,9
27.
$
154,4
22.
$
206,3
90.
$
253,5
68.
$
321,2
29.
$
Dis
tric
t-w
ide
Investe
d in c
apital assets
, net of re
late
d d
ebt
10,1
12,9
61.
$
9,9
95,6
35.
$
10,1
36,6
82.
$
11,7
06,8
72.
$
12,6
72,0
29.
$
12,4
35,0
33.
$
12,3
47,0
75.
$
12,1
60,2
00.
$
12,2
01,8
73.
$
12,4
25,8
63.
$
Re
str
icte
d1,5
50,8
26.
2,4
86,8
77.
2,6
46,4
18.
1,7
04,2
22.
1,2
78,0
28.
1,3
14,6
58.
1,5
39,2
20.
1,8
86,4
04.
2,4
19,6
87.
2,7
16,0
62.
Un
restr
icte
d92,5
17.
(82,9
53.)
(388,1
69.)
(372,8
51.)
(413,8
18.)
(323,6
90.)
(475,4
61.)
(523,6
63.)
(4,9
28,5
32.)
241,7
72.
Tota
l dis
tric
t net positio
n11,7
56,3
04.
$
12,3
99,5
59.
$
12,3
94,9
31.
$
13,0
38,2
43.
$
13,5
36,2
39.
$
13,4
26,0
01.
$
13,4
10,8
34.
$
13,5
22,9
41.
$
9,6
93,0
28.
$
15,3
83,6
97.
$
Fis
ca
l Y
ear
Endin
g J
une 3
0,
(Accru
al B
asis
of A
ccounting)
LA
ST
TE
N F
ISC
AL Y
EA
RS
NE
T P
OS
ITIO
N B
Y C
OM
PO
NE
NT
UP
PE
R D
EE
RF
IELD
TO
WN
SH
IP S
CH
OO
L D
IST
RIC
T
72
Page 122
EX
HIB
IT J
-2
Page 1
of 2
2007
2008
2009
2010
2011
2012
2013
2014
2015
2016
Expenses
Govern
menta
l activitie
s
Instr
uction
Re
gula
r4,5
44,9
35.
$
4,8
84,2
88.
$
4,7
94,9
18.
$
5,1
29,8
76.
$
4,6
69,4
08.
$
3,8
37,3
22.
$
3,7
52,6
39.
$
3,7
75,6
53.
$
4,0
13,4
64.
$
4,2
22,2
25.
$
Specia
l education
1,0
65,9
48.
1,0
78,4
17.
1,3
13,5
21.
1,2
97,2
96.
1,3
50,1
51.
2,2
03,2
38.
2,4
44,6
97.
2,4
90,1
51.
2,2
29,4
85.
2,3
54,4
16.
Oth
er
specia
l education
166,5
87.
108,8
12.
112,7
40.
110,4
40.
62,1
84.
141,6
66.
254,0
91.
228,3
49.
178,0
89.
174,0
65.
Oth
er
instr
uction
49,6
74.
52,5
35.
56,9
29.
68,9
46.
73,0
57.
64,6
29.
121,2
06.
128,4
79.
72,7
76.
0.
Adult/c
ontinuin
g e
ducation p
rogra
ms
Support
Serv
ice
s:
Tuitio
n203,6
02.
293,4
82.
316,3
05.
484,7
64.
292,2
83.
120,9
54.
167,6
81.
221,2
28.
134,3
08.
203,9
49.
Stu
dent &
instr
uction r
ela
ted s
erv
ice
s1,1
30,0
13.
1,1
79,9
86.
1,1
73,1
86.
1,2
72,4
12.
1,1
78,6
41.
1,1
31,3
17.
1,2
37,5
49.
1,1
99,8
96.
1,3
27,5
89.
1,6
14,5
74.
Genera
l adm
inis
tration
699,8
41.
708,7
77.
701,8
55.
698,1
65.
713,2
08.
680,8
55.
684,1
16.
688,9
50.
642,8
62.
679,7
67.
School A
dm
inis
trative S
erv
ice
s593,2
71.
607,1
81.
619,6
96.
587,8
64.
693,1
22.
709,5
32.
637,1
11.
720,1
97.
521,9
10.
507,4
46.
Pla
nt O
pera
tions a
nd M
ain
tenance
1,4
40,4
94.
1,4
42,6
34.
1,5
36,7
56.
1,5
08,9
52.
1,4
13,2
56.
1,3
65,4
84.
1,4
31,8
18.
1,4
43,6
99.
1,3
15,4
19.
1,4
74,6
61.
Pupil
transport
ation
482,2
91.
523,2
68.
609,6
72.
715,4
93.
547,5
57.
558,3
00.
585,1
68.
617,5
31.
860,5
10.
775,6
24.
Em
plo
yee B
enefits
3,0
63,6
10.
3,2
09,7
34.
2,9
73,7
45.
2,9
02,1
65.
3,3
41,0
06.
3,3
70,3
80.
3,7
33,2
45.
3,5
80,5
01.
5,2
46,0
53.
6,0
72,7
37.
Inte
rest on long-t
erm
debt
242,4
23.
217,1
16.
204,9
28.
191,0
52.
183,3
41.
163,4
98.
148,6
56.
133,0
43.
118,3
52.
102,2
80.
Tra
nsfe
r to
Chart
er
School
0.
0.
0.
0.
0.
22,9
84.
24,2
93.
10,3
68.
29,1
59.
20,5
49.
Inte
rnal S
erv
ice
Fund
1,6
30,9
09.
1,6
97,3
93.
1,7
27,6
84.
1,7
85,4
07.
1,7
86,1
35.
1,8
09,0
16.
1,8
69,7
29.
2,0
26,0
56.
2,1
00,4
53.
2,0
93,9
39.
Ne
w J
ers
ey
Debt S
erv
ice
Assessm
ent
0.
0.
0.
0.
71,6
32.
46,5
22.
67,8
49.
104,6
18.
104,6
18.
104,6
18.
Am
ort
ization o
f D
ebt Is
suance C
ost
3,9
34.
7,8
67.
7,8
67.
7,8
67.
7,8
67.
7,8
67.
7,8
67.
0.
0.
0.
Tota
l govern
menta
l activitie
s e
xpenses
15,3
17,5
32.
16,0
11,4
90.
16,1
49,8
02.
16,7
60,6
99.
16,3
82,8
48.
16,2
33,5
64.
17,1
67,7
15.
17,3
68,7
19.
18,8
95,0
47.
20,4
00,8
50.
Busin
ess-t
ype a
ctivitie
s:
Food s
erv
ice
484,8
30.
486,3
60.
473,3
46.
470,7
66.
502,4
97.
565,8
69.
546,8
45.
565,4
38.
576,1
15.
560,9
45.
Ch
ild C
are
106,1
64.
110,5
72.
117,5
99.
113,0
26.
97,4
92.
76,6
73.
44,7
02.
51,9
01.
59,9
10.
64,5
28.
Tota
l busin
ess-t
ype a
ctivitie
s e
xpense
590,9
94.
596,9
32.
590,9
45.
583,7
92.
599,9
89.
642,5
42.
591,5
47.
617,3
39.
636,0
25.
625,4
73.
Tota
l dis
tric
t expenses
15,9
08,5
26.
$
16,6
08,4
22.
$
16,7
40,7
47.
$
17,3
44,4
91.
$
16,9
82,8
37.
$
16,8
76,1
06.
$
17,7
59,2
62.
$
17,9
86,0
58.
$
19,5
31,0
72.
$
21,0
26,3
23.
$
Pro
gra
m R
evenues
Govern
menta
l activitie
s:
Ch
arg
es for
serv
ice
s:
Pupil
transport
ation
1,6
36,4
92.
$
1,7
01,7
03.
$
1,7
29,9
42.
$
1,7
64,0
02.
$
1,7
65,9
51.
$
1,7
91,5
89.
$
1,8
65,6
28.
$
2,0
28,9
32.
$
2,1
00,0
70.
$
2,0
92,8
78.
$
Opera
ting g
rants
and c
ontr
ibutions
1,3
27,0
19.
1,4
05,0
88.
851,2
05.
897,7
62.
915,2
65.
1,0
66,7
87.
1,3
31,1
39.
1,1
17,9
60.
2,7
20,7
83.
2,9
10,8
65.
Tota
l govern
menta
l activitie
s p
rogra
m r
evenues
2,9
63,5
11.
3,1
06,7
91.
2,5
81,1
47.
2,6
61,7
64.
2,6
81,2
16.
2,8
58,3
76.
3,1
96,7
67.
3,1
46,8
92.
4,8
20,8
53.
5,0
03,7
43.
Busin
ess-t
ype a
ctivitie
s:
Ch
arg
es for
serv
ice
s
Food s
erv
ice
229,2
02.
206,5
92.
207,7
95.
215,1
43.
199,1
08.
246,0
14.
242,7
93.
233,5
05.
230,1
34.
226,2
78.
Co
mm
unity
education &
recre
ation
97,8
50.
95,7
69.
86,6
85.
75,8
72.
46,5
49.
65,7
98.
49,8
50.
78,8
35.
88,0
54.
97,3
90.
Opera
ting g
rants
and c
ontr
ibutions
253,4
03.
281,5
10.
285,6
80.
319,1
10.
300,6
30.
301,5
97.
314,8
57.
356,5
08.
364,4
97.
369,2
15.
Tota
l busin
ess typ
e a
ctivitie
s p
rogra
m r
evenues
580,4
55.
583,8
71.
580,1
60.
610,1
25.
546,2
87.
613,4
09.
607,5
00.
668,8
48.
682,6
85.
692,8
83.
Tota
l dis
tric
t pro
gra
m r
evenues
3,5
43,9
66.
$
3,6
90,6
62.
$
3,1
61,3
07.
$
3,2
71,8
89.
$
3,2
27,5
03.
$
3,4
71,7
85.
$
3,8
04,2
67.
$
3,8
15,7
40.
$
5,5
03,5
38.
$
5,6
96,6
26.
$
Fis
ca
l Y
ear
Endin
g J
une 3
0,
(Accru
al B
asis
of A
ccounting)
LA
ST
TE
N F
ISC
AL Y
EA
RS
CH
AN
GE
S IN
NE
T P
OS
ITIO
N
UP
PE
R D
EE
RF
IELD
SC
HO
OL D
IST
RIC
T
73
Page 123
EX
HIB
IT J
-2
Page 2
of 2
2007
2008
2009
2010
2011
2012
2013
2014
2015
2016
Ne
t (E
xpense)/
Revenue
Govern
menta
l activitie
s(1
2,3
54,0
21.)
$
(12,9
04,6
99.)
$
(13,5
68,6
55.)
$
(14,0
98,9
35.)
$
(13,7
01,6
32.)
$
(13,3
75,1
88.)
$
(13,9
70,9
48.)
$
(14,2
21,8
27.)
$
(14,0
74,1
94.)
$
(15,3
97,1
07.)
$
Busin
ess-t
ype a
ctivitie
s(1
0,5
39.)
(13,0
61.)
(10,7
85.)
26,3
33.
(53,7
02.)
(29,1
33.)
15,9
53.
51,5
09.
46,6
60.
67,4
10.
Tota
l dis
tric
t-w
ide n
et expense
(12,3
64,5
60)
$
(12,9
17,7
60)
$
(13,5
79,4
40)
$
(14,0
72,6
02)
$
(13,7
55,3
34)
$
(13,4
04,3
21)
$
(13,9
54,9
95)
$
(14,1
70,3
18)
$
(14,0
27,5
34)
$
(15,3
29,6
97)
$
Genera
l R
evenues a
nd O
ther
Changes in N
et P
ositio
n
Govern
menta
l activitie
s:
Pro
pert
y ta
xes levie
d for
genera
l purp
oses, net
5,3
03,1
26.
$
5,6
29,2
86.
$
5,8
76,6
34.
$
5,9
68,4
00.
$
5,9
72,6
96.
$
6,1
33,8
50.
$
6,2
61,0
24.
$
6,3
86,2
44.
$
6,5
13,9
69.
$
6,6
44,2
48.
$
Taxes levie
d for
debt serv
ice
474,1
26.
489,0
82.
496,4
64.
505,5
84.
502,7
67.
508,8
90.
510,7
51.
518,7
70.
534,4
83.
517,9
52.
Gra
nts
and c
ontr
ibutions
6,7
38,1
58.
7,1
96,8
28.
7,0
46,6
36.
8,1
23,5
86.
7,5
36,3
37.
7,0
82,9
98.
6,9
74,4
91.
7,2
66,6
92.
7,4
02,6
39.
8,1
68,6
10.
Tuitio
n R
eceiv
ed
100,4
18.
106,7
11.
112,1
74.
36,8
36.
123,6
10.
79,8
99.
133,9
12.
130,1
81.
144,2
84.
79,2
06.
Investm
ent earn
ings
128,3
17.
100,5
18.
23,5
10.
16,4
92.
20,5
64.
18,3
48.
16,3
86.
10,3
34.
12,2
12.
4,9
91.
Mis
ce
llaneous incom
e
32,5
90.
31,4
94.
18,0
14.
63,9
58.
51,6
10.
42,6
75.
42,7
22.
56,5
24.
90,7
83.
74,4
88.
Bond P
rem
ium
1,3
33.
0.
0.
0.
0.
0.
0.
0.
0.
0.
Fix
ed A
ssets
Acquired fro
m F
iducia
ry F
unds
136,8
01.
0.
0.
0.
0.
0.
0.
2,9
24.
0.
0.
Do
nation o
f Land fro
m U
pper
Deerf
ield
Tow
nship
101,0
00.
0.
0.
0.
0.
0.
0.
0.
0.
0.
Prio
r ye
ar
adju
stm
ent
0.
0.
0.
0.
44,6
02.
0.
0.
(110,9
42.)
37,2
14.
0.
Tra
nsfe
rs(9
47.)
0.
0.
0.
0.
0.
0.
88,1
03.
0.
0.
Tota
l govern
menta
l activitie
s13,0
14,9
22.
13,5
53,9
19.
13,5
73,4
32.
14,7
14,8
56.
14,2
52,1
86.
13,8
66,6
60.
13,9
39,2
86.
14,3
48,8
30.
14,7
35,5
84.
15,4
89,4
95.
Busin
ess-t
ype a
ctivitie
s:
Investm
ent earn
ings
10,9
30.
7,0
96.
1,3
80.
1,0
58.
1,1
44.
719.
546.
459.
518.
251.
Tota
l busin
ess-t
ype a
ctivitie
s10,9
30.
7,0
96.
1,3
80.
1,0
58.
1,1
44.
719.
546.
459.
518.
251.
Tota
l dis
tric
t-w
ide
13,0
25,8
52.
$
13,5
61,0
15.
$
13,5
74,8
12.
$
14,7
15,9
14.
$
14,2
53,3
30.
$
13,8
67,3
79.
$
13,9
39,8
32.
$
14,3
49,2
89.
$
14,7
36,1
02.
$
15,4
89,7
46.
$
Ch
ange in N
et P
ositio
n
Govern
menta
l activitie
s660,9
01.
$
649,2
20.
$
4,7
77.
$
615,9
21.
$
550,5
54.
$
491,4
72.
$
(31,6
62.)
$
127,0
03.
$
661,3
90.
$
92,3
88.
$
Busin
ess-t
ype a
ctivitie
s391.
(5,9
65.)
(9,4
05.)
27,3
91.
(52,5
58.)
(28,4
14.)
16,4
99.
51,9
68.
47,1
78.
67,6
61.
Tota
l dis
tric
t661,2
92.
$
643,2
55.
$
(4,6
28.)
$
643,3
12.
$
497,9
96.
$
463,0
58.
$
(15,1
63.)
$
178,9
71.
$
708,5
68.
$
160,0
49.
$
UP
PE
R D
EE
RF
IEL
D S
CH
OO
L D
IST
RIC
T
CH
AN
GE
S IN
NE
T P
OS
ITIO
N
LA
ST
TE
N F
ISC
AL
YE
AR
S
(Accru
al B
asis
of A
ccounting) F
isca
l Y
ear
Endin
g J
une 3
0,
74
Page 124
Exhib
it J
-3
2007
2008
2009
2010
2011
2012
2013
2014
2015
2016
Genera
l F
und
Reserv
ed
1,5
44,1
18.
$
2,4
85,3
04.
$
1,3
07,2
91.
$
1,1
91,4
69.
$
953,3
07.
$
1,5
03,7
81.
$
1,5
89,1
30.
$
1,9
26,0
85.
$
2,3
32,3
27.
$
2,6
89,4
00.
$
Unre
serv
ed
197,5
69.
(1,1
52.)
(241,0
65.)
(342,9
74.)
(298,6
97.)
(323,9
23.)
(326,9
45.)
(337,4
14.)
(113,4
80.)
(334,8
07.)
Tota
l genera
l fu
nd
1,7
41,6
87.
$
2,4
84,1
52.
$
1,0
66,2
26.
$
848,4
95.
$
654,6
10.
$
1,1
79,8
58.
$
1,2
62,1
85.
$
1,5
88,6
71.
$
2,2
18,8
47.
$
2,3
54,5
93.
$
All
Oth
er
Govern
menta
l F
unds
Reserv
ed
0.
$
0.
$
0.
$
1,0
06,0
92.
$
0.
$
0.
$
0.
$
0.
$
0.
$
0.
$
Unre
serv
ed, re
port
ed in:
Specia
l re
venue f
und
(52,4
04.)
(61,4
79.)
(23,3
43.)
(24,1
26.)
(24,8
36.)
(22,7
07.)
(21,6
90.)
(27,4
54.)
(25,2
28.)
(22,2
60.)
Capital pro
jects
fund
0.
1,5
73.
1,3
39,1
26.
(463,7
47.)
319,8
47.
31,6
90.
22,8
39.
0.
85,7
03.
25,9
92.
Debt serv
ice f
und
6,7
08.
0.
1.
2,1
25.
4,8
74.
4,3
74.
2,1
89.
1,5
89.
1,6
57.
670.
Tota
l all
oth
er
govern
menta
l fu
nds
(45,6
96)
$
(59,9
06)
$
1,3
15,7
84
$
520,3
44
$
299,8
85
$
13,3
57
$
3,3
38
$
(25,8
65)
$
62,1
32
$
4,4
02
$
(modifie
d a
ccru
al basis
of accounting)
Last T
en F
iscal Y
ears
Fund B
ala
nces, G
overn
menta
l F
unds,
Upper
Deefield
School D
istr
ict
Fis
cal Y
ear
Endin
g J
une 3
0,
75
Page 125
Exh
ibit J
-4
Pa
ge
1 o
f 2
20
07
20
08
20
09
20
10
20
11
20
12
20
13
20
14
20
15
20
16
Re
ve
nu
e
Ta
x le
vy
5,7
77
,25
2.
$
6,1
18
,36
8.
$
6,3
73
,09
8.
$
6,4
73
,98
4.
$
6,4
75
,46
3.
$
6,6
42
,74
0.
$
6,7
71
,77
5.
$
6,9
05
,01
4.
$
7,0
48
,45
2.
$
7,1
62
,20
0.
$
Tu
itio
n c
ha
rge
s1
00
,41
8.
1
06
,71
1.
1
12
,17
4.
3
6,8
36
.
1
23
,61
0.
7
9,8
99
.
1
33
,91
2.
1
30
,18
1.
1
44
,28
4.
7
9,2
06
.
Inte
rest
ea
rnin
gs
11
8,0
64
.
94
,22
3.
22
,43
7.
14
,77
9.
19
,22
3.
18
,34
8.
16
,38
6.
9,7
14
.
11
,46
1.
4,7
75
.
Mis
ce
llan
eo
us
32
,59
0.
31
,49
4.
18
,01
4.
63
,95
8.
51
,61
0.
42
,67
5.
42
,72
2.
56
,52
4.
90
,78
3.
74
,48
8.
Sta
te s
ou
rce
s7
,38
1,4
28
.
7
,94
7,3
57
.
7
,17
4,6
95
.
7
,13
2,2
73
.
7
,51
6,9
33
.
7
,28
1,1
24
.
7
,62
0,1
76
.
7
,68
9,5
67
.
7
,90
6,7
55
.
8
,02
3,7
99
.
Fe
de
ral so
urc
es
68
3,7
49
.
65
4,5
59
.
72
3,1
46
.
1,8
89
,07
5.
93
4,6
69
.
86
8,6
61
.
68
5,4
54
.
69
5,0
85
.
78
0,1
58
.
1,1
55
,01
2.
To
tal R
eve
nu
e1
4,0
93
,50
1.
$
1
4,9
52
,71
2.
$
1
4,4
23
,56
4.
$
1
5,6
10
,90
5.
$
1
5,1
21
,50
8.
$
1
4,9
33
,44
7.
$
1
5,2
70
,42
5.
$
1
5,4
86
,08
5.
$
1
5,9
81
,89
3.
$
1
6,4
99
,48
0.
$
Exp
en
ditu
res
Instr
uctio
n:
Re
gu
lar
Instr
uctio
n4
,28
8,8
92
.$
4
,63
4,9
69
.$
4
,53
4,5
84
.$
4
,86
6,0
00
.$
4
,37
1,4
50
.$
3
,55
0,0
23
.$
3
,75
2,6
39
.$
3
,77
5,6
53
.$
3
,70
6,7
14
.$
3
,91
1,5
79
.$
Sp
ecia
l E
du
ca
tio
n I
nstr
uctio
n1
,01
6,7
71
.
1
,03
0,4
38
.
1
,26
6,1
87
.
1
,24
9,3
18
.
1
,29
5,9
77
.
2
,15
1,0
02
.
2
,14
7,2
11
.
2
,16
8,5
79
.
2
,17
3,7
13
.
2
,29
7,9
36
.
Oth
er
Sp
ecia
l In
str
uctio
n1
66
,58
7.
1
08
,81
2.
1
12
,74
0.
1
10
,44
0.
6
2,1
84
.
1
41
,66
6.
2
54
,09
1.
2
28
,34
9.
1
78
,08
9.
1
74
,06
5.
Oth
er
Instr
uctio
n
49
,67
4.
52
,53
5.
56
,92
9.
68
,94
6.
73
,05
7.
64
,62
9.
67
,11
8.
70
,01
2.
72
,77
6.
0.
Su
pp
ort
Se
rvic
es
Tu
itio
n2
03
,60
2.
2
93
,48
2.
3
16
,30
5.
4
84
,76
4.
2
92
,28
3.
1
20
,95
4.
1
67
,68
1.
2
21
,22
8.
1
34
,30
8.
2
03
,94
9.
Stu
de
nt
& in
st.
re
late
d s
erv
ice
s1
,08
0,8
36
.
1
,13
2,0
07
.
1
,12
5,8
52
.
1
,22
4,4
34
.
1
,12
4,4
67
.
1
,07
9,0
81
.
1
,18
3,4
61
.
1
,14
1,4
29
.
1
,27
1,8
17
.
1
,55
8,0
94
.
Ge
ne
ral a
dm
inis
tra
tio
n6
45
,74
6.
6
56
,00
1.
6
59
,06
6.
6
51
,82
6.
6
59
,54
6.
6
59
,09
2.
6
24
,61
9.
6
24
,63
6.
4
60
,56
0.
6
17
,63
8.
Sch
oo
l A
dm
inis
tra
tio
n s
erv
ice
s5
39
,17
6.
5
54
,40
5.
5
76
,90
8.
5
41
,52
6.
6
39
,46
0.
6
30
,41
6.
5
77
,61
4.
6
55
,88
3.
5
81
,51
2.
4
45
,31
7.
Pla
nt
Op
era
tio
ns a
nd
Ma
inte
na
nce
1,4
25
,74
2.
1,4
28
,24
0.
1,5
22
,55
6.
1,4
94
,55
9.
1,3
97
,00
4.
1,3
49
,81
3.
1,4
15
,59
1.
1,4
26
,15
9.
1,2
98
,68
8.
1,4
57
,71
8.
Pu
pil
tra
nsp
ort
atio
n4
82
,29
1.
5
23
,26
8.
6
09
,67
2.
7
15
,49
3.
5
47
,55
7.
5
58
,30
0.
5
85
,16
8.
6
17
,53
1.
8
60
,51
0.
7
75
,62
4.
Oth
er
su
pp
ort
se
rvic
es
Em
plo
ye
e B
en
efits
3,0
72
,31
5.
3,2
53
,63
4.
2,8
73
,65
5.
2,9
83
,76
0.
3,3
72
,83
8.
3,3
42
,83
3.
3,7
16
,40
5.
3,5
75
,86
6.
3,6
66
,38
8.
3,9
93
,84
0.
Tra
nsfe
r to
Ch
art
er
Sch
oo
ls
0.
0
.
0.
0
.
0.
2
2,9
84
.
2
4,2
93
.
1
0,3
68
.
2
9,1
59
.
2
0,5
49
.
Ca
pita
l O
utla
y1
48
,48
2.
3
7,0
22
.
3
38
,12
2.
1
,70
2,5
01
.
1
,17
0,4
87
.
4
92
,15
8.
1
48
,16
4.
1
09
,51
8.
2
94
,43
8.
4
46
,17
9.
De
bt
Se
rvic
e
Prin
cip
al
26
4,4
10
.
30
5,8
12
.
31
2,2
97
.
33
3,8
05
.
34
0,4
28
.
36
2,1
37
.
37
8,9
75
.
40
0,9
05
.
41
0,0
00
.
41
0,0
00
.
Inte
rest
an
d o
the
r ch
arg
es
27
2,0
47
.
21
3,8
32
.
21
0,9
27
.
19
6,7
04
.
18
9,1
14
.
16
9,6
39
.
15
5,0
87
.
13
9,8
47
.
12
5,0
48
.
10
8,9
76
.
To
tal E
xp
en
ditu
res
13
,65
6,5
71
.$
14
,22
4,4
57
.$
14
,51
5,8
00
.$
16
,62
4,0
76
.$
15
,53
5,8
52
.$
14
,69
4,7
27
.$
15
,19
8,1
17
.$
15
,16
5,9
63
.$
15
,26
3,7
20
.$
16
,42
1,4
64
.$
Exce
ss (
De
ficie
ncy)
of
reve
nu
es
ove
r (u
nd
er)
exp
en
ditu
res
43
6,9
30
.$
72
8,2
55
.$
(92
,23
6.)
$
(1,0
13
,17
1.)
$
(4
14
,34
4.)
$
2
38
,72
0.
$
7
2,3
08
.$
3
20
,12
2.
$
7
18
,17
3.
$
7
8,0
16
.$
(mo
difie
d a
ccru
al b
asis
of
acco
un
tin
g)
La
st
Te
n F
isca
l Y
ea
rs
Ch
an
ge
s in
Fu
nd
Ba
lan
ce
s,
Go
ve
rnm
en
tal F
un
ds,
Up
pe
r D
ee
rfie
ld T
ow
nsh
ip S
ch
oo
l D
istr
ict
Fis
ca
l Y
ea
r E
nd
ing
Ju
ne
30
,
76
Page 126
Exh
ibit J
-4
Pa
ge
2 o
f 2
20
07
20
08
20
09
20
10
20
11
20
12
20
13
20
14
20
15
20
16
(mo
difie
d a
ccru
al b
asis
of
acco
un
tin
g)
La
st
Te
n F
isca
l Y
ea
rs
Ch
an
ge
s in
Fu
nd
Ba
lan
ce
s,
Go
ve
rnm
en
tal F
un
ds,
Up
pe
r D
ee
rfie
ld T
ow
nsh
ip S
ch
oo
l D
istr
ict
Fis
ca
l Y
ea
r E
nd
ing
Ju
ne
30
,
Oth
er
Fin
an
cin
g s
ou
rce
s (
use
s)
Bo
nd
Pre
miu
m
1,3
33
.
0.
0
.
0.
0
.
0.
0
.
0.
0
.
0.
Prio
r ye
ar
Ad
justm
en
t 0
.
0.
0
.
0.
0
.
0.
0
.
(11
0,9
42
.)
0.
0
.
Ca
pita
l L
ea
se
s (
no
n-b
ud
ge
ted
)0
.
0.
5
0,0
00
.
0
.
0.
0
.
0.
0
.
0.
0
.
Do
na
tio
n o
f la
nd
fro
m U
pp
er
De
erf
ield
1
01
,00
0.
0
.
0.
0
.
0.
0
.
0.
0
.
0.
0
.
Do
na
tio
n o
f la
nd
fro
m U
pp
er
De
erf
ield
(1
01
,00
0.)
0
.
0.
0
.
0.
0
.
0.
0
.
0.
0
.
Tra
nsfe
rs in
0.
0
.
1,3
85
,76
7.
2,1
24
.
26
2,7
49
.
1,6
24
.
56
4.
8
9,1
26
.
1
48
,22
4.
3
00
,51
3.
Tra
nsfe
rs o
ut
0.
0
.
(1,3
85
,76
7.)
(2
,12
4.)
(2
62
,74
9.)
(1
,62
4.)
(5
64
.)
(1
,02
3.)
(1
48
,22
4.)
(3
00
,51
3.)
To
tal O
the
r F
ina
ncin
g s
ou
rce
s (
use
s)
0.
$
0
.$
50
,00
0.
$
0.
$
0
.$
0.
$
0
.$
(22
,83
9.)
$
0.
$
0
.$
Ne
t C
ha
ng
e in
fu
nd
ba
lan
ce
43
6,9
30
.$
72
8,2
55
.$
(42
,23
6.)
$
(1,0
13
,17
1.)
$
(4
14
,34
4.)
$
2
38
,72
0.
$
7
2,3
08
.$
2
97
,28
3.
$
7
18
,17
3.
$
7
8,0
16
.$
De
bt
se
rvic
e a
s a
pe
rce
nta
ge
of
no
nca
pita
l e
xp
en
ditu
res
3.9
7%
3.6
6%
3.6
9%
3.5
6%
3.6
9%
3.7
4%
3.5
5%
3.5
9%
3.5
7%
3.2
5%
77
Page 127
Exh
ibit J
-5
Fis
cal Y
ea
r
En
de
d
Ju
ne
30
,T
uitio
n
Inte
rest
on
Inve
stm
en
ts
Ren
t
Refu
nd
of
Prior
Ye
ar's
Exp
en
ditu
res
Te
lep
ho
ne
/
En
erg
y
Reb
ate
s
Mis
c.
To
tal
20
07
10
0,4
18
.$
11
8,0
64
.$
0.
$
0
.$
0.
$
3
2,5
90
.$
2
51
,07
2.
$
20
08
10
6,7
11
.
94
,22
3.
4,0
30
.
6,3
16
.
0.
2
1,1
48
.
2
32
,42
8.
20
09
11
2,1
74
.
22
,43
7.
4,3
47
.
3,8
24
.
0.
9
,84
3.
1
52
,62
5.
20
10
36
,83
6.
12
,65
5.
4,5
95
.
35
,15
3.
22
,67
7.
1,5
33
.
11
3,4
49
.
20
11
12
3,6
10
.
16
,47
4.
5,3
93
.
78
9.
2
6,5
48
.
1
8,8
80
.
1
91
,69
4.
20
12
79
,89
9.
16
,72
4.
6,8
65
.
19
,90
7.
6,7
58
.
9,1
45
.
13
9,2
98
.
20
13
13
3,9
12
.
15
,82
2.
8,9
51
.
14
,55
3.
6,4
96
.
12
,72
2.
19
2,4
56
.
20
15
13
0,1
81
.
8,6
91
.
9,1
18
.
12
,99
6.
17
,61
0.
14
,54
3.
19
3,1
39
.
20
15
14
4,2
84
.
11
,46
1.
12
,83
1.
18
,86
7.
17
,02
1.
41
,18
8.
24
5,6
52
.
20
16
79
,20
6.
4,7
38
.
18
,43
1.
33
,41
7.
14
,36
9.
8,2
71
.
15
8,4
32
.
So
urc
e:
Dis
tric
t re
co
rds
Un
au
dite
d
LA
ST
TE
N F
ISC
AL Y
EA
RS
GE
NE
RA
L F
UN
D -
OT
HE
R L
OC
AL R
EV
EN
UE
BY
SO
UR
CE
UP
PE
R D
EE
RF
IEL
D T
OW
NS
HIP
SC
HO
OL
DIS
TR
ICT
78
Page 128
REVENUE CAPACITY
Page 129
EXHIBIT J-6
Year Estimated
Ended Net Assessed Full Cash
Dec. 31 Valuations Valuations
2006 414,074,483. 528,714,356.
2007 421,881,678. 588,207,884.
2008 433,113,262. 728,773,880.
2009 434,564,399. 757,247,096.
2010 419,994,185. 683,593,123.
2011 424,194,653. 696,056,777.
2012 630,201,916. 631,326,018.
2013 628,117,666. 618,417,150.
2014 634,807,543. 630,327,118.
2015 631,661,246. 640,884,881.
Source: Abstract of Ratables, County Board of Taxation
98.56%
101.57%
100.71%
UPPER DEERFIELD TOWNSHIP SCHOOL DISTRICT
ASSESSED AND ESTIMATED ACTUAL VALUE
LAST TEN YEARS
UNAUDITED
OF TAXABLE PROPERTY
57.39%
61.44%
60.94%
99.82%
59.43%
71.72%
Percentage of Net
Assessed to Estimated
Full Cash Valuations
78.32%
79
Page 130
EX
HIB
IT J
-7
Fis
cal
Tota
l
Year
Genera
l (F
rom
J-6
)C
um
berland
Upper
Direct and
Ended
Basic
O
blig
ation
Tota
l D
irect
Regio
nal S
chool
Deerf
ield
Cum
berland
Overlappin
g
June 3
0,
Rate
(a)
Debt S
erv
ice (
b)
School T
ax R
ate
Dis
tric
tT
ow
nship
County
Tax R
ate
2006
1.2
56
$
0.1
29
$
1.3
85
0.7
14
$
N/A
1.3
26
$
3.4
25
2007
1.2
97
0.1
13
1.4
10
0.7
46
N/A
1.3
76
3.5
32
2008
1.3
29
0.1
14
1.4
43
0.7
39
N/A
1.6
01
3.7
83
2009
1.3
63
0.1
16
1.4
79
0.7
35
N/A
1.5
66
3.7
80
2010
1.4
19
0.1
23
1.5
42
0.7
07
N/A
1.4
67
3.7
16
2011
1.4
28
0.1
19
1.5
47
0.6
70
N/A
1.5
70
3.7
87
2012
0.9
84
0.0
81
1.0
65
0.4
55
0.0
30
0.9
47
2.4
97
2013
1.0
07
0.0
82
1.0
89
0.4
45
0.0
45
0.9
69
2.5
48
2014
1.0
17
0.0
82
1.0
99
0.4
50
0.0
61
1.0
35
2.6
45
2015
1.0
41
0.0
84
1.1
25
0.5
10
0.0
87
1.1
19
2.8
41
Sourc
e: M
unic
ipal T
ax C
olle
cto
r
Note
: N
JS
A 1
8A
:7F
-5d lim
its the a
mount th
at th
e d
istr
ict can s
ubm
it f
or
a g
enera
l fu
nd tax levy.
T
he levy w
hen a
dded to o
ther
com
ponents
of
the d
istr
ict's
net budget m
ay n
ot exceed the
p
re-b
udget year
net budget by m
ore
than the s
pendin
g g
row
th lim
itation c
alc
ula
ted a
s
f
ollo
ws: th
e p
re-b
udget year
net budget in
cre
ased b
y th
e c
ost of
livin
g o
r 2.5
perc
ent,
w
hic
hever
is g
reate
r, p
lus a
ny
spendin
g g
row
th a
dju
stm
ents
.
a T
he d
istr
ict's
basic
tax r
ate
is c
alc
ula
ted f
rom
the A
4F
form
whic
h is s
ubm
itte
d w
ith the
b
udget and the N
et valu
ation taxable
b R
ate
s f
or
debt serv
ice a
re b
ased o
n e
ach y
ear's r
equirem
ents
Upper
Deerf
ield
Tow
nship
School D
irect R
ate
Overlappin
g R
ate
s
UP
PE
R D
EE
RF
IELD
TO
WN
SH
IP S
CH
OO
L D
IST
RIC
T
DIR
EC
T A
ND
OV
ER
LA
PP
ING
PR
OP
ER
TY
TA
X R
AT
ES
LA
ST
TE
N F
ISC
AL Y
EA
RS
(Rate
per
$100 o
f A
ssessed V
alu
e)
80
Page 131
EX
HIB
IT J
-8
% o
f T
ota
l%
of
Tota
l
Taxable
Dis
tric
t N
et
Taxable
Dis
tric
t N
et
Assessed
Rank
Assessed
Assessed
Rank
Assessed
Taxpayer
Valu
e(O
ptional)
Valu
eV
alu
e(O
ptional)
Valu
e
Walm
art
TR
S L
LC
13,9
54,9
00.
$
2.2
1%
Cedar-
Carll's
Corn
er
LLC
10,7
55,6
00.
1.7
0%
KM
T P
ropert
ies L
LC
9,3
35,7
00.
1.4
8%
Seabro
ok B
ros. &
Sons
7,1
37,9
00.
1.1
3%
Cle
ment P
apas C
o., Inc.
6,8
64,0
00.
1.0
9%
Upper
Deerf
ield
Sta
tion L
P6,6
29,7
00.
1.0
5%
Founders
Realty
III
6,1
53,4
00.
0.9
7%
Upper
Deerf
ield
Adult L
ivin
g, LLC
4,6
00,0
00.
0.7
3%
Bridgeto
n R
ealty A
ssoc., L
LC
3,6
16,4
00.
0.5
7%
AtlanticC
ity
Ele
ctr
ic C
o.
3,2
03,3
00.
0.5
1%
Tota
l72,2
50,9
00.
$
11.4
4%
0.
$
0.0
0%
Sourc
e: M
unic
ipal T
ax A
ssessor
Seabro
ok H
ousin
g C
orp
.
Info
rmation N
ot A
vaila
ble
2015
2006
UP
PE
R D
EE
RF
IELD
TO
WN
SH
IP S
CH
OO
L D
IST
RIC
T
PR
INC
IPA
L P
RO
PE
RT
Y T
AX
PA
YE
RS
,
CU
RR
EN
T Y
EA
R A
ND
NIN
E Y
EA
RS
AG
O
81
Page 132
EXHIBIT J-9
Fiscal Taxes Collection
Year Levies For in
Ended and Percentage Subsequent
June 30, Collections Amount of Levy Year
2007 5,777,252.$ 5,777,252.$ 100.00%
2008 5,947,810. 5,947,810. 100.00%
2009 6,373,098. 6,373,098. 100.00%
2010 6,423,541. 6,423,541. 100.00%
2011 6,475,463. 6,475,463. 100.00%
2012 6,642,740. 6,642,740. 100.00%
2013 6,771,775. 6,771,775. 100.00%
2014 6,905,014. 6,905,014. 100.00%
2015 7,048,452. 7,048,452. 100.00%
2016 7,162,200. 7,162,200. 100.00%
Source: District records including the Certificate and Report of School
Taxes (A4F Form)
a School taxes are collected by the Municipal Tax Collector.
Under New Jersey State Statue, a municipal is required to
remit to the school district the entire property tax balance,
in the amount voted upon or certified prior to the end of the
the school year.
Collected Within the Fiscal
Year of the Levy (a)
UPPER DEERFIELD TOWNSHIP SCHOOL DISTRICT
PROPERTY TAX LEVIES AND COLLECTIONS
LAST TEN FISCAL YEARS
82
Page 134
EX
HIB
IT J
-10
Busin
ess-
Fis
cal
Bond
Type
Perc
enta
ge
Year
Genera
l C
ert
ific
ate
sA
nticip
ation
Activitie
sof
Ended
Oblig
ation
of
Capital
Note
sC
apital
Tota
l P
ers
onal
June 3
0,
Bonds (
b)
Part
icip
ation
Leases
(BA
Ns)
Leases
Dis
tric
tIn
com
e (
a)
Per
Capita (
a)
2007
5,6
24,3
57.
$
21,8
93.
$
5,6
46,2
50.
$
2.4
7%
712.
$
2008
5,3
18,5
45.
7,3
31.
5,3
25,8
76
2.2
4%
662.
2009
5,0
06,2
48.
38,7
74.
5,0
45,0
22
1.9
3%
611.
2010
4,6
72,4
43.
25,9
01.
4,6
98,3
44
1.7
7%
565.
2011
4,3
32,0
16.
14,0
41.
4,3
46,0
57
1.6
7%
567.
2012
3,9
69,8
79.
3,9
69,8
79
1.4
7%
518.
2013
3,5
90,9
04.
3,5
90,9
04
1.2
8%
468.
2014
3,1
90,0
00.
3,1
90,0
00
1.1
7%
419.
2015
2,7
80,0
00.
2,7
80,0
00
1.0
3%
365.
2016
2,3
70,0
00.
2,3
70,0
00
N/A
312.
Note
: D
eta
ils r
egard
ing the d
istr
ict's
outs
tandin
g d
ebt can b
e f
ound in the n
ote
s to the f
inancia
l sta
tem
ents
.
aS
ee E
xhib
it N
J J
-14 f
or
pers
onal in
com
e a
nd p
opula
tion d
ata
. T
hese r
atios a
re c
alc
ula
ted u
sin
g
pers
onal in
com
e a
nd p
opula
tion f
or
the p
rior
cale
ndar
year.
bIn
clu
des E
arly
Retire
ment In
centive P
lan (
ER
IP)
refu
ndin
g
Govern
menta
l A
ctivitie
s
UP
PE
R D
EE
RF
IELD
TO
WN
SH
IP S
CH
OO
L D
IST
RIC
T
RA
TIO
S O
F O
UT
ST
AN
DIN
G D
EB
T T
YP
E
LA
ST
TE
N F
ISC
AL Y
EA
RS
83
Page 135
EX
HIB
IT J
-11
Net
Perc
enta
ge
Fis
cal
Genera
lof
Actu
al
Year
Genera
l B
onded
Taxable
Ended
Oblig
ation
Debt
Valu
e (
a)
of
June 3
0,
Bonds
Deductions
Outs
tandin
gP
ropert
yP
er
Capita (
b)
2007
5,6
24,3
57
5,6
24,3
57
1.3
6%
699
2008
5,3
18,5
45
5,3
18,5
45
1.2
6%
644
2009
5,0
06,2
48
5,0
06,2
48
1.1
6%
602
2010
4,6
72,4
43
4,6
72,4
43
1.0
8%
609
2011
4,3
32,0
16
4,3
32,0
16
1.0
3%
565
2012
3,9
69,8
79
3,9
69,8
79
0.9
4%
518
2013
3,5
90,9
04
3,5
90,9
04
0.5
7%
471
2014
3,1
90,0
00
3,1
90,0
00
0.5
1%
419
2015
2,7
80,0
00
2,7
80,0
00
0.4
4%
366
2016
2,3
70,0
00
2,3
70,0
00
N/A
N/A
Note
s:
Deta
ils r
egard
ing the d
istr
ict's o
uts
tandin
g d
ebt can b
e f
ound in the n
ote
s
to the f
inancia
l sta
tem
ents
.
aS
ee E
xhib
it N
J J
-6 f
or
pro
pert
y tax d
ata
.
bP
opula
tion d
ata
can b
e f
oung in E
xhib
it N
J J
-14
Genera
l B
onded D
ebt O
uts
tandin
g
UP
PE
R D
EE
RF
IELD
TO
WN
SH
IP S
CH
OO
L D
IST
RIC
T
RA
TIO
S O
F N
ET
GE
NE
RA
L B
ON
DE
D D
EB
T O
UT
ST
AN
DIN
G
LA
ST
TE
N F
ISC
AL Y
EA
RS
84
Page 136
EX
HIB
IT J
-12
Estim
ate
d
Estim
ate
d S
ha
re
De
bt
Pe
rce
nta
ge
of
Ove
rla
pp
ing
Go
ve
rnm
en
tal U
nit
Ou
tsta
nd
ing
Ap
plic
ab
le (
a)
De
bt
De
bt R
ep
aid
With
Pro
pe
rty T
axe
s:
U
pp
er
De
erf
ield
To
wn
sh
ip1
,20
5,2
50
.$
10
0.0
00
%1
,20
5,2
50
.$
C
ou
nty
of
Cu
mb
erl
an
d -
To
wn
sh
ip's
Sh
are
86
,58
1,1
51
.
7.3
75
%6
,38
5,3
60
.
Oth
er
De
bt
C
um
be
rla
nd
Re
gio
na
l S
ch
oo
l D
istr
ict -
To
wn
sh
ip's
Sh
are
3,2
20
,94
2.
10
0.0
00
%3
,22
0,9
42
.
Su
bto
tal, O
ve
rla
pp
ing
De
bt
10
,81
1,5
52
.
Up
pe
r D
ee
rfie
ld T
ow
nsh
ip S
ch
oo
l D
istr
ict D
ire
ct D
eb
t2
,37
0,0
00
.
To
tal D
ire
ct &
Ove
rla
pp
ing
De
bt
13
,18
1,5
52
.$
So
urc
es:
Asse
sse
d v
alu
e d
ata
use
d to
estim
ate
ap
plic
ab
le p
erc
en
tag
es p
rovid
ed
by C
ou
nty
Bo
ard
of
Ta
xa
tio
n.
De
bt o
uts
tan
din
g d
ata
pro
vid
ed
by e
ach
go
ve
rnm
en
t u
nit.
No
te:
Ove
rla
pp
ing
go
ve
rnm
en
ts a
re th
ose
th
at co
nin
cid
e, a
t le
ast in
pa
rt, w
ith
th
e g
eo
gra
ph
ic b
ou
nd
ari
es o
f th
e
Dis
tric
t. T
his
sch
ed
ule
estim
ate
s th
e p
ort
ion
of
the
ou
tsta
nd
ing
de
bt o
f th
ose
ove
rla
pp
ing
go
ve
rnm
en
ts th
at
is b
orn
e b
y th
e r
esid
en
ts a
nd
bu
sin
esse
s o
f U
pp
er
De
erf
ield
To
wn
sh
ip. T
his
pro
ce
ss r
eco
gn
ize
s th
at w
he
n
co
nsid
eri
ng
th
e D
istr
ict's
ab
ility
to
issu
e a
nd
re
pa
y lo
ng
-te
rm d
eb
t, th
e e
ntire
de
bt b
urd
en
bo
rne
by th
e r
esid
en
ts a
nd
bu
sin
esse
s s
ho
uld
be
ta
ke
n in
to a
cco
un
t. H
ow
eve
r, th
is d
oe
s n
ot im
ply
th
at e
ve
ry ta
xp
aye
r is
a r
esid
en
t,
an
d th
ere
fore
, re
sp
on
sib
le f
or
rep
ayin
g th
e d
eb
t, o
f e
ach
ove
rla
pp
ing
pa
ym
en
t.
aF
or
de
bt re
pa
id w
ith
pro
pe
rty ta
xe
s, th
e p
erc
en
tag
e o
f o
ve
rla
pp
ing
de
bt a
pp
lica
ble
is e
stim
ate
d u
sin
g
taxa
ble
asse
sse
d p
rop
ert
y v
alu
es. A
pp
lica
ble
pe
rce
nta
ge
s w
ere
estim
ate
d b
y d
ete
rmin
ing
th
e p
ort
ion
of
an
oth
er
go
ve
rnm
en
tal u
nit's
ta
xa
ble
va
lue
th
at is
with
in th
e d
istr
ict's
bo
un
da
rie
s a
nd
div
idin
g it b
y e
ach
un
it's
to
tal ta
xa
ble
va
lue
.
UP
PE
R D
EE
RF
IEL
D T
OW
NS
HIP
SC
HO
OL
DIS
TR
ICT
DIR
EC
T A
ND
OV
ER
LA
PP
ING
GO
VE
RN
ME
NT
AL
AC
TIV
ITIE
S D
EB
T
AS
OF
JU
NE
30
, 2
01
6
85
Page 137
Exh
ibit J
-13
20
07
20
08
20
09
20
10
20
11
20
12
20
13
20
14
20
15
20
16
De
bt L
imit
15
,05
0,2
33
.$
17
,58
2,3
81
.$
19
,91
7,8
61
.$
21
,10
5,5
54
.$
2
0,7
57
,37
1.
$
19
,76
5,8
51
.$
19
,08
1,3
23
.$
18
,55
2,6
09
.$
18
,67
6,4
68
.$
18
,70
8,7
03
.$
To
tal N
et D
eb
t A
pp
lica
ble
to
Lim
it5
,62
4,3
57
5,3
18
,54
5
5,0
06
,24
8
4,6
72
,44
3
4,3
32
,01
6
3,9
69
,87
9
3,5
90
,90
4
3,1
90
,00
0
2,7
80
,00
0
2,3
70
,00
0
Le
ga
l D
eb
t M
arg
in9
,42
5,8
76
$
12
,26
3,8
36
$
14
,91
1,6
13
$
16
,43
3,1
11
$
16
,42
5,3
55
$
15
,79
5,9
72
$
15
,49
0,4
19
$
15
,36
2,6
09
$
15
,89
6,4
68
$
16
,33
8,7
03
$
To
tal N
et D
eb
t A
pp
lica
ble
to
th
e L
imit
a
s a
Pe
rce
nta
ge
of D
eb
t L
imit
37
.37
%3
0.2
5%
25
.13
%2
2.1
4%
20
.87
%2
0.0
8%
18
.82
%1
7.1
9%
14
.89
%1
2.6
7%
L
eg
al D
eb
t M
arg
in C
alc
ula
tio
n fo
r F
isca
l Y
ea
r 2
01
6
Eq
ua
lize
d V
alu
atio
n B
asis
20
15
61
7,4
00
,47
0.
$
20
14
63
6,2
99
,20
6.
20
13
61
7,1
70
,59
0.
1,8
70
,87
0,2
66
$
Ave
rag
e E
qu
aliz
ed
Va
lua
tio
n o
f T
axa
ble
Pro
pe
rty
62
3,6
23
,42
2
De
bt L
imit (
3 %
of A
ve
rag
e E
qu
aliz
atio
n V
alu
e)
18
,70
8,7
03
(a)
To
tal N
et D
eb
t A
pp
lica
ble
to
Lim
it2
,37
0,0
00
Le
ga
l D
eb
t M
arg
in1
6,3
38
,70
3
So
urc
e: E
qu
aliz
ed
va
lua
tio
n b
ase
s w
ere
ob
tain
ed
fro
m th
e A
nn
ua
l R
ep
ort
of th
e S
tate
of N
ew
Je
rse
y, D
ep
art
me
nt o
f T
rea
su
ry, D
ivis
ion
of T
axa
tio
n
(a)
Lim
it s
et b
y N
JS
A 1
8A
:24
-19
fo
r a
K th
rou
gh
12
dis
tric
t; o
the
r %
lim
its w
ou
ld b
e a
pp
lica
ble
fo
r o
the
r d
istr
ict ty
pe
s.
FIS
CA
L Y
EA
R
UP
PE
R D
EE
RF
IEL
D T
OW
NS
HIP
SC
HO
OL
DIS
TR
ICT
LE
GA
L D
EB
T M
AR
GIN
IN
FO
RM
AT
ION
LA
ST
TE
N F
ISC
AL
YE
AR
S
86
Page 138
DEMOGRAPHIC AND ECONOMIC
INFORMATION
Page 139
EXHIBIT J-14
Per Capita
Personal Personal Unemployment
Year Population (a) Income (b) Income ( c ) Rate (d)
2006 7,934 228,768,956.$ 28,834.$ 5.10%
2007 8,045 238,123,955. 29,599. 4.60%
2008 8,259 261,983,739. 31,721. 5.60%
2009 8,317 265,121,009. 31,877. 9.70%
2010 7,668 259,998,876. 33,907. 10.40%
2011 7,668 270,465,696. 35,272. 12.00%
2012 7,668 280,273,068. 36,551. 13.50%
2013 7,619 272,950,675. 35,825. 7.40%
2014 7,618 270,195,224. 35,468. 7.50%
2015 7,586 N/A N/A 6.20%
Source:
a Population information provided by the NJ Dept of Labor and
Workforce Development
b Personal income has been estimated based upon the municipal
population and per capita personal income presented
c Per capita personal income by county estimated based upon
the 2000 Census published by the US Bureau of Economic Analysis
d Unemployment data provided by the N.J. Dept. of Labor and
Workforce Development
UPPER DEERFIELD TOWNSHIP SCHOOL DISTRICT
DEMOGRAPHIC AND ECONOMIC STATISTICS
LAST TEN FISCAL YEARS
87
Page 140
EX
HIB
IT J
-15
% o
f T
ota
l
Perc
enta
ge o
f P
erc
enta
ge o
f
Tota
l M
unic
ipal
Tota
l M
unic
ipal
Em
plo
yer
Em
plo
yees
Rank
Em
plo
ym
ent
Em
plo
yees
Rank
Em
plo
ym
ent
00
.00
%
Sourc
e: T
op E
mplo
yeer
of
Cum
berl
and C
ounty
Info
rmation N
ot
Availa
ble
20
15
20
06
UP
PE
R D
EE
RF
IELD
TO
WN
SH
IP S
CH
OO
L D
IST
RIC
T
PR
INC
IPA
L E
MP
LO
YE
RS
CU
RR
EN
T Y
EA
R A
ND
NIN
E Y
EA
RS
AG
O
88
Page 141
OPERATING INFORMATION
Page 142
EX
HIB
IT J
-16
Function/P
rogra
m2007
2008
2009
2010
2011
2012
2013
2014
2015
2016
Instr
uction:
Regula
r81
83
83
80
79
79
76
76
76
76
Specia
l E
ducation
14
14
14
24
24
24
27
26
27
27
Oth
er
Specia
l E
ducation
12
12
12
51
11
11
1
Support
Serv
ices:
Stu
dent
& I
nstr
uction R
ela
ted S
erv
ices
18
18
19
17
15
15
15
15
15
15
Genera
l A
dm
inis
trative S
erv
ices
44
42
22
22
22
School A
dm
inis
trative S
erv
ices
33
36
55
55
55
Oth
er
Adm
inis
trative S
erv
ices
33
30
00
00
00
Centr
al S
erv
ices
00
03
33
33
33
Adm
inis
trative I
nfo
rmation T
echnolo
gy
00
01
11
11
11
Pla
nt
Opera
tions &
Main
tenance
15
15
15
14
12
12
12
12
12
12
Pupil
Tra
nsport
ation
00
00
00
00
00
Oth
er
support
serv
ices
22
22
22
22
22
Tota
l152
154
155
154
144
144
144
143
144
144
Sourc
e:
Dis
tric
t P
ers
onnel R
ecord
s
UP
PE
R D
EE
RF
IELD
TO
WN
SH
IP S
CH
OO
L D
IST
RIC
T
FU
LL-T
IME
EQ
UIV
ALE
NT
DIS
TR
ICT
EM
PLO
YE
ES
BY
FU
NC
TIO
N/P
RO
GR
AM
LA
ST
TE
N F
ISC
AL Y
EA
RS
89
Page 143
EX
HIB
IT J
-17
Avera
ge
Avera
ge
% C
hange In
Daily
Daily
Avera
ge
Stu
dent
Fis
cal
Opera
ting
Cost
Perc
enta
ge
Teachin
gM
iddle
Enro
llment
Attendance
Daily
Attendance
Year
Enro
llment
Expenditure
s (
a)
Per
Pupil
Change
Sta
ff (
b)
Ele
menta
ryS
chool
(AD
E)
(c)
(AD
A)
(c)
Enro
llment
Perc
enta
ge
2007
833
$12,9
70,6
32.
$15,5
71.
2.7
2%
90
8:9
9:6
912
861
2.7
0%
94.4
1%
2008
889
13,6
67,7
91.
15,3
74.
(1.2
6)%
92
10:1
8:7
893
843
(2.0
8)%
94.4
0%
2009
874
13,6
54,4
54.
15,6
23.
1.6
2%
92
10:4
8:7
888
840
(0.5
6)%
94.5
9%
2010
935
14,4
17,7
08.
15,4
20.
(1.3
0)%
94
9:5
8:6
931
877
4.8
4%
94.2
0%
2011
891
13,8
41,6
23.
15,5
35.
0.7
5%
87
10:3
10:1
898
852
(3.5
4)%
94.8
8%
2012
859
13,6
70,7
93.
15,9
15.
2.4
5%
87
10:3
10:1
856
817
(4.6
8)%
95.4
4%
2013
897
14,5
15,8
91.
16,1
83.
1.6
8%
88
10:3
10:1
898
850
4.9
1%
94.6
5%
2014
906
14,5
15,6
93.
16,0
22.
(0.9
9)%
87
10:3
10:1
906
862
0.8
9%
95.1
4%
2015
906
14,4
34,2
34.
15,9
32.
(0.5
6)%
88
10:3
10:1
914
868
0.8
8%
94.9
7%
2016
906
15,4
56,3
09.
17,0
60.
7.0
8%
87
10:3
10:1
906
859
(0.8
8)%
94.8
1%
Sourc
es:
Dis
tric
t re
cord
s
Note
:E
nro
llment based o
n a
nnual O
cto
ber
dis
tric
t count.
aO
pera
ting e
xpenditure
s e
qual to
tal expenditure
s less d
ebt serv
ice a
nd c
apital outlay.
bT
eachin
g s
taff
inclu
des o
nly
full-
tim
e e
quiv
ale
nts
of
cert
ific
ate
d s
taff
.
cA
vera
ge d
aily
enro
llment and a
vera
ge d
aily
attendance a
re o
bta
ined f
rom
the S
chool R
egis
ter
Sum
mary
(S
RS
).
UP
PE
R D
EE
RF
IELD
TO
WN
SH
IP S
CH
OO
L D
IST
RIC
T
OP
ER
AT
ING
ST
AT
IST
ICS
LA
ST
TE
N F
ISC
AL Y
EA
RS
Pupil/
Teacher
Ratio
90
Page 144
EX
HIB
IT J
-18
Dis
tric
t B
uild
ing
20
07
20
08
20
09
20
10
20
11
20
12
20
13
20
14
20
15
20
16
Ele
me
nta
ry:
C.F
. S
ea
bro
ok E
lem
en
tary
Sch
oo
l (1
95
7)
Sq
ua
re F
ee
t 7
0,6
66
70
,66
67
0,6
66
70
,66
67
0,6
66
70
,66
67
0,6
66
70
,66
67
0,6
66
70
,66
6
Ca
pa
city (
Stu
de
nts
)4
37
43
74
37
43
74
37
43
74
37
43
74
37
43
7
En
rollm
en
t4
49
44
94
43
43
84
16
41
24
51
45
24
52
45
2
Eliz
ab
eth
Mo
ore
Ele
me
nta
ry S
ch
oo
l (1
92
3)
Sq
ua
re F
ee
t4
8,8
94
48
,89
44
8,8
94
48
,89
44
8,8
94
48
,89
44
8,8
94
48
,89
44
8,8
94
48
,89
4
Ca
pa
city (
Stu
de
nts
)2
97
29
72
97
29
72
97
29
72
97
29
72
97
29
7
En
rollm
en
t 1
96
19
61
79
19
71
81
16
01
69
17
01
70
17
0
Mid
dle
Sch
oo
l:
Wo
od
ruff
Mid
dle
Sch
oo
l (1
97
5)
Sq
ua
re F
ee
t6
4,0
00
64
,00
06
4,0
00
64
,00
06
4,0
00
64
,00
06
4,0
00
64
,00
06
4,0
00
64
,00
0
Ca
pa
city (
Stu
de
nts
)2
59
25
92
59
25
92
59
25
92
59
25
92
59
25
9
En
rollm
en
t2
74
27
42
78
28
32
93
28
72
84
28
42
84
28
4
Oth
er:
Ce
ntr
al A
dm
inis
tra
tio
n (
19
36
)
Sq
ua
re F
ee
t1
,20
01
,20
01
,20
01
,20
01
,20
01
,20
01
,20
01
,20
01
,20
01
,20
0
Fa
cili
ty B
uild
ing
(2
00
6)
Sq
ua
re F
ee
t5
,00
05
,00
05
,00
05
,00
05
,00
05
,00
05
,00
05
,00
05
,00
05
,00
0
Nu
mb
er
of
Sch
oo
ls a
t Ju
ne
30
, 2
01
6:
Ele
me
nta
ry =
2
Mid
dle
Sch
oo
l =
1
Oth
er
= 2
So
urc
e:
Dis
tric
t F
acili
tie
s O
ffic
e
No
te:
Ye
ar
of
orig
ina
l co
nstr
uctio
n is s
ho
wn
in
pa
ren
the
se
s.
In
cre
ase
s in
sq
ua
re f
oo
tag
e a
nd
ca
pa
city a
re t
he
re
su
lt o
f a
dd
itio
ns.
En
rollm
en
t is
ba
se
d o
n t
he
an
nu
al O
cto
be
r d
istr
ict
co
un
t.
UP
PE
R D
EE
RF
IEL
D T
OW
NS
HIP
SC
HO
OL
DIS
TR
ICT
SC
HO
OL
BU
ILD
ING
IN
FO
RM
AT
ION
LA
ST
TE
N F
ISC
AL
YE
AR
S
91
Page 145
EXHIBIT J-19
UPPER DEERFIELD TOWNSHIP SCHOOL DISTRICT
SCHEDULE OF REQUIRED MAINTENANCE
LAST TEN FISCAL YEARS
UNDISTRIBUTED EXPENDITURES - REQUIRED
MAINTENANCE FOR SCHOOL FACILITIES
11-000-261-xxx
*School Facilities
Project #(s) Administration Seabrook Moore Woodruff Total
2007 $30,540. $129,146. $61,013. $57,051. $277,750.
2008 33,239. 156,573. 73,893. 56,305. 320,010.
2009 38,756. 139,502. 74,587. 69,711. 322,556.
2010 41,383. 90,749. 48,650. 58,029. 238,811.
2011 26,000. 48,490. 39,637. 36,892. 151,019.
2012 37,343. 77,143. 24,573. 91,197. 230,256.
2013 66,896. 79,260. 59,099. 107,047. 312,302.
2014 5,162. 67,090. 49,027. 136,760. 258,039.
2015 61,894. 22,541. 21,033. 26,625. 132,093.
2016 167,418. 75,553. 72,753. 37,699. 353,423.
.
Total School Facilities $ 508,631. $ 886,047. $ 524,265. $ 677,316. $ 2,596,259.
* School facilities as defined under EFCFA.
(N.J.A.C. 6A:26-1.2 and N.J.A.C. 6A:26A-1.3)
Source: District records
92
Page 146
EXHIBIT J-20
Page 1 of 2
UPPER DEERFIELD TOWNSHIP SCHOOL DISTRICT
INSURANCE SCHEDULE
JUNE 30, 2016
UNAUDITED
The Board of Education of the Township of Upper Deerfield is a member of the Gloucester Cumberland Salem
School Districts Joint Insurance Fund (GCSSDJIF)
The GCSSDJIF is a Joint Insurance Fund as defined under the Provisions of NJSA 18A:18B 1-10. The Fund
was formed by its member districts on July 1, 1998 to provide a long-term alternative to the conventional insurance
market as a means of stabilizing the otherwise cyclical nature of insurance expenditures. It achieves this goal
by pooling together member district resources, deciding on what insurance coverage it will offer and/or purchase
and at what retention, and by hiring professionals to run the Fund.
The Fund's underwriting includes workers' compensation, property, general liability, automobile liability, crime,
educator's legal liability, boiler and machinery and pollution legal liability insurances.
The coverages provided to members of the GCSSDJIF for the period of July 1, 2015 to June 30, 2016
are as follows:
2015-2016
I. Property, Inland Marine and Automobile Physical Damages
A. Limits of Liability: $150,000,000. Per Occurrence
1. GCSSDJIF Self Insured Retention $250,000. Per Occurrence
2. Member District Deductible $500. Per Occurrence
3. Perils Included "All Risk"
B. Property Valuation
1. Buildings and Contents Replacement Cost
2. Contractors Equipment Actual Cash Value
3. Automobiles Actual Cash Value
II. Boiler and Machinery
A. Limits of Liability $125,000,000.
1. GCSSDJIF Self Insured Retention None
2. Member District Deductible $1,000.
III. Crime
A. Limits of Liability $500,000.
1. GCSSDJIF Self Insured Retention $250,000.
2. Member District Deductible $500.
IV. Automobile Liability
A. Limits of Liability: $15,000,000.
1. GCSSDJIF Self Insured Retention (SIR) $250,000.
2. Member District Deductible None
V. Workers' Compensation
A. Limits of Liability: Statutory
1. GCSSDJIF Self Insured Retention $250,000.
2. Member District Deductible None
VI. Educator's Legal Liability
A. Limits of Liability: $15,000,000.
1. GCSSDJIF Self Insured Retention $175,000.
2. Member District Deductible None
93
Page 147
EXHIBIT J-20
Page 2 of 2
UPPER DEERFIELD TOWNSHIP SCHOOL DISTRICT
INSURANCE SCHEDULE
JUNE 30, 2015
UNAUDITED
VII. Pollution Legal Liability
A. Limits of Liability: $3,000,000.
1. GCSSDJIF Self Insured Retention None
2. Member District Deductible $25,000.
VIII. Cyber Liability:
A. Limits of Liability: $1,000,000.
1. GCSSDJIF Self Insured Retention $25,000.
2. Member District Deductible None
IX. Cyber Liability:
A. Limits of Liability: $1,000,000.
1. GCSSDJIF Self Insured Retention None
2. Member District Deductible $15,000.
Excess and Reinsurance Carriers Involved
Property and Crime SPELLJIF, Selective Ins. Co. of America
General Liability and Employee Benefits SPELLJIF, Selective Ins. Co. of America
Workers Compensation SPELLJIF, Selective Ins. Co. of America
Educators Legal Liability SPELLJIF, Selective Ins. Co. of America
Group Purchase of Primary Insurance Coverage Carrier Array
Boiler and Machinery Travelers Insurance Company
Pollution Legal Liabiality AIG/Commerce and Industry Insurance Company
Cyber Liability AIG/Lexington Insurance Company
Violent Malicious Acts Lloyd's of London
Surety Bonds
Board Secretary - Cherie Bratty $ 50,000.
Treasurer - Susan Robostello $ 250,000.
Storage Tank Insurance Zurich Insurance Company
A. Limits of Liability: $1,000,000.
1. Deductible $5,000.
Student Accident Insurance Arthur J. Gallagher
A. Limits of Liability: $1,000,000.
Other Insurance:
Molestation $5,000,000.
Earthquake (Annual Aggregate) $75,000,000.
Flood (Annual Aggregate) $50,000,000.
Underground Property $1,000,000.
Unnamed Locations $10,000,000.
Automatic Builder's Risk $5,000,000.
94
Page 148
SINGLE AUDIT SECTION
Page 149
K-1
REPORT ON INTERNAL CONTROL
OVER FINANCIAL REPORTING AND ON COMPLIANCE AND
OTHER MATTERS BASED ON AN AUDIT
OF FINANCIAL STATEMENTS PERFORMED IN ACCORDANCE
WITH GOVERNMENT AUDITING STANDARDS
Independent Auditor’s Report
Honorable President and
Members of the Board of Education
Upper Deerfield Township School District
County of Cumberland, New Jersey
We have audited, in accordance with auditing standards generally accepted in the United States of America and the
standards applicable to financial audits contained in Government Auditing Standards, issued by the Comptroller
General of the United States; and audit requirements as prescribed by the Office of School Finance, Department of
Education, State of New Jersey, the financial statements of the governmental activities, the business-type activities,
each major fund, and the aggregate remaining fund information of the Board of Education of the Upper Deerfield
Township School District in the County of Cumberland, State of New Jersey, as of and for the fiscal year ended June
30, 2016, and the related notes to the financial statements, which collectively comprise Upper Deerfield Township
Board of Education’s basic financial statements, and have issued our report thereon dated November 18, 2016.
Internal Control Over Financial Reporting
In planning and performing our audit of the financial statements, we considered the Upper Deerfield Township
Board of Education’s internal control over financial reporting (internal control) to determine the audit procedures
that are appropriate in the circumstances for the purpose of expressing our opinions on the financial statements, but
not for the purpose of expressing an opinion on the effectiveness of the Upper Deerfield Township Board of
Education’s internal control. Accordingly, we do not express an opinion on the effectiveness of the Upper Deerfield
Township Board of Education’s internal control.
A deficiency in internal control exists when the design or operation of a control does not allow management or
employees, in the normal course of performing their assigned functions, to prevent, or detect and correct
misstatements on a timely basis. A material weakness is a deficiency, or combination of deficiencies, in internal
control, such that there is a reasonable possibility that a material misstatement of the entity’s financial statements will
not be prevented, or detected and corrected on a timely basis. A significant deficiency is a deficiency, or a
combination of deficiencies, in internal control that is less severe than a material weakness, yet important enough to
merit attention by those charged with governance.
Our consideration of internal control was for the limited purpose described in the first paragraph of this section and
was not designed to identify all deficiencies in internal control that might be material weakness or significant
deficiencies. Given these limitations, during our audit we did not identify any deficiencies in internal control that
we consider to be material weaknesses. However, material weaknesses may exist that have not been identified.
95
Page 150
K-1
Compliance and Other Matters
As part of obtaining reasonable assurance about whether the Upper Deerfield Township Board of Education’s
financial statements are free from material misstatement, we performed tests of its compliance with certain
provisions of laws, regulations, contracts and grant agreements, noncompliance with which could have a direct and
material effect on the determination of financial statement amounts. However, providing an opinion on compliance
with those provisions was not an objective of our audit, and accordingly, we do not express such an opinion. The
results of our tests disclosed no instances of noncompliance or other matters that are required to be reported under
Government Auditing Standards and audit requirements as prescribed by the Office of School Finance, Department
of Education, State of New Jersey.
Purpose of this Report
The purpose of this report is solely to describe the scope of our testing of internal control and compliance and the
results of that testing, and not to provide an opinion on the effectiveness of the entity’s internal control or on
compliance. This report is an integral part of an audit performed in accordance with Government Auditing
Standards, in considering the entity’s internal control and compliance. Accordingly, this communication is not
suitable for any other purpose.
Respectfully submitted,
Samuel A. Delp, Jr.
Public School Accountant, #745
Triantos & Delp
Certified Public Accountants, LLC
November 18, 2016
96
Page 151
K-2
REPORT ON COMPLIANCE FOR EACH MAJOR PROGRAM AND ON INTERNAL
CONTROL OVER COMPLIANCE; AND REPORT ON SCHEDULE OF EXPENDITURES OF
FEDERAL AWARDS, AND REPORT ON SCHEDULE OF EXPENDITURES OF STATE
AWARDS, REQUIRED BY UNIFORM GUIDANCE AND NEW JERSEY OMB CIRCULAR 15-08
Independent Auditor’s Report
Honorable President and
Members of the Board of Education
Upper Deerfield Township School District
County of Cumberland, New Jersey
Report on Compliance for Each Major Federal and State Program
We have audited the Board of Education of the Upper Deerfield Township School District, in the County
of Cumberland, State of New Jersey, compliance with the types of compliance requirements described in
the OMB Compliance Supplement and the New Jersey State Aid/Grant Compliance Supplement that
could have a direct and material effect on each of Upper Deerfield Township Board of Education’s major
federal and state programs for the year ended June 30, 2016. Upper Deerfield Township Board of
Education’s major federal and state programs are identified in the summary of auditor’s results section of
the accompanying schedule of findings and questioned costs.
Management’s Responsibility
Management is responsible for compliance with the requirements of laws, regulations, contracts and
grants applicable to each of its federal and state programs.
Auditor’s Responsibility
Our responsibility is to express an opinion on compliance for each of Upper Deerfield Township Board
of Education’s major federal and state programs based on our audit of the types of compliance
requirements referred to above. We conducted our audit of compliance in accordance with auditing
standards generally accepted in the United States of America; the standards applicable to financial audits
contained in Government Auditing Standards, issued by the Comptroller General of the United States;
and the audit requirements of Title 2 U.S. Code of Federal Regulations Part 200, Uniform Administrative
Requirement, Cost Principles, and Audit Requirements for Federal Awards (Uniform Guidance); and the
audit requirements as prescribed by the Office of School Finance, Department of Education, State of
New Jersey; and New Jersey OMB’s Circular 15-08, Single Audit Policy for Recipients of Federal
Grants, State Grants and State Aid. Those standards, the Uniform Guidance and New Jersey OMB’s
Circular 15-08, require that we plan and perform the audit to obtain reasonable assurance about whether
noncompliance with the types of compliance requirements referred to above that could have a direct and
material effect on a major federal or state program occurred. An audit includes examining, on a test
basis, evidence about the Upper Deerfield Township Board of Education’s compliance with those
requirements and performing such other procedures as we considered necessary in the circumstances.
We believe that our audit provides a reasonable basis for our opinion on compliance for each major
federal and state program. However, our audit does not provide a legal determination of the Upper
Deerfield Township Board of Education’s compliance.
97
Page 152
K-2
Opinion on Each Major Federal and State Program
In our opinion, the Board of Education of the Upper Deerfield Township School District, in the County
of Cumberland, State of New Jersey, complied, in all material respects, with the types of compliance
requirements referred to above that could have a direct and material effect on its major federal and state
programs for the fiscal year ended June 30, 2016.
Other Matters
The results of our auditing procedures disclosed instances on noncompliance, which are required to be
reported in accordance with the Uniform Guidance and which are described in the accompanying
schedule of findings and questioned costs as item 2016-01. Our opinion on each major federal program
is not modified with respect to these matters.
Report on Internal Control Over Compliance
Management of the Upper Deerfield Township Board of Education is responsible for establishing and
maintaining effective internal control over compliance with the types of compliance requirements
referred to above. In planning and performing our audit of compliance, we considered Upper Deerfield
Township Board of Education’s internal control over compliance with the types of requirements that
could have a direct and material effect on each major federal or state program to determine the auditing
procedures that are appropriate in the circumstances for the purpose of expressing an opinion on
compliance for each major federal and state program and to test and report on internal control over
compliance in accordance with Uniform Guidance, and the New Jersey State Aid/Grant Compliance
Supplement, but not for the purpose of expressing an opinion on the effectiveness of internal control over
compliance. Accordingly, we do not express an opinion on the effectiveness of Upper Deerfield
Township Board of Education’s internal control over compliance.
A deficiency in internal control over compliance exists when the design or operation of a control over
compliance does not allow management or employees, in the normal course of performing their assigned
functions, to prevent, or detect and correct, noncompliance with a type of compliance requirement of a
federal or state program on a timely basis. A material weakness in internal control over compliance is a
deficiency, or combination of deficiencies, in internal control over compliance, such that there is a
reasonable possibility that material noncompliance with a type of compliance requirement of a federal or
state program will not be prevented, or detected and corrected, on a timely basis. A significant deficiency
in internal control over compliance is a deficiency, or a combination of deficiencies, in internal control
over compliance with a type of compliance requirement of a federal or state program that is less severe
than a material weakness in internal control over compliance, yet important enough to merit attention by
those charged with governance.
Our consideration of the internal control over compliance was for the limited purpose described in the
first paragraph of this section and was not designed to identify all deficiencies in internal control over
compliance that might be material weaknesses or significant deficiencies. We did not identify any
deficiencies in internal control over compliance that we consider to be material weaknesses. However,
material weaknesses may exist that have not been identified.
The purpose of this report on internal control over compliance is solely to describe the scope of our
testing of internal control over compliance and the results of that testing based on the requirements of
Uniform Guidance and NJ OMB Circular 15-08. Accordingly, this report is not suitable for any other
purpose.
98
Page 153
K-2
Report on Schedule of Expenditures of Federal Awards Required by the Uniform Guidance and Schedule
of Expenditure of State Awards Required by the New Jersey OMB’s Circular 15-08
We have audited the financial statements of Board of Education of Upper Deerfield Township School
District in the County of Cumberland, State of New Jersey as of and for the year ended June 30, 2016,
and have issued our report thereon dated November 18, 2016, which contained an unmodified opinion on
those financial statements. Our audit was conducted for the purpose of forming an opinion on the
financial statements as the whole. The accompanying schedule of expenditures of federal awards and
schedule of expenditures of state awards, are presented for purposes of additional analysis as required by
the Uniform Guidance and New Jersey OMB’s Circular 15-08 and are not a required part of the financial
statements. Such information is the responsibility of management and was derived from and relates
directly to the underlying accounting and other records used to prepare the financial statements. The
information has been subjected to the auditing procedures applied in the audit of the financial statements
and certain additional procedures, including comparing and reconciling such information directly to the
underlying accounting and other records used to prepare the financial statements or to the financial
statements themselves, and other additional procedures in accordance with auditing standards generally
accepted in the United States of America. In our opinion, the schedule of expenditures of federal awards
and schedule of expenditures of state awards are fairly stated in all material respects in relation to the
financial statements as a whole.
Respectfully submitted,
Samuel A. Delp, Jr.
Public School Accountant, #745
Triantos & Delp
Certified Public Accountants, LLC
November 18, 2016
99
Page 154
K-3
SC
HE
DU
LE
A
Pa
ge
1 o
f 2
Fe
de
ral
Fe
de
ral
Gra
nt o
r S
tate
Pro
gra
m o
rB
ala
nce
Ca
rryo
ve
r/
Fe
de
ral G
ran
tor/
Pa
ss-T
hro
ug
h G
ran
tor/
CF
DA
FA
INP
roje
ct
Aw
ard
G
ran
t P
erio
da
t Ju
ne
30
,(W
alk
ove
r)C
ash
Bu
dg
eta
ry
Pro
gra
m T
itle
Nu
mb
er
Nu
mb
er
Nu
mb
er
Am
ou
nt
Fro
mT
o2
01
5A
mo
un
tR
ece
ive
dE
xp
en
ditu
res
Ad
justm
en
ts
U.S
. D
ep
art
me
nt o
f E
du
ca
tio
n
Ge
ne
ral F
un
d:
Me
dic
al A
ssis
tan
ce
Pro
gra
m9
3.7
78
16
05
NJM
AP
N/A
60
,90
9.
$
07
/01
/15
-0
6/3
0/1
60
.$
0.
$
34
,40
9.
$
(60
,90
9.)
$
0.
$
To
tal G
en
era
l F
un
d0
.
0.
34
,40
9.
(60
,90
9.)
0.
U.S
. D
ep
art
me
nt o
f E
du
ca
tio
n
Pa
sse
d-t
hro
ug
h S
tate
De
pa
rtm
en
t o
f E
du
ca
tio
n
Sp
ecia
l R
eve
nu
e F
un
d:
Title
I, P
art
A8
4.0
10
AS
A1
0A
15
00
30
NC
LB
-53
00
15
36
2,8
23
.$
0
7/0
1/1
5-
06
/30
/16
0.
0.
30
3,9
12
.
(36
2,8
22
.)
0.
Title
I, P
art
A8
4.0
10
AS
A1
0A
15
00
30
NC
LB
-53
00
15
36
3,7
59
.$
0
7/0
1/1
4-
06
/30
/15
(16
0,5
21
.)
0.
16
0,5
21
.
0.
0.
Title
II, P
art
A
84
.36
7A
S3
67
A1
50
02
9N
CL
B-5
30
01
64
8,8
06
.$
07
/01
/15
-0
6/3
0/1
60
.
0.
38
,73
5.
(48
,80
6.)
0.
Title
II, P
art
A
84
.36
7A
S3
67
A1
50
02
9N
CL
B-5
30
01
54
9,1
02
.$
07
/01
/14
-0
6/3
0/1
5(2
6,1
72
.)
0.
26
,17
2.
0.
0.
Title
III
84
.36
5A
S3
65
A1
50
03
0N
CL
B-5
30
01
61
5,0
73
.$
07
/01
/15
-0
6/3
0/1
60
.
0.
11
,96
3.
(15
,07
3.)
0.
Title
III
84
.36
5A
S3
65
A1
50
03
0N
CL
B-5
30
01
51
5,6
05
.$
07
/01
/14
-0
6/3
0/1
5(6
,75
8.)
0.
6,7
58
.
0.
0.
I.D
.E.A
. P
art
A, B
asic
8
4.0
27
H0
27
A1
50
10
0F
T-5
30
01
62
44
,22
8.
$
07
/01
/15
-0
6/3
0/1
60
.
0.
24
4,2
28
.
(24
4,2
28
.)
0.
I.D
.E.A
. P
art
A, B
asic
8
4.0
27
H0
27
A1
50
10
0F
T-5
30
01
52
32
,42
8.
$
07
/01
/14
-0
6/3
0/1
5(2
8,5
80
.)
0.
28
,58
0.
0.
0.
I.D
.E.A
. P
art
A, P
resch
oo
l8
4.1
73
H1
73
A1
50
11
4P
S-5
30
01
65
,23
5.
$
07
/01
/15
-0
6/3
0/1
60
.
0.
4,1
55
.
(5,1
91
.)
0.
I.D
.E.A
. P
art
A, P
resch
oo
l8
4.1
73
H1
73
A1
50
11
4P
S-5
30
01
54
,94
2.
$
07
/01
/14
-0
6/3
0/1
5(1
,55
5.)
0.
1,5
55
.
0.
0.
Ra
ce
to
th
e T
op
-Pre
sch
oo
l E
xp
an
sio
n8
4.4
19
BS
41
9B
15
00
20
RT
T-P
15
-10
0-0
34
51
0,5
14
.$
0
4/0
1/1
5-
06
/30
/16
0.
0.
48
6,2
91
.
(48
6,2
91
.)
0.
50
69
-03
1-H
35
0-D
00
5
To
tal S
pe
cia
l R
eve
nu
e F
un
d(2
23
,58
6.)
0.
1,3
12
,87
0.
(1,1
62
,41
1.)
0.
U.S
. D
ep
art
me
nt o
f A
gricu
ltu
re
Pa
sse
d-t
hro
ug
h S
tate
De
pa
rtm
en
t o
f E
du
ca
tio
n
En
terp
rise
Fu
nd
:
Fo
od
Dis
trib
utio
n P
rog
ram
10
.55
51
61
6N
J3
04
N1
09
9N
/A4
0,3
84
.$
07
/01
/15
-0
6/3
0/1
60
.
0.
40
,38
4.
(38
,37
7.)
0.
Fo
od
Dis
trib
utio
n P
rog
ram
10
.55
51
61
6N
J3
04
N1
09
9N
/A3
4,1
20
.$
07
/01
/14
-0
6/3
0/1
51
,35
4.
0.
0.
(1,3
54
.)
0.
Na
tio
na
l S
ch
oo
l B
rea
kfa
st P
rog
ram
10
.55
31
61
6N
J3
04
N1
09
9N
/A8
2,0
65
.$
07
/01
/15
-0
6/3
0/1
60
.
0.
78
,19
3.
(82
,06
5.)
0.
Na
tio
na
l S
ch
oo
l B
rea
kfa
st P
rog
ram
10
.55
31
61
6N
J3
04
N1
09
9N
/A9
4,5
09
.$
07
/01
/14
-0
6/3
0/1
5(5
,84
9.)
0.
5,8
49
.
0.
0.
Na
tio
na
l S
ch
oo
l L
un
ch
Pro
gra
m1
0.5
55
16
16
NJ3
04
N1
09
9N
/A2
41
,50
3.
$
07
/01
/15
-0
6/3
0/1
60
.
0.
23
3,7
86
.
(24
1,5
03
.)
0.
Na
tio
na
l S
ch
oo
l L
un
ch
Pro
gra
m1
0.5
55
16
16
NJ3
04
N1
09
9N
/A2
30
,60
5.
$
07
/01
/14
-0
6/3
0/1
5(8
,75
0.)
0.
8,7
50
.
0.
0.
To
tal E
nte
rprise
Fu
nd
(13
,24
5.)
0.
36
6,9
62
.
(36
3,2
99
.)
0.
Su
b-T
ota
l F
ed
era
l F
ina
ncia
l A
wa
rds
(23
6,8
31
.)$
0.
$
1,7
14
,24
1.
$
(1,5
86
,61
9.)
$
0.
$
Th
e A
cco
mp
an
yin
g N
ote
s to
Sch
ed
ule
s o
f E
xp
en
ditu
res o
f A
wa
rds a
nd
Fin
an
cia
l A
ssis
tan
ce
are
an
In
teg
ral P
art
of th
is S
ch
ed
ule
.
UP
PE
R D
EE
RF
IEL
D T
OW
NS
HIP
SC
HO
OL
DIS
TR
ICT
SC
HE
DU
LE
S O
F E
XP
EN
DIT
UR
ES
OF
FE
DE
RA
L A
WA
RD
S
FO
R T
HE
FIS
CA
L Y
EA
R E
ND
ED
JU
NE
30
, 2
01
6
100
Page 155
K-3
SC
HE
DU
LE
A
SC
HE
DU
LE
A
Pa
ge
2 o
f 2
Fe
de
ral
Fe
de
ral
Gra
nt o
r S
tate
Pro
gra
m o
rR
ep
aym
en
t
Fe
de
ral G
ran
tor/
Pa
ss-T
hro
ug
h G
ran
tor/
CF
DA
FA
INP
roje
ct
Aw
ard
G
ran
t P
erio
do
f P
rio
r Y
ea
rs'
Acco
un
ts
De
ferr
ed
Du
e to
Pro
gra
m T
itle
Nu
mb
er
Nu
mb
er
Nu
mb
er
Am
ou
nt
Fro
mT
oB
ala
nce
sR
ece
iva
ble
Re
ve
nu
eG
ran
tor
U.S
. D
ep
art
me
nt o
f E
du
ca
tio
n
Ge
ne
ral F
un
d:
Me
dic
al A
ssis
tan
ce
Pro
gra
m9
3.7
78
16
05
NJM
AP
N/A
60
,90
9.
$
07
/01
/15
-0
6/3
0/1
60
.$
(26
,50
0.)
$
0.
$
0.
$
To
tal G
en
era
l F
un
d0
.
(26
,50
0.)
0.
0.
U.S
. D
ep
art
me
nt o
f E
du
ca
tio
n
Pa
sse
d-t
hro
ug
h S
tate
De
pa
rtm
en
t o
f E
du
ca
tio
n
Sp
ecia
l R
eve
nu
e F
un
d:
Title
I, P
art
A8
4.0
10
AS
A1
0A
15
00
30
NC
LB
-53
00
15
36
2,8
23
.$
0
7/0
1/1
5-
06
/30
/16
0.
(58
,91
0.)
0.
0.
Title
I, P
art
A8
4.0
10
AS
A1
0A
15
00
30
NC
LB
-53
00
15
36
3,7
59
.$
0
7/0
1/1
4-
06
/30
/15
0.
0.
0.
0.
Title
II, P
art
A
84
.36
7A
S3
67
A1
50
02
9N
CL
B-5
30
01
64
8,8
06
.$
07
/01
/15
-0
6/3
0/1
60
.
(10
,07
1.)
0.
0.
Title
II, P
art
A
84
.36
7A
S3
67
A1
50
02
9N
CL
B-5
30
01
54
9,1
02
.$
07
/01
/14
-0
6/3
0/1
50
.
0.
0.
0.
Title
III
84
.36
5A
S3
65
A1
50
03
0N
CL
B-5
30
01
61
5,0
73
.$
07
/01
/15
-0
6/3
0/1
60
.
(3,1
10
.)
0.
0.
Title
III
84
.36
5A
S3
65
A1
50
03
0N
CL
B-5
30
01
51
5,6
05
.$
07
/01
/14
-0
6/3
0/1
50
.
0.
0.
0.
I.D
.E.A
. P
art
A, B
asic
8
4.0
27
H0
27
A1
50
10
0F
T-5
30
01
62
44
,22
8.
$
07
/01
/15
-0
6/3
0/1
60
.
0.
0.
0.
I.D
.E.A
. P
art
A, B
asic
8
4.0
27
H0
27
A1
50
10
0F
T-5
30
01
52
32
,42
8.
$
07
/01
/14
-0
6/3
0/1
50
.
0.
0.
0.
I.D
.E.A
. P
art
A, P
resch
oo
l8
4.1
73
H1
73
A1
50
11
4P
S-5
30
01
65
,23
5.
$
07
/01
/15
-0
6/3
0/1
60
.
(1,0
36
.)
0.
0.
I.D
.E.A
. P
art
A, P
resch
oo
l8
4.1
73
H1
73
A1
50
11
4P
S-5
30
01
54
,94
2.
$
07
/01
/14
-0
6/3
0/1
50
.
0.
0.
0.
Ra
ce
to
th
e T
op
-Pre
sch
oo
l E
xp
an
sio
n8
4.4
19
BS
41
9B
15
00
20
RT
T-P
15
-10
0-0
34
51
0,5
14
.$
0
4/0
1/1
5-
06
/30
/16
0.
0.
0.
0.
50
69
-03
1-H
35
0-D
00
50
.
0.
0.
To
tal S
pe
cia
l R
eve
nu
e F
un
d0
.
(73
,12
7.)
0.
0.
U.S
. D
ep
art
me
nt o
f A
gricu
ltu
re
Pa
sse
d-t
hro
ug
h S
tate
De
pa
rtm
en
t o
f E
du
ca
tio
n
En
terp
rise
Fu
nd
:
Fo
od
Dis
trib
utio
n P
rog
ram
10
.55
51
61
6N
J3
04
N1
09
9N
/A4
0,3
84
.$
07
/01
/15
-0
6/3
0/1
60
.
0.
2,0
07
.
0.
Fo
od
Dis
trib
utio
n P
rog
ram
10
.55
51
61
6N
J3
04
N1
09
9N
/A3
4,1
20
.$
07
/01
/14
-0
6/3
0/1
50
.
0.
0.
0.
Na
tio
na
l S
ch
oo
l B
rea
kfa
st P
rog
ram
10
.55
31
61
6N
J3
04
N1
09
9N
/A8
2,0
65
.$
07
/01
/15
-0
6/3
0/1
60
.
(3,8
72
.)
0.
0.
Na
tio
na
l S
ch
oo
l B
rea
kfa
st P
rog
ram
10
.55
31
61
6N
J3
04
N1
09
9N
/A9
4,5
09
.$
07
/01
/14
-0
6/3
0/1
50
.
0.
0.
0.
Na
tio
na
l S
ch
oo
l L
un
ch
Pro
gra
m1
0.5
55
16
16
NJ3
04
N1
09
9N
/A2
41
,50
3.
$
07
/01
/15
-0
6/3
0/1
60
.
(7,7
17
.)
0.
0.
Na
tio
na
l S
ch
oo
l L
un
ch
Pro
gra
m1
0.5
55
16
16
NJ3
04
N1
09
9N
/A2
30
,60
5.
$
07
/01
/14
-0
6/3
0/1
50
.
0.
0.
0.
To
tal E
nte
rprise
Fu
nd
0.
(11
,58
9.)
2,0
07
.
0.
Su
b-T
ota
l F
ed
era
l F
ina
ncia
l A
wa
rds
0.
$
(11
1,2
16
.)$
2
,00
7.
$
0.
$
Th
e A
cco
mp
an
yin
g N
ote
s to
Sch
ed
ule
s o
f E
xp
en
ditu
res o
f A
wa
rds a
nd
Fin
an
cia
l A
ssis
tan
ce
are
an
In
teg
ral P
art
of th
is S
ch
ed
ule
.
Ba
lan
ce
at Ju
ne
30
, 2
01
6
UP
PE
R D
EE
RF
IEL
D T
OW
NS
HIP
SC
HO
OL
DIS
TR
ICT
SC
HE
DU
LE
S O
F E
XP
EN
DIT
UR
ES
OF
FE
DE
RA
L A
WA
RD
S
FO
R T
HE
FIS
CA
L Y
EA
R E
ND
ED
JU
NE
30
, 2
01
6
101
Page 156
K-4
SC
HE
DU
LE
BP
age 1
of 2
Adju
stm
ents
/
Gra
nt or
Pro
gra
m o
rD
efe
rre
dC
arr
yo
ve
r/R
ep
aym
ent
Sta
te P
roje
ct
Aw
ard
G
rant P
eri
od
Revenue
Due to
(Walk
over)
Ca
sh
Budgeta
ry
of P
rior
Years
'
Sta
te G
ranto
r/P
rogra
m T
itle
Num
ber
Am
ount
Fro
mT
o(A
ccts
Rece
iva
ble
)G
ranto
rA
mount
Receiv
ed
Expenditure
sB
ala
nces
Sta
te D
epart
ment of E
ducation
Genera
l F
und:
Equalization A
id16-4
95-0
34-5
120-0
78
5,6
04,1
94.
$
07/0
1/1
5-
06/3
0/1
60.
$
0.
$
0.
$
5,6
04,1
94.
$
(5,6
04,1
94
.)$
0.
$
Securi
ty A
id16-4
95-0
34-5
120-0
84
146,6
67.
$
07/0
1/1
5-
06/3
0/1
60.
0.
0.
146,6
67.
(14
6,6
67
.)
0.
Tra
nsport
ation A
id16-4
95-0
34-5
120-0
14
58,1
20.
$
07/0
1/1
5-
06/3
0/1
60.
0.
0.
58,1
20.
(58
,120
.)
0.
Specia
l E
ducation C
ate
gori
cal A
id16-4
95-0
34-5
120-0
89
456,6
01.
$
07/0
1/1
5-
06/3
0/1
60.
0.
0.
456,6
01.
(45
6,6
01
.)
0.
PA
RC
C R
eadin
ess A
id16-4
95-0
34-5
120-0
98
8,3
70.
$
07/0
1/1
5-
06/3
0/1
60.
0.
0.
8,3
70.
(8,3
70.)
0.
Per
Pupil G
row
th A
id16-4
95-0
34-5
120-0
97
8,3
70.
$
07/0
1/1
5-
06/3
0/1
60.
0.
0.
8,3
70.
(8,3
70.)
0.
On B
ehalf T
PA
F P
ost R
etire
ment M
edic
al
16-4
95-0
34-5
095-0
01
549,0
74.
$
07/0
1/1
5-
06/3
0/1
60.
0.
0.
549,0
74.
(54
9,0
74
.)
0.
On B
ehalf T
PA
F P
ensio
n16-4
95-0
34-5
095-0
02
461,1
27.
$
07/0
1/1
5-
06/3
0/1
60.
0.
0.
461,1
27.
(46
1,1
27
.)
0.
Reim
burs
ed T
PA
F S
ocia
l S
ecuri
ty C
ontr
ibutions
16-4
95-0
34-5
095-0
03
439,5
56.
$
07/0
1/1
5-
06/3
0/1
60.
0.
0.
439,5
56.
(43
9,5
56
.)
0.
Reim
burs
ed T
PA
F S
ocia
l S
ecuri
ty C
ontr
ibutions
15-4
95-0
34-5
095-0
03
426,1
61.
$
07/0
1/1
4-
06/3
0/1
5(2
1,1
17
.)
0.
0.
21,1
17.
0.
0.
Additio
nal N
on-P
ublic T
rans
16-4
95-0
34-5
120
5,7
42.
$
07/0
1/1
5-
06/3
0/1
60.
0.
0.
0.
(5,7
42.)
0.
Additio
nal N
on-P
ublic T
rans
15-4
95-0
34-5
120
6,7
86.
$
07/0
1/1
4-
06/3
0/1
5(6
,78
6.)
0.
0.
6,7
86.
0.
0.
Tota
l G
enera
l F
und
(27
,903
.)
0.
0.
7,7
59,9
82.
(7,7
37,8
21
.)
0.
Specia
l R
evenue F
und:
Pre
school E
ducation A
id16-4
95-0
34-5
120-0
86
222,6
00.
$
07/0
1/1
5-
06/3
0/1
60.
0.
0.
222,6
00.
(22
2,6
00
.)
0.
Tota
l S
pecia
l R
evenue F
und
0.
0.
0.
222,6
00.
(22
2,6
00
.)
0.
Capital P
roje
ct F
und:
Educ facilitie
s c
onst &
fin
ancin
g a
ct
School additio
n &
renovation
5300-0
70-1
4-1
002
23,5
65.
$
(1
8,2
53
.)
0.
0.
14,5
84.
0.
0.
School additio
n &
renovation
5300-0
60-1
4-1
001
92,6
01.
$
(1
9,8
17
.)
0.
0.
0.
(59
,786
.)
0.
School additio
n &
renovation
5300-0
70-1
4-1
003
31,6
64.
$
(2
3,9
54
.)
0.
0.
19,1
40.
0.
0.
Tota
l C
apital P
roje
ct F
und
(62
,024
.)
0.
0.
33,7
24.
(59
,786
.)
0.
Sta
te D
epart
ment of A
gri
culture
Ente
rpri
se F
und:
National S
chool Lunch P
rogra
m (
Sta
te S
hare
)16-1
00-0
10-3
350-0
23
5,2
63.
$
07/0
1/1
5-
06/3
0/1
60.
0.
0.
5,0
98.
(5,2
63.)
0.
National S
chool Lunch P
rogra
m (
Sta
te S
hare
)15-1
00-0
10-3
350-0
23
5,2
63.
$
07/0
1/1
4-
06/3
0/1
5(1
88
.)
0.
0.
188.
0.
0.
Tota
l E
nte
rpri
se F
und
(18
8.)
0.
0.
5,2
86.
(5,2
63.)
0.
Tota
l S
tate
Fin
ancia
l A
ssis
tance
(90
,115
.)$
0.
$
0.
$
8,0
21,5
92.
$
(8,0
25,4
70
.)$
0.
$
Bala
nce a
t June 3
0, 2015
UP
PE
R D
EE
RF
IEL
D T
OW
NS
HIP
SC
HO
OL
DIS
TR
ICT
SC
HE
DU
LE
OF
EX
PE
ND
ITU
RE
S O
F S
TA
TE
FIN
AN
CIA
L A
SS
IST
AN
CE
FO
R T
HE
FIS
CA
L Y
EA
R E
ND
ED
JU
NE
30
, 2
01
6
The A
ccom
panyin
g N
ote
s to S
chedule
s o
f E
xpenditure
s o
f A
ward
s a
nd F
inancia
l A
ssis
tance a
re a
n Inte
gra
l P
art
of th
is S
chedule
.
102
Page 157
K-4
SC
HE
DU
LE
BP
age 2
of 2
Gra
nt or
Pro
gra
m o
r
Sta
te P
roje
ct
Aw
ard
G
rant P
eri
od
(Accounts
De
ferr
ed
D
ue to
Budgeta
ryC
um
ula
tive
Sta
te G
ranto
r/P
rogra
m T
itle
Num
ber
Am
ount
Fro
mT
o.R
eceiv
able
)R
evenue
Gra
nto
rR
eceiv
able
Tota
l E
xpend.
Sta
te D
epart
ment of E
ducation
Genera
l F
und:
Equalization A
id16-4
95-0
34-5
120-0
78
5,6
04,1
94
$
07/0
1/1
5-
06/3
0/1
60.
$
0.
$
0.
$
533,0
67.
$
5,6
04,1
94.
$
Securi
ty A
id16-4
95-0
34-5
120-0
84
146,6
67
$
07/0
1/1
5-
06/3
0/1
60.
0.
0.
14,6
67.
146,6
67.
Tra
nsport
ation A
id16-4
95-0
34-5
120-0
14
58,1
20
$
07/0
1/1
5-
06/3
0/1
60.
0.
0.
5,8
12.
58,1
20.
Specia
l E
ducation C
ate
gori
cal A
id16-4
95-0
34-5
120-0
89
456,6
01
$
07/0
1/1
5-
06/3
0/1
60.
0.
0.
45,6
60.
456,6
01.
PA
RC
C R
eadin
ess A
id16-4
95-0
34-5
120-0
98
8,3
70
$
07/0
1/1
5-
06/3
0/1
60.
0.
0.
837.
8,3
70.
Per
Pupil G
row
th A
id16-4
95-0
34-5
120-0
97
8,3
70
$
07/0
1/1
5-
06/3
0/1
60.
0.
0.
837.
8,3
70.
On B
ehalf T
PA
F P
ost R
etire
ment M
edic
al
16-4
95-0
34-5
095-0
01
549,0
74
$
07/0
1/1
5-
06/3
0/1
60.
0.
0.
0.
549,0
74.
On B
ehalf T
PA
F P
ensio
n16-4
95-0
34-5
095-0
02
461,1
27
$
07/0
1/1
5-
06/3
0/1
60.
0.
0.
0.
461,1
27.
Reim
burs
ed T
PA
F S
ocia
l S
ecuri
ty C
ontr
ibutions
16-4
95-0
34-5
095-0
03
439,5
56
$
07/0
1/1
5-
06/3
0/1
60.
0.
0.
0.
439,5
56.
Reim
burs
ed T
PA
F S
ocia
l S
ecuri
ty C
ontr
ibutions
15-4
95-0
34-5
095-0
03
426,1
61
$
07/0
1/1
4-
06/3
0/1
50.
0.
0.
0.
0.
Additio
nal N
on-P
ublic T
rans
16-4
95-0
34-5
120
5,7
42
$
07/0
1/1
5-
06/3
0/1
6(5
,74
2.)
0.
0.
0.
5,7
42.
Additio
nal N
on-P
ublic T
rans
15-4
95-0
34-5
120
6,7
86
$
07/0
1/1
4-
06/3
0/1
50.
0.
0.
0.
0.
Tota
l G
enera
l F
und
(5,7
42.)
0.
0.
600,8
80.
7,7
37,8
21.
Specia
l R
evenue F
und:
Pre
school E
ducation A
id16-4
95-0
34-5
120-0
86
222,6
00
$
07/0
1/1
5-
06/3
0/1
60.
0.
0.
22,2
60.
222,6
00.
Tota
l S
pecia
l R
evenue F
und
0.
0.
0.
22,2
60.
222,6
00.
Capital P
roje
ct F
und:
Educ facilitie
s c
onst &
fin
ancin
g a
ct
School additio
n &
renovation
5300-0
70-1
4-1
002
23,5
65
$
(3,6
69.)
0.
0.
0.
0.
School additio
n &
renovation
5300-0
60-1
4-1
001
92,6
01
$
(79
,603
.)
0.
0.
0.
59,7
86.
School additio
n &
renovation
5300-0
70-1
4-1
003
31,6
64
$
(4,8
14.)
0.
0.
0.
0.
Tota
l C
apital P
roje
ct F
und
(88
,086
.)
0.
0.
0.
59,7
86.
Sta
te D
epart
ment of A
gri
culture
Ente
rpri
se F
und:
National S
chool Lunch P
rogra
m (
Sta
te S
hare
)16-1
00-0
10-3
350-0
23
5,2
63
$
07/0
1/1
5-
06/3
0/1
6(1
65
.)
0.
0.
0.
5,2
63.
National S
chool Lunch P
rogra
m (
Sta
te S
hare
)15-1
00-0
10-3
350-0
23
5,2
63
$
07/0
1/1
4-
06/3
0/1
50.
0.
0.
0.
0.
Tota
l E
nte
rpri
se F
und
(16
5.)
0.
0.
0.
5,2
63.
Tota
l S
tate
Fin
ancia
l A
ssis
tance
(93
,993
.)$
0.
$
0.
$
623,1
40.
$
8,0
25,4
70.
$
SC
HE
DU
LE
OF
EX
PE
ND
ITU
RE
S O
F S
TA
TE
FIN
AN
CIA
L A
SS
IST
AN
CE
UP
PE
R D
EE
RF
IEL
D T
OW
NS
HIP
SC
HO
OL
DIS
TR
ICT
FO
R T
HE
FIS
CA
L Y
EA
R E
ND
ED
JU
NE
30
, 2
01
6
The A
ccom
panyin
g N
ote
s to S
chedule
s o
f E
xpenditure
s o
f A
ward
s a
nd F
inancia
l A
ssis
tance a
re a
n Inte
gra
l P
art
of th
is S
chedule
.
ME
MO
Bala
nce a
t June 3
0, 2016
103
Page 158
K-5
Page 1 of 2
UPPER DEERFIELD TOWNSHIP SCHOOL DISTRICT
NOTE TO THE SCHEDULES OF EXPENDITURES OF AWARD
AND FINANCIAL ASSISTANCE
JUNE 30, 2016
NOTE 1. GENERAL
The accompanying schedules of expenditures of federal awards and state financial assistance include
federal and state award activity of the Board of Education, Upper Deerfield Township School District.
The Board of Education is defined in Note 1 to the Board’s basic financial statements. All federal and
state awards received directly from federal and state agencies, as well as federal awards and state financial
assistance passed through other government agencies is included on the schedule of expenditures of
federal awards and state financial assistance.
NOTE 2. BASIS OF ACCOUNTING
The accompanying schedules of expenditures of awards and financial assistance are presented on the
budgetary basis of accounting with the exception of programs recorded in the food service fund, which are
presented using the accrual basis of accounting.. These bases of accounting are described in Note 1 to the
Board’s basic financial statements. The information in this schedule is presented in accordance with the
requirements of 2 CFS 200-Uniform Administrative Requirements, Cost Principles, and Audit
Requirements for Federal Awards. Therefore, some amounts presented in this schedule may differ from
amounts presented in, or used in the preparation of, the basic financial statements.
NOTE 3. RELATIONSHIP TO BASIC FINANCIAL STATEMENTS
The basic financial statements present the general fund and special revenue fund on a GAAP basis.
Budgetary comparison statements or schedules (RSI) are presented for the general fund and special
revenue fund to demonstrate finance-related legal compliance in which certain revenue is permitted by
law or grant agreement to be recognized in the audit year, whereas for GAAP reporting, revenue is not
recognized until the subsequent year or when expenditures have been made.
The general fund is presented in the accompanying schedules on the modified accrual basis with the
exception of the revenue recognition of the last state aid payment in the current budget year, which is
mandated pursuant to N.J.S.A. 18A:22-4.2. For GAAP purposes, that payment is not recognized until the
subsequent budget year due to the state deferral and recording of the last state aid payment in the
subsequent year. The special revenue fund is presented in the accompanying schedules on the grant
accounting budgetary basis which recognizes encumbrances as expenditures and also recognizes the
related revenues, whereas the GAAP basis does not. The special revenue fund also recognizes the last
state aid payment in the current budget year, consistent with N.J.S.A., 18A:22-4.2.
The net adjustment to reconcile from the budgetary basis to the GAAP basis is $624 for the general fund
and $(65,340) for the special revenue fund. See Exhibit C-3 for a reconciliation of the budgetary basis to
the modified accrual basis of accounting for the general and special revenue funds. Awards and financial
assistance revenues are reported in the Board’s basic financial statements on a GAAP basis as follows:
Federal State Total
General Fund $ 60,909. $ 7,738,445. $ 7,799,354.
Capital Project Fund 1,094,103. 225,568. 1,319,671.
Debt Service Fund 0. 59,786. 59,786.
Food Service Fund 363,952. 5,263. 369,215.
Total Financial Assis. $ 1,518,964. $ 8,029,062. $ 9,548,026.
104
Page 159
K-5
Page 2 of 2
UPPER DEERFIELD TOWNSHIP SCHOOL DISTRICT
NOTE TO THE SCHEDULES OF EXPENDITURES OF AWARD
AND FINANCIAL ASSISTANCE
JUNE 30, 2016
NOTE 4. RELATIONSHIP TO FEDERAL AND STATE FINANCIAL REPORTS
Amounts reported in the accompanying schedules agree with the amounts reported in the related federal
and state financial reports.
NOTE 5. OTHER
Revenues and expenditures reported under the Food Distribution Program represent current year value
received and current year distributions respectively. The amount reported as TPAF Pension Contributions
represents the amount paid by the state on behalf of the District for the year ended June 30, 2016. TPAF
Social Security Contributions represents the amount reimbursed by the state for the employer’s share of
social security contributions for TPAF members for the year ended June 30, 2016.
NOTE 6. SUBRECIPIENTS
The District had no expenditures to subrecipients during the year ended June 30, 2016
NOTE 7. INDIRECT COSTS
The District has elected not to use the 10% de minimis indirect cost rate as allowed under the Uniform
Guidance.
105
Page 160
K-6
UPPER DEERFIELD TOWNSHIP SCHOOL DISTRICT
SCHEDULE OF FINDINGS AND QUESTIONED COSTS
FOR THE FISCAL YEAR ENDED JUNE 30, 2016
Section I – Summary of Auditor’s Results
Financial Statements
Type of auditor’s report issued: Unmodified
Internal control over financial reporting:
1. Material weakness(es) identified? Yes x No
2. Significant Deficiencies identified
that are not considered to be material
weaknesses? Yes x No
Noncompliance material to general purpose financial
statements noticed? Yes x No
Federal Awards
Internal Control over major programs:
1. Material weakness(es) identified? Yes x No
2. Significant Deficiencies identified that
are not considered to be material
weaknesses? Yes x No
Type of auditor’s report issued on compliance for
major programs: Unmodiified
Any audit findings disclosed that are required to be
reported in accordance with section .516(a) of
2 CFR? Yes x No
Identification of major programs:
CFDA Number(s) Name of Federal Program or Cluster
84.419B Race to the Top – Preschool Expansion
Dollar threshold used to distinguish between Type A and Type B programs: $750,000.
Auditee qualified as low-risk auditee? x Yes No
106
Page 161
K-6
UPPER DEERFIELD TOWNSHIP SCHOOL DISTRICT
SCHEDULE OF FINDINGS AND QUESTIONED COSTS
FOR THE FISCAL YEAR ENDED JUNE 30, 2016
(Continued)
Section I – Summary of Auditor’s Results
(Continued)
State Awards
Dollar threshold used to distinguish between type A and
type B programs: $750,000.
Auditee qualified as low risk auditee? x Yes No
Type of auditor’s report issued on compliance for
major programs: Unmodified
Internal Control over major programs:
1. Material weakness(es) identified? Yes x No
2. Significant Deficiencies identified
that are not considered to be
material weaknesses? Yes x No
Any audit findings disclosed that are required to be reported
in accordance with NJ OMB Circular Letter 15-08? Yes x No
Identification of major programs:
GMIS Number(s) Name of State Program
495-034-5120-078 Equalization Aid
495-034-5120-084 Security Aid
495-034-5120-089 Special Education Aid
495-034-5120-098 PARCC Readiness Aid
495-034-5120-097 Per Pupil Growth Aid
Section II – Financial Statement Findings
None Reported
.
107
Page 162
K-6
UPPER DEERFIELD TOWNSHIP SCHOOL DISTRICT
SCHEDULE OF FINDINGS AND QUESTIONED COSTS
FOR THE FISCAL YEAR ENDED JUNE 30, 2016
(Continued)
Section III – Federal Awards and State Financial Assistance Findings and Questioned Costs
FEDERAL AWARDS
Finding: 2016-001
Information on the federal program:
U.S. Department of Education
Passed through NJ Department of Education
Race to the Top – Preschool Expansion CFDA No. 84.419B
Criteria or specific requirement:
OMB Circular A-87, Attachment B requires that salaries charged to a federal program be supported by
periodic certifications that the employees worked on the program. The certifications should include
personal activity reports documenting actual after-the-fact activities.
Condition:
The salaries being charged to the federal Preschool Expansion program were not supported by periodic
certifications as required.
Questioned Costs:
None
Context:
The salary of the employees charged to the program were not supported by periodic certifications.
Effect:
The required documentation to support the salaries of the employee charged to the program were not
complete.
Cause:
District officials were not aware of the documentation requirements pertaining to the Preschool Expansion
program.
Recommendation:
That all salaries charged to all federal programs be supported by periodic certifications and personal
activity reports as required.
Views of responsible officials and planned corrective action:
The district officials concur with the finding and will make the necessary corrections to provide the
required supporting documentation.
Finding: 2016-002
Information on the federal program:
U.S. Department of Education
Passed through NJ Department of Education
Race to the Top – Preschool Expansion CFDA No. 84.419B
108
Page 163
K-6
UPPER DEERFIELD TOWNSHIP SCHOOL DISTRICT
SCHEDULE OF FINDINGS AND QUESTIONED COSTS
FOR THE FISCAL YEAR ENDED JUNE 30, 2016
(Continued)
Section III – Federal Awards and State Financial Assistance Findings and Questioned Costs
(Continued)
Criteria or specific requirement:
OMB Circular A-87, Attachment B requires that salaries charged to a federal program be supported by
periodic certifications that the employees worked on the program. The certifications should include
personal activity reports documenting actual after-the-fact activities.
Condition:
The grant requires that periodic reports be filed to report the total number of children enrolled in the
preschool program and also the number of children funded by the grant.
Questioned Costs:
Unknown
Context:
The grant attendance report filed for October 15, 2015 reported total preschool enrollment of 78 including
grant funded enrollment of 18. The NJ Attendance Register list total preschool enrollment of 70.
Effect:
The grant report was not supported by the attendance record.
Cause:
Error in preparing report.
Recommendation:
That grant attendance reports agree with school records. That eligibility for grant funding be supported
by necessary income verification and funded children be identified.
Views of responsible officials and planned corrective action:
Management agrees with finding.
STATE AWARDS
None Reported
109
Page 164
K-7
UPPER DEERFIELD TOWNSHIP SCHOOL DISTRICT
SUMMARY SCHEDULE OF PRIOR YEAR AUDIT FINDINGS
AND QUESTIONED COSTS AS PREPARED BY MANAGEMENT
FOR THE FISCAL YEAR ENDED JUNE 30, 2016
STATUS OF PRIOR YEAR FINDINGS
Finding:
2015-01
Condition:
The District’s expenditure records by location did not adequately break down the total amount spent for
intervention at the targeted assistance school.
Current Status:
The District made the necessary corrections to adequately track the amount spent for intervention at the
targeted assistance school.
Finding:
2015-02
Condition:
The salaries being charged to the federal Title III program were not supported by periodic certifications as
required.
Current Status:
The salary charged to the federal Title III program was properly supported by periodic certifications.
However, salaries charged to the federal Preschool Expansion program were not properly supported by
periodic certifications. See Findings 2016-01.
110