COMPREHENSIVE ANNUAL FINANCIAL REPORT FOR THE YEARS ENDED 2004 AND 2003 1400 29th Street, P.O. Box 2110, Sacramento, CA 95812-2110 (916) 321-2800 • www.sacrt.com SACRAMENTO REGIONAL TRANSIT DISTRICT
Transcript
COMPREHENSIVEANNUAL
FINANCIAL REPORT
FOR THE YEARS ENDED 2004 AND 20031400 29th Street, P.O. Box 2110, Sacramento, CA 95812-2110
(916) 321-2800 • www.sacrt.com
SACRAMENTO REGIONAL TRANSIT DISTRICT
SACRAMENTO REGIONALTRANSIT DISTRICT
Sacramento, California
Prepared by the Finance DivisionRichard Davis, Chief Financial Officer
For the Years EndedJune 30, 2004 and 2003
COMPREHENSIVEANNUAL
FINANCIAL REPORT
Table of Contents
INTRODUCTORY SECTION Page
Letter of Transmittal .................................................................................................. iCertificate of Achievement ...................................................................................... viList of Principal Officials ............................................................................................ viiOrganization Chart .................................................................................................... viiiService Area Maps ...................................................................................................... ix
MANAGEMENT DISCUSSION AND ANALYSIS ........................................................... 3
BASIC FINANCIAL STATEMENTS:
Proprietary Fund-Statement of Net Assets......................................................................11Statement of Revenues, Expenses, and Changes In Net Assets .....................................................................................13Statement of Cash Flows ....................................................................14
Pension Trust Funds:Statement of Fiduciary Net Assets .....................................................16Statement of Changes in Fiduciary Net Assets ................................. 17
Notes to Financial Statements ....................................................................... 18
STATISTICAL SECTION
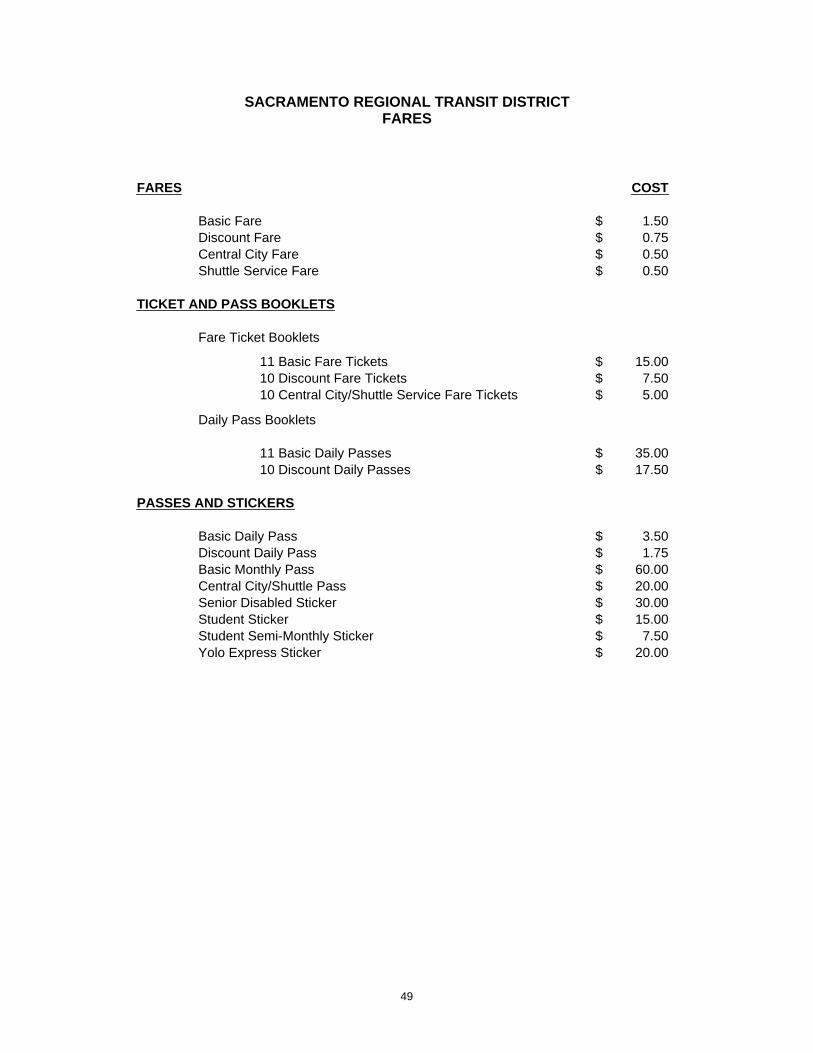
Transit District Profile ................................................................................................ 39Revenue and Expense History ................................................................................... 40Ten Year Funding History .......................................................................................... 41Fare Recovery ............................................................................................................. 42Ridership ..................................................................................................................... 43Operating Subsidy ..................................................................................................... 44Operational Ratios ..................................................................................................... 45Financial Performance Ratios..................................................................................... 46Performance Data ...................................................................................................... 47Fares ............................................................................................................................ 49Performance Measures .............................................................................................. 50Demographic Information ........................................................................................ 51Service Provided ......................................................................................................... 52
INTRODUCTORYSECTION
SACRAMENTO REGIONAL TRANSIT DISTRICT
BO
AR
D O
FD
IRE
CTO
RS
GE
NE
RA
L M
AN
AG
ER
/C
EO
CH
IEF
LE
GA
LC
OU
NS
EL
LIG
HT
RA
ILO
PE
RA
TIO
NS
BU
SM
AIN
TE
NA
NC
E
TR
AN
SP
OR
TAT
ION
BU
SC
US
TO
ME
RS
ER
VIC
E
OP
ER
AT
ION
SD
IVIS
ION
MA
RK
ET
ING
&P
UB
LIC
RE
LA
TIO
NS
DIV
ISIO
N
TRA
NSI
T SY
STEM
DEV
ELO
PMEN
TD
IVIS
ION
PL
AN
NIN
G/
viii
CO
MP
LIA
NC
E &
QU
ALI
TY
AS
SU
RA
NC
EC
HIE
F O
F S
TAF
F
AD
MIN
IST
RA
TIV
ES
ER
VIC
ES
/EE
OD
IVIS
ION
FAC
ILIT
IES
MA
NA
GE
ME
NT
DIV
ISIO
NF
INA
NC
E D
IVIS
ION
PU
BLI
CIN
FO
RM
AT
ION
& M
AR
KE
TIN
G
FA
CIL
ITIE
SM
AIN
TE
NA
NC
E
SA
FE
TY
&E
NV
IRO
NM
EN
TAL
PR
OP
ER
TY
MA
NA
GE
ME
NT
ST
RA
TE
GIC
(LO
NG
RA
NG
E)
PLA
NN
ING
SE
RV
ICE
PLA
NN
ING
SC
HE
DU
LIN
G
RE
AL
ES
TAT
E/
JOIN
TD
EV
ELO
PM
EN
T
FIN
AN
CE
&T
RE
AS
UR
Y
OF
FIC
E O
FM
AN
AG
EM
EN
T &
BU
DG
ET
HU
MA
NR
ES
OU
RC
ES
and
RIS
K M
AN
AG
EM
EN
T
EM
PLO
YE
ER
ELA
TIO
NS
INF
OR
MA
TIO
NT
EC
HN
OLO
GY
/ITS
AC
CE
SS
IBLE
SE
RV
ICE
S
PR
OC
UR
EM
EN
T &
DB
E
PA
RA
TR
AN
SIT
/S
PE
CIA
LIZ
ED
TR
AN
SP
OR
TAT
ION
SE
RV
ICE
S
PO
LIC
E S
ER
VIC
ES
EE
O
CO
MM
UN
ITY
SE
RV
ICE
BU
S
SAC
RA
MEN
TO R
EGIO
NA
L TR
AN
SIT
DIS
TRIC
T O
RG
AN
IZA
TIO
NA
L ST
RU
CTU
RE
EN
GIN
EE
RIN
G &
CO
NS
TR
UC
TIO
ND
IVIS
ION
CIV
IL &
TR
AC
KD
ES
IGN
PR
OJE
CT
MA
NA
GE
ME
NT
SY
ST
EM
S D
ES
IGN
EN
GIN
EE
RIN
GE
NV
IRO
NM
EN
TAL
CO
NT
RO
LP
RO
GR
AM
ix
DD
Do
wn
tow
nP
laza
Cit
yH
all
Fed
eral
Co
urt
ho
use
5
Sta
teC
apit
ol
Am
trak
Sta
tio
n
x
FINANCIALSECTION
SACRAMENTO REGIONAL TRANSIT DISTRICT
MANAGEMENT’S
DISCUSSION ANDANALYSIS
3
MANAGEMENT’S DISCUSSION AND ANALYSIS
As management of the Sacramento Regional Transit District (District), we offer thereaders of the District’s financial statements this narrative overview and analysis of thefinancial activities for the District for the year ended June 30, 2004. We encouragereaders to consider the information presented here in conjunction with additionalinformation that we have furnished in the transmittal letter and financial statementswhich are included in this report.
Financial Highlights
• The assets of the District exceeded its liabilities at the fiscal year-end (FY) 2004 by$706,791,478 (net assets). Of this amount, $15,675,238 is restricted for specificpurposes (restricted net assets) and $700,017,449 is invested in capital assets, netof related debt.
• The District’s total net assets increased in FY 2004 by 26.5 percent, or$148,229,366, compared to FY 2003. This increase is attributed to the constructionor acquisition of capital assets, as the majority of the District’s net assets are capitalassets such as bus and light rail vehicles and facilities, general administrativefacilities, land for buildings and future transit facilities and equipment.
• The District’s total debt increased by $13,410,492 during the fiscal year due to thedefeasance of 1992 Certificates of Participation and the issuance of $18,000,000 in2003 Certificates of Participation.
• Fare revenue increased by 1.2 percent, while other non-operating revenueincreased by 18.5 percent during the fiscal year.
• Total operating costs increased by 8.1 percent during the fiscal year.
Overview of Financial Statements
This discussion and analysis is intended to serve as an introduction to the District’sbasic financial statements which are comprised of the financial statements and thenotes to the financial statements.
Financial statements – The financial statements are designed to provide readers witha broad overview of the District’s finances, in a manner similar to a private-sectorbusiness.
The statement of net assets presents information on all the District’s assets andliabilities, with the difference between the two being reported as net assets. Over time,increases or decreases in net assets may serve as a useful indicator of whether theDistrict’s financial position is improving or deteriorating.
4
The statement of revenues, expenses and changes in net assets presents informationshowing how the District’s net assets changed during FY 2004. All changes in netassets are reported as soon as the underlying event giving rise to the change occurs(such as the receipt of goods and services or submittal of claims for capital andoperating revenue) regardless of the timing of related cash flows. In other words, theDistrict reports expenses and revenues on an accrual basis rather than a cash basis.Since the District’s primary function is to provide transportation services to the region’scitizens and recover costs through user fees and charges, the financial statementsinclude business-type activities. The District serves in a fiduciary capacity for thepension trust funds. The fiduciary fund statements are presented on an accrual basisand are included in these financial statements. The resources of the fiduciary funds arenot available to support the District’s own programs.
Notes to financial statements – The notes provide additional information that isessential to a full understanding of the financial data provided in the financialstatements.
Other information – In addition to the financial statements and accompanying notes,this report also includes a statistical section of selected financial information over a 10year period.
Analysis of the Financial Statements
The financial statements provide long-term and short-term information about theDistrict’s overall financial condition. This analysis addresses the financial statements ofthe District as a whole.
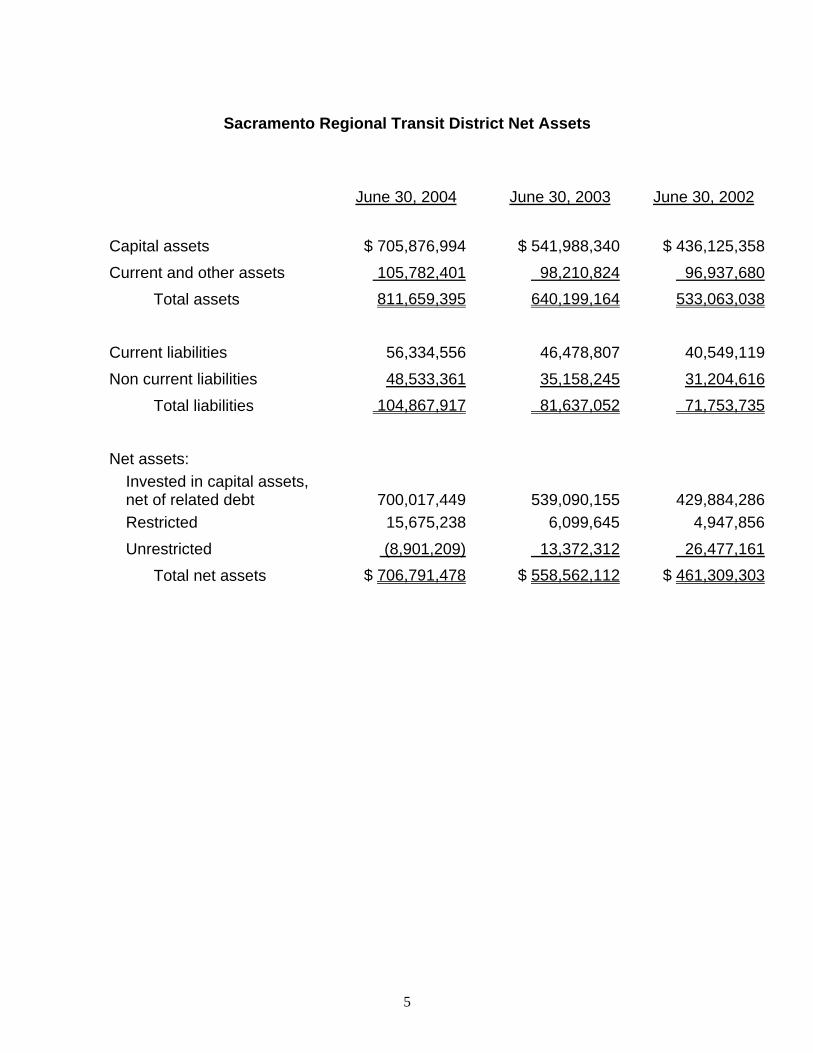
As noted earlier, net assets may serve as a useful indicator of a government’s financialposition over time. In the case of the District, assets exceeded liabilities by$706,791,478 at June 30, 2004.
The vast majority of the District’s total net assets, approximately 99.0 percent, reflectinvestment in capital assets, less any related debt and unused proceeds used toacquire those assets still outstanding. These capital assets are used to provide bus andlight rail services to the greater Sacramento area. Consequently, these assets are notavailable for future spending. Although the District’s investment in its capital assets isreported net of related debt, resources are needed to repay this debt and must beprovided from other sources, since the capital assets themselves cannot be used toliquidate these liabilities.
The increase in net assets is due to capital asset acquisition as the District is in theprocess of expanding its services.
A portion of the District’s net assets represents resources that are subject to externalrestrictions on how they may be used. Examples include grant funds advanced to theDistrict for specified purposes by other related governmental agencies.
5
Sacramento Regional Transit District Net Assets
June 30, 2004 June 30, 2003 June 30, 2002
Capital assets $ 705,876,994 $ 541,988,340 $ 436,125,358
Current and other assets 105,782,401 98,210,824 96,937,680
Total assets 811,659,395 640,199,164 533,063,038
Current liabilities 56,334,556 46,478,807 40,549,119
Non current liabilities 48,533,361 35,158,245 31,204,616
Total liabilities 104,867,917 81,637,052 71,753,735
Net assets:
Invested in capital assets,net of related debt 700,017,449 539,090,155 429,884,286
Restricted 15,675,238 6,099,645 4,947,856
Unrestricted (8,901,209) 13,372,312 26,477,161
Total net assets $ 706,791,478 $ 558,562,112 $ 461,309,303
6
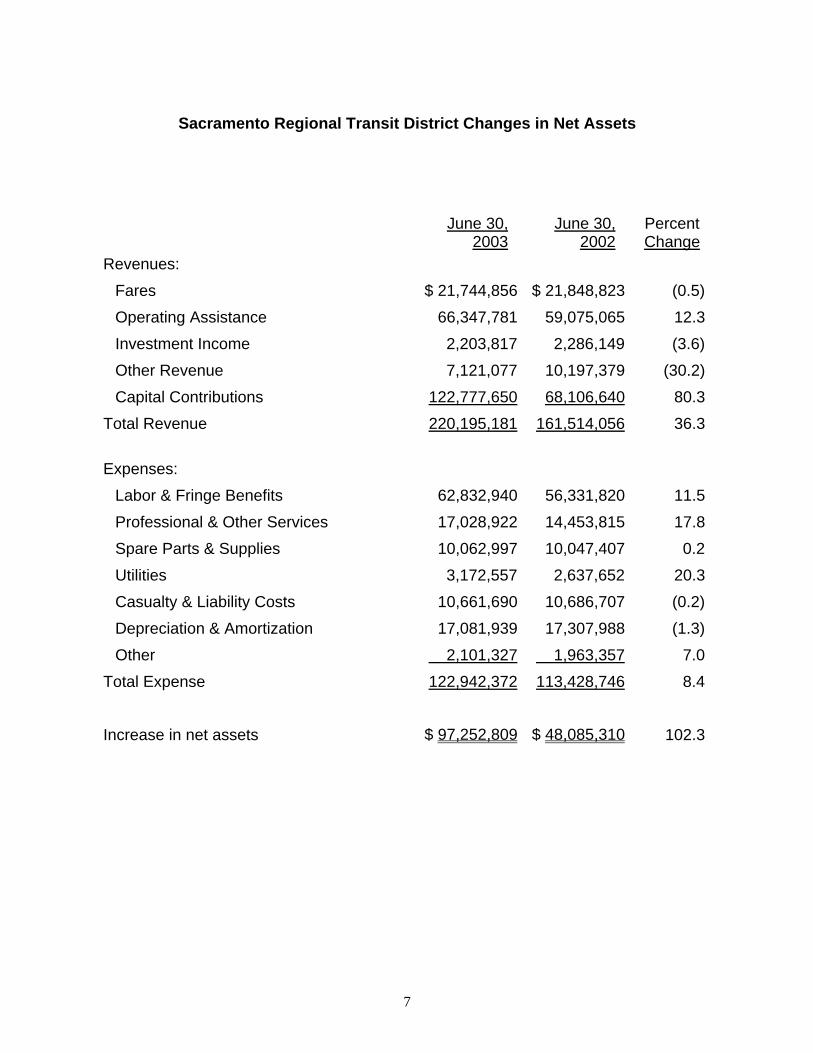
Sacramento Regional Transit District Changes in Net Assets
June 30,2004
June 30,2003
PercentChange
Revenues:
Fares $ 22,003,511 $ 21,744,856 1.2
Operating Assistance 81,161,079 66,347,781 22.3
Investment Income 1,076,396 2,203,817 (51.2)
Other Revenue 7,425,678 7,121,077 4.3
Capital Contributions 170,045,821 122,777,650 38.5
Increase in net assets $ 97,252,809 $ 48,085,310 102.3
8
Fares InvestmentIncome
OperatingAssistance
ContractedServices
OtherRevenue
CapitalContributions
2004 2003 2002
$
$50,000
$100,000
$150,000
$200,000
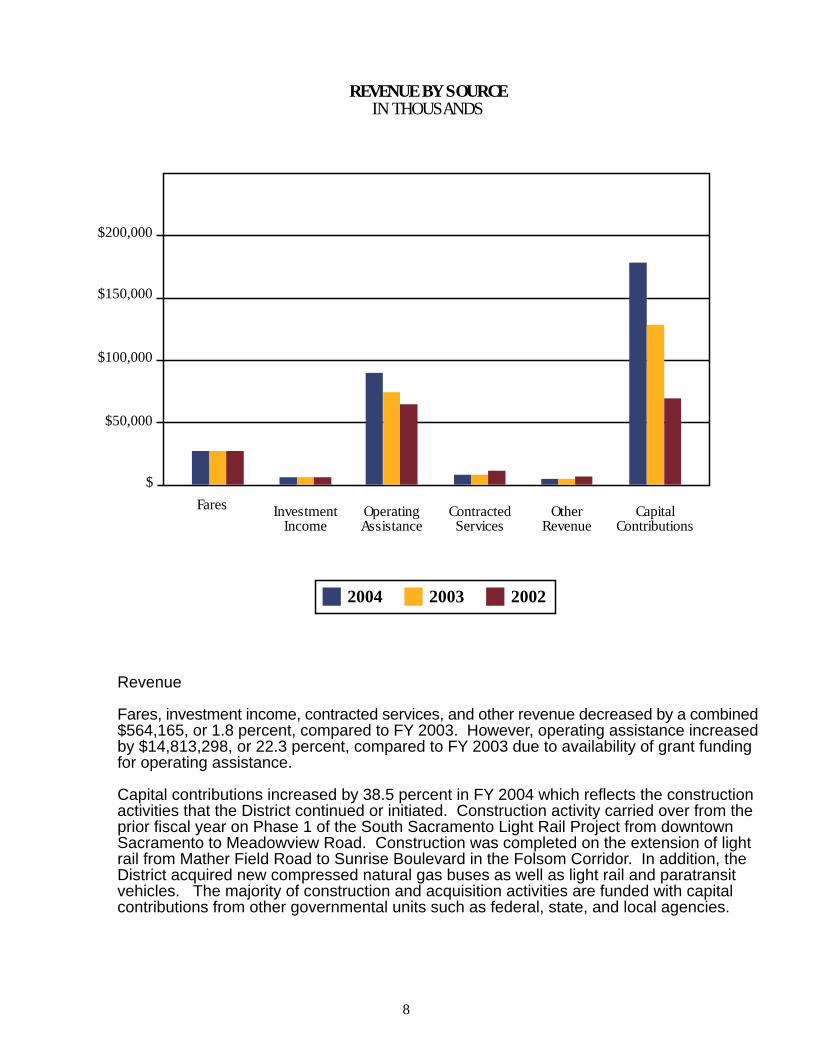
Revenue
Fares, investment income, contracted services, and other revenue decreased by a combined$564,165, or 1.8 percent, compared to FY 2003. However, operating assistance increasedby $14,813,298, or 22.3 percent, compared to FY 2003 due to availability of grant fundingfor operating assistance.
Capital contributions increased by 38.5 percent in FY 2004 which reflects the constructionactivities that the District continued or initiated. Construction activity carried over from theprior fiscal year on Phase 1 of the South Sacramento Light Rail Project from downtownSacramento to Meadowview Road. Construction was completed on the extension of lightrail from Mather Field Road to Sunrise Boulevard in the Folsom Corridor. In addition, theDistrict acquired new compressed natural gas buses as well as light rail and paratransitvehicles. The majority of construction and acquisition activities are funded with capitalcontributions from other governmental units such as federal, state, and local agencies.
REVENUE BY SOURCEIN THOUSANDS
Fabor &Fringe
Benefits
Professional &Other Services
Spare Parts& Supplies
Casualty &Liability
Depreciation
2004 2003 2002
$
$10,000
$20,000
$30,000
$40,000
OPERATING EXPENSESIN THOUSANDS
$50,000
$60,000
$70,000
$80,000
OtherUtilities
Expenses
Operating expenses increased by 8.5 percent overall for the year ended June 30, 2004. Much of the increase was the result of increased costs for compressed natural gas andelectricity to fuel the District’s bus and light rail vehicles, increased costs for bus and lightrail vehicle maintenance, increased labor and fringe benefit costs attributable to increasedstaffing for additional bus and light rail services, and increased Paratransit ADA service.
9
10
Analysis of the District’s Financial Position
The District’s net assets provide information on near term inflows, outflows, andbalances of spendable resources. The District is reporting unrestricted net assets at theend of June 30, 2004 of ($8,901,207), a decrease of $22,273,521, or 166.6 percent, incomparison with the year ended June 30, 2003. This decrease is primarily due to theincrease of capital assets financed with debt and the related unspent debt proceeds aswell as recognition of the net pension obligation. Additional contributing factors are theincrease in the reserve for property liablility damange and workers’ compenstationclaims and compensated absences liability balances.
Capital Asset and Debt Activity
As of June 30, 2004, the District’s investment in various capital assets, such as bus andlight rail vehicles, facilities, land, buildings and equipment increased from $541,988,340to $705,876,994 representing a 30.2 percent increase. The most significant addition tothe District’s capital assets is the purchase of compressed natural gas buses, light railvehicles, and paratransit vehicles for planned transit service expansions and fleetreplacement. In addition, construction activities (work in process) took place on twolight rail extensions (South Sacramento Corridor from Downtown Sacramento toMeadowview Road, and Amtrak/Folsom Corridor from Mather Field Road to SunriseBoulevard). Additional information on the capital assets can be found in footnote 5 ofthe audited financial statements.
The District’s Certificates of Participation debt has increased by $13,410,492 or 248.3percent in 2004 compared to 2003. This debt represents Certificates of Participation(COPs) notes distributed in 2004 for the purchase of light rail vehicles, trolley vehicles,related equipment and real property to be used as maintenance facilities. Additionalinformation on debt activity can be found in footnote 6 of the audited financialstatements.
Current Economic Factors and Conditions
The District has plans for future expansion and improvement of light rail and busservices. Additionally there are capital replacement and infrastructure maintenanceneeds. This will place increasing pressure on the District to ensure the availability offinancial resources.
FINANCIAL
STATEMENTS
SACRAMENTO REGIONAL TRANSIT DISTRICTSTATEMENT OF NET ASSETS - PROPRIETARY FUND
JUNE 30, 2004 AND 2003
2004 2003ASSETS
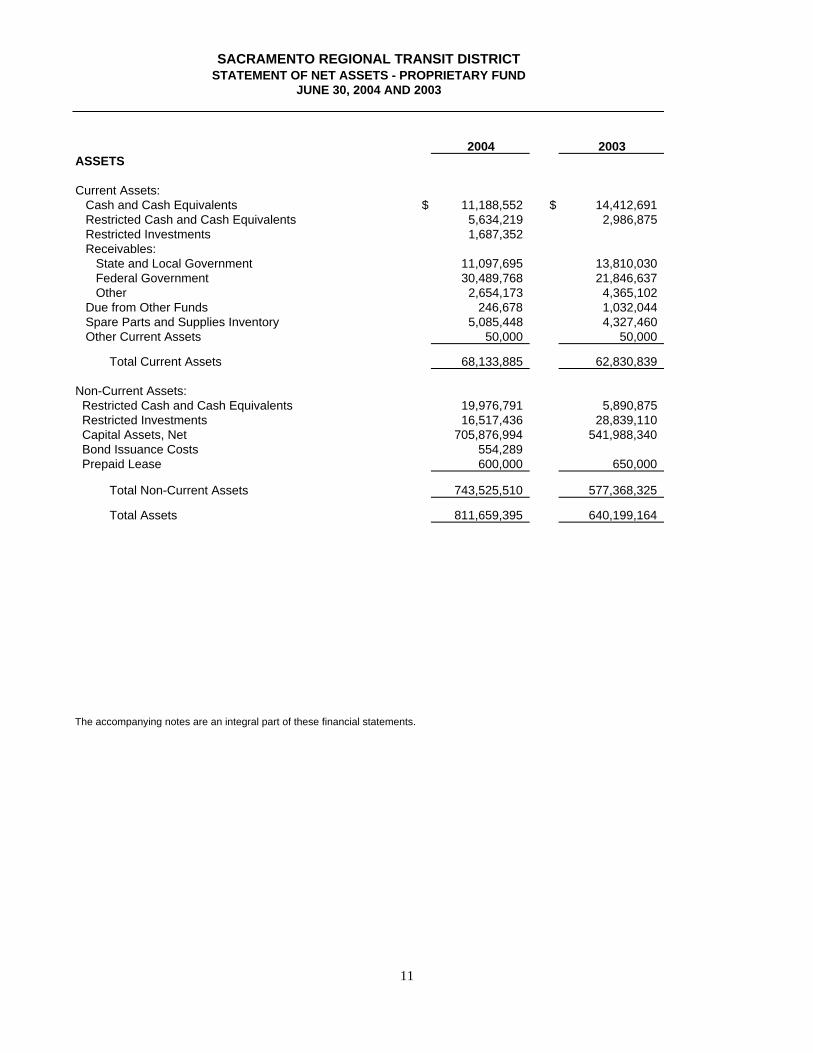
Current Assets: Cash and Cash Equivalents $ 11,188,552 $ 14,412,691 Restricted Cash and Cash Equivalents 5,634,219 2,986,875 Restricted Investments 1,687,352 Receivables: State and Local Government 11,097,695 13,810,030 Federal Government 30,489,768 21,846,637 Other 2,654,173 4,365,102 Due from Other Funds 246,678 1,032,044 Spare Parts and Supplies Inventory 5,085,448 4,327,460 Other Current Assets 50,000 50,000
Total Current Assets 68,133,885 62,830,839
Non-Current Assets: Restricted Cash and Cash Equivalents 19,976,791 5,890,875 Restricted Investments 16,517,436 28,839,110 Capital Assets, Net 705,876,994 541,988,340 Bond Issuance Costs 554,289 Prepaid Lease 600,000 650,000
Total Non-Current Assets 743,525,510 577,368,325
Total Assets 811,659,395 640,199,164
The accompanying notes are an integral part of these financial statements.
11
SACRAMENTO REGIONAL TRANSIT DISTRICTSTATEMENT OF NET ASSETS - PROPRIETARY FUND (Continued)
JUNE 30, 2004 AND 2003
2004 2003LIABILITIES
Current Liabilities: Accounts Payable 22,727,624 15,773,649 Compensated Absences 5,061,070 4,494,275 Interest Payable 236,552 114,750 Deferred Revenue 250,932 233,523 Advances from Other Governments 13,775,359 16,651,610 Reserve for Claims 7,198,000 6,511,000 Certificates of Participation 1,370,000 2,700,000 Retention Payable 5,715,019
Invested in Capital Assets, Net of Related Debt 700,017,449 539,090,155 Restricted For Capital Projects 15,675,238 6,099,645 Unrestricted (8,901,209) 13,372,312
Total Net Assets $ 706,791,478 $ 558,562,112
The accompanying notes are an integral part of these financial statements.
12
SACRAMENTO REGIONAL TRANSIT DISTRICTSTATEMENT OF REVENUES, EXPENSES, AND CHANGES
IN NET ASSETS - PROPRIETARY FUNDFOR THE YEARS ENDED JUNE 30, 2004 AND 2003
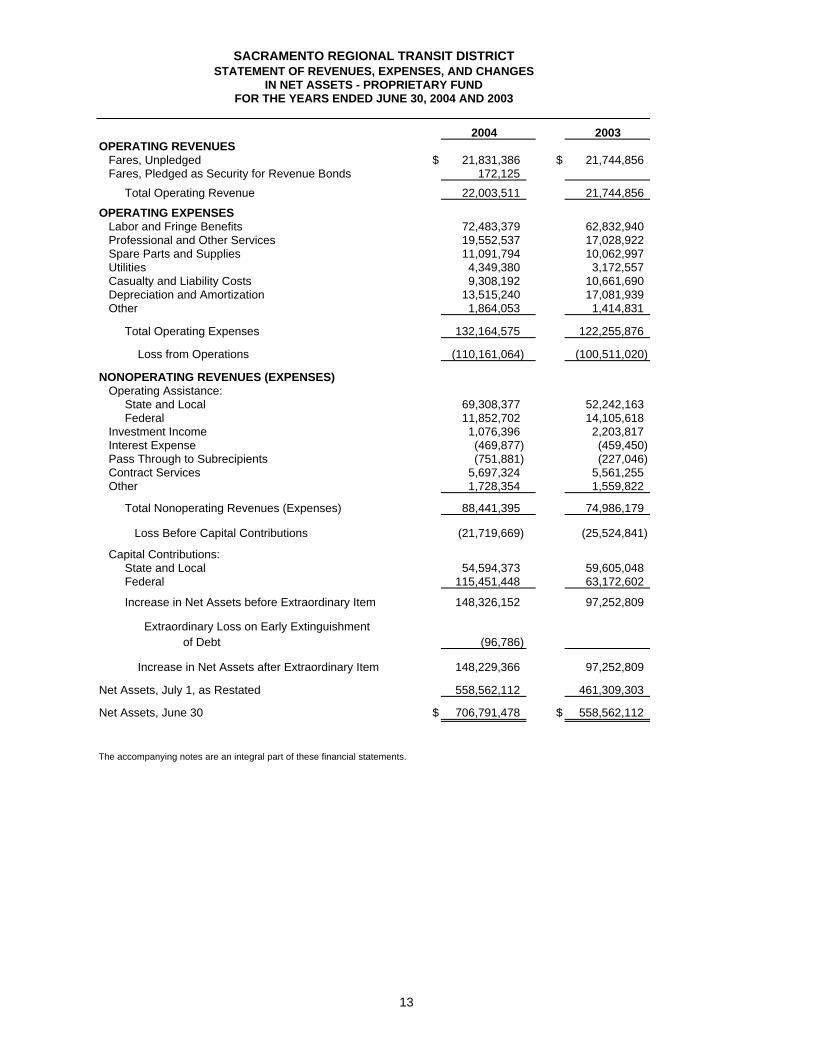
2004 2003OPERATING REVENUES Fares, Unpledged $ 21,831,386 $ 21,744,856 Fares, Pledged as Security for Revenue Bonds 172,125
Total Operating Revenue 22,003,511 21,744,856
OPERATING EXPENSES Labor and Fringe Benefits 72,483,379 62,832,940 Professional and Other Services 19,552,537 17,028,922 Spare Parts and Supplies 11,091,794 10,062,997 Utilities 4,349,380 3,172,557 Casualty and Liability Costs 9,308,192 10,661,690 Depreciation and Amortization 13,515,240 17,081,939 Other 1,864,053 1,414,831
Total Operating Expenses 132,164,575 122,255,876
Loss from Operations (110,161,064) (100,511,020)
NONOPERATING REVENUES (EXPENSES) Operating Assistance: State and Local 69,308,377 52,242,163 Federal 11,852,702 14,105,618 Investment Income 1,076,396 2,203,817 Interest Expense (469,877) (459,450) Pass Through to Subrecipients (751,881) (227,046) Contract Services 5,697,324 5,561,255 Other 1,728,354 1,559,822
Total Nonoperating Revenues (Expenses) 88,441,395 74,986,179
Loss Before Capital Contributions (21,719,669) (25,524,841)
Capital Contributions: State and Local 54,594,373 59,605,048 Federal 115,451,448 63,172,602
Increase in Net Assets before Extraordinary Item 148,326,152 97,252,809
Extraordinary Loss on Early Extinguishment of Debt (96,786)
Increase in Net Assets after Extraordinary Item 148,229,366 97,252,809
Net Assets, July 1, as Restated 558,562,112 461,309,303
Net Assets, June 30 $ 706,791,478 $ 558,562,112
The accompanying notes are an integral part of these financial statements.
13
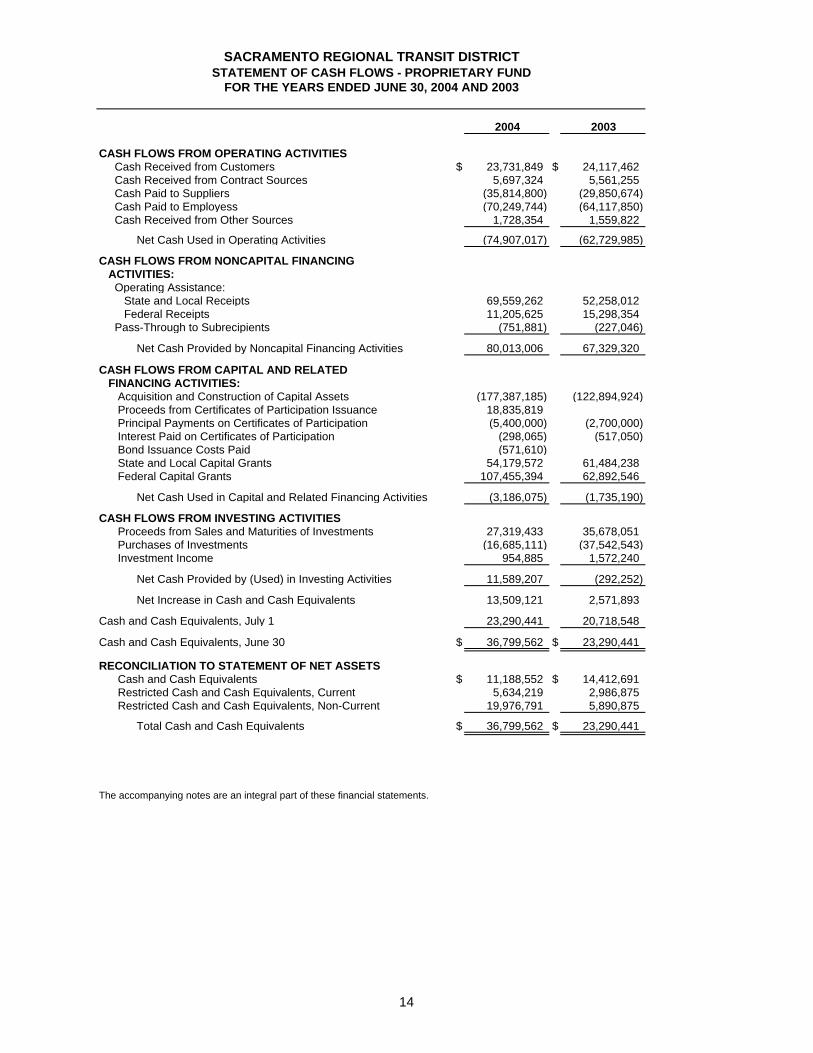
SACRAMENTO REGIONAL TRANSIT DISTRICTSTATEMENT OF CASH FLOWS - PROPRIETARY FUND
FOR THE YEARS ENDED JUNE 30, 2004 AND 2003
2004 2003
CASH FLOWS FROM OPERATING ACTIVITIES Cash Received from Customers $ 23,731,849 $ 24,117,462 Cash Received from Contract Sources 5,697,324 5,561,255 Cash Paid to Suppliers (35,814,800) (29,850,674) Cash Paid to Employess (70,249,744) (64,117,850) Cash Received from Other Sources 1,728,354 1,559,822
Net Cash Used in Operating Activities (74,907,017) (62,729,985)
CASH FLOWS FROM NONCAPITAL FINANCING ACTIVITIES: Operating Assistance: State and Local Receipts 69,559,262 52,258,012 Federal Receipts 11,205,625 15,298,354 Pass-Through to Subrecipients (751,881) (227,046)
Net Cash Provided by Noncapital Financing Activities 80,013,006 67,329,320
CASH FLOWS FROM CAPITAL AND RELATED FINANCING ACTIVITIES: Acquisition and Construction of Capital Assets (177,387,185) (122,894,924) Proceeds from Certificates of Participation Issuance 18,835,819 Principal Payments on Certificates of Participation (5,400,000) (2,700,000) Interest Paid on Certificates of Participation (298,065) (517,050) Bond Issuance Costs Paid (571,610) State and Local Capital Grants 54,179,572 61,484,238 Federal Capital Grants 107,455,394 62,892,546
Net Cash Used in Capital and Related Financing Activities (3,186,075) (1,735,190)
CASH FLOWS FROM INVESTING ACTIVITIES Proceeds from Sales and Maturities of Investments 27,319,433 35,678,051 Purchases of Investments (16,685,111) (37,542,543) Investment Income 954,885 1,572,240
Net Cash Provided by (Used) in Investing Activities 11,589,207 (292,252)
Net Increase in Cash and Cash Equivalents 13,509,121 2,571,893
Cash and Cash Equivalents, July 1 23,290,441 20,718,548
Cash and Cash Equivalents, June 30 $ 36,799,562 $ 23,290,441
RECONCILIATION TO STATEMENT OF NET ASSETS Cash and Cash Equivalents $ 11,188,552 $ 14,412,691 Restricted Cash and Cash Equivalents, Current 5,634,219 2,986,875 Restricted Cash and Cash Equivalents, Non-Current 19,976,791 5,890,875
Total Cash and Cash Equivalents $ 36,799,562 $ 23,290,441
The accompanying notes are an integral part of these financial statements.
14
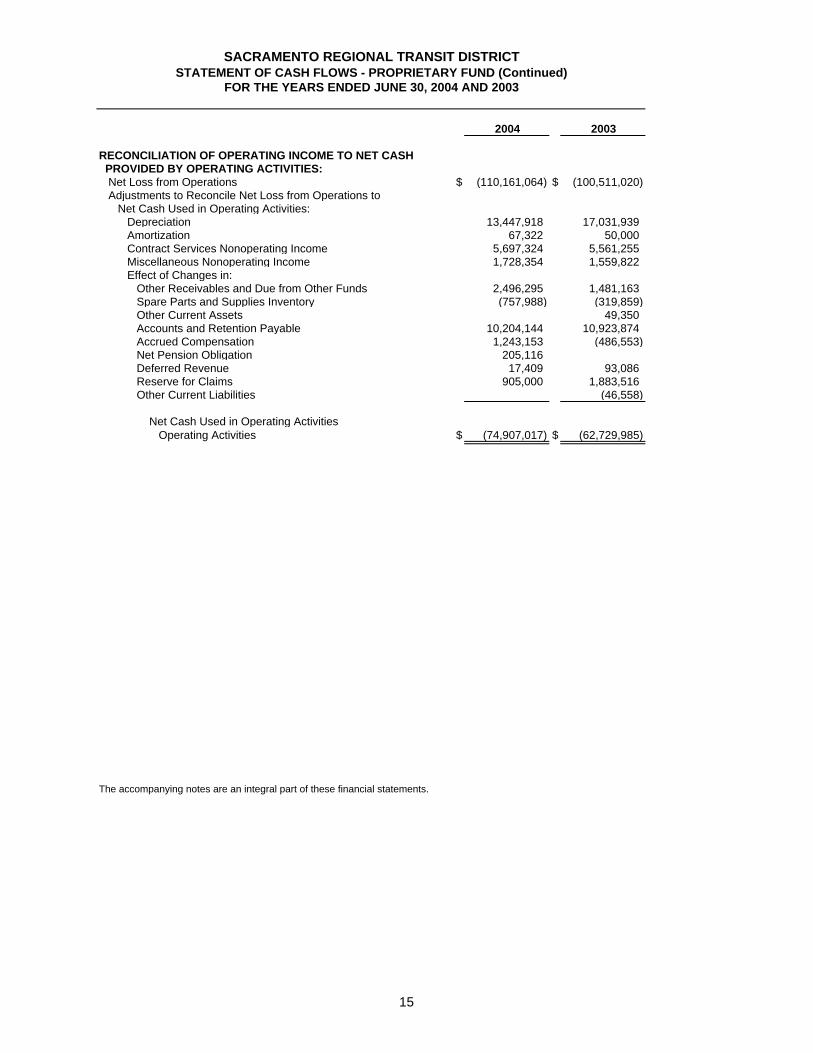
SACRAMENTO REGIONAL TRANSIT DISTRICTSTATEMENT OF CASH FLOWS - PROPRIETARY FUND (Continued)
FOR THE YEARS ENDED JUNE 30, 2004 AND 2003
2004 2003
RECONCILIATION OF OPERATING INCOME TO NET CASH PROVIDED BY OPERATING ACTIVITIES: Net Loss from Operations $ (110,161,064) $ (100,511,020) Adjustments to Reconcile Net Loss from Operations to Net Cash Used in Operating Activities: Depreciation 13,447,918 17,031,939 Amortization 67,322 50,000 Contract Services Nonoperating Income 5,697,324 5,561,255 Miscellaneous Nonoperating Income 1,728,354 1,559,822 Effect of Changes in: Other Receivables and Due from Other Funds 2,496,295 1,481,163 Spare Parts and Supplies Inventory (757,988) (319,859) Other Current Assets 49,350 Accounts and Retention Payable 10,204,144 10,923,874 Accrued Compensation 1,243,153 (486,553) Net Pension Obligation 205,116 Deferred Revenue 17,409 93,086 Reserve for Claims 905,000 1,883,516 Other Current Liabilities (46,558)
Net Cash Used in Operating Activities Operating Activities $ (74,907,017) $ (62,729,985)
The accompanying notes are an integral part of these financial statements.
15
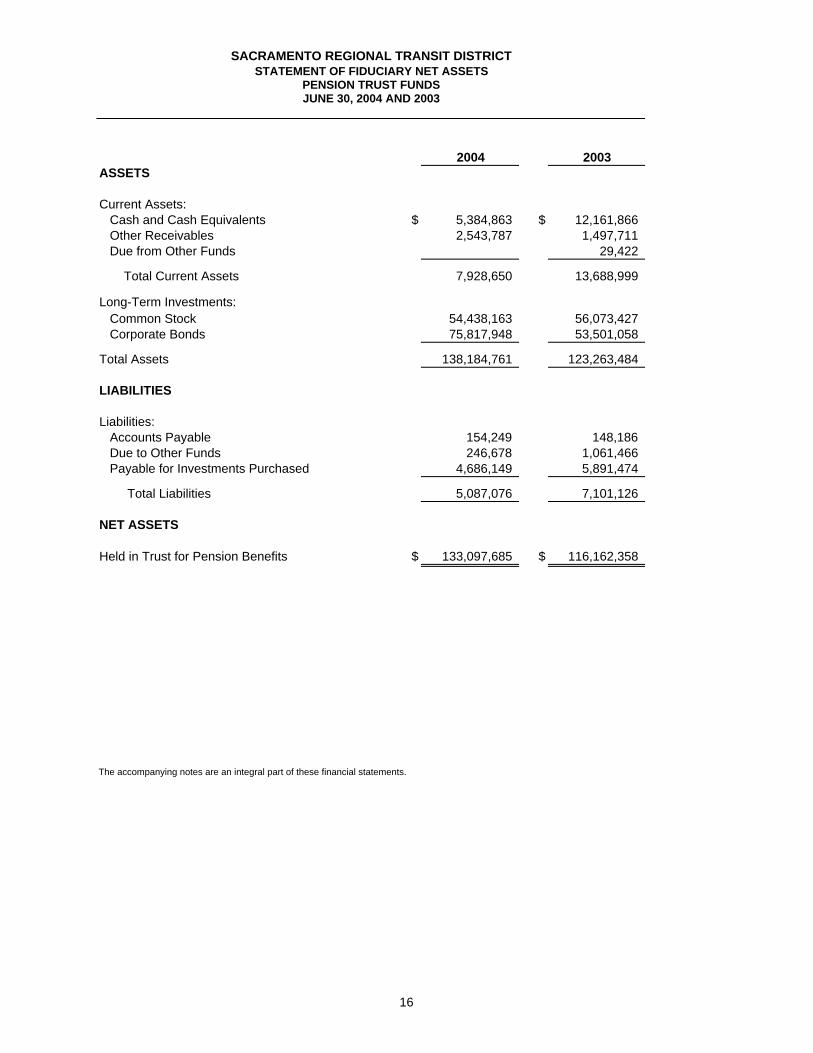
SACRAMENTO REGIONAL TRANSIT DISTRICTSTATEMENT OF FIDUCIARY NET ASSETS
PENSION TRUST FUNDSJUNE 30, 2004 AND 2003
2004 2003ASSETS
Current Assets: Cash and Cash Equivalents $ 5,384,863 $ 12,161,866 Other Receivables 2,543,787 1,497,711 Due from Other Funds 29,422
Total Current Assets 7,928,650 13,688,999
Long-Term Investments: Common Stock 54,438,163 56,073,427 Corporate Bonds 75,817,948 53,501,058
Total Assets 138,184,761 123,263,484
LIABILITIES
Liabilities: Accounts Payable 154,249 148,186 Due to Other Funds 246,678 1,061,466 Payable for Investments Purchased 4,686,149 5,891,474
Total Liabilities 5,087,076 7,101,126
NET ASSETS
Held in Trust for Pension Benefits $ 133,097,685 $ 116,162,358
The accompanying notes are an integral part of these financial statements.
16
SACRAMENTO REGIONAL TRANSIT DISTRICTSTATEMENT OF CHANGES IN FIDUCIARY NET ASSETS
PENSION TRUST FUNDSFOR THE YEARS ENDED JUNE 30, 2004 AND 2003
Net Increase (Decrease) in Fair Value of Investments 14,869,361 (1,151,830) Interest, Dividends, and Other Income 3,475,616 4,222,977 Less Investment Expenses (484,162) (419,556)
Net Investment Income 17,860,815 2,651,591
Total Additions 23,718,349 8,118,119
DEDUCTIONS
Benefits Paid to Participants 6,403,859 5,617,982 Administrative Expenses 379,163 221,421
Total Deductions 6,783,022 5,839,403
Increase in Net Assets 16,935,327 2,278,716
Net Assets, July 1 116,162,358 113,883,642
Net Assets, June 30 $ 133,097,685 $ 116,162,358
The accompanying notes are an integral part of these financial statements.
17
SACRAMENTO REGIONAL TRANSIT DISTRICTNOTES TO FINANCIAL STATEMENTS
YEARS ENDED JUNE 30, 2004 and 2003
18
1. SIGNIFICANT ACCOUNTING POLICIES
THE REPORTING ENTITY
The Sacramento Regional Transit District (District) was established in 1973 pursuant to theSacramento Regional Transit District Act. The District has the responsibility to develop, maintain,and operate a public mass transit transportation system for the benefit of the residents of theSacramento area. The District is governed by a Board of Directors appointed by the SacramentoCity Council and the Sacramento County Board of Supervisors.
As required by Governmental Accounting Standards Board (GASB) Statement No. 14, “TheFinancial Reporting Entity”, the District has reviewed criteria to determine whether other entitieswith activities that benefit the District should be included within its financial reporting entity. Thecriteria include, but are not limited to, whether the entity has a significant operational and financialrelationship with the District.
The District has determined that no other outside entity meets the above criteria, and therefore, noagency has been included as a component unit in the District's financial statements. In addition,the District is not aware of any entity that has such a relationship to the District that would result inthe District being considered a component unit of that other entity.
BASIS OF PRESENTATION
The accounts of the District are organized and operated on the basis of funds, each of which isconsidered an independent fiscal and accounting entity. The operations of each fund areaccounted for with a separate set of self-balancing accounts that comprise it assets, liabilities, netassets, revenues, and expenses, as appropriate. Resources are allocated to and accounted for inindividual funds based upon the purpose for which they are to be spent and the means by whichspending activities are controlled. The District distinguishes operating revenues and expensesfrom nonoperating items. Operating revenues and expenses generally result from providingtransportation services to customers. Separate financial statements are provided for proprietaryand fiduciary funds. The District’s accounts are organized into the following fund types:
Proprietary Fund Type
The Enterprise Fund is used to account for operations that are financed and operated in amanner similar to private business enterprises, where the intent of the governing body is that thecosts (expenses, including depreciation) of providing goods or services to the general public on acontinuing basis be financed or recovered primarily through user charges, or where the governingbody has decided that periodic determination of revenues earned, expenses incurred, and/or netincome is appropriate for capital maintenance, public policy, management control, accountability,or other policies. Unrestricted net assets for the enterprise fund represents the net assetsavailable for future operations.
SACRAMENTO REGIONAL TRANSIT DISTRICTNOTES TO FINANCIAL STATEMENTS
YEARS ENDED JUNE 30, 2004 and 2003
19
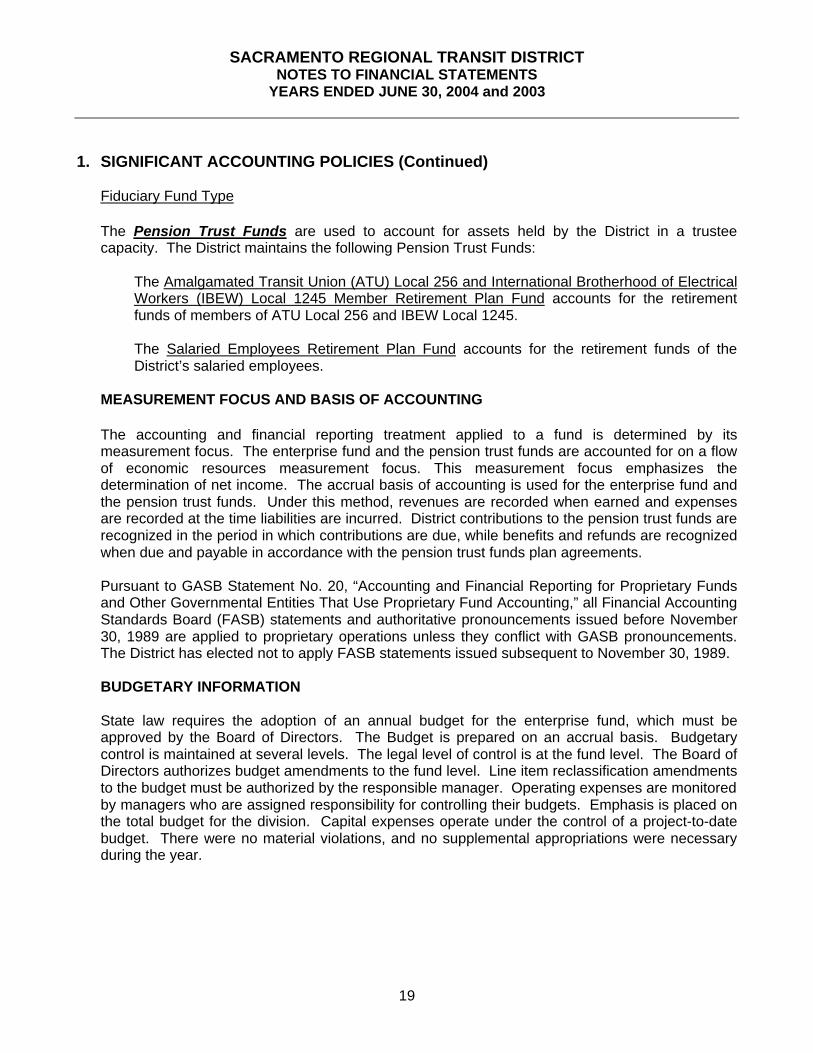
1. SIGNIFICANT ACCOUNTING POLICIES (Continued)
Fiduciary Fund Type
The Pension Trust Funds are used to account for assets held by the District in a trusteecapacity. The District maintains the following Pension Trust Funds:
The Amalgamated Transit Union (ATU) Local 256 and International Brotherhood of ElectricalWorkers (IBEW) Local 1245 Member Retirement Plan Fund accounts for the retirementfunds of members of ATU Local 256 and IBEW Local 1245.
The Salaried Employees Retirement Plan Fund accounts for the retirement funds of theDistrict’s salaried employees.
MEASUREMENT FOCUS AND BASIS OF ACCOUNTING
The accounting and financial reporting treatment applied to a fund is determined by itsmeasurement focus. The enterprise fund and the pension trust funds are accounted for on a flowof economic resources measurement focus. This measurement focus emphasizes thedetermination of net income. The accrual basis of accounting is used for the enterprise fund andthe pension trust funds. Under this method, revenues are recorded when earned and expensesare recorded at the time liabilities are incurred. District contributions to the pension trust funds arerecognized in the period in which contributions are due, while benefits and refunds are recognizedwhen due and payable in accordance with the pension trust funds plan agreements.
Pursuant to GASB Statement No. 20, “Accounting and Financial Reporting for Proprietary Fundsand Other Governmental Entities That Use Proprietary Fund Accounting,” all Financial AccountingStandards Board (FASB) statements and authoritative pronouncements issued before November30, 1989 are applied to proprietary operations unless they conflict with GASB pronouncements.The District has elected not to apply FASB statements issued subsequent to November 30, 1989.
BUDGETARY INFORMATION
State law requires the adoption of an annual budget for the enterprise fund, which must beapproved by the Board of Directors. The Budget is prepared on an accrual basis. Budgetarycontrol is maintained at several levels. The legal level of control is at the fund level. The Board ofDirectors authorizes budget amendments to the fund level. Line item reclassification amendmentsto the budget must be authorized by the responsible manager. Operating expenses are monitoredby managers who are assigned responsibility for controlling their budgets. Emphasis is placed onthe total budget for the division. Capital expenses operate under the control of a project-to-datebudget. There were no material violations, and no supplemental appropriations were necessaryduring the year.
SACRAMENTO REGIONAL TRANSIT DISTRICTNOTES TO FINANCIAL STATEMENTS
YEARS ENDED JUNE 30, 2004 and 2003
20
1. SIGNIFICANT ACCOUNTING POLICIES (Continued)
CASH AND EQUIVALENTS
For purposes of the statement of cash flows, the District considers all highly liquid investmentswith a maturity of three months or less when purchased to be cash and equivalents.
INVENTORIES
Inventories are stated at average cost and charged to expense at the time individual items arewithdrawn from inventory (consumption method). Inventory consists primarily of parts andsupplies relating to transportation vehicles and facilities.
CAPITAL ASSETS
Capital assets are stated at historical cost. The cost of normal maintenance and repairs is chargedto operations as incurred. Infrastructure, which includes light rail vehicle tracks, has beencapitalized. Improvements are capitalized and depreciated over the remaining useful lives of therelated properties. Depreciation is computed using the straight-line method over estimated usefullives as follows:
Buildings and improvements 30 to 50 yearsBuses and maintenance vehicles 4 to 12 yearsLight-rail structures and light-rail vehicles 25 to 45 yearsOther operating equipment 5 to 15 years
No depreciation is provided on construction in progress until construction is completed and theasset is placed in service.
It is the policy of the District to capitalize all capital assets with an individual cost of more than$5,000, and a useful life in excess of one year.
ACCRUED COMPENSATION
Accrued compensation includes salaries and benefits payable, the current portion of compensatedabsences, and the District’s accumulated post-retirement benefit provision.
COMPENSATED ABSENCES
The District’s policy allows employees to accumulate earned but unused vacation, sick leave, andcompensating time off which will be paid to employees upon separation from the District’s service,subject to a vesting policy.
SACRAMENTO REGIONAL TRANSIT DISTRICTNOTES TO FINANCIAL STATEMENTS
YEARS ENDED JUNE 30, 2004 and 2003
21
1. SIGNIFICANT ACCOUNTING POLICIES (Continued)
DEFERRED REVENUES
The District has deferred revenues from the prepayment of fares that apply to the subsequentaccounting year.
FEDERAL, STATE, AND LOCAL GRANT FUNDS
Grants are accounted for in accordance with the purpose for which the funds are intended.Approved grants for the acquisition of land, building, and equipment are recorded as revenues asthe related expenses are incurred. Approved grants for operating assistance are recorded asrevenues in the year in which the related grant conditions are met. Advances received on grantsare recorded as a liability until related grant conditions are met. The Transportation DevelopmentAct (TDA) provides that any funds not earned and not used may be required to be returned to theirsource.
When both restricted and unrestricted resources are available for the same purpose the Districtuses restricted resources first.
SELF-INSURANCE
The District is self-insured for workers’ compensation claims, general liability claims, and majorproperty damage. The District accrues the estimated costs of the self-insured portion of claims inthe period in which the amount of the estimated loss is determinable.
USE OF ESTIMATES
The preparation of financial statements in conformity with generally accepted accountingprinciples requires management to make estimates and assumptions that affect the reportedamounts of assets and liabilities and disclosure of contingent assets and liabilities at the date ofthe financial statements and the reported amounts of revenues and expenses during the reportingperiod. Actual results could differ from those estimates.
RECLASSIFICATIONS
Certain amounts presented in the prior year have been reclassified in order to be consistent withthe current year's presentation.
SACRAMENTO REGIONAL TRANSIT DISTRICTNOTES TO FINANCIAL STATEMENTS
YEARS ENDED JUNE 30, 2004 and 2003
22
1. SIGNIFICANT ACCOUNTING POLICIES (Continued)
CHANGES IN ACCOUNTING POLICY
For the fiscal year ended June 30, 2003, the District implemented GASB Statement Number 34(GASB 34), Basic Financial Statements – and Management’s Discussion and Analysis – for Stateand Local Governments, GASB Statement No. 37 (GASB 37) Basic Financial Statements andManagement’s Discussion and Analysis for State and Local Governments: Omnibus, and GASBStatement No. 38 (GASB 38), Certain Financial Statement Note Disclosures. GASB 34significantly changes the way state and local governments report their financial information to thepublic. The preparation of a Management Discussion and Analysis is to clarify the government’sfinancial activities as required by GASB 34. Furthermore, the District’s notes to the financialstatements incorporate modifications as required under GASB 38.
2. PRIOR PERIOD ADJUSTMENTS
The District made a correction to the June 30, 2003 state and local receivables and net assets.Supplemental programming of Measure A funds to operating support and reprogrammings ofMeasure A funds to operating support were not accrued as receivables nor recognized asoperating support in the year of the approval by the Sacramento Transportation Authority. Netassets were increased and state and local receivables were increased at June 30, 2003 by$2,209,764 as a result of the correction. In addition, the District recognized the net pensionobligation previously omitted from liabilities. Net assets were decreased and the net pensionobligation was increased at June 30, 2003 by $1,685,884. The net effect of these prior periodadjustments increased net assets by $523,880.
3. CASH AND INVESTMENTS
DEPOSITS
At June 30, 2004 and 2003, the carrying amount of the District’s deposits were $24,068,499 and$30,718,247, and the bank balances of deposits maintained with various financial institutionsamounted to $25,594,868 and $34,544,730, respectively. In accordance with GASB StatementNo. 3, “Deposits with Financial Institutions, Investments (including Repurchase Agreements), andReverse Repurchase Agreements”, the District’s deposits are categorized in the following manner:
Category 1–
Insured or collateralized with securities held bythe District or by its agent in the District’s name.
Category 2–
Collateralized with securities held by the pledgingfinancial institution’s trust department or agent inthe District’s name.
Category 3–
Uncollateralized or collateralized with securitiesheld by the pledging financial institution, or by itstrust department or agent, but not in the District’sname.
SACRAMENTO REGIONAL TRANSIT DISTRICTNOTES TO FINANCIAL STATEMENTS
YEARS ENDED JUNE 30, 2004 and 2003
23
3. CASH AND INVESTMENTS (Continued)
In accordance with the California Government Code, uninsured funds are covered by a multiplefinancial institution collateral pool maintained at a minimum of 110% of the uninsured deposits withthe pledging institution’s agent in the institution’s name.
The District’s deposits by category as of June 30, 2004 are as follows:
Total $ 850,875 $ 8,296,173 $ 16,447,820 $ 25,594,868
The District's deposits by category as of June 30, 2003 are as follows:
Category1 2 3 Total
Bank Accounts $ 700,000 $ 12,283,311 $ 12,983,311Money MarketAccounts
$ 21,561,419 21,561,419
Total $ 700,000 $ 21,561,419 $ 12,283,311 $ 34,544,730
INVESTMENTS
The District pursues a program of safety, liquidity, and yield in its’ cash management andinvestment program in order to achieve maximum return on the Enterprise Fund’s available funds.The Enterprise Fund’s investments are governed by an annual Board-adopted policy, which is incompliance with the California Government Code. During the year ended June 30, 2004, theEnterprise Fund’s permissible investments included obligations of the U.S. Treasury andGovernment Agencies, certificates of deposit, bankers’ acceptances, commercial paper, and theCalifornia Arbitrage Management Program (CAMP). Policy states that Moody's CommercialPaper Record must rate investments in commercial paper A-1 and Standard & Poor's Corporationby P-1. The District’s investment in CAMP includes reserve and lease payment funds related toCertificates of Participation.
The prudent person standard, which allows for the purchase, holding, or sale of any form or typeof investment, financial instrument, or financial transaction when prudent, governs the PensionTrust Funds’ investment activity.
All of the District’s investments are reported at fair value measured by quoted market prices.None of the Pension Trust Funds’ investments in any one organization represent five percent ormore of its total investments.
SACRAMENTO REGIONAL TRANSIT DISTRICTNOTES TO FINANCIAL STATEMENTS
YEARS ENDED JUNE 30, 2004 and 2003
24
3. CASH AND INVESTMENTS (Continued)
The District’s investments are categorized as to custodial risk in the following manner:
Category 1 – Insured or registered, or securities held by theDistrict or its agent in the District’s name.
Category 2 – Uninsured and unregistered, with securities heldby the counterparty’s trust department or agent inthe District’s name.
Category 3 – Uninsured and unregistered, with securities heldby the counterparty, or by the counterparty’s trustdepartment or agent, but not in the District’sname.
Uncategorized–
Investments in external investment pools notrequired to be categorized.
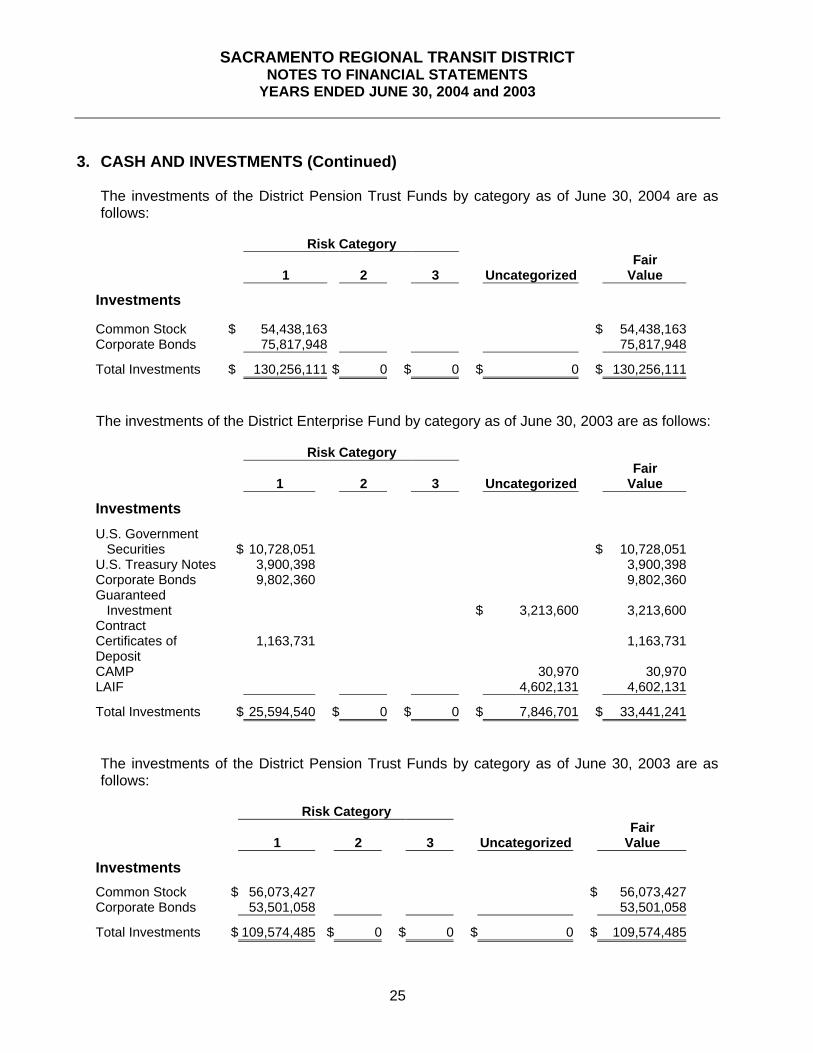
The investments of the District Enterprise Fund by category as of June 30, 2004 are as follows:
Risk Category
1 2 3 UncategorizedFair
Value
Investments
U.S. Government Securities $ 6,983,975 $ 6,983,975U.S. Treasury Notes 1,158,456 1,158,456Corporate Bonds 9,672,912 9,672,912Certificates ofDeposit
SACRAMENTO REGIONAL TRANSIT DISTRICTNOTES TO FINANCIAL STATEMENTS
YEARS ENDED JUNE 30, 2004 and 2003
26
3. CASH AND INVESTMENTS (Continued)
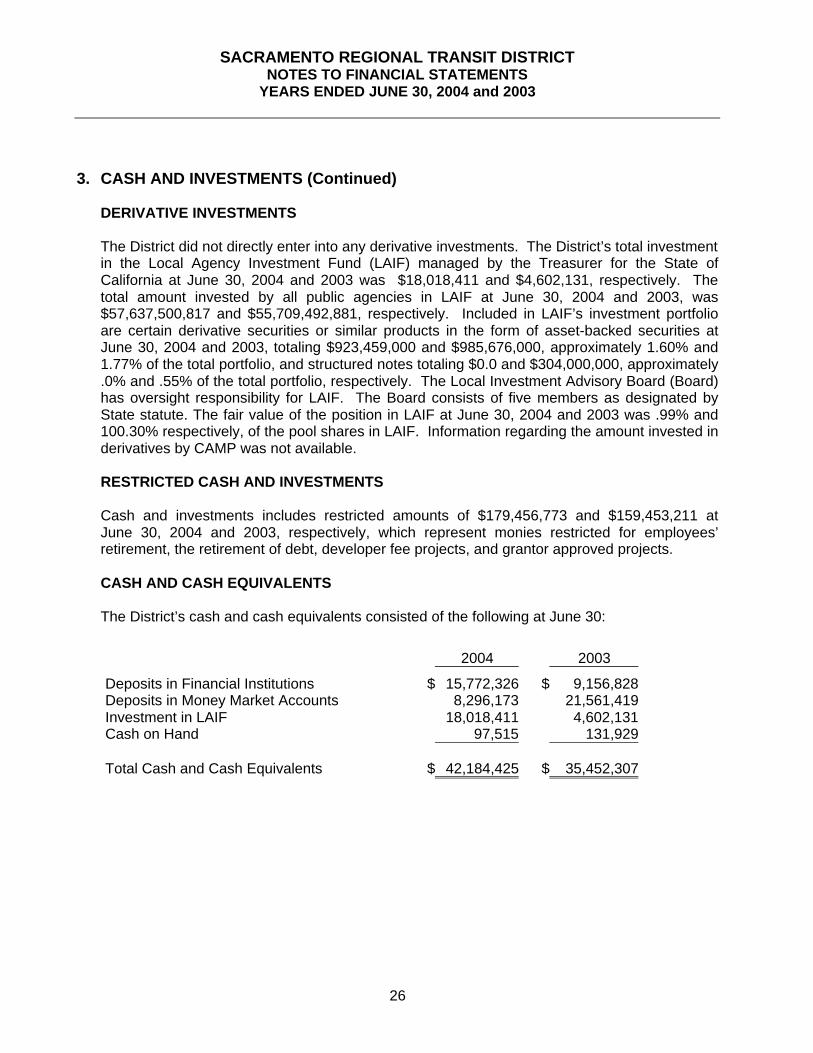
DERIVATIVE INVESTMENTS
The District did not directly enter into any derivative investments. The District’s total investmentin the Local Agency Investment Fund (LAIF) managed by the Treasurer for the State ofCalifornia at June 30, 2004 and 2003 was $18,018,411 and $4,602,131, respectively. Thetotal amount invested by all public agencies in LAIF at June 30, 2004 and 2003, was$57,637,500,817 and $55,709,492,881, respectively. Included in LAIF’s investment portfolioare certain derivative securities or similar products in the form of asset-backed securities atJune 30, 2004 and 2003, totaling $923,459,000 and $985,676,000, approximately 1.60% and1.77% of the total portfolio, and structured notes totaling $0.0 and $304,000,000, approximately.0% and .55% of the total portfolio, respectively. The Local Investment Advisory Board (Board)has oversight responsibility for LAIF. The Board consists of five members as designated byState statute. The fair value of the position in LAIF at June 30, 2004 and 2003 was .99% and100.30% respectively, of the pool shares in LAIF. Information regarding the amount invested inderivatives by CAMP was not available.
RESTRICTED CASH AND INVESTMENTS
Cash and investments includes restricted amounts of $179,456,773 and $159,453,211 atJune 30, 2004 and 2003, respectively, which represent monies restricted for employees’retirement, the retirement of debt, developer fee projects, and grantor approved projects.
CASH AND CASH EQUIVALENTS
The District’s cash and cash equivalents consisted of the following at June 30:
2004 2003
Deposits in Financial Institutions $ 15,772,326 $ 9,156,828Deposits in Money Market Accounts 8,296,173 21,561,419Investment in LAIF 18,018,411 4,602,131Cash on Hand 97,515 131,929
Total Cash and Cash Equivalents $ 42,184,425 $ 35,452,307
SACRAMENTO REGIONAL TRANSIT DISTRICTNOTES TO FINANCIAL STATEMENTS
YEARS ENDED JUNE 30, 2004 and 2003
27
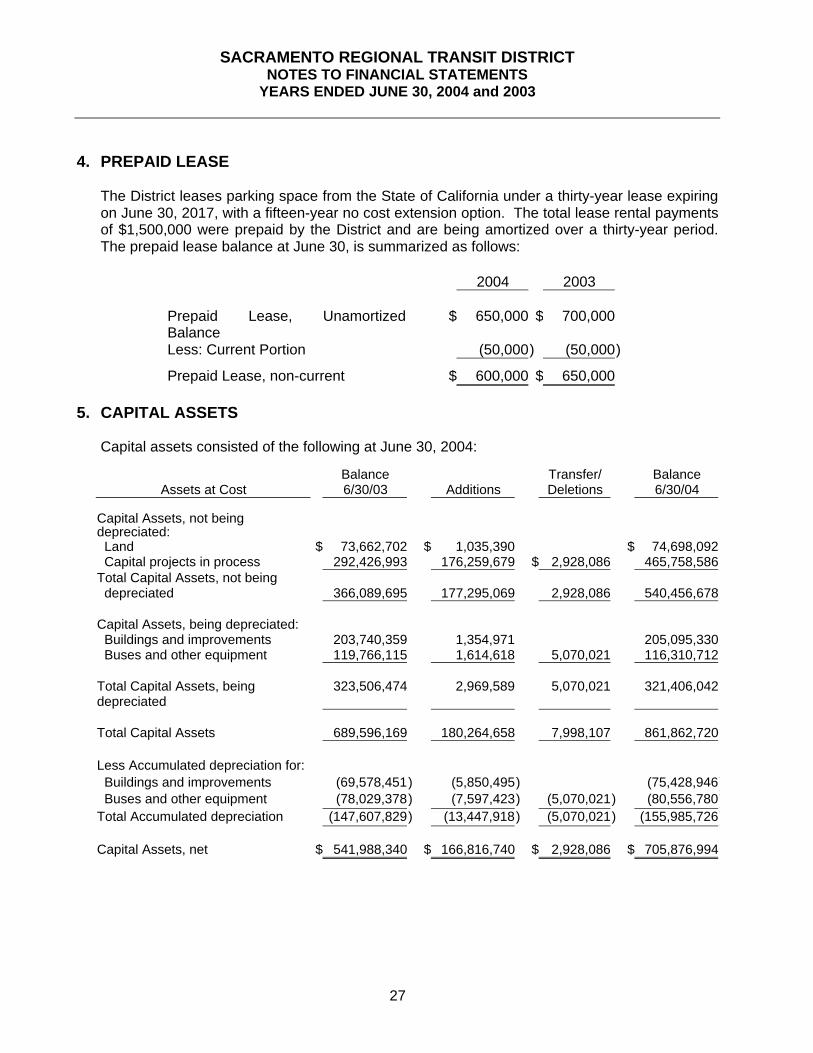
4. PREPAID LEASE
The District leases parking space from the State of California under a thirty-year lease expiringon June 30, 2017, with a fifteen-year no cost extension option. The total lease rental paymentsof $1,500,000 were prepaid by the District and are being amortized over a thirty-year period.The prepaid lease balance at June 30, is summarized as follows:
2004 2003
Prepaid Lease, UnamortizedBalance
$ 650,000 $ 700,000
Less: Current Portion (50,000) (50,000)
Prepaid Lease, non-current $ 600,000 $ 650,000
5. CAPITAL ASSETS
Capital assets consisted of the following at June 30, 2004:
Assets at CostBalance6/30/03 Additions
Transfer/Deletions
Balance6/30/04
Capital Assets, not beingdepreciated: Land $ 73,662,702 $ 1,035,390 $ 74,698,092 Capital projects in process 292,426,993 176,259,679 $ 2,928,086 465,758,586Total Capital Assets, not being depreciated 366,089,695 177,295,069 2,928,086 540,456,678
Capital Assets, being depreciated: Buildings and improvements 203,740,359 1,354,971 205,095,330 Buses and other equipment 119,766,115 1,614,618 5,070,021 116,310,712
Total Capital Assets, beingdepreciated
323,506,474 2,969,589 5,070,021 321,406,042
Total Capital Assets 689,596,169 180,264,658 7,998,107 861,862,720
Less Accumulated depreciation for: Buildings and improvements (69,578,451) (5,850,495) (75,428,946) Buses and other equipment (78,029,378) (7,597,423) (5,070,021) (80,556,780)Total Accumulated depreciation (147,607,829) (13,447,918) (5,070,021) (155,985,726)
Capital Assets, net $ 541,988,340 $ 166,816,740 $ 2,928,086 $ 705,876,994
SACRAMENTO REGIONAL TRANSIT DISTRICTNOTES TO FINANCIAL STATEMENTS
YEARS ENDED JUNE 30, 2004 and 2003
28
6. LONG-TERM DEBT
CERTIFICATES OF PARTICIPATION 1992 – LEASE PAYABLE
During April 1992, the California Transit Finance Corporation (CTFC) issued Certificates ofParticipation (COP) totaling $32,440,000 on behalf of the District, with interest rates rangingfrom 4.75% to 6.40%, to finance the acquisition of approximately 75 buses, a fare collectionsystem, and a radio system (equipment) for District operation. Concurrently, the Districtentered into a capital lease agreement with the CTFC to lease the equipment. The leaserequires the District to make annual COP payments to CTFC, which are then remitted to theCOP owners.
The Certificates of Participation were defeased on November 4, 2003, and called on March 1,2004. In the fiscal year ended June 30, 2004, an extraordinary loss on early extinguishment ofdebt of $96,786 was recognized.
The gross amount of assets recorded under this capital lease at June 30, 2003 was$21,122,087 with accumulated amortization expense of $17,334,866.
CERTIFICATES OF PARTICIPATION 2003– FAREBOX REVENUE
During December 2003, the California Transit Finance Corporation (CTFC) issued Certificatesof Participation (COP) totaling $18,000,000 on behalf of the District with interest rates rangingfrom 2.0% to 5.0%. The COPs will be used to finance the acquisition of light rail vehicles andequipment related thereto, trolley vehicles and equipment related thereto, and certain realproperty to be used as maintenance facilities. On December 1, 2003, the District entered intoan installment purchase contract with the CTFC. The obligation of the District to makeinstallment payments is an unconditional obligation of the District payable solely from andsecured by a lien on and gross pledge of farebox revenues. The installment agreementrequires the District to make annual COP payments to CTFC which are then remitted to theCOP owners. Scheduled maturity dates occur at various times through March 1, 2015.
SACRAMENTO REGIONAL TRANSIT DISTRICTNOTES TO FINANCIAL STATEMENTS
YEARS ENDED JUNE 30, 2004 and 2003
29
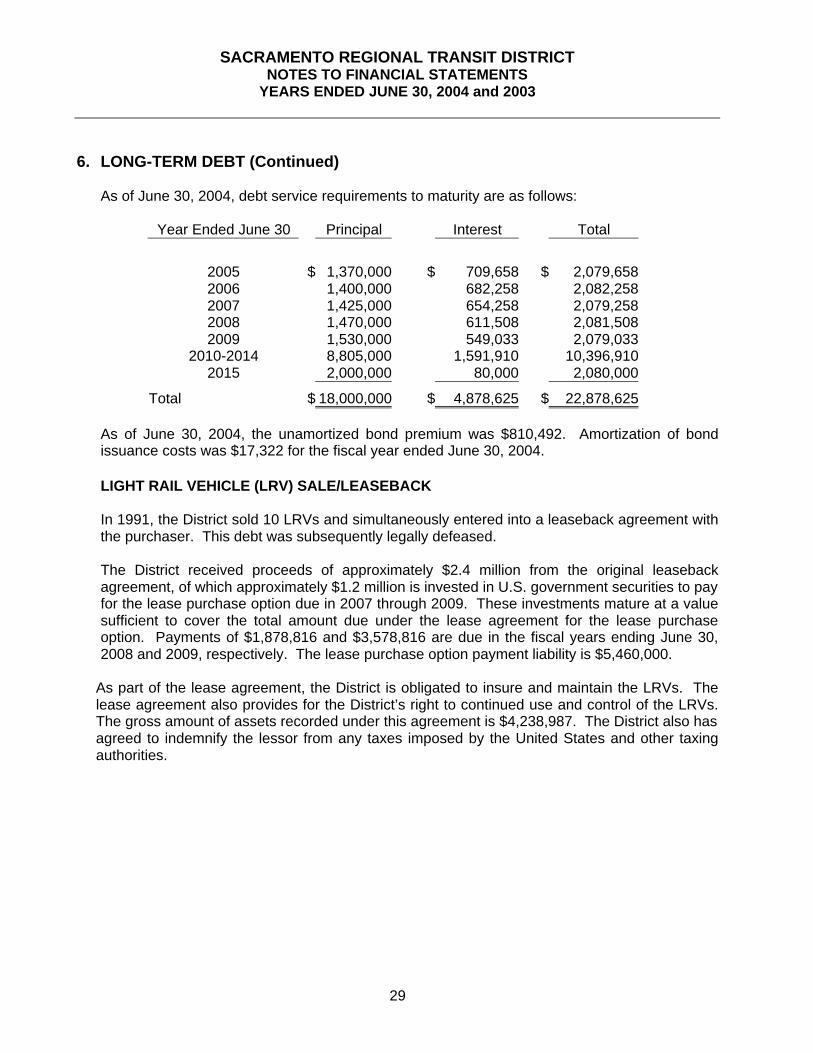
6. LONG-TERM DEBT (Continued)
As of June 30, 2004, debt service requirements to maturity are as follows:
As of June 30, 2004, the unamortized bond premium was $810,492. Amortization of bondissuance costs was $17,322 for the fiscal year ended June 30, 2004.
LIGHT RAIL VEHICLE (LRV) SALE/LEASEBACK
In 1991, the District sold 10 LRVs and simultaneously entered into a leaseback agreement withthe purchaser. This debt was subsequently legally defeased.
The District received proceeds of approximately $2.4 million from the original leasebackagreement, of which approximately $1.2 million is invested in U.S. government securities to payfor the lease purchase option due in 2007 through 2009. These investments mature at a valuesufficient to cover the total amount due under the lease agreement for the lease purchaseoption. Payments of $1,878,816 and $3,578,816 are due in the fiscal years ending June 30,2008 and 2009, respectively. The lease purchase option payment liability is $5,460,000.
As part of the lease agreement, the District is obligated to insure and maintain the LRVs. Thelease agreement also provides for the District’s right to continued use and control of the LRVs.The gross amount of assets recorded under this agreement is $4,238,987. The District also hasagreed to indemnify the lessor from any taxes imposed by the United States and other taxingauthorities.
SACRAMENTO REGIONAL TRANSIT DISTRICTNOTES TO FINANCIAL STATEMENTS
YEARS ENDED JUNE 30, 2004 and 2003
30
6. LONG-TERM DEBT (Continued)
CHANGES IN LONG-TERM LIABILITES
Long-term liability activity for the year ended June 30, 2004 was as follows:
DueBeginning Ending WithinBalance Additions Deductions Balance One Year
The following table summarizes interfund transactions for the fiscal year ended June 30, 2004:
Due fromOtherFunds
Due to Other Funds
Enterprise Fund $ 246,678Pension Trust Funds:
ATU Local 257 & IBEW Local 1245Members Retirement Plan $ 221,329
Salaried Employees Retirement Plan 25,349
Total $ 246,678 $ 246,678
SACRAMENTO REGIONAL TRANSIT DISTRICTNOTES TO FINANCIAL STATEMENTS
YEARS ENDED JUNE 30, 2004 and 2003
31
7. INTERFUND TRANSACTIONS (Continued)
The following table summarizes interfund transactions for the fiscal year ended June 30, 2003:
Due fromOtherFunds
Due to Other Funds
Enterprise Fund $ 1,032,044Pension Trust Funds:
ATU Local 257 & IBEW Local 1245Members Retirement Plan $ 1,061,466
Salaried Employees Retirement Plan 29,422
Total $ 1,061,466 $ 1,061,466
The interfund transactions exist because the pension plans may collect more or less incontributions than the enterprise fund actually paid on behalf of the pension plans. All items willbe repaid within one year.
8. FUNDING SOURCES
The District is dependent upon funds from several sources to meet its operating, maintenance,and capital requirements. The receipt of such funds is controlled by statutes, the provisions ofvarious grant contracts, and regulatory approvals, and in some instances, is dependent on theavailability of grantor and local matching funds.
FEDERAL GRANTS
Federal grant funding is obtained from the Federal Transit Administration (FTA).Federal funding for the year ended June 30 is comprised of the following:
Total Federal operating assistance grants 11,852,702 14,105,618
Capital grants:FTA Section 5307 6,188,654 4,382,578
FTA Section 5309 25,485,165 25,357,897STP and CMAQ 83,777,629 33,432,127
Total Federal capital grants 115,451,448 63,172,602
Total Federal operating and capital grants $ 127,304,150 $ 77,278,220
SACRAMENTO REGIONAL TRANSIT DISTRICTNOTES TO FINANCIAL STATEMENTS
YEARS ENDED JUNE 30, 2004 and 2003
32
8. FUNDING SOURCES (Continued)
The FTA retains its interest in assets acquired with Federal funds should they be disposed ofbefore the end of their economic lives or not used for mass transit.
Under provisions of Section 5307 of the Urban Mass Transportation Act of 1964, as amended,Federal resources are made available for planning, capital, and operating assistance, subjectto certain limitations. Funds are apportioned annually based on a statutory formula and areavailable for a period of three years following the close of the fiscal year for which they wereapportioned. Any unobligated funds at the end of such period revert to the federal government.In general, funds received for operations must, at a minimum, be matched 50% with localcontributions and funds for capital projects must be matched 20% with local contributions.
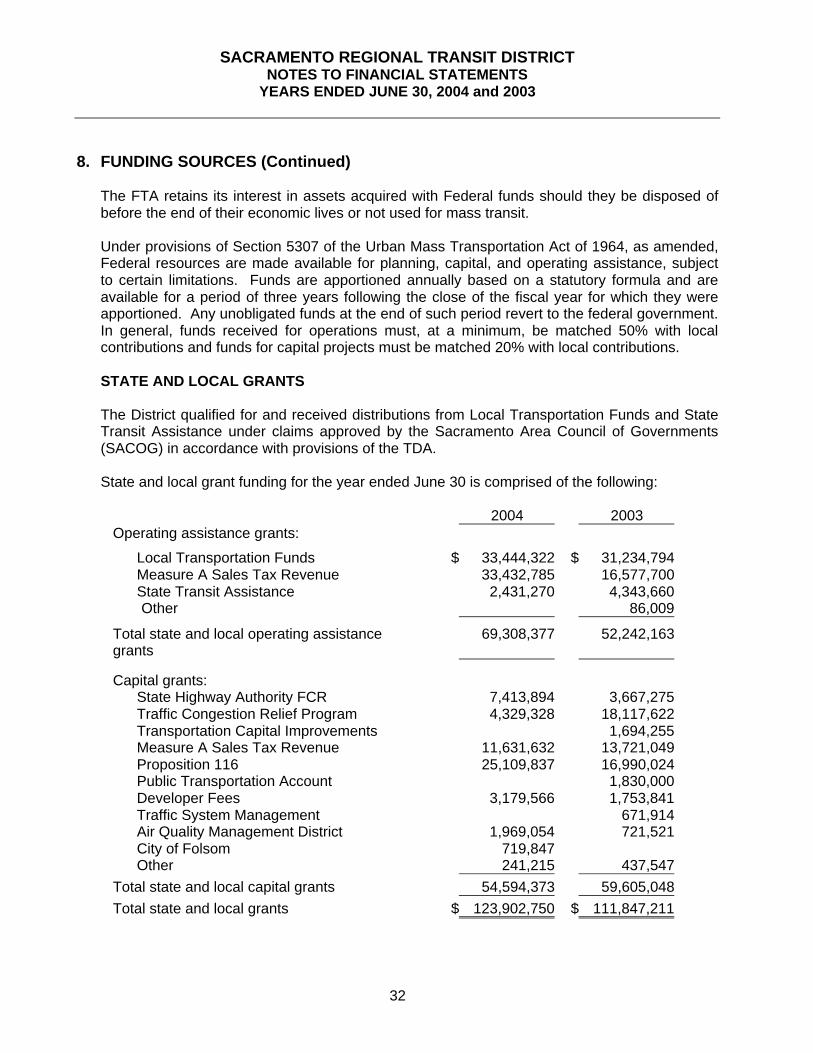
STATE AND LOCAL GRANTS
The District qualified for and received distributions from Local Transportation Funds and StateTransit Assistance under claims approved by the Sacramento Area Council of Governments(SACOG) in accordance with provisions of the TDA.
State and local grant funding for the year ended June 30 is comprised of the following:
2004 2003Operating assistance grants:
Local Transportation Funds $ 33,444,322 $ 31,234,794Measure A Sales Tax Revenue 33,432,785 16,577,700State Transit Assistance 2,431,270 4,343,660
Other 86,009
Total state and local operating assistancegrants
69,308,377 52,242,163
Capital grants:State Highway Authority FCR 7,413,894 3,667,275Traffic Congestion Relief Program 4,329,328 18,117,622Transportation Capital Improvements 1,694,255Measure A Sales Tax Revenue 11,631,632 13,721,049Proposition 116 25,109,837 16,990,024Public Transportation Account 1,830,000Developer Fees 3,179,566 1,753,841Traffic System Management 671,914Air Quality Management District 1,969,054 721,521City of Folsom 719,847Other 241,215 437,547
Total state and local capital grants 54,594,373 59,605,048
Total state and local grants $ 123,902,750 $ 111,847,211
SACRAMENTO REGIONAL TRANSIT DISTRICTNOTES TO FINANCIAL STATEMENTS
YEARS ENDED JUNE 30, 2004 and 2003
33
8. FUNDING SOURCES (Continued)
ADVANCES FROM OTHER GOVERNMENTS
Advances from other governments at June 30 consisted of the following:
2004 2003
Developer Fees $ 12,073,157 $ 14,650,488FTA Grant Funds 1,567,713 1,567,713Air Quality Management District 282,138Measure A Sales Tax Revenue 16,782Other 134,489 134,489
Total advances from other governments $ 13,775,359 $ 16,651,610
The advances from other governments are utilized principally for capital funding.
9. FARE REVENUE RATIO
The District is required to maintain a fare revenue-to-operating expense ratio of 25.50% inaccordance with the Transportation Development Act. To demonstrate compliance with thisFare Revenue Ratio, the District has supplemented per Public Utility Code Section 99268.19 aportion of its Local Measure A funds in order to meet the required ratio. The fare revenue-to-operating expense ratio for the District is calculated as follows for the year ended June 30:
2004 2003
Fare Revenues $ 22,003,511 $ 21,744,856Local Fund Supplementation
Depreciation and Amortization (13,515,240) (17,081,939)
Net Operating Expenses $ 118,649,335 $ 105,173,937
Fare Revenue Ratio 25.5% 25.5%
SACRAMENTO REGIONAL TRANSIT DISTRICTNOTES TO FINANCIAL STATEMENTS
YEARS ENDED JUNE 30, 2004 and 2003
34
10. PENSION PLANS
DESCRIPTION OF PLANS
The District contributes to two single-employer defined benefit pension plans: The SacramentoRegional Transit District Retirement Plan for members of Amalgamated Transit Union (ATU)Local 256 and International Brotherhood of Electrical Workers (IBEW) Local 1245, and theSacramento Regional Transit District Retirement Plan for Salaried Employees (Plans). ThePlans are administered by the District under the direction of the Retirement Board of Directors.The Retirement Board is comprised of members of the District’s Board of Directors and iselected annually. The Salaried Employees’ Plan covers the District’s salaried employees. Thesalaried employees fully vest after nine years of service; however, partial vesting begins in yearfive (20% per year). The Contract Employees’ Plan covers employees who are members ofATU Local 256 and IBEW Local 1245. The contract employees vest after ten years of servicewith no partial vesting. Each plan provides retirement, disability, and death benefits to planmembers and beneficiaries. The District’s Board of Directors establishes and amends benefitsprovisions for the Salaried Employees’ Plan. The District’s Board of Directors and the unionsjointly establish and amend benefit provisions for the Contracted Employees’ Plan. Each planissues a publicly available financial report that includes financial statements and requiredsupplementary information for that plan. Those reports may be obtained by writing toSacramento Regional Transit District, P.O. Box 2110, Sacramento, CA 95812.
ADMINISTRATION
The Plans are administered by the Retirement Board. All expenses incurred in theadministration of the Plans are paid by the Plans.
SIGNIFICANT ACCOUNTING POLICIES
The financial statements of the Plans are prepared on the accrual basis of accounting inaccordance with accounting principles generally accepted in the United States of America. TheDistrict contributions to the Plans are recognized in the period in which the contributions aredue pursuant to formal commitments, as well as a statutory or contractual requirements.Benefits and refunds are recognized when due and payable in accordance with the Planagreements.
SACRAMENTO REGIONAL TRANSIT DISTRICTNOTES TO FINANCIAL STATEMENTS
YEARS ENDED JUNE 30, 2004 and 2003
35
10. PENSION PLANS (Continued)
FUNDING POLICY
The District is required to contribute an actuarially determined rate; the rates for the year endedJune 30, 2004 were 10.61% and 10.68% of annual covered payroll for the Contracted andSalaried Employees’ plans, respectively, based on the actuarial valuation dated July 1, 2003,the most current available. Contribution rates for the year ended June 30, 2003 were 10.66%and 13.54% of annual covered payroll for the Contracted and Salaried plans, respectively. Nocontributions are required by plan members.
ANNUAL PENSION COST AND NET PENSION OBLIGATION
The District’s annual pension cost and net pension obligation to both the Contract Employees’and Salaried Employees’ Plans for the year ended June 30, 2004, are as follows:
Salaried ContractedEmployees’ Employees’
Plan Plan
Annual required contribution $ 2,044,485 $ 3,422,043Interest on net pension obligation 46,652 88,219Adjustment to annual required contribution 24,298 45,947 Annual pension cost 2,115,435 3,556,209Contributions made (2,044,485) (3,422,043) Increase in net pension obligation 70,950 134,166Net pension obligation beginning of year 583,152 1,102,732
Net pension obligation end of year $ 654,102 $ 1,236,898
The annual required contributions for both plans were determined as part of the July 1, 2003actuarial valuation using the entry age actuarial cost method. The actuarial assumptionsincluded (a) 8.00% investment rate of return (net of administrative expenses) and (b) projectedsalary increases of 5.04% to 9.72% for contract employees and 4.00% to 5.82% for salariedemployees. Both (a) and (b) included an inflation component of 4.00%. The actuarial value ofassets was determined using the market value adjusted to reflect investment earnings greaterthan (or less than) the assumed rate over a five-year period.
SACRAMENTO REGIONAL TRANSIT DISTRICTNOTES TO FINANCIAL STATEMENTS
YEARS ENDED JUNE 30, 2004 and 2003
36
10. PENSION PLANS (Continued)
The unfunded actuarial accrued liability is being amortized as a level percentage of projectedpayroll on an open basis. The remaining amortization period at June 30, 2003 was 24 years.
SACRAMENTO REGIONAL TRANSIT DISTRICTNOTES TO FINANCIAL STATEMENTS
YEARS ENDED JUNE 30, 2004 and 2003
37
11. POSTRETIREMENT BENEFITS
In addition to providing pension benefits, the District provides certain health care and lifeinsurance benefits under the provisions of the Personnel Rules and Procedures for non-contract employees and for retired non-contract employees. The District’s non-contractsalaried employees and their dependents may become eligible for such benefits if theemployees reach normal retirement age while working for the District. These benefits andsimilar benefits for active employees are provided through an insurance company whosepremiums are based on the benefits paid during the year. The District pays on a pay-as-you-go basis, 100.00 % of the cost, and recognizes the cost of providing such benefits to retireesby expensing the related annual insurance premiums, which were approximately $350,000 forthe years ended June 30, 2004 and 2003. Seventy-one and sixty-five employees and/or theirbeneficiaries were eligible to receive such benefits at June 30, 2004 and 2003, respectively.
12. SELF-INSURANCE
The District is exposed to various risks of loss related to torts; theft of, damage to, anddestruction of assets; errors and omissions; injuries to employees; and natural disasters.Coverage provided by self-insured and excess coverage is generally as follows as of June 30,2004:
Self-insurance Excess CoverageType of Coverage (per occurrence) (per occurrence)
Workers’ Compensation Up to $2,000,000 $2,000,000 to$10,000,000
Commercial General LiabilityBus Up to $2,000,000 $2,000,000 to
$100,000,000Light Rail Up to $5,000,000 $5,000,000 to
$100,000,000*Property:
Flood & All Other Perils Up to $250,000 $250,000 to$50,000,000
**
Collision Up to $500,000 $500,000 to$50,000,000
* Includes revenue and non-revenue vehicles.** In Aggregate excess coverage for flood.
The District purchases commercial insurance for claims in excess of self-insured amounts andfor all other risks of loss to a stated maximum amount. The District is self-insured for amountsin excess of these maximum amounts. Settled claims have not exceeded this commercialcoverage in any of the past three fiscal years.
The reserve claims liability of $19,237,000 and $18,332,000 reported at June 30, 2004 and2003, respectively, is based on estimates of the amounts needed to pay prior and current year
SACRAMENTO REGIONAL TRANSIT DISTRICTNOTES TO FINANCIAL STATEMENTS
YEARS ENDED JUNE 30, 2004 and 2003
38
claims and to allow accrual of estimated incurred but not reported claims. Non-incrementalclaims adjustment expenses have been included as part of the liability. The liabilites arediscounted using discount factors that assume a 4.00% rate of return. As of June 30, 2004and 2003, the current portion of the total claims liability is estimated to be $7,198,000 and$6,511,000, respectively. The remaining balance of $12,039,000 and $11,821,000 is reportedas a long-term liability on the balance sheet, respectively.
12. SELF-INSURANCE (Continued)
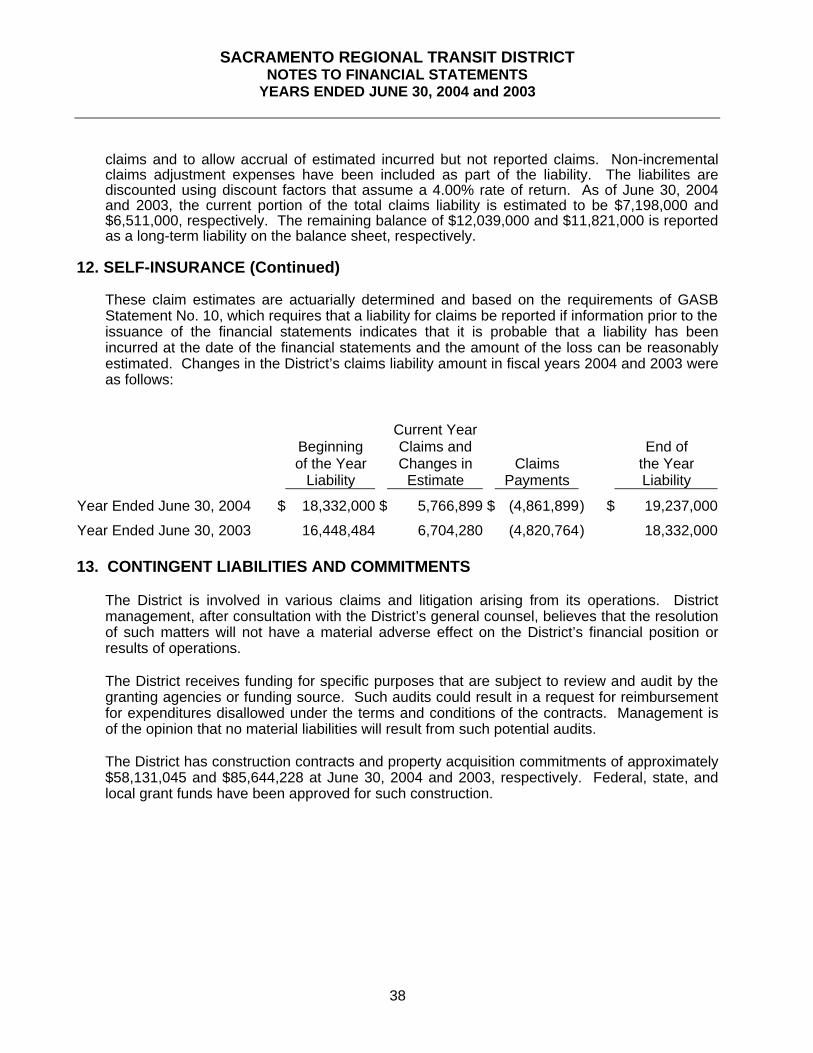
These claim estimates are actuarially determined and based on the requirements of GASBStatement No. 10, which requires that a liability for claims be reported if information prior to theissuance of the financial statements indicates that it is probable that a liability has beenincurred at the date of the financial statements and the amount of the loss can be reasonablyestimated. Changes in the District’s claims liability amount in fiscal years 2004 and 2003 wereas follows:
Current YearBeginning Claims and End ofof the Year Changes in Claims the Year
Liability Estimate Payments Liability
Year Ended June 30, 2004 $ 18,332,000 $ 5,766,899 $ (4,861,899) $ 19,237,000
Year Ended June 30, 2003 16,448,484 6,704,280 (4,820,764) 18,332,000
13. CONTINGENT LIABILITIES AND COMMITMENTS
The District is involved in various claims and litigation arising from its operations. Districtmanagement, after consultation with the District’s general counsel, believes that the resolutionof such matters will not have a material adverse effect on the District’s financial position orresults of operations.
The District receives funding for specific purposes that are subject to review and audit by thegranting agencies or funding source. Such audits could result in a request for reimbursementfor expenditures disallowed under the terms and conditions of the contracts. Management isof the opinion that no material liabilities will result from such potential audits.
The District has construction contracts and property acquisition commitments of approximately$58,131,045 and $85,644,228 at June 30, 2004 and 2003, respectively. Federal, state, andlocal grant funds have been approved for such construction.
STATISTICALSECTION
SACRAMENTO REGIONAL TRANSIT DISTRICT
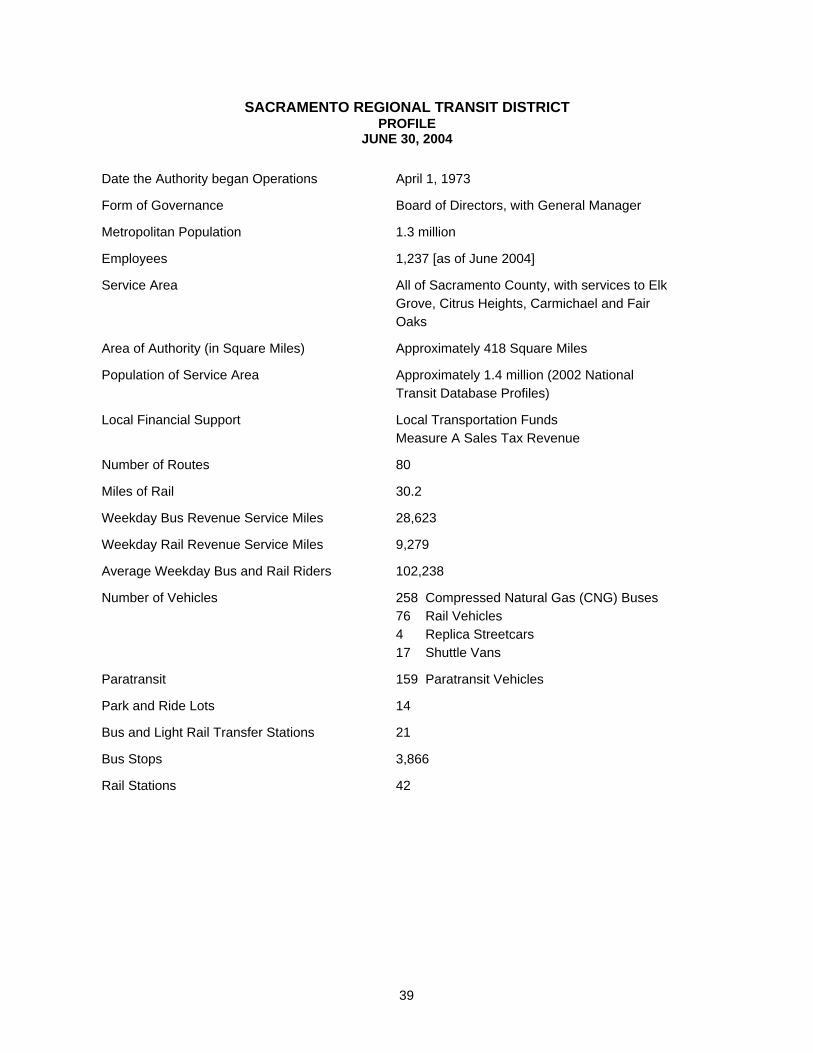
SACRAMENTO REGIONAL TRANSIT DISTRICT PROFILE
JUNE 30, 2004
Date the Authority began Operations April 1, 1973
Form of Governance Board of Directors, with General Manager
Metropolitan Population 1.3 million
Employees 1,237 [as of June 2004]
Service Area All of Sacramento County, with services to ElkGrove, Citrus Heights, Carmichael and FairOaks
Area of Authority (in Square Miles) Approximately 418 Square Miles
Population of Service Area Approximately 1.4 million (2002 NationalTransit Database Profiles)
Local Financial Support Local Transportation Funds Measure A Sales Tax Revenue
Number of Routes 80
Miles of Rail 30.2
Weekday Bus Revenue Service Miles 28,623
Weekday Rail Revenue Service Miles 9,279
Average Weekday Bus and Rail Riders 102,238
Number of Vehicles 258 Compressed Natural Gas (CNG) Buses76 Rail Vehicles4 Replica Streetcars17 Shuttle Vans
Paratransit 159 Paratransit Vehicles
Park and Ride Lots 14
Bus and Light Rail Transfer Stations 21
Bus Stops 3,866
Rail Stations 42
39
SACRAMENTO REGIONAL TRANSIT DISTRICT REVENUE AND EXPENSE HISTORY
1 Other Revenue is presented net of interest expense.
2 Total Revenues for 2001 and beyond include Capital Contributions as required under GASB 33. See Note 1 of the Financial Section, Change in Accounting Policy.
Source: District Annual Reports
40
41
TEN YEAR FUNDING HISTORY
The following table shows available funding that the District has been awarded over the last ten years from ourmajor federal, state, and local funding sources, followed by a brief description of each source.
Federal FundsSection 5307 Funds: Funds distributed by formula to large and small urban areas for a variety of transit planning, capital and preventivemaintenance needs.
Section 5309 Fixed Guideway Funds: Funds distributed by formula to urban rail transit operators for repair and rehabilitation ofcommuter and light rail systems.
Section 5309 Bus Funds: Funds for bus purchases and bus support facility projects. These funds are specifically earmarked byCongress each year.
Section 5309 New Starts Funds: Funds for fixed guideway (i.e. light rail, commuter rail, etc) projects. New Start projects arerecommended by the Federal Transit Administration and based on rigorous criteria and selected for funding by Congress.
Section 3037 Jobs Access & Reverse Commute: Funds for operating new service that provides increased access to job opportunities,either through new service routes or expansions of existing routes into non-traditional service hours.
Federal Highway Discretionary Funds: Funds distributed for a variety of transportation planning, construction, and equipmentacquisition needs. Projects are approved for funding by local agencies and forwarded to appropriate state and federal agencies forfunding authorization.
State FundsState Transportation Improvement Program: Funds distributed by the State for projects that relieve traffic congestion on state and localroads and highways.
Proposition 116 Rail Bond Funds: Funds approved by California voters in 1990 (Clean Air Transportation Improvement Act) forpassenger rail purposes. Regional Transit received a total of $100 million for light rail improvement and expansion projects.
Other: These funds include Transit Capital Improvement funds for projects approved for funding in FY 1997 and earlier (the last yearthat TCI funds were made available by the State), and for Traffic Congestion Relief Program funds approved in the FY 2000 StateBudget for specific Regional Transit capital projects.
Local FundsMeasure A Funds: Funds generated by Sacramento County’s Measure A Sales Tax ordinance, which was approved by SacramentoCounty voters in 1988. Measure A added one-half cent to the County’s sales tax for transportation purposes. Regional Transitreceives approximately one-third of countywide Measure A revenues each year and uses these funds for transit capital and operatingsupport.
Local Transportation Fund: Funds generated by the state sales tax, and used for transit operating support purposes. TheTransportation Development Act (TDA) allocates a portion of the state sales tax for transportation purposes.
State Transit Assistance Funds: Funds generated by the sales tax on gasoline and diesel fuel sales. These funds are dispersed totransit agencies for a variety of transit capital and operating support needs.
SACRAMENTO REGIONAL TRANSIT DISTRICT
LAST TEN FISCAL YEARS
Farebox RevenueIn Thousands
1995
$
$5,000
$10,000
$15,000
$20,000
$25,000
1996 1997 1998 1999 2000 2001 2002 2003 2004
Total Operating ExpenseIn Thousands
1995
$
$20,000
$40,000
$60,000
$80,000
$100,000
1996 1997 1998 1999 2000 2001 2002 2003 2004
$120,000
$140,000
Source: District Annual Reports
Refer to Note 9 in the Financial Section that explaines Local Funds Supplementation
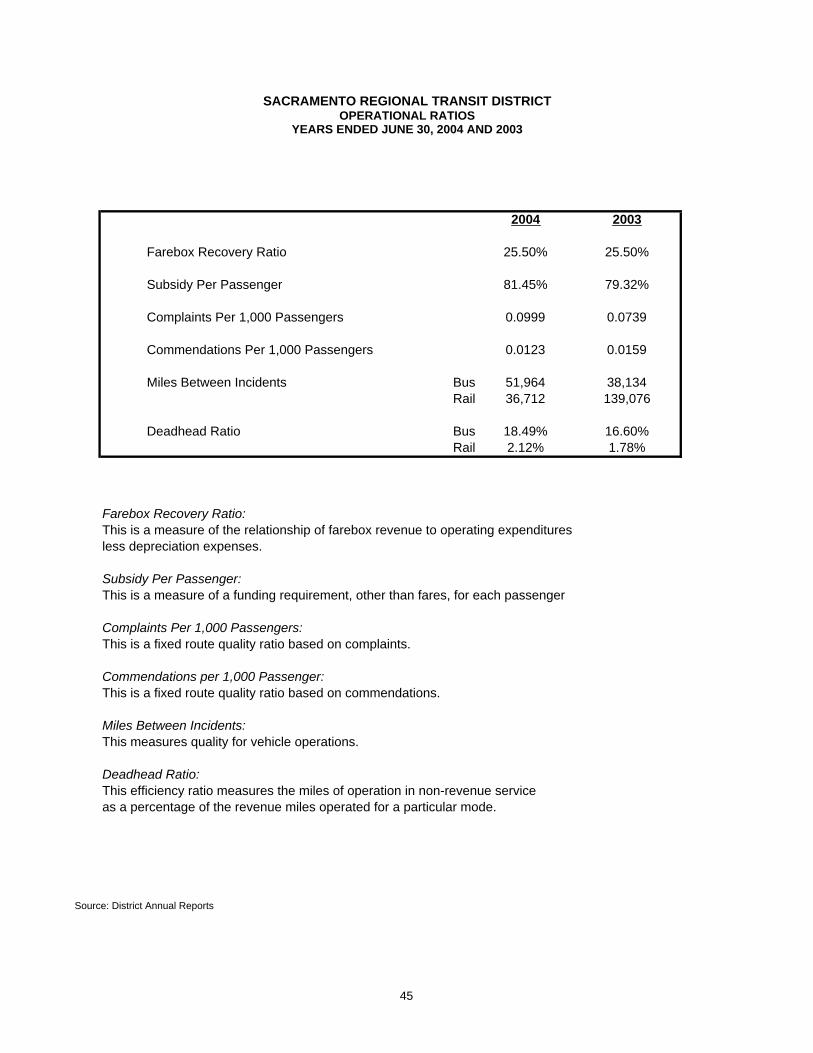
SACRAMENTO REGIONAL TRANSIT DISTRICT OPERATIONAL RATIOS
YEARS ENDED JUNE 30, 2004 AND 2003
2004 2003
Farebox Recovery Ratio 25.50% 25.50%
Subsidy Per Passenger 81.45% 79.32%
Complaints Per 1,000 Passengers 0.0999 0.0739
Commendations Per 1,000 Passengers 0.0123 0.0159
Miles Between Incidents Bus 51,964 38,134Rail 36,712 139,076
Deadhead Ratio Bus 18.49% 16.60%Rail 2.12% 1.78%
Farebox Recovery Ratio: This is a measure of the relationship of farebox revenue to operating expendituresless depreciation expenses.
Subsidy Per Passenger:This is a measure of a funding requirement, other than fares, for each passenger
Complaints Per 1,000 Passengers:This is a fixed route quality ratio based on complaints.
Commendations per 1,000 Passenger:This is a fixed route quality ratio based on commendations.
Miles Between Incidents:This measures quality for vehicle operations.
Deadhead Ratio: This efficiency ratio measures the miles of operation in non-revenue serviceas a percentage of the revenue miles operated for a particular mode.
Source: District Annual Reports
45
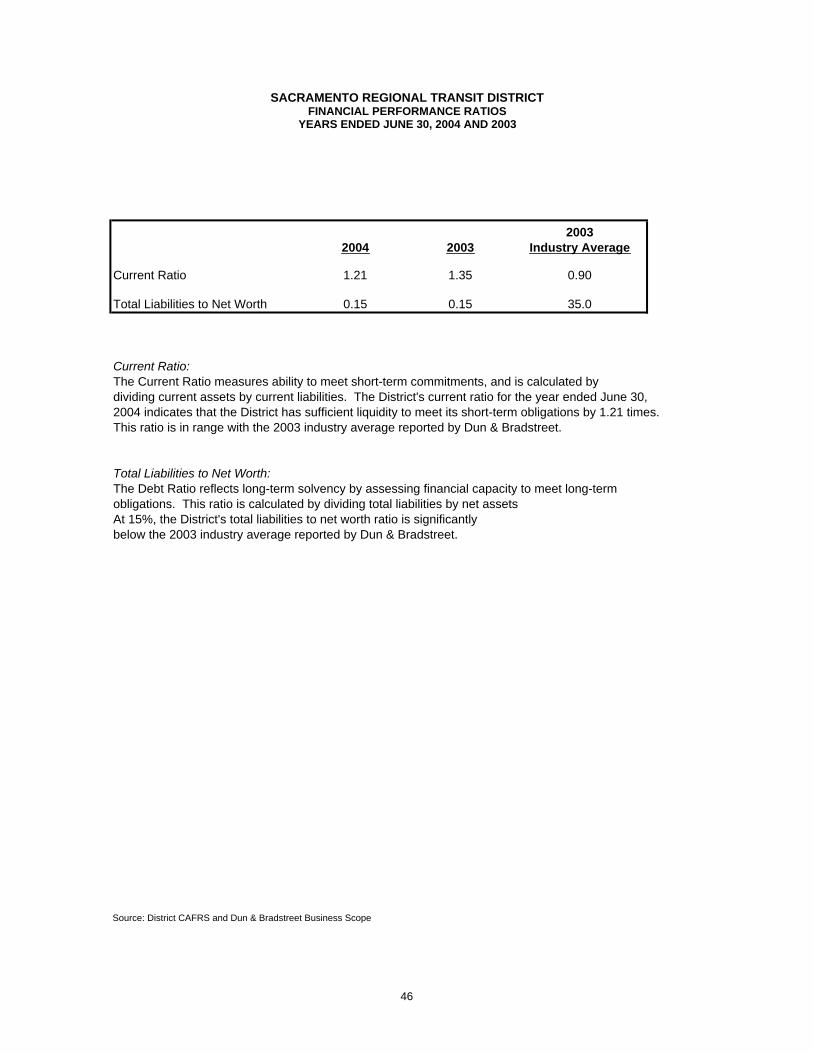
SACRAMENTO REGIONAL TRANSIT DISTRICT FINANCIAL PERFORMANCE RATIOS
YEARS ENDED JUNE 30, 2004 AND 2003
20032004 2003 Industry Average
Current Ratio 1.21 1.35 0.90
Total Liabilities to Net Worth 0.15 0.15 35.0
Current Ratio:The Current Ratio measures ability to meet short-term commitments, and is calculated bydividing current assets by current liabilities. The District's current ratio for the year ended June 30,2004 indicates that the District has sufficient liquidity to meet its short-term obligations by 1.21 times.This ratio is in range with the 2003 industry average reported by Dun & Bradstreet.
Total Liabilities to Net Worth:The Debt Ratio reflects long-term solvency by assessing financial capacity to meet long-termobligations. This ratio is calculated by dividing total liabilities by net assets At 15%, the District's total liabilities to net worth ratio is significantly below the 2003 industry average reported by Dun & Bradstreet.
Source: District CAFRS and Dun & Bradstreet Business Scope
46
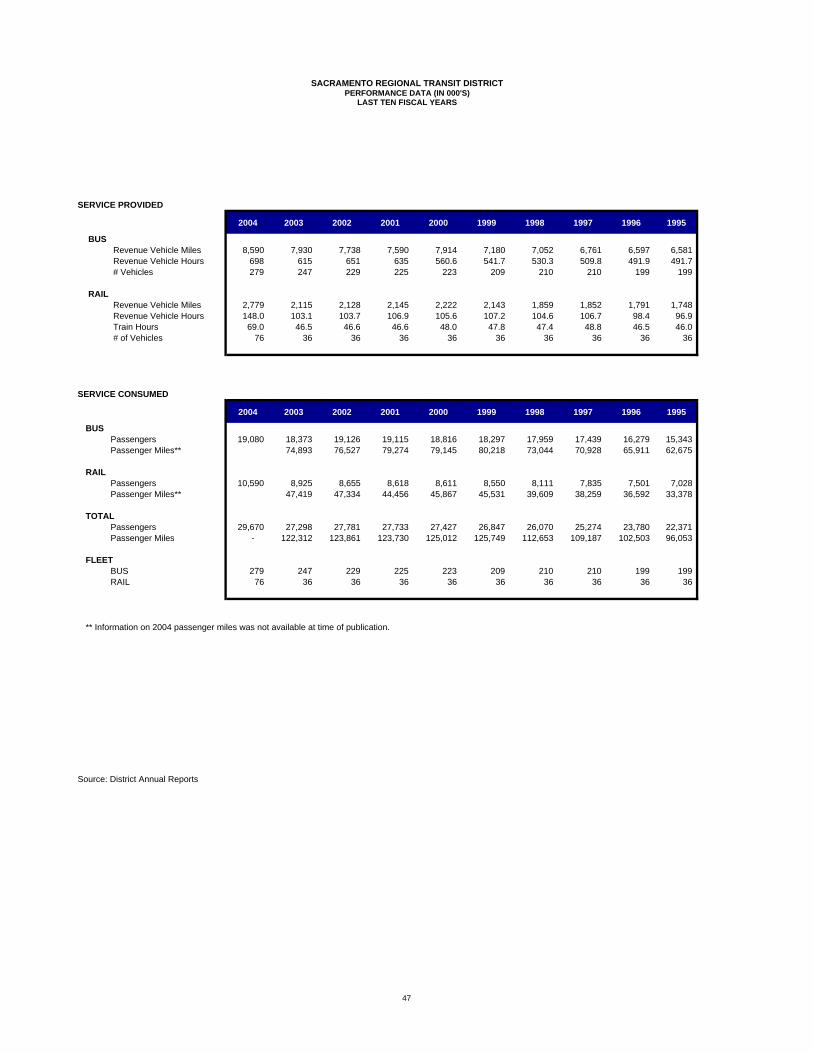
SACRAMENTO REGIONAL TRANSIT DISTRICT PERFORMANCE DATA (IN 000'S)
Source: National Transit Database, 2002 Transit Profiles - Top Fifty Agencies
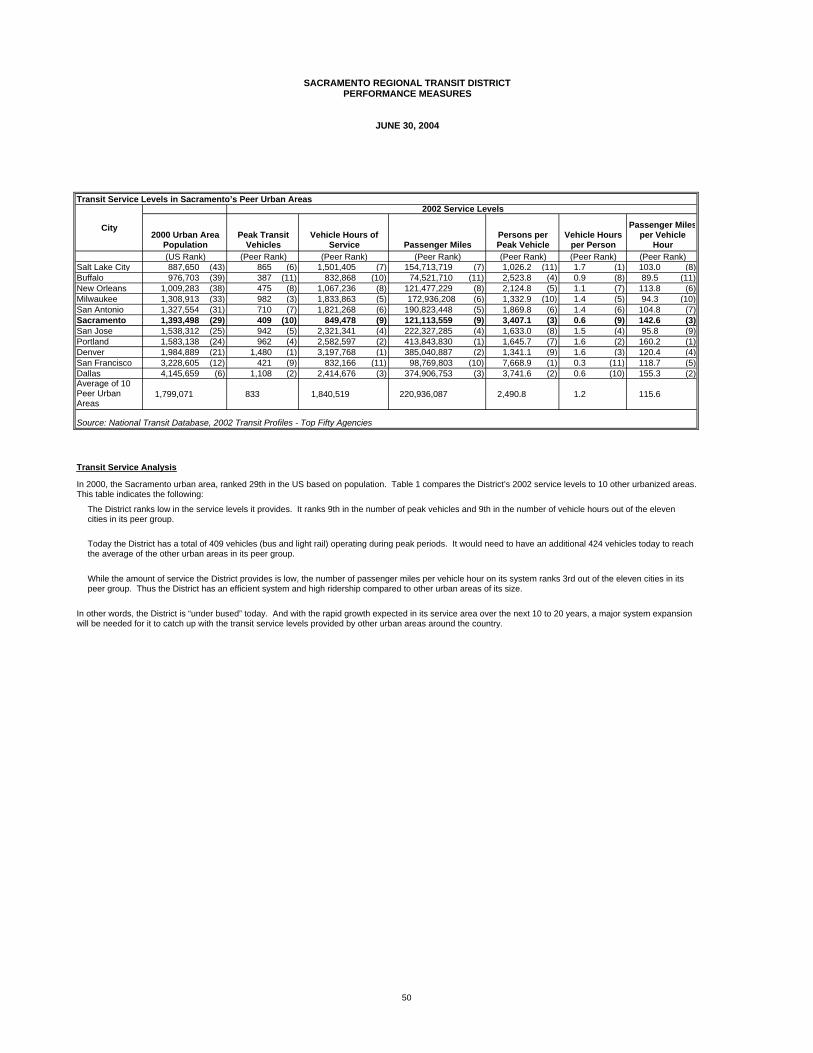
In 2000, the Sacramento urban area, ranked 29th in the US based on population. Table 1 compares the District’s 2002 service levels to 10 other urbanized areas. This table indicates the following:
City2000 Urban Area
PopulationPeak Transit
VehiclesVehicle Hours of
Service Passenger Miles
Passenger Miles per Vehicle
Hour
The District ranks low in the service levels it provides. It ranks 9th in the number of peak vehicles and 9th in the number of vehicle hours out of the eleven cities in its peer group.
Today the District has a total of 409 vehicles (bus and light rail) operating during peak periods. It would need to have an additional 424 vehicles today to reach the average of the other urban areas in its peer group.
While the amount of service the District provides is low, the number of passenger miles per vehicle hour on its system ranks 3rd out of the eleven cities in its peer group. Thus the District has an efficient system and high ridership compared to other urban areas of its size.
In other words, the District is “under bused” today. And with the rapid growth expected in its service area over the next 10 to 20 years, a major system expansion will be needed for it to catch up with the transit service levels provided by other urban areas around the country.
50
SACRAMENTO REGIONAL TRANSIT DISTRICT DEMOGRAPHIC INFORMATION
Growth Percent Growth Percent Growth Percent Growth Percent1999 to 2010 270,888 23% 518,749 28% 152,427 28% 295,905 37%2010 to 2020 186,088 13% 355,901 15% 97,963 14% 199,997 18%2020 to 2025 49,450 3% 118,038 4% 21,726 3% 64,843 5%1 Six-county region includes Sacramento, Placer, Yolo, El Dorado, Yuba and Sutter counties.Source: Sacramento Area Council of Governments, Data for Regional Analysis
EmploymentSacramento County Six-County Region 1
The tables above show the projected growth in population and employment in the District’s service area, Sacramento County, and in the entire six-county metropolitan area. Sacramento County has seen a 23 percent growth in population and a 28 percent increase in employment during 1999 through 2010. Sacramento County’s population is expected to reach about 1.6 million in by 2020 and 1.7 million by 2025.