192
For Fiscal Year Ended June 30, 2016 Santa Clara County, California SANTA CLARA VALLEY TRANSPORTATION AUTHORITY FISCAL YEAR 2016 Comprehensive Annual Financial Report
For Fiscal Year EndedJune 30, 2016
Santa Clara County, California
SANTA CLARA VALLEY TRANSPORTATION AUTHORITY
FISCAL YEAR 2016
ComprehensiveAnnual Financial Report

VTA served 10,000 football fans during Super Bowl 50 at Levi’s Stadium in Santa Clara.
Milpitas BART Station includes pedestrian bridge to light rail and six-story garage.
Berryessa BART Station getting �nal touches of plaza and roadway.
I-280/I-880/Stevens Creek Blvd Improvement Project completed August 2015.
Alum Rock BRT Station inspired by rich agricultural history of San Jose.
Story Road Eastbound BRT Station inspired by lowrider car culture in east San Jose.
Eastridge Transit Center and new 60-foot articulated Rapid Transit Bus (BRT).
One of the many light rail platform passenger information signs installed this year.

SANTA CLARA VALLEY
TRANSPORTATION AUTHORITY
SAN JOSE, CALIFORNIA
Comprehensive Annual Financial Report (CAFR)
For Fiscal Year Ended June 30, 2016
Prepared by:
Finance and Budget Division

THIS PAGE IS INTENTIONALLY LEFT BLANK

i
SANTA CLARA VALLEY TRANSPORTATION AUTHORITY
Comprehensive Annual Financial Report
For the Year Ended June 30, 2016
Table of Contents
Page
INTRODUCTION:
Letter of Transmittal…………………………………………….. .............................................................................1-1
Board of Directors ....................................................................................................................................................1-11
Organizational Chart .................................................................................................................................................1-14
Principal Officials .....................................................................................................................................................1-14
Service Area Map .....................................................................................................................................................1-15
FINANCIAL SECTION:
Independent Auditor’s Report ........................................................................................................................................2-1
Management’s Discussion and Analysis (Required Supplementary Information) .........................................................2-4
Basic Financial Statements:
Government-wide Financial Statements:
Statement of Net Position .................................................................................................................................2-22
Statement of Activities .....................................................................................................................................2-23
Fund Financial Statements:
Proprietary Funds:
Statement of Fund Net Position ....................................................................................................................2-24
Statement of Revenues, Expenses, and Changes in Fund Net Position ........................................................2-26
Statement of Cash Flows ..............................................................................................................................2-27
Governmental Funds:
Balance Sheet ..............................................................................................................................................2-29
Statement of Revenues, Expenditures, and Changes in Fund Balances .......................................................2-30
Fiduciary Funds:
Statement of Fiduciary Net Position ............................................................................................................2-31
Statement of Changes in Fiduciary Net Position ..........................................................................................2-32
Notes to the Basic Financial Statements ...................................................................................................................2-33

ii
SANTA CLARA VALLEY TRANSPORTATION AUTHORITY
Comprehensive Annual Financial Report
For the Year Ended June 30, 2016
Table of Contents (continued)
Page
Required Supplementary Information (other than MD&A):
Schedule of Changes in Net Pension Liability and Related Ratios – ATU Pension Plan ......................................... 2-95
Schedule of Employer Contributions - ATU Pension Plan ....................................................................................... 2-96
Schedule of Changes in Net Pension Liability and Related Ratios – CalPERS Plan ............................................... 2-97
Schedule of Employer Contributions – CalPERS Plan ............................................................................................. 2-98
Schedule of Funding Progress – Retirees’ Other Post Employment Benefits Trust (OPEB Trust) ..........................2-99
Budgetary Comparison Schedule – Congestion Management Program Special Revenue Fund ............................ 2-100
Supplementary Information - Combining and Individual Fund Statements and Schedules:
Enterprise Funds:
Comparative Schedule of Fund Net Position ............... ..................................................................................... 2-102
Comparative Schedule of Revenues, Expenses, and Changes in Fund Net Position ......................................... 2-104
Comparative Schedule of Cash Flows ............................................................................................................... 2-105
Budgetary Comparison Schedule – VTA Transit Fund ..................................................................................... 2-107
Fiduciary Funds:
Combining Statement of Fiduciary Net Position – ATU Pension, OPEB and Medical Funds .......................... 2-109
Combining Statement of Changes in Fiduciary Net Position – ATU Pension, OPEB and Medical Funds ....... 2-110
Combining Statement of Fiduciary Assets and Liabilities – Agency Funds ..................................................... 2-111
Combining Statement of Changes in Fiduciary Assets and Liabilities – Agency Funds ................................... 2-112
STATISTICAL SECTION (Unaudited):
Financial Trends:
Changes in Net Position .....................................................................................................................................3-1
Net Position by Component ...............................................................................................................................3-3
Fund Balances and Changes in Fund Balances, Governmental Funds ...............................................................3-4
Current Ratio ......................................................................................................................................................3-5
Operating Revenues and Operating Expenses....................................................................................................3-6
Non-operating Assistance and Interest Income ..................................................................................................3-7
Targeted Operating Reserves .............................................................................................................................3-8
Revenue Capacity:
Revenue Base and Revenue Rates .....................................................................................................................3-9
Overlapping Revenue……………………………………….. .........................................................................3-10
Principal Sales Tax Payers by Segments…………………… ..........................................................................3-11
iii
SANTA CLARA VALLEY TRANSPORTATION AUTHORITY
Comprehensive Annual Financial Report
For the Year Ended June 30, 2016+
Table of Contents (continued)
Page
Debt Capacity:
Total Outstanding Debt by Type ......................................................................................................................3-12
Ratios of Outstanding Debt ..............................................................................................................................3-13
Direct and Overlapping Debt and Debt Limitation ..........................................................................................3-14
Pledged Revenue Coverage- 1976 Half-Cent Sales Tax Revenue Bonds ........................................................3-15
Pledged Revenue Coverage- 2000 Measure A Half-cent Sales Tax Revenue Bonds ......................................3-16
Projected Pledged Revenue Coverage..............................................................................................................3-17
Demographic and Economic Information:
Population Trends ............................................................................................................................................3-18
Income and Unemployment Rates ...................................................................................................................3-19
Wage and Salary Employment by Industry (Annual Average) ........................................................................3-20
Silicon Valley Major Employers ......................................................................................................................3-21
Operating Information:
Operating Indicators .........................................................................................................................................3-22
Farebox Recovery Ratio ...................................................................................................................................3-23
Revenue Miles .................................................................................................................................................3-24
Passenger Miles ...............................................................................................................................................3-25
Selected Statistical Data ...................................................................................................................................3-26
System Data .....................................................................................................................................................3-27
Full-time Equivalent Employees ......................................................................................................................3-28
Capital Assets ...................................................................................................................................................3-29

THIS PAGE IS INTENTIONALLY LEFT BLANK


THIS PAGE IS INTENTIONALLY LEFT BLANK

SECTION 1 - INTRODUCTION
LETTER OF TRANSMITTAL
BOARD OF DIRECTORS
ORGANIZATIONAL CHART
PRINCIPAL OFFICIALS
SERVICE AREA MAP

THIS PAGE IS INTENTIONALLY LEFT BLANK

LETTER OF TRANSMITTAL

THIS PAGE IS INTENTIONALLY LEFT BLANK

October 28, 2016
Board of Directors
Santa Clara Valley Transportation Authority
Subject: Comprehensive Annual Financial Report
It is a pleasure to submit to you the Comprehensive Annual Financial Report (CAFR) of the
Santa Clara Valley Transportation Authority (VTA) for the year ended June 30, 2016. The
CAFR was prepared in accordance with the guidelines recommended by the Government
Finance Officers Association of the United States and Canada (GFOA). VTA Management
assumes responsibility for the accuracy and completeness of the data and the clarity of the
presentation, including all disclosures. To the best of our knowledge, the enclosed report is
presented in conformity with Generally Accepted Accounting Principles (GAAP), and is
complete and reliable in all material respects.
Vavrinek, Trine, Day & Company LLP, a firm of licensed Certified Public Accountants, has
audited the financial statements. The goal of the audit is to obtain a reasonable assurance that
the financial statements are free of material misstatements. Vavrinek, Trine, Day & Company
LLP concluded, based on the audit, that there was a reasonable basis for rendering an
unmodified opinion on the financial statements for the fiscal year ended June 30, 2016, and
that the financial statements are fairly stated in conformity with GAAP. The independent
auditor’s report is presented as the first component of the financial section of this report.
In addition, Vavrinek, Trine, Day & Company LLP also conducts the federally mandated
“Single Audit” designed to meet requirements of federal grantor agencies. The standards
governing the Single Audit require the independent auditor to report on the fair presentation
of the financial statements, the agency’s internal controls over compliance, and certain
federal compliance requirements.

1-2
Generally Accepted Accounting Principles require that management provide a narrative
introduction, overview, and analysis to accompany the basic financial statements in the form of
Management’s Discussion and Analysis (MD&A). This letter of transmittal is designed to
complement the MD&A and should be read in conjunction with it. The VTA’s MD&A can be
found immediately following the Independent Auditor’s Report.
PROFILE OF THE GOVERNMENT
VTA is an independent special district and political subdivision of the State of California. VTA
was created in 1972 and was known as the Santa Clara County Transit District (District). The
District served Santa Clara County (County) which is situated in the southern portion of the San
Francisco Bay Area and is bordered by the counties of Alameda, San Mateo, Santa Cruz, San
Benito, Merced, and Stanislaus. In 1976, Santa Clara County voters approved a half-cent
Measure A sales tax proposal to fund the District. In 1995, the District merged with the County’s
congestion management agency and operated under the governance of its own Board of
Directors. On January 1, 2000, VTA’s name was officially changed to the Santa Clara Valley
Transportation Authority.
Today, VTA provides bus, light rail, and paratransit services, as well as participates as a funding
partner in regional rail service including Caltrain, Capitol Corridor, and the Altamont Corridor
Express. As the County’s congestion management agency, VTA is responsible for countywide
transportation planning, including congestion management, design and construction of specific
highway, pedestrian, and bicycle improvement projects, as well as promotion of transit oriented
development. VTA continually builds partnerships to deliver transportation solutions that meet
the evolving mobility needs of Santa Clara County.
VTA is governed by a 12 member Board of Directors (the Board or the Board of Directors)
consisting of elected officials appointed by the jurisdictions they represent. Five members of the
Board and one alternate are appointed by the San Jose City Council. One member of the Board
and one alternate are appointed from among the city councils of the cities of Los Altos,
Mountain View, Palo Alto, and the Town of Los Altos Hills. One Board member and one
alternate are appointed from among the city councils of the cities of Campbell, Cupertino, Monte
Sereno, Saratoga, and the Town of Los Gatos. One Board member and one alternate are also
appointed from among the city councils of the cities of Gilroy and Morgan Hill. Two members
of the Board and one alternate are appointed from among the city councils of the cities of
Milpitas, Santa Clara, and Sunnyvale. The final two seats on the Board and one alternate are
appointed by the Santa Clara County Board of Supervisors. The allocation of Board

1-3
representation is generally based on population. A chart depicting the current membership of the
Board and the jurisdictions they represent is located on page 1-11 of this report.
ECONOMIC ENVIRONMENT
The information presented in the financial statements is better understood when considered with
a broader perspective of the specific environment in which the government entity operates. The
County of Santa Clara is located at the southern end of the San Francisco Bay and encompasses
an area of approximately 1,300 square miles. The County’s population of nearly 1.8 million is
one of the largest in the state, and the largest of the nine Bay Area counties.1 The northwest
portion of the County, known as Silicon Valley, is home to many leading computer and
electronic companies such as Google, Cisco, Hewlett-Packard, Yahoo, eBay, Facebook, and
Apple among others. Santa Clara County has enjoyed diverse employment and revenue base.
According to the US Department of Labor report in June 2016, the national unemployment rate
dropped to 4.9% and the number of unemployed persons was 7.8 million, compared to prior
year’s statistics during the same period, when unemployment rate was 5.3% and the number of
unemployed persons was 8.3 million. In June 2016, the state’s unemployment rate dropped to
5.4% from 6.2% the prior year. Although the Santa Clara County’s unemployment rate was
unchanged at 4% from a year ago, it is still the fourth lowest ranking among the counties within
the state.2
Job gains were seen specifically in the areas of Technology, Healthcare and Social Services,
Education, Accommodation and Food Services, and Management Office positions.3 With a
strong labor market and rising real income, consumer spending on goods was high. Job growth
and a surge in wages also fueled the demand for housing causing prices and rents to soar.4 The
County continues to see construction of high-density housing units near transit hubs in
anticipation of long-term challenges affecting housing and transportation.
The letter of the State Governor in January 2016 disclosed that the state budget is in good shape.
Barring any significant changes, the budget over the next two years is in balance. The state is
able to eliminate the budgetary debts and continue to maintain a healthier rainy day fund. The
1 Population Demographics for Santa Clara County in 2015 and 2016.
2 Local Area Unemployment Statistics. June 2016.
3 Silicon Valley Index. 2015.
4 San Jose Mercury News. County’s Median Hits $1 million for First Time. May 18, 2016.
1-4
fiscal stability from a balanced budget and a recovering state economy have been a reprieve from
the prior decade’s budget deficits.
Consistent with the state’s improved financial condition, the Transportation Development Act
(TDA) revenue increased by $3.9 million in FY 2016. The State Transportation Assistance
(STA) revenue, however, declined by $318 thousand as prices for diesel, along with gasoline and
crude oil, remain at a historical low. Both revenues are state programs that provide funds to
operate bus and rail systems in California.
FY 2016 witnessed positive economic conditions leading to higher consumer and business
spending. This contributed to the growth in VTA’s major revenue sources for operations and
capital activity, i.e. 1976 Half-Cent, 2000 Measure A, and BART Operating sales taxes. These
sales tax revenues are dependent upon taxable sales activity in the county. For FY 2016, the 1976
Half-Cent, 2000 Measure A, and BART Operating sales tax revenues grew 3.1%, 3% and 3.7%,
respectively.
ENTERPRISE NET POSITION OVERVIEW
GASB Statement 34 requires that management provide a narrative introduction, overview, and
analysis to accompany the basic financial statements in the form of Management’s Discussion
and Analysis (MD&A). This letter of transmittal is designed to complement the MD&A
beginning on page 2-4 and should be read in conjunction with it.
VTA’s enterprise funds report the activities of its transit operations, 1996 Measure B
Transportation Improvement Program, 2000 Measure A Transit Improvement Program, BART
Operating, Express Lanes, and Joint Development Program.
The Enterprise Funds net position increased by $398.2 million to $4.4 billion. This consists of
VTA Transit Fund of $2.0 billion, Measure B Transit Fund of $976 thousand, Express Lanes
Fund of $2.4 million, Measure A Fund of $2.2 billion, BART Operating Fund of $187.5 million,
and Joint Development of $29.2 million. Total FY 2016 Net Position is provided below (in
thousands):

1-5
Net Investment in Capital Assets 3,394,540$
Restricted:
2000 Measure A projects 429,907$
SWAP/lease collateral 120,764
BART Operating 187,515
Debt service 49,840
1996 Measure B Projects 974 789,000
Unrestricted:
Debt reduction 76,378$
Operating reserve 64,147
Sales tax stabilization 35,000
Local share of capital projects 134,029
Inventory and prepaid expenses 33,615
Irrevocable transfer made to OPEB trust fund 15,865
Joint Development 26,909
Express Lanes 2,364
Unrestricted before GASB 68 adjustment 388,307
Net Position Liability (GASB 68)* (195,565) 192,742
Total Net Position 4,376,282$
*This is a decrease of the Unrestricted Net Position to set aside amount for Net Pension Liability to comply with GASB 68 requirements. The breakdown consists of $80.6 million and $115 million for CALPERS and ATU, respectively.
SIGNIFICANT FINANCIAL POLICIES
Long-Range Planning
VTA, in its role as the Congestion Management Agency (CMA) for Santa Clara County, is
responsible for preparing and updating the Valley Transportation Plan (VTP). This document
identifies long-term programs, projects, and policies that VTA plans to pursue over the next 25
years. It considers all travel modes and addresses the links between transportation and land use
planning, air quality, energy use, and community livability. VTA annually updates and
incorporates the VTA Financial Forecasting Model as part of its long-range planning process. As
a transit operator, VTA prepares the Short Range Transit Plan (SRTP) every two years. The
SRTP is used as documentation to support projects included in the Regional Transportation Plan
prepared by Metropolitan Transportation Commission (MTC) and activities contained in the
county’s long-range transportation plan.
Biennial Budget and Budgetary Controls
The State of California and the VTA Administrative Code require that VTA management
recommend and Board of Directors adopt an operating budget at the fund level and a capital
budget on a project basis. The General Manager may reallocate appropriations between budget
types and budget units within each fund up to the limits of each fund’s annual appropriation. Any
1-6
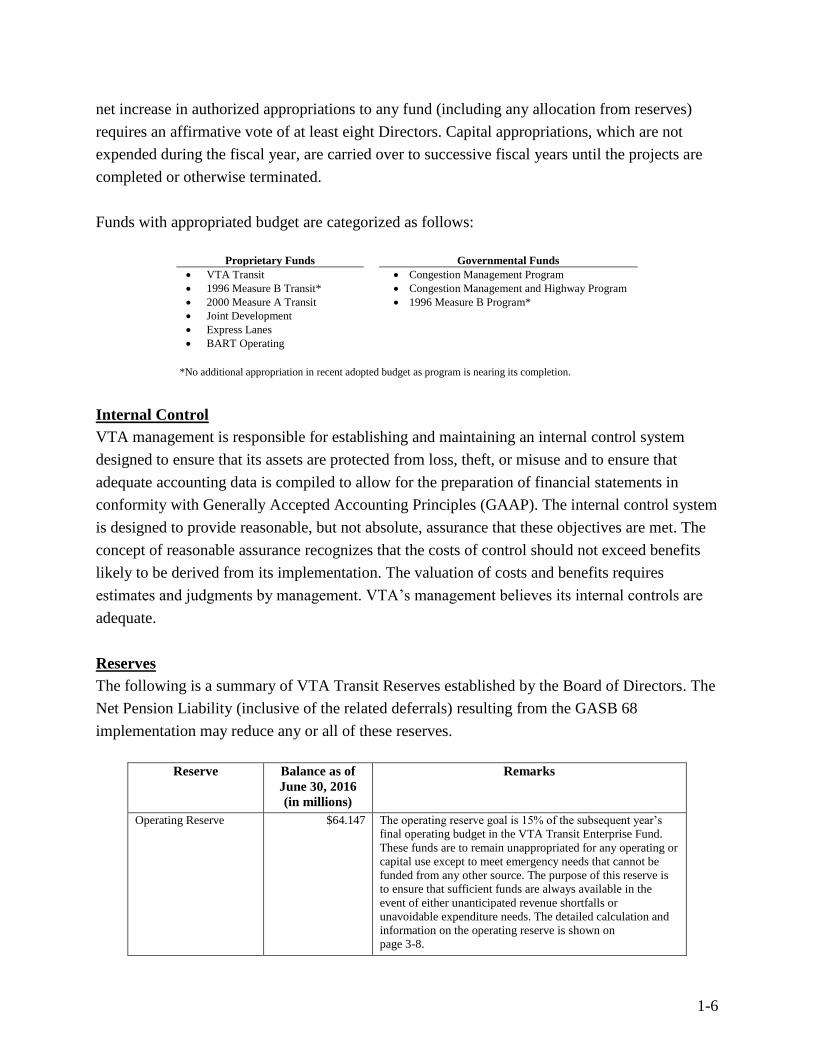
net increase in authorized appropriations to any fund (including any allocation from reserves)
requires an affirmative vote of at least eight Directors. Capital appropriations, which are not
expended during the fiscal year, are carried over to successive fiscal years until the projects are
completed or otherwise terminated.
Funds with appropriated budget are categorized as follows:
*No additional appropriation in recent adopted budget as program is nearing its completion.
Internal Control
VTA management is responsible for establishing and maintaining an internal control system
designed to ensure that its assets are protected from loss, theft, or misuse and to ensure that
adequate accounting data is compiled to allow for the preparation of financial statements in
conformity with Generally Accepted Accounting Principles (GAAP). The internal control system
is designed to provide reasonable, but not absolute, assurance that these objectives are met. The
concept of reasonable assurance recognizes that the costs of control should not exceed benefits
likely to be derived from its implementation. The valuation of costs and benefits requires
estimates and judgments by management. VTA’s management believes its internal controls are
adequate.
Reserves
The following is a summary of VTA Transit Reserves established by the Board of Directors. The
Net Pension Liability (inclusive of the related deferrals) resulting from the GASB 68
implementation may reduce any or all of these reserves.
Reserve Balance as of
June 30, 2016
(in millions)
Remarks
Operating Reserve $64.147 The operating reserve goal is 15% of the subsequent year’s
final operating budget in the VTA Transit Enterprise Fund.
These funds are to remain unappropriated for any operating or
capital use except to meet emergency needs that cannot be
funded from any other source. The purpose of this reserve is
to ensure that sufficient funds are always available in the
event of either unanticipated revenue shortfalls or
unavoidable expenditure needs. The detailed calculation and
information on the operating reserve is shown on
page 3-8.
Proprietary Funds Governmental Funds
VTA Transit
1996 Measure B Transit*
2000 Measure A Transit
Joint Development
Express Lanes
BART Operating
Congestion Management Program
Congestion Management and Highway Program
1996 Measure B Program*

1-7
Reserve Balance as of
June 30, 2016
(in millions)
Remarks
Sales Tax Stabilization $35 This reserve serves to mitigate the impact of sales tax receipt
volatility on service levels and the operating budget. VTA
Transit Sales Tax Stabilization reserve is at its current ceiling.
Debt Reduction $76.378 This reserve may be used to reduce long-term liabilities or
provide funding for approved transit-related capital
improvements and replacement of capital assets. This reserve
is used to fund local portion of the VTA Transit capital
program in order to keep assets in a state of good repair.
Financial Stability Policy
The following activities serve as guidance in the prioritization of VTA operating expenses. This
is necessary when there are budget reductions to keep spending consistent with available
revenues, and when increases in operating revenues permit VTA to add resources to its transit-
related activities.
1. Preservation of the level of fixed route transit service and paratransit service provided to
VTA riders to the extent possible. This includes developing a service plan that is in
accordance with VTA’s Transit Sustainability Policy and service design guidelines and in
the best interest of the public.
2. Direct support for the provision of transit service, i.e., only those core operating,
management and administrative functions that are necessary and essential to providing
the existing level of transit service, both in terms of the types of functions required and
level of resources needed to support service. This is measured against industry standards
and best practices with consideration of efficiencies achieved by reducing layers of
management.
3. Support for Regional Partnerships (e.g., Caltrain, ACE, Dumbarton Express, etc.)
provided by VTA in consideration of other partners’ contributions.
4. Activities that clearly contribute to increasing and diversifying VTA’s operating funding
(e.g., fare programs, joint development, advertising, and other opportunities for earned
income).
5. Activities that provide information to riders, employees, stakeholders and the public (e.g.,
VTA Ambassador Program).
6. Activities that would prudently and strategically expand VTA transit service, when
sustainable revenues are available to support the service growth (e.g., VTA’s recent
expansion of bus and light rail service to Levi’s Stadium).

1-8
MAJOR INITIATIVE
VTA’s BART Silicon Valley Project
The VTA’s BART Silicon Valley Project is a 16-mile extension of the existing BART system to
San Jose, Milpitas, and Santa Clara, which will be delivered through a phased approach. The first
phase, the Silicon Valley Berryessa Extension (SVBX), is a 10-mile, two-station extension,
beginning in Fremont south of the future BART Warm Springs Station and proceeding on the
former Union Pacific Railroad right-of-way through Milpitas, the location of the first station, and
then to the Berryessa area of north San Jose, at the second station.
The cost of the SVBX Project is approximately $2.4 billion, which includes $900 million in
federal assistance, $387.6 million in state and other local funding, and $1.134 billion from
Measure A sales tax. In March 2012, VTA received a $900 million grant commitment from the
FTA for the project, along with the first $100 million allocation, as provided for in the Full
Funding Grant Agreement (FFGA). The FFGA is a multi-year contractual agreement that
formally defines the project scope, cost, and schedule, and establishes the terms of the federal
financial assistance. Execution of the FFGA allowed the commencement of construction of the
10-mile, two-station BART extension. As of June 2016, $531 million of the total $552.6 million
grant award, has been expended and received.
In August 2014, VTA received the Traffic Congestion Relief Program (TCRP) funds in the
amount of $39 million which constitutes the final installment of the State of California’s $649
million TCRP allocation plan adopted by the California Transportation Commission (CTC) in
2008. As of June 2016, remaining unexpended amount from this allocation is $8.7 million.
The project scope includes BART vehicles, VTA feeder buses, double-track grade-separated
guideway, traction power substations, high voltage substations, a communication system,
passenger drop-off facilities, surface and structured parking facilities, bus transit centers, a
pedestrian bridge, real estate acquisition, drainage improvements, environmental mitigation,
financing, startup and revenue testing, and other elements necessary for project delivery. The
project also includes facility additions to the existing BART Hayward Yard for maintenance of
BART vehicles.
The first major design and construction contract, valued at $772 million for the line, track,
systems, and stations, was awarded in December 2011 to Design Builder Skanska-Shimmick-
Herzog, a Joint Venture. Construction of the 10-mile, two-station project is planned for 2012 to
late 2017. Construction continues at future station areas and major intersections that the BART
system will cross. At the future Milpitas Station and Berryessa Station systems, civil and

1-9
building work is underway. The parking garage at both stations has been topped out. Elevator
and parking technology installations and site work are underway. At the Berryessa Station
Campus, work is underway on the Police Zone Facility and Ancillary Building. The first pilot
BART vehicle was received in March 2016. Qualification and train operator training has been
started. VTA and BART have finalized an agreement for a new BART Operation Control Center
(OCC). VTA and BART will execute the agreement after BART completes the environmental
review for OCC project.
VTA continues project development activities for the second 6-mile phase of the project. This
includes four stations, with a five-mile-long subway tunnel through downtown San Jose, and
ends at grade in Santa Clara near the Caltrain Station. The project also includes the construction
of a maintenance facility at the current Newhall Yard, the Newhall Maintenance Facility, as well
as the purchase of 48 BART vehicles. A Request for Proposal was issued for a single-bore tunnel
technical study focusing on areas such as station configurations, ventilation, and emergency
egress. Proposals have been received and contract award is anticipated in Fall 2016. A second
administrative draft Supplemental Environmental Impact Statement/Subsequent Environmental
Impact Report (SEIS/SEIR) was submitted to Federal Transit Administration (FTA) in June
2016. This document reflects revisions based on FTA and BART comments, as well as new
options for the station location at Diridon and a single-bore tunnel. Phase II Working Group
meetings continue to be held.
AWARDS AND ACKNOWLEDGEMENTS
The Government Finance Officers Association of the United States and Canada (GFOA)
awarded a Certificate of Achievement for Excellence in Financial Reporting to VTA for its FY
2015 Comprehensive Annual Financial Report. This is the 20th consecutive year that VTA
achieved this prestigious award.
In order to receive the award, a government agency must publish an easily readable and
efficiently organized Comprehensive Annual Financial Report. This report must satisfy both
accounting principles generally accepted in the United States of America and applicable legal
requirements.
A Certificate of Achievement is valid for a period of one year only. We believe that our current
comprehensive annual financial report continues to meet the Certificate of Achievement
Program’s requirements, and we are submitting it to the GFOA to determine its eligibility for
another certificate.


2016 V T A B O A R D O F D I R E C T O R S
GROUP 1City of San Jose Magdalena Carrasco
Rose HerreraJohnny KhamisSam Liccardo*Manh NguyenRaul Peralez, Alternate
GROUP 3 City of Campbell City of Cupertino Town of Los Gatos City of Monte Sereno City of Saratoga Howard Miller, Alternate
Jason Baker*
GROUP 5 City of Milpitas City of Santa Clara Citty of Sunnyvale
Teresa O’Neill Jose Esteves, Alternate
Glenn Hendricks
GROUP 2City of Los AltosTown of Los Altos Hills City of Mountain View John McAlister, Alternate
Jeannie Bruins
City of Palo Alto
GROUP 4 City of Gilroy Perry Woodward
Larry Carr, AlternateCity of Morgan Hill
GROUP 6 County ofSanta Clara
Cindy ChavezKen YeagerDavid Cortese,* Alternate
Ex-Of�cio** Metropolitan TransportationCommission (MTC) CommissionersRepresenting Santa Clara County,Cities of Santa Clara County, andCity of San Jose
None
Jeannie Bruins, Vice ChairpersonCindy Chavez, Chairperson
As of June 30, 2016
* These individuals serve on the MTC. ** There are no Ex-Of�cio Board Members for 2016 as the MTC representatives from Santa Clara County, Cities of Santa Clara County and City of San Jose are also VTA Board Members or Alternate VTA Board Members.
1-11
VTA is an independent special district governed by its own Board of Directors. The VTA Board of Directors consists of elected governing board of�cials from the cities within Santa Clara County as well as the County of Santa Clara. Board members are appointed by the jurisdictions they represent, and all jurisdictions within the county have representation on the Board. The Board consists of 12 voting members, 6 alternates, and 3 ex-of�cio members, and membership attempts to balance regional representation and population as follows:
Group 1 (San Jose) 5 Members, 1 Alternate
Group 2 (Northwest) 1 Member, 1 Alternate from the Cities of Los Altos, Mountain View, Palo Alto, and the Town of Los Altos Hills
Group 3 (West Valley) 1 Member, 1 Alternate from the Cities of Campbell, Cupertino, Monte Sereno, Saratoga, and the Town of Los Gatos
Group 4 (South County) 1 Member, 1 Alternate from the Cities of Gilroy and Morgan Hill
Group 5 (Northeast) 2 Members, 1 Alternate from the Cities of Milpitas, Santa Clara, and Sunnyvale
Group 6 2 Members, 1 Alternate from the Santa Clara County Board of Supervisors (County of Santa Clara)
Ex-Of�cio Santa Clara County's 3 representatives to the Metropolitan Transportation Commission (MTC): 1 Member representing the County of Santa Clara, 1 Member representing the Cities of Santa Clara County, and 1 Member representing the City of San Jose. (Note: MTC commissioners serve as an Ex-Of�cio Member only when not serving as a regular or alternate member of the VTA Board of Directors.)
The Board of Directors generally meets on the �rst Thursday of each month.
V T A B O A R D O F D I R E C T O R S ’S T A N D I N G C O M M I T T E E S
V T A B O A R D O F D I R E C T O R S ’A D V I S O R Y C O M M I T T E E S
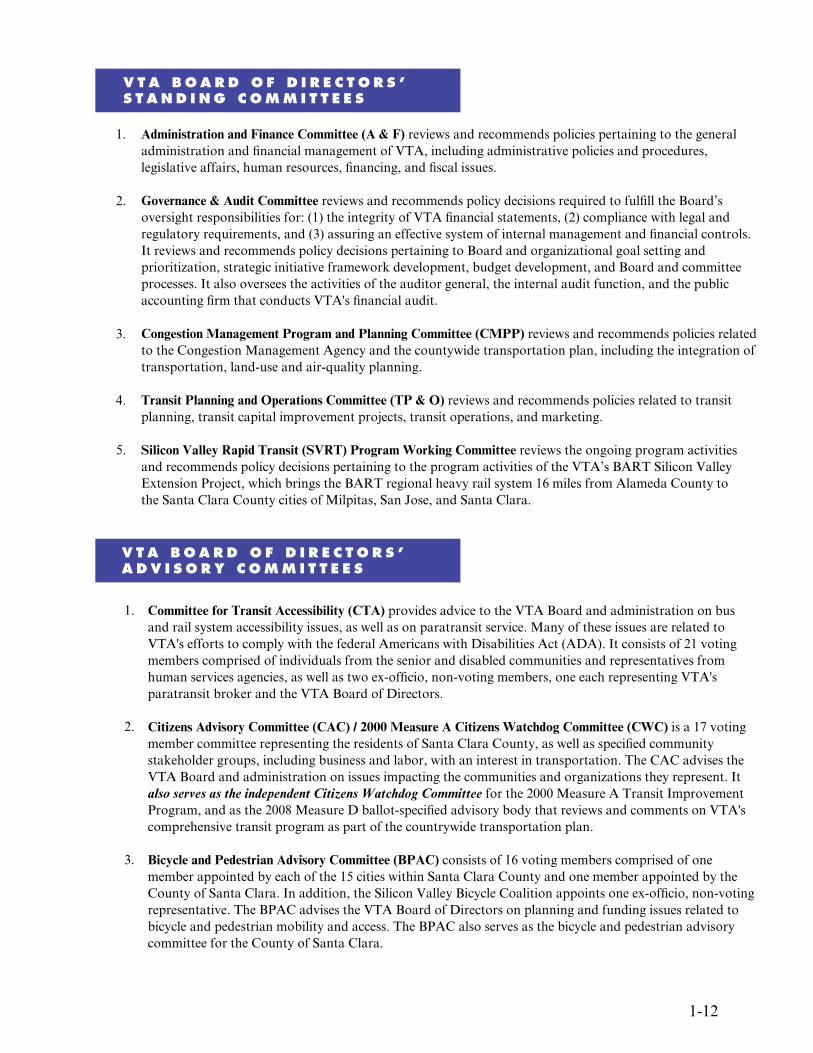
1. Administration and Finance Committee (A & F) reviews and recommends policies pertaining to the general administration and �nancial management of VTA, including administrative policies and procedures, legislative affairs, human resources, �nancing, and �scal issues.
Governance & Audit Committee reviews and recommends policy decisions required to ful�ll the Board’s oversight responsibilities for: (1) the integrity of VTA �nancial statements, (2) compliance with legal and regulatory requirements, and (3) assuring an effective system of internal management and �nancial controls. It reviews and recommends policy decisions pertaining to Board and organizational goal setting and prioritization, strategic initiative framework development, budget development, and Board and committee processes. It also oversees the activities of the auditor general, the internal audit function, and the public accounting �rm that conducts VTA's �nancial audit.
Congestion Management Program and Planning Committee (CMPP) reviews and recommends policies related to the Congestion Management Agency and the countywide transportation plan, including the integration of transportation, land-use and air-quality planning.
Transit Planning and Operations Committee (TP & O) reviews and recommends policies related to transit planning, transit capital improvement projects, transit operations, and marketing.
Silicon Valley Rapid Transit (SVRT) Program Working Committee reviews the ongoing program activities and recommends policy decisions pertaining to the program activities of the VTA’s BART Silicon Valley Extension Project, which brings the BART regional heavy rail system 16 miles from Alameda County to the Santa Clara County cities of Milpitas, San Jose, and Santa Clara.
2.
3.
4.
5.
1.
2.
3.
1-12
Committee for Transit Accessibility (CTA) provides advice to the VTA Board and administration on bus and rail system accessibility issues, as well as on paratransit service. Many of these issues are related to VTA's efforts to comply with the federal Americans with Disabilities Act (ADA). It consists of 21 voting members comprised of individuals from the senior and disabled communities and representatives from human services agencies, as well as two ex-of�cio, non-voting members, one each representing VTA's paratransit broker and the VTA Board of Directors.
Citizens Advisory Committee (CAC) / 2000 Measure A Citizens Watchdog Committee (CWC) is a 17 voting member committee representing the residents of Santa Clara County, as well as speci�ed community stakeholder groups, including business and labor, with an interest in transportation. The CAC advises the VTA Board and administration on issues impacting the communities and organizations they represent. It also serves as the independent Citizens Watchdog Committee for the 2000 Measure A Transit Improvement Program, and as the 2008 Measure D ballot-speci�ed advisory body that reviews and comments on VTA's comprehensive transit program as part of the countrywide transportation plan.
Bicycle and Pedestrian Advisory Committee (BPAC) consists of 16 voting members comprised of one member appointed by each of the 15 cities within Santa Clara County and one member appointed by the County of Santa Clara. In addition, the Silicon Valley Bicycle Coalition appoints one ex-of�cio, non-voting representative. The BPAC advises the VTA Board of Directors on planning and funding issues related to bicycle and pedestrian mobility and access. The BPAC also serves as the bicycle and pedestrian advisory committee for the County of Santa Clara.

1-13
V T A B O A R D O F D I R E C T O R S ’ P O L I C Y A D V I S O R Y B O A R D S
4.
5.
Technical Advisory Committee (TAC) is a 16 voting member committee comprised of one staff member (usually a public works, planning, transportation, or community development director) from each of the 15 cities within the county and the County of Santa Clara. In addition, the California Department of Transportation (Caltrans), Metropolitan Transportation Commission (MTC), and Santa Clara Valley Water District appoint one non-voting representative each to the TAC. The TAC provides in-depth analysis, technical expertise, and timely recommendations regarding transportation projects, programs, funding, and other policy matters, while giving voice to and reconciling local and regional perspectives.
Policy Advisory Committee (PAC) is a 16 voting member committee comprised of one city council member from each of the 15 cities within Santa Clara County and one member from the County of Santa Clara Board of Supervisors. The PAC ensures that all local jurisdictions have an opportunity to participate in the development of VTA's policies.
These Policy Advisory Boards (PAB) ensure the local jurisdictions affected by major transportation improvement projects are involved in the planning, design, and construction. Membership for each PAB varies. There are currently six active PABs:
• Diridon Station Joint Powers Policy Advisory Board
• Downtown East Valley Policy Advisory Board
• El Camino Real Rapid Transit Policy Advisory Board
• Silicon Valley Rapid Transit Corridor and BART Warm Springs Extension Policy Advisory Board
• Vasona Light Rail Project Policy Advisory Board
• State Route (SR) 85 Corridor Policy Advisory Board
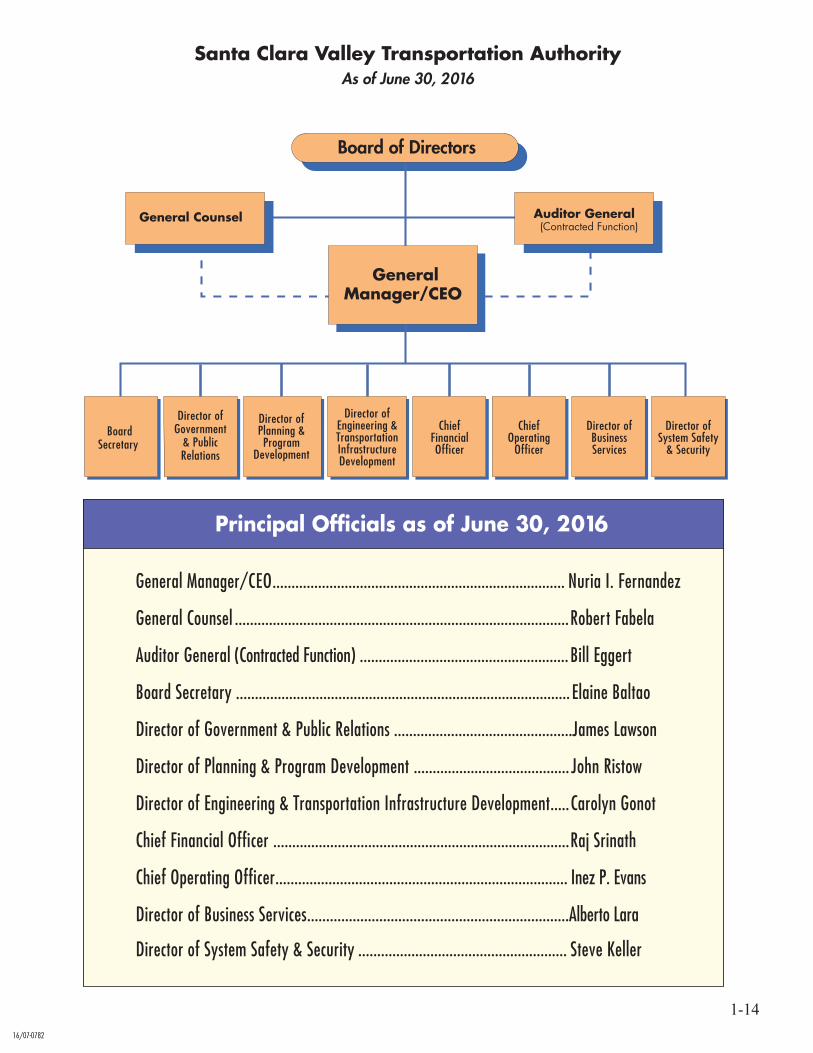
Santa Clara Valley Transportation AuthorityAs of June 30, 2016
Board of Directors
Principal Of�cials as of June 30, 2016
General Manager/CEO............................................................................. Nuria I. Fernandez
General Counsel ........................................................................................Robert Fabela
Auditor General (Contracted Function) ....................................................... Bill Eggert
Board Secretary ........................................................................................ Elaine Baltao
Director of Government & Public Relations ...............................................James Lawson
Director of Planning & Program Development ......................................... John Ristow
Director of Engineering & Transportation Infrastructure Development.....Carolyn Gonot
Chief Financial Of�cer ..............................................................................Raj Srinath
Chief Operating Of�cer............................................................................. Inez P. Evans
Director of Business Services.....................................................................Alberto Lara
Director of System Safety & Security ....................................................... Steve Keller
Director ofGovernment
& PublicRelations
Director ofPlanning &Program
Development
BoardSecretary
1-14
Auditor GeneralGeneral Counsel
Auditor GeneralGeneral Counsel
GeneralManager/CEO
(Contracted Function)
Director ofEngineering &TransportationInfrastructureDevelopment
ChiefFinancialOf�cer
ChiefOperating
Of�cer
Director ofBusinessServices
Director ofSystem Safety
& Security
16/07-0782

1-15

THIS PAGE IS INTENTIONALLY LEFT BLANK

SECTION 2 – FINANCIAL SECTION
INDEPENDENT AUDITOR’S REPORT
MANAGEMENT’S DISCUSSION AND ANALYSIS (Required Supplementary Information)
BASIC FINANCIAL STATEMENTS:
Government-wide Financial StatementsStatement of Net Statement of
Fund Financial Statements:
Proprietary Funds::Statement of Fund Net
• Statement of Revenues, Expenses and Changes in Fund Net Statement of Cash Flows
Governmental Funds:Balance SheetStatement of Revenues, Expenses and Changes in Fund Balances
Fiduciary Funds:Statement of Fiduciary NetStatement of Changes in Fiduciary Net
NOTES TO THE BASIC FINANCIAL STATEMENTS
Required Supplementary Information (other than MD&A):
Supplementary Information – Combining and Individual Fund Statements and Schedules:
Enterprise Funds:Comparative Schedule of Fund Net Comparative Schedule of Revenues, Expenses and Changes in Fund Comparative Schedule of Cash FlowsBudgetary Comparison Schedule
Fiduciary Funds:Combining Statement of Fiduciary Net – ATU Pension, OPEB, and Medical FundsCombining Statement of Changes in Fiduciary Net – ATU Pension, OPEB,
and Medical Funds
Position
Position
Activities
Position
PositionPosition
Net PositionPosition
PositionPosition
Combining Statement of Fiduciary Assets and Liabilities – Agency FundsCombining Statement of Changes in Fiduciary and Liabilities – Agency Funds Assets
• Schedule of Changes in Net Pension Liability and Related Ratios – ATU Pension Plan• Schedule of Employer Contributions – ATU Pension Plan• Schedule of Changes in Net Pension Liability and Related Ratios – CalPERS Plan• Schedule of Employer Contributions – CalPERS Plan• Schedule of Funding Progress – Retirees’ Other Post Employment Bene�ts Trust• Budgetary Comparison Schedule – Congestion Management Program Special Revenue Fund• Note to Required Supplementary Information – Budgetary Basis of Accounting

THIS PAGE IS INTENTIONALLY LEFT BLANK

INDEPENDENT AUDITOR’S REPORT
THIS PAGE IS INTENTIONALLY LEFT BLANK

260 Sheridan Avenue, Suite 440, Palo Alto, CA 94306 Tel: 650.462.0400 Fax: 650.462.0500 www.vtdcpa.com
F R E S N O L A G U N A P A L O A L T O P L E A S A N T O N R A N C H O C U C A M O N G A R I V E R S I D E S A C R A M E N T O
2-1
INDEPENDENT AUDITOR’S REPORT
The Board of DirectorsSanta Clara Valley Transportation AuthoritySan Jose, California
Report on the Financial Statements
We have audited the accompanying financial statements of the business-type activities, governmental activities,each major fund, and the aggregate remaining fund information of the Santa Clara Valley TransportationAuthority (VTA), as of and for the year ended June 30, 2016, and the related notes to the financial statements,which collectively comprise the VTA's basic financial statements as listed in the table of contents.
Management's Responsibility for the Financial Statements
Management is responsible for the preparation and fair presentation of these financial statements in accordancewith accounting principles generally accepted in the United States of America; this includes the design,implementation, and maintenance of internal control relevant to the preparation and fair presentation of financialstatements that are free from material misstatement, whether due to fraud or error.
Auditor's Responsibility
Our responsibility is to express opinions on these financial statements based on our audit. We conducted ouraudit in accordance with auditing standards generally accepted in the United States of America and the standardsapplicable to financial audits contained in Government Auditing Standards, issued by the Comptroller General ofthe United States. Those standards require that we plan and perform the audit to obtain reasonable assuranceabout whether the financial statements are free from material misstatement.
An audit involves performing procedures to obtain audit evidence about the amounts and disclosures in thefinancial statements. The procedures selected depend on the auditor's judgment, including the assessment of therisks of material misstatement of the financial statements, whether due to fraud or error. In making those riskassessments, the auditor considers internal control relevant to the entity's preparation and fair presentation of thefinancial statements in order to design audit procedures that are appropriate in the circumstances, but not for thepurpose of expressing an opinion on the effectiveness of the entity's internal control. Accordingly, we express nosuch opinion. An audit also includes evaluating the appropriateness of accounting policies used and thereasonableness of significant accounting estimates made by management, as well as evaluating the overallpresentation of the financial statements.
We believe that the audit evidence we have obtained is sufficient and appropriate to provide a basis for our auditopinions.

2-2
Opinions
In our opinion, the financial statements referred to above present fairly, in all material respects, the respectivefinancial position of the business-type activities, governmental activities, each major fund, and the aggregateremaining fund information of the VTA, as of June 30, 2016, and the respective changes in financial positionand, where applicable, cash flows thereof for the year then ended in accordance with accounting principlesgenerally accepted in the United States of America.
Emphasis of Matter - Change in Accounting Principles
As discussed in Note 2-q to the financial statements, in 2016, VTA adopted new accounting guidance, GASBStatement No. 72, Fair Value Measurement and Application. Our opinion is not modified with respect to thismatter.
Other Matters
Required Supplementary Information
Accounting principles generally accepted in the United States of America require that the management'sdiscussion and analysis, pension plans schedules of changes in net pension liability, pension plans schedules ofemployer contributions, budgetary comparison information, and schedule of funding progress for otherpostemployment benefits, as listed in the table of contents, be presented to supplement the basic financialstatements. Such information, although not a part of the basic financial statements, is required by theGovernmental Accounting Standards Board who considers it to be an essential part of financial reporting forplacing the basic financial statements in an appropriate operational, economic, or historical context. We haveapplied certain limited procedures to the required supplementary information in accordance with auditingstandards generally accepted in the United States of America, which consisted of inquiries of management aboutthe methods of preparing the information and comparing the information for consistency with management'sresponses to our inquiries, the basic financial statements, and other knowledge we obtained during our audit ofthe basic financial statements. We do not express an opinion or provide any assurance on the information becausethe limited procedures do not provide us with sufficient evidence to express an opinion or provide any assurance.
Other Information
Our audit was conducted for the purpose of forming opinions on the financial statements that collectivelycomprise the VTA's basic financial statements. The enterprise and fiduciary fund supplementary information, theintroductory and statistical sections are presented for purposes of additional analysis and are not a required partof the basic financial statements.
The enterprise and fiduciary funds supplementary information as listed in the table of contents is theresponsibility of management and was derived from and relates directly to the underlying accounting and otherrecords used to prepare the basic financial statements. Such information has been subjected to the auditingprocedures applied in the audit of the basic financial statements and certain additional procedures, includingcomparing and reconciling such information directly to the underlying accounting and other records used toprepare the basic financial statements or to the basic financial statements themselves, and other additionalprocedures in accordance with auditing standards generally accepted in the United States of America. In ouropinion, the supplementary information is fairly stated, in all material respects, in relation to the basic financialstatements as a whole for the year ended June 30, 2016.

2-3
We also previously audited, in accordance with auditing standards generally accepted in the United States ofAmerica, the basic financial statements of VTA as of and for the year ended June 30, 2015 (not presentedherein), and have issued our report thereon dated October 25, 2015, which contained unmodified opinions on therespective financial statements of the business-type activities, the governmental activities, each major fund, andthe aggregate remaining fund information. The enterprise fund supplementary information as of and for the yearended June 30, 2015 is presented for purposes of additional analysis and is not a required part of the basicfinancial statements. Such information is the responsibility of management and was derived from and relatesdirectly to the underlying accounting and other records used to prepare the June 30, 2015 financial statements.The enterprise fund supplementary information as of and for the year ended June 30, 2015 have been subjected tothe auditing procedures applied in the audit of the 2015 basic financial statements and certain additionalprocedures, including comparing and reconciling such information directly to the underlying accounting andother records used to prepare those financial statements or to those financial statements themselves, and otheradditional procedures in accordance with auditing standards generally accepted in the United States of America.In our opinion, the enterprise fund supplementary information is fairly stated in all material respects in relation tothe basic financial statements as a whole for the year ended June 30, 2015.
The introductory and statistical sections have not been subjected to the auditing procedures applied in the audit ofthe basic financial statements, and accordingly, we do not express an opinion or provide any assurance on them.
Other Reporting Required by Government Auditing Standards
In accordance with Government Auditing Standards, we have also issued our report dated October 21, 2016, onour consideration of the VTA's internal control over financial reporting and on our tests of its compliance withcertain provisions of laws, regulations, contracts, and grant agreements and other matters. The purpose of thatreport is to describe the scope of our testing of internal control over financial reporting and compliance and theresults of that testing, and not to provide an opinion on internal control over financial reporting or on compliance.That report is an integral part of an audit performed in accordance with Government Auditing Standards inconsidering the VTA's internal control over financial reporting and compliance.
Palo Alto, CaliforniaOctober 21, 2016

THIS PAGE IS INTENTIONALLY LEFT BLANK

MANAGEMENT’S DISCUSSION AND
ANALYSIS
(Required Supplementary Information)

THIS PAGE IS INTENTIONALLY LEFT BLANK

2-4
Management’s Discussion and Analysis
Management’s Discussion and Analysis (MD&A) provides a narrative overview and analysis of
the financial activities of VTA for FY 2016. To obtain a complete understanding of VTA’s
financial condition, this document should be read in conjunction with the accompanying
Transmittal Letter and Basic Financial Statements.
Financial Highlights
As of June 30, 2016, VTA’s net position amounted to approximately $4.4 billion. Of this
amount, approximately $3.4 billion consisted of net investment in capital assets which is
associated with VTA’s capital program.
Enterprise Funds operating revenues mainly from passenger fares were $42.3 million, a
decrease of $738 thousand or 1.7% from FY 2015.
As of June 30, 2016, VTA had total outstanding bonds in the amount of $1.1 billion.
VTA Transit Fund net position decreased by $33.7 million to $2 billion.
The three board-designated reserves; i.e., Transit Operating Reserve, Debt Reduction
Reserve, and Sales Tax Stabilization Reserve were $64.1 million, $76.4 million, and $35
million, respectively. Any of these reserves may be reduced by the amount of set aside for
Net Pension Liability established in compliance with GASB 68 in the amount of $195.6
million. This represents the net amount owed by VTA to employees for benefits provided
through a defined benefit pension plan that is attributed to employees’ past period of service.
VTA Measure A Fund net position in FY 2016 added $380 million to a total of $2.2 billion.
This amount is restricted for the Measure A Transit Improvement Program per the Measure
A Ballot.
The 1976 Sales Tax revenue, reflecting an improvement in taxable sales activity in the
County, increased $6.2 million, or 3.1% from FY 2015 level to $205.4 million in FY 2016.
The 2000 Measure A Sales Tax revenue increased $6 million or 3% to $205.6 million in
FY 2016.
Federal, state, and local operating grants were $16.5 million or 11.5% lower in FY 2016. The
decline was largely a result of the elimination of the use of federal grants for the funding of
preventive maintenance. While FY 2016 did not report grant revenue for preventive
maintenance activities, the prior year reported a $20.4 million revenue for this purpose. State
Transit Assistance was also lesser by $317.6 thousand in FY 2016. This was offset in part by
a net increase of $4.2 million in the Transportation Development Act (TDA) revenue, and
other operating assistance.

2-5
Capital grants decreased by $6.4 million from the FY 2015 level, due to a decrease in
grant-funded activities relating to Silicon Valley Berryessa Extension (SVBX) and
procurement of vehicles. The decrease was partially offset by recognition of grant revenues
for Mission Boulevard (Route 262)/Warren Avenue/Freight Railroad Relocation Program,
Mountain View Double Track Phase I, and Santa Clara Station Underpass projects.
As of June 30, 2016, the net position of Express Lanes and Joint Development funds
amounted to $2.4 million and $29.2 million, respectively. The Express Lanes Fund recorded
toll collection from SR 237/I-880 Express Connector. The Joint Development Fund reported
property rental revenues and other proceeds generated from VTA’s Joint Development
Program.
In FY 2016, BART operating fund’s net position was $187.5 million. The BART Operating
Sales Tax increased by $1.8 million or 3.7%, to $49.3 million in FY 2016.
Overview of the Financial Statements
VTA’s basic financial statements have three components: 1) government-wide financial
statements, 2) fund financial statements, and 3) notes to the basic financial statements. In
addition to the basic financial statements, this report also includes required and other
supplementary information.
1. Government-wide Financial Statements The Government-wide Financial Statements
provide a top-level view of VTA’s financial picture in a format resembling that of a private-
sector company.
The Statement of Net Position presents information on all of VTA’s assets and liabilities
including deferred inflow and outflow of resources, with the difference between the two
reported as net position. Over time, an increase or decrease in net position may serve as an
indicator of whether VTA’s financial position is improving or deteriorating.
The Statement of Activities presents information reflecting changes in VTA’s net position
during the most recent fiscal year. All changes in net position are reported as soon as the
underlying event giving rise to the change occurs, regardless of the timing of related cash
flows. Thus, revenues and expenses are reported in this statement for some items that will
result in cash flows only in future fiscal periods (e.g., uncollected taxes and earned but
unused vacation leave).
The government-wide statements distinguish functions of VTA that are principally supported
by sales tax and intergovernmental revenues. The VTA business-type activity is transit,

2-6
which includes bus/light rail operations, joint development, express lanes, BART operating,
and capital project activity. Although the transit operation’s primary function is intended to
recover its costs through charges for services (business-type activities), the recovery is not
significant. The governmental activities of VTA consist of congestion management and
highway programs, which include planning, programming, and construction of highway
projects.
2. Fund Financial Statements. A fund is a grouping of related accounts that is used to
maintain control over resources that have been segregated for specific activities or objectives.
VTA, like local and state governments, uses fund accounting to ensure and demonstrate
compliance with finance-related legal requirements. All VTA funds can be divided into three
categories: governmental funds, proprietary funds (i.e., enterprise funds and internal service
funds), and fiduciary funds.
Governmental funds - Governmental funds are used to account for essentially the same
functions reported as governmental activities in the government-wide financial statements.
However, unlike the government-wide financial statements, governmental fund financial
statements focus on near-term inflows and outflows of spendable resources, as well as on
balances of spendable resources available at the end of the fiscal year. Such information may
be useful in evaluating a government’s near-term financial requirements.
VTA maintains three major governmental funds to account for the financial activities of
VTA’s Congestion Management Program, the Congestion Management and Highway
Program, and the 1996 Measure B Highway Program.
Proprietary funds - VTA maintains two types of proprietary funds: enterprise funds and
internal service funds. The enterprise funds are used to report the same function presented as
“business-type activities” in the government-wide financial statements. The internal service
funds are used to account for activities that provide services to other funds, departments or to
other governments on a cost-reimbursement basis. General Liability, Workers’
Compensation, and Compensated Absences are accounted for in the internal service funds.
VTA uses the enterprise funds to account for its transit operation and capital activities, the
1996 Measure B Transit projects, the 2000 Measure A capital and operating activities, BART
Operating, Joint Development Program, and Express Lanes Program.
The enterprise funds and the internal service fund provide the same type of information as
the government-wide financial statements within the business-type activities, only in more
detail.

2-7
Fiduciary funds - Fiduciary funds are used to account for resources held for the benefit of
parties outside VTA. Fiduciary funds are not reflected in the government-wide financial
statements because the resources of those funds are not available to support VTA’s own
programs. The accounting used for fiduciary funds is much like that used for proprietary
funds.
The activities of the VTA Amalgamated Transit Union (ATU) Pension Plan, the ATU
Spousal Medical and Retiree Vision and Dental Funds and the Retirees’ Other Post
Employment Benefits (OPEB) Trust are reported in the retiree trust funds. Pension trust
funds are used to account for assets held by VTA as a trustee for individuals and other
organizations, such as ATU.
Senate Bill 83 Vehicle Registration Fee (SB 83 VRF), the Bay Area Air Quality
Management District (BAAQMD), and the 1996 Measure B Ancillary, which includes the
Pavement Management and Bicycle programs, are accounted for in an agency fund, a fund
that accounts for assets held solely in a custodial capacity. The 1996 Measure B Ancillary
Fund was closed in FY 2016.
3. Notes to the Financial Statements. The notes provide additional information that
is essential to a full understanding of the data provided in the government-wide and fund
financial statements. The notes to the financial statements can be found on pages 2-33
through 2-94 of this report.
In addition to the basic financial statements and notes, Required Supplementary Information
is presented as required by GASB. The required supplementary information shows Net
Pension Liabilities and Pension Contributions pertaining to ATU and CalPERS, VTA’s
funding progress relative to Other Post Employment Benefits as well as the Congestion
Management Program Budgetary Schedule. Required supplementary information can be
found on pages 2-95 through 2-101 of this report.
Other supplementary information such as the combining statements and other individual
schedules found immediately following the required supplementary information present
individual fund statements and schedules for the Enterprise and Fiduciary Funds. Other
supplementary information can be found on pages 2-102 through 2-112 of this report.
4. Government-wide Financial Analysis. The Government-Wide Statement of Net Position
and the Statement of Activities report a $398.4 million increase in net position. The

2-8
Business-Type activities were the major source of the growth as the Government-type
activities’ net position decreased by $342 thousand. The increase in the business-type net
position was due primarily to sales tax receipts, TDA, and capital grants related to VTA’s
BART Silicon Valley Extension Project. The 1976 sales tax, 2000 Measure A sales tax, and
BART operating sales tax collections for the fiscal year were $205.4 million, $205.6 million,
and $49.3 million, respectively. During FY 2016, VTA enterprise funds acquired or built
total capital assets of approximately $461.2 million (see Note 6). These capital assets were
funded by a variety of sources such as federal and state grants, bond proceeds as well as local
Measure A sales tax revenues.
2016 2015 2016 2015 2016 2015
Asset:
Current and other Assets 1,441,236$ 1,495,830$ 19,057$ 20,918$ 1,460,293$ 1,516,748$
Capital assets, net 4,497,706 4,100,080 - - 4,497,706 4,100,080
Total assets 5,938,942 5,595,910 19,057 20,918 5,957,999 5,616,828
Deferred outflow of resources 208,206 127,922 - - 208,206 127,922
Liabilities:
Current Liabilities 268,286 283,182 17,900 19,419 286,186 302,601
Long-term liabilities outstanding 1,498,314 1,446,584 - - 1,498,314 1,446,584
Total liabilities 1,766,600 1,729,766 17,900 19,419 1,784,500 1,749,185
Deferred inflow of resources 10,959 23,199 - - 10,959 23,199
Net Position:
Net Investment In Capital Assets 3,394,540 2,950,181 - - 3,394,540 2,950,181
Restricted 789,000 822,834 1,157 1,499 790,157 824,333
Unrestricted 186,049 197,852 - - 186,049 197,852
Total Net Position 4,369,589$ 3,970,867$ 1,157$ 1,499$ 4,370,746$ 3,972,366$
Business -Type Activities Government Activities Total
Santa Clara Valley Transportation Authority
Condensed Schedule of Net Position
FY 2016 and FY 2015
(In thousands)
The largest portion of VTA’s net position (approximately 78%) reflects its investment in
capital assets (e.g., land, buildings, infrastructure, machinery, and equipment), less any
related outstanding debt used to acquire those assets. VTA uses these capital assets to
provide services to its customers. Consequently, these assets are not available for future
spending. Although VTA’s investment in its capital assets is reported net of related debt, it
should be noted that the resources needed to repay this debt must be provided from other
sources since the capital assets themselves cannot reasonably be used to liquidate these
liabilities. The restricted net position represents mainly the funds set aside for the Measure A
and B Transit Improvement Programs, BART operating, debt service collateral with the bond
trustees, and Swap/Lease collateral. The unrestricted categories include funds set aside by
Board policies and for funding of local share of capital projects; inventory and prepaid

2-9
expenses; VTA transit operating reserve, debt reduction, express lanes and joint development
program funds, sales tax stabilization, irrevocable transfer made to the OPEB Trust, and a
deficit in compensated absences. The irrevocable transfer made to OPEB Trust, although
unrestricted, is earmarked for OPEB Trust Fund’s future operating needs. The unrestricted
net position is generally available for appropriation with Board approval. The details of net
position categories are shown on page 2-39, Note 2(j).
Governmental Accounting Standards Board (GASB) Statement 68 requires public employees
to comply with new accounting and professional reporting standards. Under this standard,
employers that participate in a defined benefit pension plan, administered as a trust or
equivalent arrangement, are required to record the net pension liability, pension
contributions, and deferred outflows/inflows of resources related to pensions in their
financial statements. Net Pension Liability is the amount owed by VTA to its employees for
benefits provided through a defined benefit pension plan. This consists of $80.6 million for
CalPERS and $115 million for ATU, net of related deferrals.
Business-Type Activities – The total net position of $4.4 billion was up by $398.7 million in
FY 2016. The current fiscal year reported favorable changes affecting general revenues and
unfavorable changes affecting net program expenses. Net program expenses (total expenses
minus program revenues) increased by $37.6 million in FY 2016, mainly due to the increase
in total expenses of $14 million and decrease in program revenues of $23.6 million.
The rise in total program expense is primarily due to the increase in labor and related fringe
of $22.8 million. There was an incremental adjustment in labor rates in accordance with
certain collective bargaining agreements, and recording of GASB 68-required pension
expense. The unfavorable change in pension expense was largely due to the increase in
actuarial estimate as a result of reduction in discount rate assumption specifically for ATU.
Service was increased by $4.6 million due to added security personnel which allowed
presence of law enforcement 24 hours a day. The decline in the following expenses offset the
earlier increases: contribution to other agencies of $8.4 million, interest expense of $3.9
million, and other net operating expenses of $1.1 million. The decline in other net operating
expenses was a result of a decrease in contributions to other agencies. These are expenditures
incurred by projects whose generated assets would end up being owned by other entities
(such as Hayward Maintenance Complex, Mission Boulevard/Warren Avenue, and Kato
Road). There was also a decrease in interest expense as a result of increased capitalized
interest. With the 2010 taxable bonds being completely drawn since August 2015, related
interest was fully capitalized for the most part of the fiscal year.

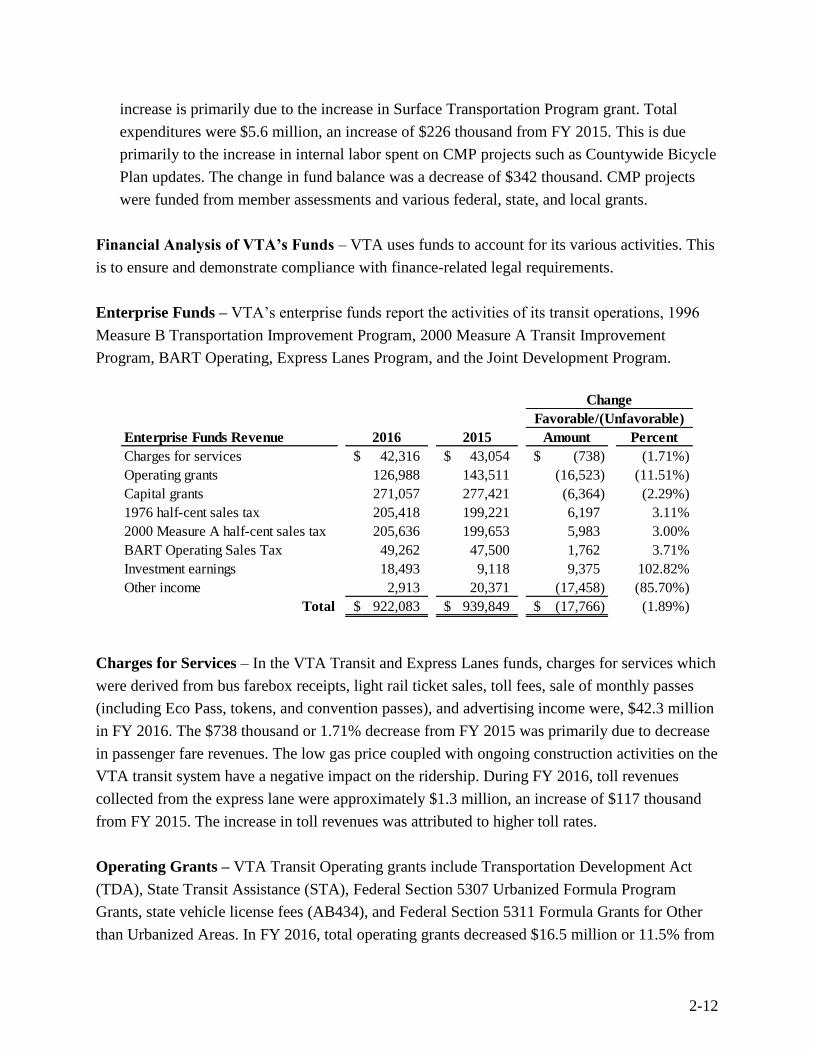
2-10
In the program revenue category, charges for services were down $738 thousand due to
decreases in passenger fares collected ($1.44 million), as well as shelter advertising revenues
($56.2 thousand). These decreases were offset partially by an increase in toll, advertising
revenues, and other operating revenues of $758.2 thousand. The increase in toll revenues was
attributed primarily to higher toll rates. Advertising revenues also experienced an increase
brought about by a higher minimum annual guarantee by the vendor.
Operating Assistance grants decreased by $16.5 million due to the elimination of use of
federal grants for funding preventive maintenance activities. While there was no preventive
maintenance grant received in FY 2016, a $20.4 million in preventive maintenance grant
received was recognized in the prior year. State transit assistance was also lesser by $317.6
thousand in FY 2016. This reduction was offset partially by an increase of $3.9 million in
Transportation Development Act (TDA) and net increase of $320 thousand in other federal
and state operating assistance grants relating to Transit Assistance Program, Transportation
for Clean Air Act Shuttle Program, Job Access Reverse Commute, and Transit Security
Grant Program revenues.
Capital grants decreased by $6.4 million as a result of reduced activities mainly in the grant-
funded Silicon Valley Berryessa Extension (SVBX) and procurement of buses. The decrease
was partially offset by the recognition of grant revenues for Mission Boulevard (Route
262)/Warren Avenue/Freight Railroad Relocation Program, Mountain View Double Track Phase
I and Santa Clara Station Underpass projects.
In the general revenue category, the upswing in sales taxes of $14 million and investment
income of $9.7 million, offset by a decrease in other income of $17.7 million, resulted in a $6
million improvement. The increase in investment income was largely due to higher mark-to-
market gains of $8.3 million as a result of modestly lower interest rates. Other income
decreased during the year because there were proceeds received from sale of properties in the
prior year but none in the current year.

2-11
2016 2015 2016 2015 2016 2015
Expenses:Operations, support services, and CMP program 431,212$ 407,618$ 8,228$ 8,071$ 439,440$ 415,689$
Caltrain subsidy & capital expense, on behalf of,
and contribution to other agencies 61,508 69,835 - - 61,508 69,835 Altamont Corridor Express subsidy 3,166 3,097 - - 3,166 3,097
Interest expense 11,330 15,204 - - 11,330 15,204
Other non-operating expenses 4,177 5,734 - - 4,177 5,734
Claims and change in future claim estimates 12,999 8,881 - - 12,999 8,881
Contribution to agencies - - 210 168 210 168
Capital outlay on behalf of other agencies - - 11,189 20,127 11,189 20,127
Total expenses 524,392 510,369 19,627 28,366 544,019 538,735
Program revenues:
Charges for services 42,316 43,054 2,529 2,526 44,845 45,580
Operating grants* 126,988 143,511 16,585 2,096 143,573 145,607
Capital grants 271,057 277,421 - 22,964 271,057 300,385
Total program revenues 440,361 463,986 19,114 27,586 459,475 491,572
Net program revenues (expenses) (84,031) (46,383) (513) (780) (84,544) (47,163)
General revenues:
Sales tax revenue 460,316 446,374 - - 460,316 446,374
Investment income 19,102 9,420 16 9 19,118 9,429
Other Income 3,335 20,993 155 250 3,490 21,243
Total general revenues 482,753 476,787 171 259 482,924 477,046
Change in net position 398,722 430,404 (342) (521) 398,380 429,883
Net position, beginning of year 3,970,867 3,729,457 1,499 2,020 3,972,366 3,731,477
Adjustment to Net Position due to
GASB 68 Implementation - (188,994) - - - (188,994)
Net position, beginning of year 3,970,867 3,540,463 1,499 2,020 3,972,366 3,542,483
Net position, end of year 4,369,589$ 3,970,867$ 1,157$ 1,499$ 4,370,746$ 3,972,366$
Business-Type Activities Governmental Activities Total
SANTA CLARA VALLEY TRANSPORTATION AUTHORITY Condensed Schedule of Activities
FY 2016 and FY 2015
(In thousands)
*To be comparative with FY 2016, $8.7 million BABs subsidy in FY 2015 was reflected under Operating grants.
Governmental Activities – The net position of governmental activities decreased $342
thousand, with an ending balance of $1.2 million; all in the Special Revenue Fund. Major
elements of changes in fund balance were as follows:
In the Congestion Management and Highway Program (CMHP) Capital Projects Funds, total
grant revenues and capital expenditures were $13.8 million. In FY 2016, CMHP reported a
decrease in grant revenues as a result of waning activities on projects (e.g. Stevens Creek
construction and US101/Capitol Expressway/Yerba Buena Interchange). The decrease was
partially offset by a slight increase in activity in SR 237 Express Lanes-Phase II Extension
and improvements at Mathilda Road. Measure B Highway Program showed capital grant
revenue of $183 thousand with the same amount of capital expenditures. The decrease in
Measure B Highway Program activities is due to the program’s winding down to completion.
In the Congestion Management Program (CMP) Special Revenue Fund, total revenue sources
were $5.3 million, an increase of $405 thousand from the $4.9 million in FY 2015. The
2-12
increase is primarily due to the increase in Surface Transportation Program grant. Total
expenditures were $5.6 million, an increase of $226 thousand from FY 2015. This is due
primarily to the increase in internal labor spent on CMP projects such as Countywide Bicycle
Plan updates. The change in fund balance was a decrease of $342 thousand. CMP projects
were funded from member assessments and various federal, state, and local grants.
Financial Analysis of VTA’s Funds – VTA uses funds to account for its various activities. This
is to ensure and demonstrate compliance with finance-related legal requirements.
Enterprise Funds – VTA’s enterprise funds report the activities of its transit operations, 1996
Measure B Transportation Improvement Program, 2000 Measure A Transit Improvement
Program, BART Operating, Express Lanes Program, and the Joint Development Program.
Enterprise Funds Revenue 2016 2015 Amount Percent
Charges for services 42,316$ 43,054$ (738)$ (1.71%)
Operating grants 126,988 143,511 (16,523) (11.51%)
Capital grants 271,057 277,421 (6,364) (2.29%)
1976 half-cent sales tax 205,418 199,221 6,197 3.11%
2000 Measure A half-cent sales tax 205,636 199,653 5,983 3.00%
BART Operating Sales Tax 49,262 47,500 1,762 3.71%
Investment earnings 18,493 9,118 9,375 102.82%
Other income 2,913 20,371 (17,458) (85.70%)
Total 922,083$ 939,849$ (17,766)$ (1.89%)
Change
Favorable/(Unfavorable)
Charges for Services – In the VTA Transit and Express Lanes funds, charges for services which
were derived from bus farebox receipts, light rail ticket sales, toll fees, sale of monthly passes
(including Eco Pass, tokens, and convention passes), and advertising income were, $42.3 million
in FY 2016. The $738 thousand or 1.71% decrease from FY 2015 was primarily due to decrease
in passenger fare revenues. The low gas price coupled with ongoing construction activities on the
VTA transit system have a negative impact on the ridership. During FY 2016, toll revenues
collected from the express lane were approximately $1.3 million, an increase of $117 thousand
from FY 2015. The increase in toll revenues was attributed to higher toll rates.
Operating Grants – VTA Transit Operating grants include Transportation Development Act
(TDA), State Transit Assistance (STA), Federal Section 5307 Urbanized Formula Program
Grants, state vehicle license fees (AB434), and Federal Section 5311 Formula Grants for Other
than Urbanized Areas. In FY 2016, total operating grants decreased $16.5 million or 11.5% from

2-13
the FY 2015 level. There was an elimination of the use of federal funds for funding preventive
maintenance activities which caused a drop in federal assistance of $20.4 million compared to
prior year. There was also a decrease in State Transit Assistance (STA) revenue of $317.6
thousand. The decrease was offset in part by an increase in Transportation Development (TDA)
revenue of $3.9 million and net increase of $320 thousand in other federal and state operating
assistance grants relating to Transit Assistance Program, Transportation for Clean Air Act,
Shuttle Program, Job Access Reverse Commute, and Transit Security Grant Program revenues.
TDA funds are derived from a quarter-cent sales tax levied by the state on taxable transactions
occurring in the Santa Clara County. The Metropolitan Transportation Commission (MTC)
retains a portion of these funds for administration and approximately 94.5% is returned to the
source county (i.e., Santa Clara). After sales tax derived from local measures, TDA revenue is
VTA’s second largest source of revenue for operations. For FY 2016, the actual TDA receipts
were $98.5 million. This is a $3.9 million or 4.1% rise over the prior fiscal year as the taxable
sales activity in the county expanded in FY 2016.
STA funds are derived from state sales tax on diesel fuel. STA apportionments are made to
regional transportation planning agencies (Metropolitan Transportation Commission in the San
Francisco Bay Area Region) based on a formula that allocates 50% of the funds according to
population and 50% according to the transit operator’s qualified revenues in the region from the
prior fiscal year. In FY 2016, VTA received $13.6 million compared to the $13.9 million in
FY 2015. The slightly lesser STA apportionment was attributed to the low diesel price during
FY 2016.
Federal Section 5307 consists of Americans with Disabilities Act (ADA) Operating Assistance.
ADA Operating set aside funds are used for paratransit activities, a mandated service that VTA
provides to residents of Santa Clara County.
Capital Grants – Capital grants include Federal Sections 5307 and 5309, other federal pass-
through, various State transit-related capital grants, capital contribution from local agencies, and
reimbursements received by VTA for capital expenses undertaken on behalf of other agencies.
These were reported under the VTA Transit, Measure B Transit, and 2000 Measure A funds.
Total capital grants decreased $6.4 million or 2.3% to $271 million. This is primarily due to
reduced activities in the federal and state funded Silicon Valley Berryessa Extension (SVBX)
and procurement of buses. The decrease was partially offset by the recognition of grant revenues
relating to Mission Boulevard (Route 262)/Warren Avenue/Freight Railroad Relocation Program,
Mountain View Double Track Phase I and Santa Clara Station Underpass projects.
2-14
The 1976 Half-Cent Sales Tax Revenues – The 1976 Sales Tax is VTA’s single largest source
of revenue for operations under the VTA Transit Fund. The State Board of Equalization (SBOE)
collects the 1976 Sales Tax for VTA. The 1976 Sales Tax Revenues pay the operating expenses
and capital expenditures, where state or federal capital assistance programs require that the
recipient of assistance contribute locally-derived revenues. For FY 2016, total sales tax revenues
were $205.4 million, a $6.2 million or 3.1% growth compared to the prior fiscal year’s sales tax
revenue.
2000 Measure A Half-Cent Sales Tax Revenues – The 2000 Measure A Half-Cent Sales Tax is
collected by the SBOE for VTA in the same manner as the 1976 Measure B Sales Tax. The 2000
Measure A Sales Tax revenues are reported in the 2000 Measure A fund and restricted for
projects and operational activities included in the 2000 Measure A ballot. The collection of this
tax occurred after the expiration of the 1996 Half-Cent Measure B Sales Tax on March 31, 2006.
For FY 2016, total sales tax revenues were $205.6 million, a $6 million or 3% growth compared
to the prior fiscal year’s sales tax revenue.
BART Operating – In November 2008, county residents passed 1/8-cent sales tax to fund the
operating and maintenance costs of the BART Extension. Collection of the tax which will be for
a period not to exceed 30 years, took effect on July 1, 2012. In FY 2016, total sales tax revenue
under the BART Operating Fund was $49.3 million.
Investment Earnings – The investment earnings are derived from three primary sources: short,
mid, and long-term investment portfolios. Investment earnings were primarily recorded under
2000 Measure A Fund. Pursuant to VTA’s adopted investment policy and California
Government Code, 100% of surplus assets are invested in domestic fixed income investments.
The increase in investment income of $9.7 million in FY 2016 was largely due to higher mark-
to-market gains as a result of modestly lower interest rates.
Federal Subsidy for Build America Bonds (BABs) – In FY 2011, VTA issued 2010 Measure
A Sales Tax Bonds which are taxable to the bond holders and recorded under 2000 Measure A
Fund. The bonds were issued under the federal BABs program which provides a 35% interest
cost subsidy to VTA. In compliance with Governmental Accounting Standards Board (GASB),
VTA recognizes the BABs subsidy as an income item in its financial statements. Starting with
FY 2016, this item was presented as Program Revenues under Operating grants. In FY 2016,
2000 Measure A Fund reported BABs subsidy of $8.7 million, more by $33 thousand from the
previous year as a result of the rate reduction in federal sequestration order.

2-15
Other income - In FY 2016, total other income was $3.3 million, a decrease of $17 million.
There were proceeds received from sale of properties in the prior year but none in the current
year.
Enterprise Funds Expenses 2016 2015 Amount Percent
Operations and support services 443,660$ 416,459$ (27,201)$ (6.53%)
Caltrain and ACE subsidy 11,580 11,487 (93) (0.81%)
Capital contributions to/or expenses
on-behalf of other agencies 53,094 61,445 8,351 13.59%
Interest expense and other bond charges 11,330 15,204 3,874 25.48%
Other non-operating expenses 4,177 5,734 1,557 27.15%
Total 523,841$ 510,329$ (13,512)$ (2.65%)
Favorable/(Unfavorable)
Comparison of
Enterprise Funds Expenses
FY 2016 and FY 2015
(In thousands)
Change
Operations and Support Services – Operations and support services expenses are incurred for
bus and light rail operations, services and support programs in VTA Transit Fund. These
expenses include labor and fringe, support services, insurance, purchased transportation and
other overhead costs related to bus and light rail operations. For FY 2016, operations and support
services expense was $27.2 million or 6.5% higher compared to that of FY 2015. Labor and
benefit costs increased by $22.8 million or 5.5% in FY 2016 as a result of an increase in labor
rates as provided for by certain collective bargaining agreements and GASB 68-required pension
expense. Pension expense rose because actuarial estimate increased affecting the net pension
liability, particularly for ATU. Services increased by $4.5 million in FY 2016 as a result of
added sheriff security personnel which extended law enforcement availability 24 hours a day.
Purchased transportation from Outreach also grew by $2.2 million brought about by increase in
transportation provider cost. These increases were partly offset by a drop in insurance and
depreciation. The reduction in general liability insurance provision was a result of actuarial
determination that the established reserves were adequate. Depreciation dropped by $3.3 million
as a result of retirement of zero-emission buses in FY 2016. There was also a decline in other
cost allocated to capital translating to a decreased capitalized labor and associated costs.
Caltrain and Altamont Corridor Express (ACE) Subsidy – Caltrain is a commuter rail
service, provided by the Peninsula Corridor Joint Powers Board (PCJPB), which consists of 3
member agencies: VTA, San Mateo County Transit District (SamTrans) and City and County of
San Francisco. VTA contributes a portion of Caltrain operating and maintenance costs for

2-16
commuter train service from Santa Clara County to San Francisco. Operating subsidy to Caltrain
under the VTA Transit Fund was $8.4 million in FY 2016; $24 thousand more than the
contribution in FY 2015.
The ACE is administered by and funded under a cooperative agreement among VTA, the
Alameda County Congestion Management Agency and the San Joaquin Regional Rail
Commission (SJRRC). VTA’s subsidy to ACE commuter rail service under the VTA Transit
Fund totaled $3.2 million in FY 2016; $68 thousand more than the contribution in FY 2015. The
annual subsidy was based on the joint power agreement with these agencies.
Capital Contributions to/or Expenses on Behalf of Other Agencies – As part of its capital
program, VTA makes capital contribution to or undertakes capital projects jointly with other
agencies. As the ownership of these capital assets does not rest with VTA, these capital expenses
are reported as non-operating expenses on its financial statements. In FY 2016, total capital
contributions to/or on behalf of other agencies were $53.1 million ($7.4 million in VTA Transit
Fund, $4.8 million in Measure B Transit Fund, and $40.9 million in 2000 Measure A Fund), or
$8.4 million lesser compared to the preceding year’s level. This is largely due to a decline in
capital activities relating to projects such as Hayward Maintenance Complex, Mission
Boulevard/Warren Avenue, and Kato Road.
Interest Expense and other Bond Charges – Interest expense and other bond charges were
$11.3 million; $3.9 million less compared to prior year, due to more interest expense being
capitalized in FY 2016 in the 2000 Measure A Fund. As the 2010 taxable bonds were completely
drawn down in August 2015, the percentage of capitalized interest proportionately increased.
Other Non-Operating Expenses – Other non-operating expenses were $1.6 million less in FY
2016 largely due to the completion of the strategic bus rapid transit plan study.

2-17
Internal Service Funds – VTA maintains Internal Service Funds to account for the activities
related to Workers’ Compensation, General Liability, and Compensated Absences programs. The
costs of these activities are accounted for in these funds and then charged to other VTA funds.
As of June 30, 2016, the total deficit for this fund category, entirely from the Compensated
Absences program, was $6.7 million and is funded by VTA Transit’s FY 2017 operating budget.
Governmental Funds – The focus of VTA’s governmental funds is to provide information on
near-term inflows, outflows, and balances of expendable resources. Such information is useful in
assessing VTA’s financing requirements. VTA maintains two governmental fund types – Special
Revenue Fund and Capital Projects Fund.
Special Revenue Fund – This fund accounts for the activities of the Congestion Management
Program. The table that follows shows the details of changes in fund balance between the current
and prior fiscal year:
Charges for services
5%
Operating grants14%
Investment earn ings
2%
1976 ha lf -cent sa les ta x
22%Capital grants29%
BART Operating Sa les Tax
5%
2000 Measure A ha lf -cent sa les
tax22%
Other income1%
Revenue by SourcesEnterprise Funds
Operations and support services
85%
Ca ltrain and ACE subs idy
2%
Capital contributions to/or expenses on -behalf
o f other agencies10%
In terest expense and other bond
charges2%
Other non-operating expenses
1%
Expenses by CategoriesEnterprise Funds
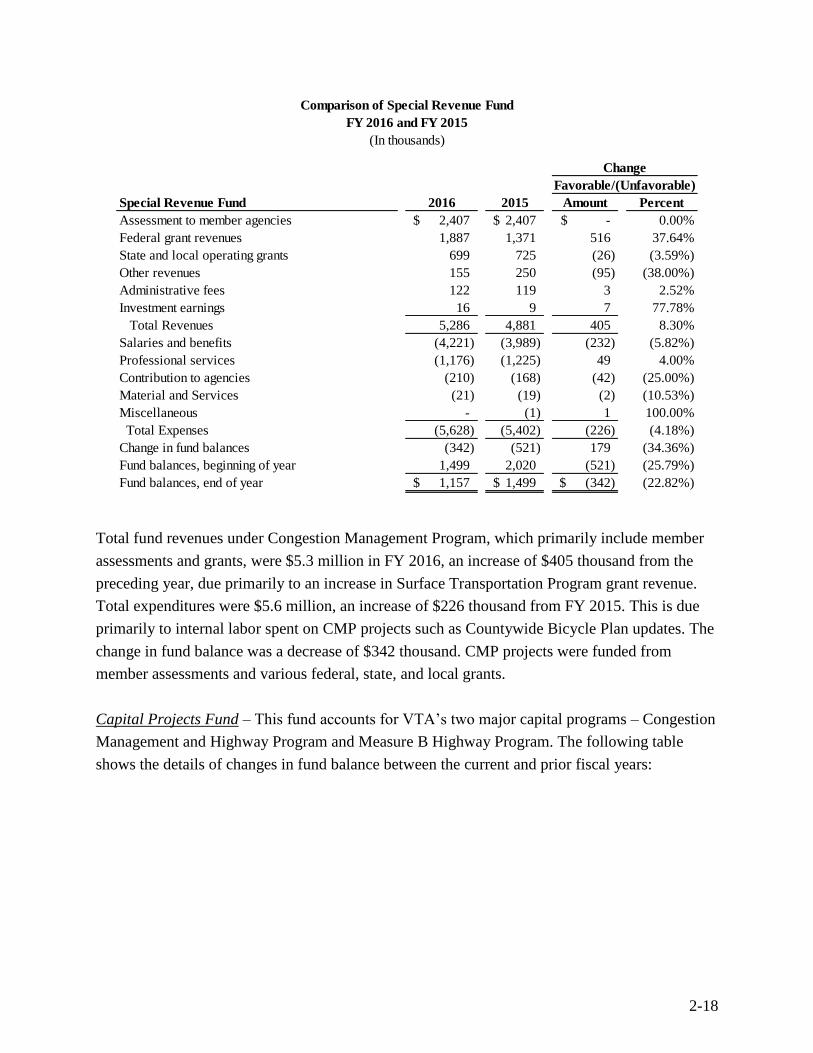
2-18
Special Revenue Fund 2016 2015 Amount Percent
Assessment to member agencies 2,407$ 2,407$ -$ 0.00%
Federal grant revenues 1,887 1,371 516 37.64%
State and local operating grants 699 725 (26) (3.59%)
Other revenues 155 250 (95) (38.00%)
Administrative fees 122 119 3 2.52%
Investment earnings 16 9 7 77.78%
Total Revenues 5,286 4,881 405 8.30%
Salaries and benefits (4,221) (3,989) (232) (5.82%)
Professional services (1,176) (1,225) 49 4.00%
Contribution to agencies (210) (168) (42) (25.00%)
Material and Services (21) (19) (2) (10.53%)
Miscellaneous - (1) 1 100.00%
Total Expenses (5,628) (5,402) (226) (4.18%)
Change in fund balances (342) (521) 179 (34.36%)
Fund balances, beginning of year 1,499 2,020 (521) (25.79%)
Fund balances, end of year 1,157$ 1,499$ (342)$ (22.82%)
Favorable/(Unfavorable)
Change
Comparison of Special Revenue Fund
FY 2016 and FY 2015
(In thousands)
Total fund revenues under Congestion Management Program, which primarily include member
assessments and grants, were $5.3 million in FY 2016, an increase of $405 thousand from the
preceding year, due primarily to an increase in Surface Transportation Program grant revenue.
Total expenditures were $5.6 million, an increase of $226 thousand from FY 2015. This is due
primarily to internal labor spent on CMP projects such as Countywide Bicycle Plan updates. The
change in fund balance was a decrease of $342 thousand. CMP projects were funded from
member assessments and various federal, state, and local grants.
Capital Projects Fund – This fund accounts for VTA’s two major capital programs – Congestion
Management and Highway Program and Measure B Highway Program. The following table
shows the details of changes in fund balance between the current and prior fiscal years:

2-19
Capital Projects Funds 2016 2015 Amount Percent
Federal, State, and local capital grant
revenues 13,999$ 22,964$ (8,965)$ (39.04%)
VTA labor and overhead costs (2,810) (2,837) 27 0.95%
Capital expenditures on behalf of other agencies (11,189) (20,127) 8,938 44.41%
Change in fund balances -$ -$ -$
Favorable/(Unfavorable)
Comparison of
Capital Project Funds
FY 2016 and FY 2015
(In thousands)
Change
For FY 2016, total revenues were $14 million which represent the total amount expended on the
projects and fully funded by other governmental agencies. This consists of $13.8 million in
Congestion Management and Highway Program, and $183 thousand in Measure B Highway
Fund.
The VTA labor and overhead costs primarily from Congestion Management and Highway
Program were $27 thousand lower in FY 2016. Capital expenditures on behalf of other agencies
were $11.2 million in FY 2016, an $8.9 million drop largely attributed to less activities in
projects nearing completion (I-880/I-280/Stevens Creek Improvement and US101/Capitol
Expressway/Yerba Buena Interchange). The decrease was partially offset by a slight increase in
activity in SR 237 Express Lanes-Phase II Extension and improvements at Mathilda Road.
Charges for services
13%
Others1%
Operating grants 86%
Revenue by SourcesGovernmental Funds
Salaries and benefits36%
Materials, services, and others
6%
Contribution to agencies
58%
Expenditures by CategoriesGovernmental Funds
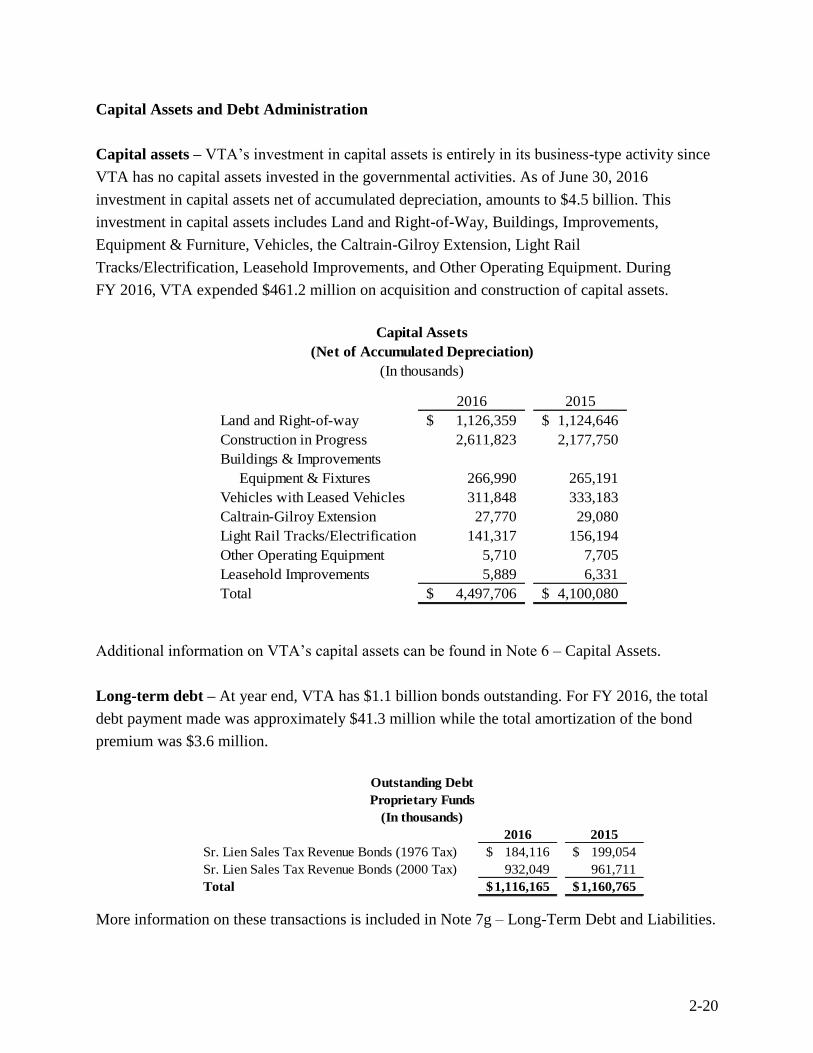
2-20
Capital Assets and Debt Administration
Capital assets – VTA’s investment in capital assets is entirely in its business-type activity since
VTA has no capital assets invested in the governmental activities. As of June 30, 2016
investment in capital assets net of accumulated depreciation, amounts to $4.5 billion. This
investment in capital assets includes Land and Right-of-Way, Buildings, Improvements,
Equipment & Furniture, Vehicles, the Caltrain-Gilroy Extension, Light Rail
Tracks/Electrification, Leasehold Improvements, and Other Operating Equipment. During
FY 2016, VTA expended $461.2 million on acquisition and construction of capital assets.
2016 2015
Land and Right-of-way 1,126,359$ 1,124,646$
Construction in Progress 2,611,823 2,177,750
Buildings & Improvements
Equipment & Fixtures 266,990 265,191
Vehicles with Leased Vehicles 311,848 333,183
Caltrain-Gilroy Extension 27,770 29,080
Light Rail Tracks/Electrification 141,317 156,194
Other Operating Equipment 5,710 7,705
Leasehold Improvements 5,889 6,331
Total 4,497,706$ 4,100,080$
Capital Assets
(Net of Accumulated Depreciation)
(In thousands)
Additional information on VTA’s capital assets can be found in Note 6 – Capital Assets.
Long-term debt – At year end, VTA has $1.1 billion bonds outstanding. For FY 2016, the total
debt payment made was approximately $41.3 million while the total amortization of the bond
premium was $3.6 million.
2016 2015
Sr. Lien Sales Tax Revenue Bonds (1976 Tax) 184,116$ 199,054$
Sr. Lien Sales Tax Revenue Bonds (2000 Tax) 932,049 961,711
Total 1,116,165$ 1,160,765$
Outstanding Debt
Proprietary Funds
(In thousands)
More information on these transactions is included in Note 7g – Long-Term Debt and Liabilities.

2-21
For Senior Lien Sales Tax Revenue Bonds secured by 1976 sales tax revenues, VTA maintains
uninsured ratings of “AAA” from Standard & Poor’s (S&P), “AA” rating from Fitch, and a
“Aa2” rating from Moody’s.
For Sales Tax Revenue Bonds secured by 2000 Measure A sales tax revenues, VTA maintains
uninsured ratings of “Aa2” from Moody’s and “AA+” from S&P.
Each of the two liens listed above has a separate series of 2007 bonds and each series has a bond
insurance policy issued by Ambac Assurance Corporation insuring the timely payment of debt
service. Since the credit ratings for Ambac Assurance Corporation are currently lower than
ratings for the VTA’s bond liens, 2007 bonds bear the rating of the respective sales tax bond
liens as listed above.
Additional information on VTA’s long-term debt can be found in Note 7 – Long-term Liabilities.
Requests for Information
Please address all questions or requests for additional information to the Finance and Budget
Division, Attention: Chief Financial Officer, Santa Clara Valley Transportation Authority
3331 North First Street, Building C, Second Floor, San Jose, CA 95134-1927

BASIC FINANCIAL STATEMENTS

THIS PAGE IS INTENTIONALLY LEFT BLANK

See Accompanying Notes to Basic Financial Statements 2-22
SANTA CLARA VALLEY TRANSPORTATION AUTHORITY Statement of Net Position
June 30, 2016
(In thousands)
Business-Type
Activities
Governmental
Activities Total
ASSETS
Cash and investments 363,775$ -$ 363,775$
Receivables, net 4,071 - 4,071
Internal balances 269 (269) -
Due from other agencies 50,070 - 50,070
Inventories 32,040 - 32,040
Other current assets 1,575 - 1,575
Net OPEB asset 15,865 - 15,865
Restricted assets:
Cash and investments 820,549 15,159 835,708
Receivables, net 4 - 4
Due from other agencies 149,685 4,167 153,852
Other current assets 248 - 248
Capital and other assets:
Intangible Assets 3,085 - 3,085
Capital assets - nondepreciable 3,738,182 - 3,738,182
Capital assets - depreciable, net of accumulated depreciation 759,524 - 759,524
Total assets 5,938,942 19,057 5,957,999
DEFERRED OUTFLOW OF RESOURCES
Accumulated decrease in fair value of hedging derivative,
deferred amount on refunding, & deferred outflow of
resources-pension related 208,206 - 208,206
LIABILITIES
Accounts payable and accrued expenses 19,364 - 19,364
Deposits 333 - 333
Accrued payroll and related liabilities 9,805 - 9,805
Bond interest and other fees payable 515 - 515
Unearned revenues 2,560 - 2,560
Other accrued expenses 271 - 271
Liabilities payable from restricted assets:
Accounts payable and accrued expenses 72,183 1,735 73,918
Bond interest and other fees payable 11,368 - 11,368
Unearned revenues 7 - 7
Due to other agencies 98,120 16,165 114,285
Long-term liabilities:
Derivative instruments 119,076 - 119,076
Due within one year 53,760 - 53,760
Due in more than one year 1,379,238 - 1,379,238
Total liabilities 1,766,600 17,900 1,784,500
DEFERRED INFLOW OF RESOURCES
Deferred inflow-pension related 6,957 - 6,957
Deferred amount on refunding 4,002 - 4,002
Total deferred inflows of resources 10,959 - 10,959
NET POSITION
Net investment in capital assets 3,394,540 - 3,394,540
Restricted:
Swap/lease collateral 120,764 - 120,764
Debt Service 49,840 - 49,840
2000 Measure A projects 429,907 - 429,907
1996 Measure B projects 974 - 974
BART Operating 187,515 - 187,515
Congestion management program - 1,157 1,157
Unrestricted (Note 2j) 186,049 - 186,049
Total Net Position 4,369,589$ 1,157$ 4,370,746$

See Accompanying Notes to Basic Financial Statements 2-23
SANTA CLARA VALLEY TRANSPORTATION AUTHORITY Statement of Activities
For the Year ended June 30, 2016
(In thousands)
Business-Type Governmental
Activities Activities Total
Transit
Congestion
Management
EXPENSES:
Operations, support services, and CMP program 431,212$ 8,228$ 439,440$
Caltrain subsidy & capital expenses on behalf of,
and contribution to other agencies 61,508 - 61,508
Altamont Commuter Express subsidy 3,166 - 3,166
Interest expense 11,330 - 11,330
Other non-operating expenses 4,177 - 4,177
Claims and change in future claim estimates 12,999 - 12,999
Contribution to agencies - 210 210
Capital outlay on behalf of other agencies - 11,189 11,189
Total expenses 524,392 19,627 544,019
PROGRAM REVENUES:
Charges for services 42,316 2,529 44,845
Operating grants 126,988 16,585 143,573
Capital grants 271,057 - 271,057
Total program revenues 440,361 19,114 459,475
Net program revenues (expenses) (84,031) (513) (84,544)
GENERAL REVENUES:
Sales tax revenue 460,316 - 460,316
Investment income 19,102 16 19,118
Other income 3,335 155 3,490
Total general revenues 482,753 171 482,924
Change in Net Position 398,722 (342) 398,380
NET POSITION, BEGINNING OF YEAR 3,970,867 1,499 3,972,366
NET POSITION, END OF YEAR 4,369,589$ 1,157$ 4,370,746$
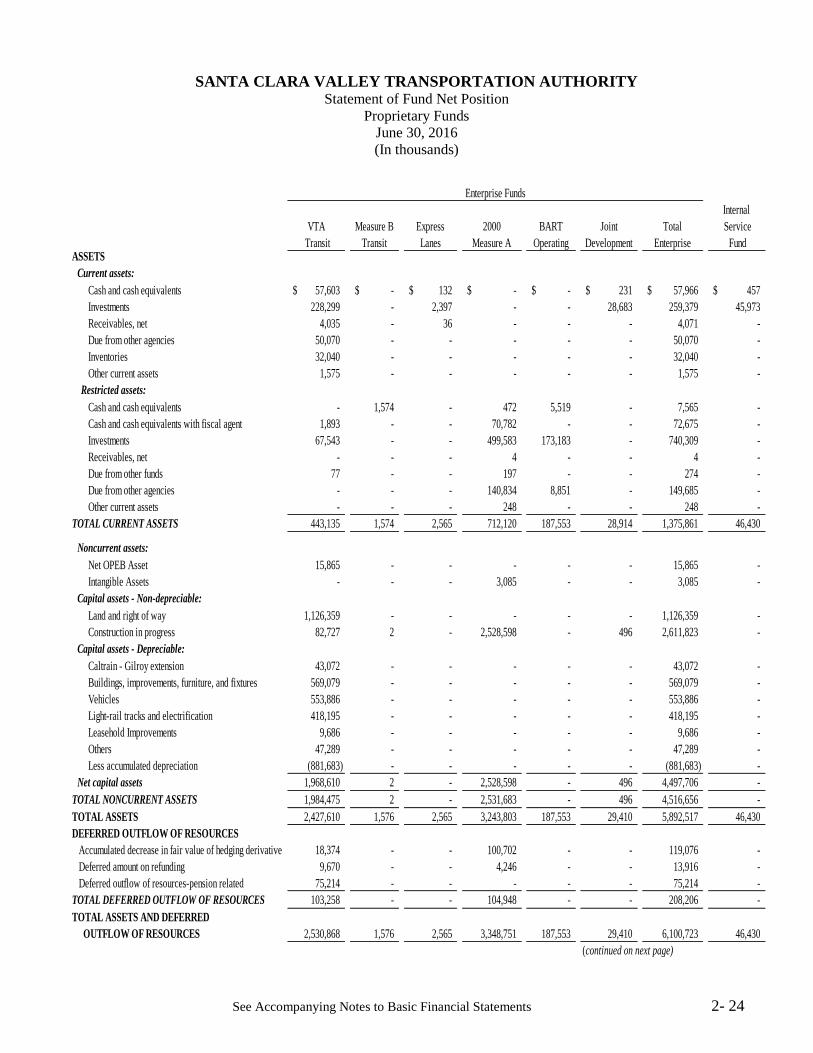
See Accompanying Notes to Basic Financial Statements 2- 24
SANTA CLARA VALLEY TRANSPORTATION AUTHORITY Statement of Fund Net Position
Proprietary Funds
June 30, 2016
(In thousands)
VTA
Transit
Measure B
Transit
Express
Lanes
2000
Measure A
BART
Operating
Joint
Development
Total
Enterprise
Internal
Service
FundASSETS
Current assets:
Cash and cash equivalents 57,603$ -$ 132$ -$ -$ 231$ 57,966$ 457$
Investments 228,299 - 2,397 - - 28,683 259,379 45,973
Receivables, net 4,035 - 36 - - - 4,071 -
Due from other agencies 50,070 - - - - - 50,070 -
Inventories 32,040 - - - - - 32,040 -
Other current assets 1,575 - - - - - 1,575 -
Restricted assets:
Cash and cash equivalents - 1,574 - 472 5,519 - 7,565 -
Cash and cash equivalents with fiscal agent 1,893 - - 70,782 - - 72,675 -
Investments 67,543 - - 499,583 173,183 - 740,309 -
Receivables, net - - - 4 - - 4 -
Due from other funds 77 - - 197 - - 274 -
Due from other agencies - - - 140,834 8,851 - 149,685 -
Other current assets - - - 248 - - 248 -
TOTAL CURRENT ASSETS 443,135 1,574 2,565 712,120 187,553 28,914 1,375,861 46,430
Noncurrent assets:
Net OPEB Asset 15,865 - - - - - 15,865 -
Intangible Assets - - - 3,085 - - 3,085 -
Capital assets - Non-depreciable:
Land and right of way 1,126,359 - - - - - 1,126,359 -
Construction in progress 82,727 2 - 2,528,598 - 496 2,611,823 -
Capital assets - Depreciable:
Caltrain - Gilroy extension 43,072 - - - - - 43,072 -
Buildings, improvements, furniture, and fixtures 569,079 - - - - - 569,079 -
Vehicles 553,886 - - - - - 553,886 -
Light-rail tracks and electrification 418,195 - - - - - 418,195 -
Leasehold Improvements 9,686 - - - - - 9,686 -
Others 47,289 - - - - - 47,289 -
Less accumulated depreciation (881,683) - - - - - (881,683) -
Net capital assets 1,968,610 2 - 2,528,598 - 496 4,497,706 -
TOTAL NONCURRENT ASSETS 1,984,475 2 - 2,531,683 - 496 4,516,656 -
TOTAL ASSETS 2,427,610 1,576 2,565 3,243,803 187,553 29,410 5,892,517 46,430
DEFERRED OUTFLOW OF RESOURCES
Accumulated decrease in fair value of hedging derivative 18,374 - - 100,702 - - 119,076 -
Deferred amount on refunding 9,670 - - 4,246 - - 13,916 -
Deferred outflow of resources-pension related 75,214 - - - - - 75,214 -
TOTAL DEFERRED OUTFLOW OF RESOURCES 103,258 - - 104,948 - - 208,206 -
TOTAL ASSETS AND DEFERRED
OUTFLOW OF RESOURCES 2,530,868 1,576 2,565 3,348,751 187,553 29,410 6,100,723 46,430
(continued on next page)
Enterprise Funds

See Accompanying Notes to Basic Financial Statements 2- 25
SANTA CLARA VALLEY TRANSPORTATION AUTHORITY Statement of Fund Net Position (continued)
Proprietary Funds
June 30, 2016
(In thousands)
VTA
Transit
Measure B
Transit
Express
Lanes
2000
Measure A
BART
Operating
Joint
Development
Total
Enterprise
Internal
Service
Fund
LIABILITIES
Current liabilities:
Current portion of long-term debt 14,820 - - - - - 14,820 -
Accounts payable and accrued expenses 18,954 - 201 - - 97 19,252 112
Deposits 286 - - - - 47 333 -
Accrued payroll and related liabilities 9,805 - - - - - 9,805 -
Bond interest and other fees payable 515 - - - - - 515 -
Unearned revenues 2,503 - - - - 57 2,560 -
Other accrued expenses 271 - - - - - 271 -
Claims liability - - - - - - - 2,673
Compensated absences - - - - - - - 8,107
Liabilities payable from restricted assets:
Current portion of long-term debt - - - 28,160 - - 28,160 -
Accounts payable and accrued expenses - 2 - 72,143 38 - 72,183 -
Bond interest and other fees payable - - - 11,368 - - 11,368 -
Unearned revenues - - - 7 - - 7 -
Due to other funds - 5 - - - - 5 -
Due to other agencies 47,481 593 - 50,046 - - 98,120 -
TOTAL CURRENT LIABILITIES 94,635 600 201 161,724 38 201 257,399 10,892
Non-current liabilities:
Long-term debt, excluding current portion 169,296 - - 903,889 - - 1,073,185 -
Derivative instruments 18,374 - - 100,702 - - 119,076 -
Claims liability - - - - - - - 21,642
Compensated absences - - - - - - - 20,589
Net Pension Liability 263,822 - - - - - 263,822 -
TOTAL NON-CURRENT LIABILITIES 451,492 - - 1,004,591 - - 1,456,083 42,231
TOTAL LIABILITIES 546,127 600 201 1,166,315 38 201 1,713,482 53,123
DEFERRED INFLOW OF RESOURCES
Deferred Inflow-Pension Related 6,957 - - - - - 6,957 -
Deferred Amount on Refunding - - - 4,002 - - 4,002 -
Total Deferred Inflow of Resources 6,957 - - 4,002 - - 10,959 -
TOTAL LIABILITIES AND DEFERRED INFLOW OF RESOURCES 553,084 600 201 1,170,317 38 201 1,724,441 53,123
NET POSITION
Net Investment in Capital Assets 1,794,164 2 - 1,599,878 - 496 3,394,540 -
Restricted:
BART Operating - - - - 187,515 - 187,515 -
Swap/lease collateral 20,062 - - 100,702 - - 120,764 -
Debt service 1,893 - - 47,947 - - 49,840 -
2000 Measure A projects - - - 429,907 - - 429,907 -
1996 Measure B projects - 974 - - - - 974 -
Unrestricted (Note 2j) 161,665 - 2,364 - - 28,713 192,742 (6,693)
TOTAL NET POSITION 1,977,784$ 976$ 2,364$ 2,178,434$ 187,515$ 29,209$ 4,376,282$ (6,693)$
Reconciliation of the Statement of Fund Net Position to the Statement of Net Position:
Net Position of Enterprise Funds 4,376,282$
Net Position of Internal Service Funds, which benefits Business-type Activities (6,693)
Net Position (Page 2-22) 4,369,589$
Enterprise Funds

See Accompanying Notes to Basic Financial Statements 2- 26
SANTA CLARA VALLEY TRANSP0ORTATION AUTHORITY Statementof Revenues, Expenses, and Changes in Fund Net Position
Proprietary Funds
For the Year ended June 30, 2016
(In thousands)
VTA
Transit
Measure B
Transit
Express
Lanes
2000
Measure A
BART
Operating
Joint
Development Total
Internal
Service
Fund
OPERATING REVENUES:
Passenger fares 37,663$ -$ -$ -$ -$ -$ 37,663$ -$
Toll revenues collected - - 1,274 - - - 1,274 -
Advertising and other 3,379 - - - - - 3,379 -
Charges for services - - - - - - - 14,648
Total Operating Revenues 41,042 - 1,274 - - - 42,316 14,648
OPERATING EXPENSES:
Labor cost 309,510 - - - - - 309,510 -
Materials and supplies 32,005 - - - - - 32,005 -
Services 32,208 - 940 - 144 155 33,447 -
Utilities 8,919 - 2 - - - 8,921 -
Casualty and liability 4,923 - - - - - 4,923 -
Purchased transportation 21,477 - - - - - 21,477 -
Leases and rentals 919 - - - - - 919 -
Miscellaneous 2,093 - 2 - - 16 2,111 2,200
Depreciation expense 62,386 - - - - - 62,386 -
Costs allocated to capital and other programs (32,039) - - - - - (32,039) -
Claims and change in future claims estimates - - - - - - - 12,999
Total Operating Expense 442,401 - 944 - 144 171 443,660 15,199
Operating Income/(Loss) (401,359) - 330 - (144) (171) (401,344) (551)
NON-OPERATING REVENUES (EXPENSES):
Sales tax revenue 205,418 - - 205,636 49,262 - 460,316 -
Measure A operating assistance 37,954 - - (37,954) - - - -
Federal operating assistance and other grants 4,105 - - - - - 4,105 -
Federal subsidy for Build America Bonds - - - 8,748 - - 8,748 -
State and local operating assistance grants 114,135 - - - - - 114,135 -
Caltrain subsidy (8,414) - - - - - (8,414) -
Capital expense on behalf of, and contribution
to other agencies (7,462) (4,776) - (40,856) - - (53,094) -
Altamont Commuter Express subsidy (3,166) - - - - - (3,166) -
Investment earnings 5,287 (1) 43 9,644 2,981 539 18,493 609
Interest expense (7,485) - - (3,845) - - (11,330) -
Measure A repayment obligations 15,007 - - (15,007) - - - -
Other income 2,072 - - 366 - 475 2,913 422
Other expense (1,817) - - (2,360) - - (4,177) -
Total Non-operating Revenues (Expenses) 355,634 (4,777) 43 124,372 52,243 1,014 528,529 1,031
Income (loss) before capital
contributions (45,725) (4,777) 373 124,372 52,099 843 127,185 480
Capital grants and contributions 11,175 4,082 - 255,800 - - 271,057 -
Transfer in/(out) 813 (813) - - - - - -
Change in net position (33,737) (1,508) 373 380,172 52,099 843 398,242 480
Net Position, beginning of year 2,011,521 2,484 1,991 1,798,262 135,416 28,366 3,978,040 (7,173)
Net Position, end of year 1,977,784$ 976$ 2,364$ 2,178,434$ 187,515$ 29,209$ 4,376,282$ (6,693)$
Reconciliation of the Statement of Revenues, Expenses & Changes in Fund Net Position to the Statement of Activities:
Change in net position of the Enterprise Funds 398,242$
Change in net position of the Internal Service Fund, which benefits Business-type Activities 480
Change in net position of Business-type Activities (Page 2-23) 398,722$
Enterprise Funds

See Accompanying Notes to Basic Financial Statements 2- 27
SANTA CLARA VALLEY TRANSPORTATION AUTHORITY Statement of Cash Flows
Proprietary Funds
For the Year Ended June 30, 2016
(In thousands)
VTA Transit
Measure B
Transit Express Lanes
2000
Measure A
BART
Operating
Joint
Development
Total
Enterprise
Funds
Internal
Service
Fund
CASH FLOWS FROM OPERATING ACTIVITIES
Cash received from passenger fares 36,939$ -$ -$ -$ -$ -$ 36,939$ -$
Cash received from Tolls - - 1,238 - - - 1,238 -
Cash received from advertising 2,896 - - - - - 2,896 -
Cash paid to employees (260,259) - - - - - (260,259) -
Cash paid to suppliers (87,091) - (944) - (144) (171) (88,350) -
Cash paid for purchased transportation (21,477) - - - - - (21,477) -
Cash received from contributions - - - - - - - 14,648
Payments made to beneficiaries - - - - - - - (19,299)
Payments made to third party contractors - - - - - - - (738)
Other receipts/(payments) - - 89 - 16 - 105 -
Net cash provided by/(used in) operating activities (328,992) - 383 - (128) (171) (328,908) (5,389)
CASH FLOWS FROM NONCAPITAL FINANCING ACTIVITIES
Operating grants received 137,641 - - 8,748 - - 146,389 -
Sales tax received 206,280 - - 206,471 49,503 - 462,254 -
Measure A operating assistance 38,108 - - (38,108) - - - -
Measure A repayment obligations 15,007 - - (15,007) - - - -
Caltrain subsidy (8,414) - - - - - (8,414) -
Altamont Corridor Express subsidy (3,166) - - - - - (3,166) -
Capital contributions to other agencies (7,461) - - (41,210) - - (48,671) -
Net cash provided by/(used in) non-capital financing activities 377,995 - - 120,894 49,503 - 548,392 -
CASH FLOWS FROM CAPITAL AND RELATED FINANCING ACTIVITIES
Payment of long-term debt (14,310) - - (26,965) - - (41,275) -
Advance (to)/from other governments 34,760 (80) - (15,451) - - 19,229 -
Interest and other fees paid on long-term debt (8,150) - - (6,917) - - (15,067) -
Acquisition and construction of capital assets (26,424) (672) - (462,014) - (256) (489,366) -
Capital contribution from other entities 11,988 - - 242,665 - 591 255,244 441
Net cash provided by/(used in) capital and related financing activities (2,136) (752) - (268,682) - 335 (271,235) 441
CASH FLOWS FROM INVESTING ACTIVITIES
Proceeds from sale of investments 742,751 - 5,398 1,454,281 362,409 67,768 2,632,607 133,315
Purchase of investments (737,918) - (5,975) (1,338,024) (417,607) (68,459) (2,567,983) (129,022)
Interest income received 3,229 - 29 7,088 1,966 385 12,697 429
Net cash provided by/(used in) investment activities 8,062 - (548) 123,345 (53,232) (306) 77,321 4,722
NET INCREASE/( DECREASE) IN CASH AND CASH EQUIVALENTS 54,929 (752) (165) (24,443) (3,857) (142) 25,570 (226)
CASH AND CASH EQUIVALENTS, BEGINNING OF YEAR 4,567 2,326 297 95,697 9,376 373 112,636 683
CASH AND CASH EQUIVALENTS, END OF YEAR 59,496$ 1,574$ 132$ 71,254$ 5,519$ 231$ 138,206$ 457$

See Accompanying Notes to Basic Financial Statements 2- 28
SANTA CLARA VALLEY TRANSPORTATION AUTHORITY Statement of Cash Flows (Continued)
Proprietary Funds
For the Year Ended June 30, 2016
(In thousands)
VTA Transit
Measure B
Transit Express Lanes
2000
Measure A
BART
Operating
Joint
Development
Total
Enterprise
Funds
Internal
Service
Fund
RECONCILIATION OF OPERATING INCOME (LOSS) TO NET
CASH PROVIDED BY/(USED IN) OPERATING ACTIVITIES:
Operating income/(loss) (401,359)$ -$ 330$ -$ (144)$ (171)$ (401,344)$ (551)$
Adjustments to reconcile operating income (loss) to
net cash used in operating activities:
Depreciation 62,386 - - - - - 62,386 -
Changes in operating assets and liabilities:
Other current assets 910 - - - - - 910 -
Receivables (552) - (36) - - - (588) -
Due from other agencies - - - - - - - -
Inventories (9,970) - - - - - (9,970) -
Accounts payable 2,712 - 89 - 16 - 2,817 -
Other accrued liabilities 17,455 - - - - - 17,455 (4,838)
Deposits from others 82 - - - - - 82 -
Unearned revenue (656) - - - - - (656) -
Net cash provided by/(used in) operating activities (328,992)$ -$ 383$ -$ (128)$ (171)$ (328,908)$ (5,389)$
Reconciliation of cash and cash equivalents to the Statement of Fund Net Position:
Unrestricted:
Cash and cash equivalents 57,603$ -$ 132$ -$ -$ 231$ 57,966$ 457$
Restricted:
Cash and cash equivalents - 1,574 - 472 5,519 - 7,565 -
Cash and cash equivalents with fiscal agent 1,893 - - 70,782 - - 72,675 -
59,496$ 1,574$ 132$ 71,254$ 5,519$ 231$ 138,206$ 457$
NONCASH ACTIVITIES:
Increase/(Decrease) in fair value of investments 2,341$ -$ 18$ 3,719$ 1,308$ 212$ 7,598$ 179$
Noncash capital contributions (653) - - 2,818 - - 2,165 -
Amortization expense of Caltrain Access Fee - - - (881) - - (881) -
Total non-cash activities 1,688$ -$ 18$ 5,656$ 1,308$ 212$ 8,882$ 179$

See Accompanying Notes to Basic Financial Statements 2-29
SANTA CLARA VALLEY TRANSPORTATION AUTHORITY Balance Sheet
Governmental Funds
June 30, 2016
(In thousands)
Special
Revenue
Fund
Congestion
Management
Program
Congestion
Management
& Highway
Program
Measure B
Highway
Program
Total
Governmental
Funds
ASSETS
Restricted assets:
Cash and cash equivalents 211$ 13,230$ 946$ 14,387$
Cash with fiscal agent - 50 - 50
Investments 722 - - 722
Due from other agencies 635 3,532 - 4,167
TOTAL ASSETS 1,568$ 16,812$ 946$ 19,326$
LIABILITIES
Liabilities payable from restricted assets:
Accounts payable 285$ 1,425$ 25$ 1,735$
Due to other funds 17 248 4 269
Due to other agencies 109 15,139 917 16,165
TOTAL LIABILITIES 411 16,812 946 18,169
FUND BALANCES Restricted for congestion management program 1,157 - - 1,157
TOTAL LIABILITIES AND FUND BALANCES 1,568$ 16,812$ 946$ 19,326$
Capital Projects Funds

See Accompanying Notes to Basic Financial Statements 2-30
SANTA CLARA VALLEY TRANSPORTATION AUTHORITY Statement of Revenues, Expenditures, and Changes in Fund Balances
Governmental Funds
For the Year ended June 30, 2016
(In thousands)
Special
Revenue Fund
Congestion
Congestion Management Measure B Total
Management & Highway Highway Governmental
Program Program Program Funds
REVENUES:
Assessment to member agencies 2,407$ -$ -$ 2,407$
Federal grant revenues 1,887 1,721 - 3,608
Administrative fees 122 - - 122
State and local operating grants 699 12,095 183 12,977
Other revenues 155 - - 155 Investment earnings 16 - - 16
TOTAL REVENUES 5,286 13,816 183 19,285
EXPENDITURES:
Congestion Management:
VTA labor and overhead costs 4,221 2,810 - 7,031
Professional services 1,176 - - 1,176
Material and services 21 - - 21
Contribution to agencies 210 - - 210
Capital expenditures on behalf of other agencies - 11,006 183 11,189
TOTAL EXPENDITURES 5,628 13,816 183 19,627
NET CHANGE IN FUND BALANCES (342) - - (342)
FUND BALANCES, BEGINNING OF YEAR 1,499 - - 1,499
FUND BALANCES, END OF YEAR 1,157$ -$ -$ 1,157$
Capital Projects Funds

See Accompanying Notes to Basic Financial Statements 2-31
SANTA CLARA VALLEY TRANSPORTATION AUTHORITY Statement of Fiduciary Net Position
Fiduciary Funds
June 30, 2016
(In thousands)
ATU Pension,
ATU Medical
& OPEB Trust
Funds
Agency
Funds
ASSETSRestricted assets:
Cash and Cash Equivalents 2,260$ 2,742$ Corporate Bond 99,715 - U.S. Government Securities 18,988 - U.S. Agency notes 62,751 - Equity Based 118,374 - Mutual Funds 470,638 - Money Market Funds 4,297 - Investment Pool 543 28,168 Receivables 4,127 - Prepaid Expenses 18 - Due from other agencies 11 -
TOTAL ASSETS 781,722$ 30,910$
LIABILITIES - - Liabilities payable from restricted assets:
Deferred pension contribution 35$ -$ Accounts payable 1,123 341
Program payable - 30,569
TOTAL LIABILITIES 1,158 30,910$
NET POSITIONRestricted for:
ATU Pension benefits 481,318 Retiree medical benefits 275,600 ATU Retiree spousal medical benefits 13,904
ATU Retiree dental and vision benefits 9,742
TOTAL NET POSITION 780,564$
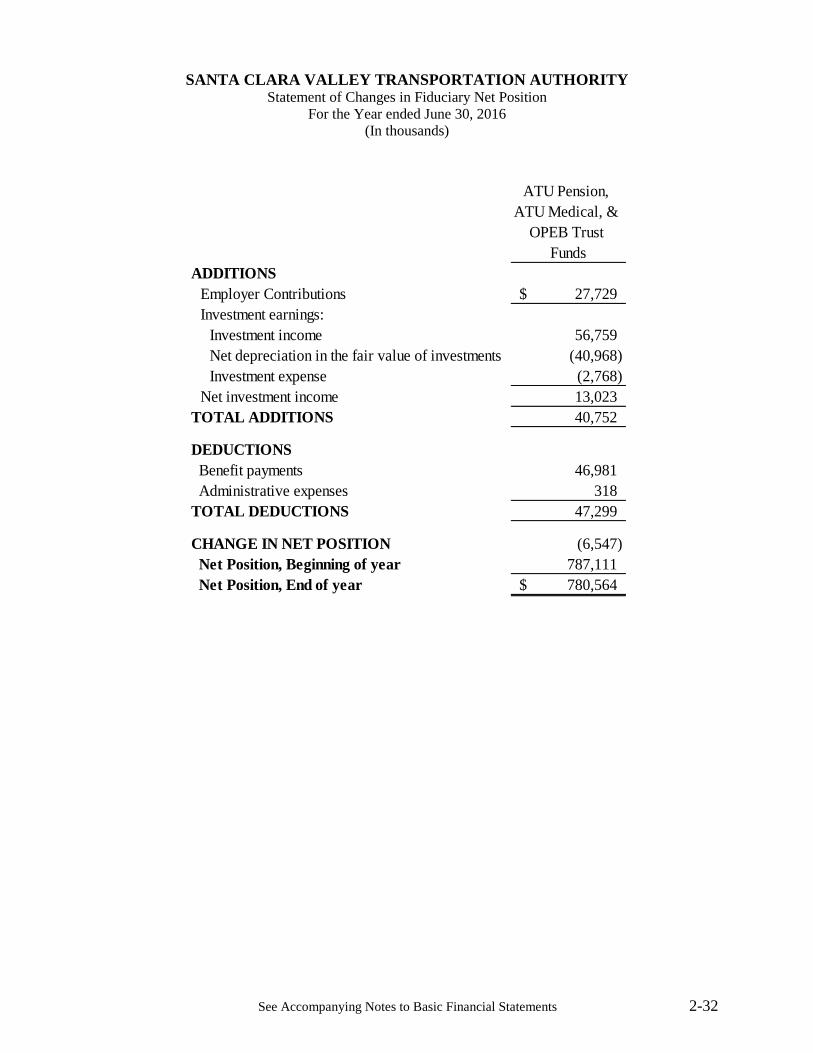
See Accompanying Notes to Basic Financial Statements 2-32
SANTA CLARA VALLEY TRANSPORTATION AUTHORITY Statement of Changes in Fiduciary Net Position
For the Year ended June 30, 2016
(In thousands)
ATU Pension,
ATU Medical, &
OPEB Trust
Funds
ADDITIONS
Employer Contributions 27,729$
Investment earnings:
Investment income 56,759
Net depreciation in the fair value of investments (40,968)
Investment expense (2,768)
Net investment income 13,023
TOTAL ADDITIONS 40,752
DEDUCTIONS
Benefit payments 46,981
Administrative expenses 318
TOTAL DEDUCTIONS 47,299
CHANGE IN NET POSITION (6,547)
Net Position, Beginning of year 787,111
Net Position, End of year 780,564$

THIS PAGE IS INTENTIONALLY LEFT BLANK

NOTES TO THE BASIC FINANCIAL
STATEMENTS

THIS PAGE IS INTENTIONALLY LEFT BLANK

2-33
NOTE 1 – THE FINANCIAL REPORTING ENTITY
Santa Clara Valley Transportation Authority (VTA), which was established in 1972,
develops, maintains, and operates a public mass transit system for the benefit of the
residents of the County of Santa Clara (County), California (State). VTA’s governing board
consists of two members of the County Board of Supervisors, five City Council members
from the City of San Jose, and five City Council members selected from among the
remaining incorporated cities in the County.
The accompanying basic financial statements also include the financial activities of the
Santa Clara Valley Transportation Authority Amalgamated Transit Union (ATU) Pension
Plan and the Other Post Employment Benefit Plan (the Plans) in the Trust Funds. The
financial activities of the Plans are included in the basic financial statements because they
exclusively serve the employees of VTA. Due to the fact that the Plans are fiscally
dependent on VTA, they are considered trust funds by VTA.
The Santa Clara Valley Transportation Authority Congestion Management Program (CMP)
was created in 1990 in response to Proposition 111. The CMP is not legally separate from
VTA. The CMP is responsible for the development and implementation of the Valley
Transportation Plan (VTP), the long-range transportation and land use plan for the County,
and for preparing and implementing the state-mandated CMP. It is also responsible for the
programming and oversight of discretionary federal, state, and local funds, and for serving
as the program manager for certain countywide grant funds, including the Transportation
Fund for Clean Air (TFCA) and 1996 Measure B Transportation Improvement Program’s
(MBTIP) Ancillary Program. Annual contributions from 17 member agencies are based on
a formula adopted by the VTA Board of Directors. The contribution formula considers
each member agency’s share of Proposition 111, state gas tax monies, as well as
employment within the County. The CMP is included as a major governmental fund in the
accompanying basic financial statements.
NOTE 2 – SUMMARY OF SIGNIFICANT ACCOUNTING POLICIES
(a) Basis of Presentation
Government-wide Financial Statements - The Statement of Net Position and
Statement of Activities display information about VTA as a whole. These statements
include the financial activities of the overall government, except for fiduciary
activities. Eliminations have been made to minimize the double counting of internal
activities. These statements distinguish between the business-type and governmental
activities of VTA. Business-type activities, which normally rely to a significant extent

2-34
on fees charged to external parties, are reported separately from governmental
activities, which normally are supported by taxes and inter-governmental revenues.
The statement of activities presents a comparison between direct expenses and
program revenues for the business-type and governmental activities. Direct expenses
are those that are specifically associated with a program or function and; are,
therefore, clearly identifiable to a particular function. Program revenues include: 1)
charges paid by the recipients of goods or services offered by the programs and 2)
grants and contributions that are restricted to meeting the operational or capital
requirements of a particular program. Revenues that are not classified as program
revenues, including all taxes, are presented as general revenues.
Fund Financial Statements - The fund financial statements provide information about
VTA’s funds, including fiduciary funds. Separate statements for each fund category –
proprietary, governmental, and fiduciary – are presented. The emphasis of fund
financial statements is on the major governmental and the enterprise funds, each
displayed in separate columns.
The Proprietary Funds are used to account for activities for which a fee is charged to
external or internal users for goods or services. VTA reports the following Enterprise
Funds:
The VTA Transit Fund is used accounts for the transit operations of VTA. The
primary sources of funding for transit operations are the TDA, one-half cent
sales tax, farebox collections, and federal/state grants.
The Measure B Transit Fund is used to account for sales tax collected from all
the 1996 Measure B Transit Improvement Program.
The Measure A Fund is used to account for the 2000 Measure A Transit
Improvement Program funded through one-half cent sales tax as approved in
an election by voters of County of Santa Clara requiring that sales tax revenues
be expended on projects included in the scope of 2000 Measure A.
The BART Operating Fund is used to account for the 1/8-cent sales tax
approved in an election by voters of County of Santa Clara requiring that sales
tax revenues be expended on operations, maintenance, improvement and future
capital needs of the 16.1 mile VTA’s BART Silicon Valley Extension.
The Express Lanes Fund is used to account for operations of the 237/880
Express Lanes. The primary source of funding for the operations is toll
revenues.
The Joint Development Fund is used to set aside the proceeds generated from
VTA’s Joint Development Program, whose mission is to maximize the

2-35
economic value of the agency’s real estate assets through site-appropriate
development. The aggregated funds may be appropriated for the continued
operation and development of VTA through formal action by the VTA Board
of Directors.
Additionally, VTA reports on Internal Service Fund. The fund is used to account for
compensated absences and risk management activities of VTA, which are managed
through a combination of purchased insurance and self-insurance.
The Governmental Funds are used to account for VTA’s general governmental activities
where the proceeds of specific revenue sources are legally restricted to expenditures for
specific purposes and for the acquisition of capital assets or construction of major capital
projects (other than those financed by the Enterprise Funds).
The Congestion Management Program Special Revenue Fund is used to
account for the congestion management planning, programming, and
development services for Santa Clara County. Major sources of revenue for
this fund are member agency assessments, and federal and state grants.
The Congestion Management and Highway Program Capital Projects Fund is
used to account for the acquisition of capital assets and construction of
highway projects administered on behalf of State and other local governments
(other than those accounted for in the Measure B Highway Program Capital
Projects Fund).
The Measure B Highway Program Capital Projects Fund is used to account
for acquisition of capital assets or construction of Measure B Highway
projects.
The Fiduciary Funds are used to account for assets held by VTA as a trustee or as an
agent for others and which assets cannot be used to support its own programs. This
includes VTA’s trust and agency funds as follows:
VTA Trust Funds include retiree funds namely VTA/ATU Pension Plan, Other
Post-Employment Benefits Trust (OPEB), ATU Spousal Medical, and Retiree
Dental/Vision Plan.
VTA Agency Funds include:
Bay Area Air Quality Management District (BAAQMD) which
accounts for the activities that relate to the Transportation Fund for
Clean Air (TFCA) program.

2-36
Senate Bill (SB) 83 Vehicle Registration Fund (VRF) was established
to administer the vehicle registration fee collected under SB 83 and
approved by voters in 2010.
Measure B Ancillary Program was established to administer the 1996
Measure B funds.
(b) Basis of Accounting and Measurement Focus
The government-wide, business-type activities, proprietary funds, and fiduciary trust
funds financial statements are reported using the accrual basis of accounting and the
economic resources measurement focus. Revenues are recorded when earned and
expenses are recorded at the time liabilities are incurred, regardless of when the
related cash flows take place. Non-exchange transactions in which VTA gives (or
receives) value without directly receiving (or giving) equal value in exchange, include
sales tax and grants. Revenues from sales tax are recognized when the underlying
transactions take place. Therefore, recorded sales taxes include an accrual for
amounts collected by the State Board of Equalization but not remitted to VTA at the
end of the fiscal year. Revenues from grants are recognized in the fiscal year in which
all eligibility requirements have been satisfied. Eligibility requirements for the
purchase of right-of-way are considered met once the acquisition has settled.
Fiduciary trust funds are also reported using accrual basis of accounting and the
economic resources measurement focus. Agency funds have no measurement focus.
VTA’s operating revenues are generated directly from its transit operations and
consist principally of passenger fares. Operating expenses for the transit operations
include all costs related to providing transit services. These costs include labor, fringe
benefits, materials, supplies, services, utilities, leases and rentals, purchased
transportation, and depreciation on capital assets. All other revenue and expenses not
meeting these definitions are reported as non-operating revenues and expenses.
Governmental funds are reported using the current financial resources measurement
focus and the modified accrual basis of accounting. Under this method, revenues are
recognized when measurable and available. Interest earnings, certain state and federal
grants, and charges for services are accrued if their receipts occur within 180 days
after the end of the accounting period so as to be both measurable and available.
Expenditures are generally recorded when a liability is incurred, as under accrual
accounting.
(c) Cash and Investments
VTA contracts with money management firms to manage most of its investment
portfolio. VTA’s investment program manager has oversight responsibility for

2-37
investments managed by these firms. The securities are held by a third-party custodial
bank. Purchases and sales of securities are reflected on the trade date. Investment
income is recognized as earned.
The remaining cash balances in certain VTA funds are invested in the Local Agency
Investment Fund (LAIF). Unless there are specific legal or contractual requirements
for specific allocations, income earned or losses arising from investments are
allocated on a monthly basis to the appropriate fund(s) based on their average daily
balances.
Cash and cash equivalents include cash on hand, demand deposits, and short-term
investments, which are readily convertible to known amounts of cash. Restricted and
unrestricted cash, and cash equivalents and cash and investments with fiscal agents
are considered to be cash and cash equivalents for purposes of the accompanying
statement of cash flows. Access to cash and investments with fiscal agents is similar
to that of a demand deposit account and, therefore, investments are considered to be
cash equivalents.
VTA has reported its investments at fair value based on quoted market information,
from its fiscal agent for actively managed accounts and from management firms for
commingled accounts.
The fair value of VTA’s investments commingled in LAIF state pool is based on
VTA’s cash positions in the commingled accounts as of the end of the fiscal year.
(d) Inventories
Inventories are valued at cost using the weighted average method, which
approximates market. They are charged to expense at the time individual items are
withdrawn from inventory (consumption method). Inventory consists primarily of
parts and supplies relating to the maintenance of transportation vehicles and facilities.
(e) Restricted Assets
Restricted assets consist of monies and other resources, the use of which are legally
restricted for capital and operating, as well as debt service and funds swap/lease
collateral.
(f) Bond Discounts, Premiums, and Bond Refunding Gains/Losses
Bond refunding gains/losses for the government-wide statement of net position and
the enterprise funds are reported as deferred inflow/outflow of resources and
amortized on a straight line basis over a period equal to the term of the related bond.

2-38
The discounts and premiums are amortized using the effective interest rate method.
Government-wide and enterprise fund bond discounts and premiums are presented as
a reduction and addition, respectively, of the face amount of bonds payable.
(g) Capital Assets
It is VTA’s policy that assets with a value of $5,000 or more, and a useful life beyond
one year are capitalized, and included in the capital asset accounting system and
depreciated over their estimated useful lives. Property, facilities, and equipment are
stated at historical cost. Normal maintenance and repair costs are charged to
operations as incurred. Improvements are capitalized and depreciated over the
remaining useful lives of the related assets.
Depreciation is computed using the straight-line method over estimated useful lives
as follows:
Asset being Depreciated Useful Life
Buildings, improvements, furniture, and fixtures 5 to 50 years
Vehicles (excluding light-rail vehicles) 5 to 12 years
Light-rail tracks, electrification, and light-rail vehicles 25 to 45 years
Leasehold improvements 10 to 35 years
Other operating equipment 5 to 10 years
Depreciation on such assets is included in the accompanying statement of activities
and enterprise statement of revenues, expenses, and changes in fund net position.
Interest is capitalized on construction in progress. Accordingly, interest that is
capitalized is the total interest cost from the date of the borrowing until the specified
asset is ready for its intended use. In the current year, VTA capitalized total interest
expense and other bond charges of $44 million relating to the Measure A Transit
Improvement Projects.
(h) Vacation and Sick Leave Benefits
It is the policy of VTA to permit employees to accumulate unused vacation and sick
leave benefits up to the limit designated in the various collective bargaining
agreements. As vacation and sick leave are used during the year, they are reported as
expenses. Additionally, there is an amount charged each month to accrue the
estimated increase in unused vacation and sick leave. The balance reflecting the year-
end value of unused vacation and sick leave is reported in the Internal Service Fund.

2-39
(i) Self-Insurance
VTA retains $3 million in self-insurance for general liability and completely self-
insures workers’ compensation claims. Estimated losses on claims other than
workers’ compensation claims are charged to expense in the period the loss is
determinable. Estimated losses for workers’ compensation claims are charged to
expense as a percentage of labor in each accounting period. The costs incurred for
workers’ compensation and general liability (including estimates for claims incurred
but not yet reported) are reported in the Internal Service Fund based on an actuarial
determination of the present value of estimated future cash payments (see Notes 14
and 16).
(j) Net Position
The government-wide and proprietary funds financial statements utilize a net position
presentation. Net Position is categorized as net investment in capital assets, restricted,
and unrestricted.
Net Investment in Capital Assets - This category groups all capital assets,
including infrastructure and intangibles, into one component of net position.
Accumulated depreciation and the outstanding balances of debt that are
attributable to the acquisition, construction, or improvement of these assets reduce
the balance in this category.
The Statement of Fund Net Position as of June 30, 2016, on pages 2-24 and 2-25
reports that enterprise fund net position invested in capital assets (net of related
debt) is $3.4 billion.
Restricted Net Position - This category consists of debt service collateral,
Swap/lease collateral, amounts restricted for Measure B Transit, 2000 Measure A
capital programs, BART Operating, and Congestion Management Program.
The Statement of Fund Net Position on pages 2-24 and 2-25 reports that
enterprise funds restricted net position amount to $789 million as of June 30,
2016, of which $578.6 million and $187.5 million are restricted by enabling
legislation for the 2000 Measure A Sales Tax and BART Operating Sales Tax
programs, respectively. The 2000 Measure A half-cent sales tax was approved by
Santa Clara County voters to fund certain transportation-related projects. The
BART Operating 1/8-cent sales tax is dedicated to the operation, maintenance,
improvement, and future capital needs of the BART Silicon Valley Extension.
When both restricted and unrestricted net positions are available, unrestricted
resources are used only after the restricted resources are depleted.

2-40
Unrestricted Net Position The remaining unrestricted net position, although not
legally restricted, have been earmarked for future capital and operating needs, as
well as for other purposes in accordance with Board directives. Unrestricted Net
Position earmarks within proprietary funds consist of the following (in
thousands):
VTA Transit
Fund
Express Lanes
Fund
Joint
Development
Fund
Total
Enterprise
Funds
Internal
Service
Fund
Local share of capital projects 132,225$ -$ 1,804$ 134,029$ -$
Debt reduction 76,378 - - 76,378 -
Express Lane - 2,364 - 2,364 -
Joint Development - - 26,909 26,909 -
Irrevocable transfer made to OPEB trust fund 15,865 - - 15,865 -
Sales Tax stabilization 35,000 - - 35,000 -
Operating reserve 64,147 - - 64,147 -
Inventory and prepaid expenses 33,615 - - 33,615 -
Workers' Compensation, General Liability &
Compensated Absences - - - - (6,693)
Net Pension Liability (GASB 68)* (195,565) - - (195,565) -
Total 161,665$ 2,364$ 28,713$ 192,742$ (6,693)$
Proprietary Funds
*Represents amount owed by VTA for benefits provided through a defined benefit pension plan (net of related deferred
inflows/outflows). This consists of $80.6 million for CalPERS and $115 million for ATU.
(k) Cost Allocated to Capital and Other Programs
On the Statement of Revenues, Expenses, and Changes in Fund Net Position, the
VTA Transit Fund reports $32 million as costs allocated to capital and other
programs. This amount represents a credit for direct and indirect labor and associated
fringe benefits, reproduction and mileage costs, and other costs that were capitalized
as construction in progress.
(l) Estimates
VTA’s management has made a number of estimates and assumptions relating to the
reporting of assets and liabilities, revenues, expenses, and the disclosure of contingent
liabilities to prepare the basic financial statements in conformity with GAAP. Actual
results could differ from those estimates.
(m) Fund Balance - Governmental Funds
The Congestion Management Program Fund balance is classified as restricted. These
are amounts that can be spent only for specific purposes because of enabling
legislation or constraints that are externally imposed by creditors, grantors,
contributors, or the laws or regulations of other governments.

2-41
(n) Spending Order Policy
When expenses are incurred for purposes for which both restricted and unassigned
fund balances are available, VTA considers restricted funds to have been spent first.
(o) Intangible Assets
These refer to the $10 million payment made to Union Pacific Rail Road in January
2005 for Caltrain right-of-way access right. This asset is amortized for 15 years.
(p) Transfers In/(Out)
The Transfers represent the interfund transactions between funds. During FY 2016,
there was a transfer of assets from Measure B Transit Fund to VTA Transit Fund in
the amount of $813 thousand for land infrastructure relating to Vasona Project.
(q) New Accounting Pronouncements
In February 2015, the GASB issued Statement No. 72, Fair Value Measurement
and Application. This Statement addresses accounting and financial reporting issues
related to fair value measurements. The definition of fair value is the price that
would be received to sell an asset or paid to transfer a liability in an orderly
transaction between market participants at the measurement date. This Statement
provides guidance for determining a fair value measurement for financial reporting
purposes. This Statement also provides guidance for applying fair value to certain
investments and disclosures related to all fair value measurements. VTA has
implemented the provisions of this Statement as of June 30, 2016.
In June 2015, the GASB issued Statement No. 76, The Hierarchy of Generally
Accepted Accounting Principles for State and Local Governments. The objective of
this Statement is to identify—in the context of the current governmental financial
reporting environment—the hierarchy of generally accepted accounting principles
(GAAP). The "GAAP hierarchy" consists of the sources of accounting principles used
to prepare financial statements of state and local governmental entities in conformity
with GAAP and the framework for selecting those principles. This Statement reduces
the GAAP hierarchy to two categories of authoritative GAAP and addresses the use
of authoritative and non-authoritative literature in the event that the accounting
treatment for a transaction or other event is not specified within a source of
authoritative GAAP. VTA has implemented the provisions of this Statement as of
June 30, 2016.
GASB Statement No. 73 – In June 2015, GASB issued Statement No. 73,
Accounting and Financial Reporting for Pensions and Related Assets that are Not
within the Scope of GASB Statement No. 68, and Amendments to Certain Provisions

2-42
of GASB Statements No. 67 and No. 68. The objective of this statement establishes
requirements for those pensions and pension plans that are not administered through
a trust meeting specified criteria. The requirements of the Statement that address
accounting and financial reporting by employers and governmental nonemployer
contributing entities for pensions that are not within the scope of Statement 68 are
effective for financial statements for fiscal years beginning after June 15, 2016, or
the FY 2017. VTA has not determined the effect of the statement.
GASB Statement No. 74 – In June 2015, GASB issued Statement No. 74, Financial
Reporting for Postemployment Benefit Plans Other Than Pension Plans. The
objective of the Statement is to address the financial reports of defined benefit OPEB
plans that are administered through trusts that meet specified criteria. The Statement
requires more extensive note disclosures and RSI related to the measurement of the
OPEB liabilities for which assets have been accumulated. The Statement is effective
for periods beginning after June 15, 2016, or the FY 2017. The pronouncement is
applicable to OPEB plans. VTA has not determined the effect of the statement.
GASB Statement No. 75 – In June 2015, GASB issued Statement No. 75, Accounting
and Financial Reporting for Postemployment Benefits Other than Pensions. The
objective of the Statement is to replace the requirements of GASB Statement No. 45.
In addition, the Statement requires governments to report a liability on the face of the
financial statements for the OPEB provided and requires governments to present
more extensive note disclosures and required supplementary information about their
OPEB liabilities. The Statement is effective for the periods beginning June 15, 2017,
or the FY 2018. VTA has not determined the effect of the statement.
GASB Statement No. 77 – In August 2015, GASB issued Statement No. 77, Tax
Abatement Disclosures. The objective of this Statement is to provide financial
statement users with essential information about the nature and magnitude of the
reduction in tax revenues through tax abatement programs. This GASB statement is
effective with Fiscal Year Ending June 30, 2017. VTA has not determined the effect
of this Statement.
GASB Statement No. 79 – In December 2015, GASB issued Statement No. 79,
Certain External Investment Pools and Pool Participants. The Statement addresses
accounting and financial reporting for certain external investment pools and pool
participants. The Statement establishes criteria for an external investment pool to
qualify for making the election to measure all of its investments at amortized cost for
financial reporting purposes. The Statement establishes additional note disclosure
requirements for qualifying external investment pools that require measure all of their

2-43
investments at amortized cost for financial reporting purposes and for governments
that participate in those pools. Both the qualifying external investment pools and their
participants are required to disclose information about any limitations or restrictions
on participant withdrawals. The Statement is effective for the periods beginning after
June 15, 2015, or the FY 2017, except for certain provisions on portfolio quality,
custodial credit risk, and shadow pricing. VTA has not determined the effect of the
statement.
GASB Statement No. 80 – In January 2016, GASB issued Statement No. 80,
Blending Requirements for Certain Component Units – An Amendment of GASB
Statement No. 14. The objective of the Statement is to improve financial reporting by
clarifying the financial statement presentation requirements for certain component
units. This Statement amends the blending requirements established in paragraph 53
of Statement No. 14, The Financial Reporting Entity, as amended. The additional
criterion requires blending of a component unit incorporated as a not-for-profit
corporation in which the primary government is the sole corporate member. The
Statement is effective for the reporting periods beginning after June 15, 2016, or the
FY 2017. VTA has not determined the effect of the statement.
GASB Statement No. 81 – In March 2016, GASB issued Statement No. 81,
Irrevocable Split–Interest Agreements. The objective of the Statement is to improve
financial reporting for irrevocable split-interest agreements by providing recognition
and measurement guidance for situations in which a government is a beneficiary of
the agreement. The Statement requires that a government that receives resources
pursuant to an irrevocable split-interest agreement recognize assets, liabilities, and
deferred inflows of resources at the inception of the agreement. Furthermore, the
Statement requires that a government recognize assets representing its beneficial
interests in irrevocable split-interest agreements that are administered by a third party,
if the government controls the present service capacity of the beneficial interests. The
Statement requires that a government recognize revenue when the resources become
applicable to the reporting period. The Statement is effective for the reporting periods
beginning after December 15, 2016, or the FY 2018. VTA has not determined the
effect of the statement.
GASB Statement No. 82 – In March 2016, GASB issued Statement No. 82, Pension
Issues – An Amendment of GASB Statements No. 67, No. 68, and No. 73. The
objective of the Statement is to address certain issues that have been raised with
respect to Statements No. 67, Financial Reporting for Pension Plans, No. 68,
Accounting and Financial Reporting for Pensions, and No. 73, Accounting and
Financial Reporting for Pensions and Related Assets That Are Not within the Scope

2-44
of GASB Statement 68, and Amendments to Certain Provisions of GASB Statements
67 and 68. Specifically, the Statement addresses issues regarding (1) the presentation
of payroll-related measures in required supplementary information, (2) the selection
of assumptions and the treatment of deviations from the guidance in an Actuarial
Standard of Practice for financial reporting purposes, and (3) the classification of
payments made by employers to satisfy employee (plan member) contribution
requirements. The Statement is effective for the reporting periods beginning after
June 15, 2016, or the FY 2017. VTA has not determined the effect of the statement.
NOTE 3 - CASH AND INVESTMENTS
Total cash and investments as of June 30, 2016, are reported in the accompanying basic
financial statements as follows (in thousands):
Enterprise
Funds
Internal
Service
Fund
Governmental
Funds
Retiree
Trust
Funds
Agency
Funds Total
Unrestricted:
Cash and Cash Equivalents 57,966$ 457$ -$ -$ -$ 58,423$
Investment 259,379 45,973 - - - 305,352
Total unrestricted 317,345 46,430 - - - 363,775
Restricted:
Cash and Cash Equivalents 7,565 - 14,387 2,260 2,742 26,954
Cash and Cash Equivalents
with Fiscal Agents 72,675 - 50 - - 72,725
Investments 740,309 - 722 775,306 28,168 1,544,505
Total restricted 820,549 - 15,159 777,566 30,910 1,644,184
Total Cash and Investments 1,137,894$ 46,430$ 15,159$ 777,566$ 30,910$ 2,007,959$
As of June 30, 2016 total cash and investments among all funds consisted of the following
(in thousands):
Cash & Cash Equivalents 85,377$
Cash & Cash Equivalents
with Fiscal Agents 72,725
Investments 1,849,857
Total 2,007,959$

2-45
Cash and Cash Equivalents
VTA maintains several checking accounts related to its operations. These checking accounts earn
interest based on the bank’s sweep rate. At June 30, 2016, the carrying amounts of these
cash balances are shown below (in thousands):
Investments
VTA’s investments fall into two categories, i.e. investments related to: (1) government-
wide and agency funds, and (2) trust funds. The first includes investments of operating and
other funds which may be restricted or unrestricted depending on the source of the funds.
The second includes trust funds investments that are held in trust to pay retirement benefits
of ATU, Local 265 Pension Plan, ATU Medical/Dental, and the VTA Retirees’ Other Post-
Employment Benefits trust.
Investment within the government-wide
Government code requires that the primary objective of the trustee is to safeguard the
principal, secondarily meet the liquidity needs of the depositors, and then achieve a
reasonable return on the funds under the trustee’s control. Furthermore, the intent of the
government code is to minimize risk of loss on held investments from:
1. Interest rate risk
2. Credit risk
3. Custodial / counterparty credit risk
4. Concentration of credit risk
VTA’s investment policy covering non-trust funds conforms to state statutes, and provides
written investment guidance regarding the types of investments that may be made and the
amounts which may be invested in any one financial institution or any one long-term
instrument. VTA’s permissible investments include U.S. treasury obligations, obligations
of federal agencies and U.S. government sponsored enterprises, state of California
obligations, local agency obligations, bonds issued by VTA except BABs, bankers’
acceptances, commercial paper, repurchase and reverse repurchase agreements, medium-
term corporate notes, insured savings/money market accounts, negotiable certificates of
deposit, mortgage and asset-back obligations, State of California’s local agency
Operation Account 69,627$
CM&HP Account 13,230
Measure B Account 2,520
Total Deposits 85,377$

2-46
agreements, qualified structured investments, and shares of beneficial interest i.e., mutual
funds) investing in these permissible investments.
VTA’s non-trust portfolio includes asset-backed securities that are invested and managed
by money managers, and includes structured notes that are invested indirectly through the
State Treasurer’s Office Local Agency Investment Fund (LAIF). At June 30, 2016, the
investment in LAIF is $25 million. LAIF is voluntarily commingled within the state of
California Pooled Money Investment Account (PMIA), whose balance at
June 30, 2016, was approximately $75.4 billion. If cash reserves of the state of California
are exhausted, then participation by the State’s General Fund in the PMIA is zero. There is
no correlation between the state’s general fund cash reserves and VTA’s funds on deposit
in the LAIF. None of this amount was invested in derivative instruments. PMIA is not a
Securities and Exchange Commission (SEC) registered pool, but it is required to invest in
accordance with the guidelines established by the California Government Code. The
weighted average maturity of the investments in PMIA on June 30, 2016, was 167 days.
The value of the pool shares investment earnings are paid quarterly based on the average
daily balance. Withdrawals from LAIF are completed on a dollar for dollar basis.
Interest Rate Risk – Interest rate risk is the risk that changes in market interest rates may
adversely affect the fair value of an investment. The longer the maturity of an investment
the greater the sensitivity of its fair value to changes in market interest rates. Of VTA’s
$1.075 billion in operating funds investments, 16.83% of the investments are fixed income
investments with a maturity of less than 1 year and 5.78% are fixed income investments
with a maturity greater than 5 years. VTA’s Investment Policy allows up to 40% of the
operating funds portfolio to be invested in maturities longer than five years.
Credit Risk – Credit risk is the risk of non-payment by the issuer of a bond or other debt
instrument. Even an increase in the perception of risk of non-payment can adversely affect
the value of such an investment. For investment grade fixed income securities, credit
strength is often gauged using credit ratings assigned by one or more nationally recognized
statistical rating organization. VTA’s investment policy governing investment of operating
funds seeks to limit exposure to credit risk by following the California Government Code
and specifying the permitted investments, minimum credit ratings, maximum maturities,
and maximum concentrations. The table on page 2-47 shows the credit quality of VTA’s
investments as of June 30, 2016.

2-47
The following is a summary of the credit quality distribution for investments with credit
exposure as a percentage of total investments as rated by Standard and Poor's:
Ratings
Fair Value
(In Thousands)
Percentages
of Portfolios
AAA 116,281 5.79%
AA+ 700,398 34.88%
AA- 39,027 1.94%
AA 31,032 1.55%
A+ 34,831 1.73%
A- 70,909 3.53%
A 77,613 3.87%
A-1+ 72,727 3.62%
A-1 4,003 0.20%
BBB+ 86,226 4.29%
BBB- 14,595 0.73%
BBB 30,476 1.52%
BB+ 6,216 0.31%
BB- 1,840 0.09%
BB 2,792 0.14%
B+ 9,853 0.49%
B 704 0.04%
Unrated* 708,436$ 35.28%
TOTAL 2,007,959$ 100.00%
*Unrated consists of money market, LAIF pooled investments, and equity securities.
Custodial Credit Risk – Deposits - For deposits, custodial credit risk is the risk that in the
event of a bank failure, some or all of VTA’s deposits might not be returned. To mitigate
this risk, State law requires all deposits to be either insured by the Federal Deposit
Insurance Corporation (FDIC) or collateralized with pledged securities held in the trust
department of the financial institutions. VTA does not have a specific policy with respect to
deposits’ custodial credit risk.
Custodial Credit Risk – Investments – The custodial credit risk for investments is the risk
that, in the event of a failure of the custodian (e.g. broker-dealer), VTA may not be able to
recover the value of its investments or collateral securities that are in the possession of
another party. VTA’s Investment Policy limits exposure to counterparty credit risk by
requiring that all securities owned by VTA be held with “perfected interest” in the name of
VTA by an independent custodian that is a bank trust department and is unrelated to any
other involved counterparty. As of June 30, 2016, VTA believes its counterparty credit risk
exposure is minimal.
Concentration of Credit Risk – Concentration of credit risk is the risk that the failure of any
one issuer or type of investment would place an undue financial burden on VTA. To
mitigate this risk, both the State Government Code and VTA’s Investment Policy places
percentage portfolio concentration limits on many instruments as well as limits on holding

2-48
individual issuer names. Under the Investment Policy certain investments are exempt from
these concentration limits, including investments issued by or explicitly guaranteed by the
U.S. Government, investments in mutual funds, external investment pools, and other
pooled investments.
Certain investments, such as obligations that are backed by the full faith and credit of the
United States Treasury are not subject to credit ratings. The following schedule indicates
the maturity of investments at June 30, 2016 (in thousands):
Investment Type
Less than 1
Year 2-5 Years 6-10 Years
Over
10 Years Fair Value
Corporate Bonds - Commingled1
93,693$ 345,571$ 6,120$ 510$ 445,894$
Corporate Bonds - Pension Plan 3,613 14,133 20,386 25,980 64,112
Corporate Bonds - OPEB Trust 436 6,857 14,222 14,088 35,603
US Government Agency Bonds
Commingled 30,404 193,999 17,664 - 242,067
Pension Plan 17 342 1,893 38,780 41,032
OPEB Trust 1 79 3,311 18,328 21,719
US Treasury
Commingled 31,895 287,649 37,837 - 357,381
Pension Plan 5,992 7,526 - - 13,518
OPEB Trust 2,370 3,100 - - 5,470
Subtotal 168,421 859,256 101,433 97,686 1,226,796
Money Market Funds - Commingled 4,753 - - - 4,753
Money Market Funds - Pension 3,551 - - - 3,551
Money Market Funds - OPEB Trust 746 - - - 746
Cash with Fiscal Agents - Commercial Paper/CD 69,539 - - - 69,539
TOTAL INVESTMENTS with Money Managers 247,010 859,256 101,433 97,686 1,305,385
LAIF 25,000 - - - 25,000
Subtotal 272,010$ 859,256$ 101,433$ 97,686$ 1,330,385
Equity-Based Investments 589,012
Retention Fund at Escrow Agents (Deposits) 3,185
Cash Deposits 1
85,377
TOTAL 2,007,959$
Maturity
1$2.8 million in Retirees, ATU, ATU Spousal Medical Plan are included in these line items.
Major holdings and their portfolio percentage are presented in the table below.
Investment Type
Fair Value
(In Thousands)
Percentages
of Portfolios
Fair Value
(In Thousands)
Percentages of
Portfolios
Treasury Notes 357,381$ 28.98% 18,988$ 2.45%
Federal Home Loan Mortgage Corp. (FHLM) 108,804 8.82% 25,521 3.29%
Federal National Mortgage Association (FNMA) 68,840 5.58% 36,129 4.66%
Federal Home Loan Bank (FNMA) 27,964 2.27% - 0.00%
Other Investments* 507,353 41.14% 689,828 89.04%
Cash/funds with fiscal agents 162,853 13.21% 4,298 0.56%
Total portforlio holdings 1,233,195$ 100.00% 774,764$ 100.00%
Operating Trusts
Major Portfolio Holdings
*Includes
$37.6 million of US Government Agency Bonds

2-49
The following schedule indicates the fair value hierarchy and fair value amounts (in
thousands) for both VTA’s operating fund investments and the trust investments at
June 30, 2016:
Investment Type Level 1 Level 2 Level 3 Fair Value
Corporate Bonds - Commingled1
-$ 445,894$ -$ 445,894$
Corporate Bonds - Pension Plan 1,139 62,109 864 64,112
Corporate Bonds - OPEB Trust - 35,357 246 35,603
US Government Agency Bonds
Commingled - 242,067 - 242,067
Pension Plan - 41,032 - 41,032
OPEB Trust - 21,719 - 21,719
US Treasury
Commingled 357,381 - - 357,381
Pension Plan 13,518 - - 13,518
OPEB Trust 5,470 - - 5,470
Subtotal 377,508 848,178 1,110 1,226,796
TOTAL INVESTMENTS with Money Managers 377,508 848,178 1,110 1,226,796
Equity-Based Investments 118,374 426,792 43,846 589,012
Leveled Investment Total 966,520$ 926,767$ 4,295$ 1,815,808$
Money Market Funds - Commingled 4,753
Money Market Funds - Pension 3,551
Money Market Funds - OPEB Trust 746
Cash with Fiscal Agents - Commercial Paper/CD 69,539
Retention Fund at Escrow Agents (Deposits) 3,185
LAIF 25,000
Cash Deposits 1
85,377
TOTAL 2,007,959$
Fair Value Hierarchy
1$2.8 million in Retirees, ATU, ATU Spousal Medical Plan are included in these line items
Fair Value Measurements
VTA categorizes the fair value measurement of its investments based on hierarchy
established by generally accepted accounting principles.The fair value hierarchy prioritizes
the inputs to valuation techniques used to measure fair value. The hierarchy gives the
highest priority to unadjusted quoted prices that are directly observable in active markets
for identical assets or liabilities (Level 1 measurements) and the lowest priority when
pricing inputs are unobservable (Level 3 measurements). The three levels of the fair value
hierarchy above are described as follows:
Level 1 – Inputs to the valuation methodology are unadjusted quoted prices for identical
assets or liabilities in active markets that the VTA has the ability to access.
Level 2 – Inputs to the valuation methodology include:
Quoted prices for similar assets or liabilities in active markets;
Quoted prices for identical or similar assets or liabilities in inactive markets;
Inputs other than quoted prices that are observable for the asset or liability;

2-50
Inputs that are derived principally from or corroborated by observable market
data by correlation or other means.
Level 3 – Inputs to the valuation methodology are unobservable and significant to the fair
value measurement. Unobservable inputs reflect VTA’s own assumptions about
the inputs market participants would use in pricing the asset or liability
(including assumptions about risk). Unobservable inputs are developed based on
best information in the circumstances and may include VTA’s own data.
Trust Funds Investments
The ATU, Local 265 Pension Plan (Pension Plan), ATU Medical/Dental, and VTA Retiree
Health are administered in accordance with Article XVI, Section 17 of the Constitution of
the State of California. Funds are invested in diversified investment portfolios structured to
minimize risk and maximize return. Each trust has an investment policy adopted by its
respective board.
NOTE 4 – INTERFUND TRANSACTIONS
During FY 2016, there was a transfer of assets from 4000 Measure B Transit Fund to VTA
Transit Fund in the amount of $813 thousand for land infrastructure relating to Vasona
Project.
The composition of interfund balances as of June 30, 2016, is as follows (in thousands):
Due from other funds Due to other funds Amount
VTA Transit Fund Congestion Management & Highway Program Fund 77$ 1
2000 Measure A VTA Transit 197 2
274$
1 Represents mainly labor cost transfer 2 Represents the reduction of Measure A Operating Assistance resulting from fourth quarter true-up of sales tax.
NOTE 5 – DUE FROM AND DUE TO OTHER AGENCIES
Due from other agencies as of June 30, 2016, consisted of the following (in thousands):
Business-Type
Activities
Fiduciary-
Type
Activities Governmental Activities
DUE FROM OTHER AGENCIES
Enterprise
Funds
Fiduciary
Funds
Congestion
Management
Program
Congestion
Management
& Highway
Program Total
Federal Government 40,607$ -$ -$ $ 929 41,536$
State Government 139,386 - 635 699 140,720
Cities and other local agencies 19,762 11 - 1,904 21,677
199,755$ 11$ 635$ 3,532$ 203,933$

2-51
Due from other agencies as of June 30, 2016, is reported in the accompanying basic
financial statements as follows (in thousands):
Business-Type
Activities
Fiduciary-
Type
Activities
ASSETS
Enterprise
Funds
Fiduciary
Funds
Congestion
Management
Program
Congestion
Management
& Highway
Program Total
Current Assets (Unrestricted) 50,070$ -$ -$ $ - 50,070$
Current Assets (Restricted) 149,685 11 635 3,532 153,863
199,755$ 11$ 635$ 3,532$ 203,933$
Governmental Activities
Due to other agencies as of June 30, 2016, consisted of the following (in thousands):
Business-Type
Activities
DUE TO OTHER AGENCIES
Enterprise
Funds
Congestion
Management
Program
Congestion
Management
& Highway
Program
Measure B
Highway
Program Total
Federal 1,006$ -$ -$ -$ 1,006$
State 68,078 - - - 68,078
Caltrain 50 - - - 50
County of Santa Clara 10,420 109 7,645 917 19,091
City of Milpitas 2,678 - 421 - 3,099
City of San Jose 5,972 - 5,306 - 11,278
City of Sunnyvale - - 469 - 469
City of Fremont 50 - - - 50
City of Cupertino - - 1,165 - 1,165
Outreach 541 - - - 541
Santa Clara Valley Water District 9,325 - - - 9,325
Various - - 133 - 133
Total 98,120$ 109$ 15,139$ 917$ 114,285$
Governmental Activities
Due to other agencies as of June 30, 2016, is reported in the accompanying basic financial
statements as follows (in thousands):
Business-Type
Activities
LIABILITIES
Enterprise
Funds
Congestion
Management
Program
Congestion
Management
& Highway
Program
Measure B
Highway
Program Total
Liabilities payable from restricted assets 98,120$ 109$ 15,139$ 917$ 114,285$
Governmental Activities
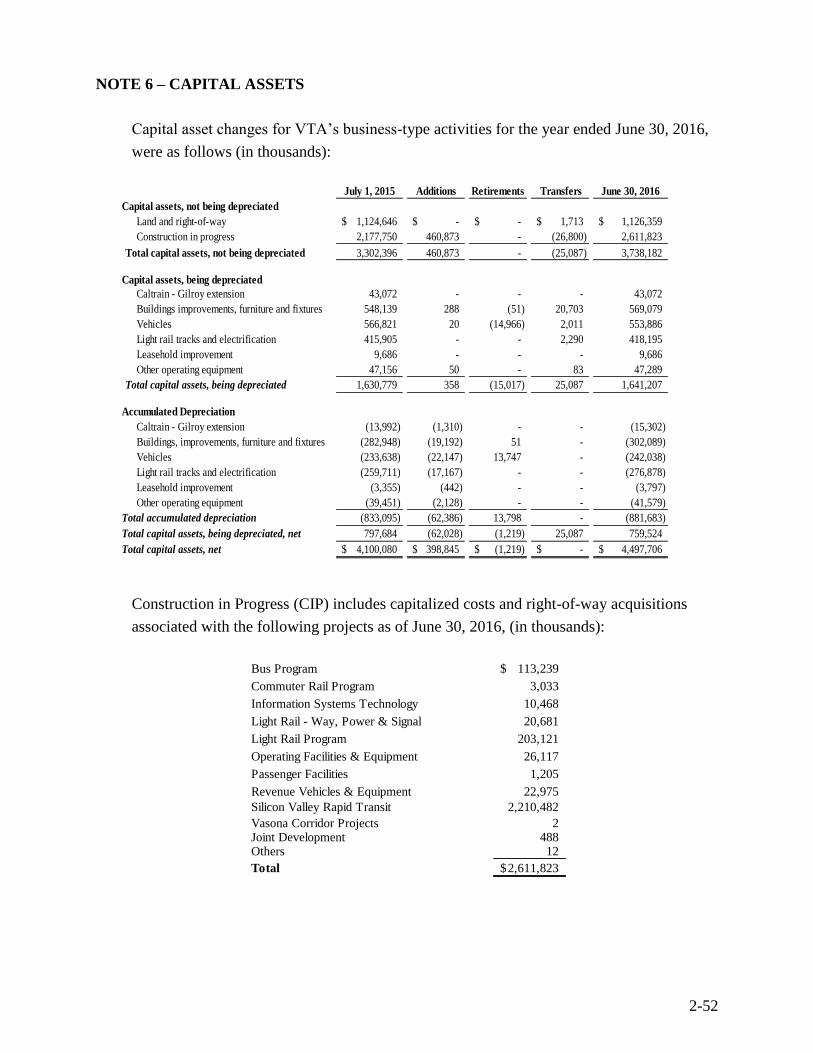
2-52
NOTE 6 – CAPITAL ASSETS
Capital asset changes for VTA’s business-type activities for the year ended June 30, 2016,
were as follows (in thousands):
July 1, 2015 Additions Retirements Transfers June 30, 2016
Capital assets, not being depreciated
Land and right-of-way 1,124,646$ -$ -$ 1,713$ 1,126,359$
Construction in progress 2,177,750 460,873 - (26,800) 2,611,823
Total capital assets, not being depreciated 3,302,396 460,873 - (25,087) 3,738,182
Capital assets, being depreciated
Caltrain - Gilroy extension 43,072 - - - 43,072
Buildings improvements, furniture and fixtures 548,139 288 (51) 20,703 569,079
Vehicles 566,821 20 (14,966) 2,011 553,886
Light rail tracks and electrification 415,905 - - 2,290 418,195
Leasehold improvement 9,686 - - - 9,686
Other operating equipment 47,156 50 - 83 47,289
Total capital assets, being depreciated 1,630,779 358 (15,017) 25,087 1,641,207
Accumulated Depreciation
Caltrain - Gilroy extension (13,992) (1,310) - - (15,302)
Buildings, improvements, furniture and fixtures (282,948) (19,192) 51 - (302,089)
Vehicles (233,638) (22,147) 13,747 - (242,038)
Light rail tracks and electrification (259,711) (17,167) - - (276,878)
Leasehold improvement (3,355) (442) - - (3,797)
Other operating equipment (39,451) (2,128) - - (41,579)
Total accumulated depreciation (833,095) (62,386) 13,798 - (881,683)
Total capital assets, being depreciated, net 797,684 (62,028) (1,219) 25,087 759,524
Total capital assets, net 4,100,080$ 398,845$ (1,219)$ -$ 4,497,706$
Construction in Progress (CIP) includes capitalized costs and right-of-way acquisitions
associated with the following projects as of June 30, 2016, (in thousands):
Bus Program 113,239$
Commuter Rail Program 3,033
Information Systems Technology 10,468
Light Rail - Way, Power & Signal 20,681
Light Rail Program 203,121
Operating Facilities & Equipment 26,117
Passenger Facilities 1,205
Revenue Vehicles & Equipment 22,975
Silicon Valley Rapid Transit 2,210,482
Vasona Corridor Projects 2 Joint Development 488 Others 12
Total 2,611,823$
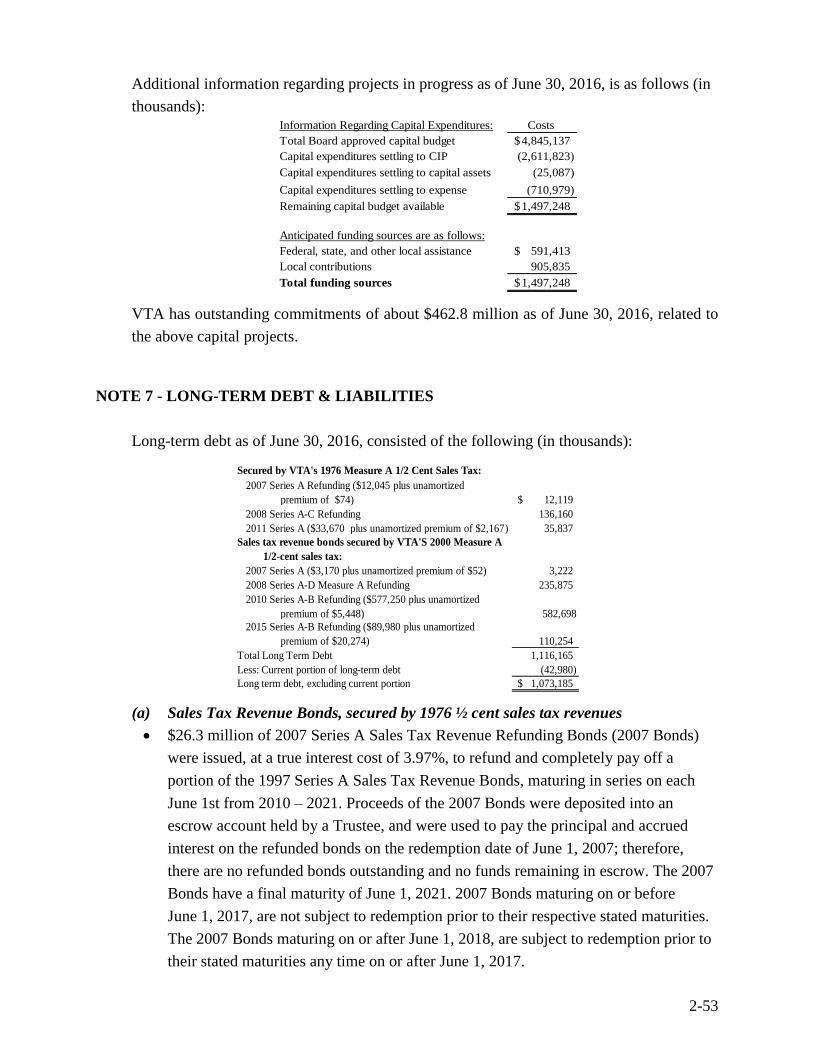
2-53
Additional information regarding projects in progress as of June 30, 2016, is as follows (in
thousands): Information Regarding Capital Expenditures: Costs
Total Board approved capital budget 4,845,137$
Capital expenditures settling to CIP (2,611,823)
Capital expenditures settling to capital assets (25,087)
Capital expenditures settling to expense (710,979)
Remaining capital budget available 1,497,248$
Anticipated funding sources are as follows:
Federal, state, and other local assistance 591,413$
Local contributions 905,835
Total funding sources 1,497,248$
VTA has outstanding commitments of about $462.8 million as of June 30, 2016, related to
the above capital projects.
NOTE 7 - LONG-TERM DEBT & LIABILITIES
Long-term debt as of June 30, 2016, consisted of the following (in thousands):
(a) Sales Tax Revenue Bonds, secured by 1976 ½ cent sales tax revenues
$26.3 million of 2007 Series A Sales Tax Revenue Refunding Bonds (2007 Bonds)
were issued, at a true interest cost of 3.97%, to refund and completely pay off a
portion of the 1997 Series A Sales Tax Revenue Bonds, maturing in series on each
June 1st from 2010 – 2021. Proceeds of the 2007 Bonds were deposited into an
escrow account held by a Trustee, and were used to pay the principal and accrued
interest on the refunded bonds on the redemption date of June 1, 2007; therefore,
there are no refunded bonds outstanding and no funds remaining in escrow. The 2007
Bonds have a final maturity of June 1, 2021. 2007 Bonds maturing on or before
June 1, 2017, are not subject to redemption prior to their respective stated maturities.
The 2007 Bonds maturing on or after June 1, 2018, are subject to redemption prior to
their stated maturities any time on or after June 1, 2017.
Secured by VTA's 1976 Measure A 1/2 Cent Sales Tax:
2007 Series A Refunding ($12,045 plus unamortized
premium of $74) 12,119$
2008 Series A-C Refunding 136,160
2011 Series A ($33,670 plus unamortized premium of $2,167) 35,837
Sales tax revenue bonds secured by VTA'S 2000 Measure A
1/2-cent sales tax:
2007 Series A ($3,170 plus unamortized premium of $52) 3,222
2008 Series A-D Measure A Refunding 235,875
2010 Series A-B Refunding ($577,250 plus unamortized
premium of $5,448) 582,698
2015 Series A-B Refunding ($89,980 plus unamortized
premium of $20,274) 110,254
Total Long Term Debt 1,116,165
Less: Current portion of long-term debt (42,980)
Long term debt, excluding current portion 1,073,185$
2-54
$168.6 million of 2008 Series A-C Sales Tax Revenue Refunding Bonds (2008 VTA
Bonds) were issued to implement a current refunding and completely pay off the
2005 Sales Tax Revenue Refunding Bonds originally issued to finance the retirement
of a portion of 2001 Bonds. There is no escrow fund nor are there 2005 Sales Tax
Revenue Refunding Bonds outstanding. The 2008 VTA Bonds were issued as
variable rate demand bonds and bear interest at a weekly rate, which is determined by
the Remarketing Agent to be the rate necessary to remarket the 2008 VTA Bonds at
par value. The maturities of the 2008 VTA Bonds extend to June 1, 2026, and are
subject to optional and mandatory redemption and optional and mandatory tender for
purchase before maturity.
Concurrent with the issuance and sale of the 2008 VTA Bonds, VTA transferred
interest rate swap agreements (originally entered into concurrent with the issuance of
the retired 2005 Sales Tax Revenue Refunding Bonds). Pursuant to the terms of the
swap agreements, VTA pays interest at a fixed rate of 3.145% to the counterparties to
the swaps. In return, the counterparties pay VTA interest based on a formula (lower
of 1 Month LIBOR1 or a rate equal to the greater of 63.5% of 1 Month LIBOR, or
55.5% of 1 Month LIBOR plus 0.44%). The outstanding principal on the 2008 VTA
Bonds is used as the basis on which the interest payments are calculated. Under
certain circumstances, the agreements are subject to termination before maturity of
the 2008 VTA Bonds.
$47.5 million of 2011 Series A Sales Tax Revenue Refunding Bonds (2011 Bonds)
were issued, at a true interest cost of 2.73%, to refund the 1998 Series A Sales Tax
Revenue Bonds and the 2000 Series A Sales Tax Revenue Bonds (collectively, the
“Refunded Bonds”), maturing in series on each June 1st from 2012 – 2028. The
Refunded Bonds were variable rate bonds, which were issued through the California
Transit Finance Authority. The bonds were refunded in order to reduce bank and
interest rate risk associated with variable rate demand bonds. Proceeds of the 2011
Bonds were deposited into an escrow account held by a Trustee, and were used to pay
the principal and accrued interest on the refunded bonds on the redemption date of
October 5, 2011. There are no 1998 Series A Sales Tax Revenue Bonds or 2000
Series A Sales Tax Revenue Bonds outstanding, and no funds remaining in escrow.
2011 Series A Bonds maturing on or before June 1, 2021, are not subject to
redemption prior to their respective stated maturities. The 2011 Bonds maturing on or
after June 1, 2022, are subject to redemption prior to their stated maturities any time
on or after June 1, 2021.
1 London Inter Bank Offering Rate (LIBOR) is a daily reference rate based on the interest rate at which banks offer to lend unsecured funds to
other banks in the London wholesale (interbank) money market.

2-55
(b) Sales Tax Revenue Bonds, secured by 2000 Measure A ½-cent sales tax revenues
$120.1 million of 2007 Measure A Series A Sales Tax Revenue Refunding Bonds
(2007 Measure A Bonds) were issued, at a true interest cost of 4.60%, to current
refund Series F and G of the 2006 Measure A Sales Tax Revenue Bonds, none of
which remain outstanding. Proceeds of the 2007 Measure A Bonds were deposited
into an escrow account held by a Trustee, and were used to fully pay the principal and
accrued interest on the refunded bonds on the redemption date of November 6, 2007.
There is no open escrow or refunded bonds outstanding. Maturities for the 2007
Measure A Bonds originally extended to April 1, 2036. 2007 Measure A Bonds
maturing on or before April 1, 2017, are not subject to redemption prior to their
respective stated maturities. 2007 Measure A Bonds maturing on or after April 1,
2018 are subject to redemption any time on or after April 1, 2017. In February 2015,
VTA refunded the Measure A 2007 Series A bonds that mature on and after April 1,
2018, by issuing the 2015 Measure A Series A and Series B bonds (see below).
Following the refunding and subsequent payment of the bonds maturing on April 1,
2015 and 2016, the only 2007 Measure A bonds outstanding are those maturing on
April 1, 2017.
$236.7 million of 2008 Series A-D Measure A Sales Tax Revenue Refunding Bonds
(2008 Measure A Bonds) were issued to current refund Series A-D of the 2006
Measure A Sales Tax Revenue Bonds, none of which remain outstanding. The 2008
Measure A Bonds were issued as variable rate demand bonds and bear interest at a
weekly rate, which is determined by the Remarketing Agent to be the rate necessary
to remarket the 2008 Measure A Bonds at par value. The maturities of the 2008
Measure A Bonds extend to April 1, 2036, and are subject to optional and mandatory
redemption and optional and mandatory tender for purchase before maturity.
Concurrent with the issuance and sale of the 2008 Measure A Bonds, four interest
rate swap agreements (originally entered into concurrent with the issuance of the
Series A-D of the 2006 Measure A Sales Tax Revenue Bonds, none of which remain
outstanding) were reassigned to the 2008 Measure A Bonds. Pursuant to the terms of
the swap agreements, VTA pays interest at a fixed rate of 3.765% to the
counterparties to the swaps. In return, the counterparties pay VTA a variable rate of
interest equal to 65% of three-month LIBOR. The outstanding principal is used as the
basis on which the interest payments are calculated. Under certain circumstances, the
agreements are subject to termination before maturity of the 2008 Measure A Bonds.
$645.9 million of 2010 Measure A Bonds were issued, at a true interest cost of
3.54%, to fund certain Measure A transit capital improvement projects, most notably

2-56
the BART Extension to Berryessa. The bonds were issued as a combination of
taxable, Build America Bonds (Series A), and traditional tax-exempt bonds
(Series B). Related to the Series A Build America Bonds, VTA is entitled to receive a
federal subsidy of 35% on its interest cost for the Build America Bonds. However, as
a result of the Federal budget impasse and resulting sequestration of funding, the
subsidy has been reduced by various amounts beginning in 2013 and has most
recently provided a subsidy of about 32.6%. Both bond series are fixed interest
bonds. The bonds have a final maturity date of April 2, 2032. The 2010 Measure A
Bonds, Series A (taxable Build America Bonds) are subject to mandatory and
optional redemption provisions prior to their stated maturity dates. The 2010 Measure
A Bonds Series B (tax-exempt) are not subject to redemption prior to their maturity
date.
$89.98 million of 2015 Measure A Series A-B were issued to current refund the 2007
Measure A Series A bonds maturing on April 1, 2018, or later. The refunding was
done in order to take advantage of the lower interest cost of the refunding bonds. The
refunding bonds were issued at an all-in true interest cost of 2.92%.
(c) Interest Rate Swaps
VTA has seven interest rate swap agreements outstanding as of year-end. Three
require that VTA pay fixed interest rates and receive variable interest at the lower of:
1)1 month LIBOR or, 2) a rate equal to 63.5% of 1 month LIBOR or 55.5% of
1 month LIBOR plus 0.44%, whichever is greater. Four agreements require that VTA
pay fixed interest rates and receive interest at 65% of three-month LIBOR.
Summary
The terms, fair values, and credit ratings of the outstanding swaps as of June 30, 2016
were as follows (dollars in thousands):
Associated
Bonds
Current
Notional
Effective
Date
Fixed Rate
Paid
Variable
Received Fair Value*
Termination
Date
Counterparty
Credit RatingCR
Fair Value
Measurement
Level
2008A 54,520$ 7/7/2005ED
3.145% Cal-EVR
(7,356)$ 6/1/2026 Aa2/AA-/NR†
2
2008B 40,820 7/7/2005ED
3.145% Cal-EVR
(5,509) 6/1/2026 A1/A/A+ 2
2008C 40,820 7/7/2005ED
3.145% Cal-EVR
(5,509) 6/1/2026 A3/BBB+/A 2
MA 2008A 85,875 8/10/2006 3.765% 65% 3Mo LIBOR (36,437) 4/1/2036 A1/A/A+ 2
MA 2008B 50,000 8/10/2006 3.765% 65% 3Mo LIBOR (21,216) 4/1/2036 A1/A/A+ 2
MA 2008C 50,000 8/10/2006 3.765% 65% 3Mo LIBOR (21,833) 4/1/2036 Aa2/AA-/NR†
2
MA 2008D 50,000 8/10/2006 3.765% 65% 3Mo LIBOR (21,216) 4/1/2036 A3/BBB+/A 2
Total 372,035$ (119,076)$
CRMoody’s, Standard and Poor’s and Fitch, respectively. EDAmended June 26, 2008 to reflect on-market fixed rate to be paid of 3.145%. VRLower of 1 month LIBOR; or a rate equal to 63.5% of 1 month LIBOR or 55.5% of 1 month LIBOR plus 0.44%, whichever is greater. †NR - No rating for Fitch
*This represents the fair value of the base amount without the accrued interest of $2.4 million.

2-57
Objective of the Swaps: The objective of the swaps is to hedge VTA’s exposure to
variable interest rate risk by synthetically fixing its fixed rate interest costs at rates
anticipated to be less than what VTA otherwise would have paid in 2005 and 2006
respectively, to issue fixed rate debt in the tax-exempt municipal bond market.
Hedge Effectiveness and Fair Value Hierarchy
In accordance with GASB 53, the swaps were tested using regression analysis to
ensure a high degree of correlation and were determined to be effective hedging
derivative instruments and therefore were recorded as deferred outflow of resources
in the assets section and as a derivative instrument liability in the liability section of
the statement of net position. The fair values of the interest rate swaps were estimated
using the zero-coupon method. As of June 30, 2016, the swaps had a negative fair
value of $119 million.
GASB 72, which requires disclosure of fair values for investments and certain other
assets, became effective in June 2015 and has been implemented beginning with these
financial statements. For this purpose, investments are assets that a government holds
primarily for the purpose of income or profit. This includes derivative products such
as the interest rate swaps that VTA is party to and that are the subject of this footnote.
GASB 72 requires disclosure of fair values in investments, description of the
valuation method used, and indication of the level in the fair value hierarchy. The
level of hierarchy is representative of the type of inputs used to value the assets.
There are three levels in the hierarchy.
- Level 1 denotes directly observable prices for the identical investment.
- Level 2 denotes indirectly observable pricing based on comparable investments or
calculated using observable rates or indices.
- Level 3 denotes unobservable pricing inputs.
All of VTA’s interest rate swaps are Level 2 because their fair value is not directly
observable and was calculated using a discounted cash flow methodology based on
observable interest rates or indices.
Credit Risks: Credit risk is the risk of non-payment by the issuer of an obligation such
as a bond, other debt instrument, or non-payment by the counterparty to an interest
rate swap. Even a perceived increase in the risk of non-payment can adversely affect
the value of such an instrument. VTA’s Interest Rate Swap Policy seeks to limit
credit exposure by requiring counterparties to initially have strong credit ratings of

2-58
“AA” at the point the swap is entered into and also requires collateral posting by the
counterparty based on its credit ratings and market value of the swap. Currently the
values of the swaps are negative, no counterparties are posting collateral, and VTA is
posting collateral on several swaps.
Although VTA’s counterparties have experienced declines in their ratings since
inception of the swaps, their S&P and Moody’s ratings remain at investment grade
levels. All payments due from counterparties continue to be made on time and are
current as of June 30, 2016. When the swaps have a positive market value, VTA
manages any credit risk associated with termination of swaps by requiring
counterparties to post collateral based on the swap’s fair value, less a threshold
amount that ranges from zero to $25 million as determined based on the
counterparty’s credit ratings. The following table lists the threshold amounts that
would be applicable:
Swap
Counterparty
Credit Rating as
of 6/30/16CR
Collateral
Threshold
Credit Rating for
Threshold of Zero
VTA 2008A Aa2/AA- 15,000,000$ Baa1/BBB+
VTA 2008B A1/A 7,000,000 A3/A-
VTA 2008C A3/BBB+ 2,000,000 Baa3/BBB-
MA 2008A A1/A 7,000,000 A3/A-
MA 2008B A1/A 7,000,000 A3/A-
MA 2008C Aa2/AA- 15,000,000 Baa1/BBB+
MA 2008D A3/BBB+ - Baa1/BBB+
CR Moody’s and Standard and Poor’s, respectively.
Collateral generally consists of cash, U.S. Government securities, and U.S. Agency
securities, held by a third party custodian. VTA has utilized three to four swap
counterparties in each of its two transactions in order to limit the concentration of
credit risk. Currently, VTA has interest rate swaps with four counterparties and no
counterparty accounts for more than 36% of outstanding notional. VTA monitors
counterparty credit risk on an ongoing basis.
Basis Risk: Is the risk that the variable rate payment received by VTA under the
swaps does not closely match the variable interest rate paid by VTA to bondholders.
The variable rate debt hedged by VTA's interest rate swaps are variable rate demand
obligation (VRDO) bonds that are remarketed weekly. VTA is exposed to basis risk
because the variable rate receipts from the swaps are based on a rate or index other
than the interest rates VTA pays on the VRDO bonds. VTA is exposed to basis risk to
the extent that variable interest rate payments paid to bondholders on the bonds are
not precisely offset by the variable rate amounts received from the swap. On June 30,
2016, there was a slightly favorable basis variance of 0.05%.

2-59
Interest Rate Risk: – Interest rate risk is the risk that changes in market interest rates
may adversely affect the fair value of an investment, or in this instance the fair value
of the interest rate swaps. The longer the maturity of an investment the greater the
sensitivity of its fair value to changes in market interest rates. Changes in interest
rates, up or down, will result in positive or negative changes, respectively, to the fair
value of the interest rate swaps.
Rollover Risk: Rollover risk is the risk that a derivative instrument serving as a hedge
has a shorter maturity than the underlying risk that is being hedged and therefore a
portion of the term of the underlying risk may be unhedged or an additional hedge
may need to be acquired at a future date, possibly under less favorable terms. As of
June 30, 2016, VTA did not have any exposure to rollover risk.
Termination Risk: Is the risk that one or more interest rate swap agreements could be
terminated unexpectedly. Under certain conditions, one or more swap agreements
could be terminated and depending on current market interest rates, either VTA or the
counterparty could be required to make a termination payment. VTA’s swap
agreements only permit the counterparty to terminate if an Event of Default or a
Termination Event has occurred. Events of Default include non-payment, false or
misleading representations, and the bankruptcy of VTA or the counterparty.
Termination Events include, a downgrade of VTA’s rating to below “BBB-minus,”
an event of taxability, or conversion of bonds to a fixed rate.
Tax Risk: Is the risk of increased interest cost to VTA from a reduction or loss of
investors’ ability to exclude bond interest from their Federal and possibly state
income tax. Tax risk can result from either anticipated or actual changes to Federal or
state income tax laws that would reduce or eliminate the current exemption of
tax-exempt bond interest from taxable income.
Foreign Currency Risk: All of VTA’s swaps are denominated in US Dollars and
therefore VTA is not exposed to foreign currency risk.
Commitments: Each of the swap agreements contain provisions that require collateral
posting by VTA when the negative swap fair value exceeds a specified threshold. The
amount of collateral posted is based on the fair value of the swap, less a threshold
amount. The threshold amount is determined based on the unenhanced credit ratings
of VTA bonds secured by the 1976 sales tax. Based on the “AA/Aa2” credit ratings
assigned to the bonds the threshold for each swap is currently $20 million. If VTA’s
bond ratings were below “A or A2”, the threshold amount would be zero and VTA

2-60
would be required to post collateral based on the fair market value with no threshold
adjustment.
Collateral generally consists of cash, U.S. Government securities and U.S. Agency
securities. As of June 30, 2016, VTA had $19.7 million of cash collateral posted with
four counterparties, related to the swaps associated with the long-term variable rate
bonds secured by 2000 Measure A Sales Tax Revenues.
Swap Payments and Associated Debt
Using rates as of June 30, 2016, debt service requirements on VTA’s swap-related
variable rate debt and net swap payments are as follows. As rates vary, variable rate
bond interest payments and net swap payments will vary (dollars in thousands).
Year Ending
June 30,
Principal
Total
Remarketing
Interest Total
Interest Rate
Swap-Net
Total
Debt
Service
Total
2017 10,465$ 1,505$ 11,511$ 23,481$
2018 10,775 1,464 11,229 23,468
2019 11,095 1,421 10,939 23,455
2020 11,425 1,376 10,639 23,440
2021 11,760 1,331 10,331 23,422
2022 - 2026 80,640 5,792 45,823 132,255
2027 - 2031 - 4,835 39,355 44,190
2032 - 2036 235,875 3,188 25,944 265,007
372,035$ 20,912$ 165,771$ 558,718$
(d) Long-Term Debt Obligation Summary
Interest Rates on all outstanding fixed-rate obligations range from 3.00% - 5.00%.
Interest on the variable rate debt is reset weekly based upon market conditions.
Projected principal and interest obligations as of June 30, 2016, are as follows (in
thousands): Principal Interest Total
Year ending June 30:
2017 42,980$ 51,458$ 94,438$
2018 44,875 49,599 94,474
2019 46,485 47,646 94,131
2020 48,580 45,529 94,109
2021 50,765 43,340 94,105
2022-2026 286,225 179,264 465,489
2027-2031 250,265 107,484 357,749
2032-2036 317,975 36,045 354,020
1,088,150 560,365$ 1,648,515$
Unamortized bond premium 28,015
Total debt 1,116,165
Less current portion (42,980)
Long-term portion of debt 1,073,185$

2-61
(e) Restrictions and Limitations
There are a number of restrictions and limitations contained in the various bond
indentures. VTA’s management believes that VTA has complied with all applicable
restrictions and limitations.
(f) Long Term Liabilities
(Dollars in thousands) July 1, 2015 Additions Reductions June 30, 2016
Amounts Due
Within One
Year
Sales Tax Revenue Bonds
Secured by 1976 ½ Cent Sales Tax
2007 Series A 14,060$ -$ 2,015$ 12,045$ 2,130$
2008 Series A-C 146,325 - 10,165 136,160 10,465
2011 Series A 35,800 - 2,130 33,670 2,225
Sales Tax Revenue Bonds Secured
by 2000 Measure A ½ Cent Sales Tax
2007 Series A 6,210 - 3,040 3,170 3,170
2008 Series A-D 235,875 - - 235,875 -
2010 Series A-B 601,175 - 23,925 577,250 24,990
2015 Series A-B 89,980 - - 89,980 -
Total Outstanding Debt 1,129,425 - 41,275 1,088,150 42,980
Plus (less) premiums/discounts 31,340 239 3,564 28,015 -
Outstanding Debt, Net 1,160,765 239 44,839 1,116,165 42,980
Derivative Instruments Liability 83,451 35,625 - 119,076 -
Claims Liability:
General Liability 11,879 2,891 7,745 7,025 1,251
Worker’s Compensation 18,433 4,235 5,378 17,290 1,422
Compensated Absences 27,538 4,810 3,652 28,696 8,107
Total Long-Term Liabilities 1,302,066$ 47,800$ 61,614$ 1,288,252$ 53,760$
VTA’s Transit Fund reports a deferred amount on refunding in the amount of $9.7 million
related to the 2007 and 2008 bonds as a deferred outflow of resources. The Measure A
Fund reflects deferred amounts on bond refunding related to the 2015 bond of $4.2 million
as deferred outflow of resources, and 2007/2008 bonds of $4.0 million as deferred inflow
of resources.
NOTE 8 – SALES TAX REVENUES
Sales tax revenue represents sales tax receipts from the California State Board of
Equalization, which, under voter-approved 1976 and 2000 Sales Tax Measures, collects a
half-cent for each taxable sales dollar spent in the County. These amounts are available to
fund both operations and capital expenses except that portion which is to be used to repay
long-term debt as described in Note 7. In November 2008, county residents passed a 1/8-
cent sales tax to fund the operating and maintenance costs of the BART Extension. The
amount of the 1976 Sales Tax, 2000 Measure A Sales Tax, and BART Operating Sales Tax

2-62
recognized during FY 2016 was $205.4 million, $205.6 million, $49.3 million,
respectively, totaling $460.3 million.
NOTE 9 – VTA PROGRAMS FUNDED THROUGH LOCAL SALES TAX MEASURES
Measure B Transportation Improvement Program (MBTIP)
In November 1996, the voters of Santa Clara County approved Measure A - an advisory
measure listing an ambitious program of transportation improvements for the County. Also
approved on the same ballot, Measure B authorized the County Board of Supervisors to
collect a nine-year half-cent sales tax for general County purposes. The tax was identified
as a funding source for Measure A projects. Collection of the tax began in April 1997;
however, use of the revenue was delayed pending the outcome of litigation challenging the
legality of the sales tax. In August 1998, the California courts upheld the tax allowing the
Measure A transportation program to move forward.
Amendment 20 to the Master Agreement was executed in June 2007 to formalize the
process for winding down the Measure B Program. That amendment included the following
significant terms:
VTA was paid the value of all approved 1996 Measure B project budgets, less the
funds already paid by County to VTA, and the net remaining Measure B funding for
Fund Swap Projects and Ancillary Programs administered by VTA.
A lump sum amount of approximately $4.0 million was also paid to VTA by the
County to cover the closeout effort associated with incomplete projects.
In March 2010, $10.23 million was transferred to Congestion Management and Highway
Program (CMHP) from the Measure B Highway and the Measure B Ancillary programs for
$7.23 million and $3 million, respectively. The purpose is for CMHP to administer the
landscaping phase of Measure B highway projects as well as the availment of various
Measure B swap funds.
During the current fiscal year, VTA paid approximately $5.2 million for current year costs
for the program. This amount was contributed by the Santa Clara County as follows: $4.8
million of Measure B fund for transit projects in the Enterprise Fund; $183 thousand of
Measure B fund for highway projects in the Measure B Highway Capital Projects Fund;
and $252 thousand for the Ancillary Program (Measure B & Fund Swap Projects,
Pavement and Bikeways). Measure B Ancillary Fund was closed in FY 2016.

2-63
2000 Measure A Program
The Santa Clara Valley Transportation Authority 2000 Measure A Program (the Measure A
Program) was created in response to the Measure A ballot approved by the voters of Santa
Clara County on November 7, 2000. The Measure A Program is responsible for a number
of key capital transit projects, including the connection of rapid transit to San Jose,
increased bus and light rail service, and providing for related operating expenses. The
Measure A Program is funded by the half-cent sales tax to be imposed for a period of 30
years and took effect upon expiration of the current County of Santa Clara 1996 Measure B
half-cent sales tax on March 31, 2006.
The Measure A Program consists of those projects and increased operations included in the
2000 Measure A ballot, as noted below:
Extend San Francisco Bay Area Rapid Transit District service (“BART”) from Fremont
through Milpitas to Downtown San Jose and the Santa Clara Caltrain Station (the
“Silicon Valley Rapid Transit Project” or “SVRT”);
Provide connections from the San Jose International Airport to BART, Caltrain
commuter rail service (“Caltrain”) and VTA’s light rail system;
Extend VTA’s light rail system from Downtown San Jose to the East Valley portion of
Santa Clara County (“DTEV Extension”);
Purchase low floor light rail vehicles to better serve the disabled, senior, and other
segments of the ridership;
Improve Caltrain by extending the system’s double track to Gilroy and providing funds
to electrify the system;
Increase Caltrain service;
Construct a new Palo Alto Intermodal Transit Center;
Improve bus service in major bus corridors;
Upgrade the Altamont Commuter Express (“ACE”) services;
Improve the Highway 17 express bus service;
Connect Caltrain with the Dumbarton Rail Corridor (serving Alameda and San Mateo
County);
Purchase zero emission buses and construct service facilities;
Provide funds to develop new light rail corridors;
Fund operating and maintenance costs associated with increased bus, rail, and
paratransit service.
2-64
The following activities have either been completed or are in progress, funded by a
combination of Tax revenues, state and federal grants, bond proceeds, and other locally
obtained funds. To date, Measure A efforts have:
Completed the purchase of low floor light rail vehicles;
Completed the Zero Emission Bus demonstration project;
Began construction on the Alum Rock Santa Clara Bus Rapid Transit (BRT) in March
2014. In September 2015, VTA entered into a Closeout Agreement with the prompt and
orderly closeout and demobilization of the contractor from the Project. The work scope
not started by the original contractor was repackaged into two new contracts. All
construction work will be completed early 2017. The El Camino Real Rapid Transit
Policy Advisory Board is exploring new project alternatives to identify a project design
that will attract independent support for the corridor cities. Design for new shelters,
seating, lighting, and other associated bus stop improvements for Stevens Creek Rapid
523 is ongoing. Construction contract will be advertised in late 2016. Conceptual
engineering for an interim transit facility at De Anza College has been completed.
Modifications at Chaboya/ North Division Phase I were completed in March 2015.
Construction for the Phase II involving modification to the Chaboya Yard is expected
to start in late 2017. Articulated buses (29 units) have been accepted by VTA and are
starting to be used for special event service. An option for 20 additional buses to
operate on the Stevens Creek corridor is available and being considered.
Received $900 million grant commitment from the FTA for the Silicon Valley
Berryessa Extension (SVBX) Project in March 2012. In December 2012, the project
received $50 million in State Transportation Improvement Program (STIP) funding to
help expand and improve BART’s Hayward Maintenance complex to accommodate the
operation of the Berryessa Extension. Work is progressing on station parking garages.
At the Berryessa Station, wall and mechanical/electrical/plumbing construction
continue at the Police Zone Facility.
Received Traffic Congestion Relief Program (TCRP) fund as reimbursement for the
preliminary engineering and construction phase on the VTA’s BART Silicon Valley
Extension. This fund is designated for construction of a 10-mile segment of the project.
As of June 2016, remaining available balance of TCRP grant final installment is $8.7
million.
Relocated and constructed utilities in the freight rail corridor in Fremont and Milpitas.
The Berryessa Creek crossing, Abel Street Seismic Retrofit, and Railroad Relocation
contracts are complete. On the Mission Boulevard/Warren Avenue Pacific Railroad
Relocation Construction contract, construction of the Union Pacific Rail Road (UPRR)
Bridge on Mission Blvd. is complete. The Agua Fria, Toroges and Agua Caliente Creek
Improvement contract is complete. The Kato Road Grade Separation contractor fully
re-opened Kato Road in April 2013. Following the completion of the Joint Powers
2-65
Agreement between Santa Clara County, Santa Clara Valley Water District (SCVWD),
and VTA, the Montague Expressway Reconstruction Project is underway. The
Montague pedestrian overcrossing design contract is in the procurement stage;
The construction of the pedestrian improvements (sidewalk and landscaping) along
Capitol Expressway was completed in the spring 2013. Construction of the transit
center was completed in May 2015. In June 2016, the funding of Phase II of the Capitol
Expressway Light Rail Extension to Eastridge was approved by the Board.
Construction phase is dependent on securing funding.
Completed the Light Rail Systems Analysis, which was adopted by the VTA Board in
May 2010. The Systems Analysis provides an evaluation of infrastructure and
operational shortcomings of the existing light rail system as well as improvement plan
for immediate action. The initial projects recommended from the Systems Analysis
began planning, design and construction in fall 2011. Vasona LRT Extension project
was re-evaluated and in June 2016, the Board approved funding to complete design,
acquire right-of way, and relocate utilities. Construction phase is dependent on securing
funding. Similar status applies to Winchester LR Double Track and Platform Extension.
Santa Clara Caltrain Station Pedestrian Underpass Extension project will provide an
extended pedestrian tunnel under the UPRR tracks to Brokaw Road at the Santa Clara
Station. Construction contract was awarded and construction is planned for completion
by mid-2017;
Completed safety improvements to 15 crossings along the Joint Powers Board (JPB)
segment. Design for next phase is complete, construction is pending High Speed Rail
Project;
Completed construction for the Blossom Hill Pedestrian Grade Separation in September
2012;
Completed Caltrain Service upgrades project for improvements to the Santa Clara
Station in 2013. This allowed ACE trains to stop at the station;
The Bike Share Pilot Program opened in August 2013 at Caltrain stations and
downtown areas in San Jose, Mountain View, and Palo Alto. Post-pilot expansion will
occur in select cities;
The environmental process for electrification and new electric trains was completed in
January 2015. In July 2016, Caltrain Board approved contract awards for design and
construction of the corridor’s electrification infrastructure, as well as the contract for
the manufacture of high performance electric trains. Caltrain expects to begin roll out
of electrified passenger device in winter 2020. VTA continues to reimburse Caltrain for
project related cost.

2-66
BART Operating Fund Sales Tax Ordinance
At the election held on November 4, 2008, the voters passed VTA Measure B supporting
the tax that would be dedicated to the operation, maintenance, improvement, and future
capital needs of the 16.1 mile Santa Clara Bay Area Rapid Transit (BART) extension. The
BART extension includes stations in Milpitas, San Jose, and Santa Clara, connecting with
Caltrain from Gilroy to San Francisco and an Airport People Mover. In November 2011,
the Board of Directors approved a retail transaction and use tax ordinance which imposes a
tax for the privilege of selling tangible personal property upon a retailer in Santa Clara
County, at the rate of one-eighth of one percent on the gross receipts of the retailer.
Collection of the tax took effect on July 1, 2012, for a period not to exceed 30 years. This
ordinance is also known as the Santa Clara Valley Transportation Authority BART
Operating and Maintenance Transactions and Use Tax Ordinance.
NOTE 10 – FEDERAL, STATE, AND LOCAL ASSISTANCE
VTA is dependent upon the receipt of funds from several sources to meet its operating,
maintenance, and capital requirements. The receipt of such revenues is controlled by
federal, state, and local laws, the provisions of various grant contracts and regulatory
approvals and, in some instances, is dependent on the availability of grant funds and the
availability of local matching funds. A summary of the various governmental funding
sources is as follows:
(a) Federal Grants
Federal grants are approved principally by the Federal Transit Administration (FTA)
and the Federal Highway Administration (FHWA). Federal grants for the year ended
June 30, 2016, are summarized as follows (in thousands):
Enterprise
Funds
Special
Revenue
Fund
Capital
Projects
Funds
Operating Assistance Grants:
FTA Section 9 (49 USC 5307) 3,696$ -$ -$
Job Access Reverse Commute Fed Grant 244 - -
Section 5311 80 - -
Mobility Options Travel Training Program 40 - -
Security Plan Revision 45 - -
Federal Technical Studies - 1,887 -
Pass-through Operating Grants - - 1,721
Total Operating Assistance Grants 4,105 1,887 1,721
Capital Grants:
FTA Section 3 (49 USC 5309) 163,199 - -
FTA Section 9 (49 USC 5307) 1,762 - -
Transit Security Grant Program 680 - -
Pass-through Capital Grants 77 - -
Total Capital Grants 165,718 - -
Total operating assistance & capital grants 169,823$ 1,887$ 1,721$
2-67
FTA Section 9 operating grants represent ADA Operating Set Aside funds that will
be used for Paratransit activities. Paratransit service is a specialized form of
transportation operated for persons with disabilities who cannot use fixed route public
transit service. As an operator of bus and light rail service, VTA is required under the
Americans with Disabilities Act to ensure that paratransit service is provided to
eligible individuals with disabilities within Santa Clara County.
The Job Access and Reverse Commute was authorized in Section 5316 of the
Transportation Equity Act of the 21st Century (TEA-21). This program, administered
by the FTA, is intended to implement a variety of transportation services that will
connect welfare recipients to employment and other job-related activities and
opportunities.
The Section 5311 program is the FTA non-urbanized area formula grant. The
program provides funding for public transportation projects serving areas outside of
an urban boundary with a population of 50,000 or less. Funds may be used for capital,
operating, planning, or technical assistance projects.
The Mobility Options Travel Training Program is being funded in whole or in part by
a New Freedom grant from the FTA. The program is being administered by the
Metropolitan Transportation Commission providing training and transit route
information to persons with disabilities, including seniors.
The Security Plan Revision is under the Transit Security Grant Program for costs
related to addressing security and preparedness enhancements for transit systems.
Federal technical studies grant under the Special Revenue Fund represents
interagency agreement with the Metropolitan Transportation Commission (MTC) for
purpose of conducting specific planning and programming activities to assist MTC in
meeting the requirements of federal legislation and related State and regional
planning and programming policies and guidelines.
The pass-through federal grants under the Capital Project Funds represent fund
agreements covering highway projects with various government agencies of the State
of California.

2-68
FTA Section 3 capital grants represent the transit capital investment program (49
U.S.C. 5309), which provides capital assistance for three primary activities:
New and replacement of buses and facilities
Modernization of existing rail systems, and
New fixed guideway systems
In March 2012, FTA awarded VTA a full funding grant agreement (FFGA) for the
SVBX project with a maximum federal New Starts financial contribution of $900
million. The FFGA is being amended through yearly increment of New Starts fund up
to 2018. SVBX project scope includes 40 BART revenue vehicles, 10.15 miles of
double-track grade separated electrified third-rail guideway, traction power
substations, high voltage substations, communication system, passenger drop-off
facilities, parking spaces real estate acquisition, utility relocation, drainage
improvements, environmental mitigation, financing, startup and revenue testing, and
other elements necessary for project delivery. The project includes facility additions
to the existing BART Hayward Yard located in the city of Hayward approximately 14
miles north of Santa Clara County for maintenance of BART vehicles.
FTA Section 9 capital grants represent the federal program (49 U.S.C. 5307), which
makes federal resources available to urbanized areas and to Governors for transit
capital and operating assistance in urbanized areas and for transportation-related
planning. This includes funds for transit enhancements and Congestion Mitigation
and Air Quality (CMAQ) award for transportation projects or programs that will
contribute to the attainment or maintenance of the National Ambient Air Quality
Standards (NAAQS) for ozone and carbon monoxide.
The Transit Security Grant Program (TSGP) award comes from the Federal
Emergency Management Agency for costs related to addressing security and
preparedness enhancements for transit systems.
The pass-through federal grants under the Enterprise Funds include Demonstration
Projects. These projects are provided as part of the transportation appropriation acts.
Grade separations, widening and demolition of bridges, new crossing configurations
are examples of projects funded with Demonstration funds. The pass-through federal
grants under the Capital Project Funds represent fund agreements covering highway
projects with various government agencies of the State of California.

2-69
(b) State and Local Grants and Assistance
State and local grants for the year ended June 30, 2016, are summarized as follows (in
thousands): Business-type
Activities
Enterprise
Funds
Congestion
Management
Program
Capital
Projects Funds
Operating assistance grants:
Transportation Development Act 98,519$ -$ -$
State Transit Assistance 13,632 - -
Transit Assitance Program 502
State Operating Assistance Grants 109
AB 434 1,373 - -
State Operating Assistance Grants - 699 -
Congestion Management & Highway Program-State Grants - - 3,205
Congestion Management & Highway Program-Measure A Swap Program - - 4,984
Other Local Grants:
Measure B Highway - - 183
Santa Clara County (Fund Swap Program) (Note 9) - - 251
Various cities, counties and others - - 3,660
Total operating assistance grants 114,135 699 12,283
Capital grants:
Traffic Congestion Relief Program 13,099 - -
PTMISEA 29,616 - -
Highway-Railroad Crossing Safety Account 569 - -
Proposition 1B Fund 4,142 - -
AB 1462 35,000 - -
Other Local Grants:
Santa Clara County (Measure B Program) (Note 9) 4,082 - -
Various cities, counties and others 18,831 - -
Total Capital Grants 105,339 - -
Total State and Local Grants 219,474$ 699$ 12,283$
Governmental Activities
Transportation Development Act (TDA) funds represent VTA’s share of the 0.25%
sales tax collected in the County.
State Transit Assistance (STA) represents funds received pursuant to the STA
Program, whereby, a portion of diesel fuel sales tax revenues is appropriated by the
State Legislature to the State Transportation Planning and Development Account for
certain transit and energy-related purposes. STA funds are allocated throughout the
state on the basis of population and operating revenues.
The Transit Assistance Program (TAP) provides transit passes to low income and
disadvantaged communities through the social services agencies within Santa Clara
County. The program will provide free or low cost local transit services passes for
qualifying low income residents of Santa Clara County not currently receiving other
forms of transportation assistance. VTA will provide the passes to Santa Clara
County, who will in turn provide the passes to eligible residents.
2-70
State Operating Assistance Grants under the Enterprise funds represent
reimbursement, in partnership with local community college, for Transit
Apprenticeship for Professional Career Advancement (TAPCA). The purpose is to
respond to two challenges: the explosive growth of Silicon Valley jobs that drives
demand for expanded public transit infrastructure; and an aging workforce, coupled
with the need to fill increasingly technical job classifications requiring specialized
training. State Operating Assistance Grants under the Congestion Management
Program represent grant receipts from the California Department of Transportation
for project planning, programming and monitoring activities related to development
of the Regional Transportation Improvement Program.
AB 434 fees represent funds received from the Bay Area Air Quality Management
District. These funds are used for shuttle services and projects promoting clean air in
the South Bay.
Capital Projects revenues consist of state and local grant revenues pertaining to
Congestion Management and Highway Program (CMHP) of $12.1 million and
Measure B Highway Program of $0.2 million. The CMHP state grants consist
primarily of corridor Mobility Improvement Account (CMIA) grant. The scope of this
grant includes performance improvements on the state highway system and major
access routes to the state highway system.
There are projects within the Congestion Management and Highway Program that
avail of 2000 Measure A swap funds. This represents a swap of 2000 Measure A
Sales Tax Revenues for grant funding from the State Transportation Improvement
Program (STIP). The Measure A Swap program was established to fund a number of
highway projects.
The Traffic Congestion Relief Program (TCRP) provides funds for projects
throughout the state of California to reduce traffic congestion, provide for safe and
efficient movement of goods, and provide system connectivity. TCRP is being
implemented by the California Transportation Commission (CTC), in consultation
with State Department of Transportation.
Public Transportation Modernization Improvement and Service Enhancement Act
(PTMISEA) Grant is part of a comprehensive voter-approved bond investment
package designed to help advance important goals and policies, including protecting
the environment and public health, conserving energy, reducing congestion, and
providing alternative mobility and access choices for Californians. The projects
approved by the Department of Transportation included building pedestrian

2-71
overcrossings, updating ticket vending machines, constructing bus rapid transit,
substation rehabilitation, and procurement of vehicles and equipment. PTMISEA
activities are presented in the following table (in thousands):
From Inception To
6/30/2016
June 30, 2016 Cumulative Balance
Proceeds received 29,269$ 209,537$
Total expenditures paid and accrued (29,616) (160,148)
Current year unused proceeds (347) 49,389
Prior year unused proceeds 54,375 -
Total proceeds available 54,028 49,389
Interest earned 620 5,259
Total proceeds available plus interest earned 54,648$ 54,648$
Highway-Railroad Crossing Safety Account or HRCSA was created by Proposition
1B, the Highway Safety, Traffic Reduction, Air Quality, and Port Security Bond of
2006 to provide funding for the completion of high-priority grade separation and
railroad crossing safety improvements. The account is being administered by the
California Transportation Commission (CTC).
Proposition 1B Fund provides funding under the California Transit Security Grant
Program and is administered by the California Emergency Management Agency.
AB 1462 is state funding derived from the sale of State-owned land in the Historic
Parkway Corridor for the Mission/I-880 Completion Project as part of the
development of the list of priority projects on state highways. This funding is used for
the Mission Boulevard (Route 262)/Warren Avenue/Freight Railroad Relocation
Program.
Santa Clara County Measure B Program includes both transit and highway projects.
Santa Clara County Fund Swap is Measure B revenue received by VTA for local
projects in exchange for federal and/or State grant funds. These funds are
programmed for certain 1996 Measure B Transportation Improvement Program
(MBTIP) Projects. Additional information on the 1996 MBTIP can be found in
Note 9.
Various cities, counties, and other agencies contribute revenue to light rail projects
and Silicon Valley Rapid Transit Corridor for project enhancements.

2-72
NOTE 11 – SANTA CLARA VALLEY TRANSPORTATION AUTHORITY
AMALGAMATED TRANSIT UNION (ATU) PENSION PLAN
(a) Plan Description and Benefits Provided
All ATU represented employees are covered by the Plan, which is a single-employer
defined benefit pension plan. The Plan provides retirement, disability, and death
benefits based on the employees’ years of service, age, and final compensation.
Employees with 10 or more years of service are entitled to full annual pension
benefits beginning at normal retirement age of 65. Employees with less than 10 years
of service are entitled to an annual benefit at age 65 provided the Pension Board
approves of such benefit. Employees with 15 or more years of service are entitled to
full annual pension benefits beginning at age 55. The Plan permits early retirement if
an employee becomes disabled after 10 or more years of service, and deferred vested
retirement upon employee termination after 10 or more years of service, with benefits
payable at age 65. Employees may elect to receive their benefits in the form of a joint
or survivor annuity. These benefit provisions and all other requirements are
established by California statute and the labor agreement with the ATU. Benefit terms
do not provide for annual cost-of-living adjustment subsequent to retirement date.
Separately issued audited GAAP basis financial statements of the Plan are available
and can be obtained from Santa Clara Valley Transportation Authority, Finance and
Budget, 3331 North First Street, Building C-2, San Jose, California 95134-1927.
The membership of the Plan as of June 30, 2016, is as follows:
Membership Status
No. of
Members
Retirees and beneficiaries currently receiving benefits 1,337
Terminated vested members not yet receiving benefits 147
Active Members 1,568
Total 3,052
(b) Basis of Accounting
Contributions are recognized as revenue when due, pursuant to formal commitments,
as well as statutory or contractual requirements. Benefits (distributions to
participants) and refunds of prior contributions are recognized when due and payable
in accordance with the terms of the Plan.

2-73
Investments are reported at fair value. Securities traded on a national or international
exchange are valued at the last reported sales price on the last business day of the
fiscal year at current exchange rates. Purchases and sales of securities are reflected on
the trade date and investment income is recognized as earned.
(c) Contribution Requirements
For FY 2016, the actuarially-determined contribution was $25.7 million. As the Plan
elected to use June 30, 2016 as its measurement date, employer contributions for FY
2016 will have an impact on the changes in the Plan’s Net Position as of the end of the
reporting year. The contribution requirements are established by the Board based on
actuarially determined rate recommended by an independent actuary. The rate is the
estimated amount necessary to finance the cost of the benefits earned by employees
during the year with an additional amount to finance the unfunded accrued liability.
(d) Changes in Net Pension Liability
The Plan’s net pension liability was $177.0 million as of June 30, 2016. The
following table shows the changes in net pension liability recognized over the
measurement period.
Total Pension
Liability
(a)
Plan Fiduciary
Net Position
(b)
Net Pension
Liability/(Asset)
(c) = (a) - (b)
Balance at June 30, 2015 611,678$ 489,191$ 122,487$
Changes Recognized for the Measurement Period:
Service cost 14,788 - 14,788
Interest (includes interest on service cost) 45,110 - 45,110
Differences between expected and actual experience 7,748 - 7,748
Changes of assumptions 14,577 - 14,577
Contributions from the Employer - 25,751 (25,751)
Net investment income - 2,245 (2,245)
Benefit Payments, including Refunds of Employee Contributions (35,588) (35,588) -
Administrative expense - (281) 281
Net changes during FY 2016 46,635 (7,873) 54,508
Balance at June 30, 2016 658,313$ 481,318$ 176,995$
Increase/(Decrease)
(Amounts in thousands)
Sensitivity of the Net Pension Liability to Change in Discount Rate:
The table below shows the sensitivity of the Net Pension Liability to the discount
rate. A one percent decrease in the discount rate increases the Total Pension Liability
by approximately 11% and increases the Net Pension Liability by approximately
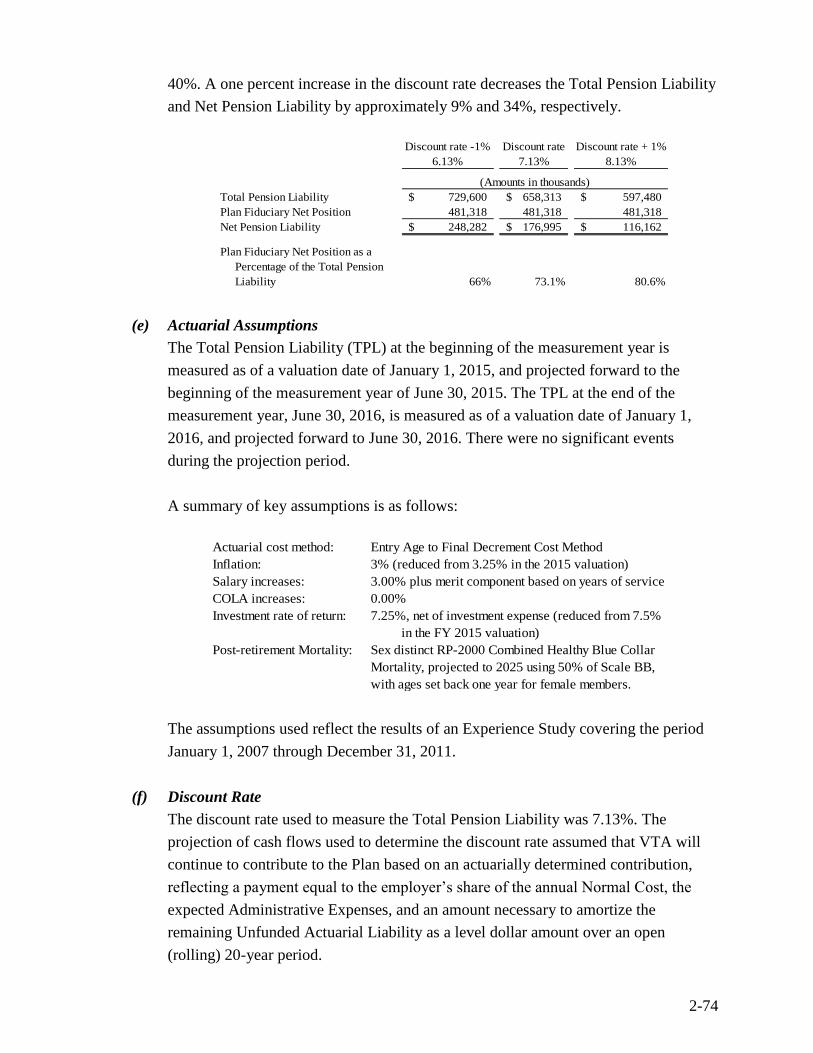
2-74
40%. A one percent increase in the discount rate decreases the Total Pension Liability
and Net Pension Liability by approximately 9% and 34%, respectively.
Discount rate -1% Discount rate Discount rate + 1%
6.13% 7.13% 8.13%
Total Pension Liability 729,600$ 658,313$ 597,480$
Plan Fiduciary Net Position 481,318 481,318 481,318
Net Pension Liability 248,282$ 176,995$ 116,162$
Plan Fiduciary Net Position as a
Percentage of the Total Pension
Liability 66% 73.1% 80.6%
(Amounts in thousands)
(e) Actuarial Assumptions
The Total Pension Liability (TPL) at the beginning of the measurement year is
measured as of a valuation date of January 1, 2015, and projected forward to the
beginning of the measurement year of June 30, 2015. The TPL at the end of the
measurement year, June 30, 2016, is measured as of a valuation date of January 1,
2016, and projected forward to June 30, 2016. There were no significant events
during the projection period.
A summary of key assumptions is as follows:
Actuarial cost method: Entry Age to Final Decrement Cost Method
Inflation: 3% (reduced from 3.25% in the 2015 valuation)
Salary increases: 3.00% plus merit component based on years of service
COLA increases: 0.00%
Investment rate of return: 7.25%, net of investment expense (reduced from 7.5%
in the FY 2015 valuation)
Post-retirement Mortality: Sex distinct RP-2000 Combined Healthy Blue Collar
Mortality, projected to 2025 using 50% of Scale BB,
with ages set back one year for female members.
The assumptions used reflect the results of an Experience Study covering the period
January 1, 2007 through December 31, 2011.
(f) Discount Rate
The discount rate used to measure the Total Pension Liability was 7.13%. The
projection of cash flows used to determine the discount rate assumed that VTA will
continue to contribute to the Plan based on an actuarially determined contribution,
reflecting a payment equal to the employer’s share of the annual Normal Cost, the
expected Administrative Expenses, and an amount necessary to amortize the
remaining Unfunded Actuarial Liability as a level dollar amount over an open
(rolling) 20-year period.

2-75
In determining the long-term expected rate of return, both short-term and long-term
market return expectations as well as the expected pension fund cashflows were taken
into account. Such cashflows were developed assuming that both members and
employers will make this required contribution on time and as scheduled in all future
years. Using historical returns of all the funds’ asset classes , expected geometric
returns were calculated over the short-term (first ten years) and the long-term (11-60
years) using a building-block approach.
Based on those assumptions, the Plan’s Fiduciary Net Position was projected to be
available to make all projected future benefit payments of current Plan members until
at least 2074 when only a portion of the projected benefit payments are expected to be
made from the projected Fiduciary Net Position. Projected benefit payments are
discounted at the long-term expected return on assets of 7.25% to the extent the
Fiduciary Net Position is available to make the payments and the municipal bond rate
of 2.85% to the extent they are not available. The single equivalent rate used to
determine the Total Pension Liability as of June 30, 2016 is 7.13%
The following is the assumed asset allocation and expected rate of return for each
major asset class:
Asset Class Target
Allocation
Long-Term Expected
Real Rate of Return
Standard
Deviation
Domestic Equity-Large Cap 15% 5.00% 17.95%
Domestic Equity-Large Cap Index 10% 5.00% 17.95%
Domestic Equity-Small Cap 10% 5.30% 22.75%
International Equity 13% 5.30% 21.30%
Emerging Markets Equity 5% 5.35% 27.85%
Domestic Fixed Income 27% 0.75% 3.75%
Absolute Return 9% 3.00% 9.30%
Real-Estate 10% 3.75% 16.45%
Cash 1% 0.00% 0.90%
(g) Plan’s Fiduciary Net Position
This refers to the fair or market value of assets. As of June 30, 2016, the Plan’s
Fiduciary Net Position amounts to $481.3 million. Detailed information about the
pension plans, fiduciary position is available in a separate financial report.
(h) Pension Expense and Deferred Inflows or Outflows of Resources Related to
Pensions
For the measurement period ending June 30, 2016, VTA incurred pension expense of
$38.5 million. This is the change in the Net Pension Liability plus the changes in
deferred amounts plus employer contributions.
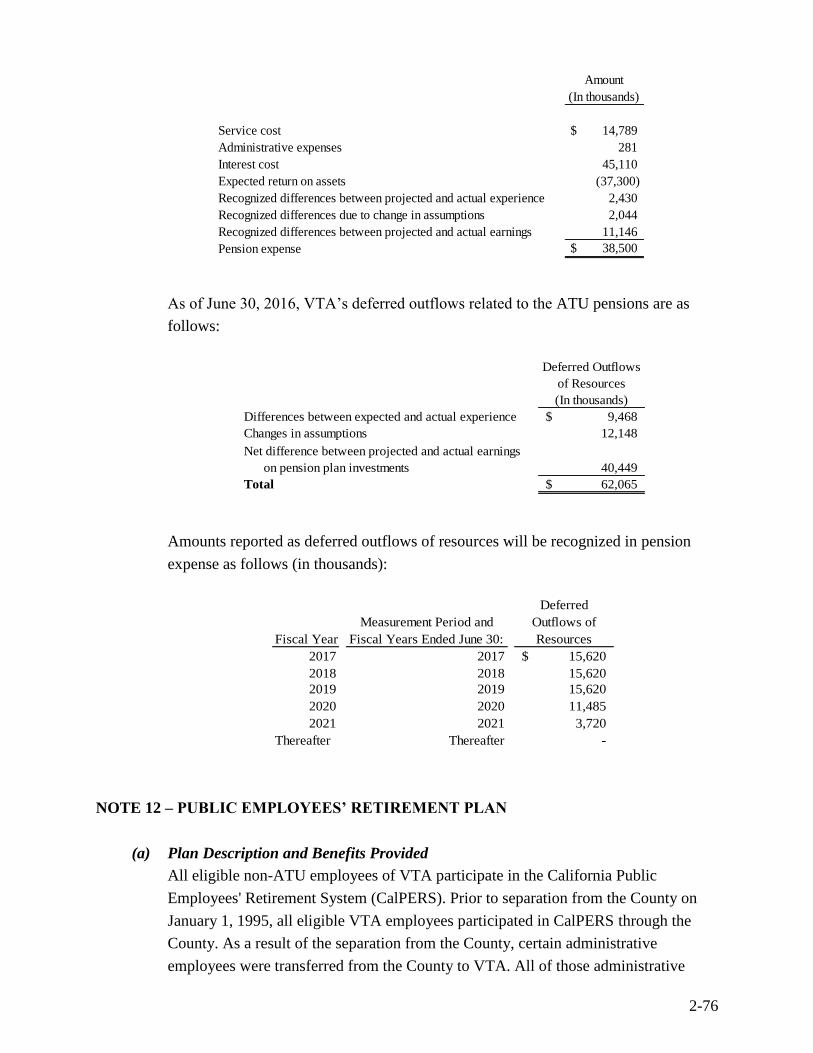
2-76
Amount
(In thousands)
Service cost $ 14,789
Administrative expenses 281
Interest cost 45,110
Expected return on assets (37,300)
Recognized differences between projected and actual experience 2,430
Recognized differences due to change in assumptions 2,044
Recognized differences between projected and actual earnings 11,146
Pension expense $ 38,500
As of June 30, 2016, VTA’s deferred outflows related to the ATU pensions are as
follows:
Deferred Outflows
of Resources
(In thousands)
Differences between expected and actual experience 9,468$
Changes in assumptions 12,148
Net difference between projected and actual earnings
on pension plan investments 40,449
Total 62,065$
Amounts reported as deferred outflows of resources will be recognized in pension
expense as follows (in thousands):
Fiscal Year
Measurement Period and
Fiscal Years Ended June 30:
Deferred
Outflows of
Resources
2017 2017 15,620$
2018 2018 15,620
2019 2019 15,620
2020 2020 11,485
2021 2021 3,720
Thereafter Thereafter -
NOTE 12 – PUBLIC EMPLOYEES’ RETIREMENT PLAN
(a) Plan Description and Benefits Provided
All eligible non-ATU employees of VTA participate in the California Public
Employees' Retirement System (CalPERS). Prior to separation from the County on
January 1, 1995, all eligible VTA employees participated in CalPERS through the
County. As a result of the separation from the County, certain administrative
employees were transferred from the County to VTA. All of those administrative

2-77
employees’ service credits earned during the period they worked for the County’s
transportation agency were transferred to VTA’s CalPERS account. The transfer of
related assets at a market value totaling approximately $52.3 million was completed
by CalPERS in FY 1999.
CalPERS is an agent multiple-employer defined benefit retirement plan that acts as a
common investment and administrative agent for various local and state
governmental agencies within California. CalPERS provides service retirement and
disability benefits, annual cost of living adjustments and death benefits to plan
members, who must be public employees and beneficiaries. Benefits are based on
years of credited service, equal to one year of full time employment. Members with
five years of total service are eligible to retire at age 50 or age 52 for New Members
with statutorily reduced benefits. All members are eligible for non-duty disability
benefits after 5 years of service credit. The death benefit is one of the following: the
Basic Death Benefit or the 1957 Survivor Benefit. These benefit provisions and all
other requirements are established by state statute and VTA resolutions. VTA
contracts with CalPERS to administer these benefits. The normal retirement benefit is
equal to 2% of final compensation for each year of credited services.
Retirement and survivor allowances are adjusted each year in May for cost of living,
beginning the second calendar year after the year of retirement. The standard cost-of-
living allowance (COLA) is 2%.
Based on census data, VTA membership in the Plan as of June 30, 2014 (date of the
most recent actuarial valuation), is as follows:
Retirees and beneficiaries receiving benefits 528
Terminated and vested members not yet receiving benefits 384
Active members 629
Total 1,541
Copies of the CalPERS’ annual financial report may be obtained from the CalPERS
Executive Office, 400 P Street, Sacramento, CA 95814.
(b) Summary of Significant Accounting Policies
For purposes of measuring the net pension liability, the following have been
determined on the same basis as they are reported by the CalPERS Financial Office:
Deferred outflows/inflows of resources related to pensions;
Pension expense;

2-78
Information about the fiduciary net position of the Plan, and
Additions to/deductions from the Plan’s fiduciary net position.
Benefit payments (including refunds of employee contributions) are recognized when
currently due and payable in accordance with the benefit terms. Investments are
reported at fair value.
(c) Contribution Requirements
Active members in VTA’s CalPERS Plan pay a portion or all (depending on hire
date) of the employee contribution to the CalPERS Plan. In FY2016, employees hired
prior to January 2012 paid 6 percent (excluding SEIU-represented employees who
paid 5% and would pay 5.5% effective August 15, 2016) toward the required
employee share and VTA paid the remaining portion of the employee contribution.
Employees hired in or after the first full pay period in January 2012 paid the
employee contribution of 7%. The CalPERS-designated PEPRA (Public Employees’
Pension Reform Act) rate is 6.5%. However, due to collective bargaining agreements,
the current employee contributions for employees considered New Members is 7%.
The 0.5% difference is reported in a liability account until the PEPRA issue is
resolved.
Employer’s contribution rate from July 1, 2015, through June 30, 2016, was 16.59%.
The employee contribution requirements of the CalPERS Plan are established by state
statute and the employer contribution is established and may be amended by
CalPERS.
The actuarial methods and assumptions used are those adopted by the CalPERS
Board of Administration. For FY 2015, VTA contributed $9 million, which is equal
to the actuarially-determined contributions. The required contribution for FY 2016
was determined as part of the June 30, 2014, actuarial valuation using the entry age
normal cost method with the contributions determined as a percent of pay. VTA’s
annual pension contribution of $11.35 million in FY 2016 was deferred as VTA opted
for June 30, 2015, to be its measurement date to comply with GASB 68.
(d) Net Pension Liability
VTA's net pension liability to the CalPERS Plan was $86.8 million as of June 30,
2016. The net pension liability was measured using an actuarial valuation as of
June 30, 2014 rolled forward to June 30, 2015 measurement date using standard
update procedures. Table on the next page shows the changes in net pension liability.
.
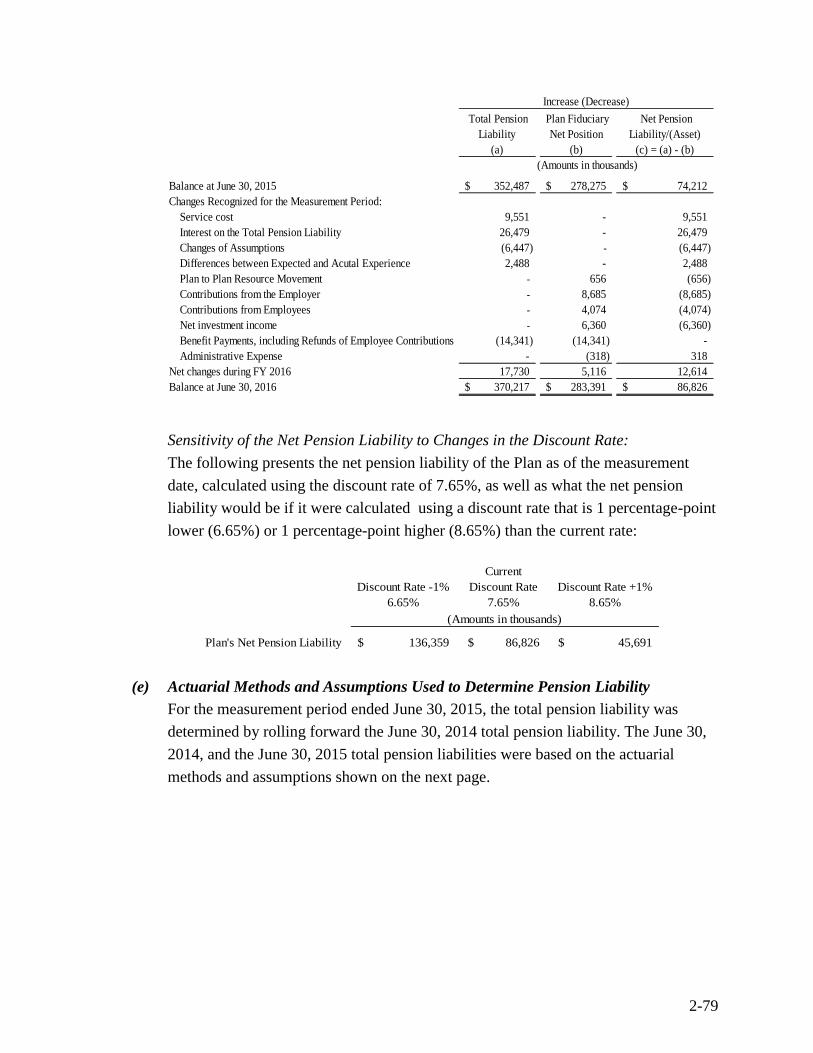
2-79
Total Pension
Liability
(a)
Plan Fiduciary
Net Position
(b)
Net Pension
Liability/(Asset)
(c) = (a) - (b)
Balance at June 30, 2015 352,487$ 278,275$ 74,212$
Changes Recognized for the Measurement Period:
Service cost 9,551 - 9,551
Interest on the Total Pension Liability 26,479 - 26,479
Changes of Assumptions (6,447) - (6,447)
Differences between Expected and Acutal Experience 2,488 - 2,488
Plan to Plan Resource Movement - 656 (656)
Contributions from the Employer - 8,685 (8,685)
Contributions from Employees - 4,074 (4,074)
Net investment income - 6,360 (6,360)
Benefit Payments, including Refunds of Employee Contributions (14,341) (14,341) -
Administrative Expense - (318) 318
Net changes during FY 2016 17,730 5,116 12,614
Balance at June 30, 2016 370,217$ 283,391$ 86,826$
(Amounts in thousands)
Increase (Decrease)
Sensitivity of the Net Pension Liability to Changes in the Discount Rate:
The following presents the net pension liability of the Plan as of the measurement
date, calculated using the discount rate of 7.65%, as well as what the net pension
liability would be if it were calculated using a discount rate that is 1 percentage-point
lower (6.65%) or 1 percentage-point higher (8.65%) than the current rate:
Discount Rate -1%
6.65%
Current
Discount Rate
7.65%
Discount Rate +1%
8.65%
Plan's Net Pension Liability 136,359$ 86,826$ 45,691$
(Amounts in thousands)
(e) Actuarial Methods and Assumptions Used to Determine Pension Liability
For the measurement period ended June 30, 2015, the total pension liability was
determined by rolling forward the June 30, 2014 total pension liability. The June 30,
2014, and the June 30, 2015 total pension liabilities were based on the actuarial
methods and assumptions shown on the next page.

2-80
Valuation date June 30, 2014
Actuarial cost method Entry Age - Normal
Actuarial Assumptions
Discount rate 7.65%
Inflation 2.75%
Salary increases Varies by entry age and service
Payroll growth 3.00%
Investment rate of return 7.65% Net of Pension Plan Investment and Administrative
Expenses; includes Inflation
Mortality rate table1
Derived using CalPERS' Membership Data for all Funds
Post retirement benefit
increase
Contract COLA up to 2.75% until Purchasing Power Protection Allowance
Floor on Purchasing Power applies, 2.75% thereafter
Protection Allowance Floor on Purchasing Power applies, 2.75% thereafter
1The mortality table used was developed based on CALPER’s specific data. The table includes 20 years of mortality
improvements using Society of Actuaries Scale BB. Details of this table are included in the 2014 experience study report.
(f) Discount Rate
The discount rate used to measure the total pension liability was 7.65%. CalPERS
concluded, based on the results of the stress test, that the current 7.65% discount rate
is adequate and the use of the municipal bond rate calculation is not necessary.
The long-term expected return on pension plan investments was determined using
building-block method in which best-estimate ranges of expected future real rates of
return (expected returns, net of pension plan investment expense and inflation) are
developed for each major asset class.
In determining the long-term expected rate of return, both short-term and long-term
market return expectations, as well as the expected pension fund cash flows, were
taken into account. Such cash flows were developed assuming that both members
and employers will make their required contributions on time and as scheduled in all
future years. Using historical returns of all the funds’ asset classes, expected
geometric returns were calculated over the short-term (first 10 years) and the long-
term (11-60 years) using building-block approach. Using the expected nominal
returns for both short-term and long-term, the present value of benefits was
calculated for each fund.
The table on the next page reflects long-term expected real rate of return by asset
class. The rate of return was calculated using the capital market assumptions applied
to determine the discount rate and asset allocation. These geometric rates of return are
net of administrative expenses.

2-81
Asset Class
New
Strategic
Allocation
Real Return
Years 1-101
Real Return
Years 11-202
Global Equity 47.00% 5.25% 5.71%
Global Fixed Income 19.00% 0.99% 2.43%
Inflation Sensitive 6.00% 0.45% 3.36%
Private Equity 12.00% 6.83% 6.95%
Real Estate 11.00% 4.50% 5.13%
Infrastructure & Forestland 3.00% 4.50% 5.09%
Liquidity 2.00% -0.55% -1.05%
1 An expected inflation of 2.5% used for this period 2 An expected inflation of 3% used for this period
(g) Pension Plan’s Fiduciary Net Position
The Plan Fiduciary Net Position includes receivables for employee service
buybacks, deficiency reserves, fiduciary self-insurance, and OPEB expense. The
Plan’s Fiduciary Net Position as of June 30, 2015 is $283.4 million.
(h) Pension Expense and Deferred Inflows/Outflows of Resources Related to Pensions
For the year ended June 30, 2016, VTA incurred a pension expense of $7.6 million
for the Plan. Amount
(In thousands)
Service cost 9,551$
Interest on the Total Pension Liability 26,479
Recognized changes in assumptions (1,791)
Recognized changes between expected and actual
experience 691
Plan to Plan resource movement (656)
Employee contributions (4,074)
Projected earnings on Pension Plan investments1
(21,168)
Recognized differences between projected and
actual earnings on Plan investments (1,754)
Administrative Expense 318
Pension Expense 7,596$
1 Net of administrative expenses
As of June 30, 2016, VTA’s deferred inflows/outflows of resources related to the
CalPERS pension plan are as follows, in thousands: Deferred
Outflows/
(Inflows)
of Resources
Net differences between Projected and
Actual Earnings on Pension Plan investments (2,301)$
Changes of Assumptions (4,656)
Differences between Expected and Actual
Experiences1,797
Pension Contributions subsequent to
measurement date 11,352
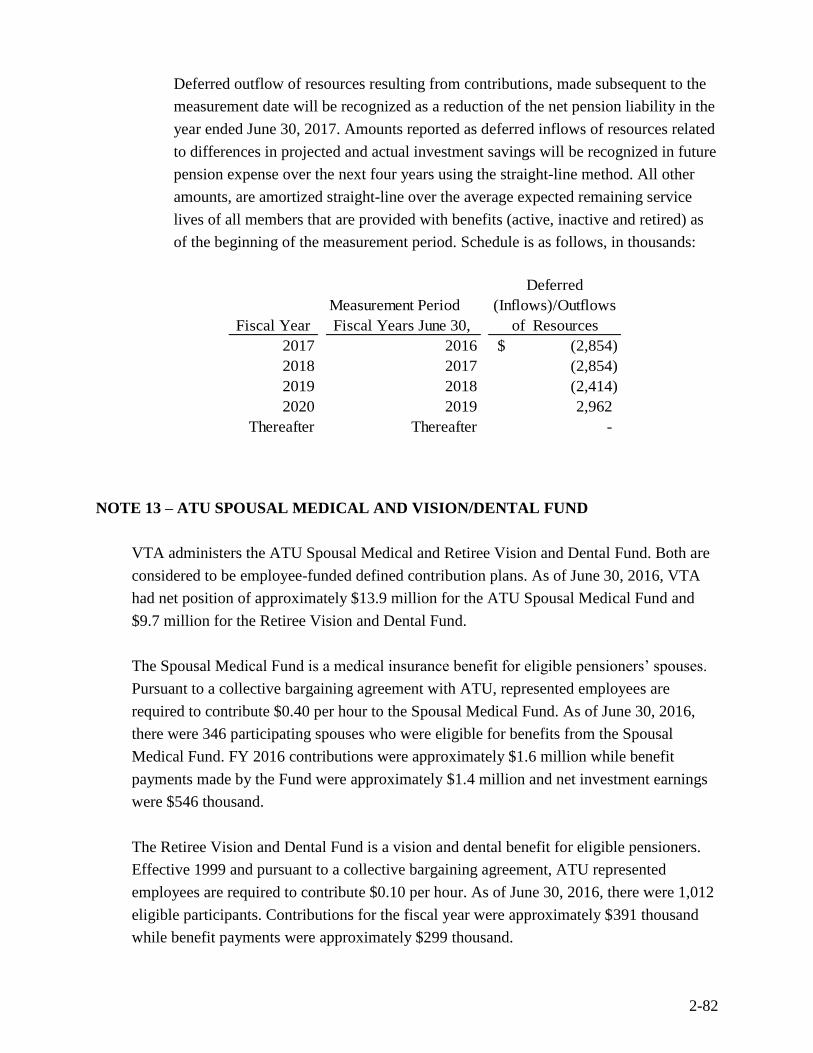
2-82
Deferred outflow of resources resulting from contributions, made subsequent to the
measurement date will be recognized as a reduction of the net pension liability in the
year ended June 30, 2017. Amounts reported as deferred inflows of resources related
to differences in projected and actual investment savings will be recognized in future
pension expense over the next four years using the straight-line method. All other
amounts, are amortized straight-line over the average expected remaining service
lives of all members that are provided with benefits (active, inactive and retired) as
of the beginning of the measurement period. Schedule is as follows, in thousands:
Fiscal Year
Measurement Period
Fiscal Years June 30,
Deferred
(Inflows)/Outflows
of Resources
2017 2016 (2,854)$
2018 2017 (2,854)
2019 2018 (2,414)
2020 2019 2,962
Thereafter Thereafter -
NOTE 13 – ATU SPOUSAL MEDICAL AND VISION/DENTAL FUND
VTA administers the ATU Spousal Medical and Retiree Vision and Dental Fund. Both are
considered to be employee-funded defined contribution plans. As of June 30, 2016, VTA
had net position of approximately $13.9 million for the ATU Spousal Medical Fund and
$9.7 million for the Retiree Vision and Dental Fund.
The Spousal Medical Fund is a medical insurance benefit for eligible pensioners’ spouses.
Pursuant to a collective bargaining agreement with ATU, represented employees are
required to contribute $0.40 per hour to the Spousal Medical Fund. As of June 30, 2016,
there were 346 participating spouses who were eligible for benefits from the Spousal
Medical Fund. FY 2016 contributions were approximately $1.6 million while benefit
payments made by the Fund were approximately $1.4 million and net investment earnings
were $546 thousand.
The Retiree Vision and Dental Fund is a vision and dental benefit for eligible pensioners.
Effective 1999 and pursuant to a collective bargaining agreement, ATU represented
employees are required to contribute $0.10 per hour. As of June 30, 2016, there were 1,012
eligible participants. Contributions for the fiscal year were approximately $391 thousand
while benefit payments were approximately $299 thousand.

2-83
A separate audited GAAP-basis postemployment benefit plan report is not available for
ATU Spousal Medical and Vision/Dental Fund.
NOTE 14 – INTERNAL SERVICE FUND
As of June 30, 2016, the assets and liabilities by individual components of the Internal
Service Fund by program are as follows (in thousands):
Workers'
Compensation
General
Liability
Compensated
Absence Total
Assets 17,309$ 7,118$ 22,003$ 46,430$
Liabilities* 17,309 7,118 28,696 53,123
Net Position -$ -$ (6,693)$ (6,693)$
*includes short-term liabilities
Workers’ Compensation and General Liability
VTA contracts with third-party administrators to process claims for both Workers’
Compensation and General Liability programs. VTA’s annual contribution to General
Liability program is based upon quarterly internal reviews of frequency and severity claims
experience. Workers’ Compensation fund contributions occur each pay period. Internally,
the Workers’ Compensation fund balance is reviewed quarterly to ensure it is appropriate
given the claims history. In addition, both funds are evaluated and reconciled based on
year-end actuarial valuations.
Actuarial Information
An actuarial analysis as of June 30, 2016 disclosed that the present values of estimated
outstanding losses, at 4% average discount rate using a 60% confidence level, are $17.3
million and $7.0 million for Workers’ Compensation and General Liability, respectively.
Changes in the balance of Workers’ Compensation and General Liability claims for the two
years ended June 30, 2015, and June 30, 2016, are as follows (in thousands): Workers’
Compensation
General
Liability
Unpaid claims at June 30, 2014 $ 18,506 $ 11,461
Provision for claims and claims adjustment expense 6,880 2,479
Changes in estimates for provision for future claims (2,767) 334
Payment for claims and other adjustments (4,185) (2,302)
Unpaid claims at June 30, 2015 18,434 11,972
Provision for claims and claims adjustment expense 6,606 2,752
Changes in estimates for provision for future claims (3,515) 35
Payment for claims and other adjustments (4,235) (7,734)
Unpaid claims at June 30, 2016 $ 17,290 $ 7,025

2-84
Compensated Absences
This represents the amount charged each month to accrue the estimated increase in unused
vacation and sick leave. This account is adjusted annually to reflect the year-end value of
unused vacation and sick leave. Compensated absences are limited to leaves that are
attributable to services already rendered and are not contingent on a specific event that is
outside the control of the employer and employee. At June 30, 2016, the outstanding
balance of compensated absences liability is $28.7 million.
NOTE 15 – SANTA CLARA VALLEY TRANSPORTATION AUTHORITY OTHER
POST EMPLOYMENT BENEFITS (OPEB) TRUST
(a) OPEB Trust Description
VTA offers postemployment benefits to its employees through the Santa Clara Valley
Transportation Authority Other Post Employment Benefit (OPEB) Trust, a single
employer defined benefit health plan funded and administered by VTA.
Employees who retire directly from VTA are eligible for retiree health benefits if they
meet certain requirements related to age and service. For ATU retirees, VTA provides
an ATU Retiree Health Care Program (the ATU Program), a post-employment
benefit, in accordance with the agreement between VTA and the ATU, to all ATU
represented employees who retire from VTA on or after attaining the age of 55 with
at least 15 years of service, or age 65 with 10 years of service, or upon Board
approval age 65 with 5 years of service, or if an employee becomes disabled and has
completed at least 10 years of service. ATU retirees can select from retiree health
plans offered under the CalPERS program. For ATU retirees living in California:
VTA will contribute up to $100 per month above the Kaiser Bay Area Single Party
rate for CalPERS medical plans, regardless of Medicare status. ATU retirees will pay
the excess above the VTA contribution of up to $100 per month above the Kaiser Bay
Area Single Party rate. For ATU retirees living outside of California: VTA will
contribute up to $100 per month above the Kaiser Out of State Single Party rate for
CalPERS medical plans, regardless of Medicare status. ATU retirees will pay the
excess above the VTA contribution of up to $100 per month above the Kaiser Out of
State Single Party rate. ATU retirees who are eligible for Medicare are reimbursed for
the Medicare Part B premium.
Non-ATU employees who retire directly from VTA on or after attaining the age of 50
years (Classic members) or 52 years (New members) with at least 5 years of
CalPERS service are also covered under a Retiree Health Care Program (the
administrative retiree program). Non-ATU retirees can select from retiree health
plans offered under the CalPERS program.

2-85
For Non-ATU retirees living in California: VTA will contribute up to the Kaiser Bay
Area Employee Only rate. Non-ATU retirees pay any premium in excess of the
CalPERS Kaiser Bay Area Employee Only rate.
For Non-ATU retirees living outside of California: VTA will contribute up to the
Kaiser Out of State Single Party rate. Non-ATU retirees pay any premium in excess
of the CalPERS Kaiser Out of State Single Party rate. Non-ATU retirees who are
eligible for Medicare are reimbursed for the Medicare Part B premium.
VTA also provides life insurance benefits for all ATU retirees and Executive
Management retirees. ATU retirees who retired prior to January 1, 2010, receive
$5,000 in life insurance coverage and those who retired on or after January 1, 2010,
receive $7,000 in life insurance coverage. Executive Management retirees receive
$50,000 in life insurance coverage for the first year of retirement, decreasing by
$10,000 each year until its expiration in the sixth year.
As of June 30, 2016, the number of retirees and active employees who met the
eligibility requirements for the ATU Program and non-ATU are as follows:
OPEB Eligible ATU Non-ATU Total
Retirees 1,024 487 1,511
Active (Vested) 728 460 1,188
(b) Basis of Accounting
Contributions are recognized as revenue when due, pursuant to formal commitments,
as well as statutory or contractual requirements. Benefits (distributions to
participants) and refunds of prior contributions are recognized when due and payable
in accordance with the terms of the Plan.
Investments are reported at fair value. Securities traded on a national or international
exchange are valued at the last reported sales price on the last business day of the
fiscal year at current exchange rates. Purchases and sales of securities are reflected on
the trade date and investment income is recognized as earned.
(c) Funding Policy
Benefit allowance provisions are established through agreements and memorandums
of understanding (MOU) between VTA and unions representing its employees.
VTA’s contributions to the plans are based on Annual Required Contribution (ARC)
as determined by an actuarial valuation study. In FY 2008, VTA established an

2-86
irrevocable trust to fund the ARC in accordance with the provisions of GASB
Statement 45.
As of June 30, 2016, VTA had assets of $275.6 million to cover costs of the ATU and
Non-ATU Programs. The Plan is presented in these financial statements as the OPEB
Trust Fund. Separate financial statements are also prepared for the Trust and can be
obtained from Santa Clara Valley Transportation Authority, Finance and Budget,
3331 North First Street, Building C-2, San Jose, California 95134-1927.
(d) Annual OPEB Cost and Net OPEB Obligations
VTA’s Annual Plan Cost (Expense) is calculated based on the Annual Required
Contribution (ARC) of the employer, an amount actuarially determined in accordance
with the parameters of GASB Statement 45. The ARC represents a level of funding
that, if paid on an ongoing basis, is projected to cover normal cost each year and
amortize any unfunded actuarial liabilities (or funding excess) over a period not to
exceed twenty years, using a closed amortization methodology. OPEB activities
during FY 2016 are as follows (in thousands):
Annual Required Contributions (4,785)$
Interest on Net Plan Asset1
-
Annual Plan Cost (Expense) (4,785)
Contributions Made -
Net OPEB Asset, Beginning of Year 20,650
Net OPEB Asset, End of Year 15,865$
1VTA’s adjustment to the ARC was offset by interest requiring no adjustment to the current year’s ARC.
In FY 2013, VTA Transit Fund made a one-time irrevocable transfer of $20.65
million to OPEB Trust Fund. This was included in VTA Transit unrestricted net
position earmarked for future operational needs of OPEB Trust Fund. OPEB Trust
Fund reflected this as a contribution during FY 2013. Plan cost, contribution made,
the percentage of annual cost contributed to the Plan, and the net Plan assets for the
years ended June 30, 2014, through 2016 are presented as follows (in thousands):
Fiscal Year
Ended
Annual
OPEB Cost
VTA
Contribution
Percentage
of Annual
OPEB Cost
Contributed
Net
OPEB Asset
6/30/16 4,785$ 4,785$ * 100% 15,865$
6/30/15 12,000 12,000 100% 20,650
6/30/14 14,100 14,100 100% 20,650
Net OPEB Obligation/Asset
* This year's contribution was offset by the reduction of Net OPEB Asset

2-87
(e) Funding Status and Funding Progress
Actuarial valuations of an ongoing plan involve estimates of the value of reported
amounts and assumptions about the probability of occurrence of events far into the
future. Examples include assumptions about future employment, mortality, and the
healthcare cost trend. Amounts determined regarding the funded status of the plan
and annual required contributions of the employer are subject to continual revision as
actual results are compared with past expectations and new estimates are made about
the future.
As of June 30, 2015, the most recent actuarial valuation date, the plan was 108.7%
funded. The actuarial accrued liability was $253.3 million and the actuarial value of
assets was $275.4 million, with $22.1 million in an overfunded actuarial accrued
liability. The covered payroll was $167.1 million which resulted in 13.2% overfunded
actuarial accrued liability as a percent of covered payroll.
The schedule of funding progress is presented on page 2-95, in the required
supplementary information following the notes to the financial statements.
(f) Actuarial Methods and Assumptions
A summary of principal assumptions and methods used by the actuaries to determine
VTA’s annual required contributions to the Plan is as follows:
Description Methods/Assumptions
Valuation date June 30, 2015
Actuarial Cost Method Individual Entry Age
Amortization Method Level dollar closed
Asset valuation method Market value
Remaining Amortization Period 13 years
Actuarial assumptions:
Discount rate 7.00%
Payroll growth rate 3.25%
Ultimate rate of medical inflation 4.50%
NOTE 16 – CLAIMS, COMMITMENTS, AND CONTINGENCIES
The VTA is exposed to liability for bodily injury and property damage; physical damage to
and loss of its property; and liability for financial loss suffered by employees and others as
a result of various risk exposures inherent to public transportation services and congestion
management oversight.
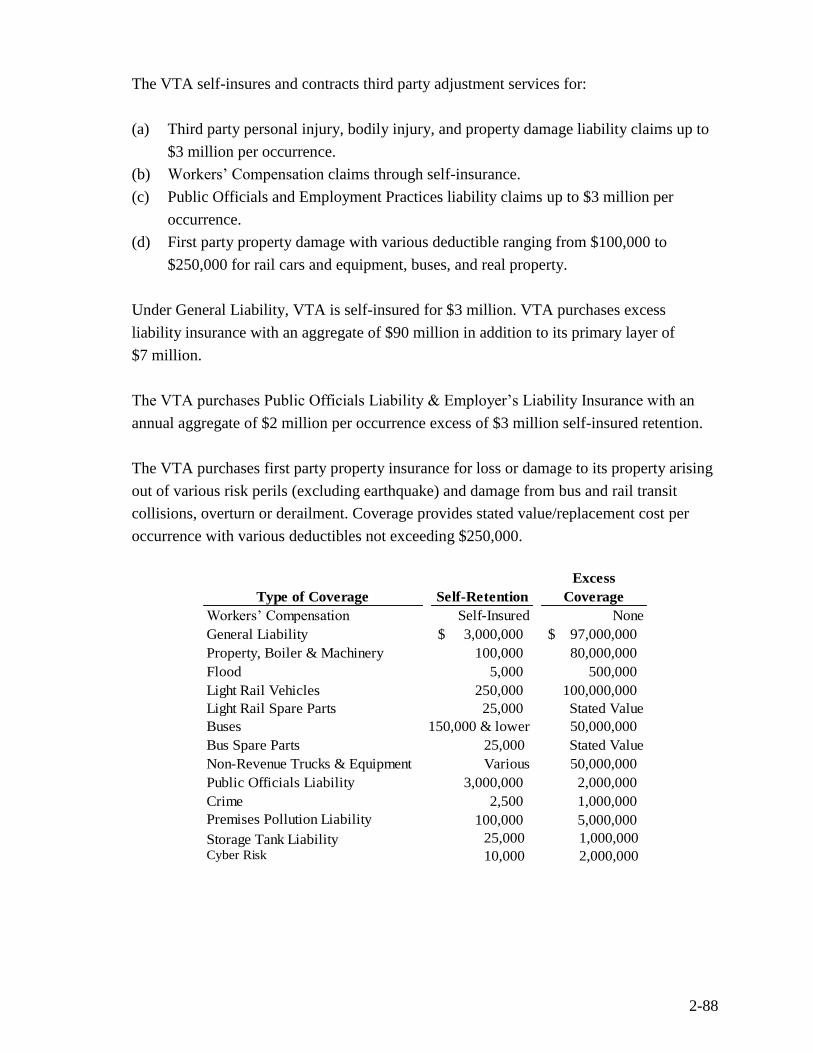
2-88
The VTA self-insures and contracts third party adjustment services for:
(a) Third party personal injury, bodily injury, and property damage liability claims up to
$3 million per occurrence.
(b) Workers’ Compensation claims through self-insurance.
(c) Public Officials and Employment Practices liability claims up to $3 million per
occurrence.
(d) First party property damage with various deductible ranging from $100,000 to
$250,000 for rail cars and equipment, buses, and real property.
Under General Liability, VTA is self-insured for $3 million. VTA purchases excess
liability insurance with an aggregate of $90 million in addition to its primary layer of
$7 million.
The VTA purchases Public Officials Liability & Employer’s Liability Insurance with an
annual aggregate of $2 million per occurrence excess of $3 million self-insured retention.
The VTA purchases first party property insurance for loss or damage to its property arising
out of various risk perils (excluding earthquake) and damage from bus and rail transit
collisions, overturn or derailment. Coverage provides stated value/replacement cost per
occurrence with various deductibles not exceeding $250,000.
Type of Coverage Self-Retention
Excess
Coverage
Workers’ Compensation Self-Insured None
General Liability $ 3,000,000 $ 97,000,000
Property, Boiler & Machinery 100,000 80,000,000
Flood 5,000 500,000
Light Rail Vehicles 250,000 100,000,000
Light Rail Spare Parts 25,000 Stated Value
Buses 150,000 & lower 50,000,000
Bus Spare Parts 25,000 Stated Value
Non-Revenue Trucks & Equipment Various 50,000,000
Public Officials Liability 3,000,000 2,000,000
Crime 2,500 1,000,000
Premises Pollution Liability 100,000 5,000,000
Storage Tank Liability 25,000 1,000,000
Cyber Risk 10,000 2,000,000
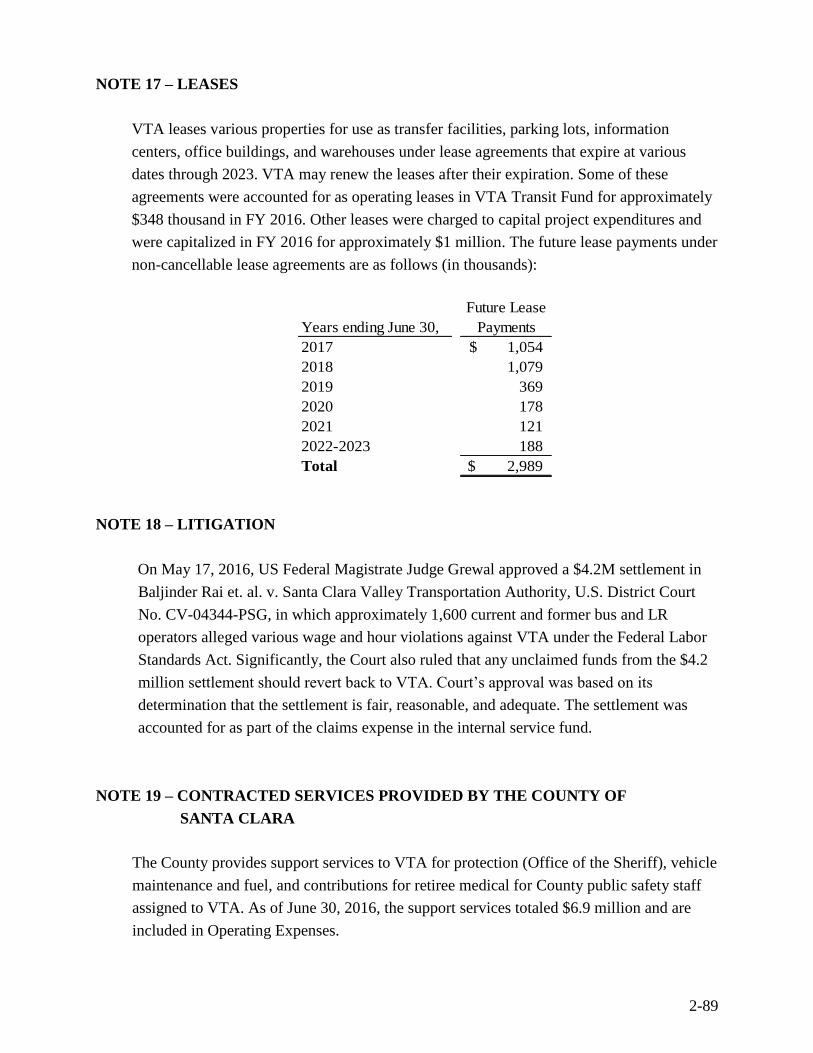
2-89
NOTE 17 – LEASES
VTA leases various properties for use as transfer facilities, parking lots, information
centers, office buildings, and warehouses under lease agreements that expire at various
dates through 2023. VTA may renew the leases after their expiration. Some of these
agreements were accounted for as operating leases in VTA Transit Fund for approximately
$348 thousand in FY 2016. Other leases were charged to capital project expenditures and
were capitalized in FY 2016 for approximately $1 million. The future lease payments under
non-cancellable lease agreements are as follows (in thousands):
Years ending June 30,
Future Lease
Payments
2017 1,054$
2018 1,079
2019 369
2020 178
2021 121
2022-2023 188
Total $ 2,989
NOTE 18 – LITIGATION
On May 17, 2016, US Federal Magistrate Judge Grewal approved a $4.2M settlement in
Baljinder Rai et. al. v. Santa Clara Valley Transportation Authority, U.S. District Court
No. CV-04344-PSG, in which approximately 1,600 current and former bus and LR
operators alleged various wage and hour violations against VTA under the Federal Labor
Standards Act. Significantly, the Court also ruled that any unclaimed funds from the $4.2
million settlement should revert back to VTA. Court’s approval was based on its
determination that the settlement is fair, reasonable, and adequate. The settlement was
accounted for as part of the claims expense in the internal service fund.
NOTE 19 – CONTRACTED SERVICES PROVIDED BY THE COUNTY OF
SANTA CLARA
The County provides support services to VTA for protection (Office of the Sheriff), vehicle
maintenance and fuel, and contributions for retiree medical for County public safety staff
assigned to VTA. As of June 30, 2016, the support services totaled $6.9 million and are
included in Operating Expenses.
2-90
NOTE 20 – JOINT VENTURES
(a) Peninsula Corridor Joint Powers Board
VTA is a member agency of the Peninsula Corridor Joint Powers Board (PCJPB),
along with the San Mateo County Transit District (SamTrans) and the City and
County of San Francisco (CCSF). The PCJPB is governed by a separate board
composed of nine members, three from each participating agency. The PCJPB was
formed in October 1991 to plan, administer, and operate the Peninsula Corridor rail
service (Caltrain), which began operating on July 1, 1992. Prior to July 1, 1992, such
rail service was operated by Caltrans.
The net operating costs and administrative expenses of the PCJPB for services
provided between San Francisco and San Jose are reimbursed by the member
agencies. In FY 2016, VTA, SamTrans, and CCSF were responsible for 40.3%,
41.9%, and 17.8%, respectively, of the member agencies’ total reimbursement for
such expenses. During the year ended June 30, 2016, VTA paid $8.4 million to the
PCJPB for operating costs.
SamTrans serves as the managing agency of the PCJPB, providing administrative
personnel and facilities. The disbursement of funds received by the PCJPB is
controlled by provisions of various grant contracts entered into with the U.S.
government, the state, and the member agencies.
VTA’s agreement with the PCJPB expired in 2001 and continues in full force and
effect on a year-to-year basis, until any member provides a one-year’s prior written
notice of withdrawal. If two or more parties to the agreement withdraw, then the
agreement shall terminate at the end of the fiscal year following expiration of the one-
year’s notice given by the second party. In that event, the property and funds of the
PCJPB would be distributed to the member agencies in accordance with a separate
agreement to be entered into between the parties.
Summary financial information (not included in VTA’s financial statements) for the
PCJPB for the years ended June 30, 2015 and 2014 (in thousands), appear on the next
page. FY 2015 is the most recent audited financial information.

2-91
PCJPB Financial Information 2015 2014
Total assets $1,452,213 $1,389,395
Total liabilities (135,238) (112,395)
Total net position $1,316,975 $1,277,000
Operating revenues $ 90,763 $ 82,145
Operating expenses (195,410) (189,212)
Non-operating revenues, net 29,397 34,380
Capital contributions 115,225 111,349
Change in net position $ 39,975 $ 38,662
Complete financial statements for the PCJPB can be obtained from SamTrans at 1250
San Carlos Avenue, San Carlos, California 94070.
(b) Altamont Corridor Express
The Altamont Corridor Express (ACE) is a commuter rail service covering over 85
miles between Stockton and San Jose with stops in Manteca, Tracy, Livermore,
Pleasanton, Fremont, Santa Clara, and San Jose. ACE is funded by VTA, the
Alameda County Congestion Management Agency, and the San Joaquin Regional
Rail Commission which also serves as the managing agency. ACE commenced
operations in October 1998, and now provides four daily round trips commuter rail
service from San Joaquin County through the Tri-Valley Area of Alameda County to
Santa Clara County. In June 2003, VTA entered into a Cooperative Service
Agreement with the San Joaquin Regional Rail Commission (SJRRC) and the
Alameda County Transportation Commission (Alameda CTC) for continued VTA
funding of ACE commuter rail service. The cooperative agreement replaced the ACE
Joint Powers Agreement (JPA) executed by the ACE member agencies – VTA,
SJRRC, and Alameda CTC. Per the cooperative agreement, VTA’s financial subsidy
is the amount paid in FY 2003, increased annually by the consumer price index (CPI).
During the year ended June 30, 2016, VTA contributed approximately $3.1 million
for operating costs.
Summary financial information (not included in VTA’s financial statements) for the
Altamont Corridor Express for the years ended June 30, 2015, and 2014 (in
thousands), appear on the next page. FY 2015 is the most recent audited financial
information.

2-92
ACE Financial Information 2015 2014
Total assets $ 181,021 $ 173,945
Total liabilities (58,983) (63,076)
Total net position $ 122,038 $ 110,869
Operating revenues $ 7,991 $ 6,885
Operating expenses (23,802) (23,688)
Non-operating revenues, net 12,842 12,137
Capital contributions 14,050 12,566
Transfer in/(out) 88 -
Prior Year's restatement - (481)
Change in net position $ 11,169 $ 7,419
Complete financial statements for ACE can be obtained from the San Joaquin
Regional Rail Commission at 949 East Channel Street, Stockton, California 95202.
(c) Capitol Corridor Intercity Rail Service
VTA is a member agency of the Capitol Corridor Joint Powers Authority, which
provides intercity rail service between Sacramento and San Jose. The Capitol
Corridor intercity rail service is provided by the Capitol Corridor Joint Powers Board,
which is comprised of members of the governing bodies of VTA, the Sacramento
Regional Transit District, the Placer County Transportation Planning Agency, the
congestion management agencies of Solano and Yolo counties, and the San Francisco
Bay Area Rapid Transit District (BART). BART is the managing agency for the
Capitol Corridor Service. VTA offers no funds to the operation of this service.
Complete financial statements for the Capitol Corridor Service can be obtained from
the San Francisco Bay Area Rapid Transit District (BART) at P.O. Box 12688,
Oakland, California 94606-2688.
NOTE 21 – OTHER FINANCING TRANSACTIONS
(a) Lease/Leaseback
In 1998 and 2003 VTA entered into a total of six lease/leaseback transactions with
five investors: KBC Bank N.V., Firth Third Leasing Company, Comerica Leasing
Corporation, US Bancorp, and First Hawaiian Leasing Inc. The leases involved a total
of 116 light rail vehicles. The light rail vehicles were leased using statutory trusts (the
“Trusts”) formed on behalf of the parties to the transactions. In each case, pursuant to
a head-lease agreement, VTA leased rail vehicles to an investor and in turn received a
prepayment of the future headlease rents that would be due through the purchase
option date. Pursuant to a sublease, each investor then leased the rail vehicles to
VTA. Sufficient monies from prepayment of the headlease rents were invested in
highly rated securities to fund all sublease rents and the purchase option payments.

2-93
Remaining monies were used to pay transaction costs, with the balance then going to
VTA as an upfront cash benefit. Highly rated insurance companies were used to
provide guaranties for certain aspects of the transactions. Subsequent to the closing of
the leases, the Internal Revenue Service disallowed the tax benefits the investors were
anticipating and as a result of the 2008 financial crisis the credit ratings of the
insurance providers were dramatically lowered below thresholds required in the lease
documents, resulting in the possibility of a default.
Subsequent to these adverse developments KBC Bank N.V. and US Bancorp were
each willing to terminate their transactions on favorable terms. The remaining three
investors either entered into agreements with VTA to resolve the potential for default
or otherwise provided forbearance for the ratings downgrades of the insurers. The
remaining leases with First Hawaiian Leasing, Comerica Leasing Corporation, and
with Firth Third Leasing Company provide purchase option dates of January 2, 2017,
January 1, 2027 and January 1, 2034, respectively.
VTA has provided notice to First Hawaiian Leasing Corporation of VTA’s intention
to exercise its purchase option on the purchase option date, January 2, 2017.
Subsequent to purchase option date three payments will be paid during calendar year
2017 from the maturing securities invested at the outset of the lease.
During August 2016, VTA and Comerica Leasing reached agreement on a favorable
termination by early exercise of the purchase option and the lease was terminated on
August 30, 2016.
(b) Sublease Agreement with Utah Transit Authority (UTA)
In May 2003, VTA entered into a further sub-lease agreement with the Utah Transit
Authority (UTA) to lease 29 rail vehicles related to VTA’s sublease with First
Hawaiian Leasing Corporation. Pursuant to the agreement with UTA, UTA has
provided notice to VTA of its desire to exercise UTA’s purchase option, which is
dependent on VTA’s successful exercise of its purchase option. As stated above,
VTA has provided notice to First Hawaiian Leasing Corporation of VTA’s intention
to exercise its purchase option on the purchase option date, January 2, 2017.

2-94
NOTE 22 – SUBSEQUENT EVENT
(a) Lease/Leaseback
Comerica terminated the lease on favorable terms on August 30, 2016. VTA
recovered $1.5 million net of expenses that will be recorded as revenue.
(b) Federal Funding Grant Agreement
The 2015 Federal Section 5309 New Starts funding for the VTA’s Silicon Valley
Berryessa Extension Project of $150 million was awarded in September 2016. Of the
$900 million grant commitment from the FTA for the project, $702.6 million has
been awarded to date.

REQUIRED SUPPLEMENTARY INFORMATION (Other than MD&A)
THIS PAGE IS INTENTIONALLY LEFT BLANK

2-95
SANTA CLARA VALLEY TRANSPORTATION AUTHORITY
Required Supplementary Information
Schedule of Changes in Net Pension Liability and Related Ratios
For the Years ended June 30, 2014 to 2016
Amalgamated Transit Union Pension Plan
(Unaudited)
(In Thousands)
2016* 2015 2014
Total Pension Liability
Service cost 14,788$ 13,468$ 12,094$
Interest (includes interest on service cost) 45,110 43,069 41,417
Difference between expected and actual experience 7,748 4,517 -
Changes in assumptions 14,577 - -
Benefit payments, including refunds of member contributions (35,588) (33,418) (30,967)
Net change in total pension liability 46,635 27,636 22,544
Total Pension Liability, beginning 611,678 584,042 561,498
Total Pension Liability, ending 658,313 611,678 584,042
Plan Fiduciary Net Position
Contributions - employer 25,751 25,590 25,787
Net investment income 2,245 16,094 64,139
Benefit payments, including refunds of member contributions (35,588) (33,418) (30,967)
Administrative expense (281) (301) (313)
Net change in Plan Fiduciary Net Position (7,873) 7,965 58,646
Plan Fiduciary Net Position, beginning 489,191 481,226 422,580
Plan Fiduciary Net Position, ending 481,318 489,191 481,226
Net Pension Liability, ending 176,995$ 122,487$ 102,816$
Plan Fiduciary Net Position as a percentage of the
Total Pension Liability 73.11% 79.98% 82.40%
Covered-employee Payroll 126,796$ 115,914$ 107,880$
Net Pension Liability as a percentage of covered-employee payroll 139.59% 105.67% 95.31%
*Notes to schedule:
Change in assumptions:
1) Investment rate of return: Reduced from 7.5% in 2015 to 7.25% in 2016, net of investment expense
2) Inflation: reduced from 3.25% in 2015 to 3% in 2016.
Benefit changes: There were no changes in the benefit during the year.
Information not available prior to FY 2014.

2-96
SANTA CLARA VALLEY TRANSPORTATION AUTHORITY
Required Supplementary Information
Schedule of Employer Contributions
For the Years ending June 30, 2007 to 2016
Amalgamated Transit Union Pension Plan
(Unaudited)
(In Thousands)
2016* 2015 2014 2013 2012 2011 2010 2009 2008 2007
Contractually-required Contribution 25,720$ 25,549$ 25,787$ 24,413$ 19,148$ 17,807$ 17,905$ 14,843$ 16,137$ 14,859$
Contributions in Relation to the
Actuarially-determined Contribution 25,751 25,590 25,787 24,413 19,148 17,807 17,905 14,843 16,137 14,859
Contributions Deficiency/(Excess) (31)$ (41)$ -$ -$ -$ -$ -$ -$ -$ -$
Covered-employee Payroll 126,796$ 115,914$ 107,880$ 104,136$ 104,726$ 98,741$ 98,036$ 99,775$ 99,408$ 94,847$
Contributions as a Percentage of
Covered-employee Payroll 20.31% 22.08% 23.90% 23.44% 18.28% 18.03% 18.26% 14.88% 16.23% 15.67%
*Notes to schedule:
Timing
Key Methods and Assumptions Used to Determine Contribution Rate:
Actuarial cost method Entry Age
Asset valuation method
Amortization method
Discount rate: 7.50%
Amortization growth rate: 0.00%
Price inflation: 3.25%
Salary increases:
Mortality:
3.25% plus merit component based on years of service
Sex distinct RP-2000 Combined Blue Collar Mortality,
(setback one year for females) projected to 2025 using
50% of Scale BB
Actuarially-determined contribution
rates are calculated based on the
actuarial valuation six months prior to
the beginning of the fiscal year
5-year smoothed market, subject to 80%/120% corridor
All unfunded liability charges are amortized over a
rolling 20-year period as a level dollar amount
No benefit modification during the last ten years.

2-97
SANTA CLARA VALLEY TRANSPORTATION AUTHORITY
Required Supplementary Information
Schedule of Changes in Net Pension Liability and Related Ratios
For the Years ended June 30, 2015 and 2016
California Public Employees’ Retirement System (CalPERS)
(Unaudited)
(In Thousands)
2016* 2015
TOTAL PENSION LIABILITY
Service cost 9,551$ 9,055$
Interest 26,479 24,724
Changes in Assumptions (6,447) -
Difference between Expect and Actual Experience 2,488 -
Benefit payments, including refunds of employee contributions (14,341) (12,834)
Net Change in Total Pension Liability 17,730 20,945
Total Pension Liability - Beginning 352,487 331,542
Total Pension Liability - Ending (a) 370,217 352,487
PLAN FIDUCIARY NET POSITION
Contributions - Employer 8,684 8,845
Contributions - Employee 4,075 4,482
Net Investment Income 1
6,042 41,263
Benefit payments, including refunds of employee contributions (14,341) (12,834)
Plan to Plan Resource Movement 656 -
Net Change in Fiduciary Net Position 5,116 41,756
Plan Fiduciary Net Position - Beginning 278,275 236,519
Plan Fiduciary Net Position - Ending (b) 283,391 278,275
Plan Net Pension Liability/(Asset) - Ending (a) - (b) 86,826$ 74,212$
Plan Fiduciary Net Position as a Percentage of the Total
Pension Liability 76.55% 78.95%
Covered-Employee Payroll 60,375$ 54,294$
Plan Net Pension Liability/(Asset) as a Percentage of Covered
Employee Payroll 143.81% 136.69% 1Net of administrative expenses
* Notes to Schedule:
Benefit Changes: The figures above do not include any liability impact that may have resulted from plan
changes which occurred after June 30, 2014 validation date. This applies for voluntary benefit changes as
well as any offers of Two Years Additional Service Credit.
Change of assumption: The discount rate was changed from 7.5% in 2015 to 7.65% in 2016 (both rates
were net of Pension Plan Investment Expenses).
Information not available prior to FY 2015.

2-98
SANTA CLARA VALLEY TRANSPORTATION AUTHORITY
Required Supplementary Information
Schedule of Employer Contributions
For the Years ending June 30, 2007 to 2016
California Public Employees’ Retirement System (CalPERS)
(Unaudited)
(In Thousands)
2016 2015a
2014 2013 2012 2011 2010 2009 2008 2007
Contractually Required Contribution 10,567$ 8,965$ 8,845$ 7,497$ 7,159$ 6,090$ 6,167$ 6,507$ 6,728$ 5,929$
Contributions in Relation to the
Contractually Required 10,567 8,965 8,845 7,497 7,159 6,090 6,167 6,507 6,728 5,929
Contributions Deficiency/(Excess) -$ -$ -$ -$ -$ -$ -$ -$ -$ -$
Covered-employee Payroll 63,927$ 60,375$ 54,294$ 52,712$ 53,950$ 51,626$ 53,231$ 54,589$ 51,043$ 49,682$
Contributions as a Percentage of
Covered-employee Payroll 16.53% 14.85% 16.29% 14.22% 13.27% 11.80% 11.59% 11.92% 13.18% 11.93%
Notes to Schedule: aThe actuarial methods and assumptions used to set the actuarially-determined contributions for were based
on valuation reports three years prior.
Entry Age Normal
Level Percent of Payroll
Actuarial value of assets
2.75%
Varies by entry age and service
3.00%
7.65% Net of Pension Plan Investment expenses; includes inflation.
The probabilities of Retirement are based on the 2010 CalPERS Experience Study for
the period 1997 to 2007.
The probabilities of mortality are based on the 2010 CalPERS Experience Study for
the period 1997 to 2007. Pre-retirement and Post-retirement rates include 5 years of
projected mortality improvement using Scale AA published by the Society of
Actuaries.
Actuarial cost method
Amortization method
Asset valuation method
Inflation
Salary increases
Payroll growth
Investment rate of return
Retirement age
Mortality
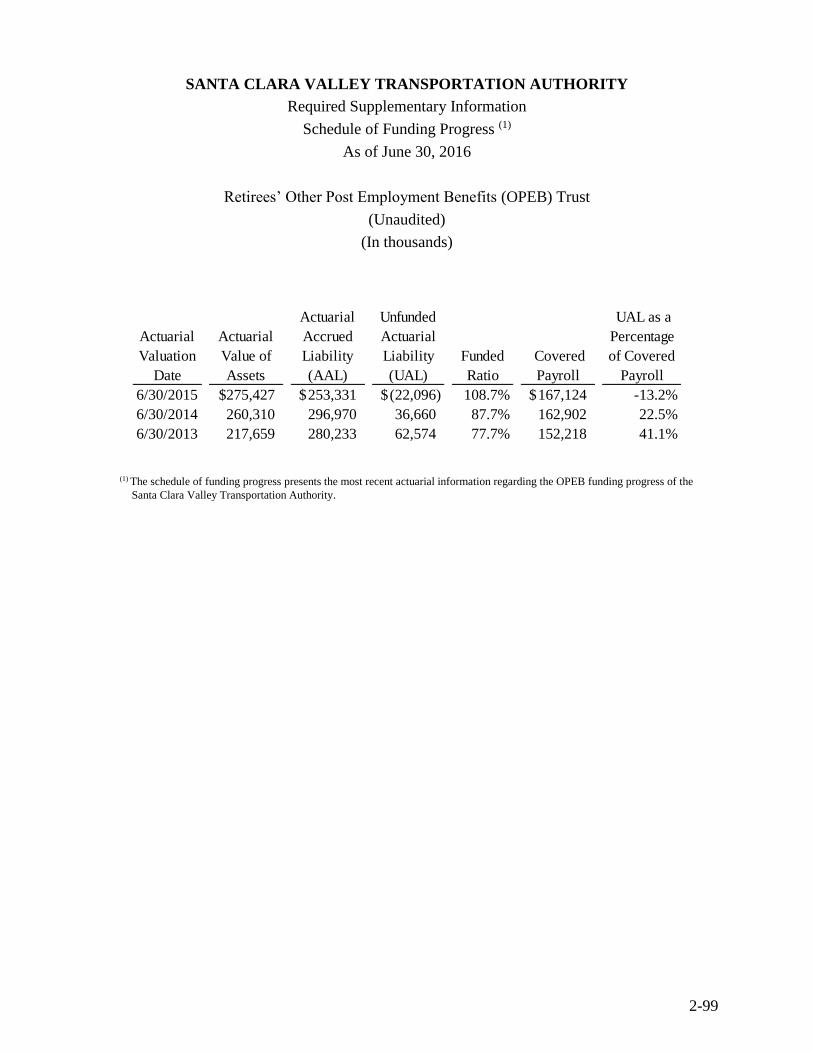
2-99
SANTA CLARA VALLEY TRANSPORTATION AUTHORITY
Required Supplementary Information
Schedule of Funding Progress (1)
As of June 30, 2016
Retirees’ Other Post Employment Benefits (OPEB) Trust
(Unaudited)
(In thousands)
(1) The schedule of funding progress presents the most recent actuarial information regarding the OPEB funding progress of the
Santa Clara Valley Transportation Authority.
Actuarial
Valuation
Date
Actuarial
Value of
Assets
Actuarial
Accrued
Liability
(AAL)
Unfunded
Actuarial
Liability
(UAL)
Funded
Ratio
Covered
Payroll
UAL as a
Percentage
of Covered
Payroll
6/30/2015 275,427$ 253,331$ (22,096)$ 108.7% 167,124$ -13.2%
6/30/2014 260,310 296,970 36,660 87.7% 162,902 22.5%
6/30/2013 217,659 280,233 62,574 77.7% 152,218 41.1%

2-100
SANTA CLARA VALLEY TRANSPORTATION AUTHORITY
Required Supplementary Information
Budgetary Comparison Schedule
Congestion Management Program Special Revenue Fund
For the Year ended June 30, 2016
(In thousands)
Original
Budget
Final
Budget Actual
Variance
Final to
Actual
Positive/
(Negative)
Revenue:
Assessments to member agencies 2,407$ 2,407$ 2,407$ -$
Federal grant revenues 2,098 2,098 1,887 (211)
Administrative fees 115 115 122 7
State and local operating assistance grants 895 895 699 (196)
Other revenues 235 235 155 (80)
Investment earnings 12 12 8 (4)
Total Revenue 5,762 5,762 5,278 (484)
Expenditures:
VTA labor and overhead costs 4,207 4,221 4,221 -
Services and other:
Professional services 1,545 1,531 1,176 355
Other services 12 12 14 (2)
Data processing 13 13 7 6
Contribution to Other Agencies 214 214 210 4
Total Expenditures 5,991 5,991 5,628 363
Change in fund balance, on a budgetary basis (229)$ (229)$ (350) (121)$
Revenues and Expenditures not budgeted:
Unrealized gain/loss on investments 9
Amortization of investment premium/discount (1)
Change in fund balance, on a GAAP basis (342)
Fund Balance, Beginning of Year 1,499
Fund Balance, End of Year 1,157$
Budgetary Basis of Accounting
State law requires the adoption of an annual budget, which must be approved by the
VTA’s Board of Directors. The VTA Board adopts a biennial budget for its Congestion
Management Program Special Revenue Fund. The budget for the Special Revenue Fund
is prepared on a modified accrual basis but excludes unrealized gains and losses on
investments and amortization of premiums and discounts.

2-101
Budgetary control is maintained at the fund level. The Division Chief must authorize line
item reclassification amendments to the budget. Managers are assigned the responsibility
for controlling their budgets and monitoring operating expenses. Annual appropriations
for the operating budget lapse at the end of the fiscal year to the extent that they have not
been expended. The unexpended capital budget at fiscal year- end is carried forward from
year to year until the project is completed.

THIS PAGE IS INTENTIONALLY LEFT BLANK

SUPPLEMENTARY INFORMATION (Combining and Individual Fund Statements)

THIS PAGE IS INTENTIONALLY LEFT BLANK

2-102
SANTA CLARA VALLEY TRANSPORTATION AUTHORITY
Comparative Schedule of Fund Net Position
Enterprise Funds
June 30,
(In thousands)
2016 2015
ASSETS
Current assets:
Cash and cash equivalents 57,966$ 3,760$
Investments 259,379 298,234
Receivables, net 4,071 3,221
Due from other agencies 50,070 -
Inventories 32,040 77,764
Due from other funds - 22,070
Other current assets 1,575 2,399
Total current assets 405,101 407,448
Restricted assets:
Cash and cash equivalents 7,565 40,045
Cash and investments with fiscal agent 72,675 68,831
Investments 740,309 760,545
Receivables, net 4 -
Due from other funds 274 8,373
Due from other agencies 149,685 143,046
Other current assets 248 235
Total restricted current assets 970,760 1,021,075
Non-current assets:
Net OPEB Asset 15,865 20,650
Intangible Assets 3,085 3,966
Capital Assets
Nondepreciable:
Land and right-of-way 1,126,359 1,124,646
Construction in progress 2,611,823 2,177,750
Depreciable:
Caltrain - Gilroy extension 43,072 43,072
Buildings, improvements, furniture, and fixtures 569,079 548,139
Vehicles 553,886 566,821
Light-rail tracks and electrification 418,195 415,905
Leasehold improvement 9,686 9,686
Other 47,289 47,156
Less: Accumulated depreciation (881,683) (833,095)
Net capital assets 4,497,706 4,100,080
Total Assets 5,892,517 5,553,219
DEFERRED OUTFLOW OF RESOURCES
Accumulated decrease in fair value of hedging instruments,
deferred amount on refunding, & deferred outflow of
resources-pension related 208,206 127,922
(Continued)
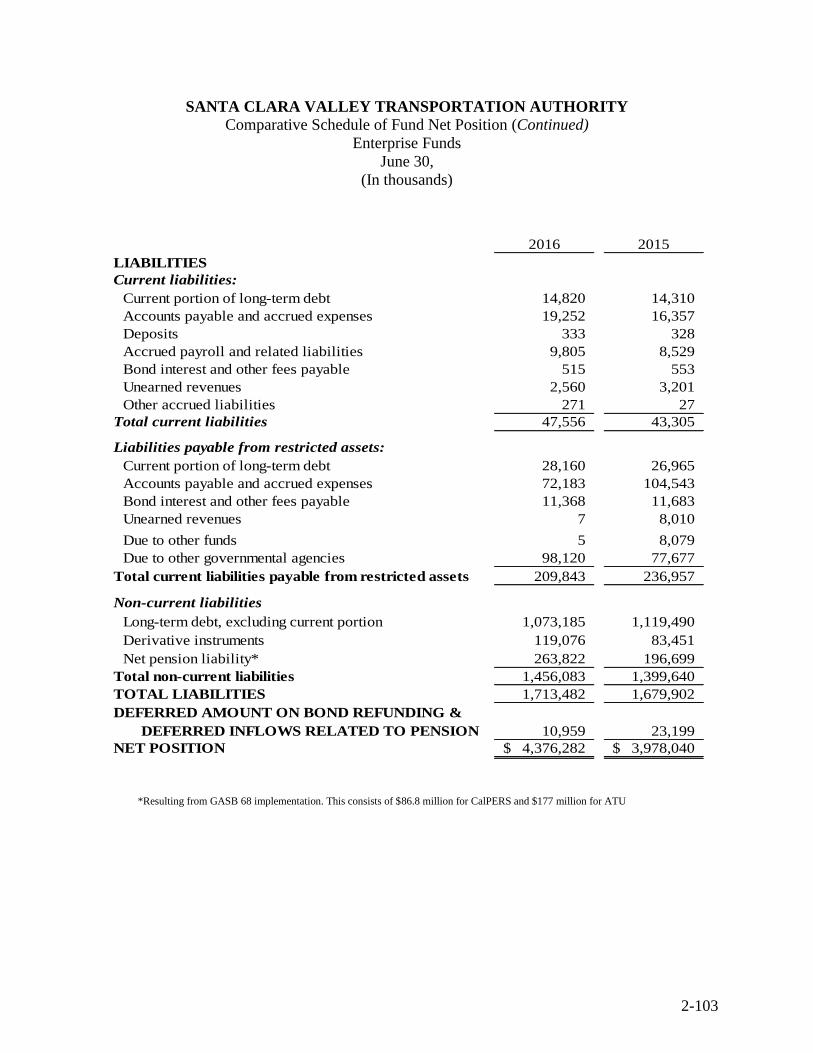
2-103
SANTA CLARA VALLEY TRANSPORTATION AUTHORITY
Comparative Schedule of Fund Net Position (Continued)
Enterprise Funds
June 30,
(In thousands)
2016 2015
LIABILITIES
Current liabilities:
Current portion of long-term debt 14,820 14,310
Accounts payable and accrued expenses 19,252 16,357
Deposits 333 328
Accrued payroll and related liabilities 9,805 8,529
Bond interest and other fees payable 515 553
Unearned revenues 2,560 3,201
Other accrued liabilities 271 27
Total current liabilities 47,556 43,305
Liabilities payable from restricted assets:
Current portion of long-term debt 28,160 26,965
Accounts payable and accrued expenses 72,183 104,543
Bond interest and other fees payable 11,368 11,683
Unearned revenues 7 8,010
Due to other funds 5 8,079
Due to other governmental agencies 98,120 77,677
Total current liabilities payable from restricted assets 209,843 236,957
Non-current liabilities
Long-term debt, excluding current portion 1,073,185 1,119,490
Derivative instruments 119,076 83,451
Net pension liability* 263,822 196,699
Total non-current liabilities 1,456,083 1,399,640
TOTAL LIABILITIES 1,713,482 1,679,902
DEFERRED AMOUNT ON BOND REFUNDING &
DEFERRED INFLOWS RELATED TO PENSION 10,959 23,199
NET POSITION 4,376,282$ 3,978,040$
*Resulting from GASB 68 implementation. This consists of $86.8 million for CalPERS and $177 million for ATU

2-104
SANTA CLARA VALLEY TRANSPORTATION AUTHORITY
Comparative Schedule of Revenues, Expenses, and Changes in Fund Net Position
Enterprise Fund
For the Years ended June 30,
(In thousands)
2016 2015
OPERATING REVENUES:
Passenger fares 37,663$ 39,108$
Toll revenues collected 1,274 1,157
Advertising and other 3,379 2,789
TOTAL OPERATING REVENUES 42,316 43,054
OPERATING EXPENSES:
Labor cost 309,510 286,689
Materials and supplies 32,005 32,407
Services 33,447 28,883
Utilities 8,921 8,316
Casualty and Liability 4,923 5,238
Purchased transportation 21,477 19,241
Leases and rentals 919 714
Miscellaneous 2,111 1,735
Depreciation expense 62,386 65,677
Costs allocated to capital and other programs (32,039) (32,441)
TOTAL OPERATING EXPENSE 443,660 416,459
OPERATING LOSS (401,344) (373,405)
NON-OPERATING REVENUES (EXPENSES)
Sales tax revenue 460,316 446,374
Federal operating assistance and other grants 4,105 24,553
Federal subsidy for Build America Bonds 8,748 8,715
State and local operating assistance grants 114,135 110,243
Caltrain subsidy (8,414) (8,390)
Capital expenses on behalf of, and
contribution to, other agencies (53,094) (61,445)
Altamont Commuter Express subsidy (3,166) (3,097)
Investment earnings 18,493 9,118
Interest expense (11,330) (15,204)
Other income 2,913 20,371
Other expense (4,177) (5,734)
NON-OPERATING REVENUE, NET 528,529 525,504
INCOME (LOSS) BEFORE CONTRIBUTIONS 127,185 152,099
CAPITAL CONTRIBUTIONS 271,057 277,421
CHANGE IN NET POSITION 398,242 429,520
NET POSITION, BEGINNING OF YEAR 3,978,040 3,737,514
Adjustment to Net position due to GASB 68 Implementation - (188,994)
NET POSITION, BEGINNING OF YEAR 3,978,040 3,548,520
NET POSITION, END OF YEAR 4,376,282$ 3,978,040$

2-105
SANTA CLARA VALLEY TRANSPORTATION AUTHORITY Comparative Schedule of Cash Flows
Enterprise Funds
For the Years Ended June 30,
2016 2015
CASH FLOWS FROM OPERATING ACTIVITIES
Cash received from passenger fares 36,939$ 40,212$
Cash received from toll revenues collected 1,238 1,186
Cash received from advertising 2,896 2,973
Cash paid to employees (260,259) (256,849)
Cash paid to suppliers (88,350) (82,515)
Cash paid for purchased transportation (21,477) (19,241)
Other receipts/(payments) 105 -
Net cash provided by/(used in) operating activities (328,908) (314,234)
CASH FLOWS FROM NONCAPITAL FINANCING ACTIVITIES
Operating grants received 146,389 205,749
Sales tax received 462,254 394,349
Caltrain subsidy (8,414) (8,390)
Altamont Commuter Express subsidy (3,166) (3,097)
Capital contribution to other agencies (48,671) (61,845)
Transfers in - 30,122
Transfers out - (30,118)
Net cash provided by/(used in) non-capital financing activities 548,392 526,770
CASH FLOWS FROM CAPITAL AND RELATED FINANCING ACTIVITIES
Payment of long-term debt (41,275) (137,130)
Proceeds from issuance of long-term debt - 89,980
Premium on issuance of long-term bonds - 20,035
Issuance and other cost - 429
Proceeds from sale of properties - 16,732
Advance (to)/from other governments 19,229 (23,102)
Interest and other fees paid on long-term debt (15,067) (29,159)
Acquisition and construction of capital assets (489,366) (561,405)
Capital contribution from other entities 255,244 390,772
Net cash provided by/(used in) capital and related financing activities (271,235) (232,848)
CASH FLOWS FROM INVESTING ACTIVITIES
Proceeds from sale of investments 2,632,607 3,433,451
Purchases of investments (2,567,983) (3,591,390)
Interest income received 12,697 8,905
Net cash provided by/(used in) investing activities 77,321 (149,034)
NET INCREASE/( DECREASE) IN CASH AND CASH EQUIVALENTS 25,570 (169,346)
CASH AND CASH EQUIVALENTS, BEGINNING OF YEAR 112,636 281,982
CASH AND CASH EQUIVALENTS, END OF YEAR 138,206$ 112,636$
(continued on next page)
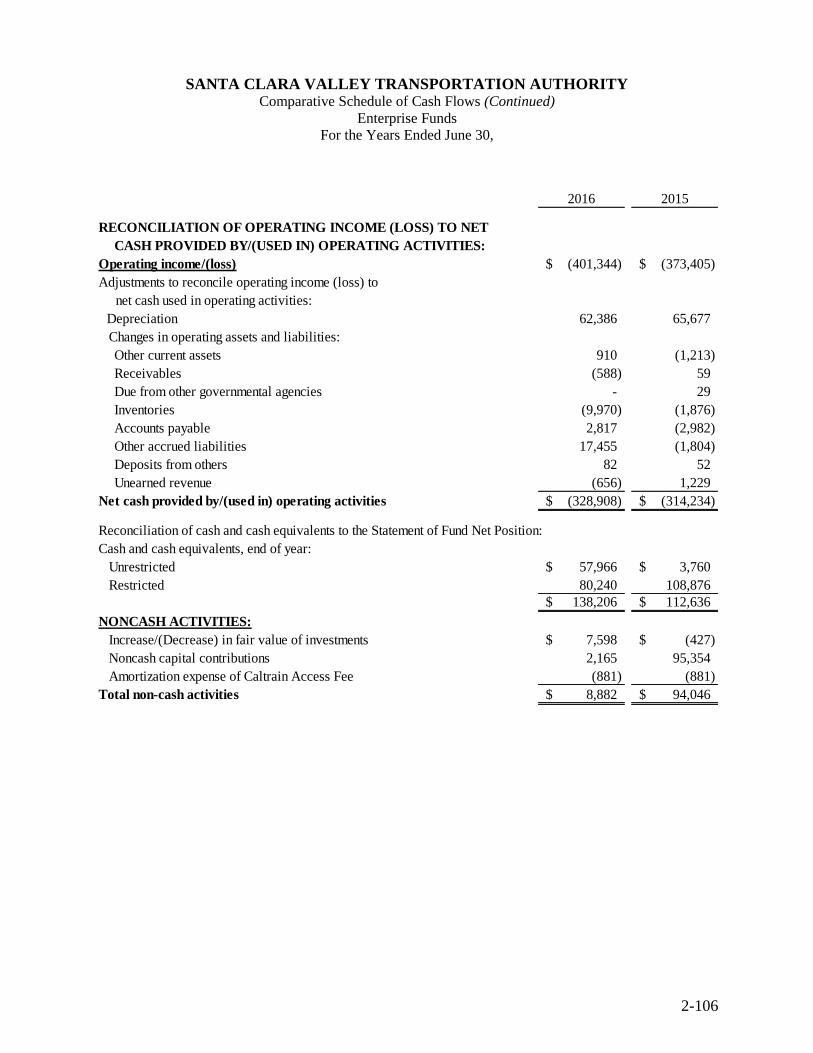
2-106
SANTA CLARA VALLEY TRANSPORTATION AUTHORITY Comparative Schedule of Cash Flows (Continued)
Enterprise Funds
For the Years Ended June 30,
2016 2015
RECONCILIATION OF OPERATING INCOME (LOSS) TO NET
CASH PROVIDED BY/(USED IN) OPERATING ACTIVITIES:
Operating income/(loss) (401,344)$ (373,405)$
Adjustments to reconcile operating income (loss) to
net cash used in operating activities:
Depreciation 62,386 65,677
Changes in operating assets and liabilities:
Other current assets 910 (1,213)
Receivables (588) 59
Due from other governmental agencies - 29
Inventories (9,970) (1,876)
Accounts payable 2,817 (2,982)
Other accrued liabilities 17,455 (1,804)
Deposits from others 82 52
Unearned revenue (656) 1,229
Net cash provided by/(used in) operating activities (328,908)$ (314,234)$
Reconciliation of cash and cash equivalents to the Statement of Fund Net Position:
Cash and cash equivalents, end of year:
Unrestricted 57,966$ 3,760$
Restricted 80,240 108,876
138,206$ 112,636$
NONCASH ACTIVITIES:
Increase/(Decrease) in fair value of investments 7,598$ (427)$
Noncash capital contributions 2,165 95,354
Amortization expense of Caltrain Access Fee (881) (881)
Total non-cash activities 8,882$ 94,046$

2-107
SANTA CLARA VALLEY TRANSPORTATION AUTHORITY Budgetary Comparison Schedule – Enterprise Fund
VTA Transit Fund
For the year ended June 30, 2016
(In thousands)
FY 2016
Adopted Final Positive
Budget Budget Actual (Negative)
REVENUES
Fares 40,618$ 40,618$ 37,663$ (2,955)$
1976 1/2 Cent Sales Tax 207,439 207,439 205,418 (2,021)
Transportation Development Act funds 97,496 97,496 98,519 1,023
Measure A Sales Tax Operating Assistance 38,287 38,287 37,954 (333)
STA 14,765 14,765 13,632 (1,133)
Federal Operating Grants 11,704 11,704 4,105 (7,599)
State Operating Grants 2,223 2,223 1,984 (238)
Investment Earnings 1,425 1,425 2,580 1,155
Advertising Income 2,115 2,115 2,515 400
Debt Reduction Fund Contribution 19,965 19,965 19,965 -
Transfer for Capital (33,600) (33,600) (33,600) -
Other Income 17,752 17,752 17,944 191
Total revenues 420,189 420,189 408,680 (11,509)
OPERATING EXPENSES
Labor Costs 308,673 310,073 300,238 9,835
Materials & Supplies 19,408 19,408 22,949 (3,541)
Security 12,473 12,183 11,420 763
Professional & Special Services 7,465 7,772 5,829 1,943
Other Services 7,693 7,893 7,748 145
Fuel 12,573 12,723 7,830 4,893
Traction Power 3,819 3,819 4,241 (422)
Tires 2,114 2,114 2,068 46
Utilities 2,895 3,010 3,105 (95)
Insurance 5,716 5,716 4,923 793
Data Processing 4,779 4,779 3,916 863
Office Expense 426 426 425 -
Communications 1,606 1,606 1,562 44
Employee Related Expense 1,027 1,045 1,048 (3)
Leases & Rents 776 776 919 (143)
Miscellaneous 709 952 911 41
Reimbursements (38,838) (38,838) (36,374) (2,465)
Total operating expenses 353,313 355,456 342,758 12,698
OTHER EXPENSES
Paratransit 19,817 19,817 19,805 12
Caltrain 8,390 8,390 8,414 (24)
Altamont Corridor Express 5,023 5,023 4,838 185
Highway 17 Express 366 366 270 96
Monterey-San Jose Express Service 35 35 35 -
Contribution to Other Agencies 8,967 8,379 890 7,488
Debt Service 21,668 21,668 21,351 317
Contingencies 2,000 1,845 - 1,845
Total other expenses 66,266 65,523 55,603 9,920
Total operating and other expenses 419,579 420,979 398,361 22,618
Change in net position, on a budgetary basis 610$ (790)$ 10,319$ 11,109$
(continued on next page)
NOTE: Totals and subtotals may not be precise due to independent rounding
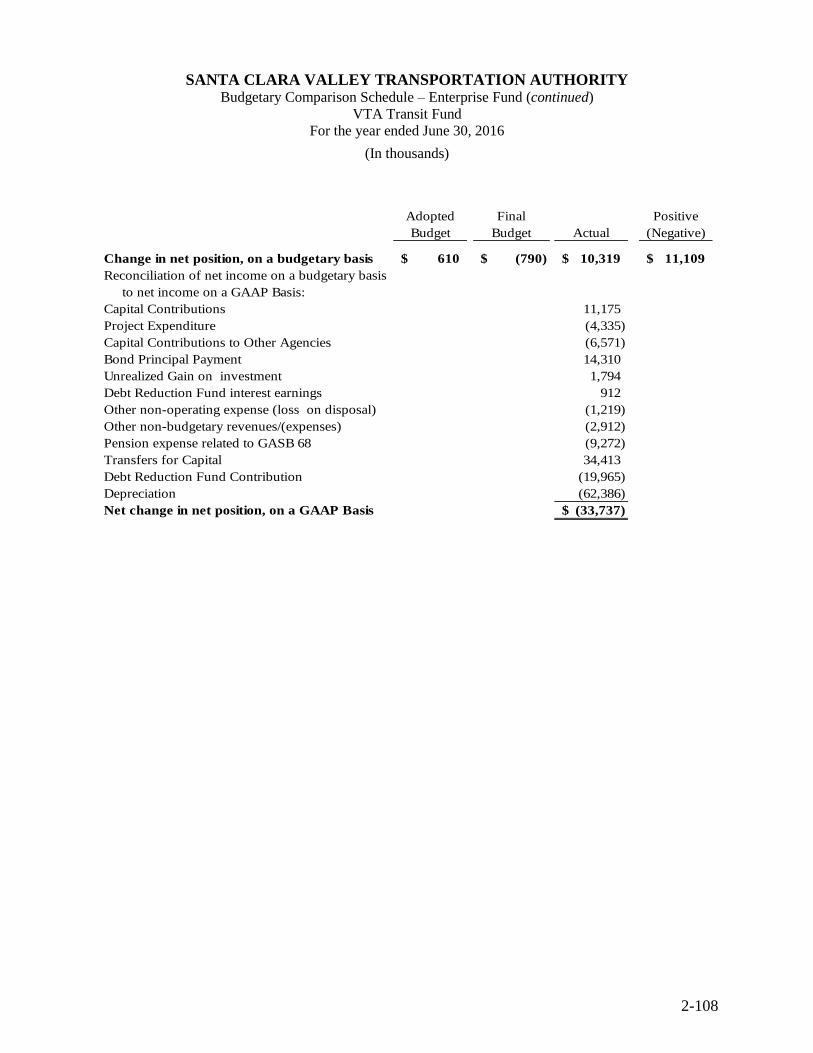
2-108
SANTA CLARA VALLEY TRANSPORTATION AUTHORITY Budgetary Comparison Schedule – Enterprise Fund (continued)
VTA Transit Fund
For the year ended June 30, 2016
(In thousands)
Adopted Final Positive
Budget Budget Actual (Negative)
Change in net position, on a budgetary basis 610$ (790)$ 10,319$ 11,109$
Reconciliation of net income on a budgetary basis
to net income on a GAAP Basis:
Capital Contributions 11,175
Project Expenditure (4,335)
Capital Contributions to Other Agencies (6,571)
Bond Principal Payment 14,310
Unrealized Gain on investment 1,794
Debt Reduction Fund interest earnings 912
Other non-operating expense (loss on disposal) (1,219)
Other non-budgetary revenues/(expenses) (2,912)
Pension expense related to GASB 68 (9,272)
Transfers for Capital 34,413
Debt Reduction Fund Contribution (19,965)
Depreciation (62,386)
Net change in net position, on a GAAP Basis (33,737)$
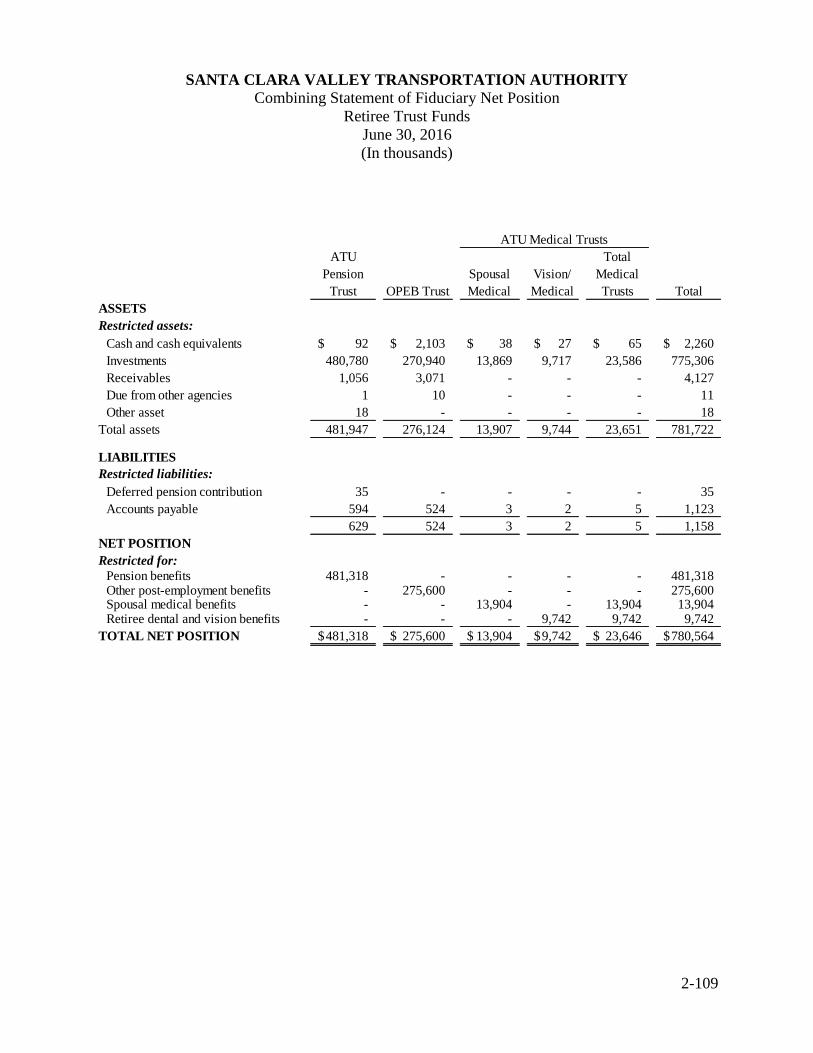
2-109
SANTA CLARA VALLEY TRANSPORTATION AUTHORITY
Combining Statement of Fiduciary Net Position
Retiree Trust Funds
June 30, 2016
(In thousands)
ATU
Pension
Trust OPEB Trust
Spousal
Medical
Vision/
Medical
Total
Medical
Trusts Total
ASSETS
Restricted assets:
Cash and cash equivalents 92$ 2,103$ 38$ 27$ 65$ 2,260$
Investments 480,780 270,940 13,869 9,717 23,586 775,306
Receivables 1,056 3,071 - - - 4,127
Due from other agencies 1 10 - - - 11
Other asset 18 - - - - 18
Total assets 481,947 276,124 13,907 9,744 23,651 781,722
LIABILITIES
Restricted liabilities:
Deferred pension contribution 35 - - - - 35
Accounts payable 594 524 3 2 5 1,123
629 524 3 2 5 1,158
NET POSITION
Restricted for:
Pension benefits 481,318 - - - - 481,318 Other post-employment benefits - 275,600 - - - 275,600 Spousal medical benefits - - 13,904 - 13,904 13,904 Retiree dental and vision benefits - - - 9,742 9,742 9,742
TOTAL NET POSITION 481,318$ 275,600$ 13,904$ 9,742$ 23,646$ 780,564$
ATU Medical Trusts

2-110
SANTA CLARA VALLEY TRANSPORTATION AUTHORITY
Combining Statement of Changes in Fiduciary Net Position
Retiree Trust Funds
For the Year ended June 30, 2016
(In thousands)
ATU
Pension OPEB Spousal Vision/ Total
Trust Trust Medical Dental Medical Trusts Total
ADDITIONS Contributions 25,751$ 16$ 1,571$ 391$ 1,962$ 27,729$ Investment earnings:
Investment income 22,010 34,745 2 2 4 56,759
Net appreciation/(depreciation)
in the fair value of investments (17,424) (24,468) 545 379 924 (40,968)
Investment expense (2,344) (420) (2) (2) (4) (2,768)
Net investment income 2,242 9,857 545 379 924 13,023
TOTAL ADDITIONS 27,993 9,873 2,116 770 2,886 40,752
DEDUCTIONS
Benefit payments 35,588 9,663 1,431 299 1,730 46,981
Administrative expenses 281 37 - - - 318
TOTAL DEDUCTIONS 35,869 9,700 1,431 299 1,730 47,299
CHANGE IN NET POSITION (7,876) 173 685 471 1,156 (6,547)
NET POSITION, BEGINNING OF YEAR 489,194 275,427 13,219 9,271 22,490 787,111
NET POSITION, END OF YEAR 481,318$ 275,600$ 13,904$ 9,742$ 23,646$ 780,564$
ATU Medical Trusts

2-111
SANTA CLARA VALLEY TRANSPORTATION AUTHORITY
Combining Statement of Fiduciary Assets and Liabilities
Agency Funds
June 30, 2016
(In thousands)
BAAQMD SB83 VRF
Program Agency Total
Assets
Restricted assets:
Cash and cash equivalents 1,103$ 1,639$ 2,742$
Investments 4,240 23,928 28,168
Total Assets 5,343 25,567 30,910
Liabilities
Liabilities payable from restricted assets:
Accounts Payable 313 28 341
Program payable 5,030 25,539 30,569
Total Liabilities Payable from Restricted Assets 5,343$ 25,567$ 30,910$
Note: Measure B Ancillary Program closed in FY 2016.
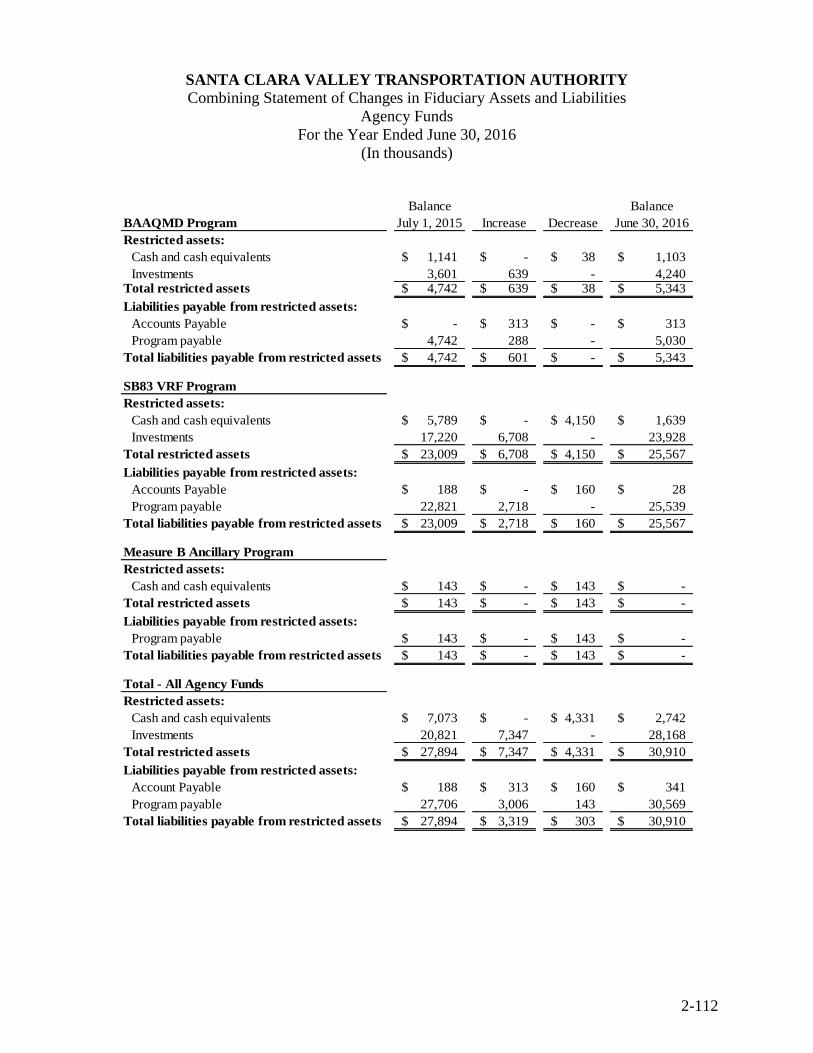
2-112
SANTA CLARA VALLEY TRANSPORTATION AUTHORITY
Combining Statement of Changes in Fiduciary Assets and Liabilities
Agency Funds
For the Year Ended June 30, 2016
(In thousands)
Balance Balance
BAAQMD Program July 1, 2015 Increase Decrease June 30, 2016
Restricted assets:
Cash and cash equivalents 1,141$ -$ 38$ 1,103$
Investments 3,601 639 - 4,240 Total restricted assets 4,742$ 639$ 38$ 5,343$
Liabilities payable from restricted assets:
Accounts Payable -$ 313$ -$ 313$
Program payable 4,742 288 - 5,030
Total liabilities payable from restricted assets 4,742$ 601$ -$ 5,343$
SB83 VRF Program
Restricted assets:
Cash and cash equivalents 5,789$ -$ 4,150$ 1,639$
Investments 17,220 6,708 - 23,928
Total restricted assets 23,009$ 6,708$ 4,150$ 25,567$
Liabilities payable from restricted assets:
Accounts Payable 188$ -$ 160$ 28$
Program payable 22,821 2,718 - 25,539
Total liabilities payable from restricted assets 23,009$ 2,718$ 160$ 25,567$
Measure B Ancillary Program
Restricted assets:
Cash and cash equivalents 143$ -$ 143$ -$
Total restricted assets 143$ -$ 143$ -$
Liabilities payable from restricted assets:
Program payable 143$ -$ 143$ -$
Total liabilities payable from restricted assets 143$ -$ 143$ -$
Total - All Agency Funds
Restricted assets:
Cash and cash equivalents 7,073$ -$ 4,331$ 2,742$
Investments 20,821 7,347 - 28,168
Total restricted assets 27,894$ 7,347$ 4,331$ 30,910$
Liabilities payable from restricted assets:
Account Payable 188$ 313$ 160$ 341$
Program payable 27,706 3,006 143 30,569
Total liabilities payable from restricted assets 27,894$ 3,319$ 303$ 30,910$

THIS PAGE IS INTENTIONALLY LEFT BLANK
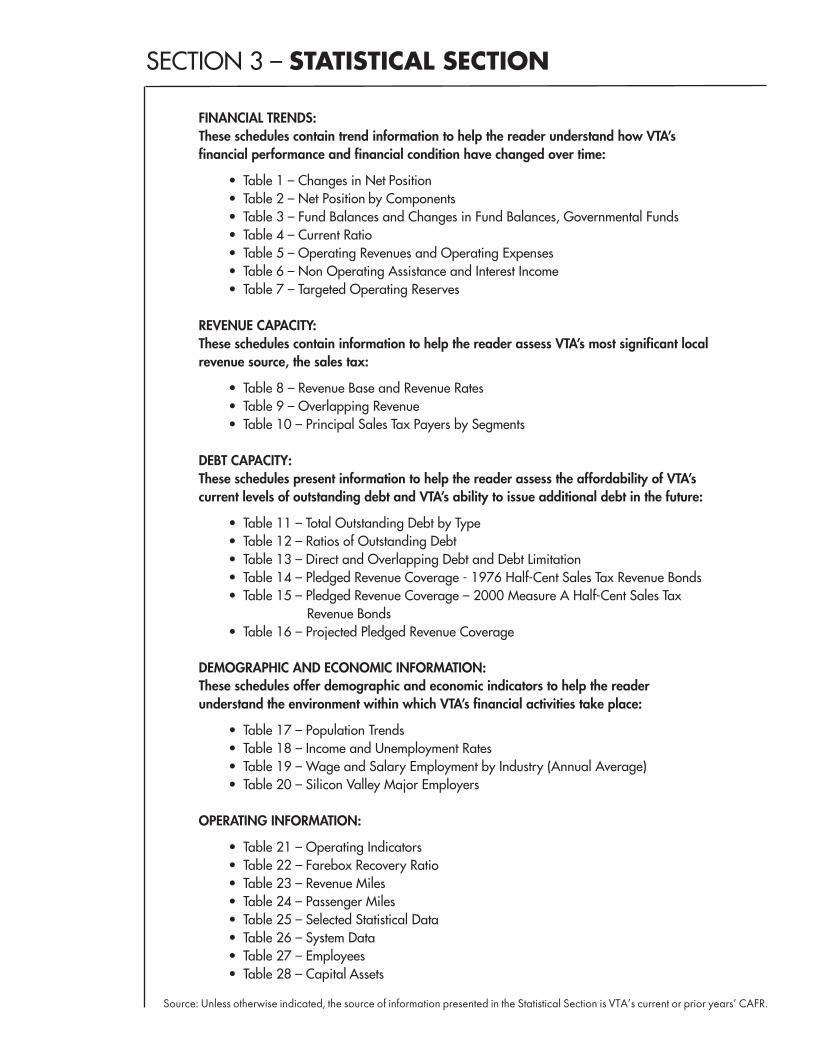
SECTION 3 – STATISTICAL SECTION
FINANCIAL TRENDS:These schedules contain trend information to help the reader understand how VTA’s financial performance and financial condition have changed over time:
• Table 1 – Changes in Net • Table 2 – Net by Components• Table 3 – Fund Balances and Changes in Fund Balances, Governmental Funds• Table 4 – Current Ratio• Table 5 – Operating Revenues and Operating Expenses• Table 6 – Non Operating Assistance and Interest Income• Table 7 – Targeted Operating Reserves
REVENUE CAPACITY:These schedules contain information to help the reader assess VTA’s most significant local revenue source, the sales tax:
• Table 8 – Revenue Base and Revenue Rates• Table 9 – Overlapping Revenue• Table 10 – Principal Sales Tax Payers by Segments
DEBT CAPACITY:These schedules present information to help the reader assess the affordability of VTA’s current levels of outstanding debt and VTA’s ability to issue additional debt in the future:
• Table 11 – Total Outstanding Debt by Type• Table 12 – Ratios of Outstanding Debt• Table 13 – Direct and Overlapping Debt and Debt Limitation• Table 14 – Pledged Revenue Coverage - 1976 Half-Cent Sales Tax Revenue Bonds• Table 15 – Pledged Revenue Coverage – 2000 Measure A Half-Cent Sales Tax
Revenue Bonds• Table 16 – Projected Pledged Revenue Coverage
DEMOGRAPHIC AND ECONOMIC INFORMATION:These schedules offer demographic and economic indicators to help the reader understand the environment within which VTA’s financial activities take place:
• Table 17 – Population Trends• Table 18 – Income and Unemployment Rates• Table 19 – Wage and Salary Employment by Industry (Annual Average)• Table 20 – Silicon Valley Major Employers
OPERATING INFORMATION:
• Table 21 – Operating Indicators• Table 22 – Farebox Recovery Ratio• Table 23 – Revenue Miles• Table 24 – Passenger Miles• Table 25 – Selected Statistical Data• Table 26 – System Data• Table 27 – Employees• Table 28 – Capital
PositionPosition
Assets
Source: Unless otherwise indicated, the source of information presented in the Statistical Section is VTA’s current or prior years’ CAFR.

THIS PAGE IS INTENTIONALLY LEFT BLANK
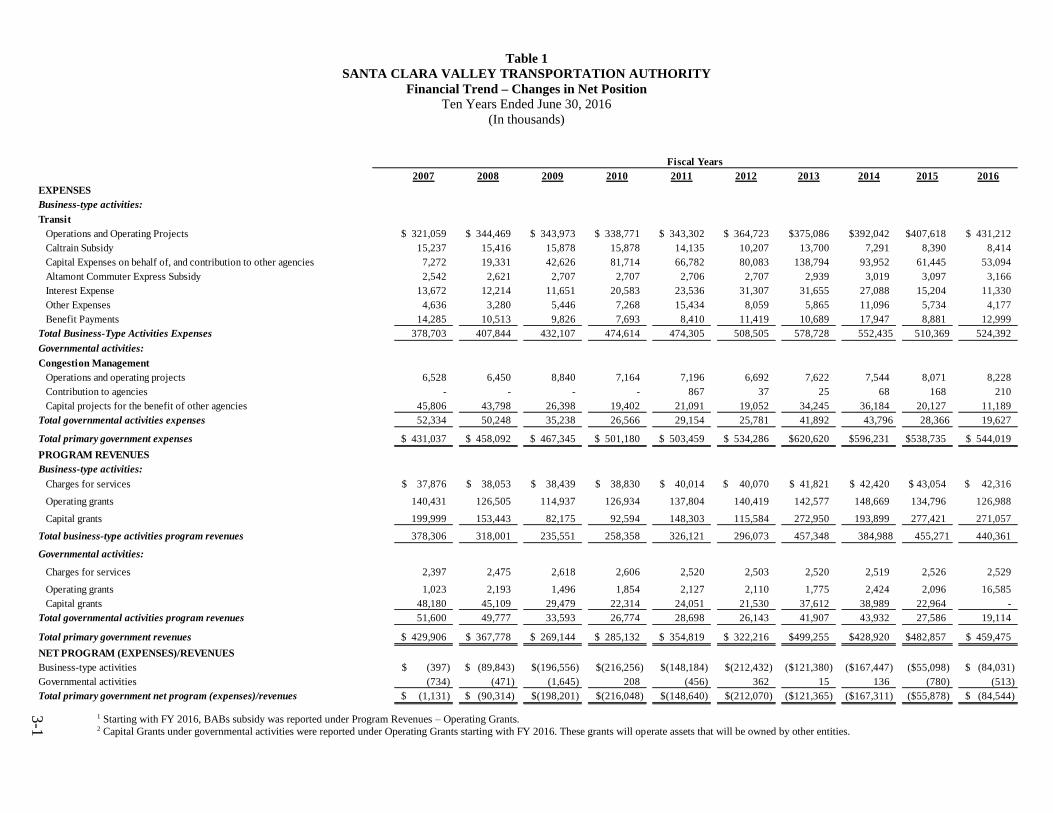
3-1
Table 1
SANTA CLARA VALLEY TRANSPORTATION AUTHORITY
Financial Trend – Changes in Net Position
Ten Years Ended June 30, 2016
(In thousands)
2007 2008 2009 2010 2011 2012 2013 2014 2015 2016
EXPENSES
Business-type activities:
Transit
Operations and Operating Projects 321,059$ 344,469$ 343,973$ 338,771$ 343,302$ 364,723$ $375,086 $392,042 $407,618 431,212$
Caltrain Subsidy 15,237 15,416 15,878 15,878 14,135 10,207 13,700 7,291 8,390 8,414
Capital Expenses on behalf of, and contribution to other agencies 7,272 19,331 42,626 81,714 66,782 80,083 138,794 93,952 61,445 53,094
Altamont Commuter Express Subsidy 2,542 2,621 2,707 2,707 2,706 2,707 2,939 3,019 3,097 3,166
Interest Expense 13,672 12,214 11,651 20,583 23,536 31,307 31,655 27,088 15,204 11,330
Other Expenses 4,636 3,280 5,446 7,268 15,434 8,059 5,865 11,096 5,734 4,177
Benefit Payments 14,285 10,513 9,826 7,693 8,410 11,419 10,689 17,947 8,881 12,999
Total Business-Type Activities Expenses 378,703 407,844 432,107 474,614 474,305 508,505 578,728 552,435 510,369 524,392
Governmental activities:
Congestion Management
Operations and operating projects 6,528 6,450 8,840 7,164 7,196 6,692 7,622 7,544 8,071 8,228
Contribution to agencies - - - - 867 37 25 68 168 210
Capital projects for the benefit of other agencies 45,806 43,798 26,398 19,402 21,091 19,052 34,245 36,184 20,127 11,189
Total governmental activities expenses 52,334 50,248 35,238 26,566 29,154 25,781 41,892 43,796 28,366 19,627
Total primary government expenses 431,037$ 458,092$ 467,345$ 501,180$ 503,459$ 534,286$ $620,620 $596,231 $538,735 544,019$
PROGRAM REVENUES
Business-type activities:
Charges for services 37,876$ 38,053$ 38,439$ 38,830$ 40,014$ 40,070$ 41,821$ 42,420$ 43,054$ 42,316$
Operating grants 140,431 126,505 114,937 126,934 137,804 140,419 142,577 148,669 134,796 126,988
Capital grants 199,999 153,443 82,175 92,594 148,303 115,584 272,950 193,899 277,421 271,057
Total business-type activities program revenues 378,306 318,001 235,551 258,358 326,121 296,073 457,348 384,988 455,271 440,361
Governmental activities:
Charges for services 2,397 2,475 2,618 2,606 2,520 2,503 2,520 2,519 2,526 2,529
Operating grants 1,023 2,193 1,496 1,854 2,127 2,110 1,775 2,424 2,096 16,585
Capital grants 48,180 45,109 29,479 22,314 24,051 21,530 37,612 38,989 22,964 -
Total governmental activities program revenues 51,600 49,777 33,593 26,774 28,698 26,143 41,907 43,932 27,586 19,114
Total primary government revenues 429,906$ 367,778$ 269,144$ 285,132$ 354,819$ 322,216$ $499,255 $428,920 $482,857 459,475$
NET PROGRAM (EXPENSES)/REVENUES
Business-type activities (397)$ (89,843)$ (196,556)$ (216,256)$ (148,184)$ (212,432)$ ($121,380) ($167,447) ($55,098) (84,031)$
Governmental activities (734) (471) (1,645) 208 (456) 362 15 136 (780) (513)
Total primary government net program (expenses)/revenues (1,131)$ (90,314)$ (198,201)$ (216,048)$ (148,640)$ (212,070)$ ($121,365) ($167,311) ($55,878) (84,544)$
Fiscal Years
1 Starting with FY 2016, BABs subsidy was reported under Program Revenues – Operating Grants. 2 Capital Grants under governmental activities were reported under Operating Grants starting with FY 2016. These grants will operate assets that will be owned by other entities.

3-2
Table 1
SANTA CLARA VALLEY TRANSPORTATION AUTHORITY
Financial Trend – Changes in Net Position (continued)
Ten Years Ended June 30, 2016
(In thousands)
2007 2008 2009 2010 2011 2012 2013 2014 2015 2016
GENERAL REVENUES AND OTHER CHANGES
IN NET POSITION
Business-type activities:
Sales tax revenue 325,037$ 323,575$ 274,903$ 279,342$ 306,456$ 332,847$ 395,163$ 417,486$ 446,374$ 460,316$
Investment income 27,288 22,511 16,862 7,352 11,039 19,289 316 9,861 9,420 19,102
Proceed from sale of land - - - - 642 6,300 4,052 - 16,732 -
Federal subsidy for Build America Bonds - - - - 5,848 9,399 9,126 8,755 8,715 -
Other income 1,347 3,523 3,385 3,241 6,865 6,007 3,254 7,325 4,261 3,335
Special items:
Transfer to OPEB Trust - (101,738) - - - - - - - -
Change in provisions for workers' compensation claims 23,769 4,662 3,500 - 5,716 - - - - -
Total business-type activities 377,441 252,533 298,650 289,935 336,566 373,842 411,911 443,427 485,502 482,753
Governmental activities:
Investment income 267 349 41 12 10 31 8 23 9 16
Other income 3 151 161 15 1,106 104 115 279 250 155
Total governmental activities 270 500 202 27 1,116 135 123 302 259 171
TOTAL PRIMARY GOVERNMENT 377,711 253,033 298,852 289,962 337,682 373,977 412,034$ 443,729 485,761 482,924
CHANGE IN NET POSITION
Business-type activities 377,044 162,690 102,094 73,679 188,382 161,410 290,531 275,980 430,404 398,722
Governmental activities (464) 29 (1,443) 235 660 497 138 438 (521) (342)
Total primary government 376,580$ 162,719$ 100,651$ 73,914$ 189,042$ 161,907$ 290,669$ 276,418$ 429,883$ 398,380$
Fiscal Years
.

3-3
Table 2
SANTA CLARA VALLEY TRANSPORTATION AUTHORITY
Financial Trends – Net Position by Component
Ten Years Ended June 30, 2016
(In thousands)
2007 2008 20091 2010 2011 2012 2013 2014 2015 2016
BUSINESS-TYPE ACTIVITIES
Net Investment in Capital Assets 1,888,879$ 2,056,769$ 2,180,768$ 2,195,790$ 2,220,118$ 2,351,676$ 2,481,805$ 2,613,290$ $2,950,181 3,394,540$
Restricted 353,186 141,764 362,079 449,096 572,054 548,367 649,724 759,608 822,834 789,000
Unrestricted 232,626 438,848 196,628 168,268 209,364 262,903 321,948 356,559 197,852 186,049
Total Business-Type Activities Net Position 2,474,691 2,637,381 2,739,475 2,813,154 3,001,536 3,162,946 3,453,477 3,729,457 3,970,867 4,369,589
GOVERNMENTAL ACTIVITIES
Restricted Net Position 1,466 1,495 52 287 947 1,444 1,582 2,020 1,499 1,157
PRIMARY GOVERNMENT
Net investment in Capital Assets 1,888,879 2,056,769 2,180,768 2,195,790 2,220,118 2,351,676 2,481,805 2,613,290 2,950,181 3,394,540
Restricted 354,652 143,259 362,131 449,383 573,001 549,811 651,306 761,628 824,333 790,157
Unrestricted 232,626 438,848 196,628 168,268 209,364 262,903 321,948 356,559 197,852 186,049
Total Primary Governmental Net Position 2,476,157$ 2,638,876$ 2,739,527$ 2,813,441$ 3,002,483$ 3,164,390$ 3,455,059$ 3,731,477$ $3,972,366 4,370,746$
Fiscal Years
______________________________ ¹ Business-type amount reclassified to match 2010 presentation
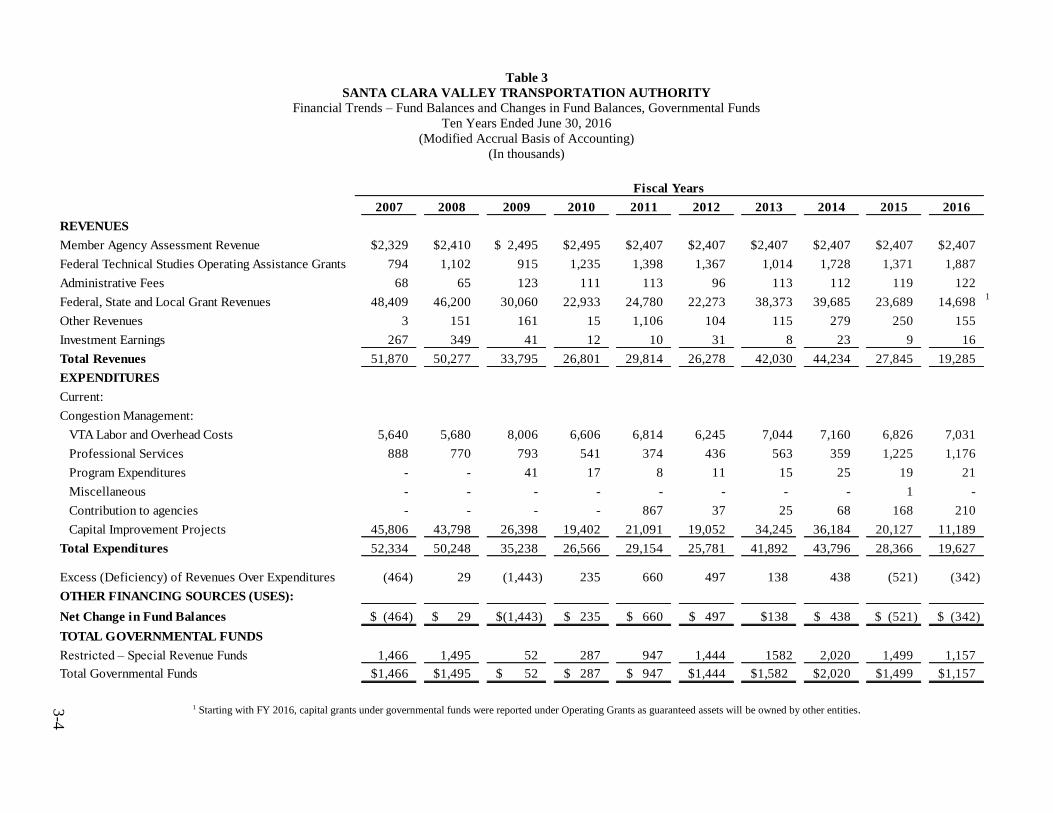
3-4
Table 3
SANTA CLARA VALLEY TRANSPORTATION AUTHORITY
Financial Trends – Fund Balances and Changes in Fund Balances, Governmental Funds
Ten Years Ended June 30, 2016
(Modified Accrual Basis of Accounting)
(In thousands)
2007 2008 2009 2010 2011 2012 2013 2014 2015 2016
REVENUES
Member Agency Assessment Revenue 2,329$ 2,410$ 2,495$ 2,495$ 2,407$ 2,407$ $2,407 2,407$ 2,407$ 2,407$
Federal Technical Studies Operating Assistance Grants 794 1,102 915 1,235 1,398 1,367 1,014 1,728 1,371 1,887
Administrative Fees 68 65 123 111 113 96 113 112 119 122
Federal, State and Local Grant Revenues 48,409 46,200 30,060 22,933 24,780 22,273 38,373 39,685 23,689 14,698 1
Other Revenues 3 151 161 15 1,106 104 115 279 250 155
Investment Earnings 267 349 41 12 10 31 8 23 9 16
Total Revenues 51,870 50,277 33,795 26,801 29,814 26,278 42,030 44,234 27,845 19,285
EXPENDITURES
Current:
Congestion Management:
VTA Labor and Overhead Costs 5,640 5,680 8,006 6,606 6,814 6,245 7,044 7,160 6,826 7,031
Professional Services 888 770 793 541 374 436 563 359 1,225 1,176
Program Expenditures - - 41 17 8 11 15 25 19 21
Miscellaneous - - - - - - - - 1 -
Contribution to agencies - - - - 867 37 25 68 168 210
Capital Improvement Projects 45,806 43,798 26,398 19,402 21,091 19,052 34,245 36,184 20,127 11,189
Total Expenditures 52,334 50,248 35,238 26,566 29,154 25,781 41,892 43,796 28,366 19,627
Excess (Deficiency) of Revenues Over Expenditures (464) 29 (1,443) 235 660 497 138 438 (521) (342)
OTHER FINANCING SOURCES (USES):
Net Change in Fund Balances (464)$ 29$ (1,443)$ 235$ 660$ 497$ $138 438$ (521)$ (342)$
TOTAL GOVERNMENTAL FUNDS
Restricted – Special Revenue Funds 1,466 1,495 52 287 947 1,444 1582 2,020 1,499 1,157
Total Governmental Funds 1,466$ 1,495$ 52$ 287$ 947$ 1,444$ $1,582 2,020$ 1,499$ 1,157$
Fiscal Years
1 Starting with FY 2016, capital grants under governmental funds were reported under Operating Grants as guaranteed assets will be owned by other entities.
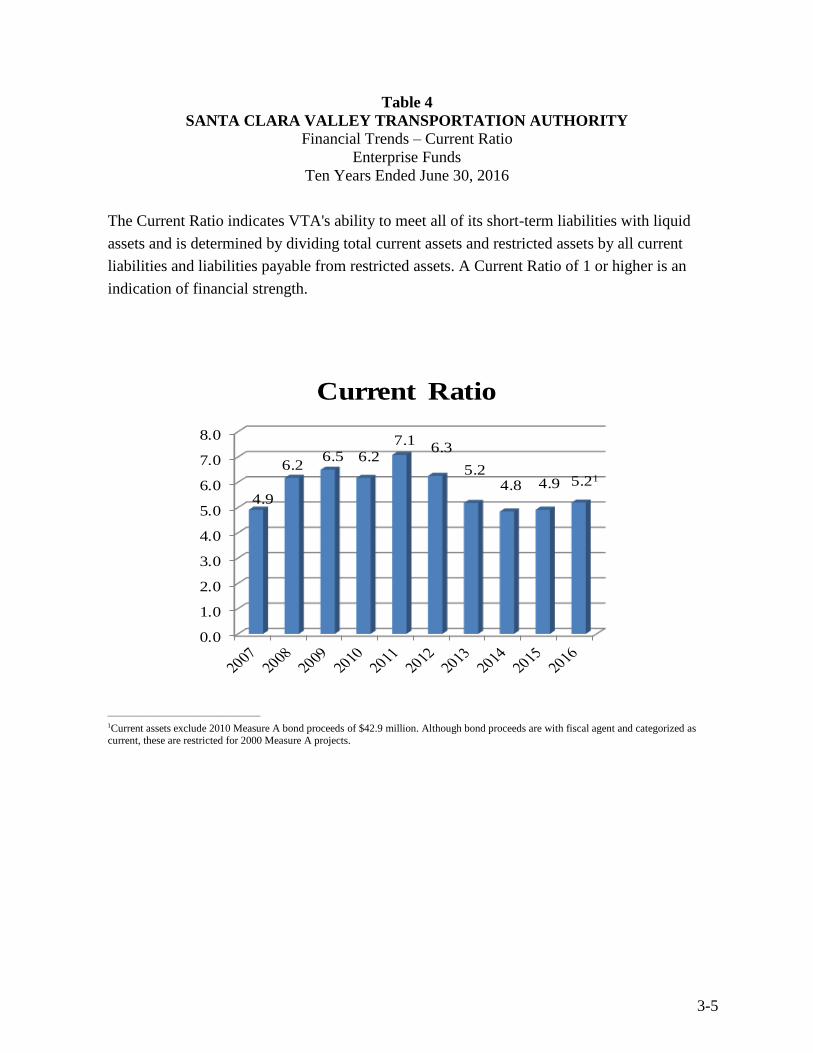
3-5
Table 4
SANTA CLARA VALLEY TRANSPORTATION AUTHORITY
Financial Trends – Current Ratio
Enterprise Funds
Ten Years Ended June 30, 2016
The Current Ratio indicates VTA's ability to meet all of its short-term liabilities with liquid
assets and is determined by dividing total current assets and restricted assets by all current
liabilities and liabilities payable from restricted assets. A Current Ratio of 1 or higher is an
indication of financial strength.
______________________________________________
1Current assets exclude 2010 Measure A bond proceeds of $42.9 million. Although bond proceeds are with fiscal agent and categorized as current, these are restricted for 2000 Measure A projects.
0.0
1.0
2.0
3.0
4.0
5.0
6.0
7.0
8.0
4.9
6.2 6.5 6.2
7.1 6.3
5.2 4.8 4.9 5.21
Current Ratio

3-6
Table 5
SANTA CLARA VALLEY TRANSPORTATION AUTHORITY
Financial Trends – Operating Revenues & Operating Expenses
VTA Transit
Ten Years Ended June 30, 2016
The chart below shows a comparison of operating revenue to expenses. Operating expenses are
exclusive of purchased transportation and depreciation to more accurately reflect operating
expenses related to direct operating service.
2007 2008 2009 2010 2011 2012 2013 2014 2015 2016
Operating Revenues 37,876$ 38,053$ 38,439$ 38,830$ 40,014$ 39,852$ 40,772$ 41,198$ 41,897$ 41,042$
Operating Expenses 271,975 273,495 273,979 272,196 277,984 297,988 303,622 330,614 330,466 358,538
Operating Revenues and Operating Expenses
(In thousands)
0
50,000
100,000
150,000
200,000
250,000
300,000
350,000
400,000
2007 2008 2009 2010 2011 2012 2013 2014 2015 2016
Operating Revenue & Operating Expenses ($000's)
Operating Revenues Operating Expenses
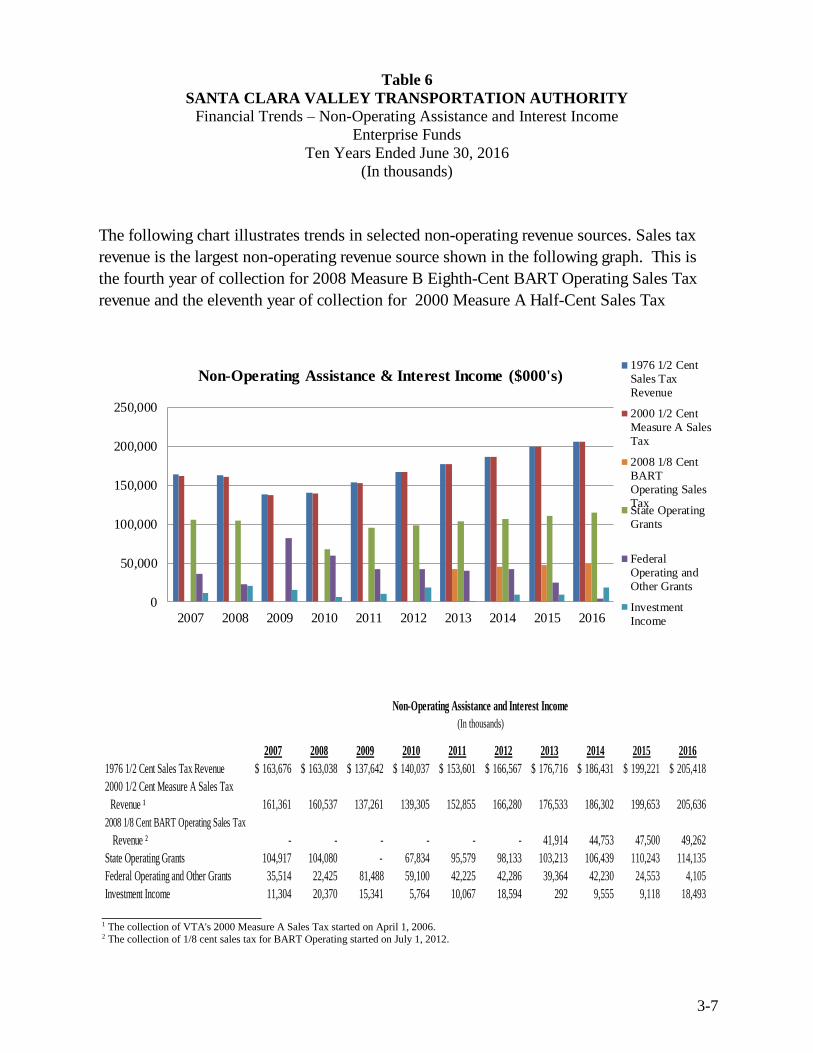
3-7
Table 6
SANTA CLARA VALLEY TRANSPORTATION AUTHORITY
Financial Trends – Non-Operating Assistance and Interest Income
Enterprise Funds
Ten Years Ended June 30, 2016
(In thousands)
2007 2008 2009 2010 2011 2012 2013 2014 2015 2016
1976 1/2 Cent Sales Tax Revenue 163,676$ 163,038$ 137,642$ 140,037$ 153,601$ 166,567$ 176,716$ 186,431$ 199,221$ 205,418$
2000 1/2 Cent Measure A Sales Tax
Revenue ¹
2008 1/8 Cent BART Operating Sales Tax
Revenue ²
State Operating Grants 104,917 104,080 - 67,834 95,579 98,133 103,213 106,439 110,243 114,135
Federal Operating and Other Grants 35,514 22,425 81,488 59,100 42,225 42,286 39,364 42,230 24,553 4,105
Investment Income 11,304 20,370 15,341 5,764 10,067 18,594 292 9,555 9,118 18,493
- - - 41,914 49,262 - - - 44,753 47,500
139,305 152,855 166,280 176,533 205,636 186,302 199,653 161,361 160,537 137,261
Non-Operating Assistance and Interest Income
(In thousands)
____________________ 1 The collection of VTA's 2000 Measure A Sales Tax started on April 1, 2006. 2 The collection of 1/8 cent sales tax for BART Operating started on July 1, 2012.
The following chart illustrates trends in selected non-operating revenue sources. Sales tax
revenue is the largest non-operating revenue source shown in the following graph. This is
the fourth year of collection for 2008 Measure B Eighth-Cent BART Operating Sales Tax
revenue and the eleventh year of collection for 2000 Measure A Half-Cent Sales Tax
0
50,000
100,000
150,000
200,000
250,000
2007 2008 2009 2010 2011 2012 2013 2014 2015 2016
Non-Operating Assistance & Interest Income ($000's)1976 1/2 Cent
Sales Tax
Revenue
2000 1/2 Cent
Measure A Sales
Tax
2008 1/8 Cent
BART
Operating Sales
TaxState Operating
Grants
Federal
Operating and
Other Grants
Investment
Income
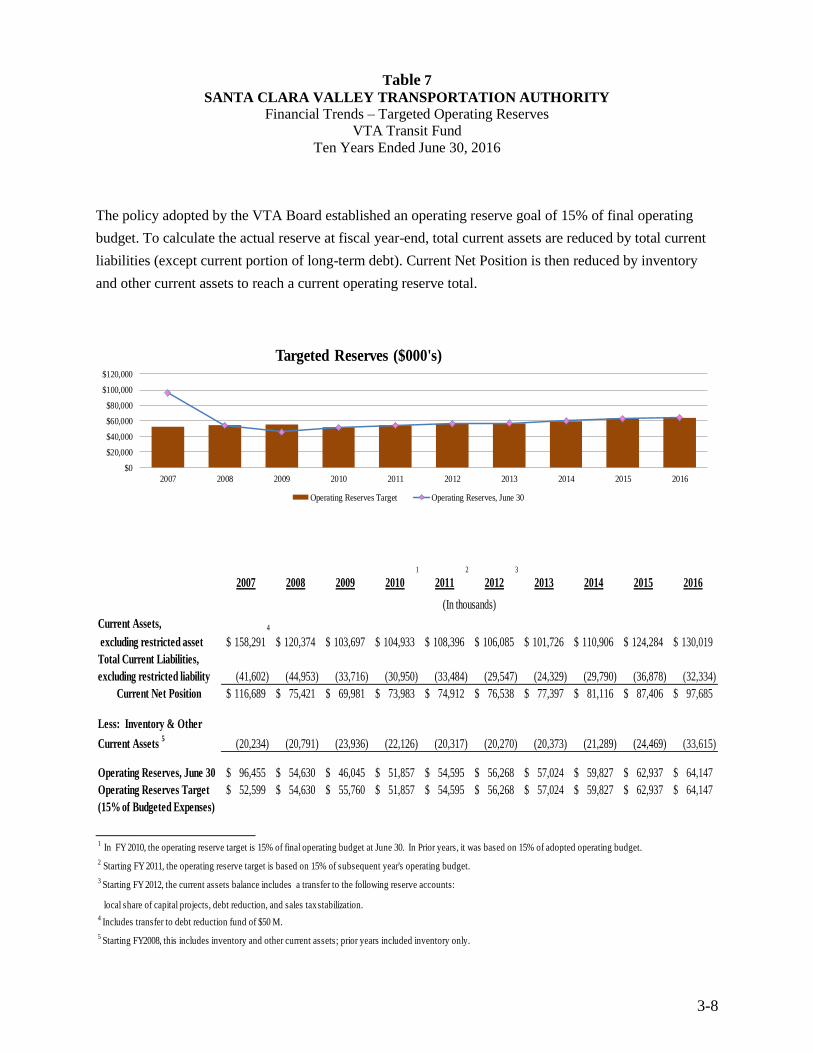
3-8
Table 7
SANTA CLARA VALLEY TRANSPORTATION AUTHORITY
Financial Trends – Targeted Operating Reserves
VTA Transit Fund
Ten Years Ended June 30, 2016
The policy adopted by the VTA Board established an operating reserve goal of 15% of final operating
budget. To calculate the actual reserve at fiscal year-end, total current assets are reduced by total current
liabilities (except current portion of long-term debt). Current Net Position is then reduced by inventory
and other current assets to reach a current operating reserve total.
1 2 3
2007 2008 2009 2010 2011 2012 2013 2014 2015 2016
Current Assets, 4
excluding restricted asset 158,291$ 120,374$ 103,697$ 104,933$ 108,396$ 106,085$ 101,726$ 110,906$ 124,284$ 130,019$
Total Current Liabilities,
excluding restricted liability (41,602) (44,953) (33,716) (30,950) (33,484) (29,547) (24,329) (29,790) (36,878) (32,334)
Current Net Position 116,689$ 75,421$ 69,981$ 73,983$ 74,912$ 76,538$ 77,397$ 81,116$ 87,406$ 97,685$
Less: Inventory & Other
Current Assets 5
(20,234) (20,791) (23,936) (22,126) (20,317) (20,270) (20,373) (21,289) (24,469) (33,615)
Operating Reserves, June 30 96,455$ 54,630$ 46,045$ 51,857$ 54,595$ 56,268$ 57,024$ 59,827$ 62,937$ 64,147$
Operating Reserves Target 52,599$ 54,630$ 55,760$ 51,857$ 54,595$ 56,268$ 57,024$ 59,827$ 62,937$ 64,147$
(15% of Budgeted Expenses)
(In thousands)
____________________
$0
$20,000
$40,000
$60,000
$80,000
$100,000
$120,000
2007 2008 2009 2010 2011 2012 2013 2014 2015 2016
Targeted Reserves ($000's)
Operating Reserves Target Operating Reserves, June 30
1 In FY 2010, the operating reserve target is 15% of final operating budget at June 30. In Prior years, it was based on 15% of adopted operating budget.
2 Starting FY 2011, the operating reserve target is based on 15% of subsequent year's operating budget.
3 Starting FY 2012, the current assets balance includes a transfer to the following reserve accounts:
local share of capital projects, debt reduction, and sales tax stabilization.
4 Includes transfer to debt reduction fund of $50 M.
5 Starting FY2008, this includes inventory and other current assets; prior years included inventory only.
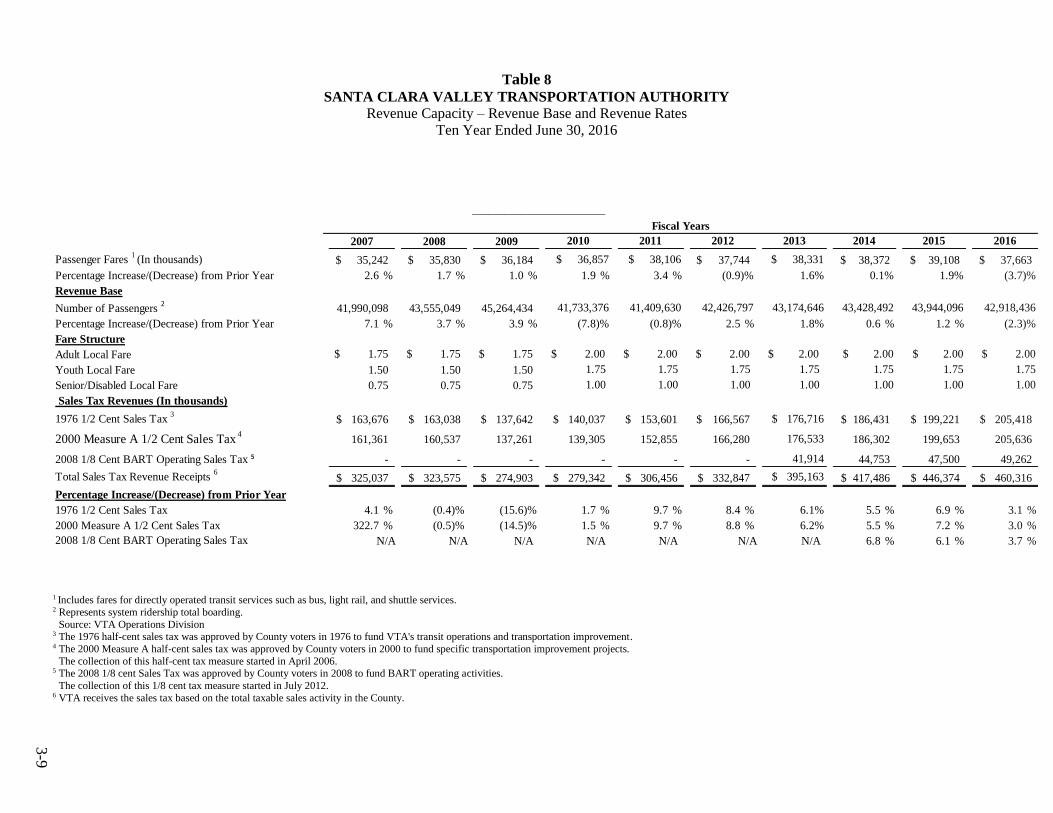
3-9
Table 8
SANTA CLARA VALLEY TRANSPORTATION AUTHORITY
Revenue Capacity – Revenue Base and Revenue Rates
Ten Year Ended June 30, 2016
_________________________
2007 2008 2009 2010 2011 2012 2013 2014 2015 2016
Passenger Fares 1 (In thousands) 35,242$ 35,830$ 36,184$ $ 36,857 $ 38,106 37,744$ $ 38,331 38,372$ 39,108$ 37,663$
Percentage Increase/(Decrease) from Prior Year 2.6 % 1.7 % 1.0 % 1.9 % 3.4 % (0.9)% 1.6% 0.1% 1.9% (3.7)%
Revenue Base
Number of Passengers 2
41,990,098 43,555,049 45,264,434 41,733,376 41,409,630 42,426,797 43,174,646 43,428,492 43,944,096 42,918,436
Percentage Increase/(Decrease) from Prior Year 7.1 % 3.7 % 3.9 % (7.8)% (0.8)% 2.5 % 1.8% 0.6 % 1.2 % (2.3)%
Fare Structure
Adult Local Fare $ 1.75 $ 1.75 $ 1.75 $ 2.00 $ 2.00 $ 2.00 $ 2.00 $ 2.00 $ 2.00 $ 2.00
Youth Local Fare 1.50 1.50 1.50 1.75 1.75 1.75 1.75 1.75 1.75 1.75
Senior/Disabled Local Fare 0.75 0.75 0.75 1.00 1.00 1.00 1.00 1.00 1.00 1.00
Sales Tax Revenues (In thousands)
1976 1/2 Cent Sales Tax 3
163,676$ 163,038$ 137,642$ 140,037$ 153,601$ 166,567$ $ 176,716 186,431$ 199,221$ 205,418$
2000 Measure A 1/2 Cent Sales Tax 4
161,361 160,537 137,261 139,305 152,855 166,280 176,533 186,302 199,653 205,636
2008 1/8 Cent BART Operating Sales Tax ⁵ - - - - - - 41,914 44,753 47,500 49,262
Total Sales Tax Revenue Receipts 6
325,037$ 323,575$ 274,903$ 279,342$ 306,456$ 332,847$ $ 395,163 417,486$ 446,374$ 460,316$
Percentage Increase/(Decrease) from Prior Year
1976 1/2 Cent Sales Tax 4.1 % (0.4)% (15.6)% 1.7 % 9.7 % 8.4 % 6.1% 5.5 % 6.9 % 3.1 %
2000 Measure A 1/2 Cent Sales Tax 322.7 % (0.5)% (14.5)% 1.5 % 9.7 % 8.8 % 6.2% 5.5 % 7.2 % 3.0 %
2008 1/8 Cent BART Operating Sales Tax N/A N/A N/A N/A N/A N/A N/A 6.8 % 6.1 % 3.7 %
Fiscal Years
1 Includes fares for directly operated transit services such as bus, light rail, and shuttle services. 2 Represents system ridership total boarding.
Source: VTA Operations Division 3 The 1976 half-cent sales tax was approved by County voters in 1976 to fund VTA's transit operations and transportation improvement. 4 The 2000 Measure A half-cent sales tax was approved by County voters in 2000 to fund specific transportation improvement projects.
The collection of this half-cent tax measure started in April 2006. 5 The 2008 1/8 cent Sales Tax was approved by County voters in 2008 to fund BART operating activities.
The collection of this 1/8 cent tax measure started in July 2012. 6 VTA receives the sales tax based on the total taxable sales activity in the County.

3-10
Table 9
SANTA CLARA VALLEY TRANSPORTATION AUTHORITY
Revenue Capacity – Overlapping Revenue
Sales Tax Rates
Ten Years Ended June 30, 2016
Fiscal Year State City VTA1Total
2007 6.25% 1.00% 1.00% 8.25%
2008 6.25% 1.00% 1.00% 8.25%
20092 7.25% 1.00% 1.00% 9.25%
2010 7.25% 1.00% 1.00% 9.25%
2011 7.25% 1.00% 1.00% 9.25%
20123
6.25% 1.00% 1.00% 8.25%
201346.63% 1.00% 1.12% 8.75%
2014 6.63% 1.00% 1.12% 8.75%
2015 6.63% 1.00% 1.12% 8.75%
20165 6.38% 1.25% 1.12% 8.75%
______________________________ 1 VTA has three specific sales tax measures approved by the voters. The 1976 half-cent sales tax measure was approved by voters in 1976 and does
not have a sunset clause. The 2000 Measure A half-cent sales tax was approved in the 2000 General Election and became effective on April 1, 2006.
This 30-year sales tax measure will sunset on March 31, 2036. The 2008 1/8-cent sales tax was approved by County voters in 2008 to fund BART Operating and maintenance. The collection of this 1/8-cent tax measure started in July 2012.
2 There was a partial year collection of 1996 Measure B Sales Tax which expired on March 31, 2006. The collection of VTA's 2000 Measure A Sales
Tax started on April 1, 2006. 3 California state legislature approved a 1% sales tax increase effective July 1, 2009.
Source: California Board of Equalization 4 The 1% sales tax increase approved by the California state legislature in 2009 expired on July 1, 2011.
Source: California Board of Equalization.
5 There was a 0.125% increase for Bart Operation and Maintenance tax effective July 1, 2012. Due to the approval of Proposition 30, the statewide
base sales and use tax rate increased by 0.25% effective January 1, 2013. The higher tax rate will apply for four years- January 1, 2013 through
December 31, 2016. Effective 4/1/2013, there was a 0.125% increase for Retail Transactions and Use tax.
Source: California Board of Equalization

3-11
Table 10
SANTA CLARA VALLEY TRANSPORTATION AUTHORITY
Revenue Capacity - Principal Sales Tax Payers by Segments
($ In millions)
Fiscal Year 2015
1 Fiscal Year 2006
Principal Revenue Payers Rank
Percentage
of Taxable
Sales Amount Rank
Percentage
of Taxable
Sales Amount
Total all Other Outlets2
1 43.0% 17,448$ 1 37.8% 11,956$
Food Services & Drinking Places 2 10.5% 4,258 5 8.1% 2,547
Motor Vehicle & Parts Dealers 3 10.1% 4,113 2 11.2% 3,540
General Merchandise Stores 4 6.7% 2,708 4 8.1% 2,560
Clothing & Clothing Accessories 5 5.8% 2,353 8 4.5% 1,434
Gasoline Stations 6 5.7% 2,300 6 6.5% 2,068
Bldg. Matrl. & Garden Equip. & Suppl. 7 4.7% 1,919 7 5.9% 1,824
Food & Beverage Stores 8 3.1% 1,266 9 3.1% 992
Electronics & Appliance Stores 9 3.0% 1,210 13 0.9% 291
Furniture & Home Furnishing Stores 10 1.5% 625 10 2.0% 634
Sport Goods, Hobby, Book & Music 11 1.5% 622 11 1.1% 350
Non-Store Retailers 12 1.5% 619 14 0.0% -
Health & Personal Care Stores 13 1.5% 608 12 1.1% 349
Miscellaneous Store Retailers 14 1.4% 568 3 9.7% 3,079
Total 100.0% 40,617$ 100.0% 31,624$
__________________________ ¹ 2016 data is not available at the time of printing ² This category is made up of diverse manufacturers and wholesalers, construction contractors, petroleum producer, and a multitude of
professional services.
Source: State Board of Equalization, Taxable Sales in California (Sales and Use Tax)
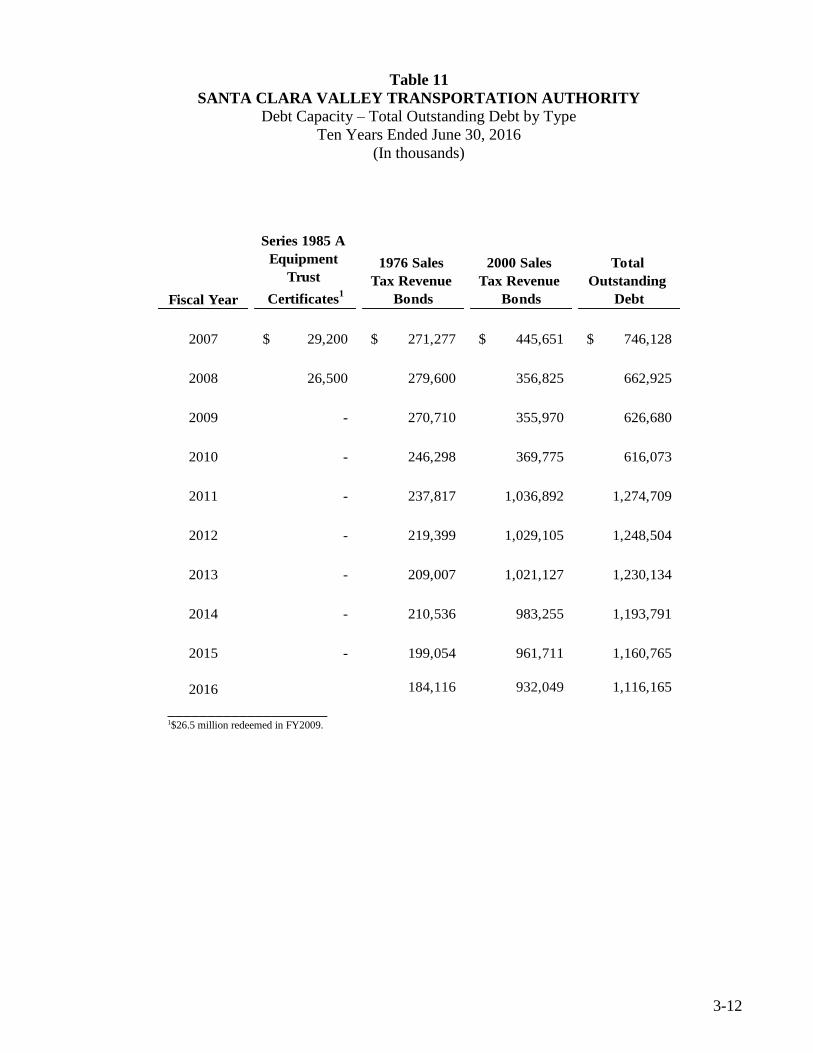
3-12
Table 11
SANTA CLARA VALLEY TRANSPORTATION AUTHORITY
Debt Capacity – Total Outstanding Debt by Type
Ten Years Ended June 30, 2016
(In thousands)
Fiscal Year
Series 1985 A
Equipment
Trust
Certificates1
1976 Sales
Tax Revenue
Bonds
2000 Sales
Tax Revenue
Bonds
Total
Outstanding
Debt
2007 29,200$ 271,277$ 445,651$ 746,128$
2008 26,500 279,600 356,825 662,925
2009 - 270,710 355,970 626,680
2010 - 246,298 369,775 616,073
2011 - 237,817 1,036,892 1,274,709
2012 - 219,399 1,029,105 1,248,504
2013 - 209,007 1,021,127 1,230,134
2014 - 210,536 983,255 1,193,791
2015 - 199,054 961,711 1,160,765
2016 184,116 932,049 1,116,165
____________________ 1$26.5 million redeemed in FY2009.

3-13
Table 12
SANTA CLARA VALLEY TRANSPORTATION AUTHORITY
Debt Capacity - Ratios of Outstanding Debt
Ten Years Ended June 30, 2016
Fiscal
Year
Total
Outstanding
Debt
(In thousands)
Total County
Taxable Sales1
(In thousands)
Total Debt as
a % of
Taxable Sales
Personal
Income²
(In thousands)
Total Debt as a
% of Personal
Income
Santa Clara
County
Population
(In thousands)
Total Debt
per Capita
2007 746,128$ 33,131,466$ 2.25% 103,501,849$ 0.72% 1,808 413$
2008 662,925 33,476,000 1.98% 104,331,553 0.64% 1,837 361
2009 626,680 29,009,000 2.16% 96,315,176 0.63% 1,858 337
2010 616,073 28,720,000 2.15% 103,636,350 0.59% 1,880 328
2011 1,274,709 32,238,000 3.95% 111,880,131 1.14% 1,782 715
2012 1,248,504 34,698,000 3.60% 122,259,021 1.02% 1,816 688
2013 1,230,134 37,013,000 3.32% 130,624,491 1.08% 1,842 668
2014 1,193,791 38,318,000 3.12% 141,873,705 0.84% 1,894 630
2015 1,160,765 40,617,475 2.86% 143,292,442 0.81% 1,903 610
2016 1,116,165 41,023,650 2.72% 144,725,366 0.77% 1,927 579
1 Taxable sales information is available through FY 2015. FY 2016 assumes a 1% increase over the previous year’s number. 2 Actual personal income is available through FY 2014. FY 2015 and FY 2016 assume a 1% increase over the prior years’ numbers.
The total outstanding debt is pledged by VTA’s sales tax revenues which were approved by Santa
Clara County voters as follows: The 1976 ½-cent Sales Tax Measure in 1976; the 2000 Measure A
½-cent Sales Tax in 2000. Collection of the 2000 Measure A ½-cent Sales Tax began in April 2006.

3-14
Table 13
SANTA CLARA VALLEY TRANSPORTATION AUTHORITY
Debt Capacity – Direct and Overlapping Debt and Debt Limitation
Santa Clara Valley Transportation Authority does not have overlapping debt with other
governments.
Santa Clara Valley Transportation Authority does not have a legal debt limit.

3-15
Table 14
SANTA CLARA VALLEY TRANSPORTATION AUTHORITY
Debt Capacity – Pledged Revenue Coverage – 1976 Half-Cent Sales Tax Revenue Bonds
Ten Years Ended June 30, 2016
(In thousands)
Available
Revenue
Fiscal
Year
Sales Tax
Revenue Principal Interest² Total Coverage
2007 163,676$ 10,855$ 13,672$ 24,527$ 6.7
2008 163,038 11,315 12,214 23,529 6.9
2009 137,642 8,890 11,651 20,541 6.7
2010 140,037 9180³ 7,025 16,205 8.6
2011 152,050 9,370 6,748 16,118 9.4
2012 166,567 10,215 8,153 18,368 9.1
2013 176,716 10,400 9,194 19,594 9.0
2014 186,431 10,435 9,766 20,201 9.2
2015 199,221 10,705 7,965 18,670 10.7
2016 205,418 14,310 7,485 21,795 9.4
Annual Debt Service¹
______________________________
1This schedule includes Junior and Senior Lien debts. ² Interest is exclusive of interest earned from bond proceeds. 3 This does not include regular principal of $2.9 million due for 1985 Equipment Trust Certificates as this debt was redeemed in
FY 2009.

3-16
Table 15
SANTA CLARA VALLEY TRANSPORTATION AUTHORITY
Debt Capacity – Pledged Revenue Coverage – 2000 Measure A Half-Cent Sales Tax Revenue Bonds
Ten Years Ended June 30, 2016
($ In thousands)
Available
Revenue
Fiscal Year
Sales Tax
Revenue Principal Interest1
Total Coverage2
2007 161,361$ -$ 15,202$ 15,202$ 10.6
2008 160,537 - 14,943 14,943 10.7
2009 137,261 855 12,321 13,176 10.4
2010 139,305 - 14,156 14,156 9.8
2011 151,518 2,430 33,490 35,920 4.2
2012 166,280 2,525 44,337 46,862 3.5
2013 176,533 2,625 44,262 46,887 3.8
2014 186,302 24,595 45,577 70,172 2.7
2015 199,653 25,775 45,086 70,861 2.8
2016 205,636 26,965 44,118 71,083 2.9
Annual Debt Service
_______________________________ 1 This is exclusive of interest earned from bond proceeds. 2 Bond indenture requires VTA to maintain coverage ratio of at least 1.3.
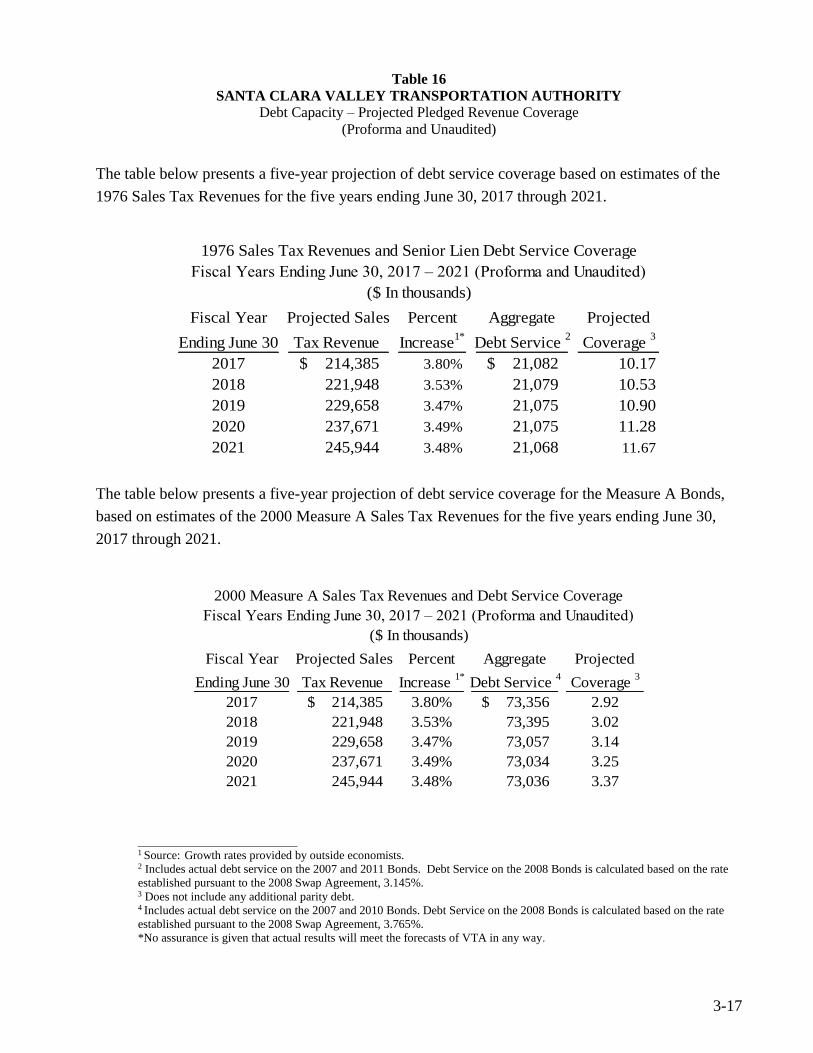
3-17
Table 16
SANTA CLARA VALLEY TRANSPORTATION AUTHORITY
Debt Capacity – Projected Pledged Revenue Coverage
(Proforma and Unaudited)
The table below presents a five-year projection of debt service coverage based on estimates of the
1976 Sales Tax Revenues for the five years ending June 30, 2017 through 2021.
Fiscal Year Projected Sales Percent Aggregate Projected
Ending June 30 Tax Revenue Increase1*
Debt Service 2
Coverage 3
2017 214,385$ 3.80% 21,082$ 10.17
2018 221,948 3.53% 21,079 10.53
2019 229,658 3.47% 21,075 10.90
2020 237,671 3.49% 21,075 11.28
2021 245,944 3.48% 21,068 11.67
1976 Sales Tax Revenues and Senior Lien Debt Service Coverage
Fiscal Years Ending June 30, 2017 – 2021 (Proforma and Unaudited)
($ In thousands)
The table below presents a five-year projection of debt service coverage for the Measure A Bonds,
based on estimates of the 2000 Measure A Sales Tax Revenues for the five years ending June 30,
2017 through 2021.
Fiscal Year Projected Sales Percent Aggregate Projected
Ending June 30 Tax Revenue Increase 1*
Debt Service 4
Coverage 3
2017 214,385$ 3.80% 73,356$ 2.92
2018 221,948 3.53% 73,395 3.02
2019 229,658 3.47% 73,057 3.14
2020 237,671 3.49% 73,034 3.25
2021 245,944 3.48% 73,036 3.37
2000 Measure A Sales Tax Revenues and Debt Service Coverage
Fiscal Years Ending June 30, 2017 – 2021 (Proforma and Unaudited)
($ In thousands)
______________________________ 1 Source: Growth rates provided by outside economists. 2 Includes actual debt service on the 2007 and 2011 Bonds. Debt Service on the 2008 Bonds is calculated based on the rate
established pursuant to the 2008 Swap Agreement, 3.145%. 3 Does not include any additional parity debt. 4 Includes actual debt service on the 2007 and 2010 Bonds. Debt Service on the 2008 Bonds is calculated based on the rate
established pursuant to the 2008 Swap Agreement, 3.765%.
*No assurance is given that actual results will meet the forecasts of VTA in any way.

3-18
TABLE 17
SANTA CLARA VALLEY TRANSPORTATION AUTHORITY
Demographic and Economic Data – Population Trends
According to population estimates provided by the State of California, the number of residents in
Santa Clara County is increasing gradually on a yearly basis. The County’s population increased by
approximately 6.06% in 2016 Census compared to the 2010 Census.
A historical summary of population in the County and its incorporated cities is provided in the
following table:
1960 1970 1980 1990 2000 2010 2016
Campbell 11,863 24,731 26,843 36,048 38,138 39,349 42,584
Cupertino 3,664 18,216 34,297 40,263 50,546 58,302 58,185
Gilroy 7,348 12,665 21,641 31,487 41,464 48,821 55,170
Los Altos 19,696 24,872 25,769 26,303 27,693 28,976 31,353
Los Altos Hills 3,412 6,862 7,421 7,514 7,902 7,922 8,658
Los Gatos 9,036 23,466 26,906 27,357 28,592 29,413 31,376
Milpitas 6,572 27,149 37,820 50,686 62,698 66,790 75,521
Monte Sereno 1,506 3,074 3,434 3,287 3,483 3,341 3,475
Morgan Hill 3,151 6,485 17,060 23,928 33,556 37,882 43,645
Mountain View 30,889 54,206 58,655 67,460 70,708 74,066 77,925
Palo Alto 52,475 55,999 55,225 55,900 58,598 64,403 68,207
San Jose 204,196 445,779 629,400 782,248 894,943 945,942 1,042,094
Santa Clara 58,880 87,717 87,700 93,613 102,361 116,468 123,752
Saratoga 14,861 27,199 29,261 28,061 29,843 29,926 30,219
Sunnyvale 51,898 95,408 106,618 117,229 131,760 140,081 148,372
Unincorporated 162,056 152,181 127,021 106,193 100,300 89,960 87,352
County Total1 641,503 1,066,009 1,295,071 1,497,577 1,682,585 1,781,642 1,927,888
California 15,717,204 18,136,045 23,668,145 29,760,021 33,871,648 37,253,956 39,256,000
County of Santa Clara Population
______________________________ 1 Totals may not be precise due to independent rounding.
Source: U.S. Census; State of California, Department of Finance, Demographic Research Unit.

3-19
Table 18
SANTA CLARA VALLEY TRANSPORTATION AUTHORITY
Demographic and Economic Data - Income and Unemployment Rates
Ten Years Ended June 30, 2016
Year
Santa Clara County
Personal Income
(In thousands)¹٫²
Santa Clara County
Per Capita
Personal Income ¹٫²
Unemployment
Rate³
2007 103,501,849 60,107 4.7%
2008 104,331,553 59,227 5.1%
2009 96,315,176 55,781 11.8%
2010 103,636,350 58,018 11.3%
2011 111,880,131 61,833 10.3%
2012 122,259,021 66,535 8.7%
2013 130,624,491 70,151 6.8%
2014 141,873,705 74,883 5.2%
2015 143,292,442 75,632 3.9%
2016 144,725,366 76,388 4.0%
______________________________
1 Bureau of Economic Analysis U.S. Department of Commerce. 2 Actual data is available through 2014. Years 2015 and 2016 data are preliminary and
assume a 1% increase over prior year. 3 California Employment Development Department. Not seasonally adjusted.

3-20
Table 19
SANTA CLARA VALLEY TRANSPORTATION AUTHORITY
Demographic and Economic Data - Wage and Salary Employment by Industry (Annual Average)
Ten Years Ending June 30, 2015
(in thousands)
2007 2008 2009 2010 2011 2012 2013 2014 2015
Civilian Labor Force ¹(In thousands) 855.2 876.8 879.8 871.6 894.8 910.9 924.0 993.7 1,018.4
Civilian Employment 814.7 825.2 777.5 774.0 804.6 830.6 857.5 942.3 976.1
Civilian Unemployment 40.5 51.7 102.2 97.6 90.2 80.3 66.5 51.4 42.3
Civilian Unemployment Rate
County 4.7% 5.9% 11.6% 11.2% 10.1% 8.8% 7.2% 5.2% 4.2%
State of California 5.4% 7.0% 11.6% 12.2% 12.0% 10.6% 8.5% 7.4% 6.2%
Wage and Salary Employment ² (In thousands)
Total Farm Agriculture 3.7 4.6 3.6 3.6 3.4 3.5 5.1 3.6 3.6
Construction and Mining 49.5 50.1 32.9 32.3 30.9 35.6 37.6 38.6 42.3
Manufacturing 163.7 166.3 153.5 150.7 154.6 155.1 156.3 156.6 159.4
Transportation & Public Utilities 13.1 13.8 11.7 11.9 11.8 12.7 13.9 14.7 15.0
Wholesale Trade 39.1 39.9 36.0 34.7 35.0 34.4 36.2 36.2 36.0
Retail Trade 86.2 88.2 77.4 75.6 77.5 80.3 84.2 82.3 84.9
Finance, Insurance & Real Estate 38.2 39.5 31.5 30.8 31.2 33.6 33.9 35.1 35.0
Services 416.7 424.1 404.4 418.5 432.8 455.4 450.0 469.1 491.4
Government 90.2 92.7 95.0 93.4 88.6 90.2 93.5 92.4 89.9
Information N/A N/A N/A N/A N/A N/A N/A 66.2 74.7
Total ³ 900.4 919.2 846.0 851.5 865.8 900.8 910.7 994.8 1,032.2
______________________________ 1 Labor force data are based upon place of residence. Employment includes self-employed, unpaid
family, workers domestics, and workers involved in labor-management disputes. Data are benchmarked to 2015. FY 2015 is the most recent available data.
2 Wage and salary employment is reported by place of work. Data are benchmarked to 2015 3 Totals may not be precise due to independent rounding.
Sources: State of California, Employment Development Department
Department of Finance, Statistics & Demographic Research. www.dice.com, April 2007 - Technology Job Market – Silicon Valley, CA Q1 2007

3-21
Table 20
SANTA CLARA VALLEY TRANSPORTATION AUTHORITY
Dmographic and Economic Data – Silicon Valley Major Employers
Current Year and Nine Years Ago
Company Name Nature of Operations
Number of
Employees* Rank
Number of
Employees Rank
Alphabet Inc./Google Inc. Search, advertising and web software 20,000 1
Apple Inc. Computer electronics 19,000 2
County of Santa Clara County government 16,837 3 15,012 4
Stanford University Research university 13,500 4 23,756 1
Kaiser Permanente Northern California Integrated healthcare delivery plan 12,500 5
Intel Corp. Semiconductor 10,801 6 5,700 11
Stanford Health Care Health System 10,034 7
University of California Santa Cruz Public University 8,182 8
Facebook Inc. Online Social Networking Service 6,799 9
Oracle Corp. Hardware and software,cloud 6,750 10
Tesla Motors Inc. Electric Vehicle Designer & Manufacturer 6,529 11
eBay Inc. E-commerce Company 6,200 12 2,200 21
Palo Alto Medical Foundation Not-for-profit healthercare organization
and multispecialty group practice6,100 13
City of San Jose Government Agency 5,651 14 7,169 8
Lockheed Martin Space Systems Co. Aerospace 5,550 15 7,951 5
San Mateo County Government Agency 5,500 16
Gilead Sciences Inc. Biotechnology Company 5,230 17
County of Monterey County government 5,100 18
San Jose State University Public University 4,626 19 4,100 14
Hewlett-Packard Co. Information Technology Company 4,570 20 7,000 9
Linkedin Corp. Business-oriented social networking service 4,500 21
Lucile Pakard Children's Hospital
(Stanford Children's Health)
Children's hospital dedicated to pediatric
and obstetric care4,200 22
Visa Inc. Global payments technology company 4,118 23
Department of Veterans Affairs, Palo Alto
Health Care System
Government-run Military Veteran Benefit
System4,000 24
Yahoo Inc. Search, advertising and news web software 3,993 25
FY 2016 FY 2007
____________________ Source: Silicon Valley/San Jose Business Journal. July 24, 2016
*Estimate provided by the most recent city and county financial reports because the employer did not provide local employment figure. Ranking is based on low end of range.
The concentration of Santa Clara County’s productivity is derived primarily from numerous high-
technology and bioscience companies. Public-sector employers continue to rank high among the largest
employers in Silicon Valley. As depicted in the chart above, as an employer, Santa Clara County itself,
continues to have the largest public-sector employee base with 16,837 workers.
The table above lists the largest employers in the Silicon Valley, which encompasses the County and
surrounding areas.

3-22
Table 21
SANTA CLARA VALLEY TRANSPORTATION AUTHORITY
Operating Information – Operating Indicators
Ten Years Ended June 30, 2016
Fiscal
Year
Total
Ridership
Average
Weekday
Ridership
Scheduled
Miles
Scheduled
Hours
Vehicle
Revenue
Miles
Passenger
Miles (000’s)
Peak
Buses
Active
Buses
Bus
Fleet
2007 31,646,555 102,123 18,705,711 1,364,903 15,882,356 128,290 345 453 524
2008 33,103,495 106,673 18,784,524 1,389,344 16,013,930 143,102 343 456 535
2009 34,510,273 111,820 18,500,655 1,379,428 15,800,214 152,856 336 424 448
2010 31,983,494 103,575 17,739,605 1,322,661 15,130,519 142,754 333 412 424
2011 31,395,126 102,187 16,990,315 1,269,071 14,376,811 148,225 333 434 494
2012 32,053,755 104,583 17,099,227 1,191,992 14,374,343 169,321 345 426 445
2013 32,432,354 106,161 17,491,993 1,213,571 14,582,508 166,576 358 426 443
2014 32,475,527 105,969 17,835,921 1,367,433 14,817,700 173,539 371 432 443
2015 32,623,599 106,214 18,435,525 1,427,554 15,247,087 174,863 384 495 540
2016 32,195,504 104,009 18,990,093 1,492,641 15,697,021 190,319 388 499 500
BUS
Fiscal
Year
Total
Ridership
Average
Weekday
Ridership
Scheduled
Miles
Scheduled
Hours
Train
Revenue
Miles
Passenger
Miles (000’s)
Peak
Cars
Light
Rail
Fleet
2007 10,278,460 32,567 2,220,230 143,816 2,105,819 54,528 53 100
2008 10,451,136 33,043 2,223,823 143,576 2,112,080 54,475 53 100
2009 10,754,161 34,305 2,216,957 143,533 2,105,555 58,709 54 99
2010 9,749,882 31,555 2,182,849 141,095 2,062,832 50,000 46 99
2011 10,014,504 31,871 2,190,140 132,452 2,055,872 54,048 49 99
2012 10,373,042 32,716 2,209,233 137,495 2,065,099 55,337 55 99
2013 10,742,292 34,242 2,199,018 137,134 2,055,418 58,116 57 99
2014 10,952,965 35,102 2,205,492 139,021 2,057,106 61,631 57 99
2015 11,320,497 34,935 2,232,077 152,821 2,081,092 60,717 59 99
2016 10,722,932 33,301 2,235,167 140,000 2,077,964 54,578 59 99
LIGHT RAIL
______________________________
Source: VTA Operations Division.
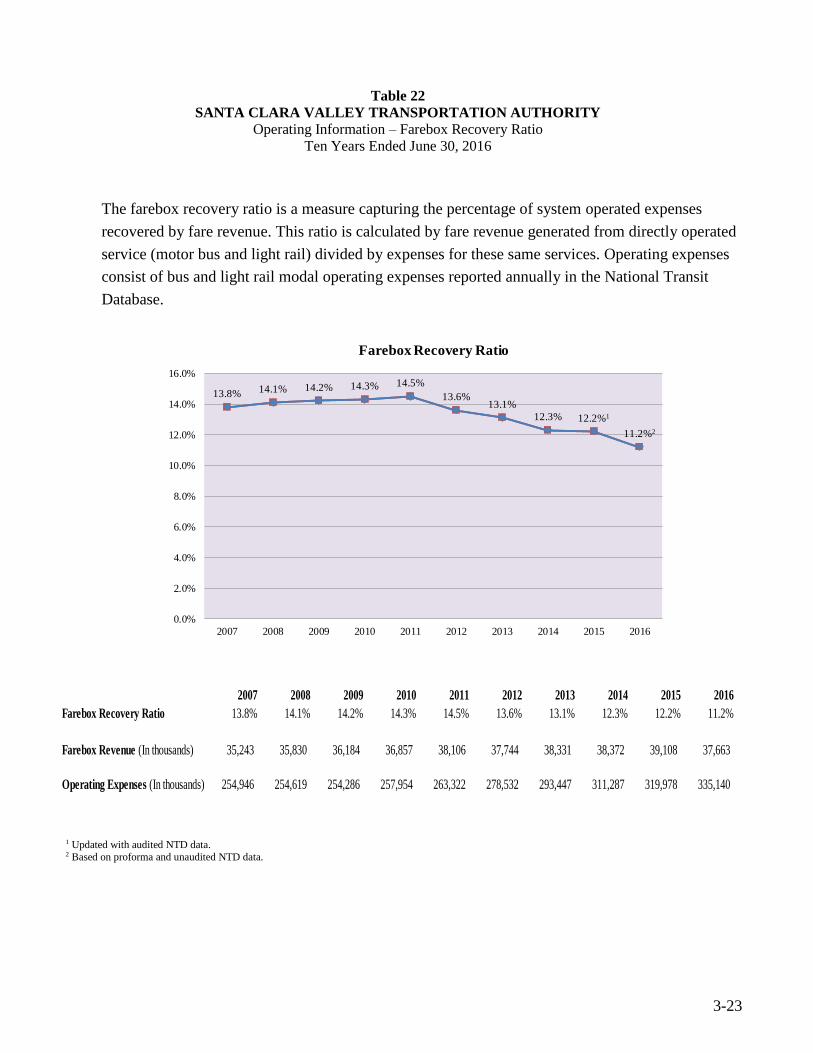
3-23
Table 22
SANTA CLARA VALLEY TRANSPORTATION AUTHORITY
Operating Information – Farebox Recovery Ratio
Ten Years Ended June 30, 2016
The farebox recovery ratio is a measure capturing the percentage of system operated expenses
recovered by fare revenue. This ratio is calculated by fare revenue generated from directly operated
service (motor bus and light rail) divided by expenses for these same services. Operating expenses
consist of bus and light rail modal operating expenses reported annually in the National Transit
Database.
2007 2008 2009 2010 2011 2012 2013 2014 2015 2016
Farebox Recovery Ratio 13.8% 14.1% 14.2% 14.3% 14.5% 13.6% 13.1% 12.3% 12.2% 11.2%
Farebox Revenue (In thousands) 35,243 35,830 36,184 36,857 38,106 37,744 38,331 38,372 39,108 37,663
Operating Expenses (In thousands) 254,946 254,619 254,286 257,954 263,322 278,532 293,447 311,287 319,978 335,140
1 Updated with audited NTD data. 2 Based on proforma and unaudited NTD data.
13.8% 14.1% 14.2% 14.3% 14.5%
13.6%13.1%
12.3% 12.2%1
11.2%2
0.0%
2.0%
4.0%
6.0%
8.0%
10.0%
12.0%
14.0%
16.0%
2007 2008 2009 2010 2011 2012 2013 2014 2015 2016
Farebox Recovery Ratio

3-24
Table 23
SANTA CLARA VALLEY TRANSPORTATION AUTHORITY
Operating Information – Revenue Miles
Ten Years Ended June 30, 2016
The following chart shows total vehicle miles in revenue service.
0
2,000
4,000
6,000
8,000
10,000
12,000
14,000
16,000
18,000
2007 2008 2009 2010 2011 2012 2013 2014 2015 2016
Total Miles (000's) Bus
Light Rail
Paratransit

3-25
Table 24
SANTA CLARA VALLEY TRANSPORTATION AUTHORITY
Operating Information – Passenger Miles
Ten Years Ended June 30, 2016
Passenger mile statistics are presented in the chart below. In FY 2016 the total passenger miles
have increased slightly by 3.71% from FY 2015.
0
20,000
40,000
60,000
80,000
100,000
120,000
140,000
160,000
180,000
200,000
2007 2008 2009 2010 2011 2012 2013 2014 2015 2016
Passenger Miles (000's) Bus
Light Rail
Paratransit

3-2
6
Table 25
SANTA CLARA VALLEY TRANSPORTATION AUTHORITY
Operating Information – Selected Statistical Data
Ten Years Ended June 30, 2016
______________________________ 1 Includes fare revenue from motor bus, light rail and shuttle services.
2007 2008 2009 2010 2011 2012 2013 2014 2015 2016
FAREBOX REVENUE ($000's)1
$35,242 $35,830 $36,184 $36,857 $38,106 $37,744 38,331 38,372 39,108 37,663
VEHICLE REVENUE MILES (000's)
BUS 15,851 15,951 15,800 15,131 14,377 14,374 14,583 14,818 15,247 15,697
LIGHT RAIL 3,354 2,112 2,106 2,063 2,056 2,065 2,056 2,057 2,081 2,078
PARATRANSIT 6,296 6,746 7,582 6,816 6,011 5,948 5,995 6,196 5,922 5,851
PASSENGER MILES (000's)
BUS 128,290 143,102 152,856 142,754 148,225 169,321 166,576 173,539 174,863 190,319
LIGHT RAIL 54,528 54,475 58,708 50,000 54,048 55,337 58,116 61,632 60,717 54,578
PARATRANSIT 7,835 8,486 9,908 9,005 8,017 8,133 8,205 8,097 6,827 6,493
FLEET SIZE
BUS 539 480 448 424 494 445 443 443 540 500
LIGHT RAIL 100 100 99 99 99 99 99 99 99 99
CASH FARE SINGLE RIDE
ADULT $1.75 $1.75 $1.75 $2.00 $2.00 $2.00 $2.00 $2.00 $2.00 $2.00
YOUTH $1.50 $1.50 $1.50 $1.75 $1.75 $1.75 $1.75 $1.75 $1.75 $1.75
SENIOR $0.75 $0.75 $0.75 $1.00 $1.00 $1.00 $1.00 $1.00 $1.00 $1.00
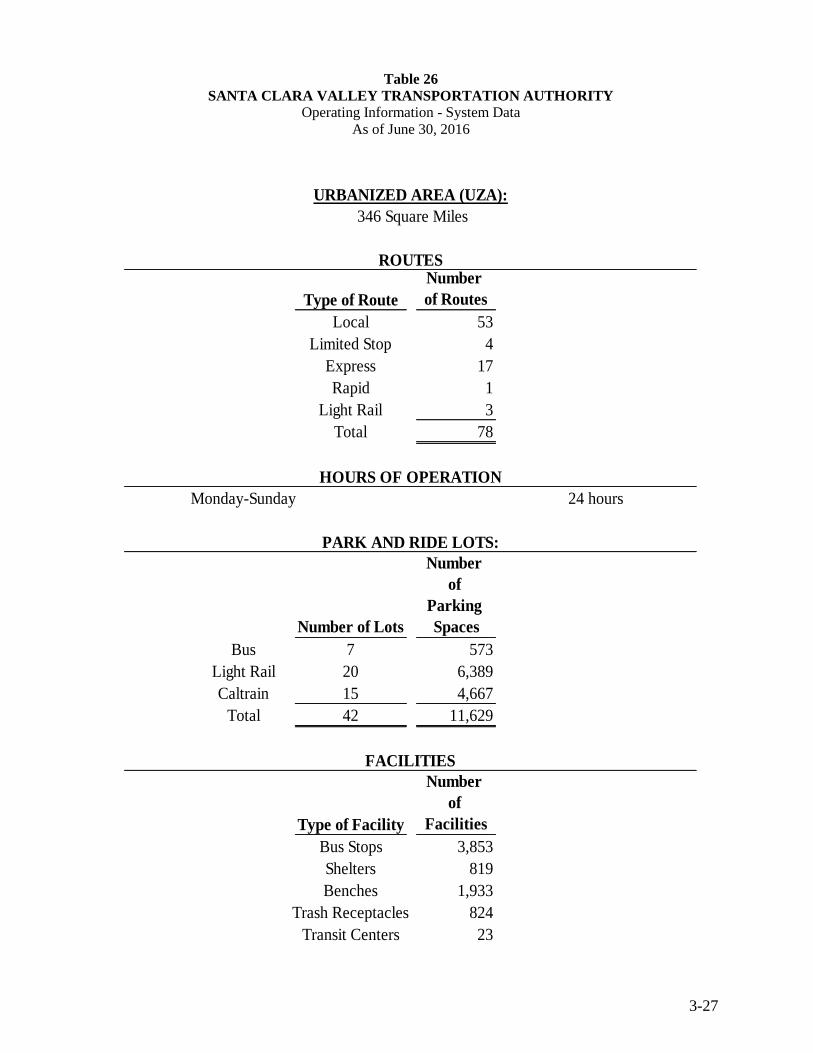
3-27
Table 26
SANTA CLARA VALLEY TRANSPORTATION AUTHORITY
Operating Information - System Data
As of June 30, 2016
Type of Route
Number
of Routes
Local 53
Limited Stop 4
Express 17
Rapid 1
Light Rail 3
Total 78
Monday-Sunday 24 hours
Number of Lots
Number
of
Parking
Spaces
Bus 7 573
Light Rail 20 6,389
Caltrain 15 4,667
Total 42 11,629
Type of Facility
Number
of
Facilities
Bus Stops 3,853
Shelters 819
Benches 1,933
Trash Receptacles 824
Transit Centers 23
ROUTES
HOURS OF OPERATION
PARK AND RIDE LOTS:
FACILITIES
URBANIZED AREA (UZA):
346 Square Miles

3-28
Table 27
SANTA CLARA VALLEY TRANSPORTATION AUTHORITY
Operating Information – Full-time Equivalent Employees1
Ten Years Ended June 30, 2016
Fiscal
Year Operations
Planning &
Program
Development2
Finance &
Budget3
Engineering &
Transportaiton
Infrastructure
Development4
SVRT
Program4
Government
& Public
Relations5
Business
Services6
System
Safety &
Security7
Chief of
Staff9
General
Counsel
General
Manager Total
2007 1584 101 100 98 NA NA 102 NA NA 8 27 2020
2008 1628 48 103 98 4 70 92 NA NA 10 4 2057
2009 1649 51 97 99 4 74 102 NA NA 8 4 2088
2010 1588 50 95 97 4 57 100 NA NA 8 18 2017
2011 1576 50 90 90 5 53 102 NA NA 8 11 1985
2012 1599 52 93 86 6 51 103 NA NA 9 13 2012
2013 1614 51 88 90 6 55 99 NA NA 11 13 2027
20148
1687 42 69 79 6 37 138 NA 25 12 5 2100
2015 1724 43 74 81 NA 4 135 30 55 13 5 2164
2016 1758 50 75 74 NA 26 192 33 NA 13 11 2232
___________________
1 A full-time employee is scheduled to work 2,080 hours per year (including vacation and sick leave). Full-time equivalent employment is calculated by dividing
total labor hours by 2,080. The table shows the total full-time equivalent by division.
2 Previously referred to as Congestion Management Division, as a result of the reorganization in FY2014. 3 Previously referred to as Fiscal Resources Division, as a result of the reorganization in FY 2014.
4 In FY 2015, Engineering & Construction Program merged with SVRT Program to form Engineering & Transportation n Infrastructure Development.
5 External Affairs Division was split into Public Affairs and Office of Chief of Staff, as a result of the reorganization in FY2014. In 2015, Public Affairs became
Government & Public Relations.
6 Previously referred to as Administrative Service Division, as a result of the reorganization in FY 2014. In September 2015 reorganization, some personnel from
the Chief of Staff Division and Operation Division were transferred to Business Services. 7 System Safety & Security became a division in FY 2015.
8 A reorganization took effect in April 2014 which created new divisions.
9 In September 2015 reorganization, all employees previously in the Chief of Staff Division were transferred to other divisions.
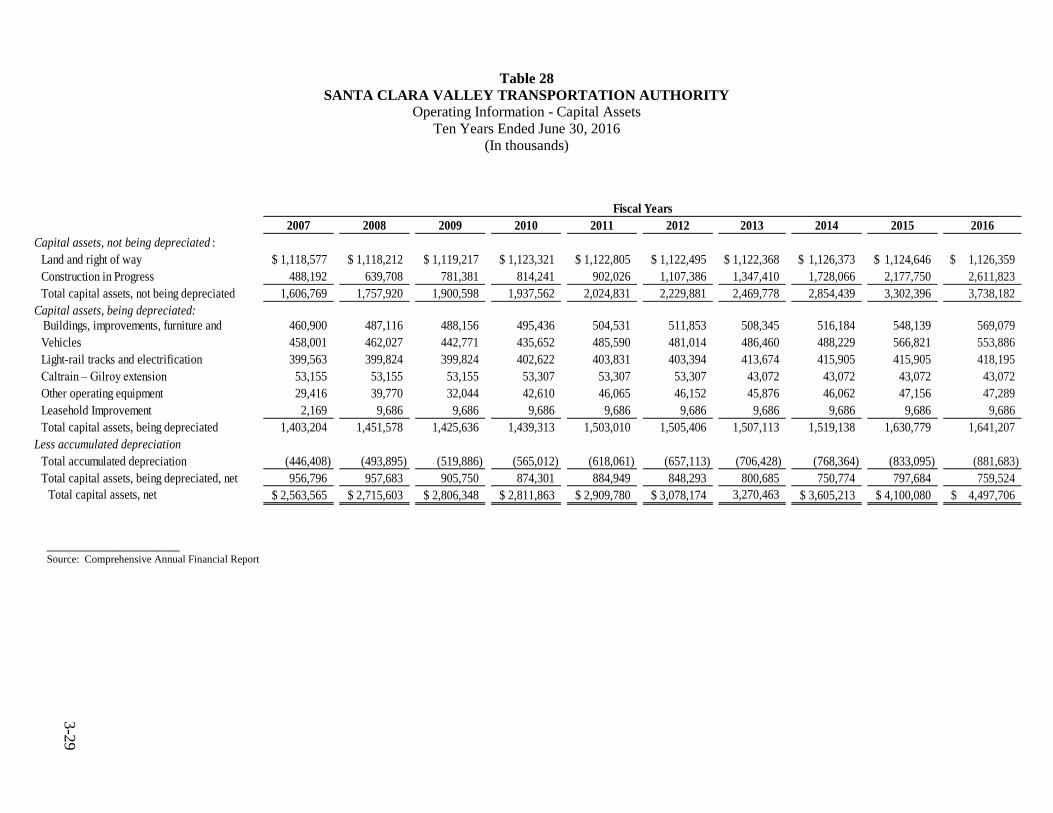
3-2
9
Table 28
SANTA CLARA VALLEY TRANSPORTATION AUTHORITY
Operating Information - Capital Assets
Ten Years Ended June 30, 2016
(In thousands)
2007 2008 2009 2010 2011 2012 2013 2014 2015 2016
Capital assets, not being depreciated :
Land and right of way 1,118,577$ 1,118,212$ 1,119,217$ 1,123,321$ 1,122,805$ 1,122,495$ $ 1,122,368 1,126,373$ 1,124,646$ 1,126,359$
Construction in Progress 488,192 639,708 781,381 814,241 902,026 1,107,386 1,347,410 1,728,066 2,177,750 2,611,823
Total capital assets, not being depreciated 1,606,769 1,757,920 1,900,598 1,937,562 2,024,831 2,229,881 2,469,778 2,854,439 3,302,396 3,738,182
Capital assets, being depreciated:
Buildings, improvements, furniture and 460,900 487,116 488,156 495,436 504,531 511,853 508,345 516,184 548,139 569,079
Vehicles 458,001 462,027 442,771 435,652 485,590 481,014 486,460 488,229 566,821 553,886
Light-rail tracks and electrification 399,563 399,824 399,824 402,622 403,831 403,394 413,674 415,905 415,905 418,195
Caltrain – Gilroy extension 53,155 53,155 53,155 53,307 53,307 53,307 43,072 43,072 43,072 43,072
Other operating equipment 29,416 39,770 32,044 42,610 46,065 46,152 45,876 46,062 47,156 47,289
Leasehold Improvement 2,169 9,686 9,686 9,686 9,686 9,686 9,686 9,686 9,686 9,686
Total capital assets, being depreciated 1,403,204 1,451,578 1,425,636 1,439,313 1,503,010 1,505,406 1,507,113 1,519,138 1,630,779 1,641,207
Less accumulated depreciation
Total accumulated depreciation (446,408) (493,895) (519,886) (565,012) (618,061) (657,113) (706,428) (768,364) (833,095) (881,683)
Total capital assets, being depreciated, net 956,796 957,683 905,750 874,301 884,949 848,293 800,685 750,774 797,684 759,524
Total capital assets, net 2,563,565$ 2,715,603$ 2,806,348$ 2,811,863$ 2,909,780$ 3,078,174$ 3,270,463 3,605,213$ 4,100,080$ 4,497,706$
Fiscal Years
____________________ Source: Comprehensive Annual Financial Report

END OF DOCUMENT


