COMPREHENSIVE ANNUAL FINANCIAL REPORT of the Borough of Fair Lawn Board of Education Fair Lawn, New Jersey For the Fiscal Year Ended June 30, 2016 Prepared by Borough of Fair Lawn Board of Education Finance Department
Transcript
COMPREHENSIVE ANNUAL
FINANCIAL REPORT
of the
Borough of Fair Lawn Board of Education Fair Lawn, New Jersey
For the Fiscal Year Ended June 30, 2016
Prepared by
Borough of Fair Lawn Board of Education Finance Department
BOARD OF EDUCATION BOROUGH OF FAIR LAWN SCHOOL DISTRICT
TABLE OF CONTENTS
INTRODUCTORY SECTION (Unaudited)
Letter of Transmittal Organizational Chart Roster of Officials Consultants and Advisors
FINANCIAL SECTION
INDEPENDENT AUDITOR'S REPORT
Independent Auditor's Report on General Purpose Financial Statements and Supplementary Schedules of Expenditures of Federal Awards and State Financial Assistance
REQUIRED SUPPLEMENTARY INFORMATION - PART I
Management's Discussion and Analysis (Unaudited)
BASIC FINANCIAL STATEMENTS
A. District - wide Financial Statements: A-I Statement of Net Position A-2 Statement of Activities
B. Fund Financial Statements: Governmental Funds:
B-1 Balance Sheet B-2 Statement of Revenues, Expenditures and Changes
in Fund Balances B-3 Reconciliation of the Statement of Revenues, Expenditures
and Changes in Fund Balances of Governmental Funds to the Statement of Activities
Proprietary Funds: B-4 Statement of Net Position B-5 Statement of Revenues, Expenses and Changes in Fund
Net Position B-6 Statement of Cash Flows
Fiduciary Funds: B-7 Statement of Fiduciary Net Position B-8 Statement of Changes in Fiduciary Net Position
\-5 6 7 8
11-13
15-21
24 25
28
29
30
32
33 34
36 37
BOARD OF EDUCATION BOROUGH OF FAIR LA WN SCHOOL DISTRICT
TABLE OF CONTENTS CONTINUED
NOTES TO BASIC FINANCIAL STATEMENTS
REQUIRED SUPPLEMENTARY INFORMATION - PART II
C. Budgetary Comparison Schedules: C-I Budgetary Comparison Schedule - General Fund C-2 Budgetary Comparison Schedule - Special Revenue Fund
NOTES TO REQUIRED SUPPLEMENTARY INFORMATION - PART II
C-3 Budget to GAAP Reconciliation
REQUIRED SUPPLEMENTARY INFORMATION - PART III
L. Schedules Related to Accounting and Reporting for Pensions (GASB 68) L-I Schedule of the District's Proportionate Share of the Net Pension
Liability - PERS L-2 Schedule of District Contributions - PERS L-3 Schedule of the District's Proportionate share of the Net Pension
Liability - TPAF
NOTES TO REQUIRED SUPPLEMENTARY INFORMATION - PART III
Notes to required Supplementary Information
OTHER SUPPLEMENTARY INFORMATION
D. School Level Schedules:Fund Financial Statements: 0-1 Combining Balance Sheet 0-2 Blended Resource Fund - Schedule of Expenditures
Allocated by Resource Type-Actual 0-3 Blended Resource Fund - Schedule of Blended
Expenditures - Budget and Actual
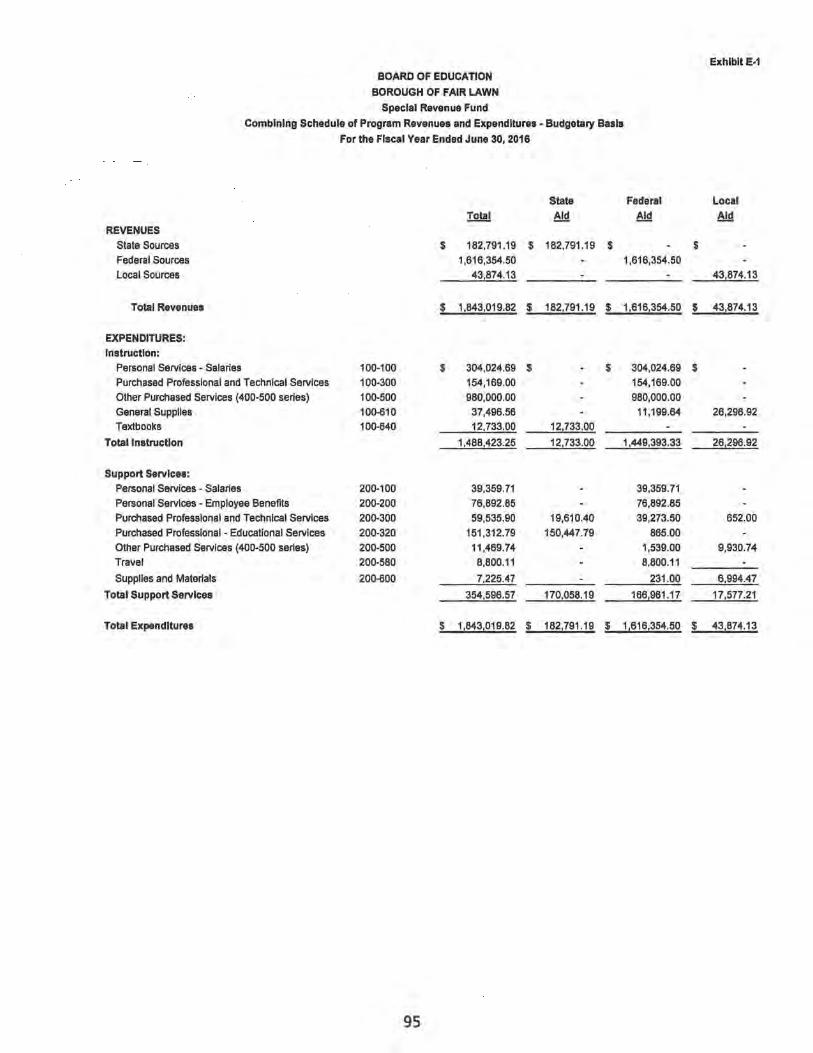
E. Special Revenue Fund: E-I Combining Schedule of Program Revenues and
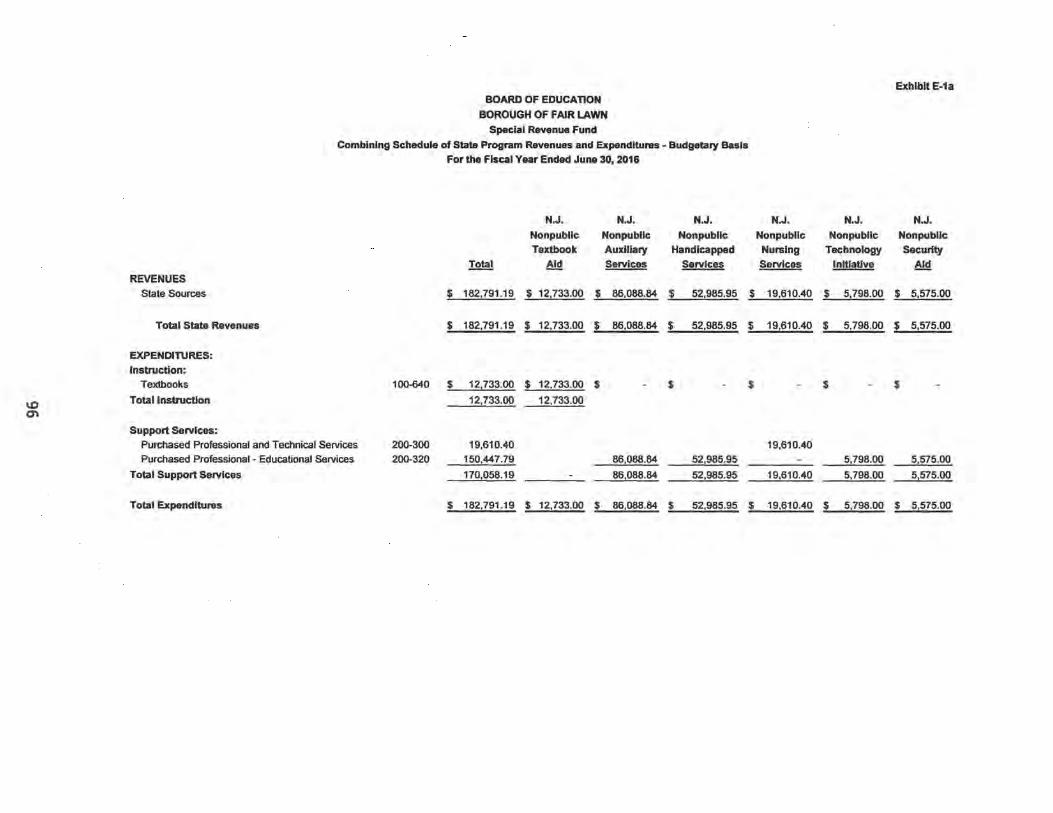
Expenditures - Budgetary Basis E-I a Combining Schedule of State Program Revenues and
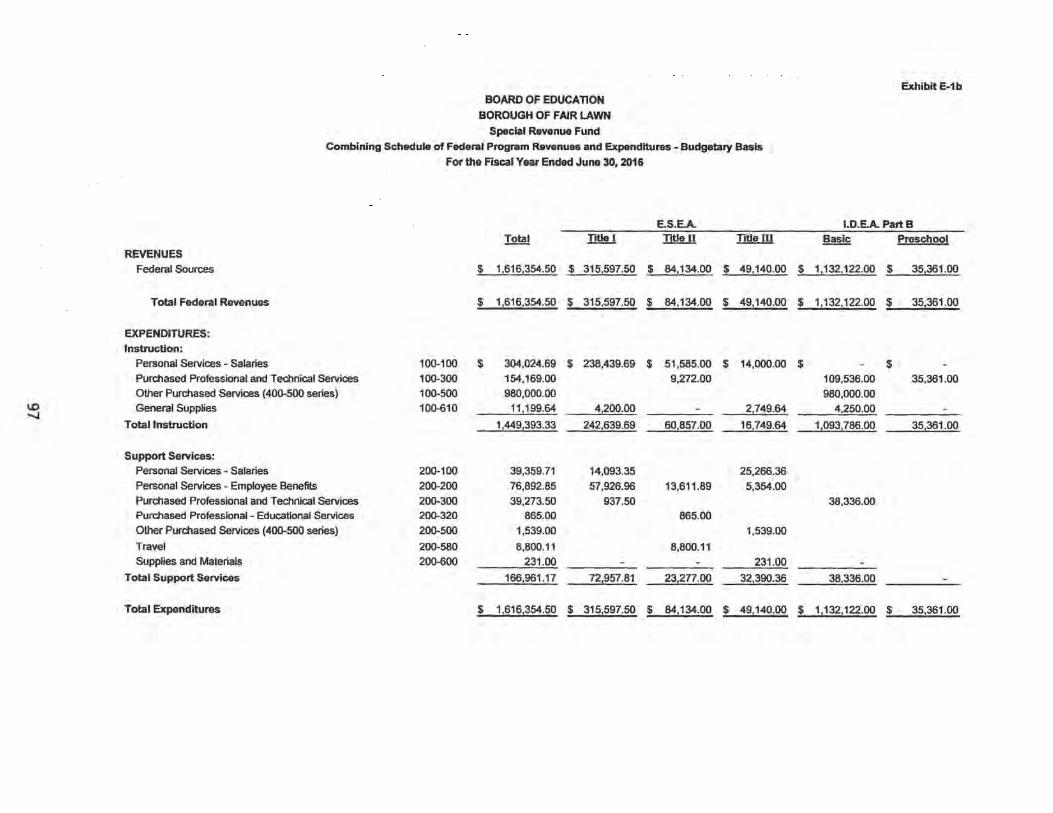
Expenditures - Budgetary Basis E-I b Combining Schedule Federal of Program Revenues and
Expenditures - Budgetary Basis E-I c Combining Schedule of Local Program Revenues and
Expenditures - Budgetary Basis
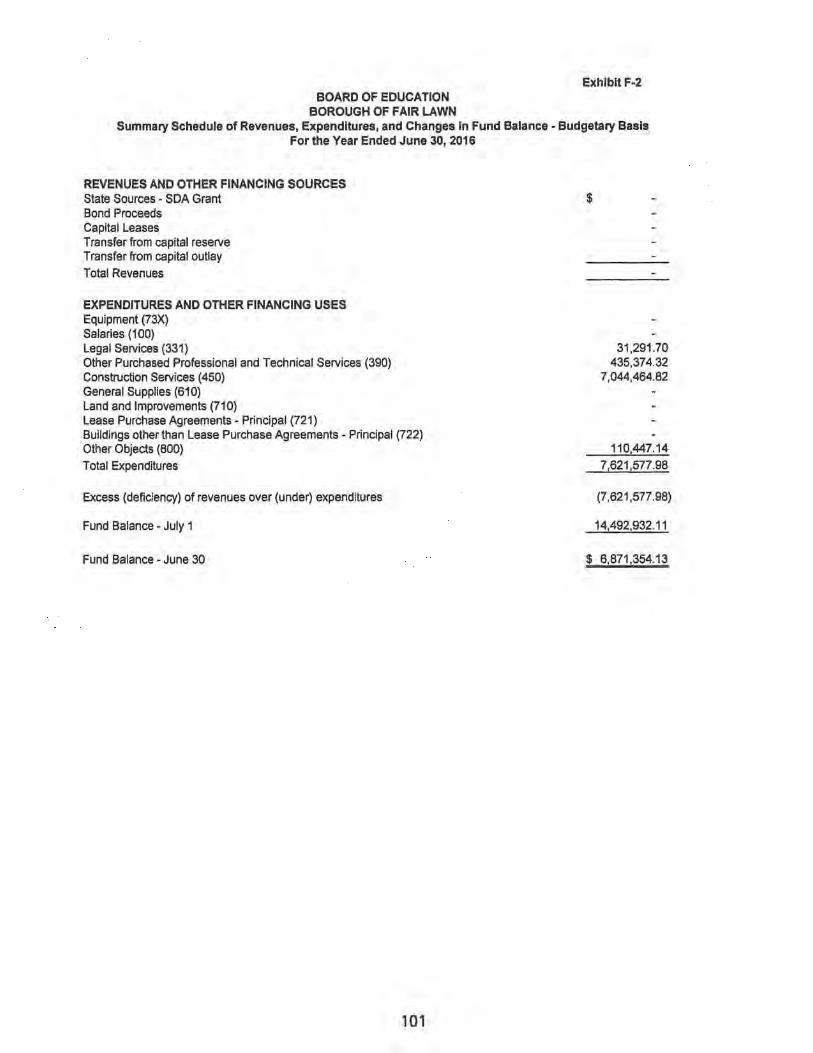
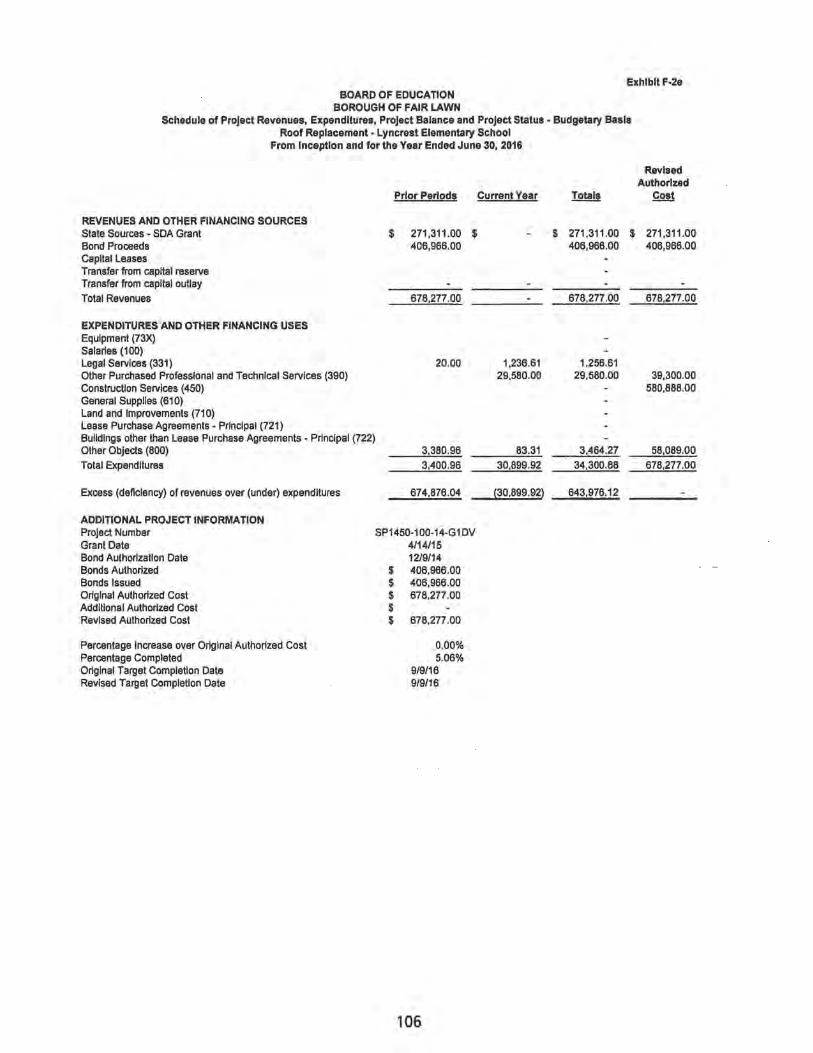
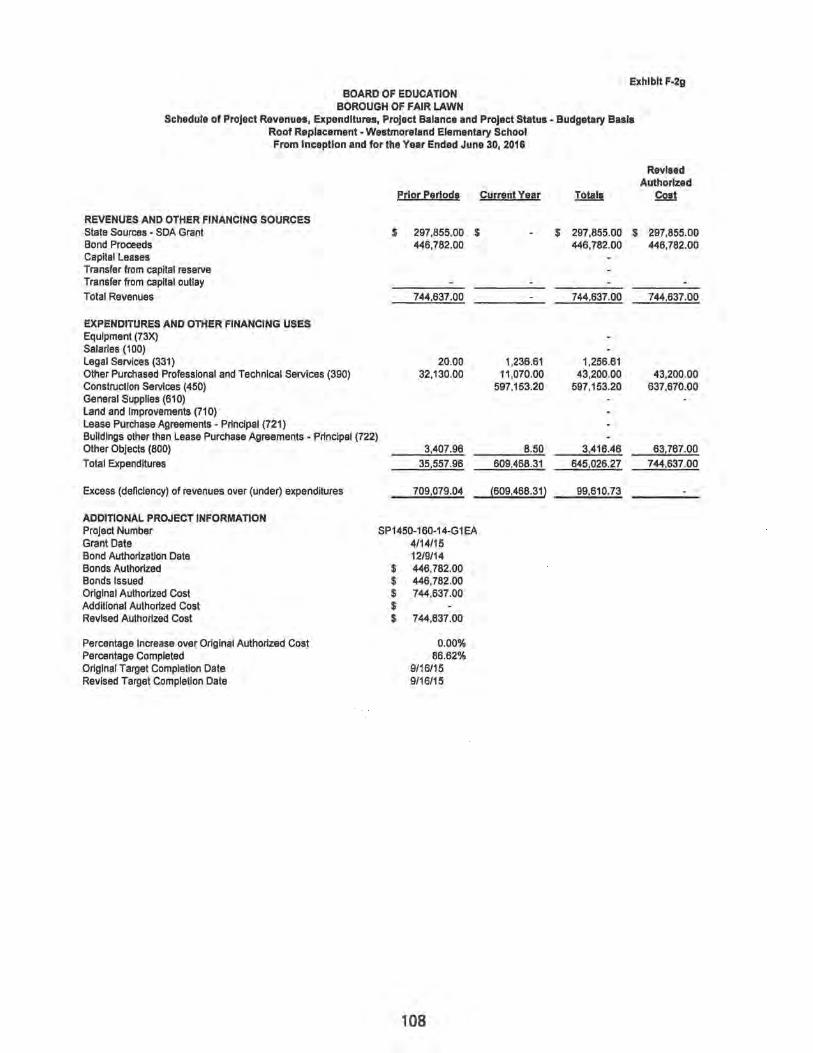
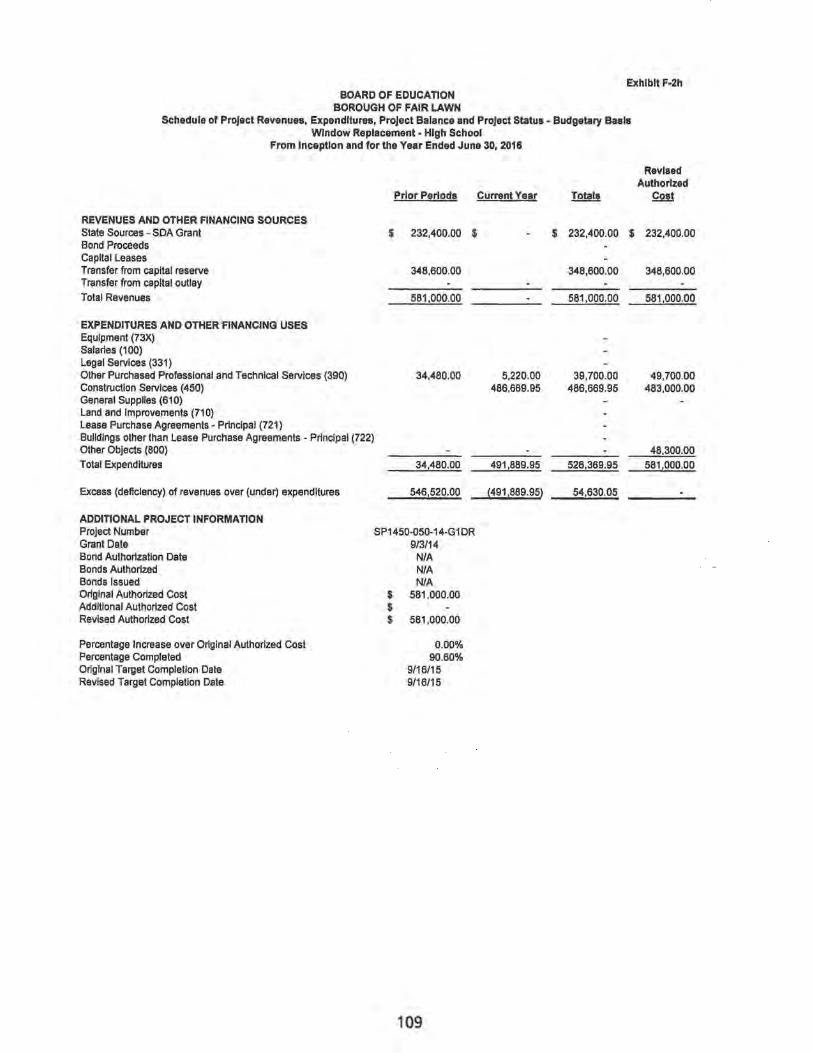
F. Capital Projects Fund: F-I Summary Schedule of Project Expenditures F-2 Summary Schedule of Revenues, Expenditures and
Changes in Fund Balance - Budgetary Basis F-2a to F-21- Schedule of Project Revenues, Expenditures, Project
Balance and Project Status - Budgetary Basis
39-73
76-81 82
84
87 88 89
91
N/A
N/A
N/A
95
96
97
98
100
101
102-113
BOARD OF EDUCATION BOROUGH OF FAIR LAWN SCHOOL DISTRICT
TABLE OF CONTENTS
(CONTINUED)
REQUIRED SUPPLEMENTARY INFORMATION -PART II (CONTINUED)
G. Proprietary Funds: Enterprise Fund:
G-I Combining Statement of Net Assets G-2 Combining Statement of Revenues, Expenses
and Changes in Fund Net Assets G-3 Combining Statement of Cash Flows
O. Proprietary Funds: Internal Service Fund:
G-4 Combining Statement of Net Assets G-5 Combining Statement of Revenues, Expenses
and Changes in Fund Net Assets G-6 Combining Statement of Cash Flows
H. Fiduciary Fund H-I Combining Statement of Fiduciary Net Assets H-2 Combining Statement of Changes in Fiduciary
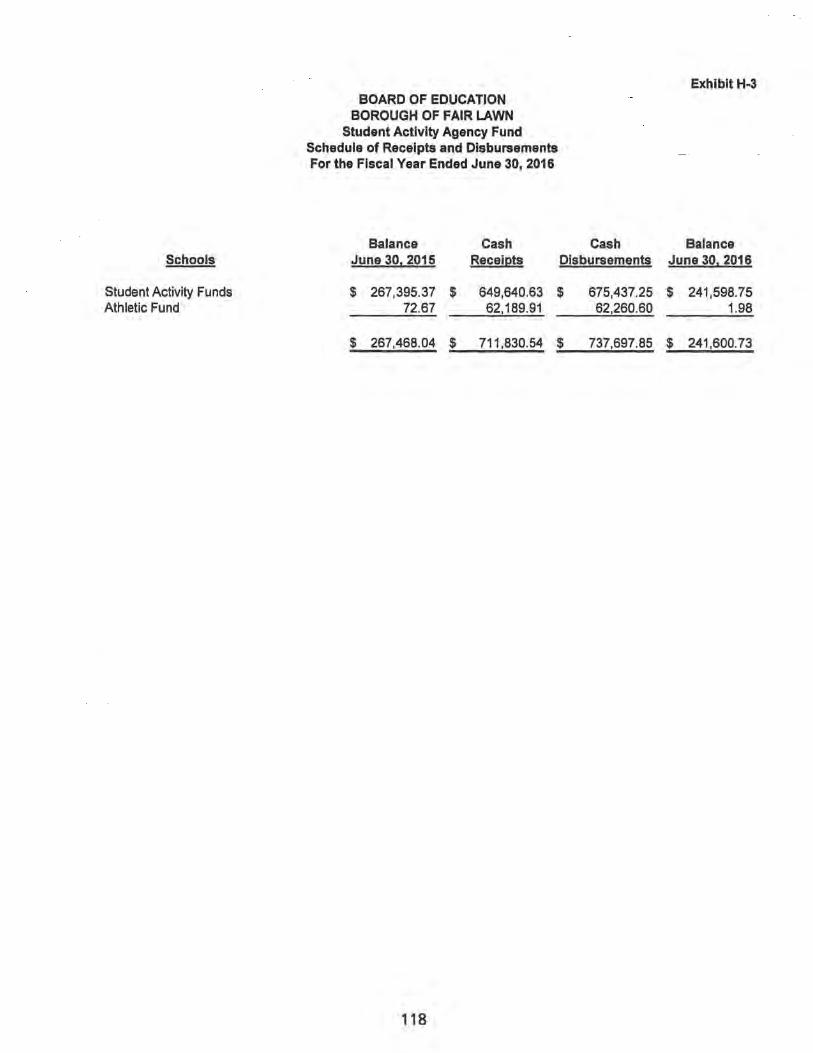
Net Assets H-3 Student Activity Agency Fund Schedule of
Receipts and Disbursements H-4 Payroll Agency Fund Schedule of Receipts and
Disbursements
I. Long - Term Debt I-I Schedule of Serial Bonds 1-2 Schedule of Obligation Under Capital Leases 1-3 Debt Service Fund Budgetary Comparison Schedule
ST A TISTICAL SECTION (UNAUDITED)
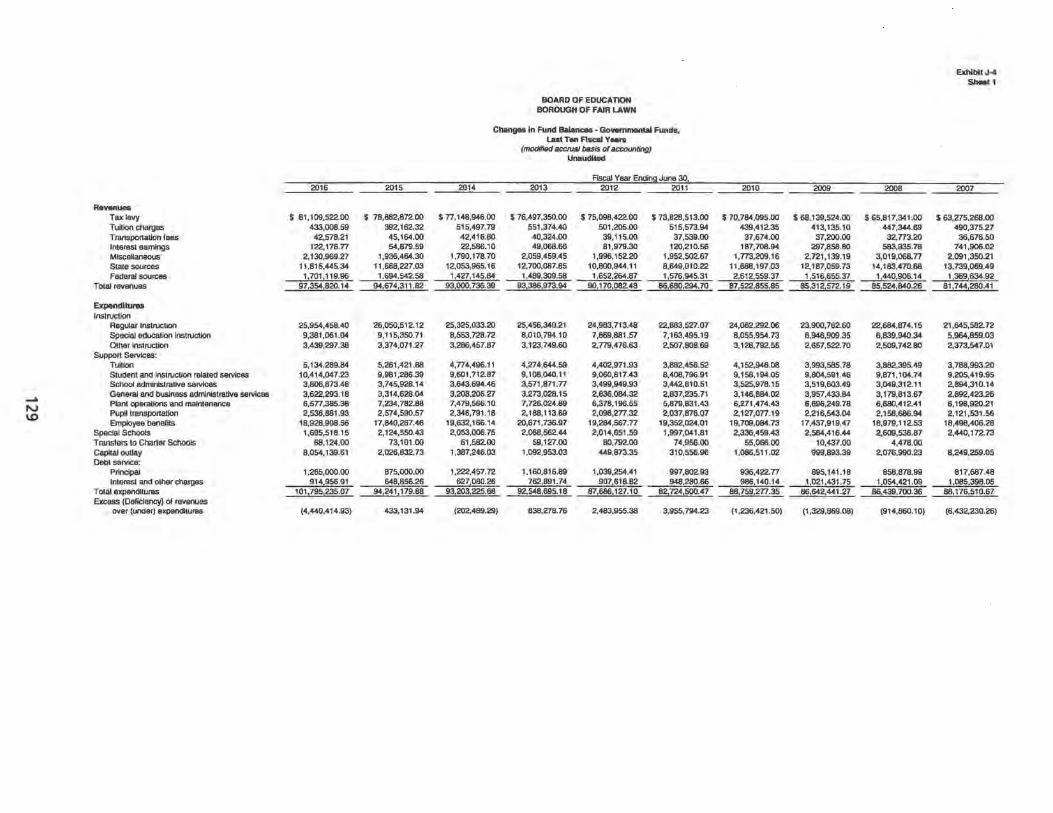
1. Financial Trends: J-I Net Assets by Component J-2 Changes in Net Assets J-3 Fund Balances - Governmental Funds J-4 Changes in Fund Balances - Governmental Funds J-5 General Fund - Other Local Revenue by Source
Revenue Capacity J-6 Assessed Value and Estimated Actual Value of Taxable Property J-7 Direct and Overlapping Property Tax Rates J-8 Principal Property Taxpayers J-9 Property Tax Levies and Collections
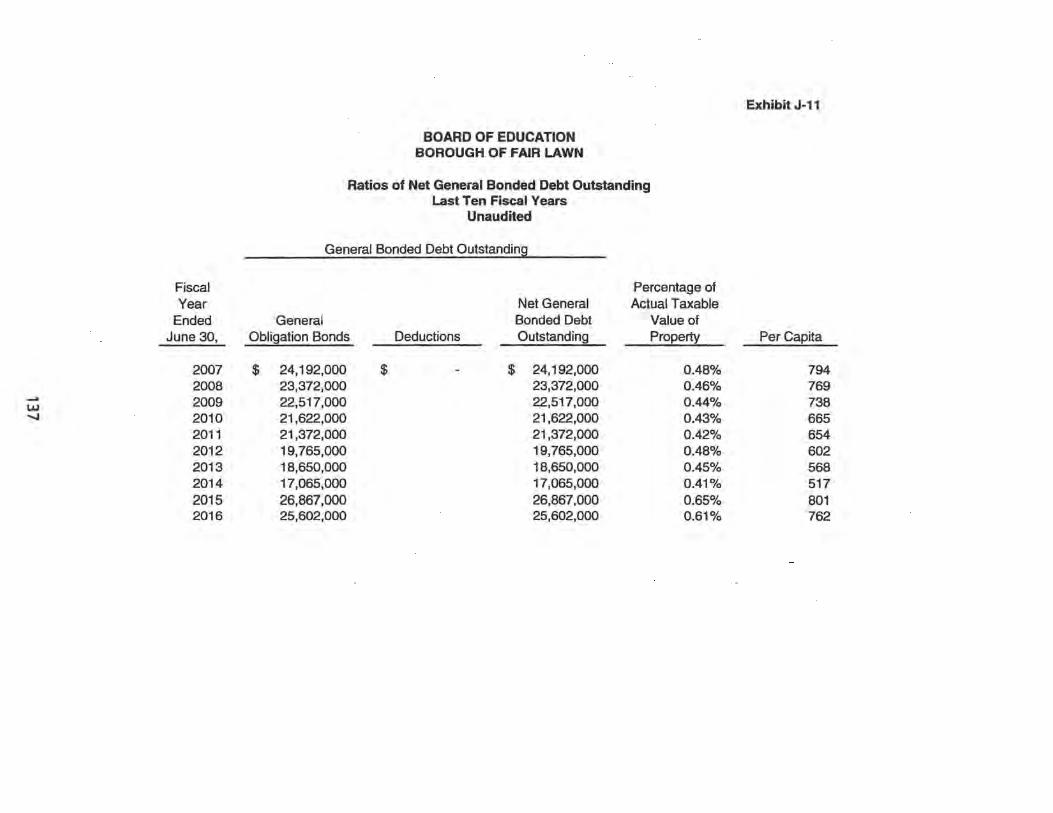
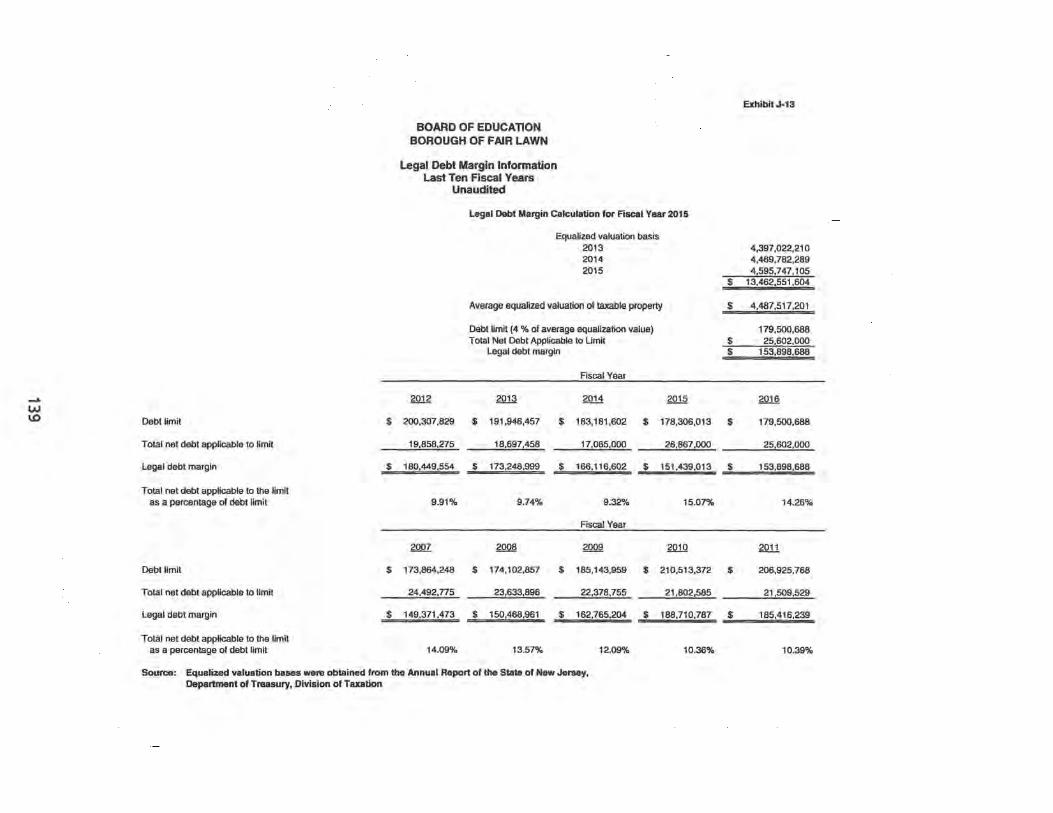
Debt Capacity J-IO Ratios of Outstanding Debt by Type J-II Ratios of Net General Bonded Debt Outstanding J-12 Direct and Overlapping Governmental Activities Debt as of June 30 J-13 Legal Debt Margin Information
N/A
N/A N/A
N/A
N/A N/A
N/A
N/A
118
119
121 N/A 122
125 126-127
128 129-130
131 132 133 134 135
136 137 138 139
BOARD OF EDUCATION BOROUGH OF FAIR LAWN SCHOOL DISTRICT
TABLE OF CONTENTS CONTINUED
STATISTICAL SECTION (UNAUDITED) (Continued)
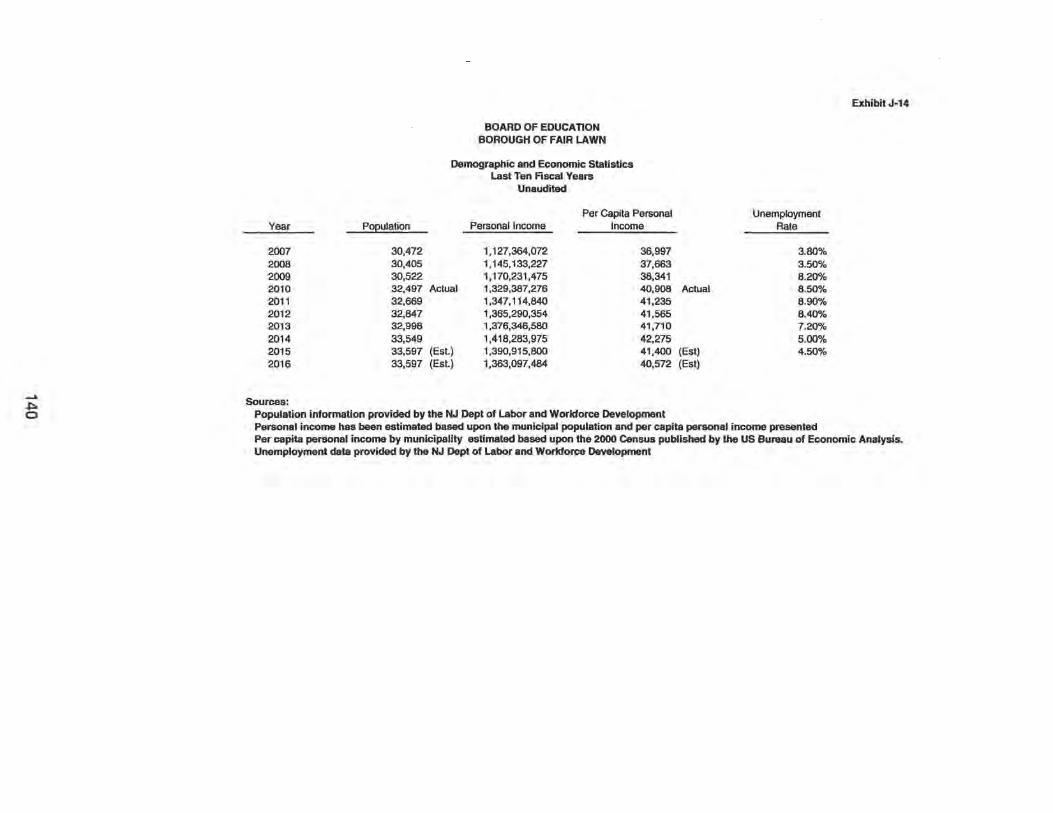
Demographic and Economic Information J-14 Demographic and Economic Statistics J-15 Principal Employers
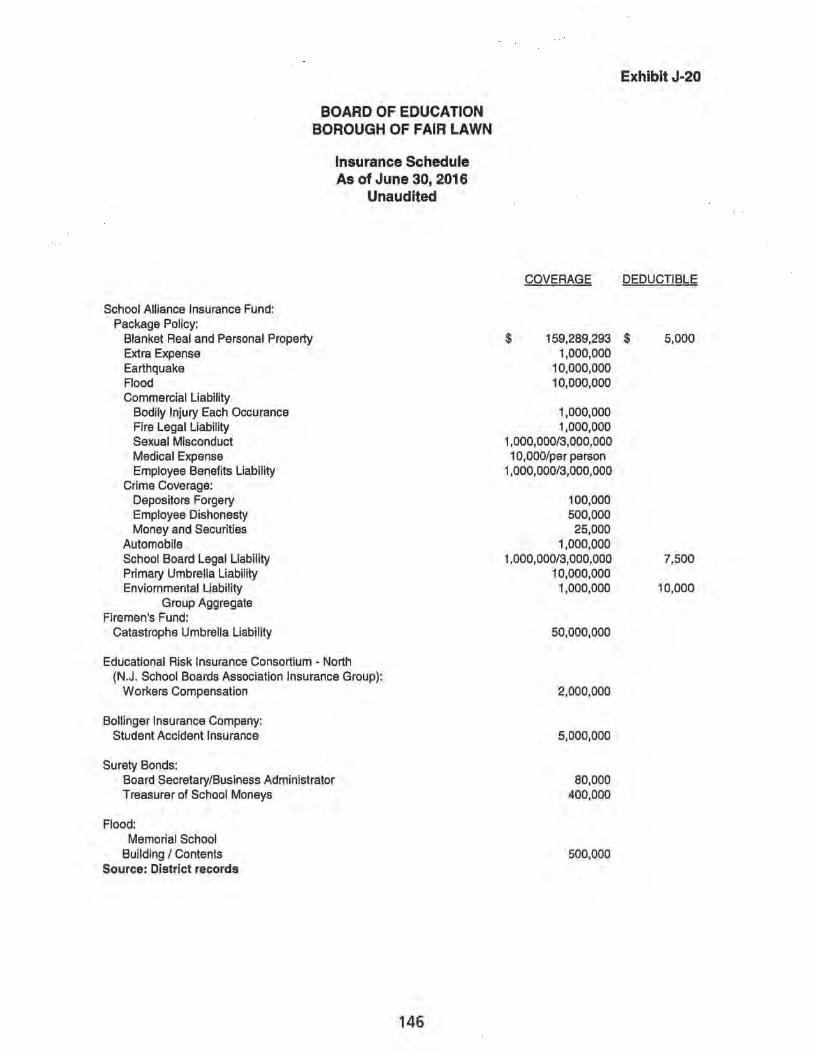
Operating Information J-16 Full-time Equivalent District Employees by Function/Program J-17 Operating Statistics J-18 School Building Information J-19 Schedule of Required Maintenance for School Facilities J-20 Insurance Schedule
SINGLE AUDIT SECTION
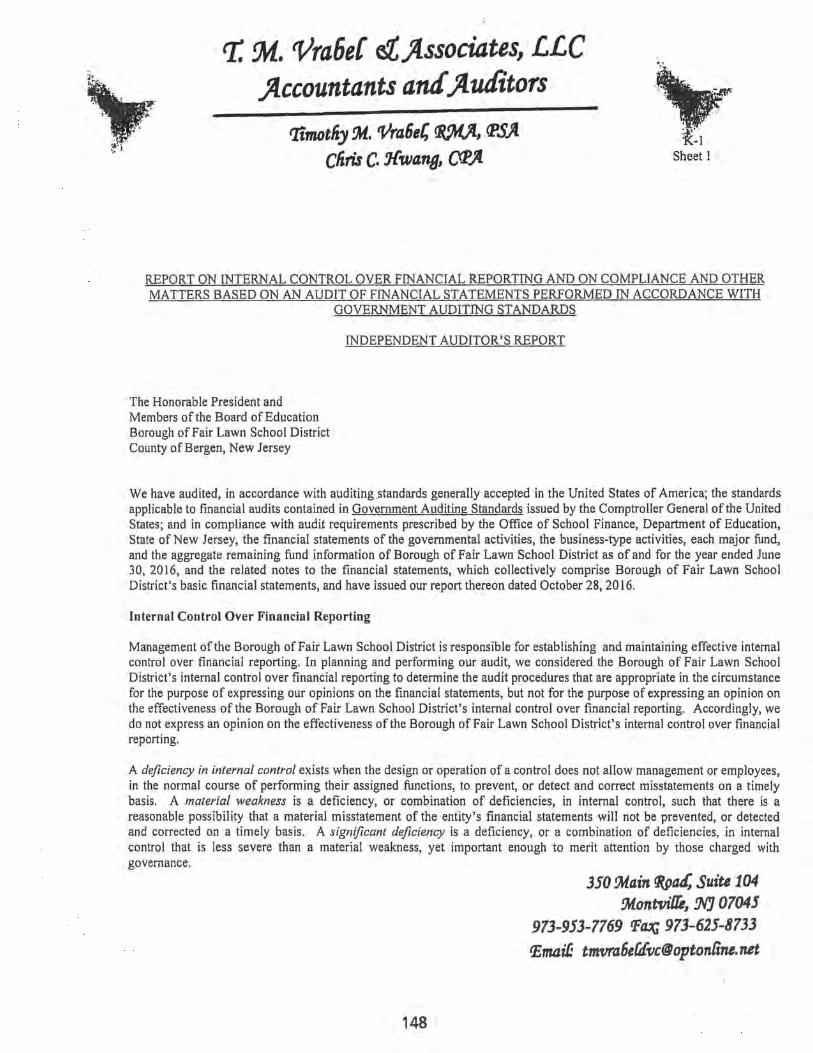
K-I Report on Internal Control over Financial Reporting and on Compliance and Other Matters Based on an Audit of Financial Statements Performed in Accordance with "Government Auditing Standards"
K-2 Report on Compliance for Each Major Program; Report on Internal Control over Compliance; Report on Schedules of Expenditures of Federal Awards and State Financial Assistance Required by OMB Circular A-133 and New Jersey OMB Circular Letter 15-08
K-3 Schedule of Expenditures of Federal Awards, Schedule A K-4 Schedule of Expenditures of State Financial Assistance, Schedule B K-5 Notes to Schedules of Expenditures of Awards and Financial
Assistance K-6 Schedules of Findings and Questioned Costs
Part 1 Summary of Auditor's Results Part 2 Schedule of Financial Statement Findings Part 3 Schedule of Federal Awards and State Financial Assistance
Findings and Questioned Costs K-7 Summary Schedule of Prior-Year Audit Findings and Questioned Costs
140 141
142 143 144 145 146
148- 149
150-152 153 154
155-156
157-158 159
160 161
Introductory Section
..
Board of Education Fair Lawn School District
October, 2016
Honorable President and Members of the Board of Education Fair Lawn School District County of Bergen, New Jersey
Dear Board Members:
The comprehensive annual financial report (CAFR) of the Fair Lawn School District (District) for the fiscal year ended June 30, 2016, is hereby submitted. Responsibility for both the accuracy of the data and completeness and fairness of the presentation, including all disclosures, rests with the management of the Board of Education (Board). To the best of our knowledge and belief, the data presented in this report is accurate in all material respects and is reported in a manner designed to present fairly, in all material respects, the respective financial position of the governmental activities, the business-type activities, each major fund, and the aggregate remaining fund infonnation of the District as of June 30, 2016 and the respective changes in financial position and cash flows, where applicable, thereof for the year then ended in conformity with accounting principles generally accepted in the United States of America. All disclosures necessary to enable the reader to gain an understanding of the District's financial activities have been included.
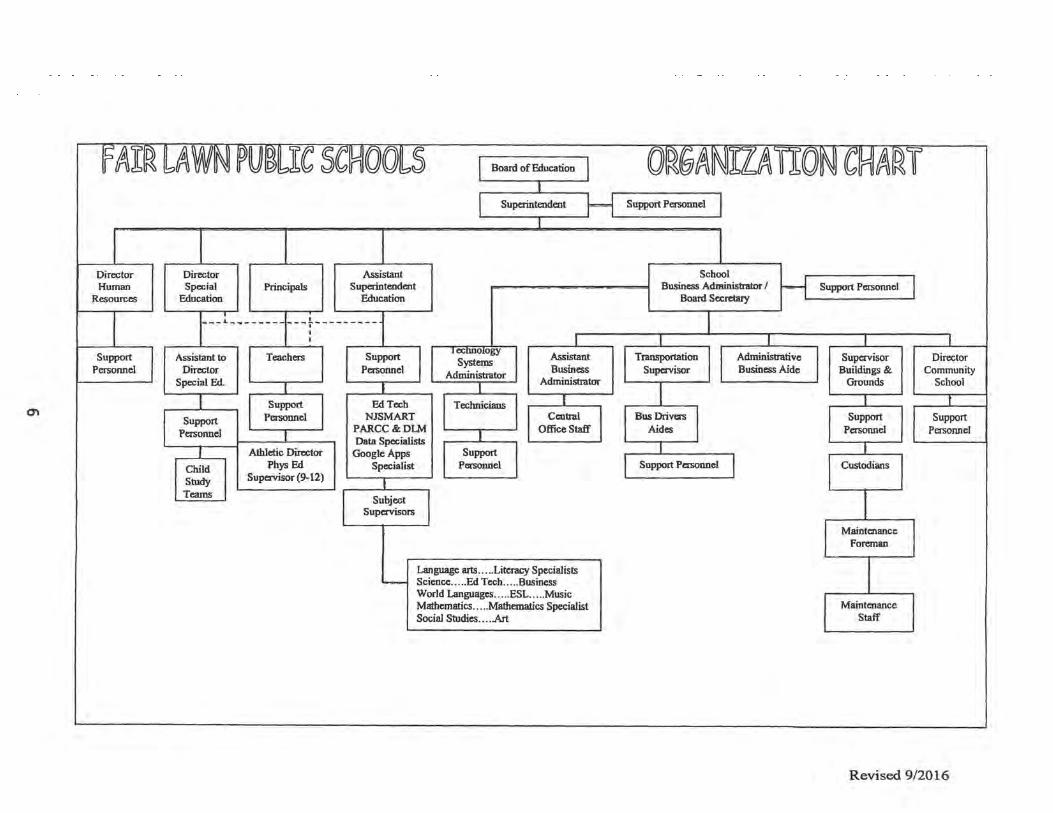
The comprehensive annual financial report is presented in four sections: introductory, financial, statistical and single audit. The introductory section includes this transmittal letter, the District's organizational chart and a list of principal officials. The financial section includes the basic financial statements and schedules, as well as the auditor's report thereon. The statistical section includes selected financial and demographic information, generally presented on a multi-year basis. The District is required to undergo an annual single audit in conformity with the provisions of the Single Audit Act Amendments of 1996 and the Title 2 U.S. Code of Federal Regulations (CFR) Part 200, "Uniform Administrative Requirements, Cost Principles, and Audit Requirements for Federal Awards" and the State Treasury Circular Letter 15-08 OMB, "Single Audit Policy for Recipients of Federal Grants, State Grants and State Aid." Information related to this single audit, including the auditor's report on the internal control structure and compliance with applicable laws and regulations and findings and recommendations, are included in the single audit section of this report.
1. REPORTING ENTITY AND ITS SERVICES
Fair Lawn School District is an independent reporting entity within the criteria adopted by the Governmental Accounting Standards Board (GASB) as established by GASB Statement No. 14. All funds and account groups of the District are included in this report. The Fair Lawn Board of Education and all its schools constitute the District's reporting entity.
The District provides a full range of educational services appropriate to grade levels K through 12. These include regular, vocational as well as special education for students with disabilities. The District completed the 2015-2016 year with an enrollment of 4,789 students. The following details the changes in the student enrollment of the District over the last ten years.
Fair Lawn is mostly a residential community which also contains some industry where the top ten (10) business tax payers offer employment from 100 employees per company to 2,000 per company.
Among the prime occupants of Fair Lawn's industrial area are such well-known companies as Mondelez Global, Colmnbia Bank Corporate Headquarters, Noble mY Hotels, Fair Lawn Promenade, LLC and others of equal and lesser stature.
Fair Lawn's excellent location in the New YorkJNew Jersey metropolitan area, the availability of convenient transportation, the favorable municipal tax structure and the multitude of social, educational and cultural services, have created a desirable atmosphere for attracting industry to locate within its borders.
Located within easy access to New York City, the district, which is coterminous with Fair Lawn Borough, serves a mature residential area. School enrollment has remained relatively stable the last few years.
The majority of Fair Lawn residents occupy single family dwellings. There are also available in the Borough two family homes, apartments and townhouses. Housing is well maintained in all areas of the Borough.
The Radburn section of the Borough, developed before the Second World War, is still considered a model of innovative community planning, combining individual homes, row houses and garden apartments with common areas and recreational facilities maintained by a private cooperative association.
3. MAJOR INITIATIVES
The Fair Lawn School District offers a challenging curriculum that extends beyond the New Jersey Student Learning Standards and the Core Curriculum Content Standards. For example, students participate in STEM activities and courses at the elementary, middle, and high school1evels; students participate in a range of academic contests throughout the year; and
2
students benefit from the various partnerships between the school district and local universities/colleges. Additionally, Fair Lawn High School offers 24 AP courses as well as 40 Honors courses.
Fair Lawn High School Seniors (2016) recorded their average Scholastic Aptitude Test (SAT) scores at 30 points writing and 33 points math above the national ayerage and 20 points on critical reading above the national average and 27 points math and 20 points writing and 17 points critical reading above the state average. Ninety-six percent of our 2016 graduates went on to higher education.
The educational experience of students is enhanced by a broad set of extracurricular offerings in the arts, athletics, service organizations, and special-interest activities. FLHS offers 73 such clubs and activities, including Varsity Law Team, Drama Club, Ski Club, and the Astronomy Club. District students participated in regional chorus groups, the New Jersey All State Chorus, as well as regional band and orchestra groups. Fair Lawn High School hosts 28 out of 31 NJSIAA sanctioned programs, and last year, we celebrated 11 league and 2 county championships.
During the 2015/2016 school year the Fair Lawn High School STEM lab underwent a major expansion, including the purchase of three 3D printers.
The Fair Lawn School District also believes it is essential to engender productive and humane citizens who are empowered with the tools necessary to function democratically in a global society. This is accomplished through strong academic programs, the establishment of a positive learning climate, a strong partnership with parents and the community, the professionalism and dedication of our staff, and our commitment to ensure high levels of learning for all students.
4. INTERNAL ACCOUNTING CONTROLS
Management of the District is responsible for establishing and maintaining an internal control structure designed to ensure that the assets of the District are protected from loss, theft or misuse and to ensure that adequate accounting data are compiled to allow for the preparation of financial statements in confonnity with generally accepted accounting principals (GAAP). The internal control structure is designed to provide reasonable, but not absolute, assurance that these objectives are met. The concept of reasonable assurance recognizes that: (1) the cost of a control should not exceed the benefits likely to be derived; and (2) the valuation of costs and benefits requires estimates and judgments by management.
As a recipient of federal and state financial assistance, the District also is responsible for ensuring that an adequate internal control structure is in place to ensure compliance with applicable laws and regulations related to those programs. This internal control structure is also subject to periodic evaluation by the District management. As part of the District's single audit described earlier, tests are made to determine the adequacy of the internal control structure, including that portion related to federal and state financial assistance programs, as well as to determine that the District has complied with applicable laws and regulations.
3
5. BUDGETARY CONTROLS
In addition to internal accounting controls the District maintains budgetary controls. The objective of these budgetary controls is to ensure compliance with legal provisions embodied in the annual appropriated budget. Annual appropriated budgets are adopted for the general fund, the special revenue fund, and the debt service fund. Project-length budgets are approved for the capital improvements accounted for in the capital projects fund. The final budget amount as amended for the fiscal year is reflected in the financial section.
An encumbrance accounting system is used to record outstanding purchase commitments on a line item basis. Open encumbrances at year-end are either canceled or are included as re-appropriation of fund balance in the subsequent year. Those amounts to be reappropriated are reported as reservations of fund balance at June 30, 2016.
6. ACCOUNTING SYSTEM AND REPORTS
The District's accounting records reflect generally accepted accounting principles, as promulgated by the Governmental Accounting Standards Board (GASB). The accounting system of the District is organized on the basis of funds and account groups. These funds and account groups are explained in ''Notes to the Financial Statements," Note 1.
7. DEBT ADMINISTRATION
At June 30, 2016, the District's outstanding debt issues include Serial Bonds and Loans Payable. In March 2004, the District experienced a successful bond referendum for a total of$23,662,000.00. The proceeds of this bond issue were designed for yarious school building improvements. The pay down of this outstanding debt began during the 2005-2006 school year and will end February 15, 2030.
In 2013, the district refinanced existing school bonds and issued new debt which resulted in annualized savings in excess of $20,000 per year which conmienced in August 2013.
In December 2014, the District achieved another successful $10.677 million Bond Referendum. Moody's upgraded the district's bond ratings to an Aa2 underlying and Aa3 enhanced rating. Bond sale was held on February 11, 2015.
The proceeds of this bond issue were placed in the District's capital projects fund for use to provide funds for the reroofing of the District's school buildings and an addition to one of the district's elementary schools. The pay down of this outstanding debt began during the 2015/2016 school year and will end June 30, 2035.
8. CASH MANAGEMENT
The investment policy of the District is guided in large part by state statute as detailed in "Notes to the Financial Statements", Note 2. The District has adopted a cash management plan which requires it to deposit pubHc funds in public depositories
4
protected from loss under the provisions of the Governmental Unit Deposit Protection Act (nGUDP A"). GUDP A was enacted in 1970 to protect Governmental Units from a loss offunds on deposit with a failed banking institution in New Jersey. The law requires governmental units to deposit public funds only in public depositories located in New Jersey, where the funds are secured in accordance with the Act. During the 1993-94 fiscal year, the Board approved extending their official Depositories to include the New Jersey Cash Management Fund.
The Fund was established in 1977 and is invested by the Division of Investment of the Treasury Department under the jurisdiction of the State Investment Council. In November 1977, legislation was enacted (P.L. 1977. C.281) which permits counties, municipalities, and school districts to participate
9. RISK MANAGEMENT
The Board carries various forms of insurance, including but not limited to general liability, student accident, environmental liability, excess umbrella liability, automobile liability and comprehensive/collision, workers' compensation, School Board legal liability, hazard and theft insurance on property and contents, and fidelity bonds.
10. OTHER INFORMATION
Independent Audit - State statutes require an annual audit by independent certified public accountants or registered municipal accountants. The accounting firm ofT.M. Vrabel & Associates LL.C, was selected by the Board's audit committee. In addition to meeting the requirements set forth in state statutes, the audit also was designed to meet the requirements of the Single Audit Act Amendments of 1996 and the related Title 2 U.S. Code of Federal Regulations (CFR) Part 200, ''Uniform Administrative Requirements, Cost Principles, and Audit Requirements for Federal Awards" and State Treasury Circular Letter 15-08 OMB. The auditor's report on the general purpose financial statements and combining and individual fund statements and schedules is included in the financial section of this report. The auditor's reports related specifically to the single audit are included in the single audit section of this report.
11. ACKNOWLEDGMENTS
We would like to express our appreciation to the members of the Fair Lawn School Board for their concern in providing fiscal accountability to the citizens and taxpayers of the school district and thereby contributing their full support to the development and maintenance of our financial operation. The preparation of this report could not have been accomplished without the efficient and dedicated services of our financial and bookkeeping staff.
Ernest Palestis Interim Superintendent of Schools
5
0"1
Director Human
Resources
Director Special
Education
Child Study Teams
Principals Assistant
Superintendent Education
Data Specialists GoogleApps
Specialist
Language arts .. . .. Literacy Specialists Science . .... Ed Tech ... .. Business World Languages ..... ESL . . ... Music Mathematics ..... Mathematics Specialist Social Studies .... .Art
Support Personnel
School Business Administrator I
Board Secretary Support Personnel
Supervisor Buildings &
Grounds
Maintenance Staff
Director Community
School
Revised 9/2016
Members of the Board of Education Term Expires
CINDY JO QUACKENBUSH PRESIDENT 12/31/2016
EUGENE BANTA VICE-PRESIDENT 12/31/2018
RON BARBARULO MEMBER 12/31/2017
EL YSS FRENKEL MEMBER 12/31/2017
JEFFREY KLEIN MEMBER 12/31/2018
JOAN PIELA MEMBER 12/31/2017
MICHAEL ROSENBERG MEMBER 12/31/2016
MARK SPINDEL MEMBER 12/31/2018
MARY MONAHAN WALLACE MEMBER 12/31/2016
BRUCE WATSON, SUPERINTENDENT
JOANNE WILSON, BUSINESS ADMINISTRATORIBOARD SECRETARY
The Honorable President and Members of the Board of Education Borough of Fair Lawn School District County of Bergen, New Jersey
Report on the Financial Statements
We have audited the accompanying basic financial statements of the governmental activities, the business-type activities, each major fund, and the aggregate remaining fund information of the Borough of Fair Lawn School District as of and for the year ended June 30, 2016, and the related notes to the financial statements which collectively comprise the District's basic financial statements as listed in the table of contents.
Management's Responsibility for the Financial Statements
Management is responsible for the preparation and fair presentation of these financial statements in accordance with the accounting principles generally accepted in the United States of America; this includes the design, implementation, and maintenance of internal control relevant to the preparation and fair presentation of financial statements that are free from material misstatement, whether due to fraud or error.
Auditor's Responsibility
Our responsibility is to express opinions on these ftnancial statements based on our audit. We conducted our audit in accordance with auditing standards generally accepted in the United States of America; the standards applicable to financial audits contained in Government Auditing Standards, issued by the Comptroller General of the United States; and in compliance with audit requirements prescribed by the Office of School Finance, Department of Education, State of New Jersey. Those standards require that we plan and perform the audit to obtain reasonable assurance about whether the basic financial statements are free of material misstatement.
An audit involves performing procedures to obtain audit evidence about the amounts and disclosures in the financial statements. The procedures selected depend on the auditor's judgment, including the assessment of risks of material misstatement of the financial statements, whether due to fraud or error. In making those risk assessments, the auditor considers internal control relevant to the entity's preparation and fair presentation of the financial statements in order to design audit procedures that are appropriate in the circumstances, but not for
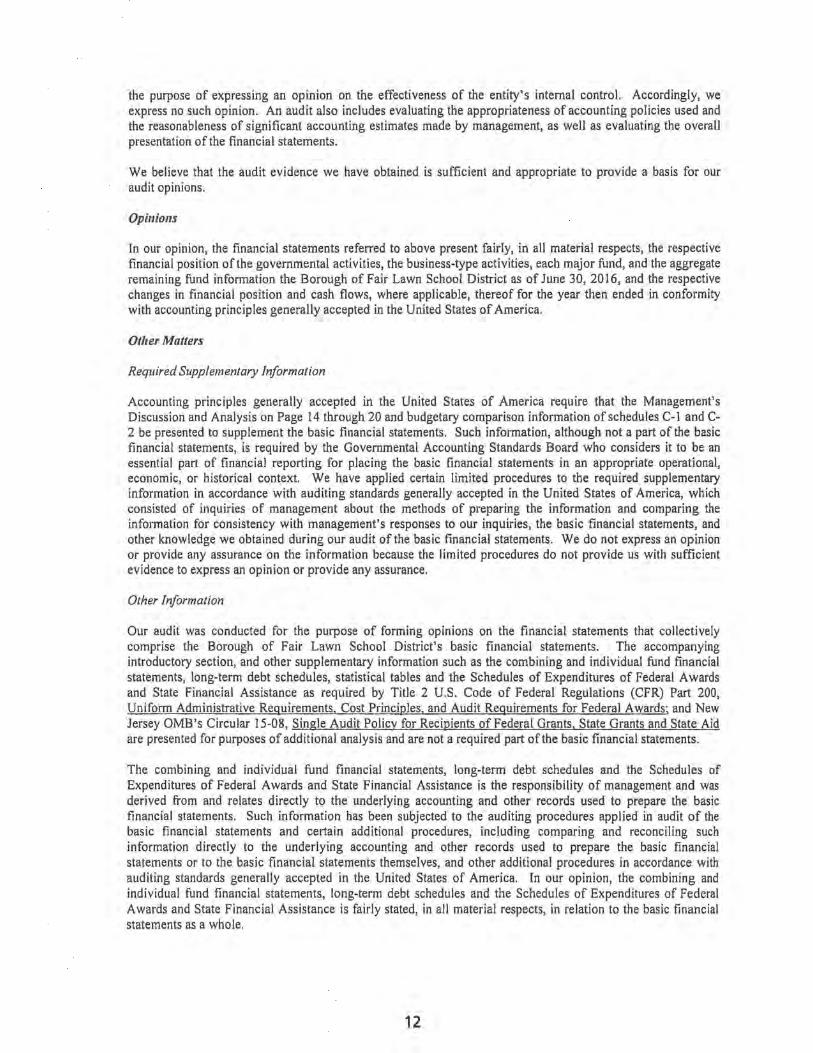
the purpose of expressing an opinion on the effectiveness of the entity's internal control. Accordingly, we express no such opinion. An audit also includes evaluating the appropriateness of accounting policies used and the reasonableness of significant accounting estimates made by management, as well as evaluating the overall presentation ofthe financial statements.
We believe that the audit evidence we have obtained is sufficient and appropriate to provide a basis for our audit opinions.
Opinions
In our opinion, the financial statements referred to above present fairly, in all material respects, the respective financial position of the governmental activities, the business-type activities, each major fund, and the aggregate remaining fund information the Borough of Fair Lawn School District as of June 30, 2016, and the respective changes in financial position and cash flows, where applicable, thereof for the year then ended in conformity with accounting principles generally accepted in the United States of America.
Otller Matters
Required Supplementary Information
Accounting principles generally accepted in the United States of America require that the Management's Discussion and Analysis on Page 14 through 20 and budgetary comparison information of schedules C- I and C-2 be presented to supplement the basic financial statements. Such information, although not a part of the basic financial statements, is required by the Governmental Accounting Standards Board who considers it to be an essential part of financial reporting for placing the basic financial statements in an appropriate operational, economic, or historical context. We have applied certain limited procedures to the required supplementary information in accordance with auditing standards generally accepted in the United States of America, which consisted of inquiries of management about the methods of preparing the information and comparing the information for consistency with management's responses to our inquiries, the basic financial statements, and other knowledge we obtained during our audit of the basic financial statements. We do not express an opinion or provide any assurance on the information because the limited procedures do not provide us with sufficient evidence to express an opinion or provide any assurance.
Other Information
Our audit was conducted for the purpose of forming opinions on the financial statements that collectively comprise the Borough of Fair Lawn School District's basic financial statements. The accompanying introductory section, and other supplementary information such as the combining and individual fund financial statements, long-term debt schedules, statistical tables and the Schedules of Expenditures of Federal Awards and State Financial Assistance as required by Title 2 U.S. Code of Federal Regulations (CFR) Part 200, Uniform Administrative Requirements, Cost Principles, and Audit Requirements for Federal Awards; and New Jersey OMB's Circular 15-08, Single Audit Policy for Recipients of Federal Grants, State Grants and State Aid are presented for purposes of additional analysis and are not a required part of the basic financial statements.
The combining and individual fund financial statements, long-term debt schedules and the Schedules of Expenditures of Federal Awards and State Financial Assistance is the responsibility of management and was derived from and relates directly to the underlying accounting and other records used to prepare the basic financial statements. Such information has been subjected to the auditing procedures applied in audit of the basic financial statements and certain additional procedures, including comparing and reconciling such information directly to the underlying accounting and other records used to prepare the basic financial statements or to the basic financial statements themselves, and other additional procedures in accordance with auditing standards generally accepted in the United States of America. In our opinion, the combining and individual fund financial statements, long-term debt schedules and the Schedules of Expenditures of Federal Awards and State Financial Assistance is fairly stated, in all material respects, in relation to the basic financial statements as a whole.
12
The introductory section and statistical tables have not been subjected to the auditing procedures and applied in the audit of the basic financial statements, and accordingly, we do not express an opinion or provide any assurance on it.
Other Reporting Required by Govemmellt Auditing Stalldards
In accordance with Government Auditing Standards, we have also issued our report dated October 28,2016 on our consideration of the Borough of Fair Lawn School District's internal control over financial reporting and on out tests of its compliance with certain provisions of laws, regulations, contracts, and grant agreements and other matters. The purpose of that report is to describe the scope of our testing of internal control over financial reporting and compliance and the results of that testing and not to provide an opinion on the internal control over financial reporting or compliance. That report is an integral part of an audit performed in accordance with Government Auditing Standards in considering Borough of Fair Lawn School District's internal control over financial reporting and compliance.
Montville, New Jersey October 28, 2016
4m.~ Timothy M. Vrabel Public School Accountant License No. CS000698
~#7
13
Chris C. W. Hwang Certified Public Accountant License No. CC033704
REQUIRED SUPPLEMENTARY INFORMATION -PART I
14
MANAGEMENT'S DISCUSSION AND ANALYSIS
Our discussion and analysis of the Fair Lawn School District financial activities for the fiscal year ended June 30, 2016. Please read it in conjunction with the transmittal letter on page 1 and the District's financial statements, which begin on page 23.
FINANCIAL HIGHLIGHTS
The District's total net position increased $5,171,000 as a result of this year's operations mainly because of the increase in the Capital Reserve Account and the decrease in outstanding debt. This year the District continues to recognize capital assets based on original cost less depreciation. (Table I)
Total cost of all of the District's programs was $96,387,000 in 2015-2016 compared to $94,232,000 in 2014-2015. (Table II)
During the year, the District had expenses for governmental activities that were $4,440,000 mores than the $97,354,000 generated in tax and other program revenues (Table III) due to planned control of expenditures and $7,621,000 of Capital Project expenditures which are primarily funded by the issuance of debt.
USING THIS ANNUAL REPORT
This annual report consists of a series of fmancial statements. The Statement of Net Position and the Statement of Activities (on pages 23 and 24) provide information about the activities of the District as a whole and present a longer-term view on the District's fmances. Fund financial statements start on page 27. For governmental activities, these statements tell how these services were financed in the short term as well as what remains for future spending. Fund fmancial statements also report the District's operation in more detail than the government-wide statements by providing information about the District's most financially significant funds
Reporting the District as a Whole
The Statement of Net Position and the Statement of Activities
Our analysis of the District as a whole begins on page 16. One of the most important questions asked about the District's fmances is "Is the District as a whole better off or worse off as a result of the year's activities?" The Statement of Net Position and the Statement of Activities report information about the District as a whole and about its activities in a way that helps answer this question. These statements include all assets and liabilities using the accrual basis of accounting, which is similar to the accounting used by most private-sector companies. Accrual of the current year's revenues and expenses are taken into account regardless of when cash is received or paid.
These two statements report the District's net position and changes in them. You can think of the District's net position, the difference between assets and liabilities, as one way to measure the District's financial health, or financial position. Over time, increases or decreases in the District's net position are one indicator whether its financial health is improving or deteriorating. You will need to consider other nonfinancial factors, however, such as changes in the District's property tax base, and the condition of the District's capital assets to assess the overall health of the District.
In the Statement of Net Position and the Statement of Activities, we divide the District into two kinds of activities:
·Governmental activities: most of the District's basic services are reported here, including general administration. ·Local taxes, tuition and state and federal aid finance most of these activities. ·Business-type-activities: the District has one (Food Service) proprietary fund as shown on pages 32 and 33.
15
Reporting the District's Most Significant Funds
Fund Financial Statements
Our analysis of the District's major funds begins on page 18. The fund financial statements begin on page 27 and provide detailed information about the most significant funds-not the District as a whole. Some funds are required to be established by State law. The District's two kinds of funds, governmental and proprietary, use different accounting approaches.
Governmental funds: most of the District's basic services are reported in governmental funds, which focus on how money flows into and out of those funds and the balances left at year-end that are available for spending. These funds are reported using an accounting method called modified accrual accounting, which measures cash and all other fmancial assets that can readily be converted to cash. The governmental fund statements provide a detailed short-term view of the District's general government operations and the basic services it provides. Governmental fund information helps one determine whether there are more or fewer financial resources that can be spent in the near future to fmance the District's programs. We describe the relationship (or differences) between governmental activities (reported in the Statement of Net Position and the Statement of Activities) and governmental funds in a reconciliation on page 29.
Proprietary funds: when the District charges customers for the full cost of the services it provides, these services are reported in proprietary funds. Proprietary funds are reported in the same way that all activities are reported in the Statement of Net Position and the Statement of Activities. In fact, the District's enterprise funds (a component of business type funds) are the same as the business-type activities we report in the government-wide statements but provide more detail and additional information, such as cash flows, for proprietary funds.
The District as Trustee
Reporting the District's Fiduciary Responsibilities
The District is the trustee, or fiduciary, for the Unemployment Compensation Trust, Scholarship Funds and Agency Funds. All of the District's fiduciary activities are reported in separate Statements of Fiduciary Net Position and Changes in Fiduciary Net Position on pages 35 and 36. We exclude these activities from the District's other financial statements because the District cannot use these assets to finance its operations. The District is responsible for ensuring that the assets reported in these funds are used for their intended purposes.
16
THE DISTRICT AS A WHOLE
The District's combined net position changed from a year ago, increasing from $(38,000) to $5,133,000. Looking at the net position and net expenses of governmental and business-type activities separately, different stories emerge. Our analysis below focuses on the net position (Table I) and changes in net position (Table 2) of the District's governmental and business-type activities as of June 30, 2016.
Table 1 Net Position (in Thousands)
Governmental Activities
~ 2.Q.l2
Current and other assets 19,252 22,770 Long term receivables 2,809 3,260 Capital assets 40,239 31,147
Total assets 62,300 57,177
Deferred outflows of resources 6,186 2,674
Long-term debt outstanding 26,451 27,853 Aggregate net pension liability 34,172 29,054 Other liabilities 1,711 1,250
Total liabilities 62,334 58,157
Deferred inflows of resources 1,019 1,731
Net position: Net investment in capital assets 14,636 4,280 Restricted 15,904 20,256 Unrestricted (deficit) {25,407) {24,574)
Total net position 51133 P8)
Business-type Activites
2Ql.2 ~
153 212
_--=3.:;:.8 46
_----"1-"-9~1 258
_--=2:.::..5 102
_--=2::::.5 102
38 46
_--=-=12:.::..8 110 _....;.;;16;.;;,6 156
Total Prim!!IY Government
2Ql.2 ~
19,405 22,982 2,809 3,260
40,277 31,193
62,491 57,435
6,186 2,674
26,451 27,853 34,172 29,054
1,736 1,352
62,359 58,259
1,019 1,731
14,674 4,326 15,904 20,256
(25,279) {24,464) 5,299 118
Unrestricted net position, the part of net position that can be used to fmance day-to-day operations without constraints established by debt covenants, enabling legislation, or other legal requirements - decreased $833,000. Restricted net position, those restricted mainly for capital projects decreased by $4,352,000. This reflects mainly a decrease in encumbrances and Capital Project funds. Capital assets reflect the original cost of land, buildings, and equipment less the accumulated depreciation. The long term outstanding debt includes the District bonds, leases, loans and compensated absences. The District remains financially stable with an unrestricted balance of $9,614,000 which reflects the District's free balance minus the allowance for potential compensated absences and the net pension liability.
17
Table 2 Changes in Net Position (in thousands)
Governmental Business-type Total Activities Activites Prim!!!y Government
2016 2015 2016 2015 2016 2015
Revenues Program revenues:
Charges for Services 2,766 2,466 891 938 3,657 3,404 Operating Grants and Contributions 13,149 12,912 337 282 13,486 13,194
General revenues: Property Taxes 80,206 78,147 80,206 78,147 Tuition 433 392 433 392 Federal and State Aid 412 495 412 495 Interest and Investment Earning; 122 55 123 56 Other General Revenues 267 207 267 207 Adjustment to Cap ital Assets 2,985 2,985 NJ.SDA Grant 3,260 3,260
Total Revenues 100,340 97,934 ~ ~ 101,569 99,155
Pro![am e1!l1enses including indirect !l1!I1enses
Instruction: Regular 35,819 34,813 35,819 34,813
Special 12,443 11,765 12,443 11,765
Other instruciton 4,563 4,466 4,563 4,466
Support services: Tuition 5,134 5,261 5,134 5,261
Student and instruction related services 13,759 12,828 13,759 12,828 School administrative services 5,168 5,Q70 5,168 5,070 General and business administrative services 4,417 4,103 4,417 4,103 Plant operations and maintenance 7,588 8,218 7,588 8,218
Pup it transportation 3,168 3,050 3,168 3,050 Special schools 2,060 2,592 2,060 2,592
Charter Schools 68 73 68 73 SDA Debt Service Assessment 77 77 77 77 Interest on long-term debt 904 736 904 736 Business-type activities:
Increase (Decrease) in Net Position 5,172 4,882 10 41 5,182 4,923 = -= ===- ==
The district as a whole provides services for the students of Fair Lawn based on a budget adopted annually in March. The budget is consistent with guidelines of the CEIFA law, combining core curriculum and financial accountability.
The district outlook reflects a community without additional land to develop and therefore expects to maintain its' current asset base. The total revenues, exclusive of the Capital Assets adjustment and N.J. S.D.A. Grant, increased by approximately $2,681,000 with Property Taxes increasing by $2,059,000. On the expenditure side, the difference in expenditures represents the normal increases associated with continuing staffing levels.
18
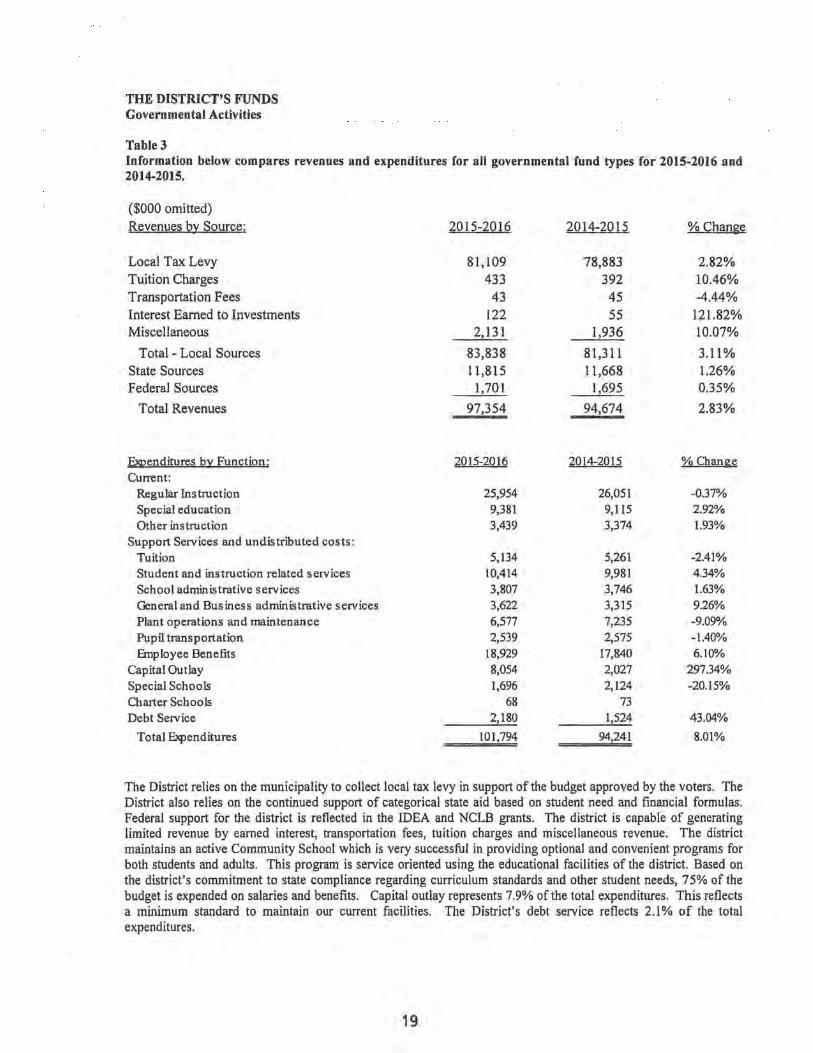
THE DISTRICT'S FUNDS Governmental Activities
Table 3 Information below compares revenues and expenditures for all governmental fund types for 2015-2016 and 2014-2015.
($000 omitted)
Revenues by Source: 2015-2016 2014-2015 % Change
Local Tax Levy 81,109 78,883 2.82% Tuition Charges 433 392 10.46% Transportation Fees 43 45 -4.44% Interest Earned to Investments 122 55 121.82% Miscellaneous 2,131 1,936 10.07%
Total- Local Sources 83,838 81,311 3.11% State Sources 11,815 11,668 1.26% Federal Sources 1,701 1,695 0.35%
Total Revenues 97,354 94,674 2.83%
Expenditures by Function: 2015-2016 2014-2015 o/sIChi!ng!O Current:
Regular Instruction 25,954 26,051 -0.37% Special education 9,381 9,115 2.92% Other instruction 3,439 3,374 1.93%
Support Services and undistributed costs: Tuition 5,134 5,261 -2.41% Student and instruction related services 10,414 9,981 4.34% School administrative services 3,807 3,746 1.63% General and Business administrative services 3,622 3,315 9.26% Plant operations and maintenance 6,577 7,235 -9.09"10 Pupil transportation 2,539 2,575 -1.40% Employee Benefits 18,929 17,840 6.10%
Capital Outlay 8,054 2,027 297.34% Special Schools 1,696 2,124 -20.15% Charter Schools 68 73 Debt Service 2,180 1,524 43.04%
Total Expenditures 101,794 94,241 8.01%
The District relies on the municipality to collect local tax levy in support of the budget approved by the voters. The District also relies on the continued support of categorical state aid based on student need and financial formulas. Federal support for the district is reflected in the IDEA and NCLB grants. The district is capable of generating limited revenue by earned interest, transportation fees, tuition charges and miscellaneous revenue. The district maintains an active Community School which is very successful in providing optional and convenient programs for both students and adults. This program is service oriented using the educational facilities of the district. Based on the district's commitment to state compliance regarding curriculum standards and other student needs, 75% of the budget is expended on salaries and benefits. Capital outlay represents 7.9% of the total expenditures. This reflects a minimum standard to maintain our current facilities. The District's debt service reflects 2.1% of the total expenditures.
19
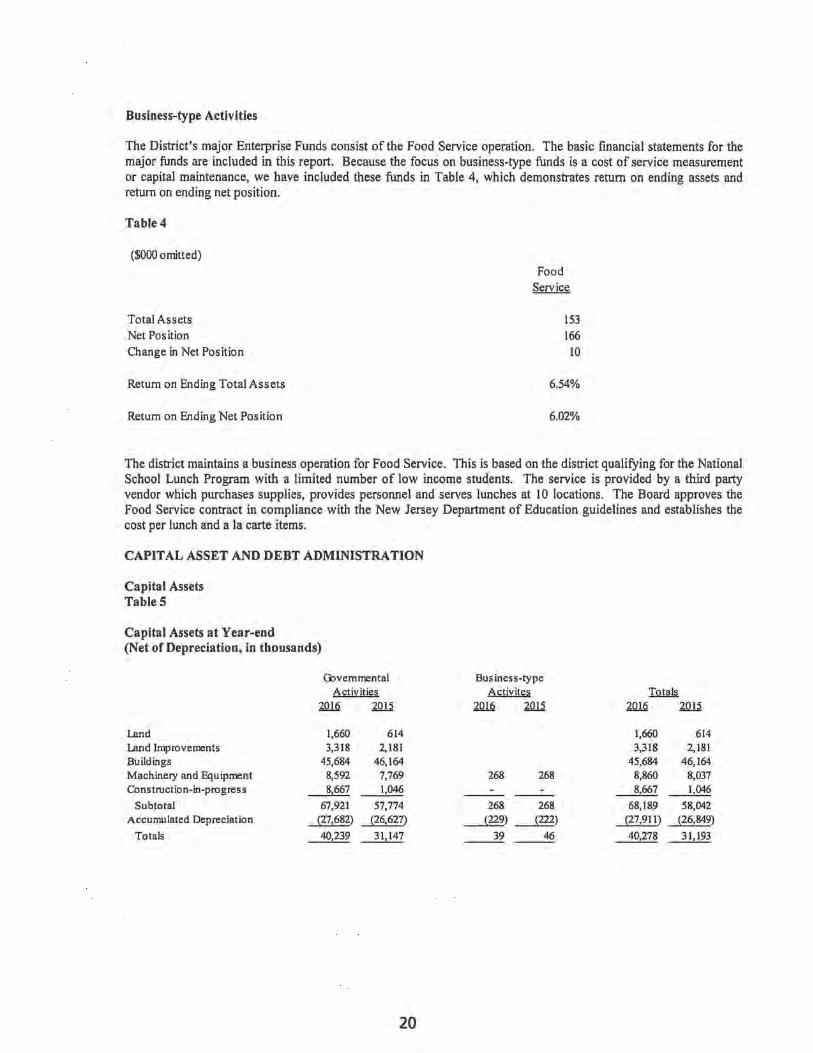
Business-type Activities
The District's major Enterprise Funds consist of the Food Service operation. The basic financial statements for the major funds are included in this report. Because the focus on business-type funds is a cost of service measurement or capital maintenance, we have included these funds in Table 4, which demonstrates return on ending assets and return on ending net position.
Table 4
($000 omitted)
Total Assets Net Position Change in Net Pos ition
Return on Ending Total Assets
Return on Ending Net Position
Food Service
153 166
10
6.54%
6.02%
The district maintains a business operation for Food Service. This is based on the district qualifying for the National School Lunch Program with a limited number of low income students. The service is provided by a third party vendor which purchases supplies, provides personnel and serves lunches at 10 locations. The Board approves the Food Service contract in compliance with the New Jersey Department of Education guidelines and establishes the cost per lunch and a la carte items.
CAPITAL ASSET AND DEBT ADMINISTRATION
Capital Assets Table 5
Capital Assets at Year-end (Net of Depreciation, in thousands)
Land Land Improvements Buildings Machinery and Equipment Construction-in-progress
Subtotal Accumulated Depreciation
Totals
Governmental Activities
2lllii 2!ill
1,660 3,318
45,684 8,592 8,667
67,921 (27,682)
40,239
614 2,181
46,164 7,769 1,046
57,774 (26,627)
31,147
20
Business-type Activites
.2Q!.2 2!ill
268 268
268 268
~)~)
39 46
1,660 3,318
45,684 8,860 8,667
68,189 (27,911)
40,278
614 2,181
46,164 8,037 1,046
58,042 (26,849)
31,193
DEBT
At year - end the District had total debt of $ 25,603,000 outstanding versus $26,868,000 last year - a decrease of 4.7% - as shown in Table 6.
Outstanding Debt, at year-end (in thousands) Table 6
Serial Bonds Loans Authorized but not Issued
An analysis of District Debt is presented in Note IV:B to the basic financial statements.
BUDGETS
Governmental Activities ~ ~
25,602 26,867
25,603 26,868
The significant variances between the originally adopted budget for the 2015-2016 year and the final budget were caused by the treatment of encumbrances that are added to the original budget and the appropriation of Fund Balance. In addition, transfers are made during the year to cover necessary expenditures without causing any budgetary line to have a negative balance.
The District's unreserved surplus was 3.46% of the budgetary expenditures after all adjustments were executed. The District remains in a stable financial position.
CONTACTING THE DISTRICT'S FINANCIAL MANAGEMENT
This fmancial report is designed to provide our citizens, taxpayers, customers, and investors and creditors with a general overview of the District's finances and to show the District's accountability for the money it receives. If you have questions about this report or need additional financial information, contact the School Business Administrator, Fair Lawn School District, New Jersey.
21
BASIC FINANCIAL STATEMENTS
22
Section A
DISTRICT - WIDE FINANCIAL STATEMENTS
23
ExhlbltA·1 BOARD OF EDUCATION
BOROUGH OF FAIR LAWN Statement of Net Position
June 3D, 2016
Governmental Buslness·type Actlvlll!! Actlvltl!! Total
Cash and cash equivalents 4,100,468.76 4,100,468.76 Capital reserve account· cash 6,356,884.70 6,356,884.70
Capital assets, net (Note lII:C.): 40,238,650.75 38,523.47 40,277,174.22 Total Assets 62,300,227.35 191,341.10 62,491,568.45
DEFERRED OUTFLOWS OF RESOURCES Deferred outflows related to pensions 6,186,128.00 6,186,128.00
Total Deferred Outflows of Resources 6,186,128.00 6,186,128.00
LIABILITIES Accounts payable 705,518.38 525.00 706,043.38 Interfunds payable 84,843.35 84,843.35 Payable to state government 56,574.81 56,574.81 Bond and loan interest payable 318,690.69 318,690.69 Unearned revenue 545,476.76 24,567.95 Long·tenn liabilities other than pensions(Note IV:B.):
Due within one year 1,490,927.50 1,490,927.50 Due beyond one year 24,960,060.00 24,960,060.00
Aggregate net pension liability 34,172,252.00 34,172,252.00 Total liabilities 62,334,343.49 25,092.95 61,789,391.73
DEFERRED INFLOWS OF RESOURCES Deferred Inflows related to pensions 1,018,547.00 1,018,547.00
Total Deferred Inflows of Resources 1,018,547.00 1,018,547.00
NET POSITION Net Investment In capital assets 14,636,650.75 38,523.47 14,675,174.22 Restricted for.
Capital projects 8,529,044.60 8,529,044.60 Debt service (280,885.24) (280,885.24) Other purposes 7,656,038.21 7,656,038.21
Total Net Position $ 5,133,464.86 $ 166,248.15 $ 5,299,713.01
The accompanying Notes to Financial Statements are an Integral part of this statement.
24
ExhlbltA-2 BOARD OF EDUCAnON
BOROUGH OF FAIR LAWN Statement of ActIvities
For the Year Ended June 30, 2016 Net (Expense) Revenue and
P~ram Revenues Changes In Net Position Operating Capital
Charges for Grants and Grants and Governmental Buslness-type FunctionsIPrograms Exoenses Services Contrl!2ution! Contributions ActIvities Actlv!l!!! Total
Support services: Tuition 5,134,289.84 2,917,341.97 (2,216,947.87) (2,216,947.87) Student and instruction related services 13,758,505.38 1,326,758.67 (12,431,746.71) (12,431,746.71) School administrative services 5,168,391 .25 440,150.13 (4,728,241 .12) (4,728,241.12) General and business administrative services 4,416,526.63 254,534.22 (4,161,992.41) (4,161,992.41) Ptant operations and maintenance 7,588,176.19 299,380.28 (7,288,795.91) (7,288,795.91) Pupil transportation 3,168,342.85 42,578.21 399,450.75 (2,726,313.89) (2,726,313.89)
Special schools 2,060,396.13 1,819,694.34 115,510.74 (125,191.05) (125,191.05) Charter Schools 68,124.00 (88,124.00) (68,124.00) SOA Debt Service Assessment n,256.OO (77,256.00) (77,256.00)
Interest on long-term debt 903,555.55 903,555.55
"-I Total governmental activities 95,168,532.56 2,765,828.10 13,148,766.58 (79,253,937.88) (79,253,937.88)
U1 Business-type activities:
Food Service 1,218,615.40 891,361 .98 337,109.87 9,856.45 9,856.45
Total buSiness-type activities 1,218,615.40 891,361 .98 337,109.87 9,856.45 9,856.45
Total primary government ~ 96,387,147 .~ L 3,657,190.~ $ ~3,485,876 .4~ L $ _(79,253,937.88) $ 9,856.45 $ (79,244,081.43)
General revenues: Taxes:
Property taxes, levied for general purposes $ 79,519,827.00 $ $ 79,519,827.00 Property taxes, levied for debt service principal 686,139.45 686,139.45
Federal and State aid not restricted 411,672.85 411,672.85 Tuition (other than special schools) 433,008.59 433,008.59 Investment Earnings 122,176.n 162.56 122,339.33 Miscellaneous Income 267,400.80 267,400.80
Adjustment to Capital Assets 2,985,343.00 2,985,343.00 Total general revenues, special items, extraordinary items and transfers 84,425,568.46 162.56 84,425,731.02
Change in Net Assets 5,171,630.58 10,019.01 5,181 ,649.59
Net Assets-beginning, as restated (38,165.72) 156,229.14 118,063.42
Net Assets-ending $ 5,133,464.66 $ 166,248.15 $ 5,299,713.01
The accompanying Notes to Financial Statements are an Integral part of this statemenL
Section B
FUND FINANCIAL STATEMENTS
26
GOVERNMENTAL FUNDS
27
ExhlbltB·1 BOARD OF EDUCATION
BOROUGH OF FAIR LAWN Balance Sheet
Governmental Funde June 3D, 2018
Special Capital Debt Total General Revenue Projects Service Governmental
Total Fund Balances 13,760,003.72 6,871,354.13 37,805.45 20,689,183.30
Total Uablllties and Fund Balances $ 141919,875.08 $ 2321541 .94 $ 619091159.54 $ 371805.45
Amounts reported for govemmental Bellvilies In the statement of net position (A· 1 ) are different because:
Adjustment to Cabt Service Fund net position for the accrual of Interest expance. (318,890.69)
Capital assets used In govemmental activities are not finanCial resources and therefore are not reported In the funds. The cost of the assets Is $87.920.260.58 and the accumulated depreciation Is $27,681,629.83. 40,238,650.75
Pension \labilities net of deferred outflowa and Inflowa of resources (29,004,871 .00)
Long-term lIabllllles, Including bonds payable, are not due and payabla In the current period and therefore are not reportad as lIabllllles In the funds (see Note IV:B.) (28,450,987.50)
Net position of govemmental activities $ 511331464.88
The accompanying Notea to Financial Statemente are an Intagral part of this statement
28
Exhibit B·2 BOARD OF EDUCATION
BOROUGH OF FAIR LAWN Statement of Revenuel, Expenditures, And Changes In Fund Balances
Governmental Funds For the Year Ended June 30, 2016
Special Capital Debt Total General Revenue Projects Service Governmental
Total· Local Sources 82,178,803.28 43,874.13 27,882.45 1,589,895.00 83,838,254.84
State sources 11,632,654.15 182,791.19 11,815,445.34 Federal sources 84,765.46 1,818,354.50 1,701,119.98
Total Revenues 93,894,222.87 1,843,019.82 27,882.45 1,589,895.00 97,354,820.14
EXPENDITURES Current
Regular instruction 25,595,182.15 359,276.25 25,954,458.40 SpedaleduceUonlnslruction 8,251,914.04 1,129,147.00 9,381,061 .04 Other Instruction 3,439,297.38 3,439,297.38 Support services and undistributed costs:
Tuition 5,134,289.84 5,134,289.84 Student and instruction related services 10,136,343.51 277,703.72 10,414,047.23 School administrative services 3,806,873.46 3,606,873.48 General and business administrative services 3,822,293.18 3,622,293.18 Plant operations and maintenance 6,577,385.38 6,577,385.38 Pupil transportation 2,538,881.93 2,538,881 .93 Unallocated benafits 18,852,015.71 76,892.85 18,928,908.58
Spaclai schools 1,895,518.15 1,695,518.15 Transfer to charter school 68,124.00 68,124.00 Capital ouUay 432,561.63 7,621,577.98 8,054,139.81 Debt service:
Principal 1,265,000.00 1,265,000.00 Interest and othar charges 914,956.91 914,956.91
Total Expendituras 90,150,680.36 1,843,019.82 7,621,577.98 2,179,956.91 101,795,235.07
Excess (Deficiency) of revenues over expendituras 3,743,542.51 (7,593,695.53) (590,261 .91) (4,440,414.93)
OTHER FINANCING SOURCES AND (USES) Trensfers in 527,862.45 527,682.45 Transfers (out) (500,000.00) (27,682.45) (527,882.45)
Total Other Financing Sources and (Uses) (500,000.00) (27,882.45) 527,882.45
Net change in fund balances 3,243,542.51 (7,621,577.98) (82,379.46) (4,440,414.93) Fund Balan~uly 1 10,516,461.21 14,492,932.11 100,184.91 25,109,578.23
The accompanying Notes to Financial Statements are an Integral part of this statement
29
BOARD OF EDUCATION BOROUGH OF FAIR LAWN
Reconciliation of the Statement of Revenu .. , Expendlturea, and Chang .. In Fund Balanc .. of Govammantal Funda
to the Statement of Actlvltle. For tha Yaar Ended June 30, 2016
Total net change In fund balance. - governmental fundi (from B-2)
Amounll reported for govemmental activities In the slltament of activities (A-2) are different because:
In the statement of activities, Interest on long-term debt In the statement of activities Is accrued, regardless of when due. In the govemmental funds, Interest Is reported whan due. The dlfferenca In accrued Interest Is an addition In the reconciliation. (+)
Interest paid Interest accrued
Capital outlays ans reported In govemmantal funds as expendltunss. However, In the statament of activities, the cost of those assellis allocated over their astlmated useful lives as depreciation expense. This Is the amount by which capital outlays exceeded depreciation In the period.
Depreciation expanse Capital outlays (exclusive of capital lease prinCipal payments and
SDA Debt Service Assessment)
Adjustment to Capital Assets In accordance with physical apprelsal and dispositions
In the statement of activities, only the gain on the disposal of capital asset. Is reported, whereas In the governmental funds, the proceeds from a sale Increase flnanclal resources. Thus, the change In net assell will differ from the change In fund balance by the cost of the asset removed. (-)
In the statement of activities, certain operetlng expanses, e.g., compensated absences (vacations and unused sick pay) ans measured by the amounll earned during the year. In the governmental funds, however, expenditures for these Items are reported In the amount of flnanclal resources used (paid). When the earned amount exceeds the paid amount, the difference Is reduction In the reconciliation (-); when the paid amount exceeds the eemed emount the difference Is an addition In the reconciliation (+).
Governmental funds report district pension contributions as expenditures. In the statement of activites, however, the cost of pension benefits earned net of employee contributions is reported IS pension expense.
District pension contributions - PERS Cost of benefill eamed net of
employees contributions
Payment of long-term liability principal Is an expenditure In the govemmental fundi, but the repayment reduces long-term liabilities In the statement of net assell and Is not reported In the statement of activities.
Debt prinCipal Capltalleaae principal
Proceeds from debt Issues are a financing source In the govemmental funds. They are not revenue In the statement of activities; Issuing debt Increasel long-term liabilities In the statement of net assets.
Proceeds of long-term debt Capital lease proceed.
Revenues In the statement of activities which do not provide current financial resources are not reported as revenues In the funds. (+)
Change In net pOlltlon of governmental actlvltle.
The accompanying Nota. to Financial Stataments are an Integral part of thI, statement.
30
Exhibit B-3
S (4,440,414.93)
S 914,958.91 (903,555.55)
11,401.38
(1,870,643.46)
7,976,683.61 6,108,240.15
2,985,343.00
136,555.00
1,308,757.00
(2,201,251 .00) (892,494.00)
1,285,000.00
S 5,171,630.58
PROPRIETARY FUNDS
31
ASSETS
Current Assets: Cash and cash equivalents Accounts receivable Interfunds receivable Other receivables Inventories
Total Current Assets
Noncurrent assets: Furniture, machinery and equipment Less accumulated depreciation
Total Noncurrent Assets
Total Assets
LIABILITIES
Current Liabilities: Accounts payable Unearned revenue
Total Current Liabilities
NET POSITION
Net Investment in capital assets Unrestricted
Total Net Position
BOARD OF EDUCATION BOROUGH OF FAIR LAWN Statement of Net Position
Proprietary Funds June 3D, 2016
$
Exhibit B-4
Business-type ActivIties -Enterprise Funds
Food ServIce Totals
31,637.49 15,132.63 84,843.35 5,733.03
151471 .13 1521817.63
267,621.53 (2291°98.06)
381523.47 191 1341.10
525.00 24,567.95
251°92.95
$ 31,637.49 15,132.63 84,843.35
5,733.03 151471.13
152,817.63
267,621.53 (229,098.06)
38,523.47 191,341.10
525.00 24,567.95
251°92.95
38,523.47 38,523.47 127,724.68 127,724.68
$ 166,248.15 $ 166,248.15
The accompanying Notes to Financial Statements are an integral part of this statement.
32
BOARD OF EDUCATION BOROUGH OF FAIR LAWN
Exhibit B-5
Statement of Revenues, Expenses, and Changes in Fund Net Position Proprietary Funds
BOARD OF EDUCATION BOROUGH OF FAIR LAWN Statement of Cash Flows
Proprietary Funds For the Year Ended June 3D, 2016
CASH FLOWS FROM OPERATING ACTIVITIES Receipts from customers Payments to employees Payments for employee benefits Payments to suppliers
Net cash provided by (used for) operating acllvlties
CASH FLOWS FROM NONCAPITAL FINANCING ACTIVITIES State Sources Federal Sources Operating subsidies and transfers to other funds
Net cash provided by (used for) non-capltal financing actlvllles
CASH FLOWS FROM INVESTING ACTIVITIES Interest and dividends
Net cash provided by (used for) Investing activities
Netlncraase (decrease) in cash and cash equivalents Balances-beglnnlng of year
Balances-end of year
Reconciliation of operating Income (loss) to net cash provided by (used for) operating activities: Operating Income (loss)
Adjustments to reconcile operating Income (loss) to net cash provided by (used for) operating activities:
Depreciation and net amortization (Increase) decrease In accounts receivable, net (Increase) decrease In Inventories Increase (decrease) In accounts payable Increase (decrease) In uneamed revenue
Total adjustments
Net cash provided by (used for) operating activities
The accompanying Notes to Financial Statements are an Integral part of this statement
Change in Net Position 54,817.91 Net Position-beginning 525,885.30
Net Position-ending $ 580,703.21
The accompanying Notes to Financial Statements are an Integral part of this statement.
37
Exhibit B·8
Rental Escrow
$
247.54 247.54
(247.54) 10,514.09
$ 101266.55
NOTES TO BASIC FINANCIAL STATEMENTS
38
BOARD OF EDUCATION BOROUGH OF FAIR LAWN
NOTES TO BASIC FINANCIAL STATEMENTS YEAR ENDED JUNE 3~. 2016
Note I: Summary of Significant Accounting Policies
A. Basis of Presentation
The fmancial statements of the Board of Education (Board) of the Borough of Fair Lawn School District (District) have been prepared in conformity with generally accepted accounting principles (GAAP) as applied to governmental units. The Governmental Accounting Standards Board (GASB) is the accepted standard-setting body for establishing governmental accounting and financial reporting principles. In its accounting and fmancial reporting, the District follows the pronouncements of the Governmental Accounting Standards Board (GASB). The more significant accounting policies established in GAAP and used by the District are discussed below.
B. Reporting Entity
The Borough of Fair Lawn School District is an instrumentality of the State of New Jersey, established to function as an educational institution. The Board consists of elected officials and is responsible for the fiscal control of the District. A superintend.ent is appointed by the Board and is responsible for the administrative control of the District.
The primary criterion for including activities within the District's reporting entity, as set forth in Section 2100 of the GASB Codification of Governmental Accounting and Financial Reporting Standards. is the degree of oversight responsibility maintained by the District. Oversight responsibility includes financial interdependency, selection of governing authority, designation of management, ability to significantly influence operations and accountability for fiscal matters. The combined fmancial statements include all funds of the District over which the Board exercises operating control. The operations of the District include six elementary, two middle and one senior high schools located in Fair Lawn. There were no additional entities required to be included in the reporting entity under the criteria as described above, in the current fiscal year. Furthermore, the District is not includable in any other reporting entity on the basis of such criteria.
C. Basic Financial Statements- Government-Wide Statements
The District's basic financial statements include both government-wide (reporting the District as a whole) and fund fmancial statements (reporting the District's major funds). Both the government-wide and fund fmancial statements categorize primary activities as either governmental or business type. The District's general and special revenue activities are classified as governmental activities. The District's food service program is classified as business-type activity.
In the government-wide Statement of Net Position, both the governmental and business-type activities columns (a) are presented on a consolidated basis by column, (b) and are reported on a full accrual, economic resource basis, which recognizes all long-term assets and receivables as well as long-term debt and obligations. The District's net position are reported in three parts-invested in capital assets, net of related debt; restricted net position; and unrestricted net position. The District first utilizes restricted resources to finance qualifying activities.
39
BOARD OF EDUCATION BOROUGH OF FAIR LAWN
NOTES TO BASIC FINANCIAL STATEMENTS YEAR ENDED JUNE 30. 2016
Note I: Summary of Significant Accounting Policies (Continued)
C. Basic Financial Statements- Government-Wide Statements
The government-wide Statement of Activities reports both the gross and net costs of each of the District's functions and business-type activities. The functions are also supported by general government revenues (property taxes, tuition, certain intergovernmental revenues, etc.). The Statement of Activities reduces gross expenses (including depreciation) by related program revenues, operating and capital grants. Program revenues must be directly associated with the function (regular instruction, vocational programs, student and instruction related services, etc.) or a business-type activity. Operating grants include operating-specific and discretionary (either operating or capital) grants while the capital grants column reflects capital-specific grants.
The net costs (by function or business-type activity are normally covered by general revenue (property taxes, tuition, interest income, etc.).
a. The District allocates indirect costs such as on-behalf TP AF Pension Contributions, and Reimbursed TP AF Social Security Contributions.
The government-wide focus is more on the sustainability of the District as an entity and the change in the District's net position resulting from the current year's activities. Fiduciary funds are excluded from the government-wide fmancial statements.
D. Basic Financial Statements- Fund Financial Statements
The fmancial transactions of the District are reported in individual funds in the fund fmancial statements. Each fund is accounted for by providing a separate set of self-balancing accounts that comprises its assets, liabilities, reserves, fund equity, revenues and expenditures/expenses. The various funds are reported by generic classification within the fmancial statements.
The emphasis in fund fmancial statements is on the major funds in either the governmental or business-type activities category are summarized into a single column. GASBS No. 34 sets forth minimum criteria (percentage of the assets, liabilities, revenues or expenditures/expenses of either fund category or the governmental and enterprise combined) for the determination of major funds. The nonmajor funds are combined in a column in the fund financial statements. The State of New Jersey Department of Education has mandated that all New Jersey School districts must report all governmental funds as major, regardless of the fund meeting the GASB defmition of a major fund. However, the GASB criteria are applied to proprietary funds.
40
BOARD OF EDUCATION BOROUGH OF FAIR LAWN
NOTES TO BASIC FINANCIAL STATEMENTS YEAR ENDED JUNE 30.2016
Note I: Summary of Significant Accounting Policies (Continued)
D. Basic Financial Statements- Fund Financial Statements (Continued)
The following fund types are used by the District:
Governmental Fund Types
The focus of the governmental funds' measurement (in the fund statements) is upon determination of financial position and changes in fmancial position (sources, uses, and balances of fmancial resources) rather than upon net income. The following is a description of the governmental funds of the District:
General Fund - The general fund is the general operating fund of the District. It is used to account for all financial resources except those required to be accounted for in another fund. Included are certain expenditures for vehicles and movable instructional or noninstructional equipment which are classified in the Capital Outlay sub fund.
As required by the New Jersey State Department of Education, the District includes budgeted Capital Outlay in this fund. Generally accepted accounting principles as they pertain to governmental entities state that General Fund resources may be used to directly fmance capital outlays for long-lived improvements as long as the resources in such cases are derived exclusively from unrestricted revenues.
Resources for budgeted capital outlay purposes are normally derived from State of New Jersey Aid, district taxes and appropriated fund balance. Expenditures are those that result in the acquisition of or additions to fixed assets for land, existing buildings, improvements of grounds, construction of buildings, additions to or remodeling of buildings and the purchase of built-in equipment. These resources can be transferred from and to Current Expense by board resolution and, excluding equipment, with County Superintendent approval.
Special Revenue Fund - The Special Fund is used to account for the proceeds of specific revenue from State and Federal Government, (other than major capital projects, Debt Service or the Enterprise Funds) and local appropriations that are legally restricted to expenditures for specified purposes.
Capital Projects Fund - The Capital Projects Fund is used to account for all fmancial resources to be used for the acquisition or construction of major capital facilities (other than those fmanced by Proprietary Funds). The fmancial resources are derived from temporary notes or serial bonds that are specially authorized by the voters as a separate question on the ballot either during the annual election or at a special election.
Debt Service Fund - The Debt Service Fund is used to account for the accumulation of resources for, and the payment of principal and interest on bonds issued to finance major property acquisition, construction and improvement programs.
Permanent Fund - A permanent fund is used to account for assets held under the terms of a formal trust agreement, whereby the District is under obligation to maintain the trust principal.
"
41
BOARD OF EDUCATION BOROUGH OF F AIR LAWN
NOTES TO BASIC FINANCIAL STATEMENTS YEAR ENDED JUNE 30, 2016
Note I: Summary of Significant Accounting Policies (Continued)
D. Basic Financial Statements- Fund Financial Statements (Continued)
Fund Balances - Governmental Funds
In the fund fmancial statements, governmental funds report the following classifications of fund balance:
Nonspendable - includes amounts that cannot be spent because they are either not spendable in form or are legally or contractually required to be maintained intact.
Restricted - includes amounts restricted by external sources (creditors, laws or other governments, etc.) or by constitutional provision or enabling legislation.
Committed - includes amounts that can only be used for specific purposes. Committed fund balance is reported pursuant to resolutions passed by the Board of Education, the District's highest level of decision making authority. Commitments may be modified or rescinded only through resolutions approved by the Board of Education.
Assigned - includes amounts that the District intends to use for a specific purpose, but do not meet the definition of restricted or committed fund balance. Under the District's policY, amounts may be assigned by the Business Administrator.
Unassigned - includes amounts that have not been assigned to other funds or restricted, committed or assigned to a specific purpose within the General Fund. The District reports all amounts that meet the unrestricted General Fund Balance Policy described below as unassigned.
The details of the fund balances are included in the Governmental Funds Balance Sheet. When an expenditure is incurred for purposes for which both restricted and unrestricted fund balance is available, the District considers restricted funds to have been spent first. When an expenditure is uncured for which committed, assigned, or unassigned fund balance are available, the District considers amounts to have been spent first out of committed funds, then assigned funds, and fmally unassigned funds as needed.
Proprietary Fund Type
The focus of Proprietary Fund measurement is upon determination of net income, changes in net position, fmancial position and cash flows. The generally accepted accounted principles applicable are those similar to businesses in the private sector. The following is a description of the Proprietary Funds of the District:
Enterprise Funds - The Enterprise Funds are utilized to account for operations that are fmanced and operated in a manner similar to private business enterprises - where the intent of the District is that the costs (i.e. expenses including depreciation and indirect costs) of providing goods or services to the students on a continuing basis be fmanced or recovered primarily through user charges; or, where the District has decided that the periodic determination of revenues eamed, expenses incurred, and/or net income is appropriate for capital maintenance, public policy, management control, accountability or other purposes.
42
BOARD OF EDUCATION BOROUGH OF F AIR LAWN
NOTES TO BASIC FINANCIAL STATEMENTS YEAR ENDED JUNE 30, 2016
Note I: Summary of Significant Accounting Policies (Continued)
D: Basic Financial Statements- Fund Financial Statements (Continued)
The District's Enterprise Fund is comprised of the Food Service Fund.
Depreciation of all exhaustive fixed assets used by proprietary funds is charged as an expense against their operations. Accumulated depreciation is reported on proprietary fund balance sheets. Depreciation has been provided over the estimated useful lives using the straight-line method. The estimated useful lives are as follows:
Food Service Fund: Equipment Light Trucks and Vehicle Heavy Trucks and Vehicle
Fiduciary Fund Types
12 Years 4 Years 6 Years
Fiduciary Funds are used to report assets held in a trustee or agency capacity for others and therefore are not available to support District programs. The reporting focus is on net position and changes in net position and are reported using accounting principles similar to proprietary funds.
The District's fiduciary funds are presented in the fiduciary fund fmancial statements by type (Unemployment Compensation, private purpose and agency). Since by definition these assets are being held for the benefit of a third party (other local governments, private parties, pension participants, etc.) and cannot be used to address activities or obligations of the government, these funds are not incorporated into the government-wide statements.
E. Basis of Accounting
Basis of accounting refers to the point at which revenues or expenditures/expenses are recognized in the accounts and reported in the financial statements. It relates to the timing of the measurements made regardless of the measurement of focus applied.
1. Accrual:
Both governmental and business-type activities in the government-wide fmancial statements and proprietary and fiduciary fund fmancial statements are presented on the accrual basis of accounting. Revenues are recognized when incurred.
43
BOARD OF EDUCATION BOROUGH OF F AIR LAWN
NOTES TO BASIC FINANCIAL STATEMENTS YEAR ENDED JUNE 30, 2016
Note I: Summary of Significant Accounting Policies (Continued)
E. Basis of Accounting (Continued)
2. Modified Accrual:
The governmental fund financial statements are presented on the modified accrual basis of accounting. Under the modified accrual basis of accounting, revenues are recorded when susceptible to accrual; i.e., both measurable and available. "Available" means collectible within the current period or within 60 days after year end. Expenditures are generally recognized under the modified accrual basis of accounting when the related liability is incurred. The exception to this general rule is that principal and interest on general obligation long-term debt, if any, is recognized when due.
3. Revenues:
Substantially all governmental fund revenues are accrued. Property taxes are susceptible to accrual and under New Jersey State Statutes a municipality is required to remit to its school district the entire balance of taxes in the amount voted upon or certified, prior to the end of the school year. The District records the entire approved tax levy as revenue (accrued) at the start of the fiscal year, since the revenue is both measurable and available. Subsidies and grants to proprietary funds, which finance either capital or current operations, are reported as non operating revenue. In respect to grant revenues, the provider recognizes liabilities and expenses and recipient recognizes receivables and revenue when the applicable eligibility requirements, including time requirements are met. Resources transmitted before the eligibility requirements are met are reported as advances by the provider and deferred revenue by the recipient. Program revenues, including tuition revenue, are reported as reductions to expenses in the Statement of Activities.
4. Expenditures:
Expenditures are recognized when the related fund liability is incurred. Inventory costs are reported in the period when inventory items are used, rather than in the period of purchase.
F. BudgetslBudgetary Control
Annual appropriated budgets are prepared in the spring of each year for the general, special revenue and debt service funds. The budgets are submitted to the county office for approval and, as long as the District budget is within State mandated CAPs, there is no public vote on the budget. If the budget exceeds State mandated CAPS, the voters have an opportunity to approve or reject the budget at the regular election held in November.
44
BOARD OF EDUCATION BOROUGH OF F AIR LAWN
NOTES TO BASIC FINANCIAL STATEMENTS YEAR ENDED JUNE 30, 2016
Note I: Summary of Significant Accounting Policies (Continued)
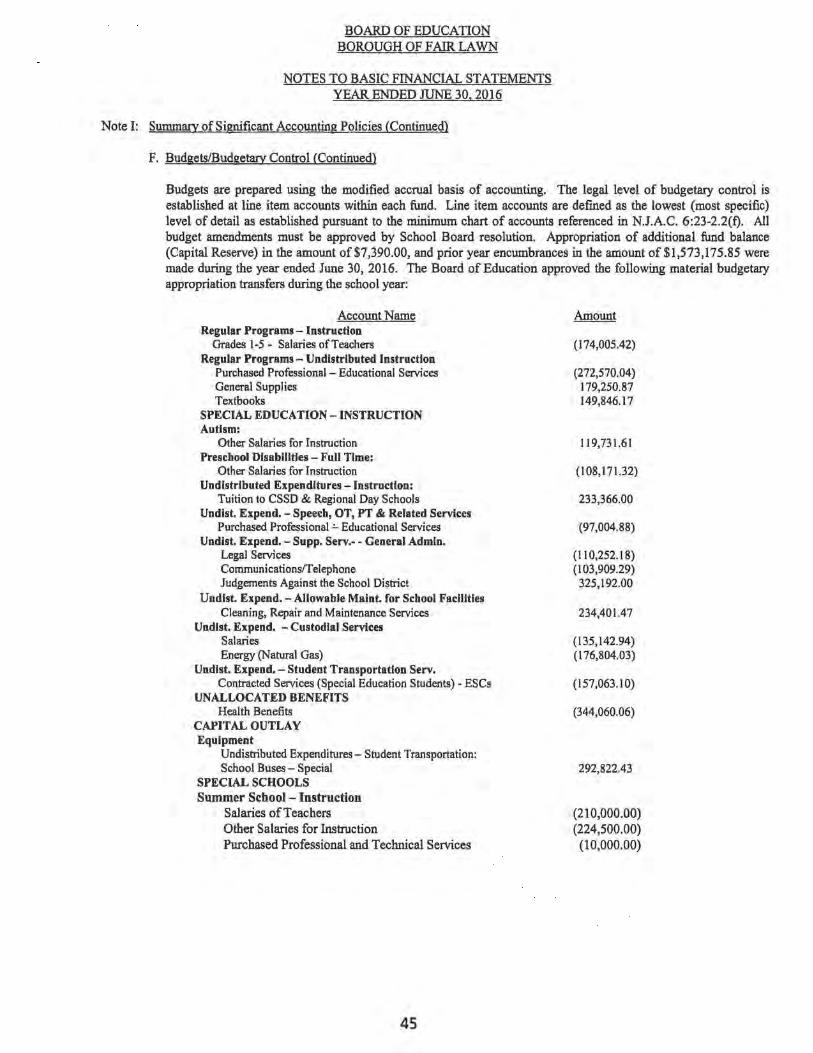
F. BudgetslBudgetarv Control (Continued)
Budgets are prepared using the modified accrual basis of accounting. The legal level of budgetary control is established at line item accounts within each fund. Line item accounts are defmed as the lowest (most specific) level of detail as established pursuant to the minimum chart of accounts referenced in N.J.A.C. 6:23-2.2(t). All budget amendments must be approved by School Board resolution. Appropriation of additional fund balance (Capital Reserve) in the amount of $7,390.00, and prior year encumbrances in the amount of $1,573,175.85 were made during the year ended June 30, 2016. The Board of Education approved the following material budgetary appropriation transfers during the school year:
Undistributed Expenditures - Student Transportation: School Buses - Special
SPECIAL SCHOOLS Summer School- Instruction
Salaries of Teachers Other Salaries for Instruction Purchased Professional and Technical Services
45
Amount
(174,005.42)
(272,570.04) 179,250.87 149,846.17
119,731.61
(108,171.32)
233,366.00
(97,004.88)
(110,252.18) (103,909.29) 325,192.00
234,401.47
(135,142.94) (176,804.03)
(157,063.10)
(344,060.06)
292,822.43
(210,000.00) (224,500.00) (10,000.00)
BOARD OF EDUCATION BOROUGH OF F AIR LAWN
NOTES TO BASIC FINANCIAL STATEMENTS YEAR ENDED JUNE 30, 2016
Note I: Summary of Significant Accounting Policies (Continued)
F. BudgetslBudgetary Control (Continued)
Fonnal budgetary integration into the accounting system is employed as a management control device during the year. For governmental funds there are no substantial differences between the budgetary basis of accounting and generally accepted accounting principles with the exception of legally mandated revenue recognition of the one or more June state aid payments for budgetary purposes only and the special revenue fund as noted below. Encumbrance accounting is also employed as an extension of fonnal budgetary integration in the governmental fund types. Unencumbered appropriations lapse at fiscal year end.
The accounting records of the special revenue fund are maintained on the grant accounting budgetary basis. The grant accounting budgetary basis differs from GAAP in that the grant accounting budgetary basis recognizes encumbrances as expenditures and also recognizes the related revenues, whereas the GAAP basis does not. Sufficient supplemental records are maintained to allow for the presentation of GAAP basis fmancial reports.
The special revenue fund had no encumbrances at June 30, 2016.
The reconciliation of the general and special revenue funds from the budgetary basis of accounting to the GAAP basis of accounting is as follows.
Sources/inflows of resources Actual amounts (budgetary basis) "revenue"
from the budgetary comparison schedule Difference - budget to GAAP:
The last two State aid payments are recognized as revenue for budgetary purposes, and differs from GAAP which does not recognize this revenue until the subsequent year when the State recognizes
the related expense in accordance with GASB 33.
Grant accounting budgetary basis differs from GAAP in that encumbrances are recognized as expenditures, and the related revenue is recognized.
Total revenues as reported on the statement of revenues, expenditures and changes in fund balances - governmental funds.
Uses/outflows of resources Actual amounts (budgetary basis) "total outflows" from the
budgetary comparison schedule Differences - budget to GAAP
Encumbrances for supplies and equipment ordered but not received are reported in the year the order is placed for budgetary purposes, but in the year the supplies are received
for financial reporting purposes.
Total expenditures as reported on the statement of revenues, expenditures, and changes in fund balances - governmental funds
46
General Fund
$ 93,871,145.87
23,077.00
$ 93,894,222.87
$ 90,150,680.36
$ 90,150,680.36
Special Revenue
Fund
$ 1,843,019.82
$ 1.843,019.82
$ 1,843,019.82
$ 1.843,019.82
BOARD OF EDUCATION BOROUGH OF F AIR LAWN
NOTES TO BASIC FINANCIAL STATEMENTS YEAR ENDED JUNE 30. 2016
Note I: Summary of Significant Accounting Policies (Continued)
G. Assets. Liabilities and Fund Equity
1. Deposits and Investments
Deposits are cash and cash equivalents including petty cash, change funds, cash in banks and all highly liquid investments with a maturity of three months or less at the time of purchase and are stated at cost plus accrued interest. Other than Certificates of Deposit, deposits with maturities of greater than three months are considered to be Investments. U.S. Treasury and agency obligations and certificates of deposit with maturities of one year or less when purchased are stated at cost. All other investments are stated at fair value.
New Jersey school districts are limited as to the types of investments and types of financial institutions they may invest in. New Jersey statute 18A:20-37 provides a list of permissible investments that may be purchased by New Jersey school districts.
2. Short - term Interfund ReceivableslPayables
Short - term interfund receivables/payables represents amounts that are owed, other than charges for goods or services rendered to/from a particular fund in the District and that are due within one year.
3. Inventories and Prepaid Expenses
Inventories, which benefit future periods, other than those recorded in the enterprise fund are recorded as expenditure during the year of purchase.
Enterprise fund inventories are valued at cost, which approximates market, using the first-in-first-out (FIFO) method.
Prepaid expenses represent payments made to vendors for services that will benefit periods beyond June 30, 2016.
4. Capital Assets
Capital assets purchased or acquired with an original cost of $2,000 or more are reported at historical cost or estimated historical cost. Contributed assets are reported at fair market value as of the date received. Additions, improvements and other capital outlays that significantly extend the useful life of an asset are capitalized. Other costs incurred for repairs and maintenance are expensed as incurred. Depreciation on the following assets is provided on the straight - line basis over the following estimated useful lives:
Buildings Machinery and Equipment Land Improvements Other Infrastructure
20-50 years 5-10 years
10-20 years 10-50 years
Land and Construction in Progress are not depreciated.
47
BOARD OF EDUCATION BOROUGH OF F AIR LAWN
NOTES TO BASIC FINANCIAL STATEMENTS YEAR ENDED JUNE 30, 2016
Note I: Summary of Significant Accounting Policies (Continued)
G. Assets, Liabilities and Fund Equity (Continued)
4. Capital Assets (Continued)
GASB No. 34 requires the District to report and depreciate new infrastructure assets effective with the beginning of the current year. Neither their historical cost nor related depreciation has historically been reported in the fmancial statements. The retroactive reporting of infrastructure is subject to an extended implementation period and is first effective for fiscal years ending in 2006.
5. Compensated Absences
Compensated absences are those absences for which employees will be paid, such as vacation, sick leave, and sabbatical leave. A liability for compensated absences that are attributable to services already rendered, and that are not contingent on a specific event that is outside the control of the District and its employees, is accrued as the employees earn the rights to the benefits. Compensated absences that relate to future services, or that are contingent on a specific event that is outside the control of the District and its employees, are accounted for in the period in which such services are rendered or in which such events take place.
In governmental and similar trust funds, compensated absences that are expected to be liquidated with expendable available financial resources are reported as an expenditure and fund liability in the fund that will pay for the compensated absences. The noncurrent portion (the amount estimated to be used in subsequent fiscal years) for governmental funds is maintained separately and represents a reconciling item between the fund and government - wide presentations. (See Note X)
6. Unearned Revenue
Unearned revenue in the special revenue fund represents cash which has been received but not yet earned.
48
BOARD OF EDUCATION BOROUGH OF FAIR LAWN
NOTES TO BASIC FINANCIAL STATEMENTS YEAR ENDED JUNE 30. 2016
Note I: Summary of Significant Accounting Policies (Continued)
G. Assets. Liabilities and Fund Equity (Continued)
7. Long - tenn Obligations
Long - tenn debt is recognized as a liability of a governmental fund when due, or when resources have been accumulated in the debt service fund for payment early in the following year. For other long - tenn obligations, only that portion expected to be financed from expendable available financial resources is reported as a fund liability of a governmental fund. The noncurrent portion (the amount estimated to be used in subsequent fiscal years) for governmental funds is maintained separately and represents a reconciling item between the fund and government - wide presentations.
8. Fund Equity
Reserves represent those portions of fund equity not appropriable for expenditure or legally segregated for a specific future use. Designated fund balances represent plans for future use of financial resources.
9. Net Position
Net Position represents the difference between assets and liabilities in the District-wide financial statements. Net investment in capital assets consists of capital assets, net of accumulated depreciation, reduced by the outstanding balance of any long-tenn debt used to build or acquire the capital assets. Net position is reported as restricted in the District-wide fmancial statements when there are limitations imposed on their use through external restrictions imposed by creditors, grantors, or laws or regulations of other governments.
10. Use of Estimates
The preparation of financial statements in conformity with generally accepted accounting principles requires management to make estimates and assumptions that affect certain reports, amounts and disclosures. Accordingly, actual results could differ from those estimates.
11 Allocation of Costs
In the government-wide statement of activities, the District has allocated unallocated benefits to various programs based on the original budgetary expenditures by program.
H. Recent Accounting Pronouncements Not Yet Effective
In June 2015, the Governmental Accounting Standards Board (GAS B) issued Statement No. 75 "Accounting and Financial Reporting for Postemployment Benefits Other Than Pensions". This statement, which is effective for fiscal periods beginning after June 15,2017, will have significant effects on the entity's financial reporting and the provisions of this statement will require significant modifications to the disclosure requirements related to the entity's proportionate share of the benefit plans reported at the State of New Jersey level.
Explanation of Differences between Governmental Funds Balance Sheet and the Statement of Net Position
"Total fund balances" of the Districrs governmental funds in B·I differs from "net position" of governmental activities reported in the statement of net position in A· I. This difference primarily results from the long. term economic focus of the statement of net position versus the current financial resources focus of the governmental fund balance sheets.
Total Fund BalanceslNet Position 20,669,163.30 (14,368,020.25) (1,167,678.19) 5,133,464.86
Total Liabilities, Deferred Inflows of Resources and Fund BalanceslNet Position $ 22,099,382.01 $ 46,424,778.75 $ p7,805.41~ $ 68,486,355.35
50
HVAK1J ut hQUCAflUN BOROUGH OF FAIR LAWN
NOTES TO BASIC FINANCIAL STATEMENTS YEAR ENPEDJUNE 30 2016
Note II' Recoocjliation of Government Wide and Fund Fin8!lcial Statements (Continued)
Explanation ofDiiferences between Governmental Funds Balance Sheet and the Statement of Net Position (Continued)
1. When Capital Assets (land, buildings, equipment) that are to be used in governmental activities are purchased or constructed, the cost of those assets are reported as expenditures in governmental funds. However, the statement of net position includes those capital assets among the assets of the District as a whole.
Cost of capital assets Accumulated depreciation
Long - term liabilities applicable to the District's governmental activities are not due and payable in the current period and accordingly are not reported as fund liabilities. All liabilities - both current and long - term are reported in the statement of net position.
Adjustment to Debt Service Fund net position for the accrual of interest expense.
Net PERS Pension Liabjlity Deferred outflows related to pensions Deferred inflows related to pensions
Serial Bonds Compensated Absences
51
s
s
S
S
S
S
S
67,920,280.58 (27,681,629.83)
40,238,650.75
34,172,252.00 (6,186,128.00) 1,018,547.00
29,004,671.00
25,602,000.00 848,987.50
26,450,987.50
pI81690.69)
Note 11' kons;m,lign oCGaycrnmpd widq aod fund [mancil! St'tcmen" (Cgnljnyedl
Explanation or Dill' ........ betw=I Gowmmenta! funds Operatinl Statement of Activities
BOARD Of EDUCATION BOROUGH Of fAIR LAWN
NOTES TO BASIC FINANCIAL STATEMENTS YEAR ENDED IUNE 30 2016
Tho 'net chana. in fund ball111C01' for aovemmcnlll funds in B-2 diITers !'rom the 'chanso in net position' for SC\'CllUllOlltal ectivitiCi reported in tho ltatement DC activitiCl in A-2. The diff'en:nce arise primarily Cor Ihc lone - lerm economic focus OCthe._torldivitia .... us the current (manei.l_ fDCUI ofthe"vCn1IIICIIlI! funds. Tho dToct of the di!T_ is ilIottntcd below.
S'IJcmcn' ofRmoYR Expenditun;a Ind ChWSl in Fund B,Iancal$tIlCme!J1 ofAF'jvjticg
LocII Tu !.o>y Tuition CharaOI Transportation Fees Interest Euncd on Invcstments MiJccll_ Slill Soun:os f ....... Soun:os
Tolil
Cumat: Rcaul" ioatnactioo Special cdUCItioa Othcrinstruetion
Other f'mancina UlCllo.uacs in Net ABell: A.lj",_tto C.pita! AuelI
Toill Net CbInao for the VOIr (4,440,414.93) 11,401.36
2. In tho .tatemcnt of activities, in&ctell an lona-term dobl in the ltatement DC activities is accrued. reprdlcu o(when duo, In the &Q\'CI'MDItal funds, i_t is roportcd ...... du •. Tho Iccruod intcrelt is In sddition in the reconciliations. (+)
l. Capilli outJl)'llU'D rqIC)Md in JOvmuncntll funds II expenditures. However. in the statement ofac:liviltcs,lhc cost oflhoso usctJ is allocated over lhoir estimated uscfullivcs u depreciation ctc.pc:nsa. This iSlho amount which Clpilll ootll)'l cxcccded depreciation in tho period.
3. .. the.tatcmcnt of ldivities, Only the "in on the di._1 of eapillllSlCll i. rcpottcd, , ......... in the _III funds, the proeccdo !'rom ..... inc:IUIO finln<:ia! __ Thus, the chana. in nellSIClI ,viII diITer fnxn the chanao in fund b.l .... by the cos, OCthe IllelIOIIID\'ed. (-)
... In tho .talcment of activitiDl, ecnain operatinl cxpcnsa, e." compensa&od .bsc:ncc!I (vaCiLions) ani measured by the amounts earned duriq the year. .. the _III f_, hen.., .... , .. pcndi ..... for these ilCml are reportod in the amount of fi"""ill_ used (pIid). When tho amed _ ........ tho Plid amount, the di!Tcn:nco is n:duction in the roconeiliatioo (-); ...... the poid _
........ theDlmOd_ theclilT ....... is InllC!dition to the roc:oncili.tion (+).
Governmental funds nport district pension contributions u oxpenditur'el. In tho statement of IcrivilaJ, however, tho ~t oCpenJion benofits
DImOd net OC .... p!oyoe "",tributi ... i. roportcd II pension ""_ Cost orbencfits DImOd net of emplD)'CC c:ontrib.tions
Poyment of Ionl-term li.bility prinei", i. In expenditure in tho aovemmcnt fundo, b.tlll. poymcnt rall1CC1 lona - term li.bilitics in tho .lIlcmcnt of
net web and it not reponed in tho .tatement of activitics. Dabtprinc:i'" C.pilll ..... principal
4. Pnx:eecb from dabt iuues IJe a finmcina IOW'CO in tho 80vemmcntal fundi. They arc not RMnLlO in tho statement oC aClivitie!, issuina debt inctOUeJ lona • t.orm lilbilities in tho statement oC net 1IICtI,
NOTES TO BASIC FINANCIAL STATEMENTS YEAR ENDED JUNE 30. 2016
Note III: Detailed Disclosure Regarding Assets and Revenues
A. Deposits and Investments
Deposits
New Jersey statutes permit the deposit of public funds in institutions located in New Jersey which are insured by the Federal Deposit Insurance Corporation (FDIC), the Savings Association Insurance Fund, or by any other agencies of the United States that insure deposits or the State of New Jersey Cash Management Fund.
N.J.S.A. 17:9-41 et. Seq. establishes the requirements for the security of deposits of governmental units. The statute requires that no governmental unit shall deposit public funds in a public depository unless such funds are secured in accordance with the Governmental Unit Deposit Protection Act. Public depositories include Savings and Loan institutions, banks (both state and national banks) and savings banks the deposits of which are federally insured. All public depositories must pledge collateral, having a market value at least equal to five percent of the average daily balance of collected public funds, to secure the deposits of Governmental Units. If a public depository fails, the collateral it has pledged, plus the collateral of all other public depositories, is available to pay the full amount of their deposits to the Governmental Units.
At June 30, 2016 the Borough of Fair Lawn School District's cash and cash equivalent'S amounted to $21,271,689.95. Of this amount, $250,000.00 was covered by federal depository insurance (F.D.I.C.) and $21,020,204.61 was covered by a collateral pool maintained by the banks as required by GUDP A.
At June 30,2016 the Borough of Fair Lawn School District's participation in the State of New Jersey Cash Management Fund amounted to $1,485.34.
GASB Statement No. 40, Deposit and Investment Risk Disclosures, requires the disclosure of bank deposits that are subject to custodial credit risk. The custodial credit risk for deposits is the risk that, in the event of the failure of a depository financial institution, the Borough of Fair Lawn School District will not be able to recover deposits or will not be able to recover collateral securities that may be in the possession of an outside party.
As of June 30, 2016, $1,485.34 of the Borough of Fair Lawn School District's cash and cash equivalents of $21,271,689.95 was exposed to custodial credit risk as follows:
Uninsured and collateral held by public depository or by its' trust department not in the Borough of Fair Lawn
School District's name
53
$1.485.34
$1.485.34
BOARD OF EDUCATION BOROUGH OF FAIR LAWN
NOTES TO BASIC FINANCIAL STATEMENTS YEAR ENDED JUNE 30, 2016
Note III: Detailed Disclosure Regarding Assets and Revenues (Continued)
A. Deposits and Invesbnents (Continued)
Invesbnents
New Jersey statutes (N.J.S.A. 18A:20-37) permit the Borough of Fair Lawn School District to purchase the following types of securities:
a. When authorized by resolution adopted by a majority vote of all its members the board of education of any school district may use moneys which may be in hand for the purchase of the following types of securities which, if suitable for registry, may be registered in the name of the school district;
(1) Bonds or other obligations of the United States of America or obligations guaranteed by the United States of America;
(2) Government money market mutual funds; (3) Any obligation that a federal agency or a federal instrumentality has issued in accordance with an
act of Congress, which security has a maturity date not greater than 397 days from the date of purchase, provided that such obligation bears a ftxed rate of interest not dependent on any index or other external factor;
(4) Bonds or other obligations of the school district or bonds or other obligations ofloca1 unit or units within which the school district is located;
(5) Bonds or other obligations, having a maturity date not more than 397 days from the date of purchase, approved by the Division of Invesbnent of the Deparbnent of the Treasury for invesbnent by school district;
(6) Local government invesbnent pools: (7) Deposits with the State of New Jersey Cash Management Fund established pursuant to section 1 of
P.L. 1977, c.281 (C.52:18A-90.4) or (8) Agreements for the repurchase of fully collateralized securities, if:
(a) the underlying securities are permitted invesbnents pursuant to paragraphs (1) and (3) of this subsection a;
(b) the custody of collateral is transferred to a third party; (c) the maturity of the agreement is not more than 30 days; (d) the underlying securities are purchased through a public depository as deftned in section 1 of
P.L. 1970, c.236 (C.17:9-41) and for which a master repurchase agreement providing for the custody and security of collateral is executed.
The Borough of Fair Lawn School District had no invesbnents as described in NoteI:G.1 at June 30, 2016.
B. Interfund Receivables and Payables
As of June 30, 2016, interfund receivables and payables resulting from various interfund transactions were as follows:
Due from Due to
Other Funds Other Funds
General Fund $ 5,226.68 $84,843.35 Capital Projects Fund 37,805.41 Debt Service Fund 37,805.41 Enterprise Fund 84,843.35 Trust and Agency Fund 5,226.68
$127.875.44 $127,875.44
54
BOARD OF EDUCATION BOROUGH OF FAIR LAWN
NOTES TO BASIC FINANCIAL STATEMENTS YEAR ENDED JUNE 30. 2016
Note m: D~llIiled Di~!<IQ~ure ReiW~ing A~~e~ and Revenue~ (~Qntinue~) •
C. Capital Assets
Capital asset activity for the year ended June 30, 2016 was as follows:
Beginning ~ Al!Qi!iQm
Governmental activities: Capital assets not being depreciated:
Land $ 614,091.00 $ Construction in Progress 1,045,531.89 7,621,577.98
Total Capital assets not being depreciated I ,659,622.89 7,621 ,577.98
Land Improvements 2,180,460.00 Buildings and Improvements 46,164,178.02 105,393.00 Machinery and Equipment 7,769,426.82 249,912.63
Totals at historical cost 56,114,064.84 355,305.63
Less accumulated depreciation for: Land Improvements (1,799,480.00) (98,463.47) Buildings and Improvements (18,291,518.71) (909,740.70) Machinery and Equipment {6,535,62 1.42) {862,439.29)
Total accumulated depreciation (26,626,620.13) (1,870,643.46) (I) Net capital assets being depreciated 29,487,444.71 (1,515,337.83)
Governmental activities capital assets, net $ 31,147,067.60 $ 6,106,240.15
Business - type activities: Equipment $ 267,621.53 S Less accumulated depreciation (221,739.31) (7,358.75)
Business - type activities capital assets, net S 451882.22 $ FI358.75)
(1) Depreciation expense was charged to governmental functions as follows: Instruction S 1,234,138.71 Special Education Other Instruction Student and Instruction Related Services School Administrative Services General and Business Administrative Services Plant Operations and Maintenance Pupil Transportation Special Schools
NOTES TO BASIC FINANCIAL STATEMENTS YEAR ENDED JUNE 30. 2016
Note IV: Detailed Disclosures Regarding Liabilitjes and ExpenseslExoenditures
A. Operating Leases
The District has commitments to lease copying equipment under operating leases which expire in 2021. Total operating lease payments made during the year ended June 30, 2016 were $86,179.52 . Future minimum lease payments are as fottows:
June 30, 2017 June 30, 2018 June 30, 2019 June 30, 2020 June 30, 2021
Year Ended
Total future minimum lease payments
B. Long - Teon Liabilities
Long - Term liability activity for the year ended June 30, 2016 was as fottows :
Beginning ~ Ml1i1illm
Govemmental activities: Long - Term debt:
Serial Bonds $ 26,867,000.00 $ Total debt payable 26,867,000.00 Other liabilities:
Compensated absences 985,542.50 28,025.00 Total other liabilities 985,542.50 28,025.00
Govemmental activities long - term liabilities 27 ,852,542.50 28,025.00
(I) Paid by debt service fund (2) Paid by general fund
NOTES TO BASIC FINANCIAL STATEMENTS YEAR ENDED JUNE 30, 2016
Note IV:Detailed Disclosure Regarding Liabilities and ExpenseslExpenditures (Continued)
B. Long - Term Liabilities (Continued)
1. Bonds Payable
Bonds are authorized in accordance with State law by the voters of the municipality through referendums. All bonds are retired in serial installments within the statutory period of usefulness. Bonds issued by the Board are general obligation bonds.
Serial Bonds outstanding as of June 30, 2016 consisted of the following:
Description Interest Due Maturity Amount Issued Amount Rate Date Date Outstanding
Refunding Bonds of2012 Various 2/15 2/15/30 $ 6,515,000.00 $ 5,730,000.00 Refunding Bonds of 20 13 Various 2/15 2/15/30 9,950,000.00 9,545,000.00 Various Improvements Various 3/1 3/1/35 10,677,000.00 10,327,000.00
$21, H2,000.00 $25,~02,QQO.OQ
Principal and interest due on serial bonds outstanding is as follows:
NOTES TO BASIC FINANCIAL STATEMENTS YEAR ENDED JUNE 30. 2016
Note IV: Detailed Disclosure Regarding Liabilities and ExpenseslExpenditures (Continued)
B. Long - Term Liabilities (Continued)
2. Temporary Notes
There were no Temporary Notes outstanding as ofJune 30, 2016.
3. Bonds Authorized But Not Issued
There were no authorized but not issued bonds as of June 30, 2016.
4. Capital Leases Payable
There were no capital leases payable as ofJune 30, 2016.
58
BOARD OF EDUCATION BOROUGH OF F AIR LAWN
NOTES TO BASIC FINANCIAL STATEMENTS YEAR ENDED JUNE 30, 2016
Note V: Detailed Disclosure Regarding Fund Equity
A. Capital Reserve Account
Capital reserve accounts may be established by New Jersey school districts for the accumulation of funds for use as capital outlay expenditures in subsequent fiscal years. A capital reserve account is maintained in the general fund and its activity is included in the general fund annual budget.
During fiscal year 1991-1992 the Board passed a resolution for the establishment of a capital reserve account. The 1992-1993 certified budget included an increase in the capital reserve account of $3,500,000.00 comprised of a voter approved transfer from unreserved fund balance.
Funds placed in the capital reserve account are restricted to capital projects in the district's approved Long Range Facilities Plan (LRFP). Upon submission of the LRFP to the department, a district may increase the balance in the capital reserve by appropriating funds in the annual general fund budget certified for taxes or by transfer by board resolution at year end of any unanticipated revenue or unexpended line-item appropriation amount, or both. A district may also appropriate additional amounts when the express approval of the voters has been obtained either by a separate proposal at budget time or by a special question at one of the four special elections authorized pursuant to N.J.S.A. 19:60-2. Pursuant to N.J.A.C. 6A:23A-14.1(g), the balance in the account cannot at any time exceed the local support costs of uncompleted capital projects in its approved LRFP.
59
BOARD OF EDUCATION BOROUGH OF FAIR LAWN
NOTES TO BASIC FINANCIAL STATEMENTS YEAR ENDED JUNE 30, 2016
Note V: Detailed Disclosure Regarding Fund Equity (Continued)
A. Capital Reserve Account (Continued)
A summarY of the account's transactions is as follows:
1992-1993 Budget (described above)
For the period 7/1/92 - 6/30/13: InvesnnentInconae Resolution (Unreserved Fund Balance Transfer frona Fund 30 Budgetary Expenditures
2013-2014 Resolution (Unreserved Fund Balance) 2013-2014 Invesnnent Income 2013-2014 Budget Expenditures 2014-2015 Resolution (Unreserved Fund Balance) 2014-2015 Invesnnent Income 2014-2015 Transfer to Fund 30 2014-2015 Transfer to Fund 40 2014-2015 Budget Expenditures 2015-2016 Resolution (Unreserved Fund Balance) 2015-2016 Invesnnent Income 2015-2016 Budget Expenditures
Balance June 30, 2016
$3,500,000.00
291,237.31 4,165,566.36
34,655.65 (5,482,699.88) 3,265,282.29
1,629.70 (1,250,000.00) 2,471,625.04
1,488.71 (1,601,070.00)
(500,000.00) (500,000.00)
2,593,348.53 3,210.99
(637,390.00)
$6.356.884.70
The June 30, 2016 LRFP balance oflocal support costs of uncompleted capital projects at June 30, 2016 is $14,956,800.00.
60
Note VI: Pension Plans
BOARD OF EDUCATION BOROUGH OF FAIR LAWN
NOTES TO BASIC FINANCIAL STATEMENTS YEAR ENDED JUNE 30, 2016
Description of Systems
Substantially all of the Board's employees participate in one of the following contributory defined benefit public employee retirement systems which have been established by State statute: the Teachers' Pension and Annuity Fund (TPAF) or the Public Employees' Retirement System (PERS) or the Defmed Contribution Retirement Program (DCRP). These systems are sponsored and administered by the New Jersey Division of Pensions and Benefits. The Teachers' Pension and Annuity Fund retirement system is considered a cost sharing plan with special funding situations as under current statute, all employer contributions are made by the State of New Jersey on behalf of the Board and the system's other related non-contributing employers. The PERS is considered a cost sharing multipleemployer defined benefit plan. The DCRP is considered a cost sharing mUltiple-employer defmed contribution plan.
The Public Employees' Retirement System (PERS) was established in January 1955, under the provisions ofN.J.S.A. 43:15A to provide coverage including post-retirement health care to substantially all full time employees of the State or any county, municipality, school district or public agency provided the employee is not a member of another Stateadministered retirement system.
The vesting and benefit provisions are set by N.J.S.A. 43:15A. PERS provides retirement, death and disability benefits. All benefits vest after ten years of service, except for medical benefits, which vest after 25 years of service or under the disability provisions ofPERS.
The following represents the membership tiers for PERS:
Tier 1 2 3 4 5
Definition Members who were enrolled prior to July 1, 2007 Members who were eligible to enroll on or after July 1, 2007 and prior to November 2,2008 Members who were eligible to enroll on or after November 2,2008 and prior to May 22,2010 Members who were eligible to enroll on or after May 22,2010 and prior to June 28, 2011 Members who were eligible to enroll on or after June 28, 2011
Service retirement benefits of 1/551h of fmal average salary for each year of service credit is available to tier 1 and 2 members upon reaching age 60 and to tier 3 members upon reaching age 62. Service retirement benefits of 1/601h of final average salary for each year of service credit is available to tier 4 members upon reaching age 62 and tier 5 members upon reaching age 65. Early retirement benefits are available to tier 1 and 2 members before reaching age 60, tier 3 and 4 members before age 62 with 25 or more years of service credit and tier 5 with 30 or more years of service credit before age 65. Benefits are reduced by a fraction of a percent for each month that a member retires prior to the age at which a member can receive full early retirement benefits in accordance with their respective tier. Tier 1 members can receive an unreduced benefit from age 55 to age 60 if they have at least 25 years of service. Deferred retirement is available to members who have at least 10 years of service credit and have not reached the service retirement age for the respective tier.
61
BOARD OF EDUCATION BOROUGH OF F AIR. LAWN
NOTES TO BASIC FINANCIAL STATEMENTS YEAR ENDED JUNE 30. 2016
Note VI: Pension Plans (Continued)
The Teachers' Pension and Annuity Fund (TPAF) was established in 1955, under the provisions ofN.J.S.A. 18:66, to provide coverage including post-retirement health care to substantially all full-time public school employees in the State. Membership is mandatory for such employees and vesting occurs after 10 years of service for pension benefits and 25 for post-retirement health care coverage.
The vesting and benefit provisions are set by N.J.S.A. 18A:66. TPAF provides retirement, death and disability benefits. All benefits vest after ten years of service, except for medical benefits, which vest after 25 years of service or under the disability provisions of TP AF. Members are always fully vested for their own contributions and, after three years of service credit, become vested for 2% of related interest earned on the contributions. In the case of death before retirement, members' beneficiaries are entitled to full interest credited to the members' accounts.
The following represents the membership tiers for TP AF:
Tier 1 2 3 4 5
Definition Members who were enrolled prior to July 1, 2007 Members who were eligible to enroll on or after July 1, 2007 and prior to November 2, 2008 Members who were eligible to enroll on or after November 2, 2008 and prior to May 22, 2010 Members who were eligible to enroll on or after May 22,2010 and prior to June 28, 2011 Members who were eligible to enroll on or after June 28, 2011
Service retirement benefits of 1I55th of final average salary for each year of service credit is available to tier 1 and 2 members upon reaching age 60 and to tier 3 members upon reaching age 62. Service retirement benefits of 1/60th of fmal average salary for each year of service credit is available to tier 4 members upon reaching age 62 and tier 5 members upon reaching age 65. Early retirement benefits are available to tier 1 and 2 members before reaching age 60, tier 3 and 4 members before age 62 with 25 or more years of service credit and tier 5 with 30 or more years of service credit before age 65. Benefits are reduced by a fraction of a percent for each month that a member retires prior to the age at which a member can receive full early retirement benefits in accordance with their respective tier. Tier 1 members can receive an unreduced benefit from age 55 to age 60 if they have at least 25 years of service. Deferred retirement is available to members who have at least 10 years of service credit and have not reached the service retirement age for the respective tier.
The Defmed Contribution Retirement Program (DCRP) was established as of July 1, 2008 under the provisions of Chapter 92, P.L. 2008 and Chapter 103, P.L. 2008 (NJSA 43:15C-1 et seq .. ). The DCRP is a cost sharing multipleemployer defined contribution pension fund. The DCRP provides eligible members, and their beneficiaries with a tax-sheltered, defined contribution retirement benefit, along with life insurance and disability coverage. Vesting and benefit provisions are established by NJSA 43: 15C-1 et seq ..
According to the state law, all obligations of each retirement system will be assumed by the State of New Jersey should any retirement systems terminate. The State of New Jersey, Department of the Treasury, Division of Pensions and Benefits issues a publicly available financial report that includes the fmancial statements and required supplementary information of each of the above systems. The financial reports may be accessed via the New Jersey Division of Pensions and Benefits website at www.state.nLus/treasurv/pensions.
62
BOARD OF EDUCATION BOROUGH OF F AIR LAWN
NOTES TO BASIC FINANCIAL STATEMENTS YEAR ENDED JUNE 30. 201-6':--·
Note VI: Pension Plans (Continued)
Significant Legislation
P.L 2011, c.78, effective June 28, 2011, made various changes to the manner in which TPAF, PERS, PFRS, SPRS, and JRS operate and to the benefit provisions of those systems.
This legislation's provisions impacting employee pension and health benefits include:
• For new members of TPAF and PERS hired on or after June 28, 2011 (Tier 5 members), the years of creditable service needed for early retirement benefits increased from 25 to 30 years and the early retirement age increased from 55 to 65.
• The eligibility age to qualify for a service retirement in the TP AF and PERS increased from age 62 to 65 for Tier 5 members.
• The annual benefit under special retirement for new PFRS members enrolled after June 28, 2011 (Tier 3 members), decreased from 65 percent of final compensation to 60 percent of final compensation after 25 years of service and from 70 percent of final compensation to 65 percent of final compensation after 30 or more years of service.
• It increased the active member contribution rates as follows: TP AF and PERS active member rates increased from 5.5 percent of annual compensation to 6.5 percent plus an additional 1 percent phased-in over 7 years; PFRS and PERS Prosecutors Part active member rates increased from 8.5 percent to 10 percent; SPRS active member rates increased from 7.s percent to 9 percent; and JRS active member rates increased from 3 percent to 12 percent phased-in over seven years for members hired or reappointed on or after June 28, 2011. For Fiscal Year 2012, the member contribution rates increased in October 2011. The phase-in of the additional incremental member contributions for TP AF, PERS and JRS members takes place in July of each subsequent fiscal year.
• The payment of automatic cost-of-living adjustment (COLA) additional increases to current and future retirees and beneficiaries was suspended until reactivated as permitted by this law.
• It changed the method for amortizing the pension systems' unfunded accrued liability (from a level percent of pay method to a level dollar of pay method).
63
BOARD OF EDUCATION BOROUGH OF FAIR LA WN
NOTES TO BASIC FINANCIAL STATEMENTS YEAR ENDED JUNE 30, 2016
Note VI: Pension Plans (Continued)
Contribution Requirements
The contribution policy is set by laws of the State of New Jersey and contributions are required by active members and participating employers. Plan member and employer contributions may be amended by State of New Jersey legislation, with the amount of contributions by the State of New Jersey contingent upon the annual Appropriations Act.
During the state fiscal year ended June 30, 2015, for TPAF, which is a cost sharing plan with special funding situations, the annual pension cost differs from the annual required contribution. For PERS, which is a cost sharing mUlti-employer defined benefit pension plan, annual pension cost equals contributions made.
The District's total payroll for the year ended June 30, 2016 was $55,234,937.70 and covered payroll was $38,830,986.00 for TPAF, $9,836,977.00 for PERS and $2,735,752.43 for DCRP. Contributions to the TPAF, PERS and the DCRP for the last three years made by the employees, Borough of Fair Lawn School District and the State were as follows:
In accordance with N.J .S.A. 18A:66-66 the State of New Jersey reimbursed the Board $2,782,191.15 during the year ended June 30, 2016 for the employer's share of social security contributions for TPAF members as calculated on their base salaries. This amount and the State of New Jersey's Contribution to the TPAF have been included in the basic financial statements and the budgetary comparison schedule - General Fund as a revenue and expenditure in accordance with GASB 24.
64
BOARD OF EDUCATION BOROUGH OF F AIR. LAWN
NOTES TO BASIC FINANCIAL STATEMENTS YEAR ENDED JUNE 30, 2016
Note VII: Public Employees Retirement System
At June 30, 2016, the District reported a liability of $34,172,252.00 for its proportionate share of the net pension liability. The net pension liability was measured as of June 30, 2014, and the total pension liability used to calculate the net pension liability was determined by an actuarial valuation as of that date. The District's proportion of the net pension liability was based on a projection of the District's long-term share of contributions to the pension plan relative to the projected contributions of all participating employers, actuarially determined. At June 30, 2015, the District's proportion was 0.1522285199%, which was a decrease of 1.90% from its proportion measured as of June 30,2014.
For the year ended June 30, 2016, the District recognized pension expense of $2,201,251.00. At June 30, 2016, the District reported deferred outflows of resources and deferred inflows of resources related to PERS from the following sources:
Difference between expended and
actual experience
Changes of assumptions Net difference between projected and
actual earnings on pension plan investments
Changes in proportion District contributions subsequent to
the measurement data Total
Deferred Outflows of Resources
$
815,230
3,669,827
392,314
1.308,757 $6,186,128
Deferred Inflows of Resources
$
549,424 469,123
$1,018,541
Amounts reported as deferred outflows of resources and deferred inflows of resources related to pensions will be recognized in pension expense as follows:
Year ended June 30, 2016 2017 2018 2019 2020 Total
65
$716,483 716,483 716,483
1,141,114 645,068
$3,935,631
BOARD OF EDUCATION BOROUGH OF F AIR LAWN
NOTES TO BASIC FINANCIAL STATEMENTS YEAR ENDED JUNE 30, 2016
Note VII: Public Employees Retirement System (Continued)
Actuarial Assumptions
The collective total pension liability for the June 30, 2015 measurement date was determined by an actuarial valuation as of July 1, 2014, which was rolled forward to June 30, 2015. This actuarial valuation used the following actuarial assumptions, applied all periods in the measurement:
Inflation rate
Salary increases: 2012-2021 Thereafter
Investment rate of return:
3.04%
2.15% - 4.40% (based on age) 3.15% - 5.40% (based on age)
7.90%
Mortality rates were based on the RP-2000 Combined Healthy Male and Female Mortality Tables (setback 1 year for males and females) for service retirement and beneficiaries of former members with adjustments for mortality improvements from the base year of 2012 based on Projection Scale AA. The RP-2000 Disability Mortality Tables (setback 3 years for males and setback 1 year for females) are used to value disabled retirees.
The actuarial assumptions used in the July 1, 2014 valuation were based on the results of an actuarial experience study for the period July 1, 2008 to June 30,2011.
In accordance with State statute, the long-term expected rate of return on plan investments is determined by the State Treasurer, after consultation with the Directors of the Division of Investments and Division of Pensions and Benefits, the board of trustees and the actuaries. Best estimates of arithmetic real rates of return for each major asset class included in PERS's target asset allocation as of June 30, 2015 are summarized in the following table:
Long-Term Expected
Target Real Rate Asset Class Allocation of Return
Cash 5.00% 1.04% U.S. Treasury 1.75% 1.64% Investment Grade Credit 10.00% 1.79% Mortgages 2.10% 1.62% High Yield Bonds 2.00% 4.03% Inflation-Indexed Bonds 1.50% 3.25% Broad US Equities 27.25% 8.52% Developed Foreign Equities 12.00% 6.88% Emerging Market Equities 6.40% 10.00% Private Equity 9.25% 12.41% Hedge Funds! Absolute Return 12.00% 4.72% Real Estate (Property) 2.00% 6.83% Commodities 1.00% 5.32% Global Debt ex US 3.50% -0.40% REIT 4.25% 5.12%
66
BOARD OF EDUCATION BOROUGH OF FAIR LAWN
NOTES TO BASIC FINANCIAL STATEMENTS YEAR ENDED JUNE 30, 2016
Note VII:Public Employees Retirement System (Continued)
Discount Rate
The discount rate used to measure the total pension liability was 4.90% as of June 30, 2015. This single blended discount rate was based on the long-term expected rate of return on pension plan investments of 7.9%, and a municipal bond rate of 3.80% as of June 30, 2015, based on the Bond Buyer Go 20-Bond Municipal Bond Index which includes tax-exempt general obligation municipal bonds with an average rating of AAJAa or higher. The projection of cash flows used to determine the discount rate assumed that contributions from plan members will be made at the current member contribution rates and that contributions from employers will be made based on the average of the last five years of contributions made in relation to the last five years of actuarially determined contributions. Based on those assumptions, the plan's fiduciary net position was projected to be available to make projected future benefit payments of current plan members through 2033. Therefore, the long-term expected rate of return on plan investments was applied to projected benefit payments through 2033, and the municipal bond rate was applied to projected benefit payments after that date in determining the total pension liability.
Sensitivity of the District's proportionate share of the net pension liability to changes in the discount rate
The following presents the District's proportionate share of the net pension liability calculated using the discount rate of 4.90%, as well as what the District's proportionate share of the net pension liability would be if it were calculated using a discount rate that is I-percentage point lower (3.90%) or I-percentage point higher (5.90%) than the current rate:
District's proportionate share of the net pension liability
Note VIII: Teachers Pension and Annuity Fund (TP AF)
1% Decrease (3.90%)
$42,472,692
Current Discount
Rate (4.90%)
$34,172,252
1% Increase (5.90%)
$27,214,781
At June 30, 2015, the District reported a liability for its proportionate share of the net pension liability that reflected a reduction for State pension support to the District. The amount recognized by the District as its proportionate share of the net pension liability, the related State support, and the total portion of the net pension liability that was associated with the District were as follows:
District's proportionate share of the net pension liability
State's proportionate share of the net pension liability associated with the District
Total
$
236.103,641
$236,103,641
The net pension liability was measured as of June 30,2014 and the total pension liability to calculate the net pension liability was determined by an actuarial valuation as of that date. The District's proportion of the net pension liability was based on a projection of the District's long-term share of contributions to the pension plan relative to the projected contributions of all participating school districts and the State, actuarially determined. At June 30, 2015, the District's proportion was 0.00%, which was a decrease of 0.00% from its proportion measured as of June 30, 2014.
67
BOARD OF EDUCATION BOROUGH OF FAIR LAWN
NOTES TO BASIC FINANCIAL STATEMENTS YEAR ENDED JUNE 30, 2016
Note VIII: Teachers Pension and Annuity Fund (TPAF)(Continued)
For the year ended June 30, 2015, the State (for the District) recognized pension expense of$14,416,253 and revenue of $14,416,253 for support provided by the State. At June 30, 2015, the State (for the District) reported deferred outflows of resources and deferred inflows of resources related to TPAF from the following sources:
Differences between expected and actual experience Changes of assumptions Net difference between projected and actual earnings
on pension plan investments Changes in proportion State's contribution associated with the District
subsequent to the measurement date Total
$
Deferred Outflows
Of Resources
1,192,905 26,738,589
170,750
2,007,593 $30,109,837
Deferred Inflows
Of Resources
$7,070
1,988,117 269,796
$2,264,983
Amounts reported as deferred outflows of resources and deferred inflows of resources related to pensions will be recognized in pension expense as follows:
Year ended June 30, 2016 2017 2018 2019 2020 Thereafter Total
The collective total pension liability for the June 30, 2015 measurement date was determined by an actuarial valuation as of July 1,2014, which was rolled forward to June 30, 2015, This actuarial valuation used the following actuarial assumptions, applied all periods in the measurement:
Inflation rate
Salary increases: 2012-2021 Thereafter
Investment rate of return:
68
2.50%
Varies based on experience Varies based on experience
7,90%
BOARD OF EDUCATION BOROUGH OF FAIR LAWN
NOTES TO BASIC FINANCIAL STATEMENTS YEAR ENDED JUNE 30. 2016
Note VllI: Teachers Pension and Annuity Fund (TP AF)(Continued)
Mortality rates were based on the RP-2000 Health Annuitant Mortality Table for Males or Females, as appropriate with adjustments for mortality improvements based on Scale AA from the base year of 2000 until the valuation date plus 15 years to account for future mortality improvement. Post-retirement mortality improvements for non-disabled annuitants are projected using Scale AA from the base year of 2000 for males and 2003 for females until the valuation date plus 7 years to account for future mortality improvement.
The actuarial assumptions used in the July 1, 2014 valuation were based on the results of an actuarial experience study for the period July 1,2009 to June 30, 2012.
In accordance with State statute, the long-term expected rate of return on plan investments (7.90% at June 30,2015) is determined by the State Treasurer, after consultation with the Directors of the Division of Investments and Division of Pensions and Benefits, the board of trustees and the actuaries. The long-term expected rate of return was determined using a building block method in which best-estimate ranges of expected future real rates of return (expected returns, net of pension plan investment expense and inflation) are developed for each major asset class. These ranges are combined to produce the long-term expected rate of return by weighting the expected future real rates of return by the target asset allocation percentage and by adding expected inflation. Best estimates of arithmetic real rates of return for each major asset class included in TPAF's target asset allocation as of June 30, 2015 are summarized in the following table:
Long-Term Target Expected Real
Asset Class Allocation Rate of Return US Cash 5.00% 0.53% US Government Bonds 1.75% 1.39% US Credit Bonds 13.50% 2.72% US Mortgages 2.10% 2.54% US Inflation-Indexed Bonds 1.50% 1.47% US High Yield Bonds 2.00% 4.57% US Equity Market 27.25% 5.63% Foreign-Developed Equity 12.00% 6.22% Emerging Markets Equity 6.40% 8.46% Private Real Estate Property 4.25% 3.97% Timber 1.00% 4.09% Farmland 1.00% 4.61% Private Equity 9.25% 9.15% Commodities 1.00% 3.58% Hedge Funds - MultiStrategy 4.00% 4.59% Hedge Funds - Equity Hedge 4.00% 5.68% Hedge Funds - Distressed 4.00% 4.30%
69
BOARD OF EDUCATION BOROUGH OF FAIR LAWN
NOTES TO BASIC FINANCIAL STATEMENTS YEAR ENDED JUNE 30. 2016
Note VIII: Teachers Pension and Annuity Fund (TP AF)(Continued)
Discount Rate
The discount rate used to measure the total pension liability was 4.13% as of June 30, 2015. This single blended discount rate was based on the long-term expected rate of return on pension plan investments of 7.9%, and a municipal bond rate of 3.80% as of June 30, 2015, based on the Bond Buyer Go 20-Bond Municipal Bond Index which includes tax-exempt general obligation municipal bonds with an average rating of ANAa or higher. The projection of cash flows used to determine the discount rate assumed that contributions from plan members will be made at the current member contribution rates and that contributions from employers will be made based on the average of the last five years of contributions made in relation to the last five years of actuarially determined contributions. Based on those assumptions, the plan's fiduciary net position was projected to be available to make projected future benefit payments of current plan members through 2027. Therefore, the long-term expected rate of return on plan investments was applied to projected benefit payments through 2027, and the municipal bond rate was applied to projected benefit payments after that date in determining the total pension liability.
Sensitivity of the District's proportionate share of the net pension liability to changes in the discount rate
The following presents the District's proportionate share of the net pension liability calculated using the discount rate of 4.13%, as well as what the District's proportionate share of the net pension liability would be if it were calculated using a discount rate that is I-percentage point lower (3.13%) or I-percentage point higher (5.13%) than the current rate:
Current 1% Discount 1%
Decrease Rate Increase (3.13%) (4.13%) (5.13%)
District's proportionate share of the net pension liability $280,609,177 $236,103,641 $197,784,020
Note IX: Health Benefit and Post-Retirement Medical Benefits
P.L. 2011, c.78 effective October 2011, sets new employee contribution requirements towards the cost of employerprovided health benefit coverage. Employees are required to contribute a certain percentage of the cost of coverage. The rate of contribution is determined based on the employee's annual salary and the selected level of coverage. The increased employee contributions will be phased in over a 4-year period for those employed prior to this new legislation's effective date with a minimum contribution required to be at least 1.5% of salary.
Health Benefits Program Fund (HBPF)- Local Education (including Prescription Drug Program Fund)- The State of New Jersey provides free coverage to members of the Teachers' Pension and Annuity Fund who retire from a board of education or county college with 25 years of service or on a disability retirement. Under the provisions of P.L. 1992, c.126, the State also provides free coverage to members of the Public Employees' Retirement System and Alternate Benefits Program who retire from a board of education or county college with 25 years of service or on a disability retirement if the member's employer does not provide this coverage.
70
BOARD OF EDUCATION BOROUGH OF F AIR LAWN
NOTES TO BASIC FINANCIAL STATEMENTS YEAR ENDED JUNE 30. 2016
Note IX: Health Benefit and Post-Retirement Medical Benefits (Continued)
P.L. 1987, c.384 and P.L. 1990, c.6 required the Teachers' Pension and Annuity Fund and the Public Employees' Retirement System, respectively, to fund post-retirement medical benefits for those employees who retire after accumulating 25 years of credited service or on a disability retirement. As of June 30, 2015, there were 107,314 retirees receiving post-retirement medical benefits and the state contributed $1.25 billion on their behalf. The cost of these benefits is funded through contributions by the State in accordance with P.L. 1994, c.62. Funding of postretirement medical benefits changed from a pre-funding basis to a pay-as-you-go basis beginning in Fiscal Year 1994.
The State is also responsible for the cost attributable to P.L. 1992 c.126 which provides free health benefits to members ofPERS and the Alternate Benefit Program who retired from a board of education or county college with 25 years of service. The State paid $214.1 million toward Chapter 126 benefits for 19,056 eligible retired members in fiscal year 2015.
Note X: Deferred Compensation Plan
The Board offers its employees a deferred compensation plan (the "Plan") created in accordance with Internal Revenue Code Section 403(b). The plans, which are administered by the entities listed below, permits participants to defer a portion of their salary until future years. Amounts deferred under the plans are not available to employees until termination, retirement, death or unforeseeable emergency or upon death to their beneficiaries. The plan administrators are as follows:
Equitable Lincoln Investment Planning VALIC
All amounts of compensation deferred under this plan, all property and rights purchased with those amounts, and all income attributable to those amounts, property and rights are (until paid or made available to the employee or other beneficiary) solely the property and rights of the Borough of Fair Lawn School District (without being restricted to the provisions of benefits under the Plan) subject only to the claims of the Borough of Fair lawn's general creditors. Participants' right under the Plan are equivalent to those of general creditors of the Borough of Fair lawn School District in an amount equal to the fair market value of the deferred account for each participant.
The maximum amount of deferred compensation for any participant for any taxable year shall not exceed the lesser of $18,000.00 or 100 percent of the participant's includible compensation for the taxable year except as provided by the limited catch-up provision which may effect a participant's last three taxable years ending before a participant attains normal retirement age as dermed by plan.
During the year ended June 30, 2015 and 2016, the employees' contributions to the plan were $1,779,591.18, and $1,868,712.95.
71
Note XI: Risk Management
BOARD OF EDUCATION BOROUGH OF FAIR LAWN
NOTES TO BASIC FINANCIAL STATEMENTS YEAR ENDED JUNE 30, 20 I 6
New Jersey Unemployment Compensation Insurance - The District has elected to fund its New Jersey Unemployment Compensation Insurance under the "Benefit Reimbursement Method". Under this plan, the District is required to reimburse the New Jersey Unemployment Trust Fund for benefits paid to its former employees and charged to its account with the State. The District is billed quarterly for amounts due to the State.
The following table is a summary of district contributions, employee contributions, reimbursements to the state for benefits paid and the ending balance of the district's trust fund for the current and previous two years:
The Borough of Fair Lawn School District is exposed to various risks of loss related to torts; theft of, damage to, and destruction of assets; errors and omissions; injuries to employees; and natural disasters.
The District is a member of the School Alliance Insurance Fund. (the "Fund"). The Fund is both an insured and selfadministered group of school districts established for the purpose of providing certain low-cost Property Damage, Employer's Liability, School Board Legal Liability, Automobile and Equipment Liability, insurance coverage for member school districts in order to keep local property taxes at a minimum. The District pays an annual assessment
Note XI: Risk Management(Continued)
to the Fund and should it be determined that payments received by the Fund are deficient, additional assessments may be levied. Additionally, the Fund maintains a contract of excess insurance with a commercial reinsuror to secure the payment of benefits.
The District is a member of the New Jersey School Board Association Insurance Group (the "Group").
The Group is both an insured and self-administered group of school districts established for the purpose of providing certain low-cost Workers' Compensation coverage for member school districts in order to keep local property taxes at a minimum. The District pays an annual assessment to the Group and should it be determined that payments received by the Group are deficient, additional assessments may be levied. Additionally, the Group maintains a contract of excess insurance with a commercial reinsuror to secure the payment of benefits.
The Borough of Fair Lawn School District continues to carry commercial insurance coverage for all other risks of loss, including employee health and accident insurance. Settled claims resulting from these risks have not exceeded commercial insurance coverage in any of the past three fiscal years.
72
BOARD OF EDUCATION BOROUGH OF F AIR LAWN
NOTES TO BASIC FINANCIAL STATEMENTS YEAR ENDED JUNE 30. 2016
Note Xll:Compensated Absences
The District accounts for compensated absences (e.g., unused vacation, sick leave) as directed by Governmental Accounting Standards Board Statement No. 16 (GASB 16), "Accounting for Compensated Absences". A liability for compensated absences attributable to services already rendered and not contingent on a specific event that is outside the control of the employer and employee is accrued as employees earn the rights to the benefits.
District employees are granted vacation and sick leave in varying amounts under the District's personnel policies. In the event of termination, an employee is reimbursed for accumulated vacation. Sick leave benefits provide for ordinary sick pay are paid upon retirement to employees over 50 years old with 15 years of service. In the district-wide Statement of Net Position, the liabilities whose average maturities are greater than one year are reported in two components - the amount due within one year and the amount due in more than one year.
The liability for vested compensated absences of the proprietary fund types is recorded within those funds as the benefits accrue to employees. As of June 30, 2016, no liability existed for compensated absences in the Food Service Fund.
Note XllI:Contingent Liabilities
The Borough of Fair Lawn School District is a defendant in several lawsuits, none of which is unusual for a Board of Education of its size. Additional liabilities, if not covered by insurance, should not be material in amount.
Note XIV:Subseguent Events
The Borough of Fair Lawn School District has evaluated subsequent events through October 28,2016, the date which the financial statements were available to be issued and no additional items were noted for disclosure or adjustment.
Required Supplementary Information Budgetary Comparison Schedule
Note to RSI For the Fiscal Year Ended June 30,2016
Note A - Explanation of Differences between Budgetary Inflows and Outflows and GAAP Revenues and Expenditures
Exhibit Sourcesllnflows of resources Actual amounts (budgetary basis) "revenue"
from the budgetary comparison schedule [C-1&C-2] Difference - budget to GAAP:
The last State aid payment is recognized as revenue for budgetary purposes, and differs from GAAP which does not recognize this revenue until the subsequent year when the State recognizes the related expense in accordance with GASB 33.
Grant accounting budgetary basis differs from GAAP in that encumbrances are recognized as expenditures, and the related revenue is recognized.
Total revenues as reported on the statement of revenues, expenditures and changes in fund balances - governmental funds. [B-2]
Uses/outflows of resources Actual amounts (budgetary basis) "total outflows" from the
budgetary comparison schedule [C-1&C-2] Differences - budget to GAAP
Encumbrances for supplies and equipment ordered but not received are reported in the year the order is placed for budgetary purposes, but in the year the supplies are received for financial reporting purposes.
Transfers to and from other funds are presented as outflows of budgetary resources but are not expenditures for financial reporting purposes.
Net transfers (outflows) to general fund
Total expenditures as reported on the statement of revenues, expenditures, and changes in fund balances - governmental funds [B-2]
84
Exhibit Col
Special General Revenue
Fund Fund
$ 93,871,145.87 $ 1,843,019.82
23,077.00
$ 93,894,222.87 $ 1,843,019.82
$ 90,150,680.36 $ 1,843,019.82
$ 90,150,680.36 $ 11843.019.82
REQUIRED SUPPLEMENTARY INFORMATION -PART III
85
Section L
SCHEDULES RELATED TO ACCOUNTING AND REPORTING FOR PENSIONS (GASB 68)
86
BOARD OF EDUCATION BOROUGH OF FAIR LAWN
Schedule of the District's Proportionate Share of the Net Pension Llablllty- PERS
Fiscal Year Ending June 301
District's proportion of the net pension liability
District's proportionate share of the net pension liability
District's covered employee payroll
District's proportionate share of the net pension liability as a percentage of its covered employee payroll
Plan fiduciary net position as a percentage of the total pension liability
$
$
2014
0.1522045239%
29,089,309.00
9,754,894.00
296.20%
48.72%
2015
0.1551818755%
$ 29,054,291 .00
$ 9,719,098.00
298.94%
52.08%
Note: This schedule does not contain ten years of information as GASB No. 68 was Implemented during fiscal year ended June 30, 2015.
Total State Revenues $ 182.791.19 $ 12.733.00 $ 86.088.84 $ 52.985.95 $
EXPENDITURES: Instruction:
Textbooks 100-640 $ 12.733.00 $ 12.733.00 $ $ $
Total Instruction 12.733.00 12.733.00
Support Services: Purchased Professional and Technical Services 200-300 19.610.40 Purchased Professional - Educational Services 200-320 150.447.79 86.088.84 52.985.95
Total Support Services 170,958.19 86.088.84 52.985.95
Summary Schedule of Revenues, Expenditures, and Changes In Fund Balance· Budgetary Basis For the Year Ended June 30,2016
REVENUES AND OTHER FINANCING SOURCES State Sources· SDA Grant Bond Proceeds Capital Leases Transfer from capital reserve Transfer from capital outlay Total Revenues
EXPENDITURES AND OTHER FINANCING USES Equipment (73X) Salaries (100) Legal Services (331) Other Purchased Professional and Technical Services (390) Construction Services (450) General Supplies (610) Land and Improvements (710) Lease Purchase Agreements· Principal (721) Buildings other than Lease Purchase Agreements· Principal (722) Other Objects (800) Total Expenditures
Excess (deficiency) of revenues over (under) expenditures
Fund Balance· July 1
Fund Balance· June 30
101
$
31,291.70 435,374.32
7,044,464.82
110,447.14 7,621,577.98
(7,621,577.98)
14,492,932.11
$ 6,871,354.13
exhibit F·2a BOARD OF EDUCATION
BOROUGH OF FAIR LAWN Schedule of Project Revenues, Expenditures, Project Balance and Project Status· Budgetary Basis
Addltlons/Renovatlons • Westmoreland Elementary School From Inception and for the Year Ended June 3D, 2018
Prior Period!! Current Year Totals
REVENUES AND OTHER FINANCING SOURCES State Sources - SDA Grant S S S Bond Proceeds 7,387,480.00 7,387,480.00 Capital Leases Transfer from capital reserve Transfer from capital outlay Total Revenues 71387,480.00 7,387,480.00
EXPENDITURES AND OTHER FINANCING USES Equipment (73X) Salaries (100) legal Services (331) 55,842.60 21,331 .49 77,174.09 Other Purchased Professional and Technical Services (390) 462,177.35 230,930.32 693,107.67 Construction Services (450) 4,021,446.53 4,021,446.53 General Supplies (610) Land and Improvements (710) Lease Purchase Agreements· Principal (721) Buildings other than Lease Purchase Agreements - Principal (722) Other Objects (800) 78,660.44 78,660.44 Total expenditures 518,019.95 4,352,388.78 4,870,388.73
Excess (deficiency) of revenues over (under) expenditures 61869,460.05 !413521368.78) 215171091.27
ADDITIONAL PROJECT INFORMATION Project Number N/A Grant Date N/A Bond Authorization Date 12/9/14 Bonds Authorized S 7,388,466.00 Bonds Issued S 7,387,480.00 Original Authorized Cost S 7,388,466.00 Additional Authorized Cost S Revised Authorized Cost S 7,388,466.00
Percentage Increase over Original Authorized Cost 0.00% Percentage Completed 65.92% Original Target Completion Date 11/16/16 Revised Target Completion Date 11/16/16
102
Revised Authorized
CO!!t
S 7,388,466.00
7,388,466.00
125,000.00 886,772.00
5,796,994.00
579,700.00 7,388,466.00
ExhIbIt F-2b BOARD OF EDUCATION
BOROUGH OF FAIR LAWN Schedule of Project Revenues, ExpendItures, Project Balance and Project Status - Budgetary Baals
Roof Replacement - HIgh School From InceptIon and for the Year Ended June 30, 2018
REVENUES AND OTHER FINANCING SOURCES State Sources - SDA Grant Bond Proceeds Capital Leases Transfer from capital reserve Transfer from capItal outlay Total Revenues
EXPENDITURES AND OTHER FINANCING USES Equipment (73X) Salaries (100) Legal Services (331) Other Purchased Professional and Technical Services (390) Construction Services (450) General Supplies (610) Land and Improvements (710) Lease Purchase Agreements - Principal (721) Buildings other than Lease Purchase Agreements - Principal (722) Other Objects (800) Total Expenditures
Excess (deficiency) of revenues over (under) expenditures
ADDITIONAL PROJECT INFORMATION Project Number Grant Date Bond Authorization Date Bonds Authorized Bonds Issued Original Authorized Cost Additional Authorized Cost Revised Authorized Cost
Percentage Increase over Original Authorized Cost Percentage Completed Original Target Completion Date Revised Target Completion Date
BOROUGH OF FAIR LAWN Schedule of Project Revenues, ExpendHures, Project Balance and Project Status· Budgetary Basis
Roof Replacement· Thomas Jefferson Middle School From Inception and for the Year Ended June 30, 2016
REVENUES AND OTHER FINANCING SOURCES State Sources· SDA Grant Bond Proceeds Capital Leases Transfer from capital reserve Transfer from capital ouUay Total Revenues
EXPENDITURES AND OTHER FINANCING USES Equipment (73X) Salaries (100) Legal Services (331) Other Purchased Professional and Technical Services (390) Construction Services (450) General Supplies (610) Land and Improvements (710) Lease Purchase Agreements· Principal (721) Buildings other than Lease Purchase Agreements· Principal (722) Other Objects (800) Total Expenditures
Excess (deficiency) of revenues over (under) expenditures
ADDITIONAL PROJECT INFORMATION Project Number Grant Date Bond Authorization Date Bonds Authorized Bonds Issued Original Authorized Cost AddiUonal Authorized Cost Revised Authorized Cost
Percentage Increase over Original Authorized Cost Percentage Completed Original Target Completion Date Revised Target Completion Date
Schedule of Project Revenues, Expenditures, Project Balance and Project Status· Budgetary Basis Roof Replacement· John A. Forrest Elementary School
From Inception and for the Year Ended June 3D, 2016
REVENUES AND OTHER FINANCING SOURCES State Sources· SDA Grant Bond Proceeds Capital Leases Transfer from capital reserve Transfer from capital outlay Total Revenues
EXPENDITURES AND OTHER FINANCING USES Equipment (73X) Salaries (100) Legal Services (331) Other Purchased Professional and Technical Services (390) Construction Services (450) General Supplies (610) Land and Improvements (710) Lease Purchase Agreements· Principal (721) Buildings other than Lease Purchase Agreements· Principal (722) Other Objects (800) Total Expenditures
Excess (deficiency) of revenues over (under) expenditures
ADDITIONAL PROJECT INFORMATION Project Number Grant Date Bond Authorization Date Bonds Authorized Bonds Issued Original Authorized Cost Additional Authorized Cost Revised Authorized Cost
Percentage Increase over Original Authorized Cost Percentage Completed Original Target Completion Date Revised Target Completion Date
BOROUGH OF FAIR LAWN Schedule of Project Revenues, Expenditures, Project Balance and Project Status· Budgetary Basis
Roof Replacement· Lyncrest Elementary School From Inception and for the Year Ended June 30, 2016
REVENUES AND OTHER FINANCING SOURCES State Sources· SDA Grant Bond Proceeds Capital Leases Transfer from capital reserve Transfer from capital outlay Total Revenues
EXPENDITURES AND OTHER FINANCING USES Equipment (73X) Salaries (100) Legal Services (331) Other Purchased Professional and Technical Services (390) Construction Services (450) General Supplies (610) Land and Improvements (710) Lease Purchase Agreements - Principal (721) Buildings other than Lease Purchase Agreements· Principal (722) Other Objects (800) Total Expenditures
Excess (deficiency) of revenues over (under) expenditures
ADDITIONAL PROJECT INFORMATION Project Number Grant Date Bond Authorization Date Bonds Authorized Bonds Issued Original Authorized Cost Additional Authorized Cost Revised Aulhorlzed Cost
Percentage Increase over Original Authorized Cost Percentage Completed Original Target Completion Date Revised Target Completion Date
BOROUGH OF FAIR LAWN Schedule of Project Revenues, Expenditures, Project Balance and Project Status· Budgetary Basis
Roof Replacement· Warren Point Elementary School From Inception and for the Year Ended June 3D, 2016
REVENUES AND OTHER FINANCING SOURCES State Sources· SDA Grant Bond Proceeds Capital Leases Transfer from capital reserve Transfer from capital outlay Total Revenues
EXPENDITURES AND OTHER FINANCING USES Equipment (73X) Salaries (100) Legal Services (331) Other Purchased Professional and Technical Services (390) Construction Services (450) General Supplies (610) Land and Improvements (710) Lease Purchase Agreements - Principal (721) Buildings other than Lease Purchase Agreements - Principal (722) Other Objects (800) Total expenditures
Excess (deficiency) of revenues over (under) expenditures
ADDITIONAL PROJECT INFORMATION Project Number Grant Date Bond Authorization Date Bonds Authorized Bonds Issued Original Authorized Cost Additional Authorized Cost Revised Authorized Cost
Percentage Increase over Original Authorized Cost Percentage Completed Original Target Completion Date Revised Target Completion Date
BOROUGH OF FAIR LAWN Schedule of Project Revenues, Expenditures, Project Balance and Project Status· Budgetary Basis
Roof Replacement· Westmoreland Elementary School From Inception and for the Year Ended June 30, 2016
REVENUES AND OTHER FINANCING SOURCES State Sources· SDA Grant Bond Proceeds Capital Leases Transfer from capital reserve Transfer from capital outlay Total Revenues
EXPENDITURES AND OTHER FINANCING USES Equipment (73X) Salaries (100) Legal Services (331) Other Purchased Professional and Technical Services (390) Construction Services (450) General Supplies (610) Land and Improvements (710) Lease Purchase Agreements· Principal (721) Buildings other than Lease Purchase Agreements· Principal (722) Other Objects (800) Total expenditures
Excess (deficiency) of revenues over (under) expenditures
ADDITIONAL PROJECT INFORMATION Project Number Grant Date Bond Authorization Date Bonds Authorized Bonds Issued OrigInal Authorized Cost AddItional Authorized Cost RevIsed Authorized Cost
Percentage Increase over OrigInal Authorized Cost Percentage Completed Original Target CompletIon Date Revised Target Completion Date
BOROUGH OF FAIR LAWN Schedule of Project Revenuea, Expendlturea, Project Balance and Project Statua • Budgetary Baala
Window Replacement· High School From Inception and for the Year Ended June 30, 2016
REVENUES AND OTHER FINANCING SOURCES State Sources· SDA Grant Bond Proceeds Capital Leases Transfer from capital reserve Transfer from capital outlay Total Revenues
EXPENDITURES AND OTHER FINANCING USES Equipment (73X) Salaries (100) Legal Services (331) Other Purchased Professional and Technical Services (390) Construction Services (450) General Supplies (610) Land and Improvements (710) Lease Purchase Agreements· Principal (721) Buildings other than Lease Purchase Agreements· Principal (722) Other Objects (800) Total Expenditures
Excess (deficiency) of revenues over (under) expenditures
ADDITIONAL PROJECT INFORMATION Project Number Grant Date Bond Authorization Date Bonds Authorized Bonds Issued Original Authorized Cost Additional Authorized Cost Revised Authorized Cost
Percentage Increase over Original Authorized Cost Percentage Completed Original Target Completion Date Revised Target Completion Date
Prior Perloda
$ 232,400.00 $
348,600.00
581,000.00
34,480.00
34,480.00
546,520.00
SP1450·050·14·G1DR 9/3/14 N/A N/A N/A
$ 581,000.00 $ $ 581,000.00
0.00% 90.60%
9/16/15 9/16/15
109
Current Year
5,220.00 486,669.95
491,889.95
(491,889.95)
$
Totala
232,400.00
348,600.00
581,000.00
39,700.00 486,669.95
526,369.95
54,630.05
$
Revlaed Authorized
Cost
232,400.00
348,600.00
581,000.00
49,700.00 483,000.00
48,300.00 561,000.00
Exhibit F·21 BOARD OF EDUCATION
BOROUGH OF FAIR LAWN Schedule of Project Revenues, Expenditures, Project Balance and Project Status· Budgetary Basis
Window Replacement· Memorial Middle School From Inception and for the Year Ended June 30, 2016
REVENUES AND OTHER FINANCING SOURCES State Sources· SDA Grant Bond Proceeds Capital Leases Transfer from capital reserve Transfer from capital outlay Total Revenues
EXPENDITURES AND OTHER FINANCING USES Equipment (73X) Salaries (100) Legal Services (331) Other Purchased Professional and Technical Services (390) Construction Services (450) General Supplies (610) Land and Improvements (710) Lease Purchase Agreements· Principal (721) Buildings other than Lease Purchase Agreements · Principal (722) Other Objects (800) Total Expenditures
Excess (deficiency) of revenues over (under) expenditures
ADDITIONAL PROJECT INFORMATION Project Number Grant Date Bond Authorization Date Bonds Authorized Bonds Issued Original Authorized Cost Additional Authorized Cost Revised Authorized Cost
Percentage Increase over Original Authorized Cost Percentage Completed Original Target Completion Date Revised Target Completion Date
Prior Periods
$ 349,660.00 $
524,490.00
874,150.00
48,620.00
48,620.00
825,530.00
SP1450·070-14·G1DT 9/3/14 N/A N/A N/A
$ 874,150.00 $ $ 874,150.00
0.00% 46.05%
9/16/15 9/16/15
110
Current Year
8,580.00 344,433.00
927.54 353,940.54
(353,940.54)
$
!2!1!!
349,660.00
524,490.00
874,150.00
57,200.00 344,433.00
927.54 402,560.54
471,589.46
$
Revised Authorized
Cost
349,660.00
524,490.00
874,150.00
77,200.00 724,500.00
72,450.00 874,150.00
Exhibit F·2j BOARD OF EDUCATION
BOROUGH OF FAIR LAWN Schedule of Project Revenues, Expenditures, Project Balance and Project Status· Budgetary Basis
Window Replacement· Radburn Elementary School From Inception and for the Year Ended June 30, 2016
Prior Pgrlodl
REVENUES AND OTHER FINANCING SOURCES State Sources· SDA Grant $ 20,080.00 $ Bond Proceeds Capital Leases Transfer from capital reserve 30,120.00 Transfer from capital outlay Total Revenues 50,200.00
EXPENDITURES AND OTHER FINANCING USES Equipment (73X) Salaries (100) Legal Services (331) Other Purchased Professional and Technical Services (390) 3,300.00 Construction Services (450) General Supplies (610) Land and Improvements (710) Lease Purchase Agreements· Principal (721) Buildings other than Lease Purchase Agreements· Principal (722) Other Objects (800) Total Expenditures
Excess (deficiency) of revenues over (under) expenditures
ADDITIONAL PROJECT tNFORMATION Project Number Grant Date Bond Authorization Date Bonds Authorized Bonds Issued Original Authorized Cost Additional Authorized Cost Revised Authorized Cost
Percentage Increase over Original Authorized Cost Percentage Completed Original Target Completion Date Revised Target Completion Date
3,300.00
46.900.00
SP1450-110-14-G1DW 2/5/15
N/A N/A N/A
$ 50,200.00 $ $ 50,200.00
0.00% 95.17%
1/6/16 1/6116
111
Cur[!nt Ygar
376.50 2,500.00
41,600.00
44.476.50
{44,476.50)
Totall
$ 20,080.00 $
30,120.00
50,200.00
376.50 5.800.00
41,600.00
47.778.50
2,423.50
Revised Authorized
Cost
20,080.00
30,120.00
50,200.00
7.300.00 42,900.00
50,200.00
Exhibit F-2k BOARD OF EDUCATION
BOROUGH OF FAIR LAWN Schedule of Project Revenues, Expenditures, Project Balance and Project Status - Budgetary Basis
Window Replacement - Edison School From Inception and for the Year Ended June 30, 2016
REVENUES AND OTHER FINANCING SOURCES State Sources - SDA Grant Bond Proceeds Capital Leases Transfer from capital reserve Transfer from capital outlay Total Revenues
EXPENDITURES AND OTHER FINANCING USES Equipment (73X) Salaries (100) Legal Services (331) Other Purchased Professional and Technical Services (390) Construction Services (450) General Supplies (610) Land and Improvements (710) Lease Purchase Agreements - Principal (721) Buildings other than Lease Purchase Agreements - Principal (722) Other Objects (800) Total Expenditures
Excess (deficiency) of revenues over (under) expenditures
ADDITIONAL PROJECT INFORMATION Project Number Grant Date Bond Authorization Date Bonds Authorized Bonds Issued Original Authorized Cost Additional Authorized Cost Revised Authorized Cost
Percentage Increase over Original Authorized Cost Percentage Completed Original Target Completion Date Revised Target CompleUon Date
Prior Period.
$ 325,060.00 $
487,590.00
812,650.00
44,160.00
44,160.00
768,490.00
SP1450-130-14-G1DX 215/15
N/A N/A N/A
$ 812,650.00 $ $ 812,650.00
0.00% 74.17%
1/6116 1/6/16
112
Current Year
4,590.00 536,452.00
17,511.47 558,553.47
(558,553.47)
$
Total.
325,060.00
487.590.00
812,650.00
48,750.00 536,452.00
17.511 .47 602,713.47
209,938.53
$
Revised Authorized
Co.t
325,060.00
487,590.00
812,650.00
66,300.00 678.500.00
67,850.00 812,850.00
Exhibit F-21 BOARD OF EDUCATION
BOROUGH OF FAIR LAWN Schedule of Project Revenues, Expenditures, Project Balance and Project Status - Budgetary Basis
Window Replacement - Warren Point Elementary School From Inception and for the Year Ended June 3D, 2018
REVENUES AND OTHER FINANCING SOURCES State Sources - SDA Grant Bond Proceeds Capital Leases Transfer from capital reserve Transfer from capital outlay Total Revenues
EXPENDITURES AND OTHER FINANCING USES Equipment (73X) Salaries (100) Legal Services (331) Other Purchased Professional and Technical Services (390) Construction Services (450) General Supplljls (610) Land and Improvements (710) Lease Purchase Agreements - Principal (721) Buildings other than Lease Purchase Agreements - Principal (722) Other Objects (800) Total Expenditures
Excess (deficiency) of revenues over (under) expenditures
ADDITIONAL PROJECT INFORMATION Project Number Grant Date Bond Authorization Date Bonds Authorized Bonds Issued Original Authorized Cost Additional Authorized Cost Revised Authorized Cost
Percentage Increase over Original Authorized Cost Percentage Completed Original Target Completion Date Revised Target Completion Date
$
Prior Periods
140,180.00
210,270.00
350,450.00
21,296.00 6,878.00
28,174.00
322,276.00
$
SP1450-140-14-G1DZ 9/3/14
N/A N/A N/A
$ 350,450.00 $ $ 350,450.00
0.00% 67.40%
9/16/15 9/16/15
113
Current Year
5,304.00 202,722.00
208,026.00
(208,026.00)
$
I2!!l!
140,180.00
210,270.00
350,450.00
26,600.00 209,600.00
236,200.00
114,250.00
$
Revised Authorized
Cost
140,180.00
210,270.00
350,450.00
34,200.00 283,600.00
32,650.00 350,450.00
Section G
PROPRIETARY FUNDS
114
ENTERPRISE FUND
115
INTERNAL SERVICE FUND
116
Section H
FIDUCIARY FUND
117
Schools
Student Activity Funds Athletic Fund
BOARD OF EDUCATION BOROUGH OF FAIR LAWN
Student Activity Agency Fund Schedule of Receipts and Disbursements For the Fiscal Year Ended June 30,2016
Balance Cash Cash June 30, 2015 Receipts Disbursements
GASB requires that ten years of statistical data be presented. Pursuant to State of New Jersey Department of Education requirements issued for the fiscal year ended June 30, 1994, only two years statistical data needed to be presented. Additional year's data will be included each year thereafter until ten years of data is presented.
123
Financial Trends J-1 J-2 J-3 J-4 J-S
Revenue Capacity
STATISTICAL SECTION (Unaudited)
Net Position by Component Changes in Net Position Fund Balances - Governmental Funds Changes in Fund Balances - Governmental Funds General Fund - Other Local Revenue by Source
J-6 Assessed Value and Estimated Actual Value of Taxable Property J-7 Direct and Overlapping Property Tax Rates J-8 Principal Property Taxpayers J-9 Property Tax Levies and Collections
Debt Capacity J-10 J-11 J-12 J-13
Ratios of Outstanding Debt by Type Ratios of Net General Bonded Debt Outstanding Direct and Overlapping Governmental Activities Debt as of June 30 Legal Debt Margin Information
Demographic and Economic Information J-14 Demographic and Economic Statistics J-1S Principal Employers
Operating Information J-16 FUll-time Equivalent District Employees by Function/Program J-17 Operating Statistics J-18 School Building Information J-19 Schedule of Required Maintenance for School Facilities J-20 Insurance Schedule
T otaJ business-type activities program revenues 1.228.471.85 1.220.873.02 1.166.897.84 1.097.559.64 1.189.602.42 1.159.358.42 1.186.276.12 1.226.384.67 1.229.141.23 1.110.838.22 TOC8l district-Wide program revenues $ 17.143.066.53 S 16.598.643.45 S 16.637.114.06 S 17.477.445.23 S 16.166.233.31 S 13.997.264.75 S 16.533.075.63 S 16.496.476.06 S 19.116.516.01 S 18.467.554.35
Net Direct Debt of School District as of December 31,2015
Net Overlapping Debt of School District: Borough of Fair Lawn (100%)
BOARD OF EDUCATION BOROUGH OF FAIR LAWN
Direct and Overlapping Governmental Activities Debt As of December 31,2015
Unaudited
County of Bergen - Borough's share (2.7524%) Passaic Valley Sewerage Commissioners -
Borough's share (1.262%)
Total Direct and Overlapping Debt as of December 31,2015
$
Source: Borough of Fair Lawn School District Chief Financial Officer and Bergen County Treasurer's Office, Bergen County Utility Authority and Passaic Valley Sewerage Commissioners.
Exhibit J-12
$ 26,687,000.00
26,567,870.98 26,522,323.98
3,314,756.67 56,404,951.63
$ 83,091,951.63
..... W 1.0
BOARD OF EDUCATION BOROUGH OF FAIR LAWN
Legal Debt Margin Information Last Ten Fiscal Years
Unaudited
Legal Debt Margin Calculation for Fiscal Year 2015
Equalized valuation basis 2013 2014 2015
Average equalized valuation 01 taxable property
Debt limit (4 % 01 average equalization value)
Debt limit
Total net debt applicable to limit
Legal debt margin
Total net debt applicable to the limit as a percentage 01 debt limit
Debt limit
Total net debt applicable to limit
Legal debt margin
Total net debt applicable to the limit as a percentage of debt limit
$
$
$
$
W2.
200,307,829
19,858,275
1 8O,449,55~
9.91%
2QQZ
173,864,248
24,492,775
149,371,47~
14.09%
Total Net Debt Applicable to Umlt Legal debt margin
Fiscal Year
2013 2014
$ 191,946,457 $ 183,181,602
18,697,458 17,065,000
$ 173,248,999 $ 166,116,602
9.74% 9.320/.
Fiscal Year
gQQft 2009
$ 174,102,857 $ 185,143,959
23,633,696 22,378,755
$ 150,468,961 $ 162,765,204
13.57% 12.09%
Source: Equalized valuation bases were obtained from the Annual Report of the Stata of New Jersey, Department of Treasury, Division of Taxation
$
$
$
$
2015
178,306,013
26,867,000
151,439,013
15.07%
£Q1Q
210,513,372
21,802,585
188,710,787
10.36%
Exhibit J-13
4,397,022,210 4,469,782,289 4,595,747,105
$ 13,462,551,604
$ 4,487,517,201
179,500,688 $ 25,602,000 $ 153,898,688
~
$ 179,500,688
25,602,000
$ 153,698,688
14.26%
2011
$ 206,925,768
21,509,529
$ 185,416,239
10.39%
-" ~ o
Year
2007 2008 2009 2010 2011 2012 2013 2014 2015 2016
Sources:
BOARD OF EDUCATION BOROUGH OF FAIR LAWN
Demographic and Economic Statistics Last Ten Fiscal Years
Unaudited
Per Capita Personal Population Personal Income Income
Personal income has been estimated based upon the municipal population and per capita personal income presented
Exhibit J-14
Per capita personal income by municipality estimated based upon the 2000 Census published by the US Bureau of Economic Analysis. Unemployment data provided by the NJ Dept of Labor and Workforce Development
Employer Employees
-~ -
Source:
BOARD OF EDUCATION BOROUGH OF FAIR LAWN
Principal Employers Current Year and Ten Years Ago
Unaudited
2016
Rank [Optional]
Not Available
Percentage of Total Municipal
Employment
0.00%
Employees
2006
Rank [Optional]
Not Available
Exhibit J-15
Percentage of Total Municipal
Employment
0.00%
Exhibit J-16
BOARD OF EDUCATION BOROUGH OF FAIR LAWN
Full-time Equivalent District Employees by FunctionlProgram Last Nine Fiscal Years
Number 01 Schools at June 30, 2016 Elementary = 6 Middla School = 2 Senklr High School = 1 Other = 1
Source: District FaciUties Office
Note: Year of original construction Is shown In parenthesas. Increasas In .quare footage end capacity ara the RlSun of alterations and additions. Enrollment is based on the annuai October district count
...... ,J::o. V1
Undis1ribu1ed EJcpendituras-Requirod Maintenance for School Facifilias
fJimotliy~. o/ra6e' ~ .. (p~ cliris C. :J{wana .. OP.ft.
.~ .,.
Sheet I
REPORT ON INTERNAL CONTROL OVER FINANCIAL REPORTING AND ON COMPLIANCE AND OTHER MATTERS BASED ON AN AUDIT OF FINANCIAL STATEMENTS PERFORMED IN ACCORDANCE WITH
GOVERNMENT AUDITING STANDARDS
INDEPENDENT AUDITOR'S REPORT
The Honorable President and Members of the Board of Education Borough of Fair Lawn School District County of Bergen, New Jersey
We have audited, in accordance with auditing.standards generally accepted in the United States of America; the standards applicable to financial audits contained in Government Auditing Standards issued by the Comptroller General of the United States; and in compliance with audit requirements prescribed by the Office of School Finance, Department of Education, State of New Jersey, the financial statements of the governmental activities, the business-type activities, each major fund, and the aggregate remaining fund information of Borough of Fair Lawn School District as of and for the year ended June 30,2016, and the related notes to the financial statements, which collectively comprise Borough of Fair Lawn School District's basic financial statements, and have issued our report thereon dated October 28, 2016.
Internal Control Over Financial Reporting
Management of the Borough of Fair Lawn School District is responsible for establishing and maintaining effective internal control over financial reporting. In planning and performing our audit, we considered the Borough of Fair Lawn School District's internal control over financial reporting to determine the audit procedures that are appropriate in the circumstance for the purpose of expressing our opinions on the financial statements, but not for the purpose of expressing an opinion on the effectiveness of the Borough of Fair Lawn School District's internal control over financial reporting. Accordingly, we do not express an opinion on the effectiveness of the Borough of Fair Lawn School District's internal control over financial reporting.
A deficiency in internal control exists when the design or operation of a control does not allow management or employees, in the normal course of performing their assigned functions, to prevent, or detect and correct misstatements on a timely basis. A material weakness is a deficiency, or combination of deficiencies, in internal control, such that there is a reasonable possibility that a material misstatement of the entity's financial statements will not be prevented, or detected and corrected on a timely basis. A significant deficiency is a deficiency, or a combination of deficiencies, in internal control that is less severe than a material weakness, yet important enough to merit attention by those charged with governance.
148
350 !Main {}(paL, Suite 104 !MontTlilU .. Xl 07045
Our consideration of internal control over financial reporting was for the limited purpose described in the first paragraph of this section and was not designed to identify all deficiencies in internal control over financial reporting that might be significant deficiencies or material weaknesses. Given these limitations, during our audit we did not identify any deficiencies in internal control over financial reporting that we consider to be material weaknesses. However, material weaknesses may exist that have not been identified.
Compliance and Other Matters
As part of obtaining reasonable assurance about whether the Borough of Fair Lawn School District's financial statements are free of material misstatement, we performed tests of its compliance with certain provisions of laws, regulations, contracts, and grant agreements, noncompliance with which could have a direct and material effect on the determination of financial statement amounts. However, providing an opinion on compliance with those provisions was not an objective of our audit, and accordingly, we do not express such an opinion. The results of our tests disclosed no instances of noncompliance or other matters that are required to be reported under Government Auditing Standards.
Purpose of This Report
The purpose of this report is solely to describe the scope of our testing of internal control and compliance and the results of that testing, and not to provide an opinion on the effectiveness of the Borough of Fair Lawn School District's internal control or on compliance. This report is an integral part of an audit performed in accordance with Government Auditing Standards in considering the Borough of Fair Lawn School District's internal control and compliance. Accordingly, this communication is not suitable for any other purpose.
Montville, New Jersey October 28,2016
149
a~fL! Public School Accountant License No. CS000698
Chris C. W. Hwang Certified Public Accountant License No. CC033704
REPORT ON COMPLIANCE FOR EACH MAJOR PROGRAM; REPORT ON INTERNAL CONTROL OVER COMPLIANCE; REPORT ON SCHEDULES OF EXPENDITURES OF FEDERAL A WARDS AND STATE
FINANCIAL ASSISTANCE REOUIRED BY TITLE 2 U.S. CODE OF FEDERAL REGULATIONS (CFR) PART 200, UNIFORM ADMINISTRATIVE REOUIREMENTS, COST PRINCIPLES AND AUDIT REOUIREMENTS FOR
FEDERAL A WARDS AND NEW JERSEY OMB CIRCULAR LETTER 15-08
The Honorable President and Members of the Board of Education Borough of Fair Lawn School District County of Bergen, New Jersey
INDEPENDENT AUDITOR'S REPORT
Report on Compliance for Each Major Federal and State Program
We have audited the Borough of Fair Lawn School District's compliance with the types of compliance requirements described in U.S Office of Management and Budget (OMB) Circular A-l33 Compliance Supplement and the New Jersey Compliance Manual State Grants Compliance Supplement and the New Jersey Compliance Manual State Grants Compliance Supplement that could have a direct and material effect on each of its major federal and state programs for the year ended June 30, 2016. Borough of Fair Lawn School District's major federal and state programs are identified in the Summary of Auditor's Results Section of the accompanying schedule of findings and questioned costs.
Management's Responsibility
Management is responsible for compliance with the requirements of laws, regulations, contracts and grants applicable to its federal and state programs.
Auditor's Responsibility
Our responsibility is to express an opinion on compliance for each of Borough of Fair Lawn School District's major federal and state programs based on our audit of the types of compliance requirements referred to above. We conducted our audit of compliance in accordance with auditing standards generally accepted in the U~ited States of America; the standards applicable to financial audits contained in Goyernment Auditing Standards, issued by the Comptroller General of the United States; in compliance with the audit requirements as prescribed by the Office of School Finance, Department of Education, State of New Jersey; Title 2 U.S. Code of Federal Regulations (CFR) Part 200, Uniform Administrative Requirements, Cost Principles, and Audit Requirements for Federal Awards; and New Jersey Office of Management and Budget Circular Letter 15-08 Single Audit Policy for Recipients of Federal Grants, State Grants and State Aid. Those
standards, Title 2 U.S. Code of Federal Regulations (CFR) Part 200, Uniform Administrative Requirements, Cost Principles, and Audit Requirements for Federal Awards and New Jersey OMB's Circular Letter 15-08 require that we plan and perform the audit to obtain reasonable assurance about whether noncompliance with the types of compliance requirements referred to above that could have a direct and material effect on a major federal and state program occurred. An audit includes examining, on a test basis, evidence about Borough of Fair Lawn School District's compliance with those requirements and performing such other procedures as we considered necessary in the circumstances.
We believe that our audit provides a reasonable basis for our opinion. Our audit does not provide a legal determination of Borough of Fair Lawn School District's compliance with those requirements.
Opi"iOl' 0" Each Major Federal ami State program
In our opinion, the Borough of Fair Lawn School District, in the County of Bergen, State of New Jersey, complied, in all material respects, with the types of compliance requirements referred to above that could have a direct and material effect on each of its major federal and state programs for the year ended June 30, 2016.
Report on Internal Control Over Compliance
The management of Borough of Fair Lawn is responsible for establishing and maintaining effective internal control over compliance with the types of compliance requirements referred to above. In planning and performing our audit of compliance, we considered Borough of Fair Lawn School District's internal control over compliance with the types of requirements that could have a direct and material effect on a major federal or state program to determine the auditing procedures that are appropriate in the circumstances for the purpose of expressing an opinion on compliance and to test and report on internal control over compliance in accordance with Title 2 U.S. Code of Federal Regulations (CFR) Part 200, Uniform Administrative Requirements, Cost Principles, and Audit Requirements for Federal Awards and New Jersey OMB Circular 15-08, but not for the purpose of expressing an opinion on the effectiveness of the Borough of Fair Lawn School District's internal control over compliance. Accordingly, we do not express an opinion on the effectiveness of the Borough of Fair Lawn School District's internal control over compliance.
A deficiency in internal control over compliance exists when the design or operation of a control over compliance does not allow management or employees, in the normal course of performing their assigned functions, to prevent or detect and correct noncompliance with a type of compliance requirement of a federal or state program on a timely basis. A material weakness in internal control over compliance is a deficiency, or combination of deficiencies in internal control over compliance, such that there is a reasonable possibility that material noncompliance with a type of compliance requirement of a federal or state will not be prevented or detected and corrected, on a timely basis . A significant deficiency in internal control over compliance is a deficiency, or a combination of deficiencies, in internal control over compliance with a type of compliance requirement of federal or state program that is less severe than a material weakness in internal control over compliance, yet important enough to merit attention by those charged with governance.
Our consideration of internal control over compliance was for the limited purpose described in the first paragraph of this section and was not designed to identify all deficiencies in internal control over compliance that might be significant deficiencies or material weaknesses. We did not identify any deficiencies in internal control over compliance that we consider to be material weaknesses. However, material weaknesses may exist that have not been identified.
The purpose of this report on internal control over compliance is solely to describe the scope of our testing of internal control over compliance and the results of that testing based on the requirements of Title 2 U.S. Code of Federal Regulations (CFR) Part 200, Uniform Administrative Requirements, Cost Principles, and Audit Requirements for Federal Awards and New Jersey OMB Circular 15-08. Accordingly, this report is not suitable for any other purpose.
151
K-2 Sheet 3
Report on Schedules of Expenditures of Federal Awards and State Financial Assistance Required by Title 2 U.S. Code of Federal Regulations (CFR) Part 200, Uniform Administrative Requirements. Cost Principles. and Audit Requirements for Federal Awards and New Jersey OMB Circular 15-08
We have audited the financial statements of the Borough of Fair Lawn School District as of and for the year ended June 30, 2016, and have issued our report thereon dated October 28, 2016, which contained an unmodified opinion on those financial statements. Our audit was conducted for the purpose of forming an opinion on the financial statements as a whole. The accompanying Schedules of Expenditures of Federal Awards and State Financial Assistance are presented for purposes of additional analysis as required by Title 2 U.S. Code of Federal Regulations (CFR) Part 200, Unifonn Administrative Reguirements. Cost Principles. and Audit Reguirements for Federal Awards and New Jersey OMB Circular 15-08 and is not a required part of the financial statements. Such information is the responsibility of management and was derived from and relates directly to the underlying accounting and other records used to prepare the financial statements. The information has been subjected to the auditing procedures applied in the audit of the financial statements and certain additional procedures, including comparing and reconciling such information directly to the underlying accounting and other records used to prepare the financial statements or to the financial statements themselves, and other additional procedures in accordance with auditing standards generalIy accepted in the United States of America. In our opinion, the Schedules of Expenditure of Federal Awards and State Financial Assistance are fairly stated in alI material respects in relation to the financial statements as a whole.
Montville, New Jersey October 28,2016
1E1:::./~,tL Public School Accountant License No. CS000698
Chris C.W. Hwang Certified Public Accountant License No. CC033704
152
K-3 BOARD OF EllUCATlON
BOROUGH OF FAIR LAWN
Sched .... of ExpondlIu_ of F_ Awords, Schedule A Fortho FIscal y_ ElIded Ju .. 3G, 2011
F_ CFDA F-... IWDGETARY EXPEHIlIIYIW! Ropoymont of Ba&anca.tY!!IB mll F_ral Gra __ Through
TotIIIS .... ~&.bIec:tID ... Proaram~ s 1151.11_328..50
(1) RealDClUd (2) ......... _ .........
131 c.nc.Iod
The .:ca1nNfflinA Noe. to Sched.Ms '" ~.., A'IMaIII AasiIbnce.., an ~,.., af V. sc:heCUe.
BOARD OF EDUCATION BOROUGH OF FAIR LAWN
NOTES TO SCHEDULES OF EXPENDITURES OF A WARDS AND FINANCIAL ASSISTANCE YEAR ENDED JUNE 30, 2016
Note 1: General
K-5 Sheet I
The accompanying schedules of expenditures of awards and financial assistance present the activity of all federal and state programs of the Borough of Fair Lawn School District Board of Education. The Board of Education is defined in Notel:B. to the Board's basic financial statements. All federal awards and state financial assistance received directly from federal and state agencies, as well as federal awards and state financial assistance passed through other government agencies is included on the schedule of expenditures of federal awards and state financial assistance.
Note 2: Basis of Accounting
The accompanying schedules of expenditures of awards and financial assistance are presented using the budgetary basis of accounting with the exception of programs recorded in the food service fund, which are presented using the accrual basis of accounting. These bases of accounting are described in Notes I:E and Note I:F. to the Board's basic financial statements. The information in the schedules is presented in accordance with the requirements of Title 2 U.S. Code of Federal Regulations (CFR) Part 200, Uniform Administrative Requirements, Cost Principles, and Audit Requirements for Federal Awards. Therefore, some amounts presented in the schedules may differ from amounts presented in, or used in the preparation of, the basic financial statements.
Note 3: Relationship to Basic Financial Statements
The basic financial statements present the general fund and special revenue fund on a GAAP basis. Budgetary comparison statements or schedules are presented for the general fund and special revenue fund to demonstrate finance-related legal compliance in which certain revenue is permitted by law or grant agreement to be recognized in the audit year, whereas for GAAP reporting, revenue is not recognized until the subsequent year or when expenditures have been made.
The general fund is presented in the accompanying schedules on the modified accrual basis with the exception of the revenue recognition of the one or more deferred June state aid payments in the current budget year, which is mandated pursuant to N.J .S.A. 18A:22-44.2. For GAAP purposes, payments are not recognized until the subsequent year due to the state deferral and recording of the state aid payments in the subsequent year. The special revenue fund is presented in the accompanying schedules on the grant accounting budgetary basis which recognizes encumbrances as expenditures and also recognizes the related revenues, whereas the GAAP basis does not. The special revenue fund also recognizes the one or more deferred June state aid payments in the current budget year, consistent with N.J.S.A. 18A:22-44.2.
155
BOARD OF EDUCATION BOROUGH OF FAIR LAWN
NOTES TO SCHEDULES OF EXPENDITURES OF AWARDS AND FINANCIAL ASSISTANCE YEAR ENDED JUNE 30, 2016
(CONCLUDED)
K-5 Sheet 2
Note 3: Relationship to Basic Financial Statements (Continued)
Note 4:
The net adjustment to reconcile from the budgetary basis to the GAAP basis is $23,077.00 for the general fund and $ -0- for the special revenue fund. See the Notes to Required Supplementary Information for a reconciliation of the budgetary basis to the GAAP basis of accounting for the general and special revenue funds. Awards and financial assistance revenues are reported in the Board's basic financial statements on a GAAP basis as follows:
Federal State Total General Fund $ 84,765.46 $ 11,632,654.15 $ 11,717,419.61 Special Revenue Fund 1,616,354.50 182,791.19 1,799,145.69 Food Service Fund 326,396.47 10,713.50 337,109.87
Total Awards and Financial Assistance $ 2.027.516.33 $ 11.826.158.84 $ 13.853,675.17
Relationship to Federal and State Financial Reports
Amounts reported in the accompanying schedules agree with the amounts reported in the related federal and state financial reports .
Note 5: Other
Revenues and expenditures reported under the Food Distribution Program represent current year value received and current year distributions respectively. The amount reported as TPAF Pension Contributions represents the amount paid by the state on behalf of the district for post-retirement medical benefits and the normal and accrued liability pension costs for the year ended June 30, 2016. TPAF Social Security Contributions represents the amount reimbursed by the state for the employer's share of social security contributions for TPAF members for the year ended June 30, 2016.
156
BOARD OF EDUCATION BOROUGH OF FAIR LAWN
SCHEDULE OF FINDINGS AND OUESTIONED COSTS FOR THE YEAR ENDED JUNE 30, 2016
Part I - Summary of Auditor's Results Financial Statement Section
A) Type of auditor's report issued: Unmodified
B) Internal Control over financial reporting:
I) Material weakness(es) identified? __ -Jyes X no 2) Were significant deficiencies identified
that were not considered to be material weaknesses? ---yes,_-,-,X,--_n,one reported
C) Noncompliance material to basic financial statements noted?
Federal Awards Section
D) Dollar threshold used to determine Type A programs
E) Auditee qualified as low-risk auditee?
F) Type of auditor's report on compliance for major programs
G) Internal Control over compliance:
I) Material weakness(es) identified? 2) Were significant deficiencies identified
that were not considered to be material weaknesses?
H) Any audit findings disclosed that are required to be reported in accordance with Title 2 U.S. Code of Federal Regulations (CFR) Part 200, Uniform Administrative Requirements, Cost Principles, and Audit Requirements for Federal Awards
I) Identification of major programs:
CFDA Number(s)
84.027A
84.173A
157
__ -Jyes X no
$ 750,000.00
_--"X-'----'yes ___ no
Unmodified
__ --'yes X no
X none reported
__ --'yes X no
Name of Federal Program or Cluster
I.D.E.A Part B. Basic
I.D.E.A. Part B Preschool
K-6 Sheet I
BOARD OF EDUCATION BOROUGH OF FAIR LA WN
SCHEDULE OF FINDINGS AND QUESTIONED COSTS FOR THE YEAR ENDED JUNE 30, 2016
(CONTINUED)
Part 2 - Schedule of Financial Statement Findings
K-6 Sheet 3
This section identifies the significant deficiencies, material weaknesses, and instances of noncompliance related to the basic financial statements that are required to be reported in accordance with Chapter 5.18 of Government Auditing Standards.
Not Applicable
159
BOARD OF EDUCATION BOROUGH OF FAIR LAWN
SCHEDULE OF FINDINGS AND OUESTIONED COSTS FOR THE YEAR ENDED JUNE 30, 2016
(CONTINUED)
Part 3 - Schedule of Federal Awards and State Financial Assistance Findings and Questioned Costs
K-6 Sheet 4
This section identifies the significant deficiencies, material weaknesses, and instances of noncompliance, including questioned costs, related to the audit of major federal and state programs, as required by Title 2 U.S. Code of Federal Regulations (CFR) Part 200, Uniform Administrative Requirements, Cost Principles, and Audit Requirements for Federal Awards and New Jersey OMS's Circular 15-08.
Not Applicable
160
BOARD OF EDUCATION BOROUGH OF FAIR LA WN
SUMMARY SCHEDULE OF PRIOR-YEAR AUDIT FINDINGS AND QUESTIONED COSTS
FOR THE YEAR ENDED JUNE 30, 2016
K-7
This section identifies the status of prior-year findings related to the basic financial statements and federal and state awards that are required to be reported in accordance with Chapter 6.12 of Government Auditing Standards, U.S. Title 2 U.S. Code of Federal Regulations (CFR) Part 200, Uniform Administrative Requirements, Cost Principles, and Audit Requirements for Federal Awards and New Jersey OMB's Circular 15-08.