Nul C ato Do Compr owntow rehens wnWa Pr Cit Nove Pr AN Energy 1901 Braga Ancho sive En For ater Pla repared For ty of Nulato ember 1, 201 repared By: NTHC‐DEHE y Projects Gro aw Street, Su rage, AK 995 nergy A ant and 1 oup ite 200 08 Audit d Laun ndroma 1 at
Transcript
Nul
C
ato Do
Compr
owntow
rehens
wn Wa
Pr
Cit
Nove
Pr
ANEnergy
1901 BragaAncho
sive EnFor ater Pla
repared For
ty of Nulato
ember 1, 201
repared By:
NTHC‐DEHE y Projects Groaw Street, Surage, AK 995
nergy A
ant and
1
oup ite 200 08
Audit
d Launndroma
1
at
2
Table of Contents 1. EXECUTIVE SUMMARY .............................................................................................................................. 3 2. AUDIT AND ANALYSIS BACKGROUND ....................................................................................................... 5 2.1 Program Description ........................................................................................................................... 5 2.2 Audit Description ................................................................................................................................ 5 2.3. Method of Analysis ............................................................................................................................ 6 2.4 Limitations of Study ............................................................................................................................ 8
3. Nulato Downtown Water Plant and Laundromat .................................................................................... 8 3.1. Building Description ........................................................................................................................... 8 3.2 Predicted Energy Use ........................................................................................................................ 10 3.2.1 Energy Usage / Tariffs ................................................................................................................ 10 3.2.2 Energy Use Index (EUI) .............................................................................................................. 12
Appendix A – Listing of Energy Conservation and Renewable Energy Websites ........................................ 19
PREFACE
The Energy Projects Group at the Alaska Native Tribal Health Consortium (ANTHC) prepared this document for the City of Nulato. The authors of this report are Carl H. Remley, Certified Energy Auditor (CEA) and Certified Energy Manager (CEM) and Gavin Dixon. The purpose of this report is to provide a comprehensive document that summarizes the findings and analysis that resulted from an energy audit conducted over the past couple months by the Energy Projects Group of ANTHC. This report analyzes historical energy use and identifies costs and savings of recommended energy efficiency measures. Discussions of site specific concerns and an Energy Efficiency Action Plan are also included in this report. ACKNOWLEDGMENTS The Energy Projects Group gratefully acknowledges the assistance of Mr. Greg Patsy Water Treatment Plant Operator for the City of Nulato.
3
1. EXECUTIVE SUMMARY This report was prepared for the City of Nulato. The scope of the audit focused on Nulato Downtown Water Plant and Laundromat. The scope of this report is a comprehensive energy study, which included an analysis of building shell, interior and exterior lighting systems, HVAC systems, and plug loads. Based on electricity and fuel oil prices in effect at the time of the audit, the annual predicted energy costs for the buildings analyzed are as $12,548 for Electricity, $30,324 for #1 Oil, with total energy costs of $42,871 per year. It should be noted that this facility received the power cost equalization (PCE) subsidy from the state of Alaska this past year. Without PCE the electrical costs for the facility would have been $46,227, fuel oil costs would be $30,324, and total energy costs would be $76,551. Currently the water plant is operating at peak efficiency due to the close attention to detail and timely manual operation of operator Greg Patsy. This precise operational concern is critical to the reduced fuel and electrical usages of the facility, and cannot be guaranteed during other operational scenarios. A more advanced controls retrofit is recommended, but currently would not yield any payback, as automated controls would not increase efficiency over current manual operation. Table 1.1 below summarizes the energy efficiency measures analyzed for the Nulato Downtown Water Plant and Laundromat. Listed are the estimates of the annual savings, installed costs, and two different financial measures of investment return.
Table 1.1PRIORITY LIST – ENERGY EFFICIENCY MEASURES
Rank
Feature
Improvement Description
Annual Energy Savings
Installed Cost
Savings to Investment Ratio, SIR1
Simple Payback (Years)2
1 Cooking and Clothes Drying - ClothesDryer
The dryer preheat is currently not supplying air to the dryers, however the heating coil is radiating heat all of the time, a huge inefficiency, it should be valved off to reduce heat losses.
$1,613 $150 161.37 0.1
2 Setback Thermostat: Water Plant
Implement a Heating Temperature Unoccupied Setback to 60.0 deg F for the Water Plant space.
$474 $600 11.85 1.3
3 Setback Thermostat: Laundromat
Implement a Heating Temperature Unoccupied Setback to 60.0 deg F for the Laundromat space.
$225 $600 5.64 2.7
4
Table 1.1PRIORITY LIST – ENERGY EFFICIENCY MEASURES
Rank
Feature
Improvement Description
Annual Energy Savings
Installed Cost
Savings to Investment Ratio, SIR1
Simple Payback (Years)2
4 HVAC And DHW Using a summer nozzle setting (3.5 gph, instead of 4.5 gph) on the boilers will reduce cycling and thus the idle losses off the boilers. Additionally, putting a VFD on the furnace air handler to run on demand and vary with outside air temperature would reduce the current load which is constantly running all the time.
$2,660 $10,000 3.67 3.8
5 Air Tightening Perform air sealing to reduce air leakage by 300 cfm at 50 Pascals.
$213 $500 4.37 2.3
6 Other Electrical: Appliances
Improve Manual Switching $39 $100 2.20 2.6
7 Setback Thermostat: Lift Station
Implement a Heating Temperature Unoccupied Setback to 40.0 deg F for the Lift Station space.
$68 $500 2.02 7.4
8 Lighting: Exterior Lighting
Replace with 4 LED 20W Module Electronic
$135 $1,100 1.07 8.1
TOTAL, cost-effective measures
$5,427 $13,550 5.61 2.5
The following measures were not found to be cost-effective: 9 Other Electrical: CP-
4B Potable Water Circulation
Replace with Grundfos CR8-50 U-6-A-BUBE w/ premium efficiency motor and Add new Other Controls
$163 $2,200 0.30 13.5
10 Other Electrical: Pressure Pump P Line, Storage Tank
Replace with Baldor 35k, 701-186 Fs, 3 HP, 3 Phase, premium efficiency motor
$85 $1,800 0.26 21.2
TOTAL, all measures $5,676 $17,550 4.40 3.1 Table Notes:
1 Savings to Investment Ratio (SIR) is a life‐cycle cost measure calculated by dividing the total savings over the life of a project (expressed in today’s dollars) by its investment costs. The SIR is an indication of the profitability of a measure; the higher the SIR, the more profitable the project. An SIR greater than 1.0 indicates a cost‐effective project (i.e. more savings than cost). Remember that this profitability is based on the position of that Energy Efficiency Measure (EEM) in the overall list and assumes that the measures above it are implemented first.
2 Simple Payback (SP) is a measure of the length of time required for the savings from an EEM to payback the investment cost, not counting interest on the investment and any future changes in energy prices. It is calculated by dividing the investment cost by the expected first‐year savings of the EEM.
5
With all of these energy efficiency measures in place, the annual utility cost can be reduced by $5,676 per year, or 13.2% of the buildings’ total energy costs. These measures are estimated to cost $17,550, for an overall simple payback period of 3.1 years. If only the cost‐effective measures are implemented, the annual utility cost can be reduced by $5,427 per year, or 12.7% of the buildings’ total energy costs. These measures are estimated to cost $13,550, for an overall simple payback period of 2.5 years. Table 1.2 below is a breakdown of the annual energy cost across various energy end use types, such as Space Heating and Water Heating. The first row in the table shows the breakdown for the building as it is now. The second row shows the expected breakdown of energy cost for the building assuming all of the retrofits in this report are implemented. Finally, the last row shows the annual energy savings that will be achieved from the retrofits.
2.1 Program Description This audit included services to identify, develop, and evaluate energy efficiency measures at the Nulato Downtown Water Plant and Laundromat. The scope of this project included evaluating building shell, lighting and other electrical systems, and HVAC equipment, motors and pumps. Measures were analyzed based on life‐cycle‐cost techniques, which include the initial cost of the equipment, life of the equipment, annual energy cost, annual maintenance cost, and a discount rate of 3.0%/year in excess of general inflation.
2.2 Audit Description Preliminary audit information was gathered in preparation for the site survey. The site survey provides critical information in deciphering where energy is used and what opportunities exist within a building. The entire site was surveyed to inventory the following to gain an understanding of how each building operates:
• Building envelope (roof, windows, etc.) • Heating, ventilation, and air conditioning equipment (HVAC)
6
• Lighting systems and controls • Building‐specific equipment
The building site visit was performed to survey all major building components and systems. The site visit included detailed inspection of energy consuming components. Summary of building occupancy schedules, operating and maintenance practices, and energy management programs provided by the building manager were collected along with the system and components to determine a more accurate impact on energy consumption. Details collected from Nulato Downtown Water Plant and Laundromat enable a model of the building’s energy usage to be developed, highlighting the building’s total energy consumption, energy consumption by specific building component, and equivalent energy cost. The analysis involves distinguishing the different fuels used on site, and analyzing their consumption in different activity areas of the building. Nulato Downtown Water Plant and Laundromat are classified as being made up of the following activity areas: 1) Laundromat: 1,500 square feet 2) Water Plant: 3,462 square feet 3) Lift Station: 80 square feet In addition, the methodology involves taking into account a wide range of factors specific to the building. These factors are used in the construction of the model of energy used. The factors include: • Occupancy hours • Local climate conditions • Prices paid for energy
Savings includes the total discounted dollar savings considered over the life of the improvement. When these savings are added up, changes in future fuel prices as projected by the Department of Energy are included. Future savings are discounted to the present to account for the time‐value of money (i.e. money’s ability to earn interest over time). The Investment in the SIR calculation includes the labor and materials required to install the measure. An SIR value of at least 1.0 indicates that the project is cost‐effective—total savings exceed the investment costs. Simple payback is a cost analysis method whereby the investment cost of a project is divided by the first year’s savings of the project to give the number of years required to recover the cost of the investment. This may be compared to the expected time before replacement of the system or component will be required. For example, if a boiler costs $12,000 and results in a savings of $1,000 in the first year, the payback time is 12 years. If the boiler has an expected life to replacement of 10 years, it would not be financially viable to make the investment since the payback period of 12 years is greater than the project life. The Simple Payback calculation does not consider likely increases in future annual savings due to energy price increases. As an offsetting simplification, simple payback does not consider the need to earn interest on the investment (i.e. it does not consider the time‐value of money). Because of these simplifications, the SIR figure is considered to be a better financial investment indicator than the Simple Payback measure. Measures are implemented in order of cost‐effectiveness. The program first calculates individual SIRs, and ranks all measures by SIR, higher SIRs at the top of the list. An individual measure must have an individual SIR>=1 to make the cut. Next the building is modified and re‐simulated with the highest ranked measure included. Now all remaining measures are re‐evaluated and ranked, and the next most cost‐effective measure is implemented. AkWarm goes through this iterative process until all appropriate measures have been evaluated and installed. It is important to note that the savings for each recommendation is calculated based on implementing the most cost effective measure first, and then cycling through the list to find the next most cost effective measure. Implementation of more than one EEM often affects the savings of other EEMs. The savings may in some cases be relatively higher if an individual EEM is implemented in lieu of multiple recommended EEMs. For example implementing a reduced operating schedule for inefficient lighting will result in relatively high savings. Implementing a reduced operating schedule for newly installed efficient lighting will result in lower relative savings, because the efficient lighting system uses less energy during each hour of operation. If multiple EEM’s are recommended to be implemented, AkWarm calculates the combined savings appropriately. Cost savings are calculated based on estimated initial costs for each measure. Installation costs include labor and equipment to estimate the full up‐front investment required to implement a change. Costs are derived from Means Cost Data, industry publications, and local contractors and equipment suppliers.
8
2.4 Limitations of Study All results are dependent on the quality of input data provided, and can only act as an approximation. In some instances, several methods may achieve the identified savings. This report is not intended as a final design document. The design professional or other persons following the recommendations shall accept responsibility and liability for the results.
3. Nulato Downtown Water Plant and Laundromat
3.1. Building Description The 5,042 square foot Nulato Downtown Water Plant and Laundromat was constructed in 1980, with a normal occupancy of 0 people. The number of hours of operation for this building average 6.8 hours per day, considering all seven days of the week. Description of Building Shell The exterior walls are 2x6 construction with just under six inches of fiberglass insulation. The roof of the building is a cold roof, with between 12 and 18 inches of fiberglass insulation. Insulation is fairly new and was added in a recent remodel of the facility. The foundation of the building is built on pilings with fewer than six inches of fiberglass insulation in the floor. Typical windows throughout the building are double paned glass wood/vinyl window. Doors are metal urethane with no thermal break. There is additionally a garage door with over an inch of polystyrene insulation and a metal clad exterior. Description of Heating Plants The Heating Plants used in the building are: Weil‐McClain Nameplate Information: Weil McClain 78 Boiler Model 678 Fuel Type: #1 Oil Input Rating: 643,000 BTU/hr Steady State Efficiency: 69 % Idle Loss: 3 % Heat Distribution Type: Water Boiler Operation: Oct ‐ May Notes: 4.5 gph nozzle. net i=b=r 559, Model 301 3RD‐W CCT Burner 1/4 HP Weil McClain Nameplate Information: Weil McClain 78 Boiler Model 678
9
Fuel Type: #1 Oil Input Rating: 643,000 BTU/hr Steady State Efficiency: 69 % Idle Loss: 3 % Heat Distribution Type: Water Boiler Operation: All Year Notes: 4.5 gph nozzle. net i=b=r 559, Model 301 3RD‐W CCT Burner 1/4 HP Space Heating and Cooling Distribution Systems The water plant is heated with unit heaters, while the washeteria has baseboard heating. In practice the building receives the majority of its heat from jacket losses off the boilers and off the heat of the dryers. Unit heaters are set to come on only when the temperature outside reaches ‐6 degrees Fahrenheit. Domestic Hot Water System Two K Tam Tuss 60 15 gallon water tanks are supplied heat off the boilers and maintained at 120 degrees Fahrenheit. 100 feet of pipe circulated 24/7 to provide hot water for use in the washers and showers. About 9 gallons per day of hot water is used in the facility. Lighting Interior lighting in the facility is made up primarily of two bulb T8 fixtures with magnetic ballasts and 34 wall four foot bulbs. There is a CFL for use in the tool closet. Exterior lights include four 70 watt metal halide fixtures. Plug Loads Plug loads in the building include a desktop, monitor, stereo, coffee pot, a fan in the water storage area, and several battery chargers. Major Equipment The facility includes a variety of major equipment, including many circulation pumps and heat exchangers for heating the circulation and sewage lines. However these are almost never used. Primarily electrical loads in the build include: Raw Water Line Circulation Loop: Grundfos UMC50‐80 Model A Pump 3 Horsepower Well Pump School Circulation Loop: Grundfos UPS50‐80 Pressure Pump for the P‐Line loop: 3 HP Baldor 701‐186 FS CP‐4B Potable water circulation: Grundfos CR8‐50 U‐6=A‐BUBE
10
3.2 Predicted Energy Use
3.2.1 Energy Usage / Tariffs
The electric usage profile charts (below) represents the predicted electrical usage for the building. If actual electricity usage records were available, the model used to predict usage was calibrated to approximately match actual usage. The electric utility measures consumption in kilowatt‐hours (kWh) and maximum demand in kilowatts (kW). One kWh usage is equivalent to 1,000 watts running for one hour. The fuel oil usage profile shows the fuel oil usage for the building. Fuel oil consumption is measured in gallons. One gallon of #1 Fuel Oil provides approximately 132,000 BTUs of energy. The following is a list of the utility companies providing energy to the building and the class of service provided: Electricity: AVEC‐Nulato ‐ Commercial ‐ Sm The average cost for each type of fuel used in this building is shown below in Table 3.1. This figure includes all surcharges, subsidies, and utility customer charges:
Table 3.1 – Average Energy Cost Description Average Energy Cost
Figure 3.2 below shows how the annual energy cost of the building splits between the different fuels used by the building. The “Existing” bar shows the breakdown for the building as it is now; the “Retrofit” bar shows the predicted costs if all of the energy efficiency measures in this report are implemented.
Figure 3.2 Annual Energy Costs by Fuel Type
Figure 3.3 below addresses only Space Heating costs. The figure shows how each heat loss component contributes to those costs; for example, the figure shows how much annual space heating cost is caused by the heat loss through the Walls/Doors. For each component, the space heating cost for the Existing building is shown (blue bar) and the space heating cost assuming all retrofits are implemented (yellow bar) are shown.
12
Figure 3.3 Annual Space Heating Cost by Component
The tables below show AkWarm’s estimate of the monthly fuel use for each of the fuels used in the building. For each fuel, the fuel use is broken down across the energy end uses. Note, in the tables below “DHW” refers to Domestic Hot Water heating.
Electrical Consumption (kWh)
Jan Feb Mar Apr May Jun Jul Aug Sept Oct Nov Dec Lighting 926 844 926 728 746 722 746 746 722 926 896 926
3.2.2 Energy Use Index (EUI) Energy Use Index (EUI) is a measure of a building’s annual energy utilization per square foot of building. This calculation is completed by converting all utility usage consumed by a building for one year, to British Thermal Units (Btu) or kBtu, and dividing this number by the building square footage. EUI is a good measure of a building’s energy use and is utilized regularly for comparison of energy performance for similar building types. The Oak Ridge National Laboratory (ORNL) Buildings Technology Center under a contract with the U.S. Department of Energy maintains a Benchmarking Building Energy Performance Program. The ORNL website determines how a building’s energy use compares with similar facilities throughout the U.S. and in a specific region or state.
13
Source use differs from site usage when comparing a building’s energy consumption with the national average. Site energy use is the energy consumed by the building at the building site only. Source energy use includes the site energy use as well as all of the losses to create and distribute the energy to the building. Source energy represents the total amount of raw fuel that is required to operate the building. It incorporates all transmission, delivery, and production losses, which allows for a complete assessment of energy efficiency in a building. The type of utility purchased has a substantial impact on the source energy use of a building. The EPA has determined that source energy is the most comparable unit for evaluation purposes and overall global impact. Both the site and source EUI ratings for the building are provided to understand and compare the differences in energy use. The site and source EUIs for this building are calculated as follows. (See Table 3.4 for details): Building Site EUI = (Electric Usage in kBtu + Fuel Oil Usage in kBtu + similar for other fuels) Building Square Footage Building Source EUI = (Electric Usage in kBtu X SS Ratio + Fuel Oil Usage in kBtu X SS Ratio + similar for other fuels) Building Square Footage where “SS Ratio” is the Source Energy to Site Energy ratio for the particular fuel.
Table 3.4
Nulato Downtown Water Plant and Laundromat EUI Calculations
Energy Type Building Fuel Use per Year Site Energy Use per Year, kBTU
Source/Site Ratio
Source Energy Use per Year, kBTU
Electricity 94,342 kWh 321,990 3.340 1,075,447
#1 Oil 7,581 gallons 1,000,682 1.010 1,010,689
Total 1,322,672 2,086,135
BUILDING AREA 5,042 Square Feet
BUILDING SITE EUI 262 kBTU/Ft²/Yr
BUILDING SOURCE EUI 414 kBTU/Ft²/Yr
* Site ‐ Source Ratio data is provided by the Energy Star Performance Rating Methodology for IncorporatingSource Energy Use document issued March 2011.
4.1 Summary of Results The energy saving measures are summarized in Table 4.1. Please refer to the individual measure descriptions later in this report for more detail. Calculations and cost estimates for analyzed measures are provided in Appendix C.
Table 4.1Nulato Downtown Water Plant and Laundromat, Nulato, Alaska
PRIORITY LIST – ENERGY EFFICIENCY MEASURES Rank
Feature
Improvement Description
Annual Energy Savings
Installed Cost
Savings to Investment Ratio, SIR
Simple Payback (Years)
1 Cooking and Clothes Drying - Clothes Dryer
The dryer preheat is currently not supplying air to the dryers, however the heating coil is radiating heat constantly, a huge inefficiency, it should be isolated reduce the heat loss.
$1,613 $150 161.37 0.1
15
Table 4.1Nulato Downtown Water Plant and Laundromat, Nulato, Alaska
PRIORITY LIST – ENERGY EFFICIENCY MEASURES Rank
Feature
Improvement Description
Annual Energy Savings
Installed Cost
Savings to Investment Ratio, SIR
Simple Payback (Years)
2 Setback Thermostat: Water Plant
Implement a Heating Temperature Unoccupied Setback to 60.0 deg F for the Water Plant space.
$474 $600 11.85 1.3
3 Setback Thermostat: Laundromat
Implement a Heating Temperature Unoccupied Setback to 60.0 deg F for the Laundromat space.
$225 $600 5.64 2.7
4 HVAC And DHW Using a summer nozzle setting (3.5 gph or less, instead of 4.5 gph) on the boilers will reduce cycling and thus the idle losses off the boilers. Additionally, putting a VFD on the furnace air handler to run on demand and vary with outside air temperature would reduce the current load which is constantly running all the time.
$2,660 $10,000 3.67 3.8
5 Air Tightening Perform air sealing to reduce air leakage by 300 cfm at 50 Pascals.
$213 $500 4.37 2.3
6 Other Electrical: Appliances
Improve Manual Switching $39 $100 2.20 2.6
7 Setback Thermostat: Lift Station
Implement a Heating Temperature Unoccupied Setback to 40.0 deg F for the Lift Station space.
$68 $500 2.02 7.4
8 Lighting: Exterior Lighting
Replace with 4 LED 20W Module Electronic
$135 $1,100 1.07 8.1
TOTAL, cost-effective measures
$5,427 $13,550 5.61 2.5
The following measures were not found to be cost-effective: 9 Other Electrical: CP-
4B Potable Water Circulation
Replace with Grundfos CR8-50 U-6-A-BUBE w/ premium efficiency motor and Add new Other Controls
$163 $2,200 0.30 13.5
10 Other Electrical: Pressure Pump P Line, Storage Tank
Replace with Baldor 35k, 701-186 Fs, 3 HP, 3 Phase, premium efficiency motor
$85 $1,800 0.26 21.2
TOTAL, all measures $5,676 $17,550 4.40 3.1
4.2 Interactive Effects of Projects The savings for a particular measure are calculated assuming all recommended EEMs coming before that measure in the list are implemented. If some EEMs are not implemented, savings for the remaining EEMs will be affected. For example, if ceiling insulation is not added, then savings from a project to
16
replace the heating system will be increased, because the heating system for the building supplies a larger load. In general, all projects are evaluated sequentially so energy savings associated with one EEM would not also be attributed to another EEM. By modeling the recommended project sequentially, the analysis accounts for interactive affects among the EEMs and does not “double count” savings. Interior lighting, plug loads, facility equipment, and occupants generate heat within the building. When the building is in cooling mode, these items contribute to the overall cooling demands of the building; therefore, lighting efficiency improvements will reduce cooling requirements in air‐conditioned buildings. Conversely, lighting‐efficiency improvements are anticipated to slightly increase heating requirements. Heating penalties and cooling benefits were included in the lighting project analysis.
4.3 Building Shell Measures
4.3.1 Air Sealing Measures
4.4 Mechanical Equipment Measures
4.4.1 Heating/Cooling/Domestic Hot Water Measure
4.4.2 Ventilation System Measures (There were no improvements in this category)
4.4.3 Night Setback Thermostat Measures
Rank Location Existing Air Leakage Level (cfm@50/75 Pa) Recommended Air Leakage Reduction (cfm@50/75 Pa)
5 Air Tightness estimated as: 5200 cfm at 50 Pascals Perform air sealing to reduce air leakage by 300 cfm at 50 Pascals.
Installation Cost $500 Estimated Life of Measure (yrs) 10 Energy Savings (/yr) $213
Breakeven Cost $2,185 Savings‐to‐Investment Ratio 4.4 Simple Payback yrs 2
Auditors Notes: Being aware of leaks and taking small measures to reduce air leakages, such as closing the door all the way, adding weather stripping to the front door and using caulk to seal air leakages on the windows could also further reduce heat losses. Given the nature of WTP operations the ventilation requirements are generally greater than the noted air leakage. Increasing facility tightness might require additional mechanical ventilation at times.
Rank Recommendation
4 Using a summer nozzle setting (3.5 gph or less, instead of 4.5 gph) on the boilers will reduce cycling and thus the idle losses off the boilers. Additionally, putting a VFD on the furnace air handler to run on demand and vary with outside air temperature would reduce the current load which is constantly running all the time.
Installation Cost $10,000 Estimated Life of Measure (yrs) 20 Energy Savings (/yr) $2,660
Breakeven Cost $36,691 Savings‐to‐Investment Ratio 3.7 Simple Payback yrs 4
Auditors Notes: The facility air handler is currently a large electrical draw for WTP, reducing the run time of this appliance will have immediate pay‐back through manual switching. More sophisticated controls could be installed, to control air circulation requirements. Boiler will provide maximum system efficiency with long sustained burn rates. Smaller nozzles will aid in this, and can be changed as needed throughout the season. Miss‐matched nozzle sizes and manual alternation of the boilers through boiler set‐points can assist the operator in accomplishing this.
17
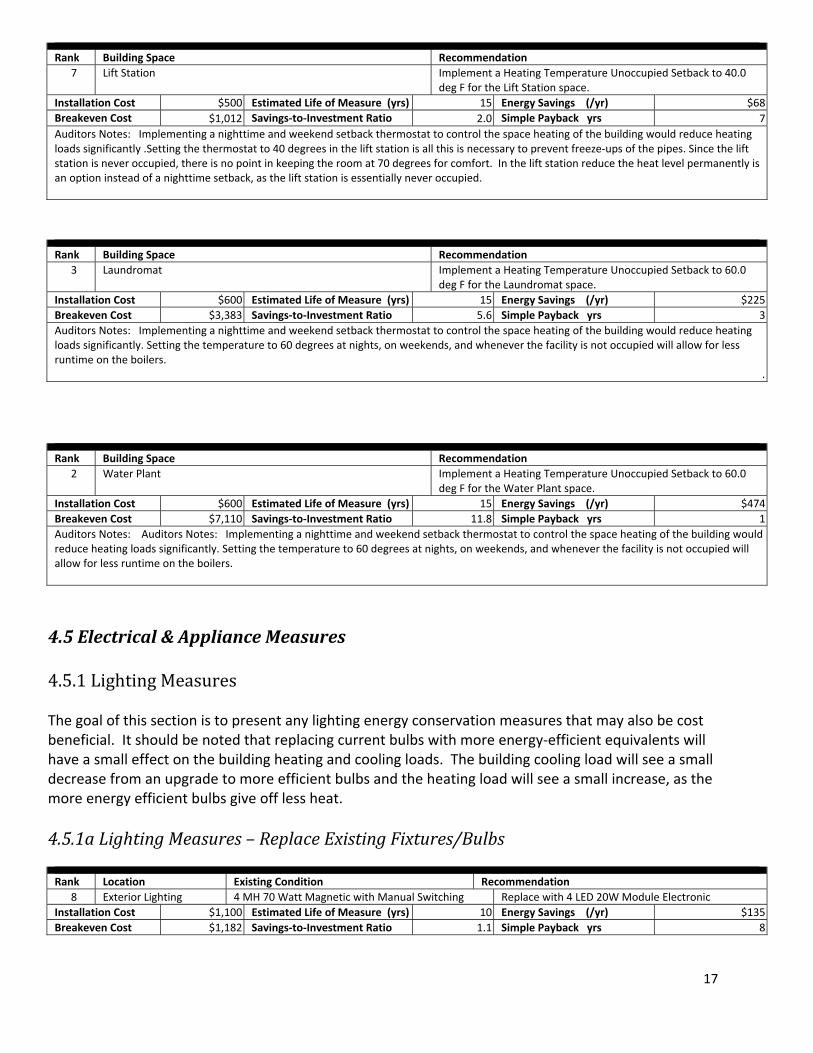
4.5 Electrical & Appliance Measures 4.5.1 Lighting Measures The goal of this section is to present any lighting energy conservation measures that may also be cost beneficial. It should be noted that replacing current bulbs with more energy‐efficient equivalents will have a small effect on the building heating and cooling loads. The building cooling load will see a small decrease from an upgrade to more efficient bulbs and the heating load will see a small increase, as the more energy efficient bulbs give off less heat.
7 Lift Station Implement a Heating Temperature Unoccupied Setback to 40.0 deg F for the Lift Station space.
Installation Cost $500 Estimated Life of Measure (yrs) 15 Energy Savings (/yr) $68
Breakeven Cost $1,012 Savings‐to‐Investment Ratio 2.0 Simple Payback yrs 7
Auditors Notes: Implementing a nighttime and weekend setback thermostat to control the space heating of the building would reduce heating loads significantly .Setting the thermostat to 40 degrees in the lift station is all this is necessary to prevent freeze‐ups of the pipes. Since the lift station is never occupied, there is no point in keeping the room at 70 degrees for comfort. In the lift station reduce the heat level permanently is an option instead of a nighttime setback, as the lift station is essentially never occupied.
Rank Building Space Recommendation
3 Laundromat Implement a Heating Temperature Unoccupied Setback to 60.0 deg F for the Laundromat space.
Installation Cost $600 Estimated Life of Measure (yrs) 15 Energy Savings (/yr) $225
Breakeven Cost $3,383 Savings‐to‐Investment Ratio 5.6 Simple Payback yrs 3
Auditors Notes: Implementing a nighttime and weekend setback thermostat to control the space heating of the building would reduce heating loads significantly. Setting the temperature to 60 degrees at nights, on weekends, and whenever the facility is not occupied will allow for less runtime on the boilers.
.
Rank Building Space Recommendation
2 Water Plant Implement a Heating Temperature Unoccupied Setback to 60.0 deg F for the Water Plant space.
Installation Cost $600 Estimated Life of Measure (yrs) 15 Energy Savings (/yr) $474
Breakeven Cost $7,110 Savings‐to‐Investment Ratio 11.8 Simple Payback yrs 1
Auditors Notes: Auditors Notes: Implementing a nighttime and weekend setback thermostat to control the space heating of the building would reduce heating loads significantly. Setting the temperature to 60 degrees at nights, on weekends, and whenever the facility is not occupied will allow for less runtime on the boilers.
Rank Location Existing Condition Recommendation
8 Exterior Lighting 4 MH 70 Watt Magnetic with Manual Switching Replace with 4 LED 20W Module Electronic
Installation Cost $1,100 Estimated Life of Measure (yrs) 10 Energy Savings (/yr) $135
Breakeven Cost $1,182 Savings‐to‐Investment Ratio 1.1 Simple Payback yrs 8
18
4.5.3 Other Electrical Measures
4.5.5 Clothes Drying Measures
Auditors Notes: Replacing current metal halide exterior fixtures with LED wall packs will reduce energy use, increase lift expectancy of light bulbs, and improve lighting performance in cold weather.
Rank Location Description of Existing Efficiency Recommendation
Replace with Baldor 35k, 701‐186 Fs, 3 HP, 3 Phase, premium efficiency motor
Installation Cost $1,800 Estimated Life of Measure (yrs) 7 Energy Savings (/yr) $85
Breakeven Cost $477 Savings‐to‐Investment Ratio 0.3 Simple Payback yrs 21
Auditors Notes: Replacing the current motor with premium efficiency motor would significantly reduce electrical use, but is not recommended based solely on energy savings due to the high initial cost. However if the motors must be replaced anyways, it is advisable to pay the premium for more efficient motors, as the savings listed here could be realized for marginal extra cost.
Rank Location Description of Existing Efficiency Recommendation
9 CP‐4B Potable Water Circulation
Grundfos CR8‐50 U‐6‐A‐BUBE with Manual Switching Replace with Grundfos CR8‐50 U‐6‐A‐BUBE w/ premium efficiency motor and Add new Other Controls
Installation Cost $2,200 Estimated Life of Measure (yrs) 7 Energy Savings (/yr) $163
Breakeven Cost $670 Savings‐to‐Investment Ratio 0.3 Simple Payback yrs 13
Auditors Notes: Replacing the current motor with premium efficiency motor would significantly reduce electrical use, but is not recommended based solely on energy savings due to the high initial cost. However if the motors must be replaced anyways, it is advisable to pay the premium for more efficient motors, as the savings listed here could be realized for marginal extra cost.
Rank Location Description of Existing Efficiency Recommendation
6 Appliances 6 Desktop, Monitor, Stereo, Coffee Pot, Water Storage Fan, Battery Chargers with Manual Switching
Improve Manual Switching
Installation Cost $100 Estimated Life of Measure (yrs) 7 Energy Savings (/yr) $39
Breakeven Cost $220 Savings‐to‐Investment Ratio 2.2 Simple Payback yrs 3
Auditors Notes: Turning off computers and appliances when not in use will reduce electrical loads significantly. Also brewing coffee in single pots and then storing the hot coffee in a thermos and not using the burner to keep coffee warm for long periods would reduce electrical consumption further.
Rank Location Description of Existing Efficiency Recommendation
1 The dryer preheat is currently not supplying air to the dryers, however the heating coil is radiating heat all of the time, a huge inefficiency, it should be isolated to eliminate this needless heat losses.
Installation Cost $150 Estimated Life of Measure (yrs) 15 Energy Savings (/yr) $1,613
Breakeven Cost $24,205 Savings‐to‐Investment Ratio 161.4 Simple Payback yrs 0
Auditors Notes: Dryer pre‐heat from a legacy system, fans have been shut off, but he hydronic heating flow should also be isolated to prevent this needless waste of heat, and associated calls for heat.
19
5. ENERGY EFFICIENCY ACTION PLAN Through inspection of the energy‐using equipment on‐site and discussions with site facilities personnel, this energy audit has identified several energy‐saving measures. The measures will reduce the amount of fuel burned and electricity used at the site. The projects will not degrade the performance of the building and, in some cases, will improve it. Several types of EEMs can be implemented immediately by building staff, and others will require various amounts of lead time for engineering and equipment acquisition. In some cases, there are logical advantages to implementing EEMs concurrently. For example, if the same electrical contractor is used to install both lighting equipment and motors, implementation of these measures should be scheduled to occur simultaneously.
Appendix A – Listing of Energy Conservation and Renewable Energy Websites Lighting Illumination Engineering Society ‐ http://www.iesna.org/ Energy Star Compact Fluorescent Lighting Program ‐ www.energystar.gov/index.cfm?c=cfls.pr_cfls DOE Solid State Lighting Program ‐ http://www1.eere.energy.gov/buildings/ssl/ DOE office of Energy Efficiency and Renewable Energy ‐ http://apps1.eere.energy.gov/consumer/your_workplace/ Energy Star – http://www.energystar.gov/index.cfm?c=lighting.pr_lighting Hot Water Heaters Heat Pump Water Heaters ‐ http://apps1.eere.energy.gov/consumer/your_home/water_heating/index.cfm/mytopic=12840 Solar Water Heating FEMP Federal Technology Alerts – http://www.eere.energy.gov/femp/pdfs/FTA_solwat_heat.pdf Solar Radiation Data Manual – http://rredc.nrel.gov/solar/pubs/redbook Plug Loads DOE office of Energy Efficiency and Renewable Energy – http:apps1.eere.energy.gov/consumer/your_workplace/ Energy Star – http://www.energystar.gov/index.cfm?fuseaction=find_a_product The Greenest Desktop Computers of 2008 ‐ http://www.metaefficient.com/computers/the‐greenest‐pcs‐of‐2008.html Wind
20
AWEA Web Site – http://www.awea.org National Wind Coordinating Collaborative – http:www.nationalwind.org Utility Wind Interest Group site: http://www.uwig.org WPA Web Site – http://www.windpoweringamerica.gov Homepower Web Site: http://homepower.com Windustry Project: http://www.windustry.com Solar NREL – http://www.nrel.gov/rredc/ Firstlook – http://firstlook.3tiergroup.com TMY or Weather Data – http://rredc.nrel.gov/solar/old_data/nsrdb/1991‐2005/tmy3/ State and Utility Incentives and Utility Policies ‐ http://www.dsireusa.org